Article

Unintentional Passive Islanding Detection and Prevention Method with Reduced Non-Detection Zones

by
Sowmya Ramachandradurai
,
Narayanan Krishnan
* and
Natarajan Prabaharan
*
Department of Electrical and Electronics Engineering, SASTRA Deemed to be University, Thanjavur 613401, India
*
Authors to whom correspondence should be addressed.
Energies 2022, 15(9), 3038; https://doi.org/10.3390/en15093038
Submission received: 2 March 2022 / Revised: 11 April 2022 / Accepted: 16 April 2022 / Published: 21 April 2022
(This article belongs to the Special Issue Challenges and Research Trends of Renewable Energy Power System)

Abstract

:
Islanding detection and prevention are involved in tandem with the rise of large- and small-scale distribution grids. To detect islanded buses, either the voltage or the frequency variation has been considered in the literature. A modified passive islanding detection strategy that coordinates the V-F (voltage–frequency) index was developed to reduce the non-detection zones (NDZs), and an islanding operation is proposed in this article. Voltage and frequency were measured at each bus to check the violation limits by implementing the proposed strategy. The power mismatch was alleviated in the identified islands by installing a battery and a diesel generator, which prevented islanding events. The proposed strategy was studied on the three distinct IEEE radial bus distribution systems, namely, 33-, 69-, and 118-bus systems. The results obtained in the above-mentioned IEEE bus systems were promising when the proposed strategy was implemented. The results of the proposed strategy were compared with those of methods developed in the recent literature. As a result, the detection time and number of islanded buses are reduced.

1. Introduction

Nowadays, engineers incorporate renewable energy resources into distribution systems to bring down the usage of fossil fuels and to sustainably reduce greenhouse gas emissions. In addition, renewable energy resources are used to meet the power demand and to decrease the losses in distribution networks. On the other hand, the increasing penetration of DG imposes challenges in terms of islanding issues. The existing methods of passive islanding detection, such as artificial neural networks (ANNs) and intelligence-based and signal-transferring techniques, have more non-detection zones (NDZs), and the detection of islanding is much slower than with the proposed modified passive islanding detection strategy. The existing prevention methods are implemented with relays, which lead to fewer difficulties during the loading and generation mismatch than with the proposed prevention method.

1.1. Literature Review

In [1], the use of multiple distributed generation (DG) units in a radial system improved the voltage profile, increased flexibility, and reduced power losses in the system. The undeniable problem in the integration of distributed generation units is the islanding, even though there are numerous advantages [2]. In [3], as specified in IEEE 1547-2008, in a DG system, islanding was examined with a delay of a minimum of two seconds. Local methods and remote methods were used to detect islanding. The problem encountered by the local and remote methods was that of non-detection zone (NDZs); failure to identify islanding leads to non-detection zones (NDZs) [4].
In remote methods, communication-based islanding occurs where information is transferred between a utility and distributed generation units, thereby eliminating NDZs. The costs for the execution of these methodologies are high when compared to those of local islanding detection techniques, but identification of islanding by using this technique can be more effective and reliable than with other methods [5].
The electrical variables, such as frequency, voltage, current, etc., in a DG region are measured by using active methods and passive methods that are categorized as local methods [6]. A passive method sets threshold limits to detect islanding, and the power flow is maintained by managing the frequency and voltage. A protective relay is operated to isolate the DG connection when a bus system goes beyond the threshold limits [7]. Since passive methods have a minimal effect on the quality of power and reduce NDZs, they are considered to be the better methods. The different kinds of passive techniques for the detection of islanding include over-current (I), over-voltage (V), over frequency, under-current (I), under-voltage (V), under-frequency, etc. [8].
Artificial-intelligence-based techniques have been introduced to identify islanding in systems where passive detection methods are used. Artificial neural networks [9] and intelligence-based [10] and signal-transferring techniques [11] have been introduced to detect islanding events with passive detection techniques.
NDZs can be eliminated with active methods, but the system suffers from the deterioration of power quality; an active islanding detection strategy is briefly explained in [12]. In the case of the presence of multiple renewable energy resources or DG units, the operation of islanding is performed through the evaluation of the voltage for enormous power fluctuations at the foremost bus to disconnect various loads [13].
In order to prevent the occurrence of islanding, a logical regression classifier was used to accurately simulate DGs in a radial system in a MATLAB environment. This model contained numerous conditions of occurrence based on DG energy supplies, a low monitorable area, and multiple islanding states during operation [14]. Since the communication speeds of directional over-current relays and frequency relays are fast and their operation is reliable, they can be used in small-scale micro-grids [15]. Islanding can be prevented by under-voltage and under-current relays and over-voltage and over-current relays, which do not require communication-based preventive devices [16].
In a pole transformer, the nonlinear magnetizing property was developed for the prevention of islanding in a PV system [17,18]. Rotating-machine-based DGs were used for the prevention of islanding with reduced non-detection zones [19]. All of the methods mentioned above had various shortcomings in the detection and prevention of islanding, other than the passive islanding detection methods. The brief explanation of literature review is shown in Table 1.

1.2. Research Gap and Motivation

The work proposed here is a novel modified passive islanding detection strategy for detecting and preventing islanding with load-flow analysis using the backward and forward sweep (BFS) method [20], which is associated with passive islanding detection. In this work, the proposed strategy for the detection and prevention of islanding was validated in the presence of various DGs in a radial system. The V-F measurements were carried out for various IEEE radial bus distribution systems, such as 33-, 69- and 118-bus systems, with predefined threshold limits in order to identify the islanding in these distribution systems. A diesel generator and the battery were installed in the buses, which were islanded based upon their generation and load values, thus preventing their operation during the islanding of the system.
Table 1. Technical contributions of the proposed method with respect to existing methods.
InferenceIslanding Detection Techniques
Rate of Change of Power (ROCOP) [21]Rate of Change of Frequency (ROCOF) [22]Phase Jump Detection (PJD) [23]Harmonic Distortion [24]Over-/Under-Voltage and Frequency (OUV/OUF) [25]Voltage Imbalance [24]Voltage Variation Method [26]Frequency Variation Method [26]Proposed Method
NDZsmaller than OUV/OUFsmaller than ROCOFlarge than ROCOPsmaller than ROCOFlarger than PJDsmaller than voltage variationlarger than harmonic distortionlarger than voltage variationreduced than other methods
Detection time24–26 s24 s10–20 s45 s4–2 s53 s1.29 s1.95 s0.58 s
Number of islanded busesmoremoremoremoremoremoremoremoreless
Preventioncan prevent with a power control relaycan prevent with the rate of change of the frequency relaycan control with the slip-mode frequency-shift methodcan control with a digital relaycan prevent with an under-/over-frequency/voltage relayvoltage relays are usedover-/under-voltage relays are usedrates of change of frequency relays are usedinstalling a battery or diesel generator prevents islanding

1.3. Contribution and Organization of the Paper

The main attributes proposed in this work are:
  • An unintentional passive islanding detection method using the V-F index is proposed to detect islanding events.
  • With the proposed strategy, the number of buses islanded and time taken for the detection of islanding are minimized when compared to those of the existing methods.
This paper is organized as follows:
  • Section 2 describes the model description of the DGs.
  • The detection strategy for the proposed method is described in Section 3.
  • The prevention strategy for the proposed method is described in Section 4.
  • The results obtained for various bus systems and their discussions are provided in Section 5.
  • Finally, in Section 6, the conclusion of this work is described.

2. Model Description

The DGs were installed for 33-, 69-, and 118-bus systems [27,28] by referring to existing papers. The modeling equations for different DGs from existing papers were discussed in order to identify how the DGs were modeled and installed in particular buses.

2.1. PV Modeling

Solar energy is converted into electric current through what is referred as the photovoltaic (PV) effect. The solar panels receive sunlight, which is an abundant and sustainable form of energy. The cost is high in the first stage of usage and is slowly reduced with increasing efficiency [29,30]. The power generation depends on the rating of the module, the atmospheric temperature, and the solar insolation. Solar insolation is indicated as follows [31]:
B F ( s ) = s ( σ 1 ) × Γ ( σ + μ ) Γ ( σ ) Γ ( μ ) × ( 1 s ) ( μ 1 ) 0 s 1
μ = ( ν ( 1 + ν ) ) ζ 2 × ( 1 ν ) 1
σ = ν μ 1 ν
s, B F ( s ) , and Γ are the solar insolation (kW/m 2 ), beta distribution function (BDF), and gamma function of solar power, respectively. σ is measured as 0.999 and μ is measured as 0.055 from Equations (2) and (3).
The parameters of the BDF are given as Γ ( σ + μ ) ; ν and ζ are the mean and standard deviation, which are taken from actual data. The PV’s power output P o u t ( s ) is obtained as follows [31]:
P o u t ( s ) = N p × F F × V y i × I y i
The I (current) and V (voltage) characteristics of a cell are evaluated as follows:
F F ( f i l l f a c t o r ) = V M T × I M T V o p t × I S
V y i = V o p t K v c × T C Y I
I y i = S I [ I S + K i c ( T C Y I 25 ) ]
T C Y I = T A T + S I [ ( N O T 20 ) / 0.8 ]
Coefficient of voltage ( K v c ) = 14.40 mV/ C and the current ( K i c ) is 1.22 mA/ C; N O T is calculated as 43 C, representing the optimal temperature of a PV cell; the open-circuit voltage ( V o p t ) is 21.98 V and the short-circuit current ( I S ) is 5.32 A; the maximum power point tracking (MPPT) ( I M T ) current is 4.76 A; and the maximum power point tracking ( V M T ) voltage is 17.32 V.The solar insolation (SI), fill factor ( F F ), the temperature at a specific cell ( T C Y I ), and the ambient temperature ( T A T ) are calculated with 1 kV as the value of V y i [31]. The above-mentioned values are substituted into Equations (4)–(8) to calculate the output power of the PV P o u t ( s ) [31].

2.2. Wind Modeling

A wind turbine produces power that is not constant and varies from second to second because the turbine’s speed is not constant. Therefore, the units of the wind power generation profile are affected due to the intermittency of the wind speed. The modeling of the wind speed is framed by the Weibull probability distribution function (PDF), and the power output concerning speed is given below [31]:
P i s W = 0 , v i n s c v o r v o u t c p v v v i n s c v r a t e d v i n s c P i , r a t W , v i n s c v v r a t e d P i , r a t W , e l s e
P i , r a t W = 0.5 MW (rated power), v i n s c = 3 m/s (cut-in speed), P i s W = 10 MW (generated power), v o u t c p = 25 m/s (cut-out speed), and v r a t e d = 13 m/s (rated speed of the turbine).

2.3. Hydro-Energy Modeling

The generation of hydro-energy requires a large area for installation and has low emissions. The conversion of a kinetic source into an electrical source of energy is executed in a hydro-energy system. This is considered as a dispatchable generation unit, and the hydropower output is calculated as [32]:
P = Υ t o t a l × ϰ × g a × h p
The output power is P, hydraulic efficiency ( Υ t o t a l ) is 75.1%, water density ( ϰ ) is 1000 kg/m 3 , pressure head ( h p ) is 2.25 m, and ( g a ) = 9.81 m/s 2 (acceleration due to gravity).

3. Proposed Passive Method for Islanding Detection

The method proposed here is a passive method in which an islanded bus is identified in the presence of DG units in a distribution system with different ratings. The power flow is executed by using the BFS algorithm, and the DG is placed according to the results obtained from this algorithm. The islanding is detected by considering the frequency and voltage values.
The voltage index was used to detect islanding in [13]. Beginning with a load disconnection strategy, the generalization of the foremost bus was initiated with the line current ( I G r m s ) at each DG bus. The sampling frequency under consideration was 1.66 kHz, and the time was 2 s. The product of the sampling frequency and time provided 3333 samples per cycle with a 60 Hz base frequency [13].
K V 1 = | v b a v s y | × a a v
K 0 = N × Δ v o × V a v
The values determined by the equations given above [13] are K V 1 = 0.35, which is the voltage index, K 0 = 0.17, which is the threshold index, and ‘N’ = 3333 samples/cycle. The average voltage V a v is calculated with respect to the change in the system frequency, which is 0.12 p.u. The average accumulative voltage (aav) is the mean voltage variation/cycle with respect to time [13].
In [33], the islanding was determined in different phases; in phase I, islanding was suspected due to changes in voltage or frequency. In the subsequent phase, islanding was detected with a change in voltage (reactive power) and change in frequency (active power).
The proposed strategy is expressed mathematically as
X 1 = 1 3353 V m a g s i n N s a ω t = 1 3353 v m a g s i n 2 π f N s a t
Since ω = 2 π f ,
X 2 = 1 3353 ( 1 / N s a × a b s ( X 1 ) )
V o p e ( n e w ) = V b a V o p e
Δ V o = V b a V o p e ( n e w ) × X 2
Δ f = 60 f d
K c o n s t a n t = 0 n b ( Δ f × 2 π ) / 60
f d = 1 + f × [ P l o a d ( n b ) / P a c t u a l l o a d ( n b ) ] × ( V b a / V o p e ) ]
Δ c s = ( Δ f / 60 ) × n b
K 1 = X 2 / V b a a n d K 2 = K c o n s t a n t × Δ V o
Table 2 shows the values of specific parameters of single buses used in the proposed V-F index method for 33-, 69-, and 118-bus systems, which were evaluated with Equations (13)–(21). The K 1 and K 2 values were evaluated using the frequency, base voltage, change in voltage, number of samples, voltage magnitude, and frequency variation at an individual bus with respect to the nominal frequency.
The frequency variation at an individual bus with respect to the nominal frequency is evaluated with Equation (18). Followed by the number of samples, the phase voltage in the network is associated with the time, frequency, and magnitude of the voltage, which are calculated by using X 1 and X 2 from Equations (13) and (14). The number of samples (3353) is calculated with the product of the sampling frequency (1.676 kHz) and the time of 2 s. For each bus in the considered distribution systems, the above values should be calculated. The loads of all of the buses vary for each hour, according to which the samples are also changed for each bus and frequency value that is measured in the radial distribution network. An islanded bus is detected with Equation (21). If K 1 > K 2 , islanding has occurred. K 1 and K 2 are unique and, hence, are calculated at each step for individual buses.

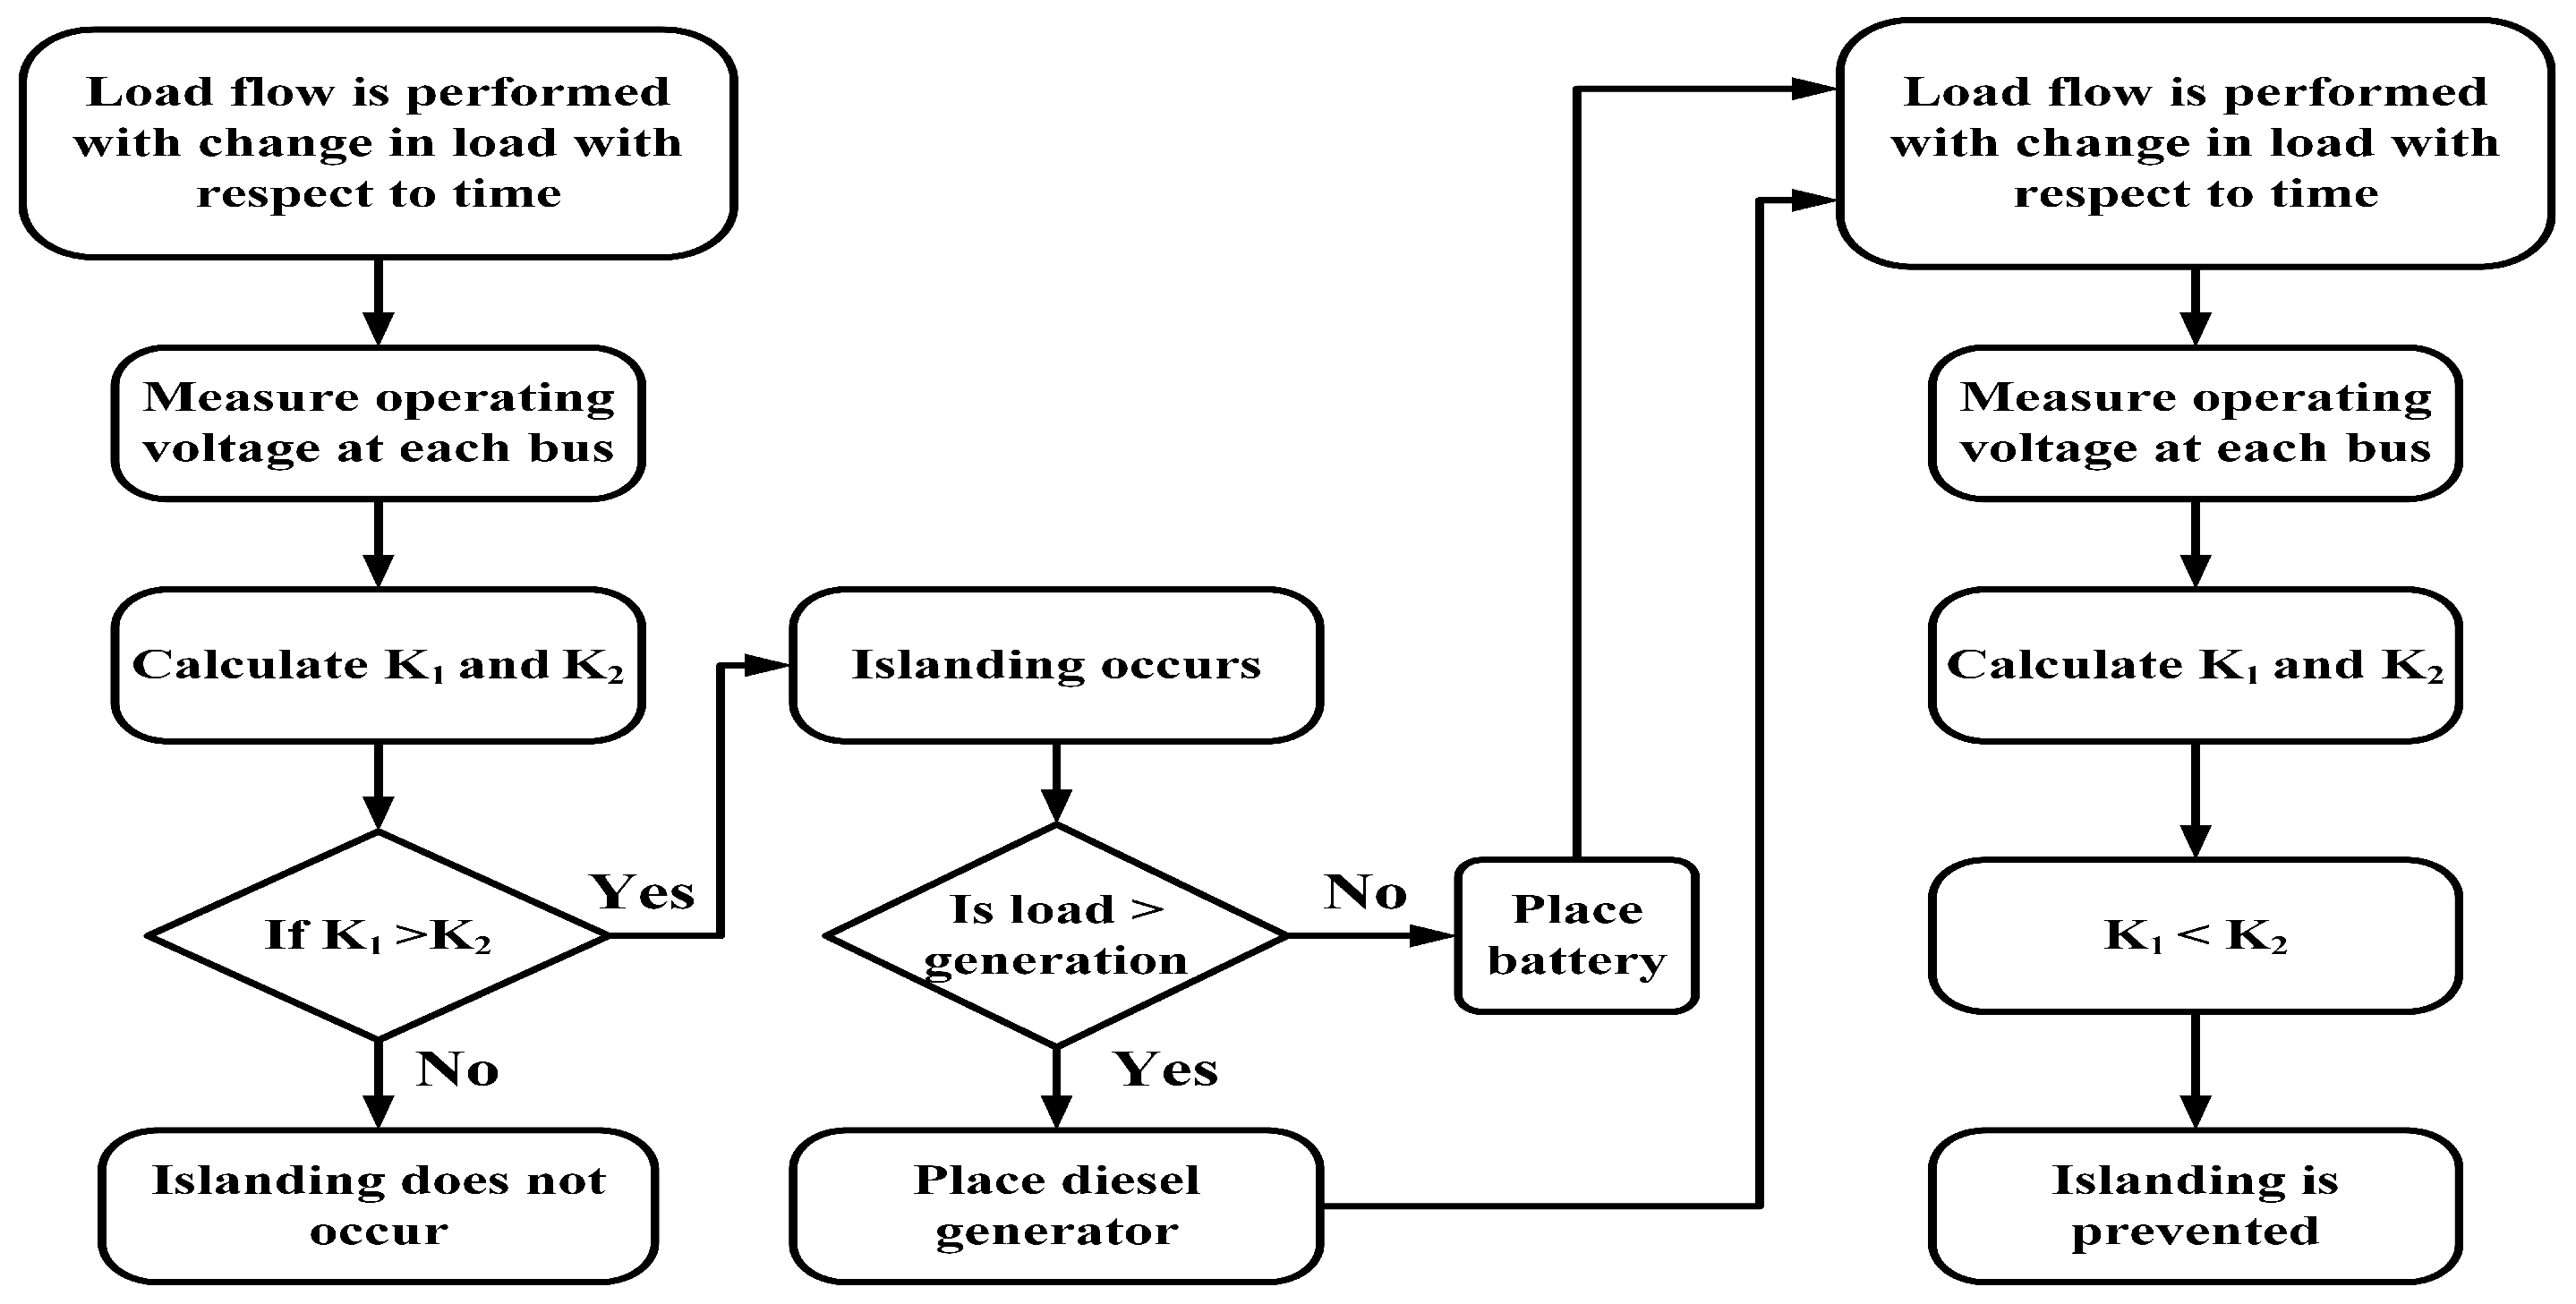
4. Proposed Strategy for Islanding Prevention

A battery or diesel generator is installed in an islanded bus based on the load and generation. If the generation is less than the load, a diesel generator is installed to overcome the power deficiency. If the generation is greater than the load at the islanded bus, a battery is installed to absorb the excess power. So, installing a battery or diesel generator at an islanded bus provides a power balance. Once the power is balanced, islanding in an appropriate bus can be prevented with stable voltage values.
The diesel generator is modeled as
P G e n < P L o a d , | P G e n P L o a d | = P D i e s e l .
The battery is modeled as
P G e n > P L o a d , | P G e n P L o a d | = P B ( c h )
or
P j + ( X i j × Q j ) ( Δ V × V i ) / R i j = P B ( d c h )
Δ V = ( V i 1 V i )
For PV power alone, P G e n = P P V ; for wind power alone, P G e n = P W i n d ; for hydropower alone, P G e n = P H y d r o . For the combination of PV–hydro, P G e n = P P V + P H y d r o ; for the combination of PV–wind, P G e n = P P V + P W i n d ; for the combination of wind–hydro, P G e n = P W i n d + P H y d r o . P P V , P W i n d , P H y d r o , and P D i e s e l are the power generation by the photovoltaic, wind, hydro, and diesel generation units. P G e n is the power generation and P L o a d is the load at the islanded bus. P B ( c h ) is the charging battery power and P B ( d c h ) is the discharging battery power. Δ V represents changes in voltage, and X i j and R i j are the resistance and reactance of the bus. P j is the real power, and Q j is the reactive power. V i 1 is the voltage magnitude of the previous iteration; V i is the voltage magnitude of a particular bus of the current iteration.
The size of the diesel generator is fixed by finding the difference between the generation and load values of an islanded bus. If the generation value is 200 kW and the load is 400 kW, the difference is 200 kW. Here, the load is greater than the generation, so the diesel generator is given the rating of 200 kW to balance the load and generation at the islanded bus. Likewise, the size of the battery is fixed by finding the difference between the load and generation values of an islanded bus. If the generation value is 800 kW and the load is 200 kW, the difference is 600 kW. Here, the generation is greater than the load, so the battery is given the rating of 600 kW to absorb the generated and to balance the load and generation at the islanded bus.
The operations of detection and prevention are presented in Figure 1 and can be explained as follows:
  • Initially, the load-flow method is carried out. By using Equation (21), the values of K 1 and K 2 are calculated. When K 1 is greater than K 2 , islanding occurs; otherwise, islanding does not occur in a particular bus, and the buses in the network are treated as islanded buses when there are ± 2 % changes in the frequency and voltage values with respect to the nominal frequency and voltage.
  • After the occurrence of islanding, the condition between the load and generation is checked. If the load is less than the generation, a battery is installed to prevent islanding, and if the generation is less than the load, a diesel generator is installed to prevent islanding.
  • Here, the diesel generators are installed as dispatchable DG units in order to support the network in such conditions where non-dispatchable DG units do not provide the power.
  • Since a battery is a storage device, it can charge or discharge power, and it cannot generate power by itself. However, a diesel generator can generate power and support the grid as well. Hence, a diesel generator is also used to prevent islanding.
  • After the placement, the system is rejoined with the grid, and the islanding detection method is performed as described in Section 3. Now, no buses are islanded due to the power balance, and the result of K 1 < K 2 is provided.

5. Results and Discussion

The BFS load-flow method gave the results by which changes in the V-F index were determined through the placement of several DG units by referring to existing papers on all distribution systems, and it was simulated in MATLAB [34]. A number of DGs were used to enhance the stability of the system and reduce the losses in the system. The loads were varied linearly with respect to time to detect islanding for all DG combinations. The loads in all DG combinations were not varied until 0.5 s, and after 0.5 s, the loads were steadily increased in steps of 10% of the system’s base load. While increasing the load, there was a distortion in voltage and frequency values for different time durations for the various DG combinations in all of the bus systems.

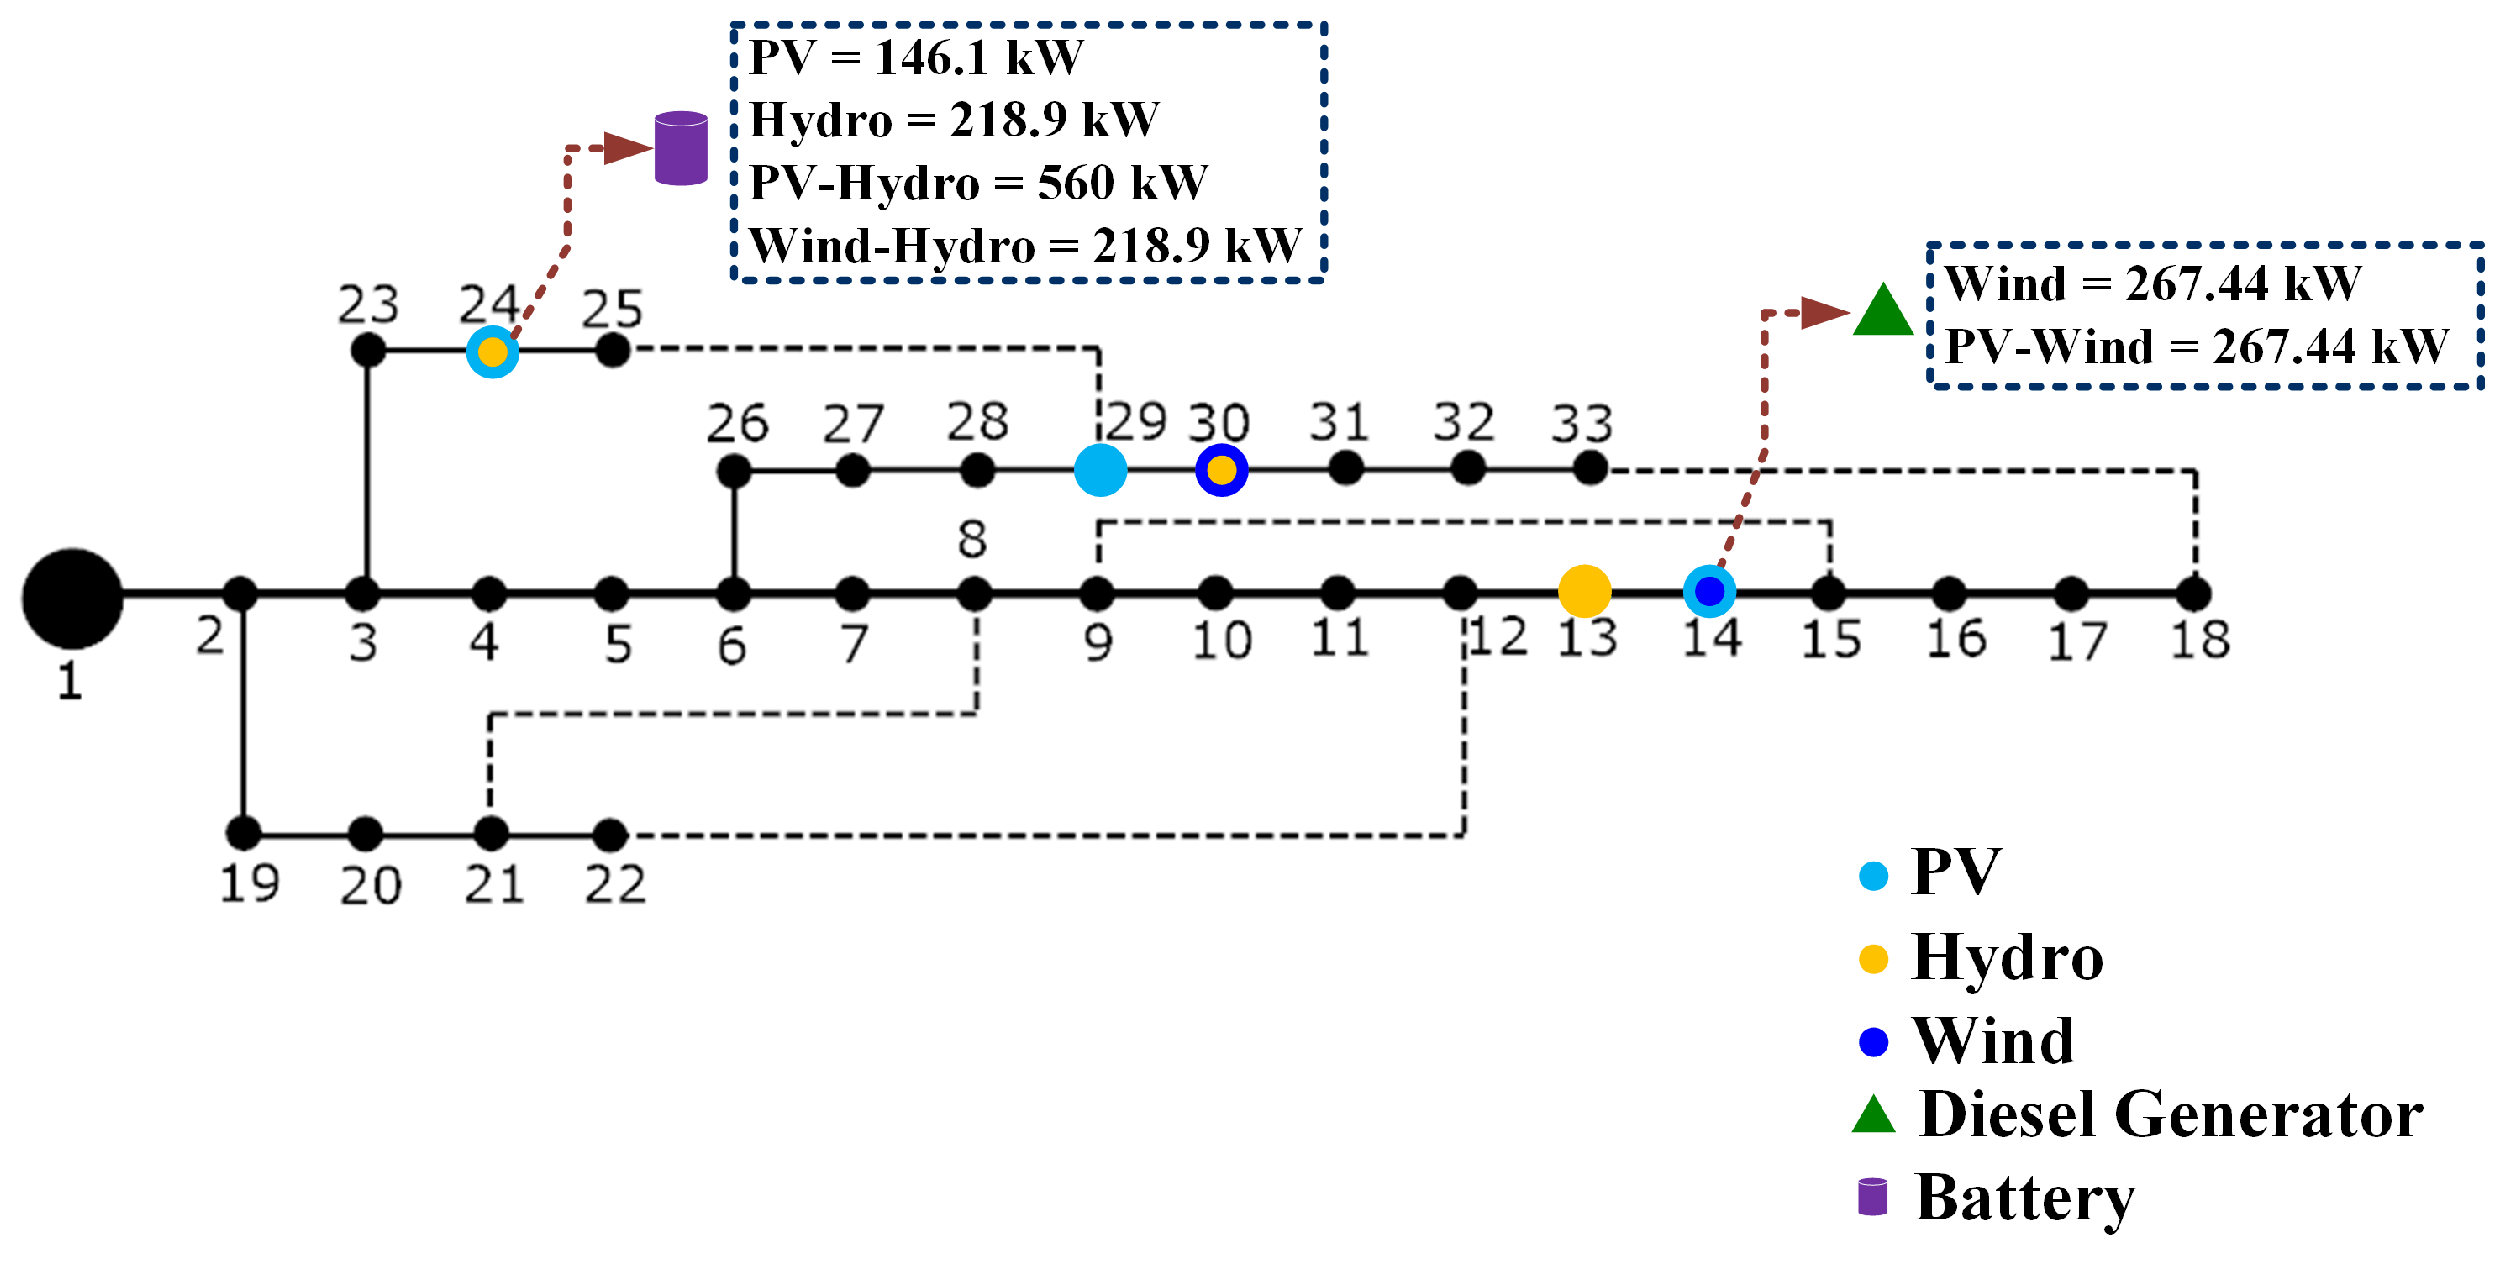
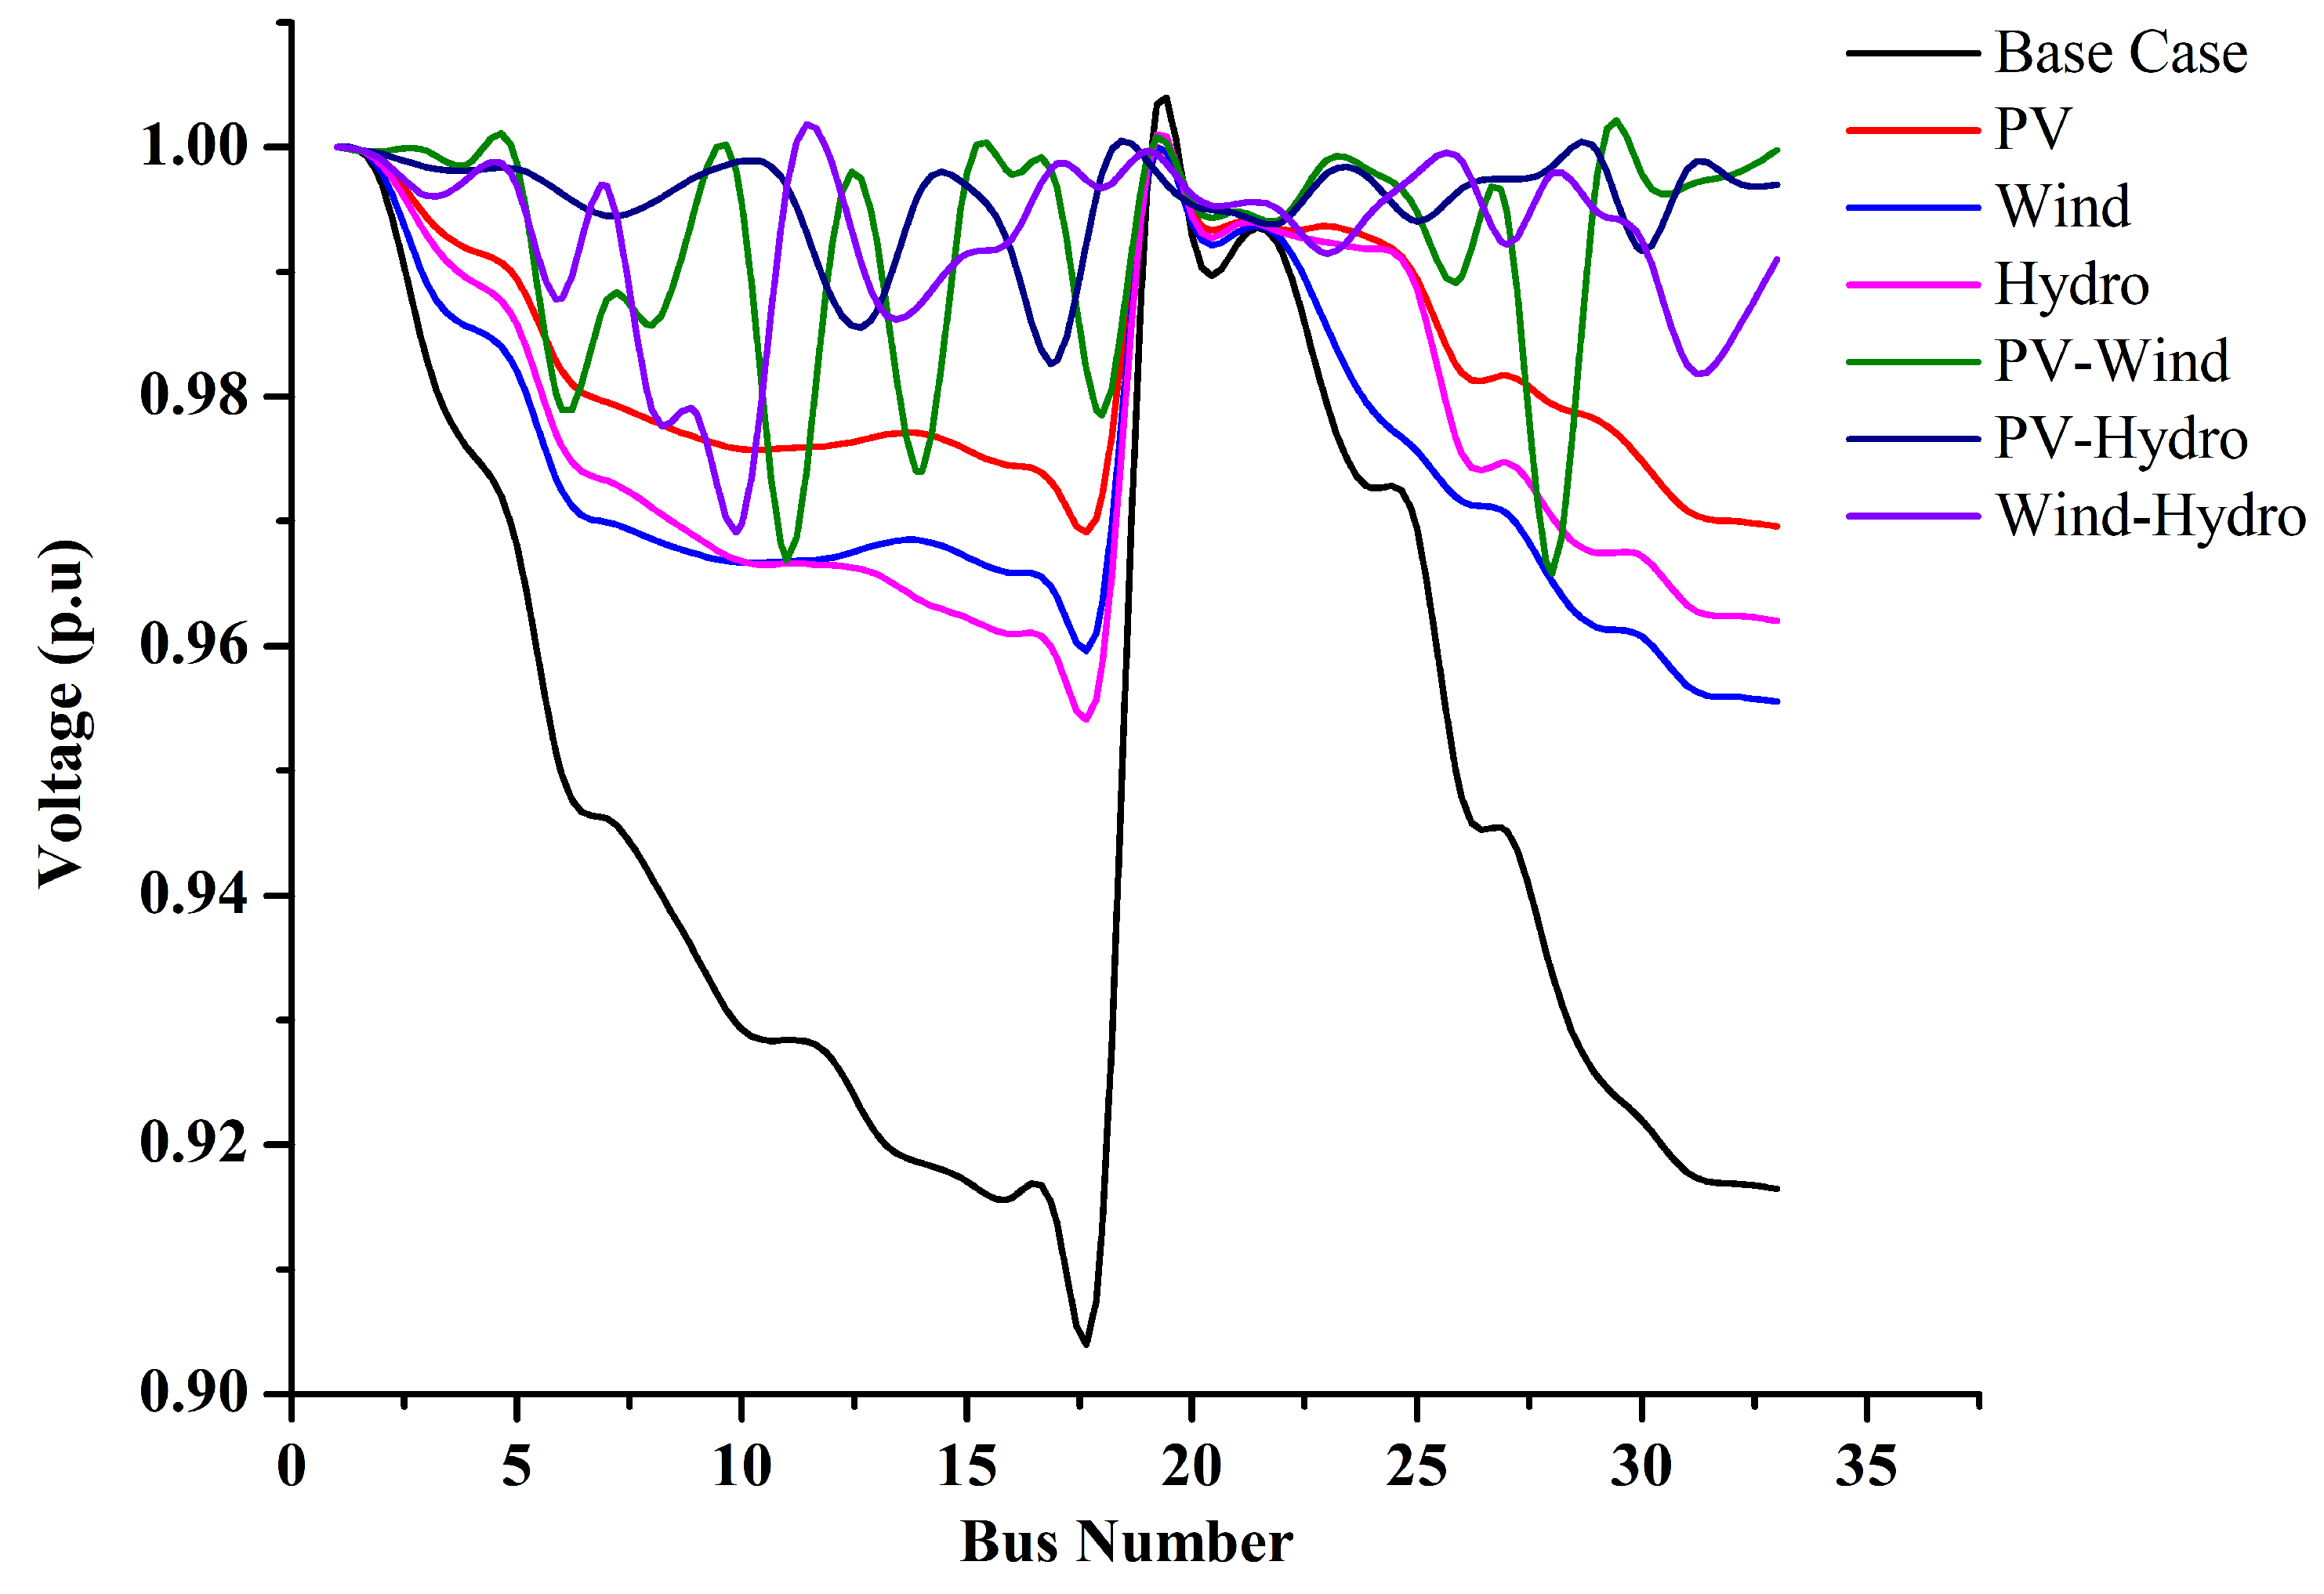
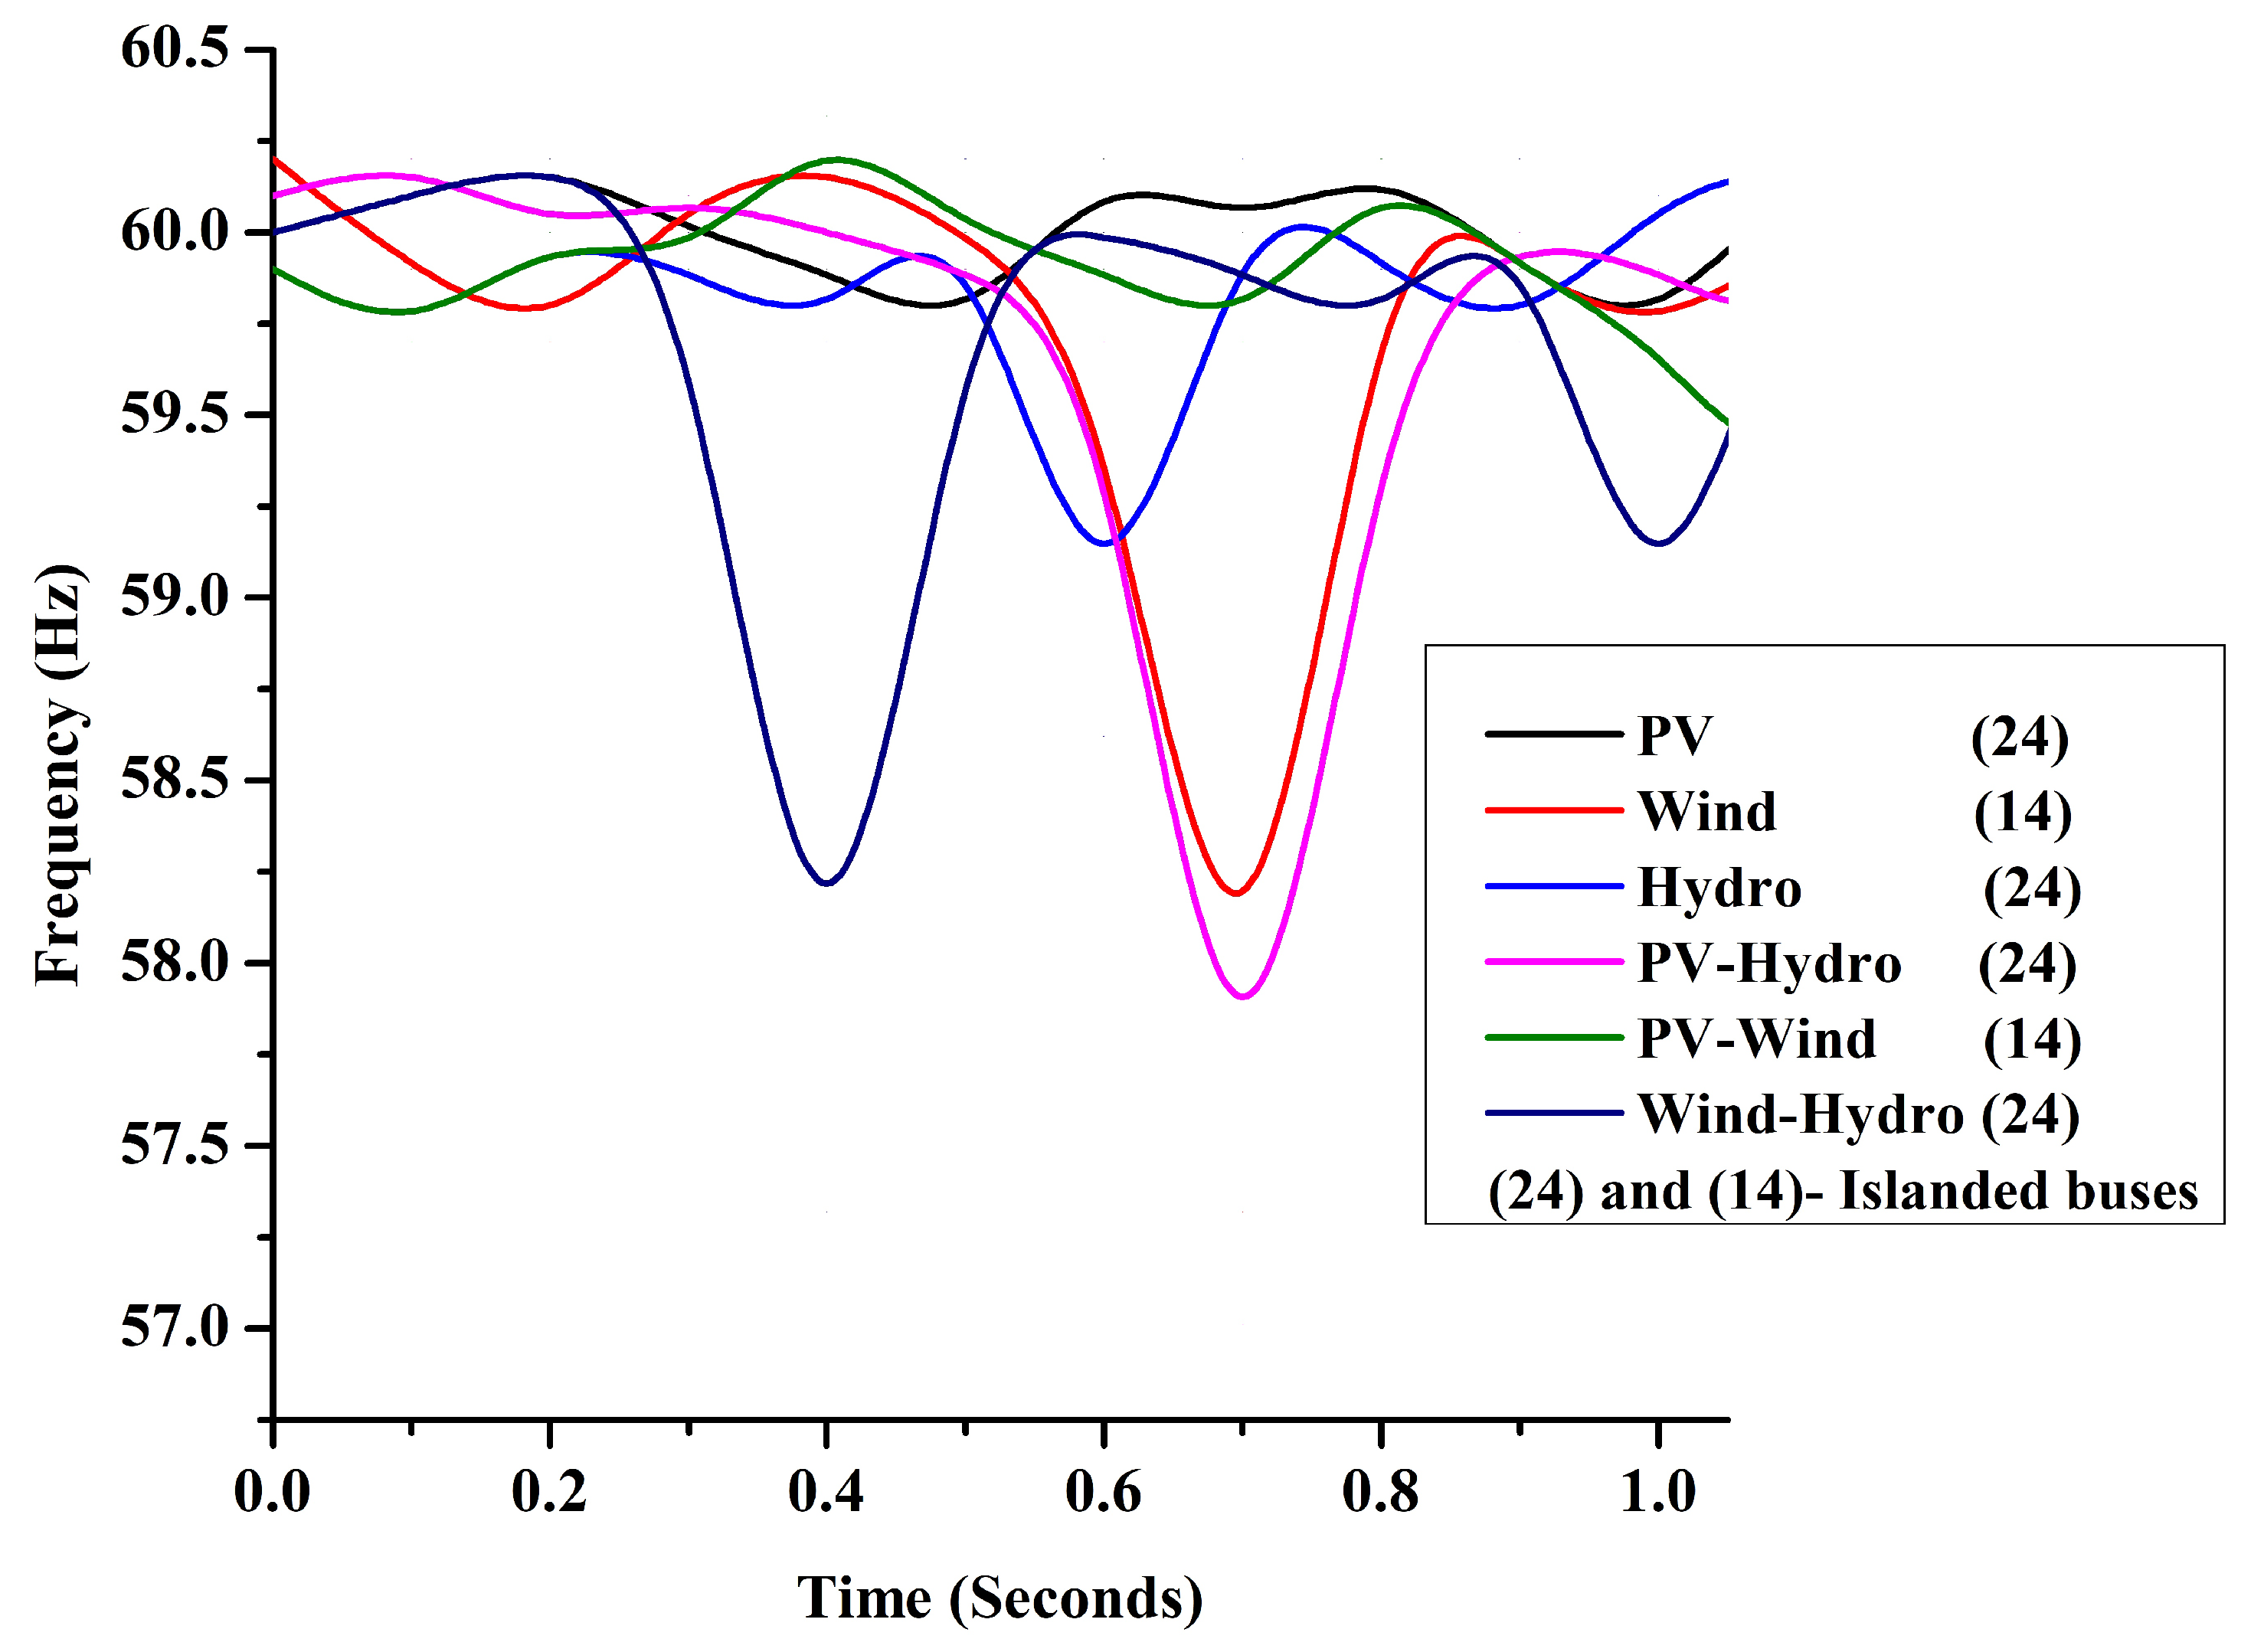
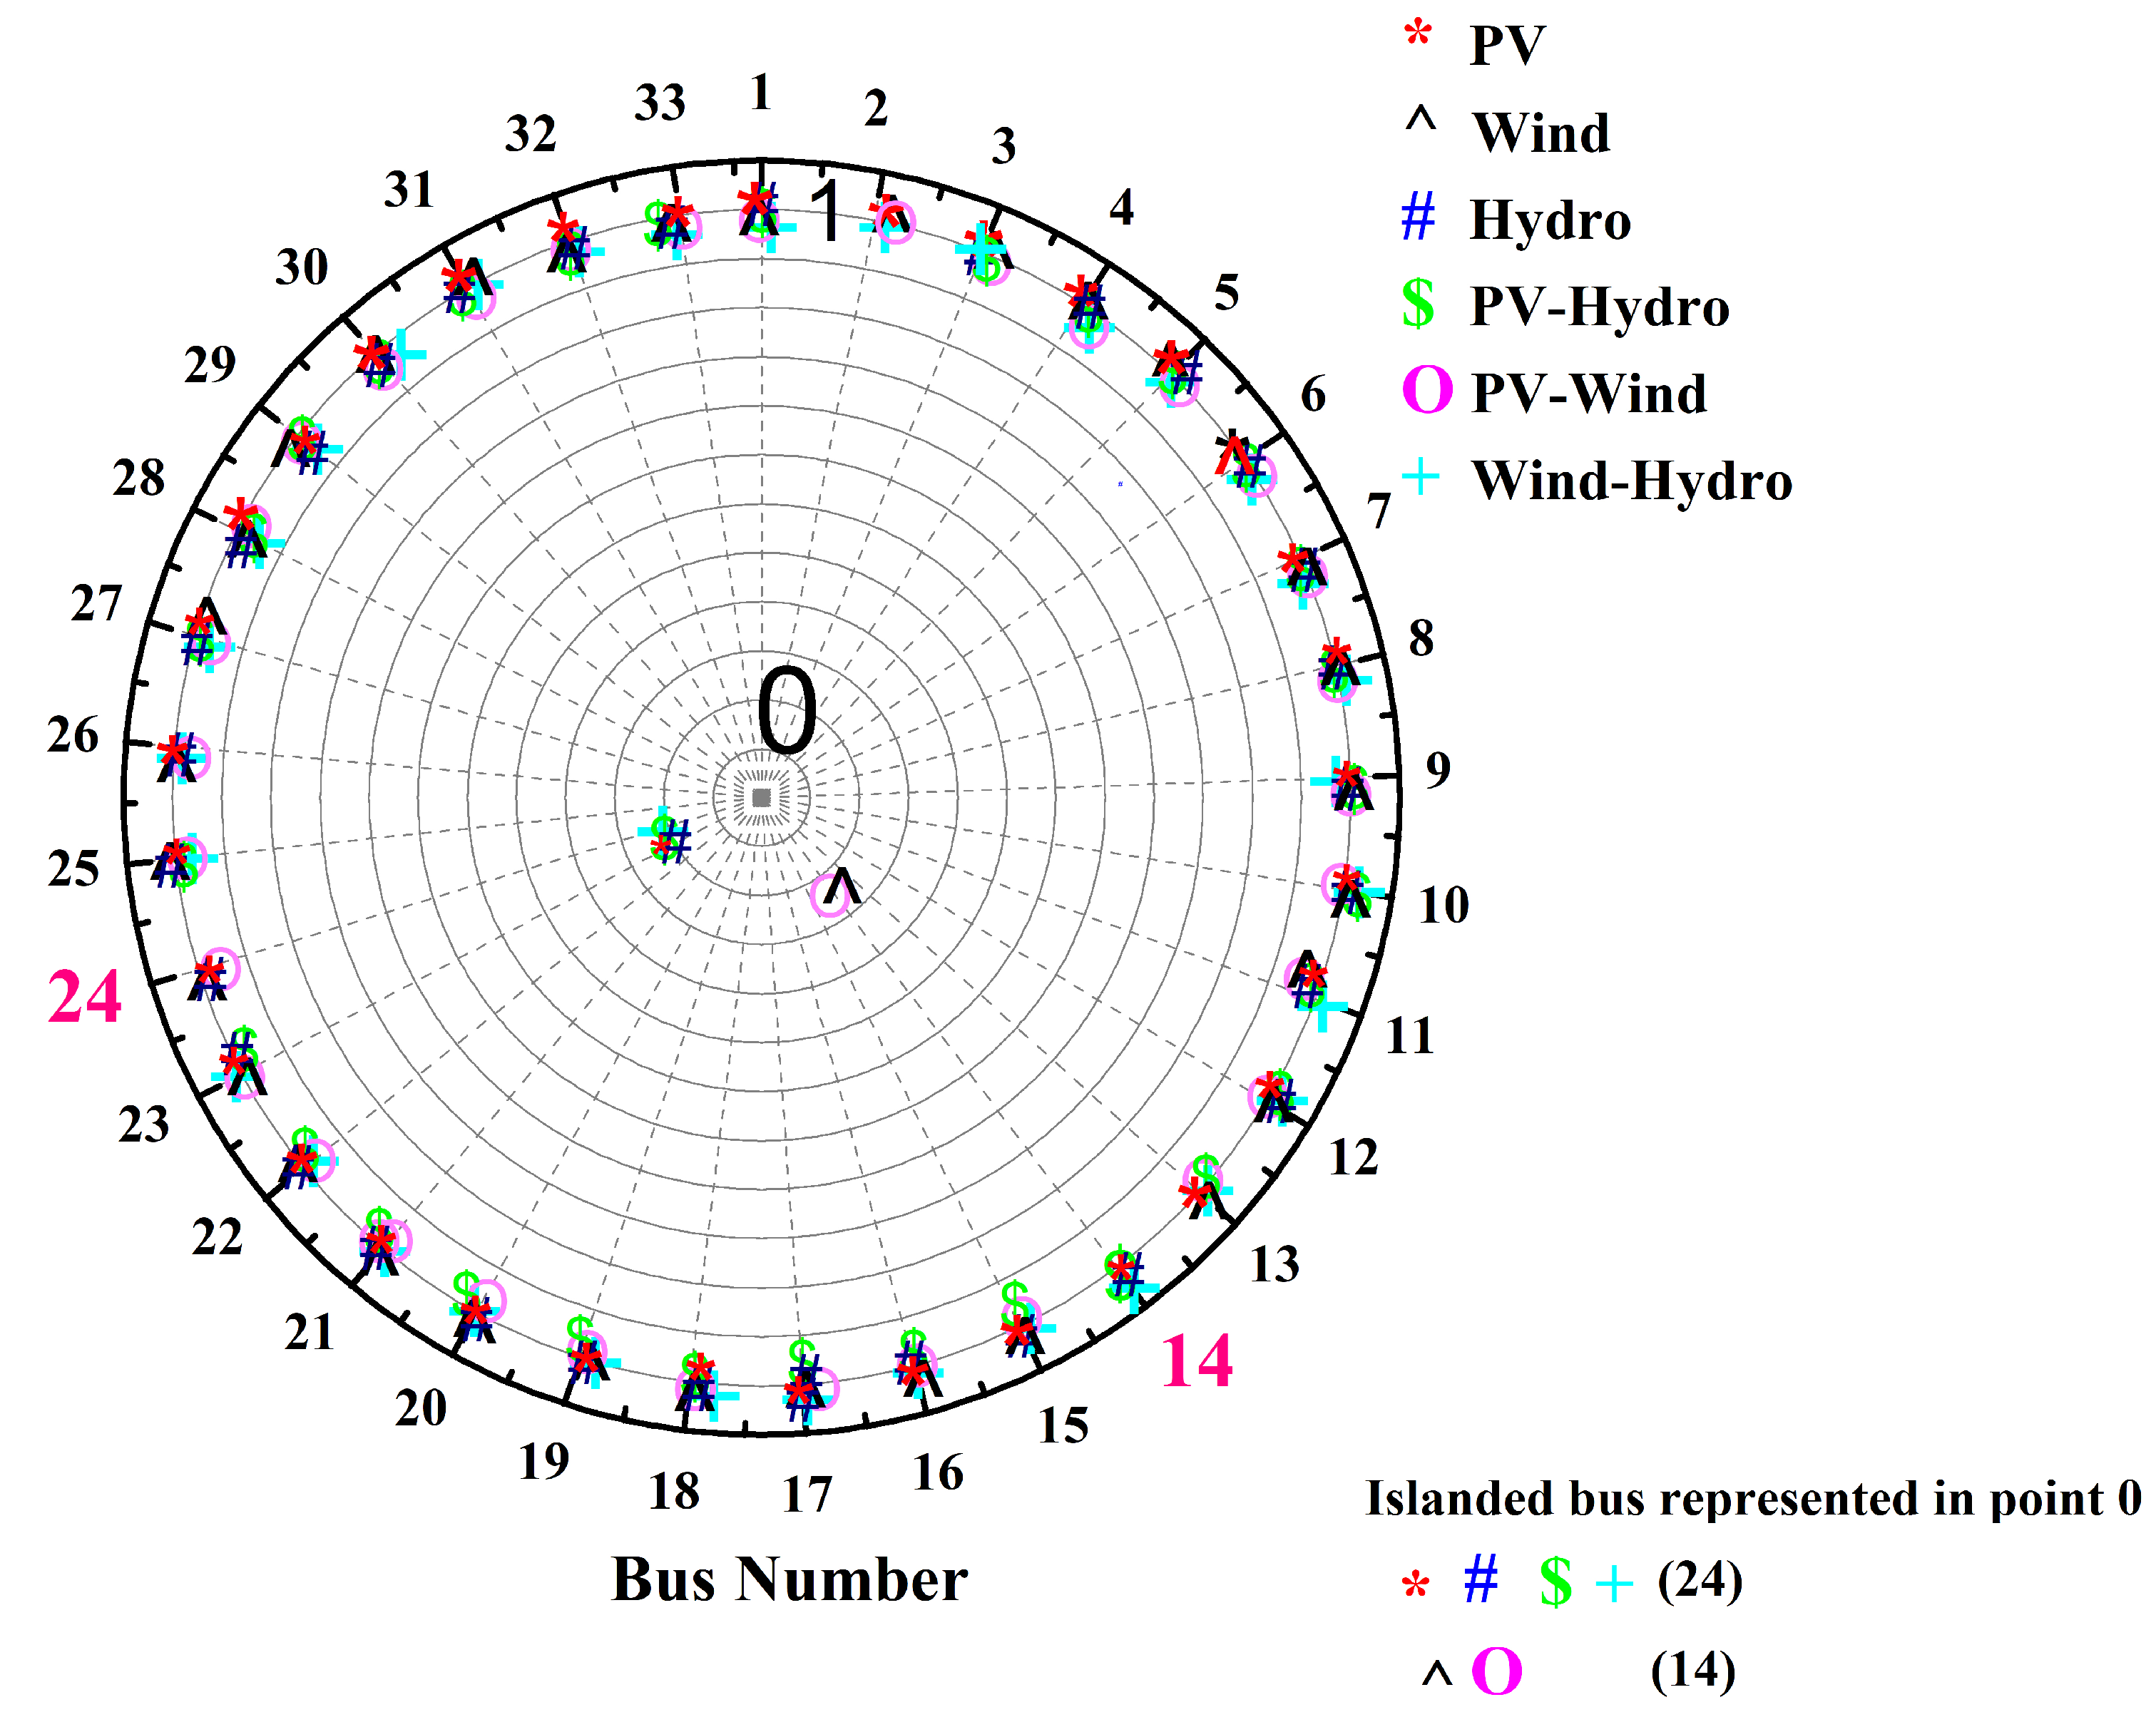
5.1. Islanding Detection and Prevention for the 33-Bus System

Islanding detection with deviations in voltage (v) and frequency (f) was performed with PV, hydro, and wind placement. The 33-bus system with DG units under consideration is shown in Figure 2. PV units were placed at buses 14, 24, and 29, and these buses had ratings of 691, 986.1, and 1277.3 kW, respectively [35]; the wind unit had ratings of 722.56 kW at the 14th bus and 813.89 kW at the 30th bus [27]. At the 13th bus, 24th bus, and 30th bus. a hydro units were placed with ratings of 537.8, 1058.9, and 967.7 kW, respectively [35].
Table 3 shows the results of exiting techniques with the proposed strategy for different DG units. The time of detection was measured with the changes in voltage and frequency at islanded buses. The loads in all DG combinations were not varied until 0.5 s, and after 0.5 s, the loads were constantly increased in steps of 10% of the system’s base load. While increasing the load, there were variations in voltage and frequency at 1.02 s (PV), 0.75 s (wind), 0.60 s (hydro), 0.75 s (PV–hydro), 0.58 s (PV–wind), and 0.75 s (wind–hydro).
In the presence of PV, hydro, the combination of PV and hydro, and the combination of hydro and wind, the method using the V-F index identified islanding at the 24th bus. Using the (proposed) V-F index method, islanding was noticed at 117.6% of the system’s base load for PV, 108.6% of the system’s base load for hydro, 110.3% of the system’s base load for DG with PV and hydro together, and 110.22% of the system’s base load for DG with hydro and wind together. Using existing methods [13,33], islanding was noticed at 122.1% and 123.3% of the system’s base load for PV, 110.3% and 114.2% of the system’s base load for hydro, 123.23% and 112.7% of the system’s base load for DG with PV and hydro together, and 117.3% and 119.2% of the system’s base load for DG with hydro and wind together. In the presence of wind and the combination of PV and wind, the proposed method identified islanding at the 14th bus. Using the proposed (V-F index) method, islanding was determined at 119.6% of the system’s base load for wind and 111.22% of the system’s base load for DG with PV and wind together. However, when using existing methods [13,33], islanding was determined at 121.1% and 125.3% of the system’s base load for wind and 121.23% and 120.7% of the system’s base load for DG with PV and wind together.
In the proposed strategy, when the PV unit was placed, islanding was detected at the 24th bus at 1.02 s, and the detection time using voltage variation [33] was 1.29 s; that when using frequency variation [13] was 1.95 s. Islanding occurred at the 24th bus because the load was greater than the generation. In the 24th bus, the load was 840 kW and the generation was 986.1 kW. When placing a battery with a rating of 146.1 kW at bus 24, islanding was prevented. By using the proposed strategy, accuracy was achieved in detection; the time taken for the detection of islanding was also reduced by 0.27 s compared to voltage variation [33] and by 0.93 s compared to frequency variation [13].
When a wind unit was placed, the detection time using voltage variation [33] was 0.99 s and that using frequency variation [13] was 0.98 s. When the proposed strategy was used, islanding was detected at the 14th bus in 0.75 s. The load at the 14th bus was 990 kW and the generation at the 14th bus was 722.56 kW. Thus, the islanding occurred because the load was higher than the generation. To prevent this, a diesel generator with a rating of 267.44 kW was placed at that particular bus. The detection time was reduced by 0.24 s when compared to voltage variation [33] and by 0.23 s when compared to frequency variation [13].
When a hydro unit was placed, islanding occurred in 0.60 s at the 24th bus in the proposed strategy; it occurred with the generation of 1058.9 kW and load of 840 kW. The islanding was detected with the voltage variation [33] in 0.82 s, and it was detected with the frequency variation [13] in 0.65 s. At the 24th bus, the generation was 1058.9 kW and the load was 840 kW, which resulted in islanding. Here, the generation was greater than the load, so placing a battery with a rating of 218.9 kW prevented islanding. The time taken for the detection of islanding was reduced by 0.22 s when compared with the voltage variation [33] and by 0.05 s when compared with the frequency variation [13].
When the PV–hydro combination was used, islanding was detected in 0.75 s at the 24th bus by the proposed strategy. The time taken for the detection of islanding for the photovoltaic–wind combination was 0.58 s at bus 14. The generation and load at the 24th bus were 2045 and 1485 kW, respectively, for the PV–hydro combination, and at the 14th bus, they were 1413.56 and 1146.12 kW, respectively, for the PV–wind combination, which led to islanding. For the PV–hydro combination, the voltage variation method [33] detected the islanded buses in 1.054 s, and the method of frequency variation [13] detected the islanded buses in 1.032 s. For the PV–wind combination, the voltage variation method [33] detected the islanded buses in 0.62 s, and the frequency variation method [13] detected the islanded buses in 0.88 s. Placing a battery with a rating of 560 kW at the 24th bus prevented islanding with the PV–hydro combination, and placing a diesel generator with a rating of 267.44 kW at the 14th bus prevented islanding with the PV–wind combination.
For the PV–hydro combination, the detection time was reduced by 0.304 s when compared with that of voltage variation [33] and by 0.252 s when compared with that of frequency variation [13]. For the PV–wind combination, the detection time was reduced by 0.04 s when compared with that of voltage variation [33] and by 0.3 s when compared with that of frequency variation [13].
In the placement of the wind–hydro combination, islanding was detected in 0.75 s at the 24th bus with the proposed strategy. Here, at the 24th bus, the generation was 1058.9 kW and the load was 840 kW, which led to islanding. The voltage variation method [33] detected the islanded buses in 1.98 s, and the frequency variation method [13] detected the islanded buses in 0.75 s. By placing a battery with a rating of 218.9 kW at the 24th bus, islanding was prevented by maintaining the frequency and voltage. By placing a battery with a rating of 218.9 kW at the 24th bus, islanding was prevented. The detection time of the proposed strategy was reduced by 1.23 s when compared with that of voltage variation [33] and by 1.24 s when compared with that of frequency variation [13].
The NDZs were reduced by the proposed method in the presence of PV units, hydro units, the combination of PV–hydro, and the combination of wind–hydro in comparison with the results of existing methods. This is because the number of buses connected to the 24th bus (the islanded bus) was only two buses, unlike in existing methods. Likewise, in the presence of wind units and the combination of PV–wind, the NDZs were reduced by the proposed method. This is because the number of buses connected to the 14th bus was only five, unlike in existing methods. The proposed V-F index method is also suitable for low-power mismatches. In the 33-bus system, the islanded bus was identified at the load of 146 kW.
With the V-F index method, the voltage and frequency are continuously monitored (passive islanding), and K 1 and K 2 are calculated for different cases from Equation (21). The occurrence of islanding was mostly at the 24th bus because K 1 was greater than K 2 . For PV alone, the K 2 and K 1 values were calculated as 0.8532 and 0.98652. For hydro, the K 2 and K 1 values were 0.9235 and 0.93568. For PV–hydro and wind–hydro, the K 2 and K 1 values were 0.95362 and 0.9632 or 0.99386 and 0.9982, respectively. Islanding was detected at the 24th bus because K 1 was greater than K 2 for all of the cases. This was because of the greater generation in the bus, leading to variations in the frequency limits. The frequency changes led to voltage variations because the changes in the voltage ( Δ v ) varied with the frequency violations, as shown in Equation (16). Figure 3 and Figure 4 show the voltage values and frequency values of all of the buses. Buses in which the values deviated from the fixed values of voltage (0.99 to 1.05 p.u.) and fixed values of frequency (±2% of the rated frequency) were considered islanded buses.
Figure 5 has ones and zeros, which represent the non-islanded and islanded buses, respectively, for various DG combinations, which were obtained using Equation (21).

Quantitative Analysis of the 33-Bus System

Reliability indices were calculated based on customer interruption (islanded buses). To ensure the system’s performance, reliability indices were measured, as shown in Table 4.
After installing the battery or diesel generator, the reliability values are improved by around 30% to 97% for various reliability indices, and the values of K 1 (V-F index values) are less than the values of K 2 (threshold limits).

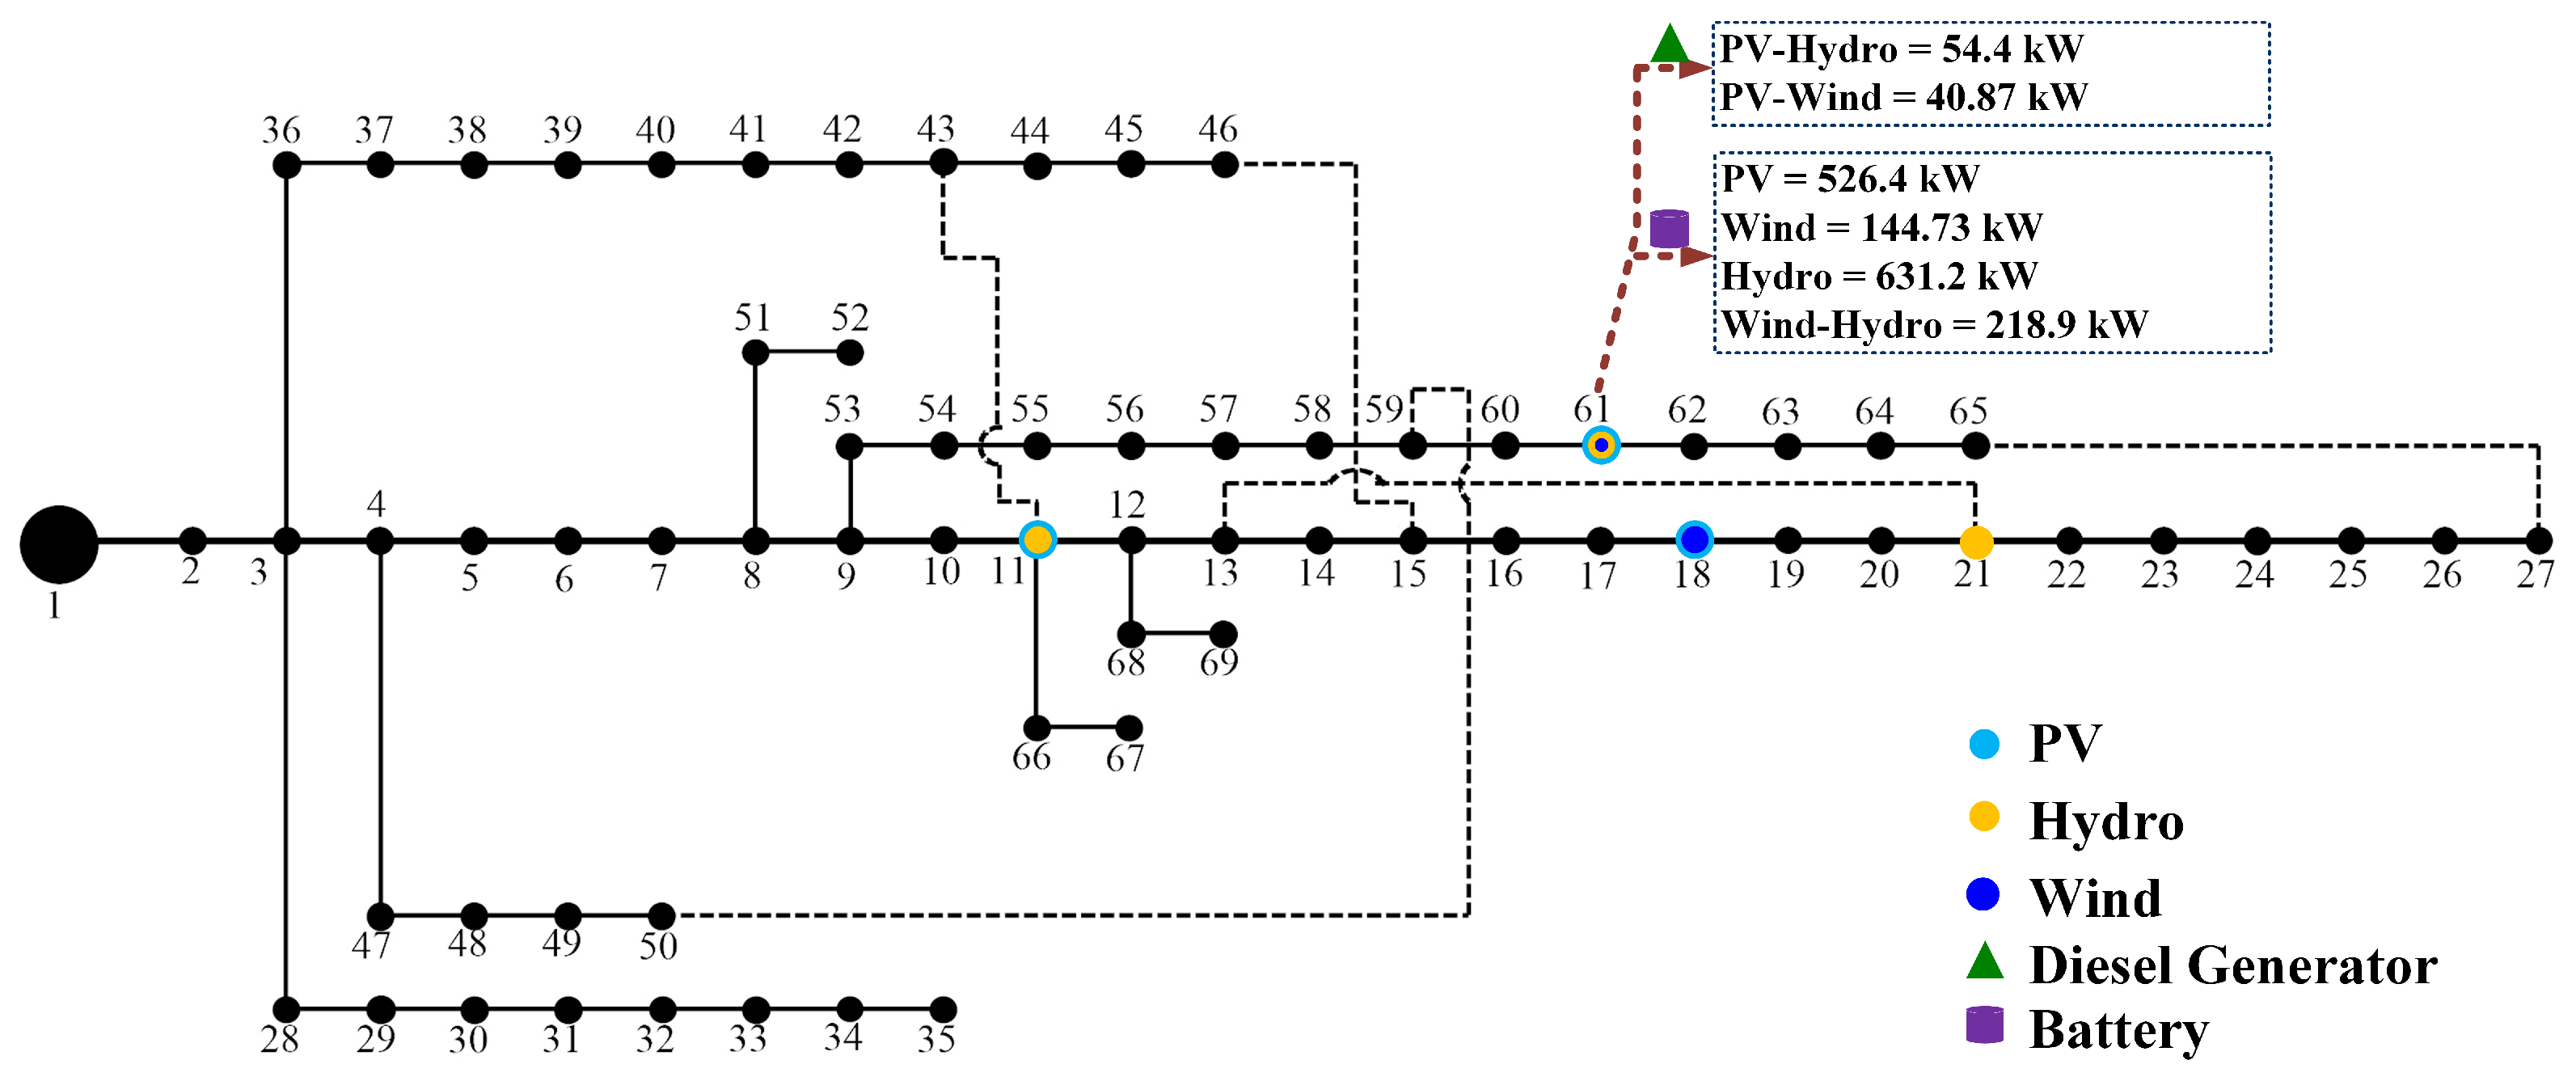
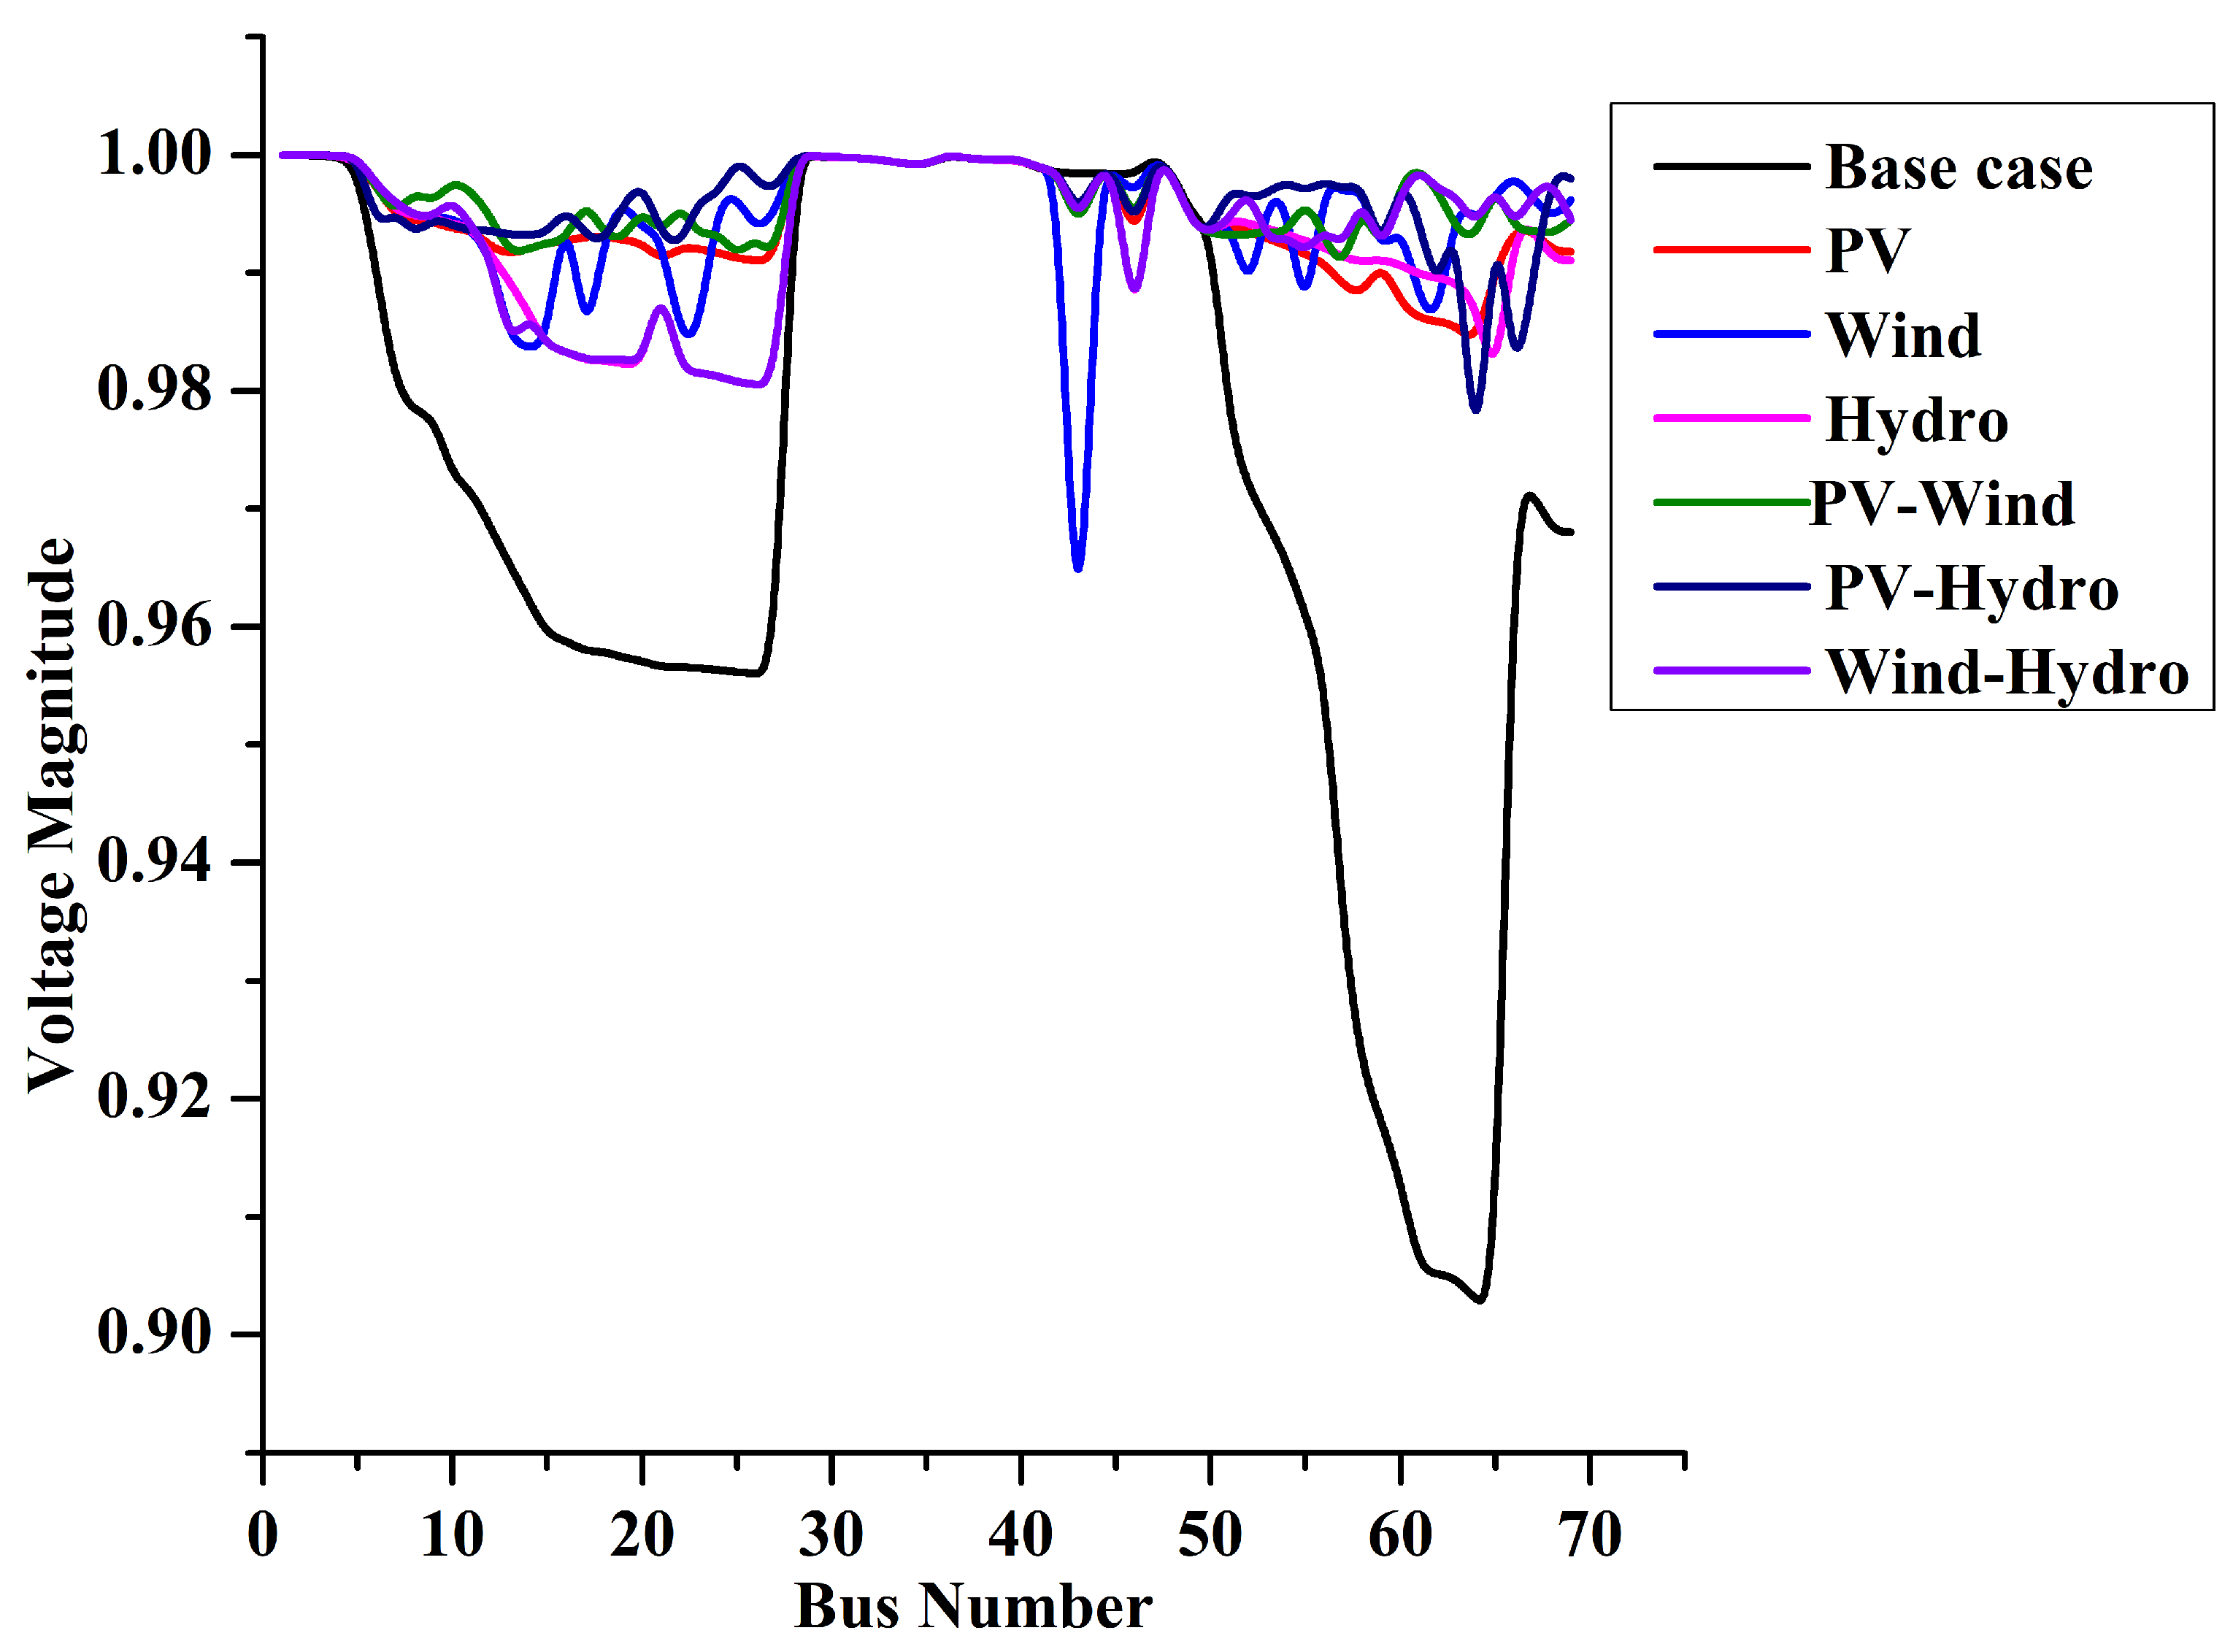
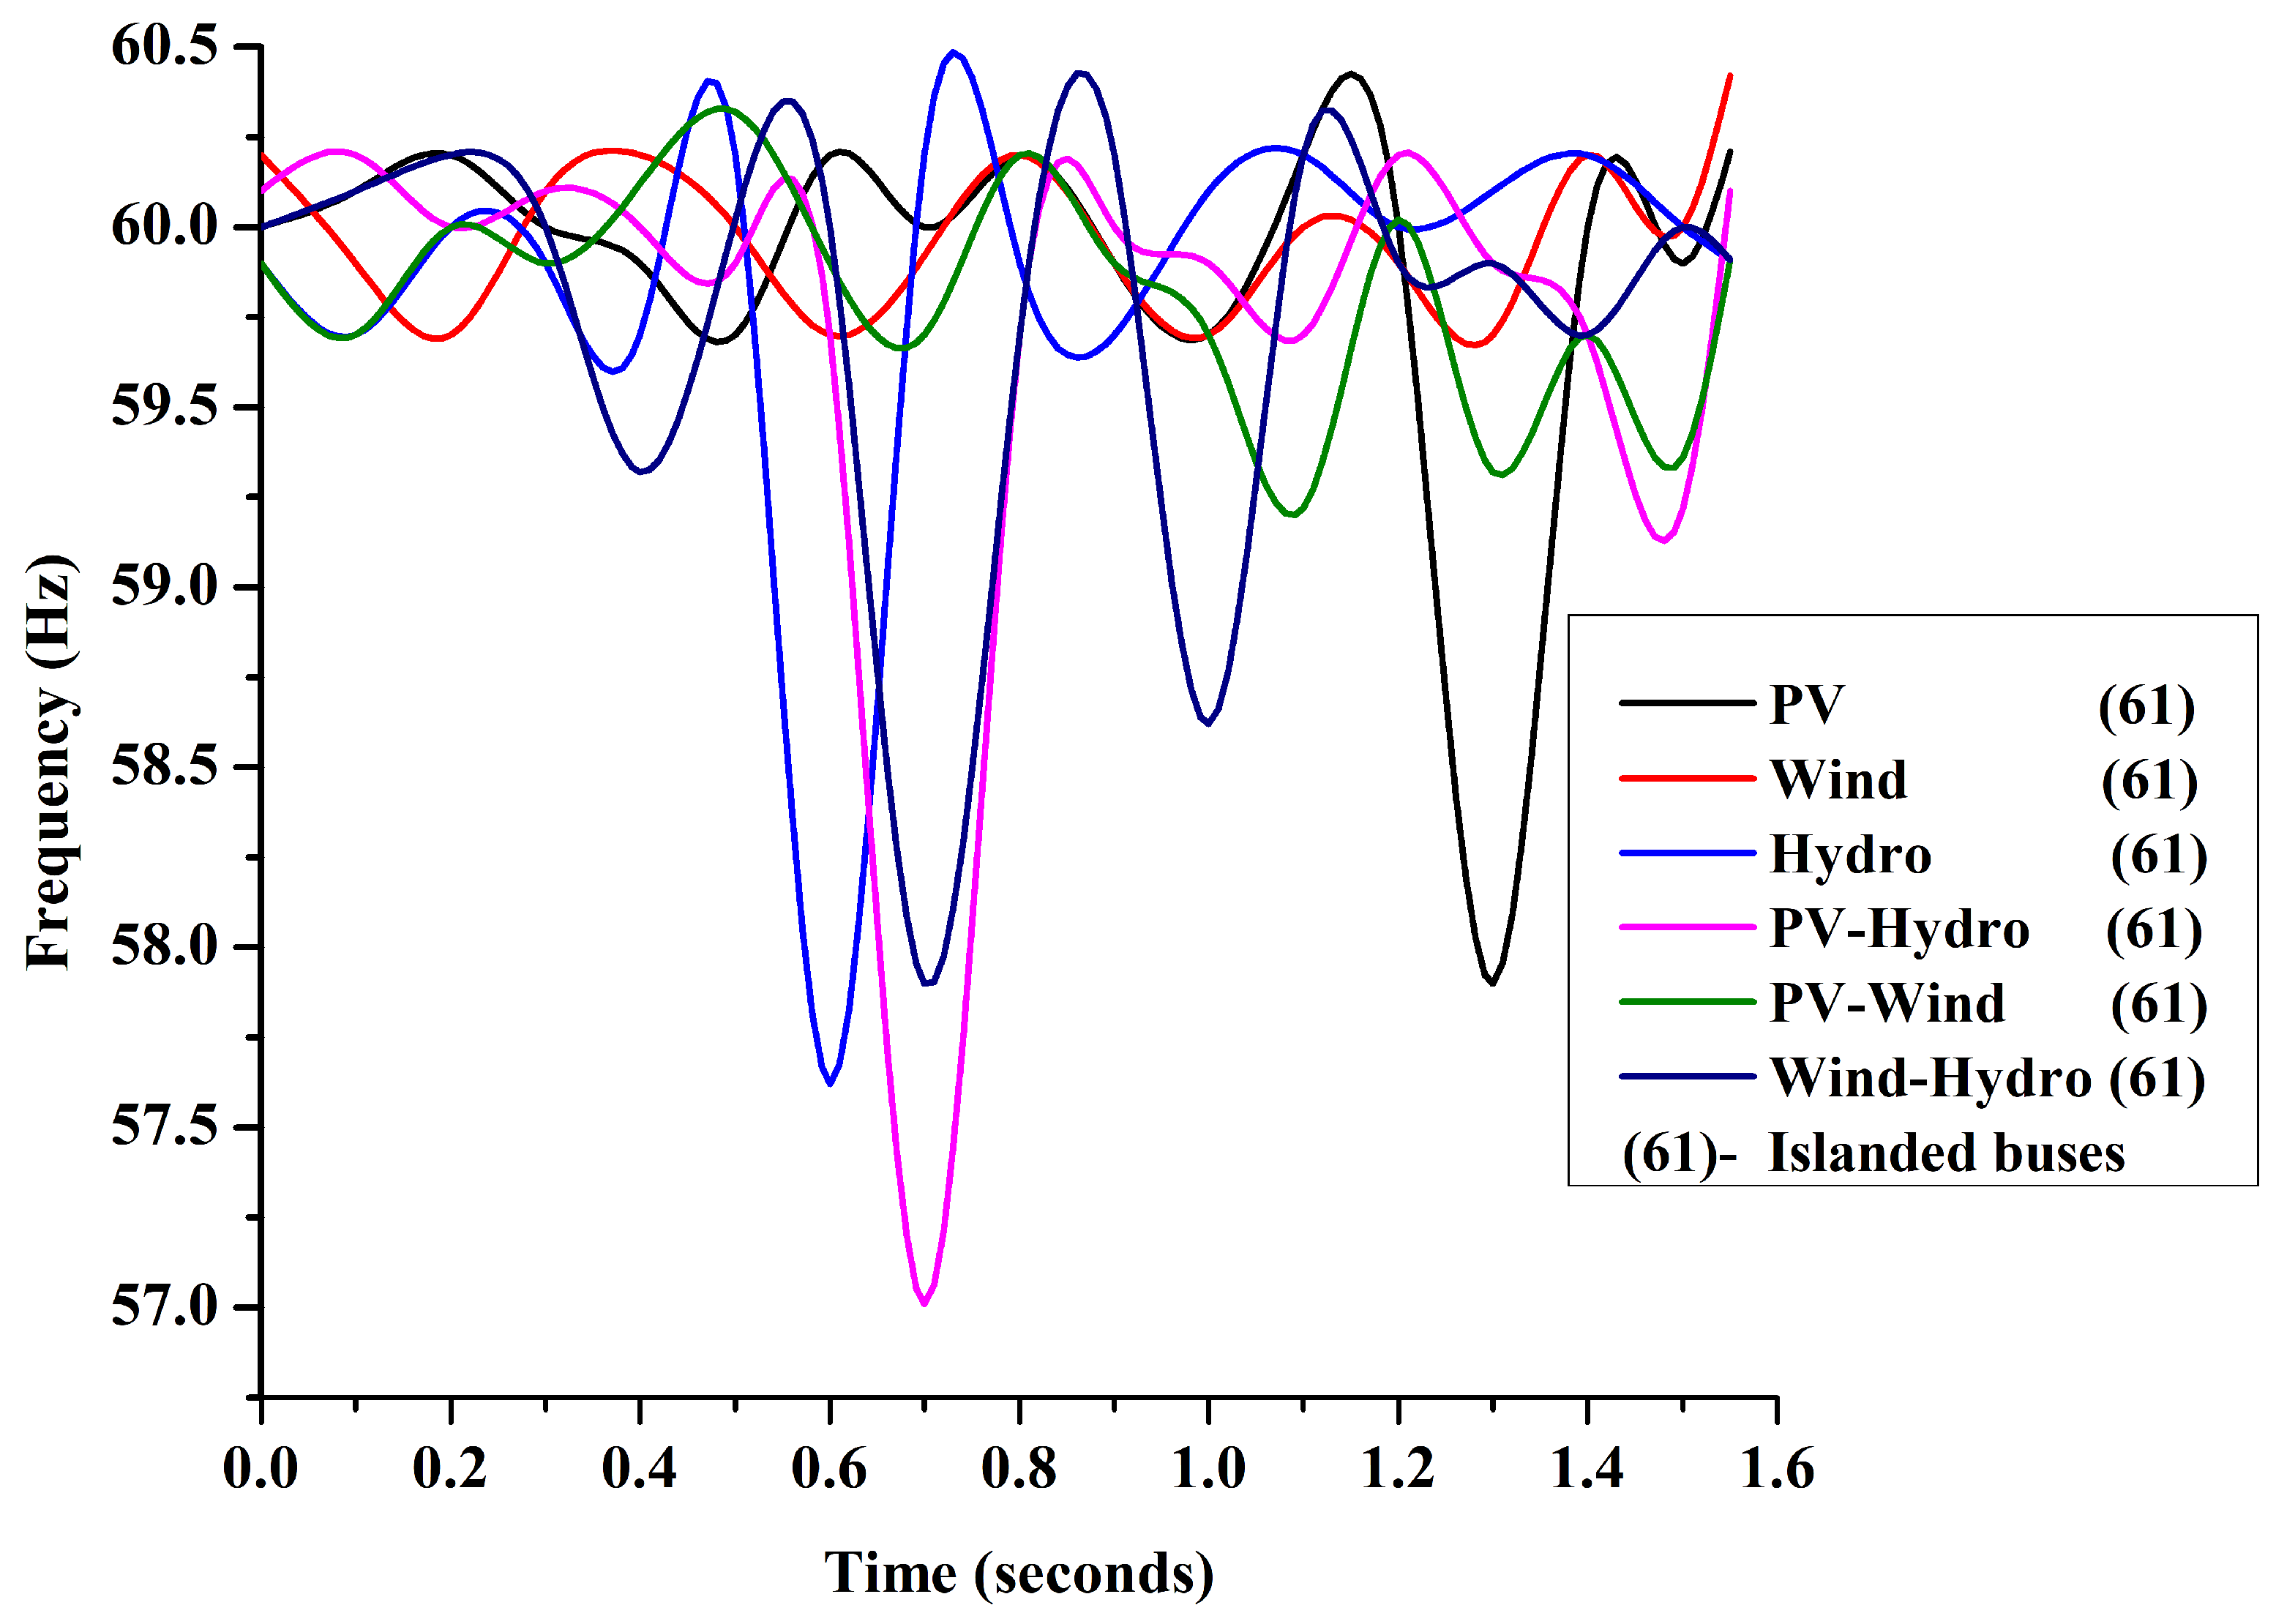
5.2. Islanding Detection and Prevention for the 69-Bus System

Islanding detection with the deviation in voltage (v) and frequency (f) was performed with the placement of PV, hydro, and wind units. The 69-bus system with the DG units under consideration is shown in Figure 6. At buses 11, 18, and 61, PV units were placed, and these buses had ratings of 501.2, 482.2, and 1770.4 kW, respectively [35]. A wind unit with a rating of 409.6 kW was placed at the 18th bus, and one with a rating of 1338.73 kW was placed at the 61st bus [27]. At the 11th bus, 21st bus, and 61st bus, hydro units were placed with ratings of 707.1, 256, and 1875.2 kW, respectively [35].
Table 5 shows the results of the exiting techniques with the proposed strategy for different DG units. The time taken for the detection of islanding was measured with the variation in voltage (v) and frequency (f) at the islanded buses. The loads in all DG combinations were not varied until 0.5 s, and after 0.5 s, the loads were constantly increased in steps of 10% of the system’s base load. While increasing the load, there was a deviation in the voltage and frequency at 1.35 s (PV), 1.55 s (wind), 0.62 s (hydro), 0.65 s (PV–hydro), 0.57 s (PV–wind) and 0.57 s (wind–hydro).
In the presence of PV, hydro, wind, the combination of PV and hydro, the combination of PV and wind, and the combination of hydro and wind, the method of the V-F index identified islanding at the 61st bus. Using the (proposed) V-F index method, islanding was noticed at 119.6% of the system’s base load for PV, 110.6% of the system’s base load for hydro, 112.4% of the system’s base load for wind, 111.3% of the system’s base load for DG with PV and hydro together, 110.26% of the system’s base load for DG with PV and wind together, and 111.25% of the system’s base load for DG with hydro and wind together. However, when using existing methods [13,33], the islanding is determined at 125.1% and 129.3% of the system’s base load for PV, 112.3% and 116.2% of the system’s base load for hydro, 127.3% and 112.2% of the system’s base load for wind, 125.3% and 112.7% of the system’s base load for DG with PV and hydro together, 117.3% and 119.2% of the system’s base load for DG with PV and wind together, and 115.3% and 113.2% of the system’s base load for DG with hydro and wind together.
In the proposed strategy, when a PV unit was placed, the islanding was detected at the 61st bus in 1.35 s. The detection time when using voltage variation [33] was 1.56 s, and that when using frequency variation [13] was 1.72 s. The islanding occurred at the 61st bus because the load was less than the generation. There was a 1244 kW load, and the generation was 1770.4 kW. Placing a battery with a rating of 526.4 kW at the 61st bus prevented islanding. By using the proposed strategy, accuracy was achieved in the detection; in addition, the time taken for the detection of islanding was reduced by 0.21 s compared to that of the voltage variation [33] and 0.37 s compared to that of the frequency variation [13].
With the presence of wind, hydro, PV–hydro, PV–wind, and wind–hydro, islanding occurred at the 61st bus according to the proposed strategy. The voltage variation method [33] detected islanded buses in 1.92 s for wind, 1.75 s for hydro, 0.96 s for PV–hydro, 0.92 s for PV–wind, and 0.75 s for wind–hydro. The frequency variation method [13] detected islanded buses in 1.92 s for wind, 1.56 s for hydro, 0.75 s for PV–hydro, 0.66 s for PV–wind, and 0.63 s for wind–hydro. Islanding was detected by the proposed strategy at the 61st bus in 1.55 s for wind alone, 0.62 s for hydro alone, 0.65 s for PV–hydro, 0.57 s for PV–wind, and 0.57 s for wind–hydro.
Islanding occurred at the 61st bus due to a mismatch between the generation and load. Placement of wind units provided a load of 1194 kW and generation of 1338.73 kW, which led to islanding. The hydro placement led to islanding because the generation was greater than the load, with a load of 1244 kW and generation of 1875.2 kW. For the wind–hydro placement, islanding occurred at the same bus because the generation was greater than the load, with a load of 2995.03 kW and generation of 3213.93 kW. Placing a battery with a rating of 144.73, 631.2, or 218.9 kW at the 61st bus for wind, hydro, or wind–hydro, respectively, prevented islanding. By using the proposed strategy, accuracy was achieved in detection; in addition, the time taken for the detection of islanding for wind, hydro, and wind–hydro was reduced by 0.37, 1.13, and 0.18 s, respectively, in comparison with that of the voltage variation [33]. The time time taken for the detection of detection of islanding for wind, hydro, and wind–hydro was reduced by 0.37, 0.94, and 0.06 s, respectively, in comparison with that of the frequency variation [13].
For the PV–hydro and PV–wind placements, islanding occurred at the 61st bus because the load was greater than the generation, with loads of 3700 and 3150 kW and generation of 3645.6 and 3109.13 kW. Placing a diesel generator with a rating of 54.4 or 40.87 kW prevents islanding at the 61st bus. The detection times when using voltage variation [33] were 0.96 and 0.92 s, and those found when using frequency variation [13] were 0.75 and 0.66 s. The proposed strategy detected islanding in 0.65 and 0.57 s. By using the proposed strategy, accuracy was achieved in detection; in addition, the time taken for the detection of islanding for PV–hydro and PV–wind was reduced by 0.31 and 0.35 s in comparison with that of voltage variation [33]. The time taken for the detection of islanding for PV–hydro and PV–wind was reduced by 0.1 and 0.09 s in comparison with that of frequency variation [13].
The NDZs were reduced by the proposed method for all cases of DG units in comparison with the existing methods. This was because the number of buses connected to the 61st bus (the islanded bus) was only five, unlike in the existing methods. The proposed V-F index method was also suitable for low-power mismatches. In the 69-bus system, the islanded bus was identified at the load of 40 kW.
In the V-F index method, the voltage and frequency are continuously monitored (passive islanding), and K 1 and K 2 are calculated for different cases by using Equation (21). The occurrence of islanding was mostly at the 61st bus, as the K 2 and K 1 values for PV were 0.9532 and 0.97652, the K 2 and K 1 values for wind were 0.9235 and 0.93568, the K 2 and K 1 values for hydro were 0.9335 and 0.96568, the K 2 and K 1 values for PV–hydro were 0.95362 and 0.97386, the K 2 and K 1 values for PV–wind were 0.9432 and 0.9682, and the K 2 and K 1 values for wind–hydro were 0.9632 and 0.9782, respectively. Islanding was detected at the 61st bus for the above cases because K 1 was greater than K 2 . This was due to greater generation or load in the bus, leading to a violation of the frequency limits. Frequency violations led to voltage variations because the change in the voltage ( Δ v ) varied with the frequency violations, as shown in Equation (16). Figure 7 and Figure 8 show the voltage values and frequency values of all of the buses. Buses in which the values deviated from the fixed values of voltage (0.99 to 1.05 p.u.) and fixed values of frequency (±2% of the rated frequency) were considered as islanded buses. Figure 9 has ones and zeros that represent non-islanded buses and islanded buses, respectively, for various DG combinations, which were obtained by using Equation (21).

Quantitative Analysis of the 69-Bus System

Reliability indices were calculated based on customer interruption (islanded buses). To ensure the system’s performance, reliability indices were measured, as shown in Table 6.
After installing the battery or diesel generator, the reliability values are improved by around 20% to 99% for the various reliability indices, and the values of K 1 (V-F index values) are less than the values of K 2 (threshold limits).

5.3. Islanding Detection and Prevention for the 118-Bus System

Islanding detection with the deviation in voltage (v) and frequency (f) was performed with the placement of PV, hydro, and wind units. The 118-bus system with DG under consideration is shown in Figure 10. At buses 20, 30, 47, 73, 80, 90, and 110, PV units i with ratings of 2.0856, 3.3381, 2.1249, 2.794, 2.0369, 2.6069, and 3.1877 MW, respectively, were placed [36]. Wind units were placed at the second bus with a rating of 2.10000 MW, at the fifth bus with a rating of 1.70000 MW, at the 12th bus with a rating of 1.65000 MW, at the 44th bus with a rating of 2.00000 MW, at the 53rd bus with a rating of 1.55000 MW, at the 82nd bus with a rating of 1.85000 MW, and at the 86th bus with a rating of 1.95000 MW [28]. Hydro units were placed at various buses, such as at the 20th bus with a rating of 2.0187 MW, the 39th bus with a rating of 3.2905 MW, the 47th bus with a rating of 2.0615 MW, the 74th bus with a rating of 2.4092 MW, the 85th bus with a rating of 1.7437 MW, the 90th bus with a rating of 2.5473 MW, and the 110th bus with a rating of 3.1775 MW [36].
Table 7 shows the results of the exiting techniques with the proposed strategy for different DG units. The time taken for the detection of islanding was measured with the variations in voltage (v) and frequency (f) at the islanded buses. The loads in all DG combinations were not varied until 0.5 s, and after 0.5 s, the loads were steadily increased in steps of 10% of the system’s base load. While increasing the load, there were deviations in the voltage and frequency values at 1.25 s for PV, 1.30 s for wind, 1.50 s for hydro, 1.79 s for the combination of PV–hydro, 0.55 s for the combination of PV–wind, and 0.93 s for the combination of wind–hydro.
In the presence of PV and hydropower generators, the method of the V-F index identified islanding at the 110th bus. Using the (proposed) V-F index method, the islanding was noticed at 114.9% of the base load for PV and 120.3% of the system’s base load for hydro. However, with the existing methods [13,33], the islanding was detected at 120.9% of the system’s base load and 123.5% of the system’s base load for PV and 128.3% of the system’s base load and 114.7% of the system’s base load for hydro. In the presence of wind and DG with hydro and wind together, the proposed method detected islanding at the fifth bus. With the proposed method, the islanding was detected at 112.5% of the base load for wind and 113.6% of the system’s base load for DG with hydro and wind together. However, with the existing methods [13,33], the islanding was detected at 128.3% of the base load and 114.7% of the system’s base load for wind and 130% of the system’s base load and 124.3% of the base load for the combination of hydro and wind. In the presence of DG with PV and hydro together and DG with hydro and wind together, the proposed method detected islanding at the 110th bus. With the proposed method, the islanding was detected at 128.7% of the system’s base load for DG with PV and hydro together and 111.3% of the system’s base load for DG with hydro and wind together. However, with the existing methods [13,33], the islanding was detected at 129.5% of the system’s base load and 130% of the system’s base load for DG with PV and hydro together and at 112% of the system’s base load and 113.4% of the system’s base load for DG with hydro and wind together.
With the proposed strategy, when the PV unit was placed, the islanding was detected at the 110th bus in 1.25 s. The voltage variation method [33] detected the islanded bus in 1.39 s, and the frequency variation method [13] detected the islanded bus in 1.59 s. Islanding occurred at this bus because the generation was less than the load; the 110th bus had a load of 3.9955 MW, and the generation was 3.1877 MW. Islanding was prevented by installing a diesel generator with a rating of 0.8078 MW at the 110th bus. By using the proposed strategy, accuracy was achieved in the detection; in addition, the time taken for the detection of islanding was reduced by 0.14 s in comparison with that of voltage variation [33] and by 0.3 s in comparison with that of frequency variation [13].
With the proposed strategy, when the wind unit was placed, the islanding was detected at the fifth bus in 1.30 s. The voltage variation method [33] detected the islanded bus in 1.75 s, and the frequency variation method [13] detected the islanded bus in 1.32 s. Islanding occurred at this bus because the load was less than the generation. The fifth bus had a load of 1.59 MW and the generation was 1.700 MW, which led to islanding. A battery with a rating of 0.11 MW is installed to prevent islanding. By using the proposed strategy, accuracy was achieved in the detection; in addition, the time taken for the detection of islanding was reduced by 0.45 s in comparison with that of voltage variation [33] and by 0.02 s in comparison with that of frequency variation [13].
With the proposed strategy, when the hydro unit was placed, the islanding occurred at the 110th bus in 1.50 s. The voltage variation method [33] detected the islanded bus in 1.55 s, and the frequency variation method [13] detected the islanded bus in 1.55 s. Islanding occurred at this bus because the generation was less than the load. The 110th bus had the generation of 3.1775 MW and a load of 4.230 MW, which led to islanding. Installing a diesel generator with a rating of 1.0525 MW prevented islanding at this bus. By using the proposed strategy, accuracy was achieved in the detection and prevention; in addition, the time taken for the detection of islanding was reduced by 0.05 s in comparison with that of voltage variation [33] and by 0.05 s in comparison with that of frequency variation [13].
When PV–hydro and wind–hydro were placed, islanding occurred at bus 110. The islanding detection times for the combinations of PV–hydro and wind–hydro were 1.79 and 0.93 s at the 110th bus. At the 110th bus, the generation was 6.3652 MW and the load was 6.18850 MW for the PV–hydro combination, and the generation was 3.1775 MW and the load was 4.58 MW for the wind–hydro combination. The voltage variation method [33] detected the islanded bus in 1.92 s and the frequency variation method [13] detected the islanded bus in 1.99 s for the combination of PV–hydro. For the wind–hydro combination, the voltage variation method [33] detected the islanded bus in 1.99 s and the frequency variation method [13] detected the islanded bus in 0.99 s. By using the proposed strategy, accuracy was achieved in the detection; in addition, the time taken for the detection of islanding was reduced by 0.13 and 1.06 s in comparison with that of voltage variation [33] for the PV–hydro combination and wind–hydro combination, and the time taken for the detection of islanding was reduced by 0.2 and 0.06 s in comparison with that of frequency variation [13] for the PV–hydro combination and wind–hydro combination. Installing a battery with a rating of 0.1767 MW at the 110th bus prevented islanding for the PV–hydro combination. Installing a diesel generator with a rating of 1.4 MW prevented islanding at the 110th bus for the wind–hydro combination.
When the PV–wind combination was placed, islanding occurred in 0.93 s at the fifth bus with the proposed strategy. Bus 5 had the generation of 1.700 MW and a load of 1.69 MW, which led to islanding. The method of voltage variation [33] detected the islanded bus in 1.99 s, and the frequency variation method [13] detected the islanded bus in 0.99 s. Installing a battery with a rating of 0.01 MW at the fifth bus prevented islanding. By using the proposed strategy, accuracy was achieved in the detection; in addition, the time taken for the detection of islanding was reduced by 0.04 s in comparison with that of voltage variation [33] and by 0.2 s in comparison with that of frequency variation [13].
The NDZs were reduced by the proposed method in the presence of PV, hydro, the combination of PV–hydro, and the combination of wind–hydro in comparison with those of existing methods. This was because the number of buses connected to the 110th bus (the islanded bus) was only four, unlike in the existing methods. Likewise, in the presence of wind and the combination of PV–wind, the NDZs were reduced by the proposed method. This was because the number of buses connected to the fifth bus was only five, unlike in the existing methods. The proposed V-F index method is also suitable for low-power mismatches. In the 118-bus system, the islanded bus was identified at a load of 10 kW.
In the V-F index method, the voltage and frequency are continuously monitored (passive islanding), and K 1 and K 2 are calculated for different cases by using Equation (21). The occurrence of islanding was mostly in the 110th bus, as the K 2 and K 1 values for PV were 0.9632 and 0.98652; for hydro, the K 2 and K 1 values were 0.9635 and 0.98568; for PV–hydro, the K 2 and K 1 values were 0.97362 and 0.99386; for wind–hydro, the K 2 and K 1 values were 0.9535 and 0.9782. Islanding was mostly detected at the 110th bus for the above cases because K 1 was greater than K 2 . This was due to the greater generation or load in the bus, leading to the violation of the frequency limits. Frequency violations led to voltage variations because the changes in the voltage ( Δ v ) varied with the frequency violations, as shown in Equation (16). Figure 11 and Figure 12 show the voltage values and frequency values of all of the buses. Buses in which the values deviated from the fixed values of voltage (0.99 to 1.05 p.u.) and fixed values of frequency (±2% of the rated frequency) were considered as islanded buses. Figure 13 has ones and zeros that represent the non-islanded and islanded buses, respectively, for various DG combinations, which were obtained by using Equation (21).

Quantitative Analysis of the 118-Bus System

Reliability indices were calculated based on customer interruption (islanded buses). To ensure the system’s performance, reliability indices were measured, as shown in Table 8.
After installing the battery or diesel generator, the reliability values are improved by around 21% to 98% for the various reliability indices, and the values of K 1 (V-F index values) are less than the values of K 2 (threshold limits).
The separate measurement of the deviations of frequency and voltage led to NDZs in the existing methods. The changes in frequency and voltage were simultaneously measured to reduce the NDZs in the proposed method. In addition, the proposed method helped in determining the exact islanded bus with various DG types. The effect of islanding was reduced by installing either a diesel generator or a battery unit, depending upon the power balance in the identified islands. The research findings from the three different bus systems can be summarized as follows:
  • In the 33-bus system, the vulnerable bus identified was bus 24 because of the value of K 1 (V-F index values) was greater than that of K 2 (threshold limits) for PV, hydro, and PV–hydro and wind–hydro combinations. With the proposed V-F index method, the detection time for impending islanding was 23.37% faster than that of the voltage variation method and 62.62% faster than that of the frequency variation method in the presence of PV. The proposed method was 30.98% faster than the voltage variation method and 28% faster than the frequency variation method in the presence of hydro. The proposed method was 33.33% faster than the voltage variation method and 31.46% faster than the frequency variation method in the presence of PV–hydro. The proposed method was 90% faster than the voltage variation method and 90.51% faster than the frequency variation method in the presence of wind–hydro. Likewise, bus 14 was the vulnerable bus for wind and the PV–wind combination. With the proposed V-F index method, the detection time for impending islanding was 27.58% faster than that of the voltage variation method and 26.58% faster than that of the frequency variation method in the presence of wind. The proposed method was 6.66% faster than the voltage variation method and 41.09% faster than the frequency variation method in the presence of PV–wind. The generation was greater than the load for PV, hydro, and the PV–hydro and wind–hydro combinations. So, a battery was installed for power balance at the 24th bus. The generation was less than the load for wind and the PV–wind combination. So, a diesel generator was installed for power balance at the 14th bus for wind and the PV–wind combination.
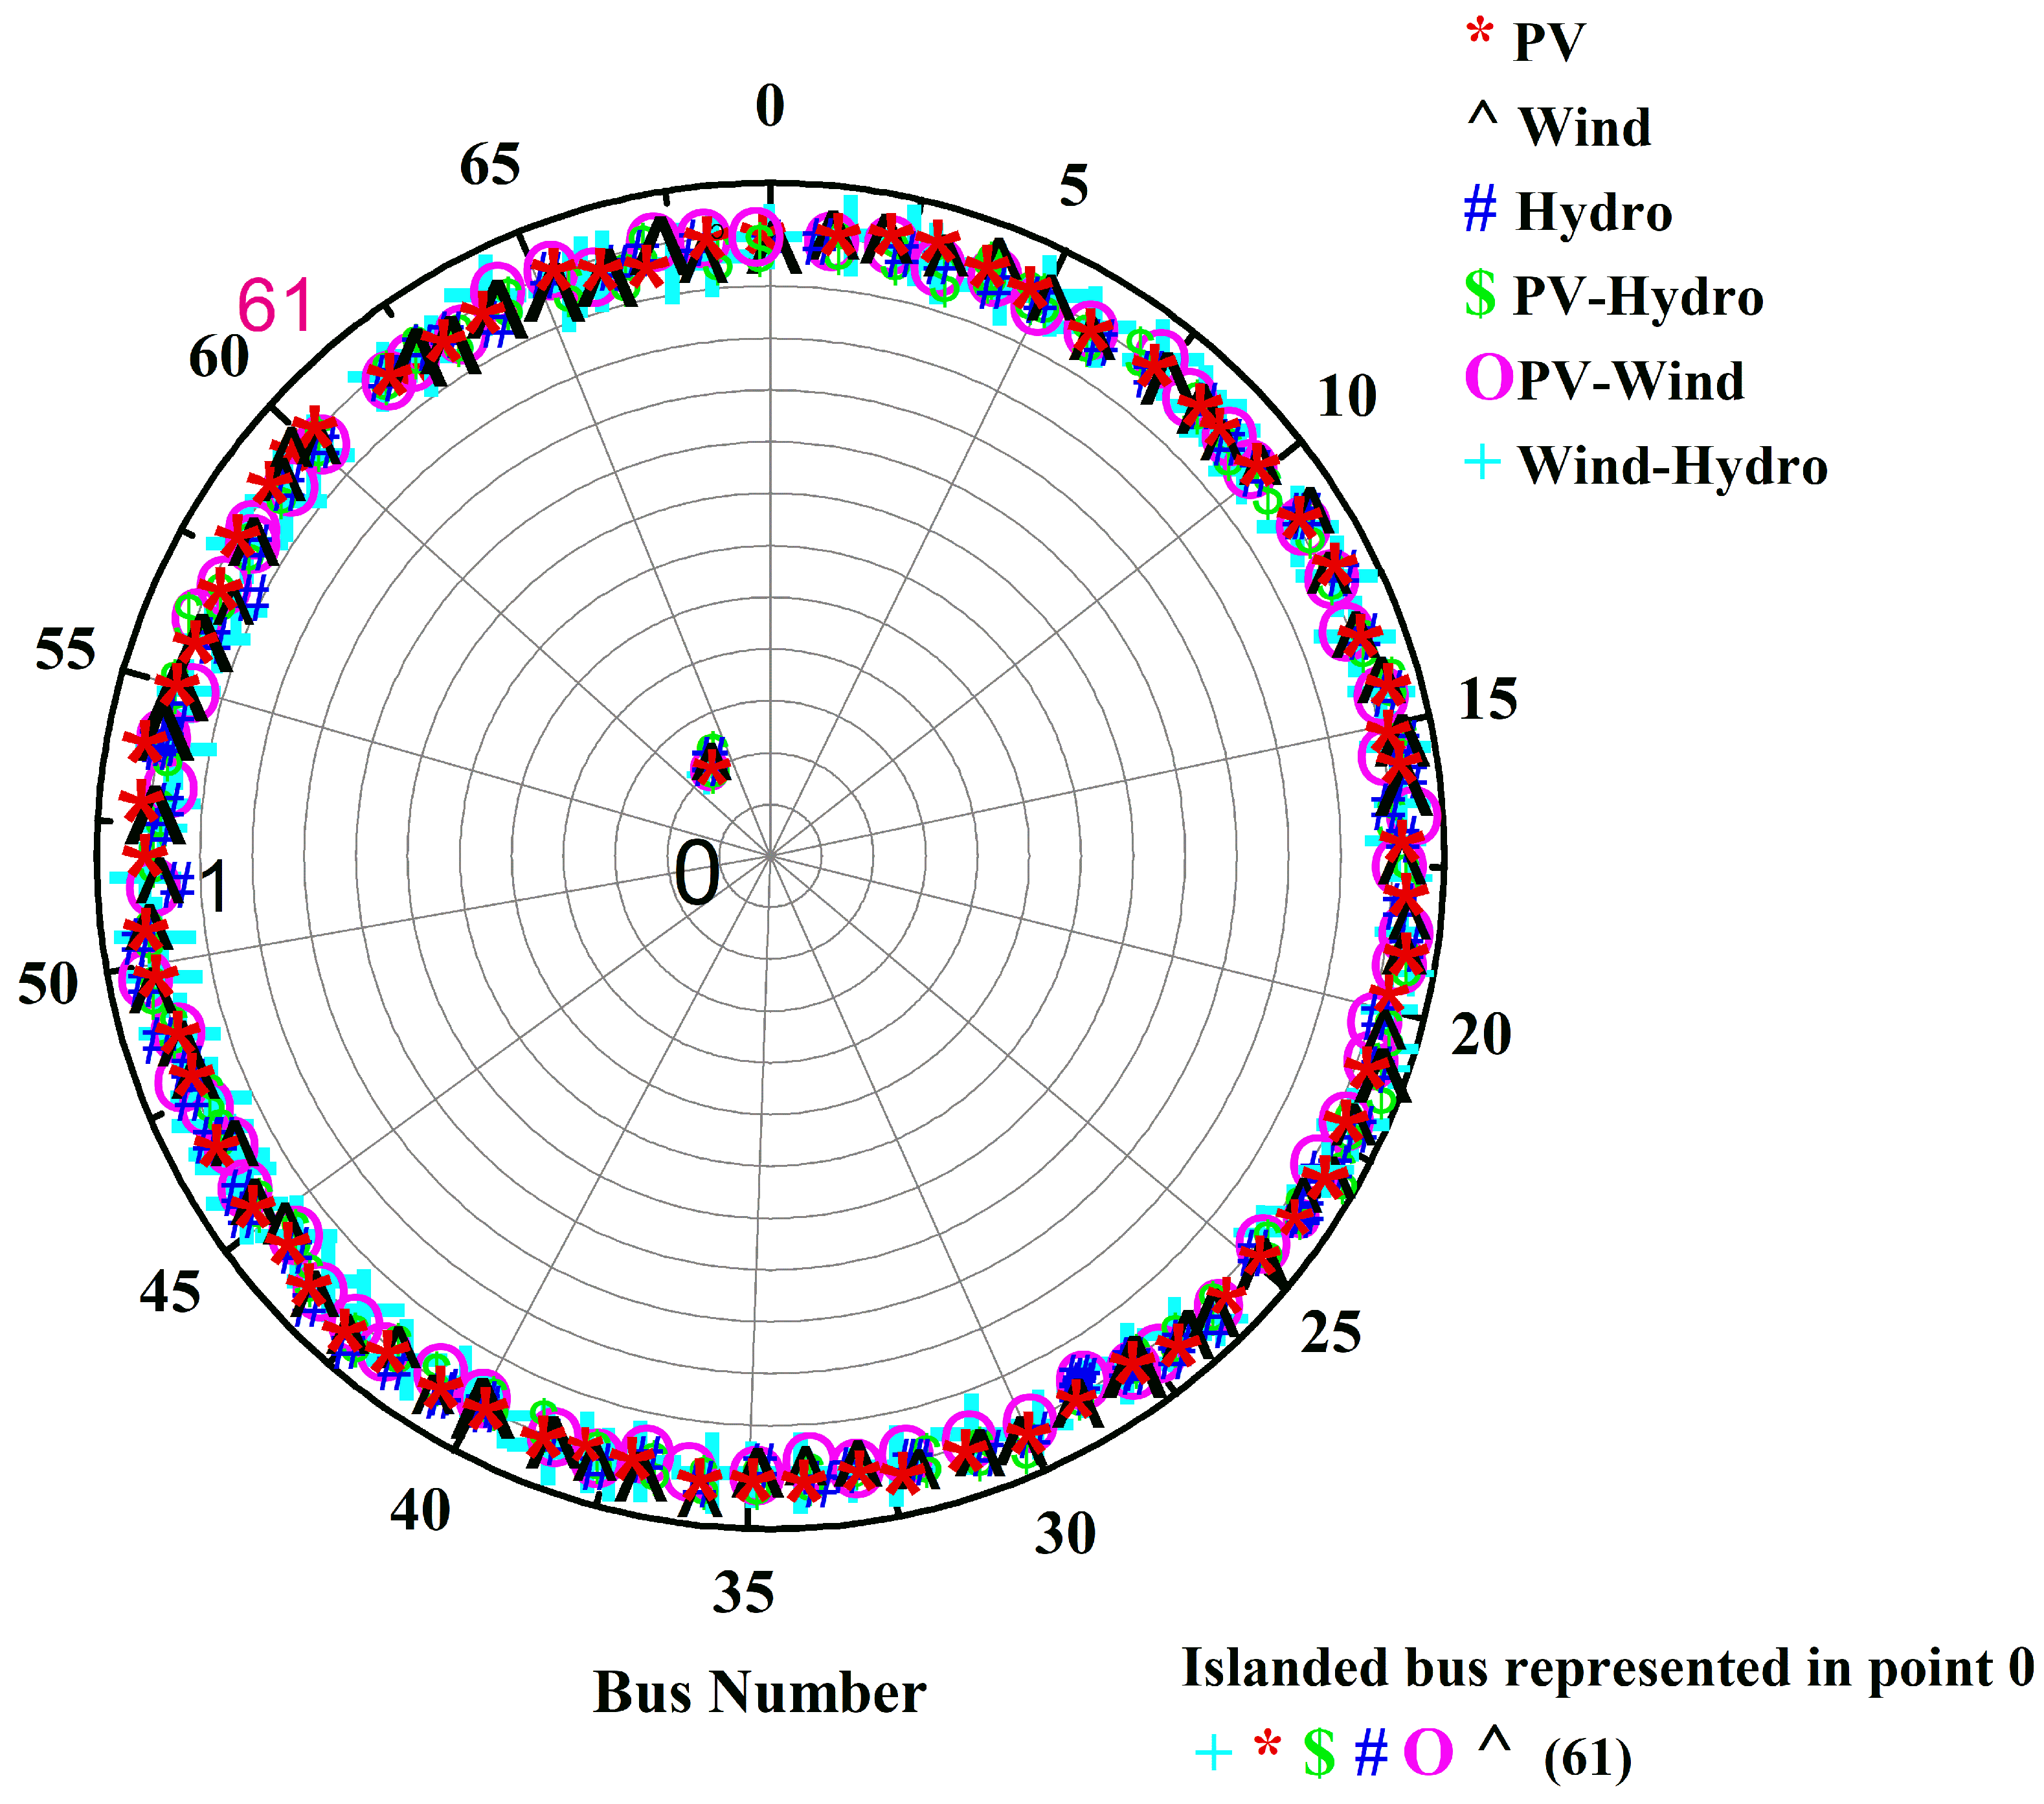
  • In the 69-bus system, the vulnerable bus identified was bus 61 because of the value of K 1 (V-F index values) was greater than that of K 2 (threshold limits) for PV, wind, hydro, PV–hydro, PV–wind, and wind–hydro. With the proposed V-F index method, the detection time for impending islanding was 14.43% faster than that of the voltage variation method and 24.10% faster than that of the frequency variation method in the presence of PV. The proposed method was 21.32% faster than the voltage variation method and 21.32% faster than the frequency variation method in the presence of wind. The proposed method was 95.35% faster than the voltage variation method and 86.23% faster than the frequency variation method in the presence of hydro. The proposed method was 38.50% faster than the voltage variation method and 14.28% faster than the frequency variation method in the presence of PV–hydro. The proposed method was 46.97% faster than the voltage variation method and 14.63% faster than the frequency variation method in the presence of PV–wind. The proposed method was 27.77% faster than the voltage variation method and 10% faster than the frequency variation method in the presence of wind–hydro. The generation was greater than the load for PV, wind, hydro, and the wind–hydro combination. So, a battery was installed for power balance at the 61st bus. The generation was less than the load for PV–hydro and the combination of PV–wind. So, a diesel generator was installed for power balance at the 61st bus for PV–hydro and the combination of PV–wind.
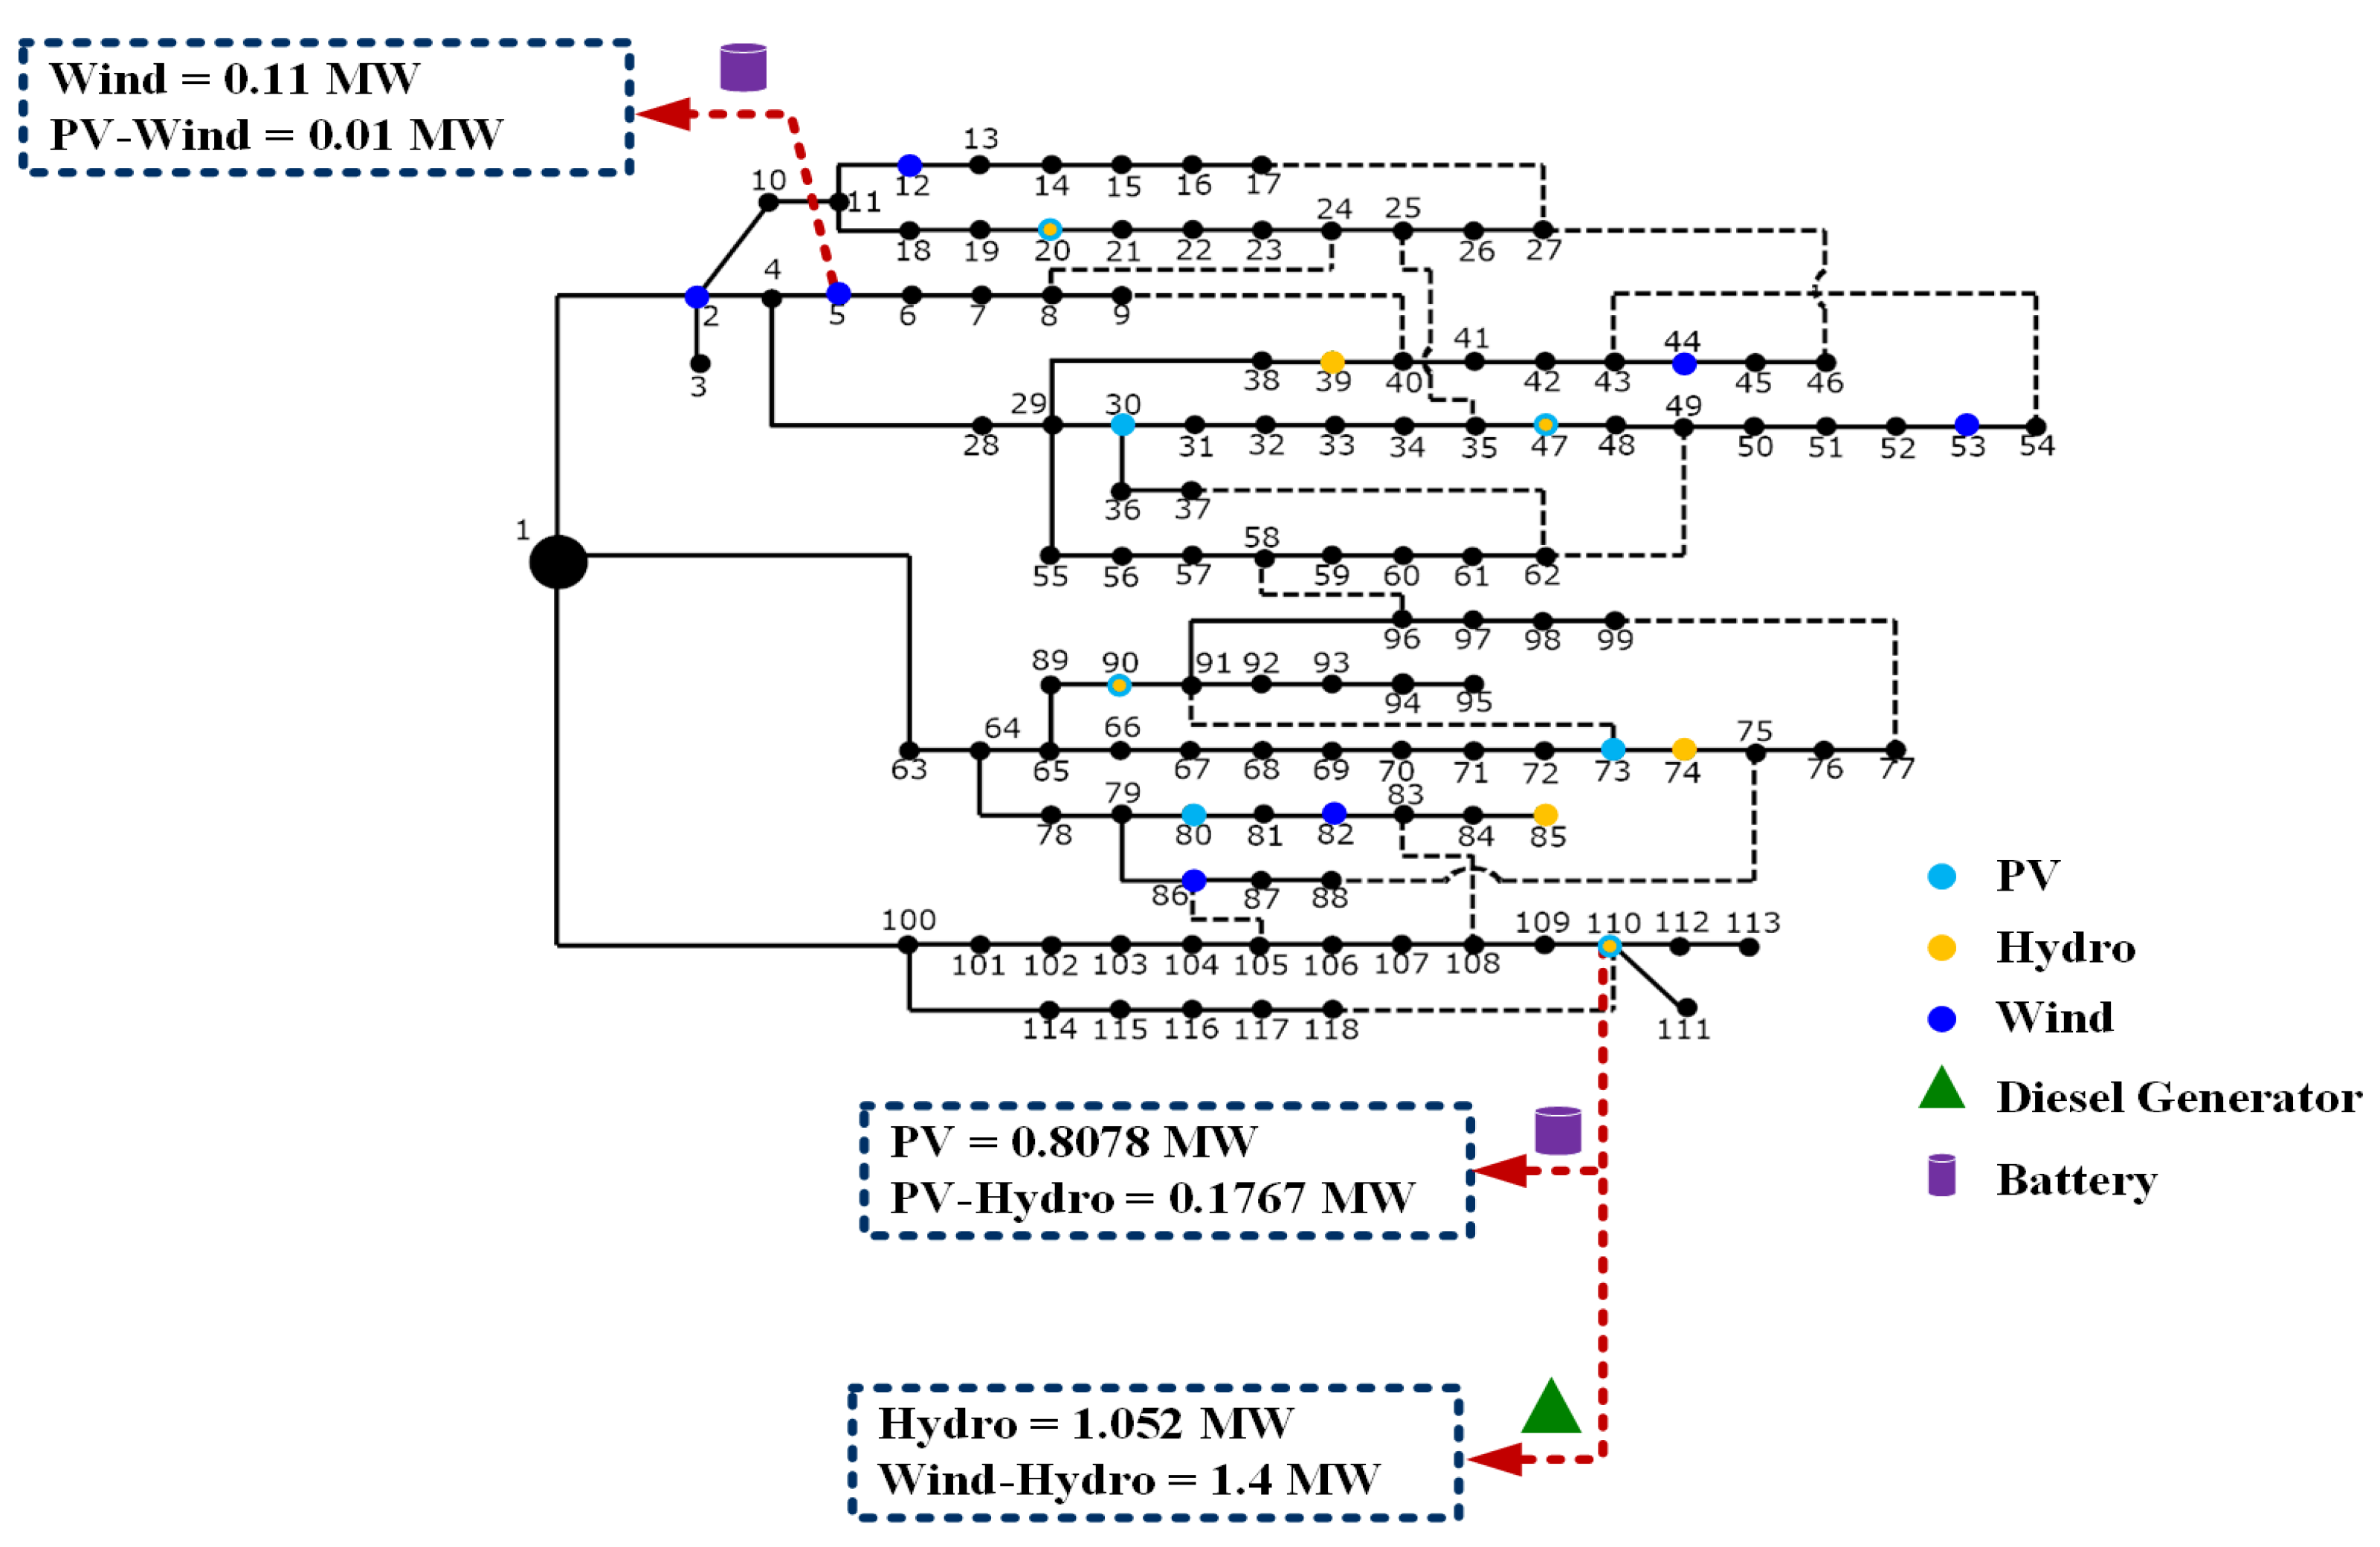
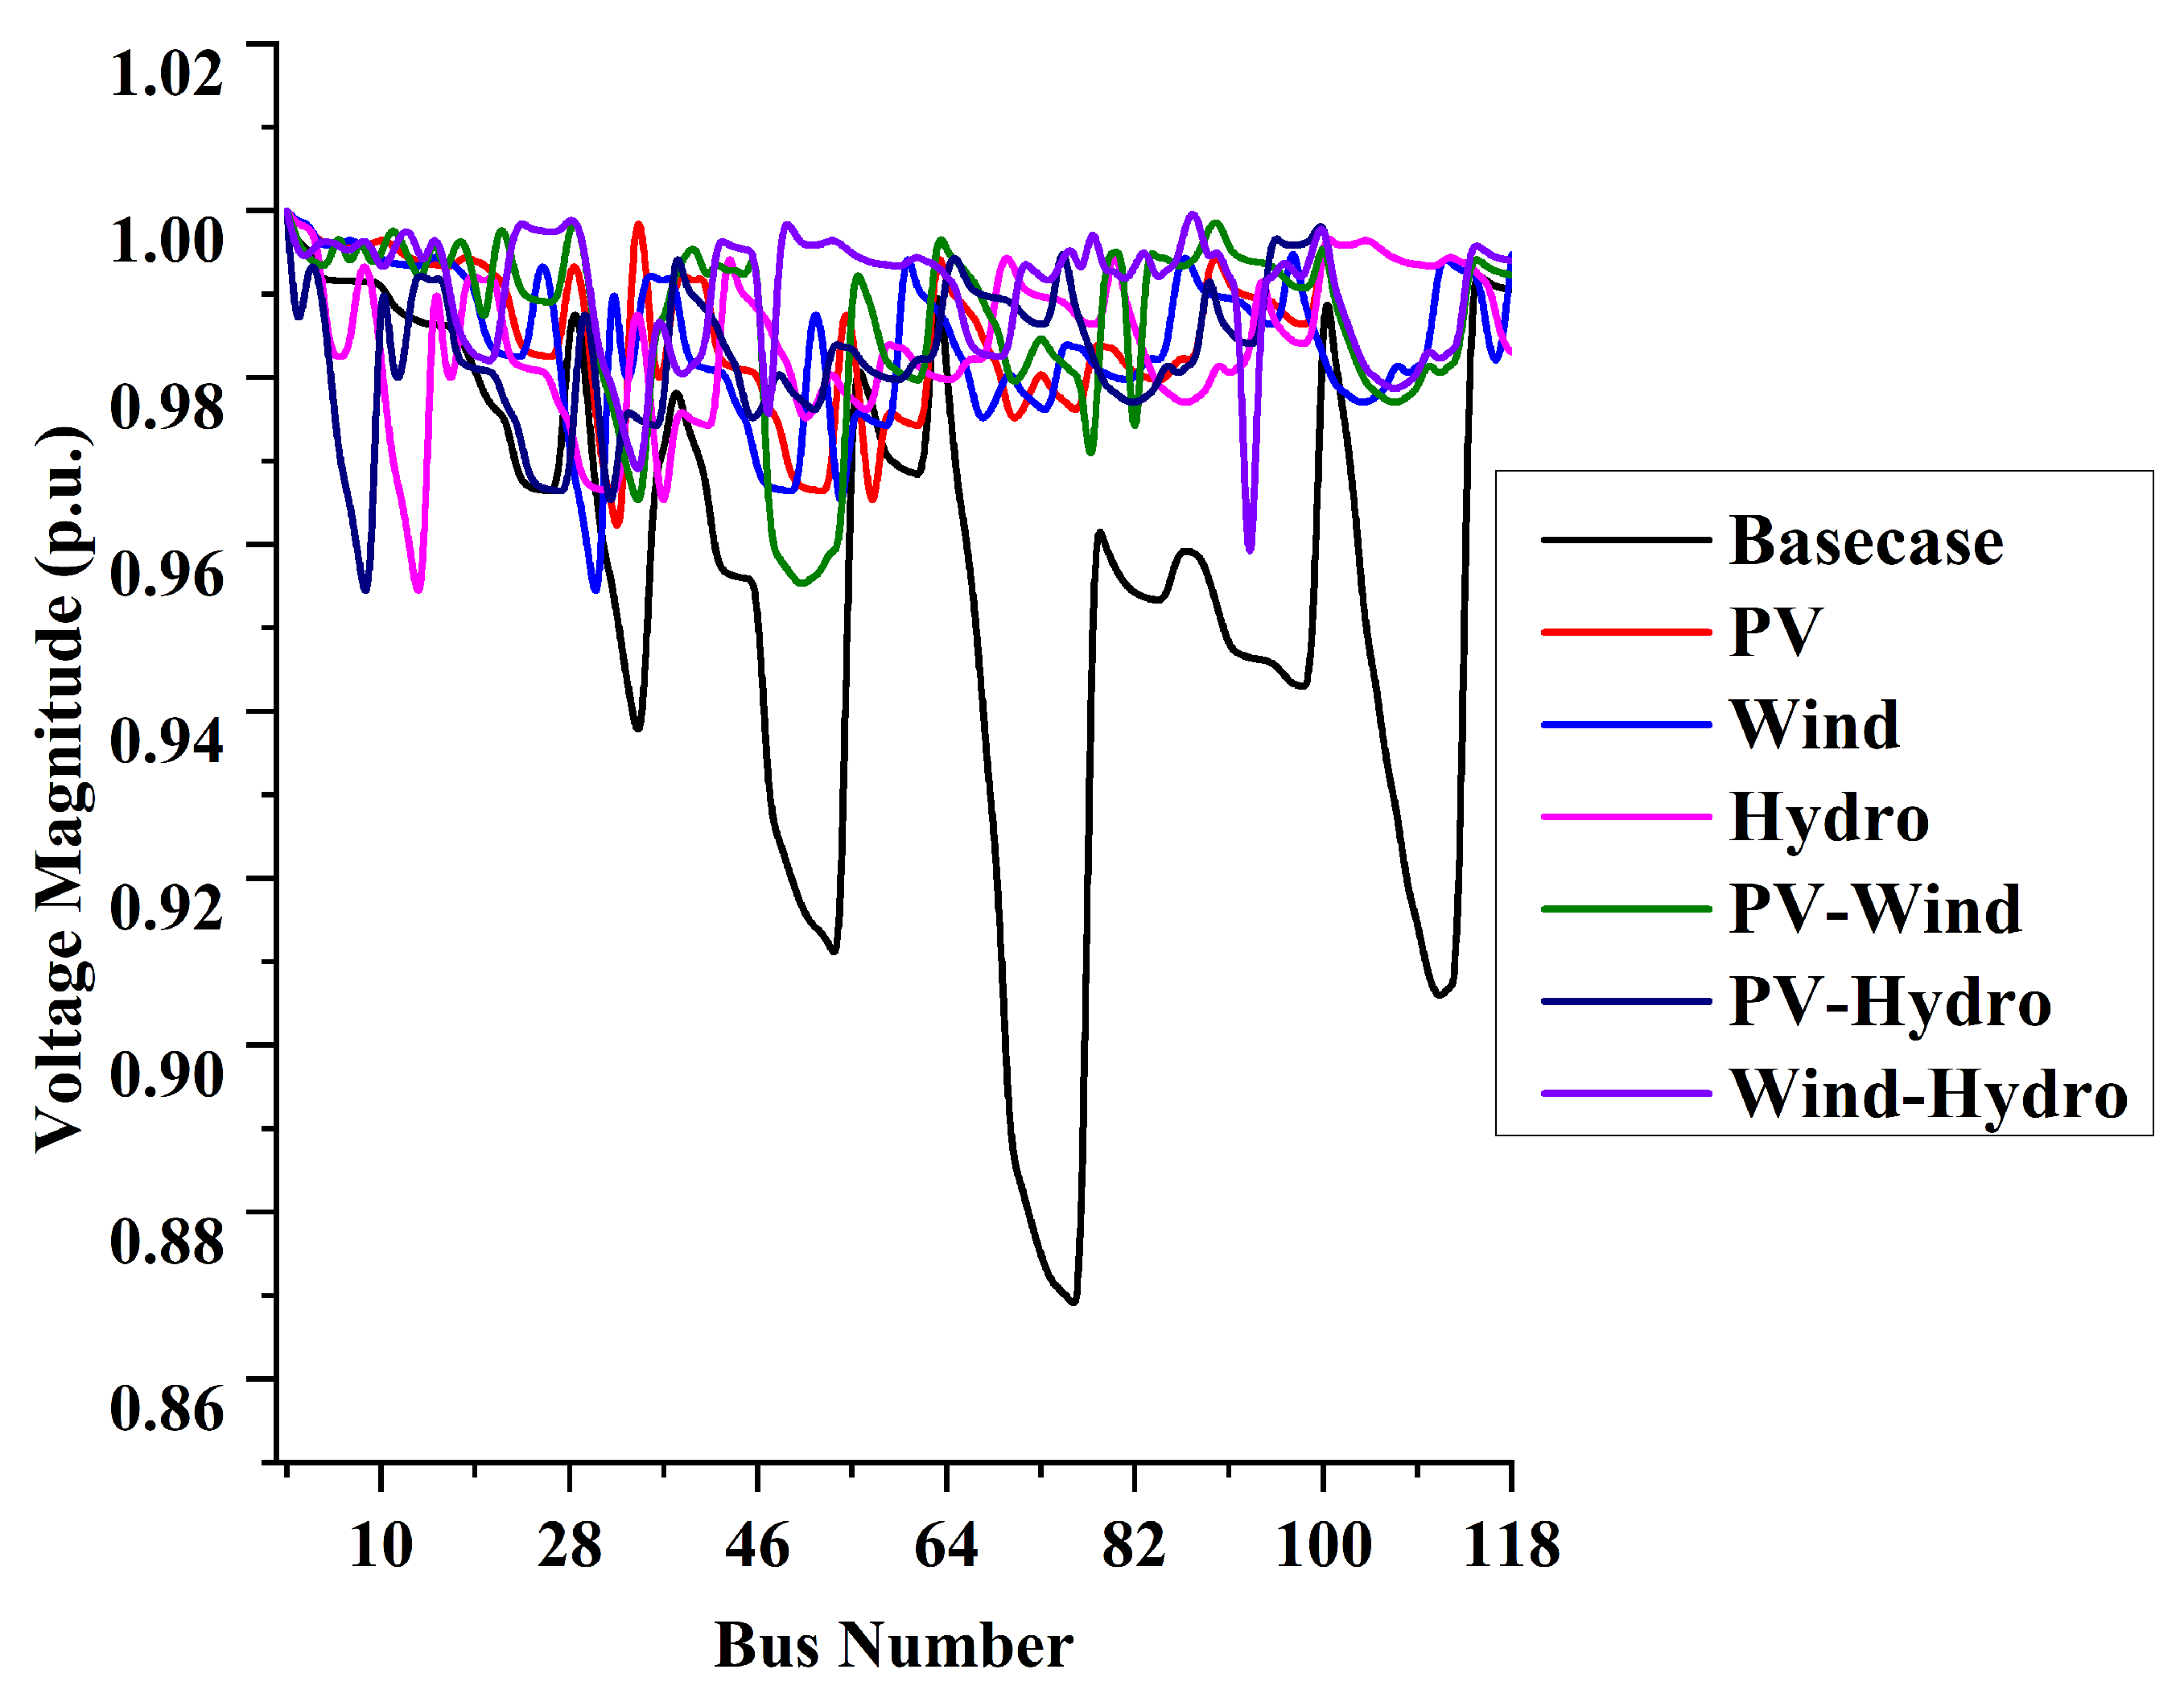
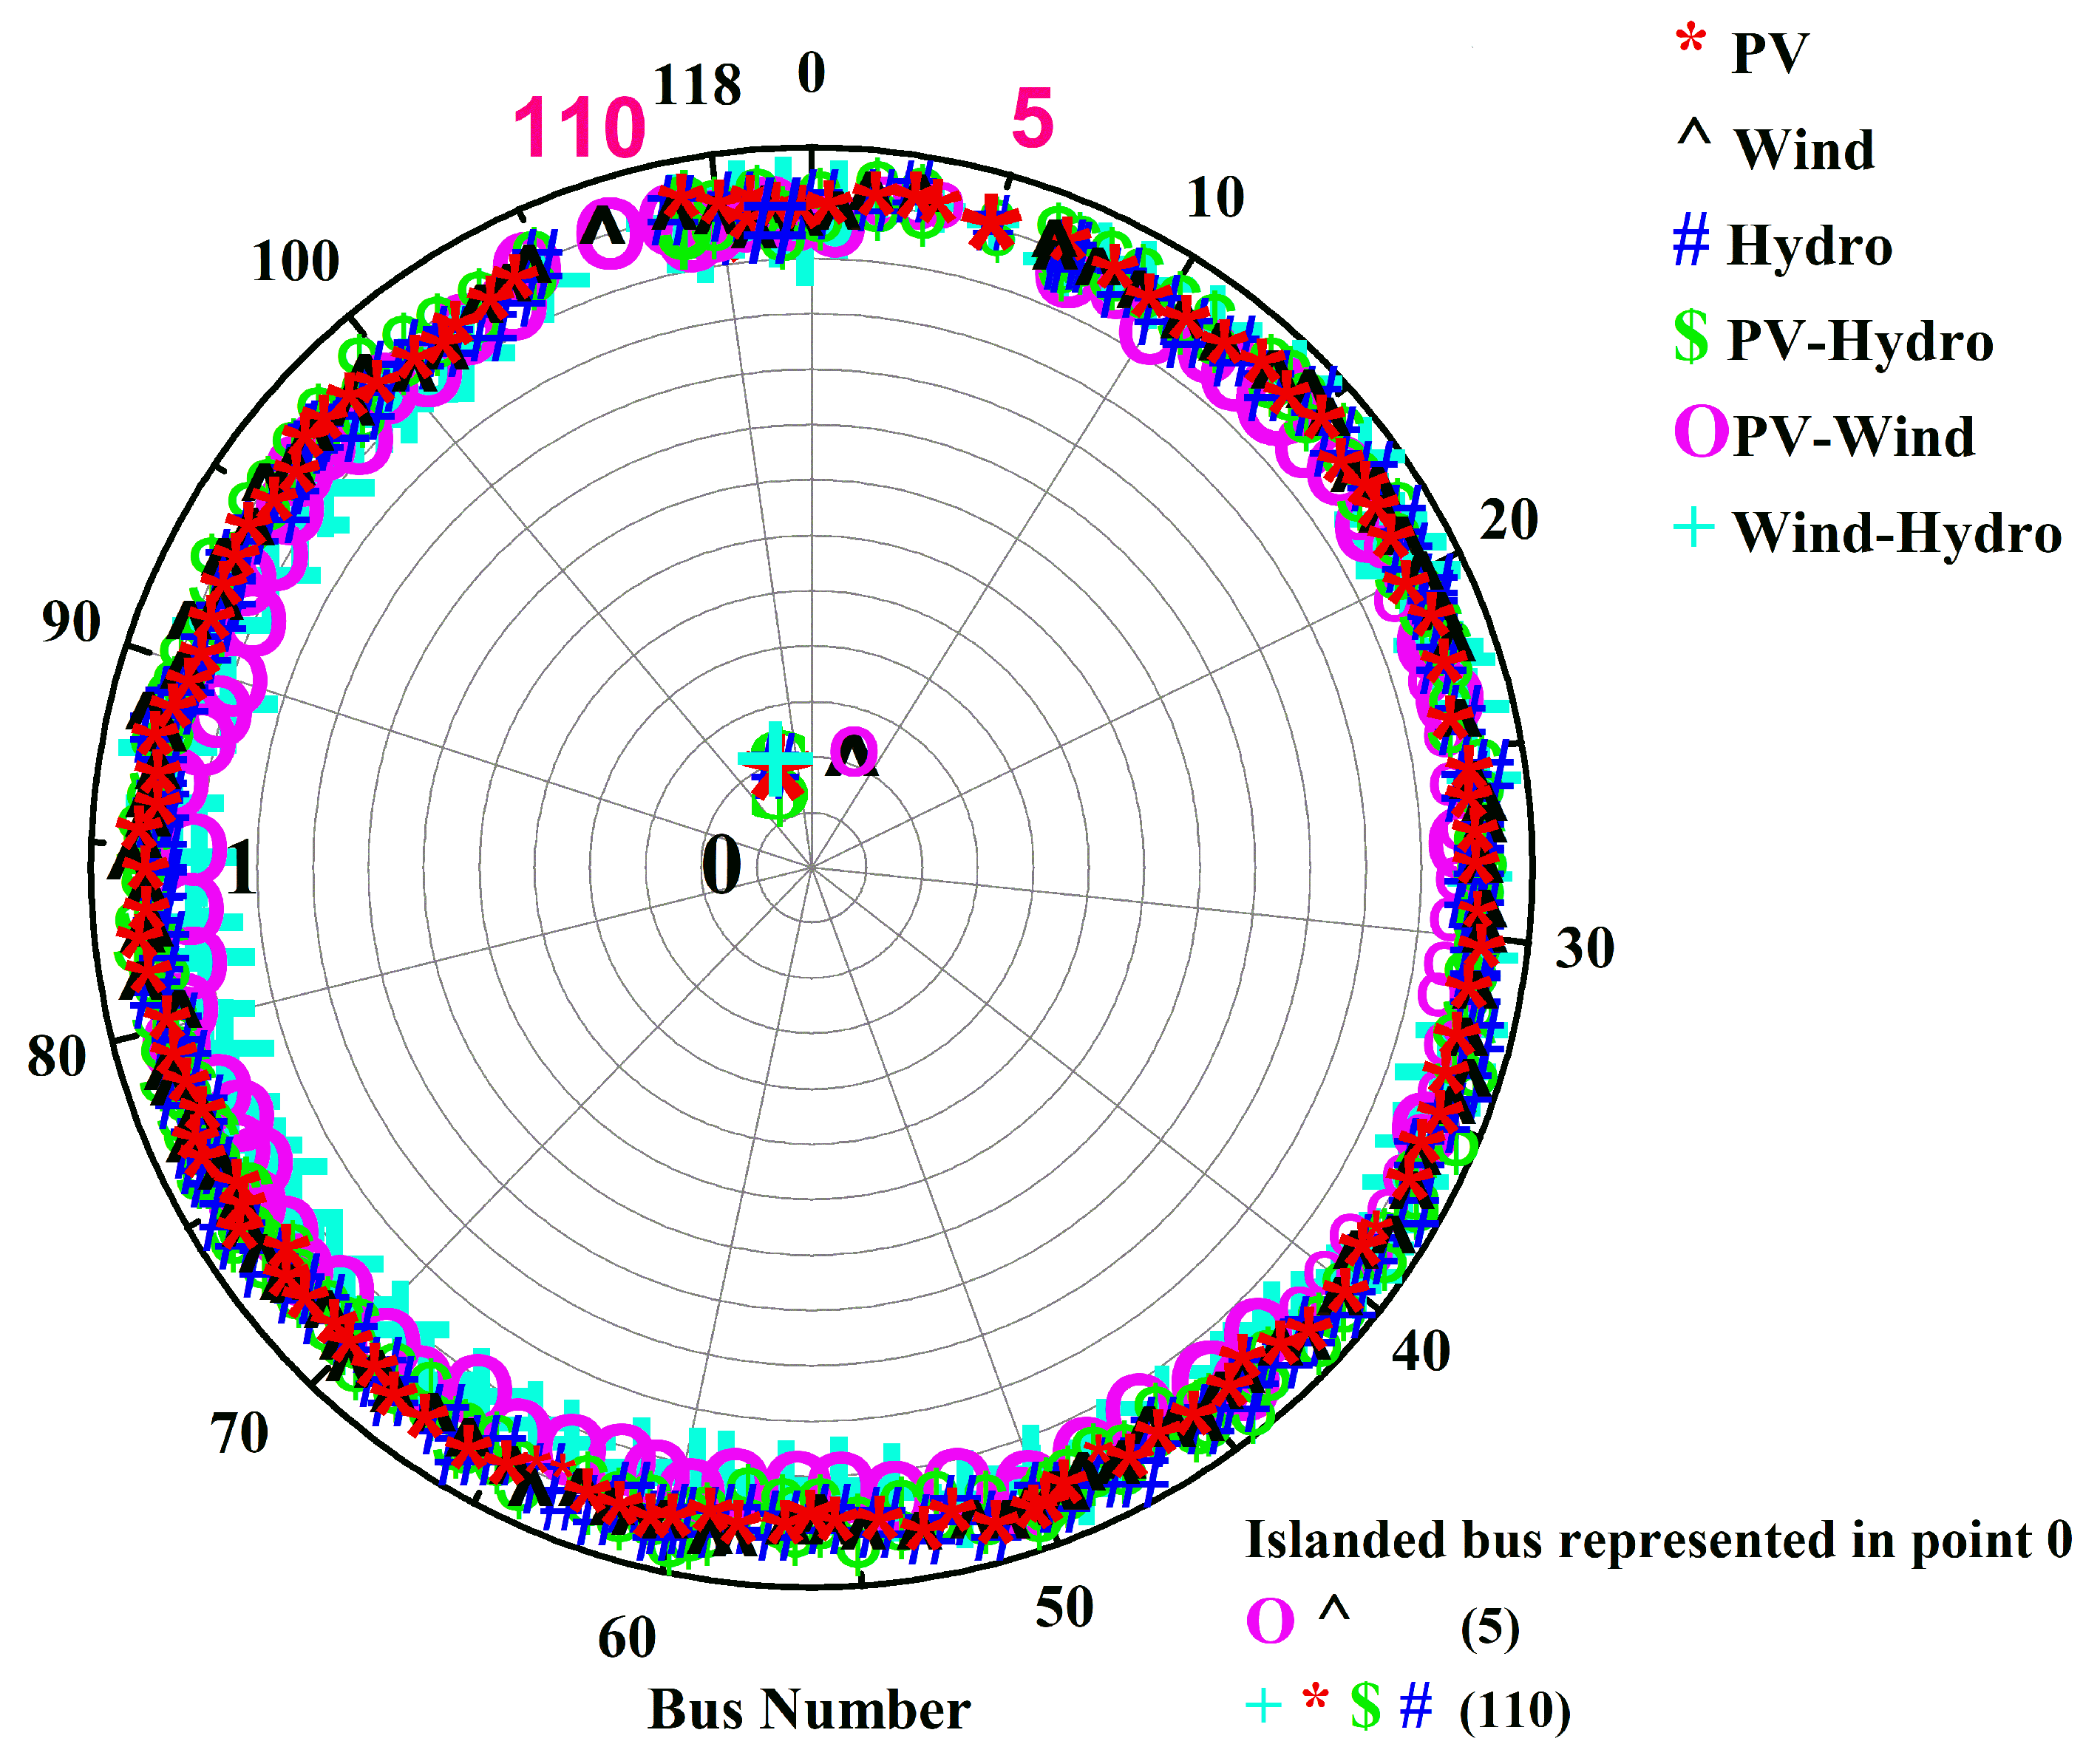
  • In the 118-bus system, the vulnerable bus identified was bus 110 because the value of K 1 (V-F index values) was greater than that of K 2 (threshold limits) for PV, hydro, PV–hydro, and wind–hydro. With the proposed V-F index method, the detection time for impending islanding was 10.60% faster than that of the voltage variation method and 23.94% faster than that of the frequency variation method in the presence of PV. The proposed method was 3.27% faster than the voltage variation method and 3.27% faster than the frequency variation method in the presence of hydro. The proposed method was 7% faster than the voltage variation method and 10.58% faster than the frequency variation method in the presence of PV–hydro. The proposed method was 72.67% faster than the voltage variation method and 6.2% faster than the frequency variation method in the presence of wind–hydro. Likewise, bus 5 was the vulnerable bus for wind and the PV–wind combination. With the proposed V-F index method, the detection time for impending islanding was 27.58% faster than that of the voltage variation method and 1.52% faster than that of the frequency variation method in the presence of wind. The proposed method was 7% faster than the voltage variation method and 30.76% faster than the frequency variation method in the presence of PV–wind. The generation was greater than the load for PV, wind, PV–hydro, and PV–wind. So, a battery was installed for power balance at the 110th bus for PV and the combination of PV–hydro, as well as at the fifth bus for wind and the combination of PV–wind. For hydro and the combination of wind–hydro, the generation was less than the load. So, a diesel generator was installed for power balance at the 110th bus for hydro and the combination of wind–hydro.

6. Conclusions

A modified method for the passive detection of islanding was proposed in this work, along with a prevention strategy that uses dispatchable and non-dispatchable DG units. Identification of islanded buses is performed by increasing the load in steps of 10% of the base load. The placement of a diesel generator or battery depends on the power balance in the identified island. The proposed islanding detection time is fast, and the number of islanded buses is less than that of the existing methods. The proposed method detects islanding for even smaller load variations than with the existing methods. The NDZs are reduced through the simultaneous measurement of voltage and frequency variations. The effectiveness of the proposed strategy was tested on IEEE 33-, 69-, and 118-bus systems.
In the 33-bus system, the generation was greater than the load for PV, hydro, and the PV–hydro and wind–hydro combinations. So, a battery was installed at the 24th bus. The generation was less than the load for wind and the PV–wind combination. So, a diesel generator was installed at the 14th bus. In the 69-bus system, the generation was greater than the load for PV, wind, hydro, and the wind–hydro combination. So, a battery was installed at the 61st bus. The generation was less than the load for the PV–hydro and PV–wind combinations. So, a diesel generator was installed at the 61st bus. In the 118-bus system, the generation was greater than the load for PV, wind, and the PV–hydro and PV–wind combinations. So, a battery was installed at the 110th bus for PV and the combination of PV–hydro and at the fifth bus for wind and the combination of PV–wind. The generation was less than the load for hydro and the combination of wind–hydro. So, a diesel generator was installed at the 110th bus for hydro and the combination of wind–hydro. In the future, various corrective methods can be implemented to reduce power imbalances. The main disadvantage is that passive methods of islanding detection require the inverter to be slightly out of time with the grid. This requires further research and investigation.

Author Contributions

Conceptualization, S.R.; Formal analysis, S.R.; Methodology, S.R.; Supervision, N.K. and N.P.; Writing—original draft, S.R.; Writing—review & editing, N.K. and N.P. All authors have read and agreed to the published version of the manuscript.

Funding

The authors have not received any funding for this work.

Institutional Review Board Statement

Not applicable.

Informed Consent Statement

Not applicable.

Data Availability Statement

Not applicable.

Conflicts of Interest

The authors have no conflict of interest to declare.

References

  1. Selim, A.; Kamel, S.; Mohamed, A.A.; Elattar, E.E. Optimal Allocation of Multiple Types of Distributed Generations in Radial Distribution Systems Using a Hybrid Technique. Sustainability 2021, 13, 6644. [Google Scholar] [CrossRef]
  2. Ji, X.; Zhang, X.; Zhang, Y.; Yin, Z.; Yang, M.; Han, X. Three-Phase Symmetric Distribution Network Fast Dynamic Reconfiguration Based on Timing-Constrained Hierarchical Clustering Algorithm. Symmetry 2021, 13, 1479. [Google Scholar] [CrossRef]
  3. Shahid, M.U.; Alquthami, T.; Siddique, A.; Munir, H.M.; Abbas, S.; Abbas, Z. RES Based Islanded DC Microgrid with Enhanced Electrical Network Islanding Detection. Energies 2021, 14, 8432. [Google Scholar] [CrossRef]
  4. Cebollero, J.A.; Cañete, D.; Martín-Arroyo, S.; García-Gracia, M.; Leite, H. A Survey of Islanding Detection Methods for Microgrids and Assessment of Non-Detection Zones in Comparison with Grid Codes. Energies 2022, 15, 460. [Google Scholar] [CrossRef]
  5. Abokhalil, A.G.; Awan, A.B.; Al-Qawasmi, A.R. Comparative Study of Passive and Active Islanding Detection Methods for PV Grid-Connected Systems. Sustainability 2018, 10, 1798. [Google Scholar] [CrossRef] [Green Version]
  6. Mohamed, A.A.; Kamel, S.; Selim, A.; Khurshaid, T.; Rhee, S.B. Developing a Hybrid Approach Based on Analytical and Metaheuristic Optimization Algorithms for the Optimization of Renewable DG Allocation Considering Various Types of Loads. Sustainability 2021, 13, 4447. [Google Scholar] [CrossRef]
  7. Lopez, J.R.; Ibarra, L.; Ponce, P.; Molina, A. A Decentralized Passive Islanding Detection Method Based on the Variations of Estimated Droop Characteristics. Energies 2021, 14, 7759. [Google Scholar] [CrossRef]
  8. Bukhari, S.B.A.; Mehmood, K.K.; Wadood, A.; Park, H. Intelligent Islanding Detection of Microgrids Using Long Short-Term Memory Networks. Energies 2021, 14, 5762. [Google Scholar] [CrossRef]
  9. Montoya, O.D.; Arias-Londoño, A.; Grisales-Noreña, L.F.; Barrios, J.Á.; Chamorro, H.R. Optimal Demand Reconfiguration in Three-Phase Distribution Grids Using an MI-Convex Model. Symmetry 2021, 13, 1124. [Google Scholar] [CrossRef]
  10. Bakhshi-Jafarabadi, R.; Sadeh, J.; Rakhshani, E.; Popov, M. High power quality maximum power point tracking-based islanding detection method for grid-connected photovoltaic systems. Int. J. Electr. Power Energy Syst. 2021, 131, 107103. [Google Scholar] [CrossRef]
  11. Hashemi, F.; Ghadimi, N.; Sobhani, B. Islanding detection for inverter-based DG coupled with using an adaptive neuro-fuzzy inference system. Int. J. Electr. Power Energy Syst. 2013, 45, 443–455. [Google Scholar] [CrossRef]
  12. Ray, P.K.; Mohanty, S.R.; Kishor, N. Disturbance detection in grid-connected distributed generation system using wavelet and S-transform. Electr. Power Syst. Res. 2011, 81, 805–819. [Google Scholar] [CrossRef]
  13. Abd-Elkader, A.G.; Saleh, S.M.; Eiteba, M.B.M. A passive islanding detection strategy for multi-distributed generations. Int. J. Electr. Power Energy Syst. 2018, 99, 146–155. [Google Scholar] [CrossRef]
  14. Liu, S.; Ji, F.; Li, Y.; Xiang, J. Islanding detection method based on system identification. IET Power Electron. 2016, 9, 2095–2102. [Google Scholar] [CrossRef]
  15. Ahmadzadeh-Shooshtari, B.; Hamedani Golshan, M.E.; Sadeghkhani, I. A combined method to efficiently adjust frequency-based anti-islanding relays of synchronous distributed generation. Int. Trans. Electr. Energy Syst. 2015, 25, 3042–3059. [Google Scholar] [CrossRef]
  16. Zamani, M.A.; Sidhu, T.S.; Yazdani, A. A Protection Strategy and Microprocessor-Based Relay for Low-Voltage Microgrids. IEEE Trans. Power Deliv. 2011, 26, 1873–1883. [Google Scholar] [CrossRef]
  17. Ustun, T.S.; Ozansoy, C.; Zayegh, A. Modeling of a Centralized Microgrid Protection System and Distributed Energy Resources According to IEC 61850-7-420. Power Syst. IEEE Trans. 2012, 27, 1560–1567. [Google Scholar] [CrossRef]
  18. Sebastián, R. Battery energy storage for increasing stability and reliability of an isolated Wind Diesel power system. IET Renew. Power Gener. 2017, 11, 296–303. [Google Scholar] [CrossRef]
  19. Abd-Elkader, A.G.; Saleh, S.M. Zero non-detection zone assessment for anti-islanding protection in rotating machines based distributed generation system. Int. J. Energy Res. 2021, 45, 521–540. [Google Scholar] [CrossRef]
  20. Jabari, F.; Sohrabi, F.; Pourghasem, P.; Mohammadi-Ivatloo, B. Backward-forward sweep based power flow algorithm in distribution systems. In Optimization of Power System Problems; Springer: Berlin/Heidelberg, Germany, 2020; pp. 365–382. [Google Scholar]
  21. Redfern, M.; Usta, O.; Fielding, G. Protection against loss of utility grid supply for a dispersed storage and generation unit. IEEE Trans. Power Deliv. 1993, 8, 948–954. [Google Scholar] [CrossRef]
  22. Freitas, W.; Xu, W.; Affonso, C.M.; Huang, Z. Comparative analysis between ROCOF and vector surge relays for distributed generation applications. IEEE Trans. Power Deliv. 2005, 20, 1315–1324. [Google Scholar] [CrossRef]
  23. IEA-PVPS. Evaluation of Islanding Detection Methods for Photovoltaic Utility-Interactive Power Systems; Report IEA PVPS T5-09; IEA-PVPS: Paris, France, 2002. [Google Scholar]
  24. Jang, S.I.; Kim, K.H. An islanding detection method for distributed generations using voltage unbalance and total harmonic distortion of current. IEEE Trans. Power Deliv. 2004, 19, 745–752. [Google Scholar] [CrossRef]
  25. De Mango, F.; Liserre, M.; Dell’Aquila, A. Overview of anti-islanding algorithms for pv systems. Part ii: Activemethods. In Proceedings of the 2006 12th International Power Electronics and Motion Control Conference, Portorož, Slovenia, 30 August–1 September 2006; pp. 1884–1889. [Google Scholar]
  26. Ramachandradurai, S.; Krishnan, N. Islanding-based reliability enhancement and power loss minimization by network reconfiguration using PSO with multiple DGs. Int. Trans. Electr. Energy Syst. 2021, 31, e12987. [Google Scholar] [CrossRef]
  27. Pottukkannan, B.; Suvarchala, K.; Muthukannan, P.; Thangaraj, Y. Optimal Allocation of Renewable Distributed Generation in Radial Distribution Network. J. Adv. Res. Dyn. Control Syst. 2018, 10, 11. [Google Scholar]
  28. Fang, X.; Li, F.; Wei, Y.; Azim, R.; Xu, Y. Reactive power planning under high penetration of wind energy using Benders decomposition. IET Gener. Transm. Distrib. 2015, 9, 1835–1844. [Google Scholar] [CrossRef]
  29. Sahu, B.K. A study on global solar PV energy developments and policies with special focus on the top ten solar PV power producing countries. Renew. Sustain. Energy Rev. 2015, 43, 621–634. [Google Scholar] [CrossRef]
  30. Toledo, O.M.; Oliveira Filho, D.; Diniz, A.S.A.C. Distributed photovoltaic generation and energy storage systems: A review. Renew. Sustain. Energy Rev. 2010, 14, 506–511. [Google Scholar] [CrossRef]
  31. Soroudi, A.; Aien, M.; Ehsan, M. A probabilistic modeling of photo voltaic modules and wind power generation impact on distribution networks. IEEE Syst. J. 2011, 6, 254–259. [Google Scholar] [CrossRef] [Green Version]
  32. Bhandari, B.; Poudel, S.R.; Lee, K.T.; Ahn, S.H. Mathematical modeling of hybrid renewable energy system: A review on small hydro-solar-wind power generation. Int. J. Precis. Eng. Manuf. Green Technol. 2014, 1, 157–173. [Google Scholar] [CrossRef]
  33. Narayanan, K.; Siddiqui, S.A.; Fozdar, M. Hybrid islanding detection method and priority-based load shedding for distribution networks in the presence of DG units. IET Gener. Transm. Distrib. 2017, 11, 586–595. [Google Scholar]
  34. Mathworks. MATLAB. 2019. Available online: https://ww2.mathworks.cn/en/products/new_products/release2019a.html (accessed on 1 March 2022).
  35. Prakash, D.B.; Lakshminarayana, C. Multiple DG placements in distribution system for power loss reduction using PSO Algorithm. Procedia Technol. 2016, 25, 785–792. [Google Scholar] [CrossRef] [Green Version]
  36. Jamil Mahfoud, R.; Sun, Y.; Faisal Alkayem, N.; Haes Alhelou, H.; Siano, P.; Shafie-khah, M. A novel combined evolutionary algorithm for optimal planning of distributed generators in radial distribution systems. Appl. Sci. 2019, 9, 3394. [Google Scholar] [CrossRef] [Green Version]
Figure 1. Flowchart for passive islanding detection.
Energies 15 03038 g001
Figure 2. The structure of the 33-bus system.
Energies 15 03038 g002
Figure 3. Voltage values of the 33-bus system.
Energies 15 03038 g003
Figure 4. Frequency values of the 33-bus system.
Energies 15 03038 g004
Figure 5. Detection of islanding.
Energies 15 03038 g005
Figure 6. The structure of the 69-bus system.
Energies 15 03038 g006
Figure 7. Voltage values of the 69-bus system.
Energies 15 03038 g007
Figure 8. Frequency values of the 69-bus system.
Energies 15 03038 g008
Figure 9. Detection of islanding.
Energies 15 03038 g009
Figure 10. The structure of the 118-bus system.
Energies 15 03038 g010
Figure 11. Voltage values of the 118-bus system.
Energies 15 03038 g011
Figure 12. Frequency values of the 118-bus system.
Energies 15 03038 g012
Figure 13. Detection of islanding.
Energies 15 03038 g013
Table 2. Ratings of the proposed method.
VariablesRatings (Bus System)
3369118
K 1 —V-F index and K 2 —threshold limits represented in Equation (21)0.09684 and 0.105040.09884 and 0.15040.099924 and 0.2432
X 1 and X 2 —The phase voltage related to the time, frequency, and voltage represented in Equations (13) and (14)1.5925 and 1.2261.7925 and 1.3261.6251 and 0.2432
P l o a d ( n b ) —The real power value of one bus with respect to the next bus used in Equation (19)7.2 kW8.7 kW9.3 kW
P a c t u a l l o a d ( n b ) —The actual load used in Equation (19)20 kW22 kW23 kW
N s a —The number of samples used in Equations (13) and (14)335333533353
V o p e ( n e w ) —The new operating voltage calculated using Equation (15)11.66 kV12.1 kV9.2 kV
V o p e —The system operating voltage used in Equation (19)0.995 kV0.998 kV0.996 kV
V b a —The base voltage used in Equations (15), (16), (19), and (21)12.66 kV12.66 kV11 kV
Δ f —The violated frequency represented in Equation (17)0.36 Hz0.38 Hz0.39 Hz
Δ V o —The change in voltage represented in Equation (16)1.226 kV1.226 kV1.120 kV
f d —The determined frequency represented in Equation (19)59.64 Hz59.65 Hz59.61 Hz
Table 3. Results of islanding detection and prevention for the 33-bus system.
Type of DGDG BusesNovel Passive Islanding DetectionIslanding Prevention at the Identified Bus
for the Proposed V-F Index Method
Voltage Variation [33]Frequency Variation [13]Proposed V-F Index
Method
Diesel Generator (kW)Battery (kW)
Islanded BusesDetection Time
[s]
Islanded BusesDetection Time
[s]
Islanded BusDetection Time
[s]
PV14, 24, 2924, 291.2914, 24, 291.95241.02-146.1
Wind14, 3014, 300.9914, 300.98140.75267.44-
Hydro13, 24, 3013, 300.8224, 300.65240.60-218.9
PV–Hydro13, 14, 24, 29, 3014, 24, 301.05413, 291.032240.75-560
PV–Wind14, 24, 29, 3014, 24, 300.6214, 300.88140.58267.44-
Wind–Hydro31, 14, 24, 3014, 24, 301.9814, 301.99240.75-218.9
Table 4. Reliability evaluation of the 33-bus system after reinforcement.
CasesVoltage
Variation
[33]
Frequency
Variation
[13]
Proposed
V-F Index
Method
ENSAENSSAIDISAIFIASAIENSAENSSAIDISAIFIASAIENSAENSSAIDISAIFIASAI
PV29,701.11671.100.373.951.9930,211.1669.020.393.661.7216,710.1357.110.250.271.51
Wind28,522.03662.120.343.721.8327,101.2621.010.353.521.6915,021.3351.150.210.241.45
Hydro26,210.01572.100.312.571.7926,101.2602.10.323.371.6313,101.6272.160.190.211.32
PV–Hydro24,311.11525.120.292.421.7124,001.7597.40.293.021.589347.02202.100.150.191.29
PV–Wind21,010.12511.030.252.251.4521,295.2531.80.252.921.527142.07189.020.120.131.21
Wind–Hydro17,821.51502.120.211.991.4115,150.5521.90.192.821.475215.01169.700.090.081.16
Table 5. Results of islanding detection and prevention for the 69-bus system.
Type of DGDG BusesNovel Passive
Islanding Detection
Islanding Prevention at the
Identified Bus for the Proposed
V-F Index Method
Voltage Variation
[33]
Frequency variation
[13]
Proposed V-F
Index Method
Diesel Generator (kW)Battery (kW)
Islanded
Buses
Detection
Time [s]
Islanded
Buses
Detection
Time [s]
Islanded
Bus
Detection
Time [s]
PV11, 18, 6111, 611.5618, 611.72611.35-526.4
Wind18, 6118, 611.9218, 611.92611.55-144.73
Hydro11, 21, 6121, 611.7511, 611.56610.62-631.2
PV–Hydro11, 18, 21, 6118, 610.9621, 610.75610.6554.4-
PV–Wind11, 18, 6111, 610.9211, 610.66610.5740.87-
Wind–Hydro11, 18, 21, 6118, 610.7521, 610.63610.57-218.9
Table 6. Reliability evaluation of the 69-bus system after reinforcement.
CasesVoltage Variation [33]Frequency Variation [13]Proposed V-F Index Method
ENSAENSSAIDISAIFIASAIENSAENSSAIDISAIFIASAIENSAENSSAIDISAIFIASAI
PV28,741.9597.360.353.421.7227,881.3599.50.273.351.8416,757.14249.640.200.161.35
Wind27,422.03594.330.323.391.7026,122.3596.30.253.291.7516,527.3225.970.150.131.32
Hydro26,122.13570.210.312.571.6824,325.1570.30.222.991.717002.11200.6770.120.111.27
PV–Hydro24,012.01555.010.292.461.6523,210.1477.20.202.951.676950.21179.5440.100.071.24
PV–Wind20,911.10549.010.252.321.5920,195.2460.20.172.751.624709.12168.4220.070.051.14
Wind–Hydro19,810.51519.230.211.971.5520,050.5435.20.152.321.453790.02150.0110.050.021.12
Table 7. Results of islanding detection and prevention for the 118-bus system.
Type of DGDG BusesNovel Passive
Islanding Detection
Islanding Prevention at the
Identified Bus for the Proposed
V-F Index Method
Voltage Variation
[33]
Frequency Variation
[13]
Proposed V-F
Index Method
Diesel Generator (kW)Battery (kW)
Islanded
Buses
Detection
Time [s]
Islanded
Buses
Detection
Time [s]
Islanded
Bus
Detection
Time [s]
PV20, 39, 47,
73, 80, 90, 110
47, 801.3980, 1101.591101.25-0.8078
Wind5, 82, 865, 82, 861.755, 861.3251.30-0.11
Hydro39, 47, 11039, 47, 1101.5539, 1101.551101.501.052-
PV–Hydro20, 80, 90, 11080, 1101.9280, 1101.991101.79-0.1767
PV–Wind5, 39, 44,
47, 82
5, 39, 820.595, 820.7550.55-0.01
Wind–Hydro74, 82, 86, 11086, 1101.9986, 1100.991100.931.4-
Table 8. Reliability evaluation of the 118-bus system after reinforcement.
CasesVoltage Variation [33]Frequency Variation [13]Proposed V-F Index Method
ENSAENSSAIDISAIFIASAIENSAENSSAIDISAIFIASAIENSAENSSAIDISAIFIASAI
PV30,541.03695.210.393.571.9728,881.3670.320.313.471.8919,957.14269.520.230.191.35
Wind29,422.03624.330.353.491.7027,122.3656.30.293.371.8517,527.3245.970.210.151.33
Hydro26,122.13590.210.322.271.6826,325.1590.30.263.311.808952.11230.6770.200.131.29
PV–Hydro25,312.01575.010.302.211.6525,210.1577.20.232.991.756545.21189.5440.170.101.25
PV–Wind20,911.10569.010.292.191.5921,195.2540.20.222.871.725950.12178.4220.120.071.19
Wind–Hydro17,810.51549.230.251.991.5520,150.5495.20.192.521.504990.02155.0110.090.041.11
Publisher’s Note: MDPI stays neutral with regard to jurisdictional claims in published maps and institutional affiliations.

