Article

Simulation about the Effect of the Height-to-Stroke Ratios of Ports on Power and Emissions in an OP2S Engine Using Diesel/Methanol Blends

1
School of Energy and Power Engineering, North University of China, University Road No.3, Taiyuan 030051, China
2
China North Engine Research Institute (Tianjin), Tianjin 300400, China
*
Author to whom correspondence should be addressed.
Energies 2022, 15(8), 2942; https://doi.org/10.3390/en15082942
Submission received: 13 March 2022 / Revised: 30 March 2022 / Accepted: 7 April 2022 / Published: 17 April 2022

Abstract

:
Zero carbon emissions will dominate the future of internal combustion engines (ICEs). Existing technology has pushed the performance of ICEs operating on traditional working principles to almost reach their limit. The new generation of ICEs needs to explore new efficient combustion modes. For new combustion modes to simplify the emission after treatment, the opposed-piston, two-stroke (OP2S) diesel engine is a powertrain with great potential value. Combined with dual-fuel technology, the OP2S diesel engine can effectively reduce carbon emissions to achieve clean combustion. Hence, methanol/diesel dual fuel was burnt in the OP2S engine to create a clean combustion mode for future demands. In the present work, a 1D simulation model of an OP2S diesel engine was established and verified. We investigated the influence of port height to stroke ratio (HSR) on power and emission performances of the OP2S diesel engine under different methanol ratios. The results show that the methanol ratio extremely influences the indicated power (IP) with the HSR of intake ports increasing. The IP decreases by about 1.8–2.0% for every 5% increase in methanol. Correspondingly, the methanol ratio extremely influences the indicated thermal efficiency (ITE), with the HSR of exhaust ports increasing. The ITE increases by about 2.1–3.1% for every 5% increase in methanol. The increasing methanol ratio reduces the HSR of ports for the optimal IP and ITE. To balance power performance and emission performance, the methanol ratio should be kept to 10–15%.

1. Introduction

The energy demand in worldwide transportation has been rising by leaps and bounds. Liquid fossil fuels still primarily drive internal combustion engines (ICEs) [1]. Worldwide vehicle ownership will double by 2040, increasing the demand for liquid fossil fuels that aggravate environmental pollution. This new challenge has prompted green powertrains to spring up. It will take quite a long time for these green powertrains to replace ICEs due to low energy density and safety [2].
The combustion mode directly determines the operating performance of conventional fuel engines. Various combustion methods such as reactivity-controlled compression ignition (RCCI) low-temperature combustion (LTC), homogeneous charge compression ignition (HCCI), etc., were designed and developed through multiple injections, exhaust turbocharging, valve life electronic control systems, and variable compression ratio. The physicochemical properties of hydrocarbon fuels will restrict the further improvement of thermal efficiency, which inevitably produces a large number of emissions [3]. New ideas must be developed based on fuel properties. The conventional hydrocarbon without oxygen needs to fully react with the oxygen in the air to achieve combustion. This reinforces the requirements for the amount of air and the degree of fuel and air mixing, generating more soot. In addition, burning hydrocarbon fuels also releases more carbon dioxide. This conflicts with the current international situation of environmental conservation. In 2015, 195 countries and EU parties reach an agreement to restrict global average temperature rise to below 2 °C, with carbon neutrality goals to be fully achieve by 2100. Carbon neutrality plans have gradually been developed and implemented [4].
It is a great prospect for ICEs to achieve carbon neutrality and zero emissions. ICEs are in urgent need of upgrading to meet the requirements of industrial development and environmental protection. Therefore, clean and renewable fuels such as natural gas, biodiesel, etc., are burnt with diesel to reduce emissions. This leads to the emergence of a dual-fuel combustion mode [5,6]. Dual fuel employs the properties of different fuels to flexibly design combustion modes, which can significantly promote efficiency and reduce emissions. Many investigations have focused on clean and renewable fuels again. Among them, methanol has attracted much attention due to its wide range of sources [7]. With methanol/diesel fuel blends increasing, the experiment results of Cenk Sayin showed brake-specific fuel consumption and NO raised, while brake thermal efficiency, CO, and total hydrocarbon were reduced [8]. Injection strategies are a key factor affecting the performance of methanol–diesel dual-fuel engines. A significant reduction in the 1D monoxide in hydrocarbon, carbon monoxide, nitric oxide, and soot emissions with good combustion stability could be achieved through proper quantity and timing of the postinjected diesel [9]. Through a high premixed ratio of methanol, a dual-fuel diesel engine can break the trade-off relationship between NOx and soot emissions [10]. Four combustion modes were investigated to obtain a more clean and high thermal efficient combustion mode for diesel/methanol dual-fuel engines [11]. In a word, the methanol/diesel dual fuel brings new life to traditional ICEs. However, dual-fuel technology is rarely used in opposed-piston two-stroke (OP2S) diesel engines.
The OP2S diesel engine is focused on because of its plain structure, high power density, and low heat transfer loss [12,13]. Compared with ICEs of the same volume, OP2S diesel engines’ inborn characteristics provide powerful operating and cost advantages, making them ideal for future demands for high-performance engines [14,15,16]. Hence, new technology helps overcome OP2S diesel engines’ defects for high efficiency and low emissions. In particular, OP2S diesel engines can diminish the emissions after-treatment system to achieve low NOx levels without increasing extra energy [17]. Combined with dual-fuel technology, the OP2S engines fueled with methanol/diesel blends may become an option for efficient and clean ICEs.
The simulation model of the OP2S diesel engine was established by using the equivalent method. The present work mainly analyzed indicated power, indicated thermal efficiency, NOx, and soot of the OP2S diesel engine under different methanol ratios to stimulate the wide application of OP2S diesel engines fueled with methanol/diesel blends.

2. Simulation Setup

2.1. Simulation Model

Without a dedicated OP2S simulation element in GT-POWER, a two-stroke diesel engine model is employed to simulate the operating process of an OP2S diesel engine based on an equivalent method. The equivalent model complies with these principles: (1) the main structural parameters of an equivalent model are the same as those of an OP2S model; (2) the variation of the working volume remains constant; (3) the piston movement and port timing remain unchanged. The specifications of the OP2S diesel engine are shown in Table 1. This simulation model included intake/exhaust environment modules, intake/exhaust pipe modules, intake/exhaust port modules, the cylinder module, the fuel injector module, and the crankcase module. The combustion model used the multipulse model. The heat transfer model applied the woschniGT model. The NOx emission model employed the NOx model. The soot model employed the Nagle and Strickland-Constable model.

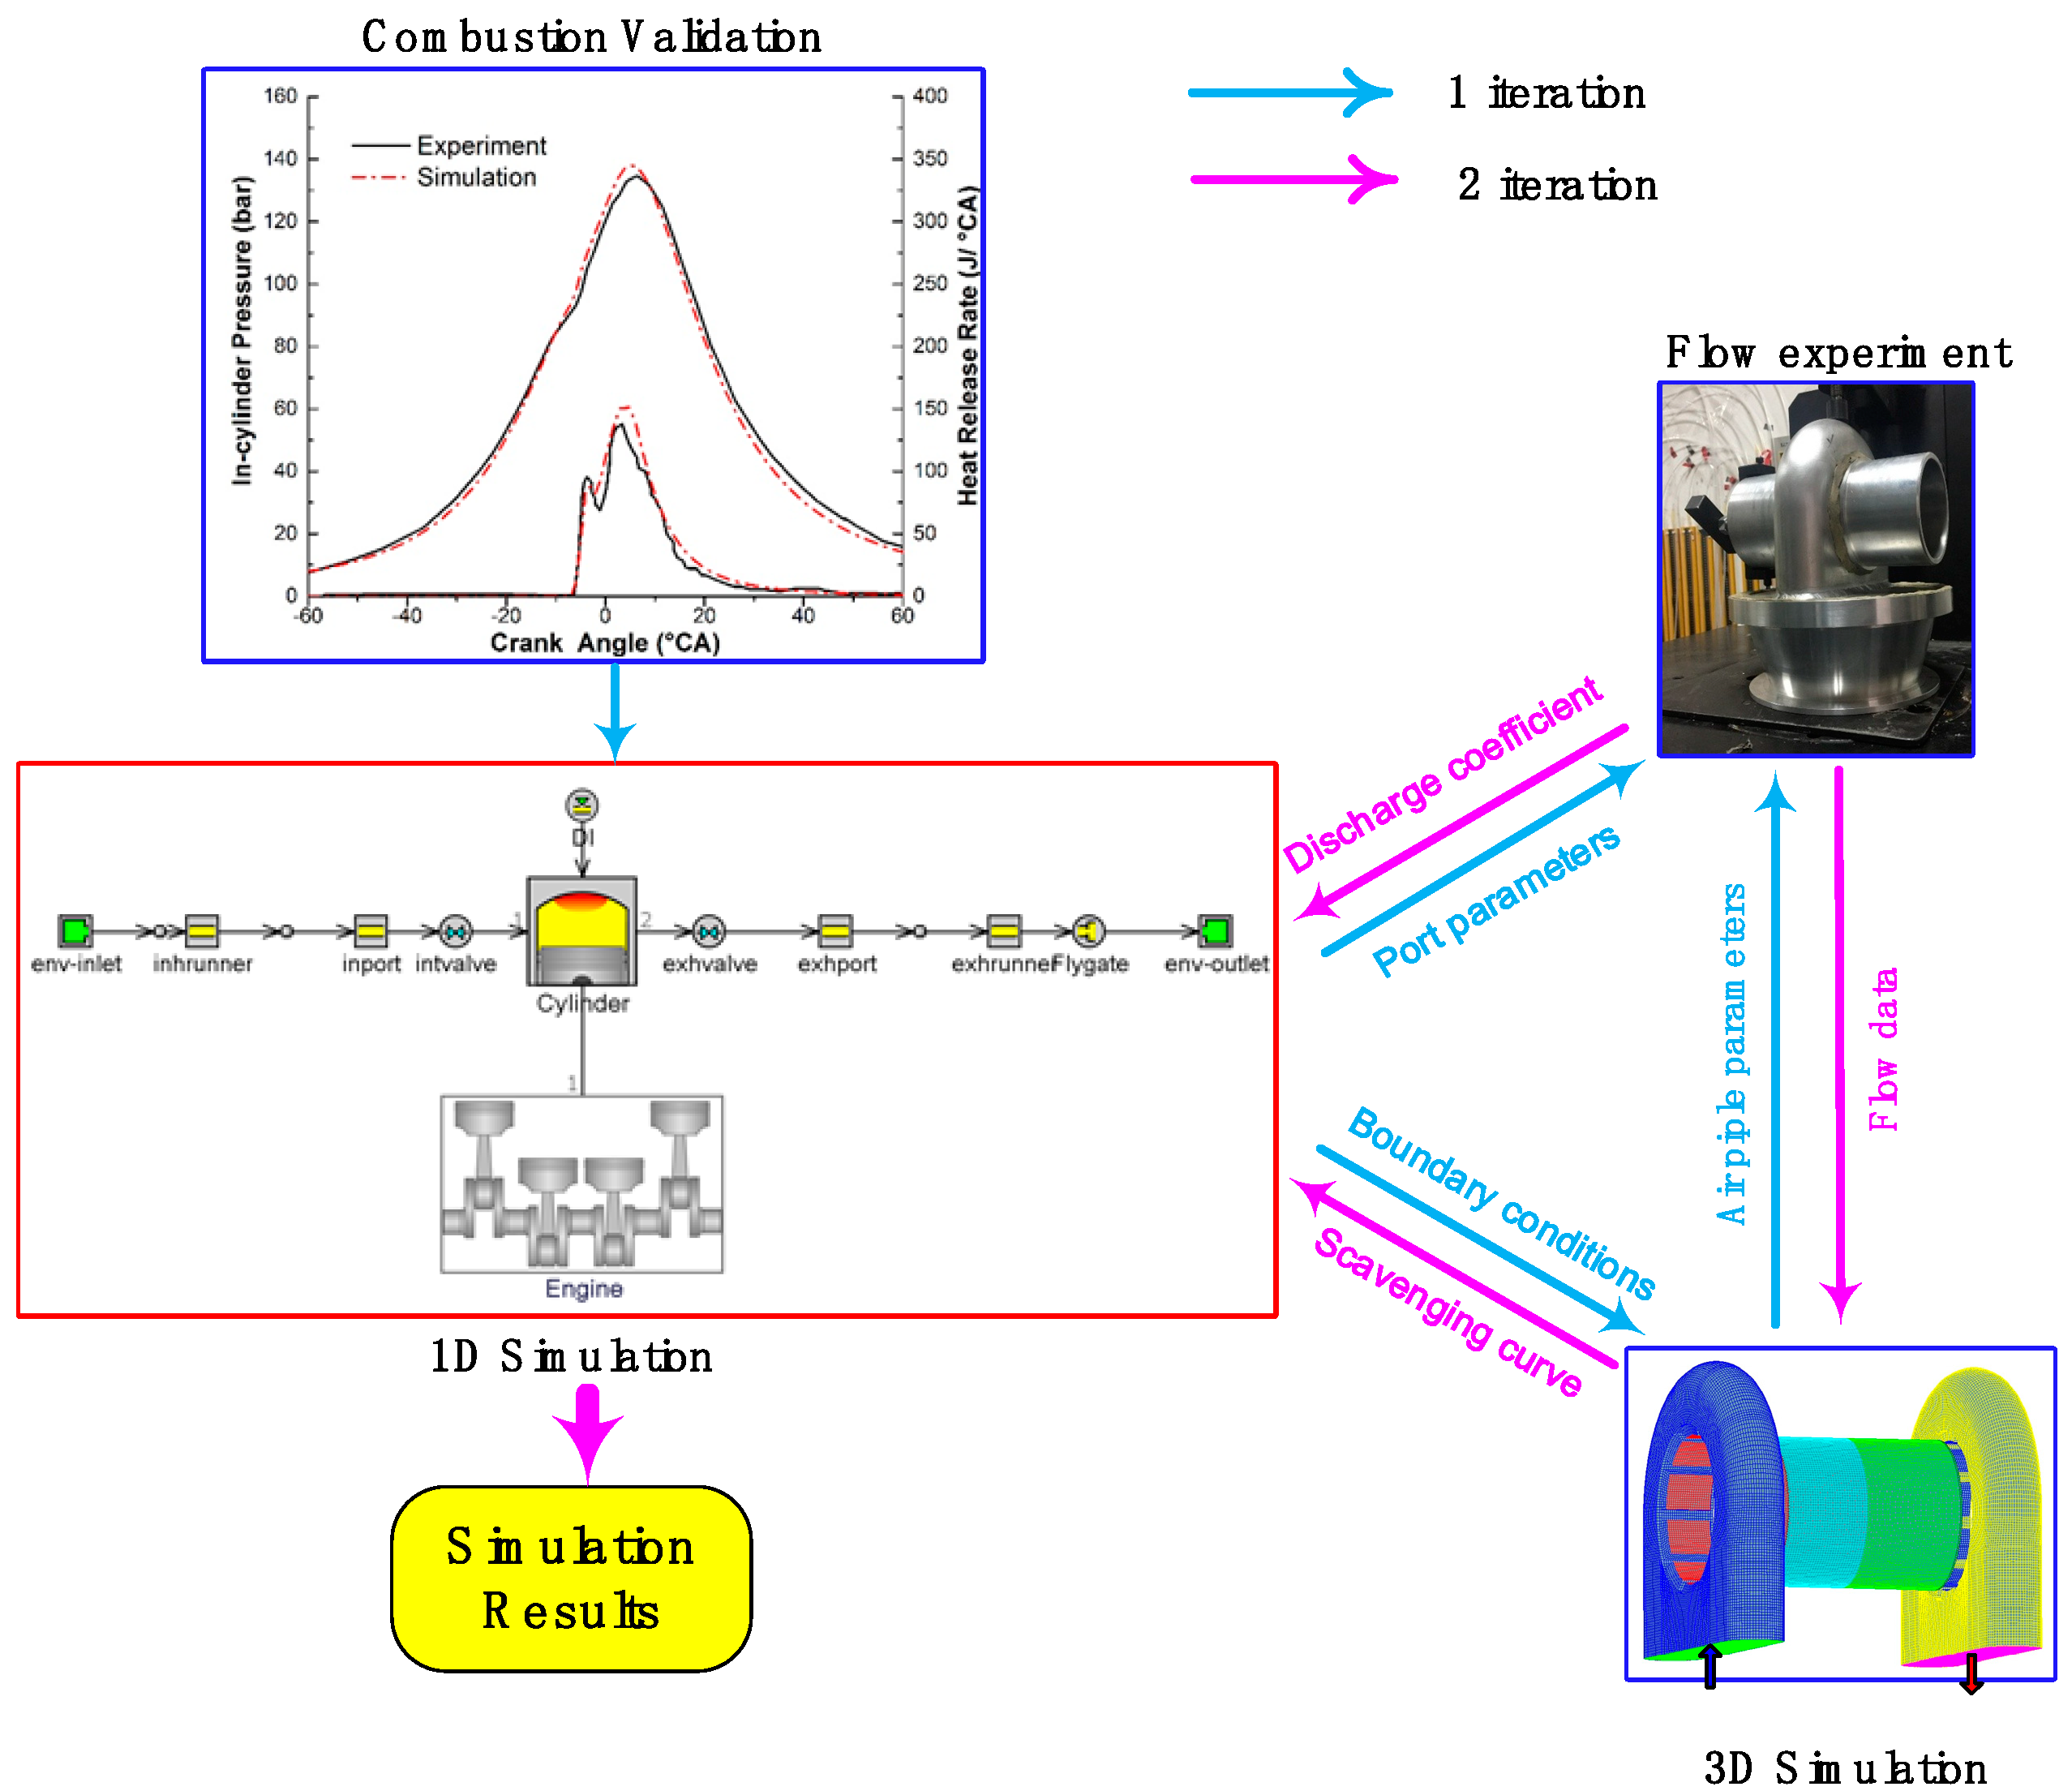
2.2. Simulation Validation

The 1D simulation model of the OP2S diesel engine is given in Figure 1. It involves scavenging and combustion processes. Firstly, the 1D simulation model was validated according to experimental data. The relative error is controlled within 10% and the simulation model can be used for subsequent simulation analysis. Through combining the 1D simulation and the flow experiment, we acquired the discharge coefficient. In addition, the scavenging curves were obtained through the 1D/3D simulations. Secondly, the discharge coefficient and scavenging curves were, respectively, substituted into the 1D simulation model for the first iteration to acquire the final iteration model. A detailed description is seen in Ref. [18].

2.3. Simulation Method

Figure 2 is a schematic of the port structure parameters for the OP2S diesel engine. This work studied the rectangular port. The rectangular port included port height (height-to-stroke ratio) and port width (width-to-circumference ratio) parameters. The width-to-circumference ratio (WCR) of ports only affects the port area, so the WCR was kept at 0.75 for all cases. This present work mainly concentrated on the height-to-stroke ratio (HSR). In Section 3.1, the height-to-stroke ratio (HSR) of the exhaust port remains at 0.18. In Section 3.2, the HSR of the intake port remains at 0.056. In Section 3.3, the HSR of intake ports includes 12 points, and the HSR of intake ports includes 11 points, as shown in Table 2. The total condition point was 12 × 11. This work investigated pure diesel and diesel with different methanol ratios as given in Table 3. The fuel properties used in this study are presented in Table 4.

3. Results and Discussion

3.1. The Influence of Intake Port

Figure 3 illustrates the indicated power (IP) under different HSRs of intake ports. With the HSR of the intake port increasing, the IP first rises and then reduces. Before the HSR of the intake port increases to 0.056, the IP rises linearly. The small intake port height produces the small inlet airflow. The air entering the cylinder can be rapidly mixed with the fuel, promoting combustion. When the HSR of the intake port increases from 0.056 to 0.13, the IP increases slowly. The large intake port height causes adequate air to enter the cylinder, the fuel and air mixing dominates the combustion performance instead of the intake air. After the HSR of the intake port exceeds 0.13, the IP decreases slowly. The increase in intake port height causes a long intake time, part of the charge flows into the intake manifold. Before the HSR of the intake port reaches 0.056, the increase in methanol ratio does not affect the IP. After the HSR of the intake port exceeds 0.056, the increase in methanol ratio uniformly reduces IP under different methanol ratios. The IP decreases by about 1.8–2.0% for every 5% increase in methanol. Moreover, the HSR of the intake port remains at 0.13 at the maximum IP for different methanol ratios.
Figure 4 shows the indicated thermal efficiency (ITE) under different HSRs of intake ports. With the HSR of the intake port increasing, the ITE first rises and then diminishes. This is consistent with the results of Reference [19]. Before the HSR of the intake port increases to 0.056, the ITE rises linearly. Smaller port height results in larger intake air losses and less intake air, worsening combustion. After the HSR of the intake port exceeds 0.056, it shows a little change for the ITE. The larger port height can reduce intake air loss, providing sufficient air to burn. At this time, the ITE is determined by the mixing and combustion method of OP2S diesel engines. After the HSR of the intake port exceeds 0.13, the ITE decreases slowly. The increase in intake port height causes a long intake time. Part of the charge flows into the intake manifold, losing thermal efficiency. The growing methanol ratio uniformly increases the ITE under different methanol ratios. The ITE is increased by about 7.8–8.3% for every 5% increase in methanol. This is because methanol contains oxygen, which helps to promote combustion. Additionally, the HSR of the intake port remains at 0.13 at the maximum ITE for different methanol ratios.
Figure 5 indicates the NOx under different HSRs of intake ports. With the HSR of the intake port increasing, the NOx first rises and then decreases. Before the HSR of the intake port increases to 0.08, the increase in methanol ratio uniformly raises the NOx for different methanol ratios. The smaller HSR of the intake port limits the intake air, which mainly determines the combustion performance. The oxygen contained in methanol helps to enhance the full combustion of fuel. After the HSR of the intake port exceeds 0.1, the increase in methanol ratio decreases the NOx for different methanol ratios. The larger port height provides enough air to burn. The calorific value of the fuel determines the combustion performance. For the same intake port height, the larger methanol ratio indicates the lower energy in the fuel, resulting in lower incylinder temperature and fewer NOx emissions.
Figure 6 indicates the soot concentration under different HSRs of intake ports. Before the HSR of the intake port increases to 0.04, the soot concentration increases because of less air intake. The small port height results in the small intake of air, producing a high fuel equivalence. After the HSR of the intake port exceeds 0.04, the soot concentration decreases dramatically. The increase in the intake port height causes a large amount of air intake, promoting soot oxidation. After the HSR of the intake port increases to 0.09, the soot concentration keeps constant. This is because sufficient air in the cylinder fully oxidizes the soot. When the HSR of the intake port is 0.04–0.09, the increase in methanol ratio leads to a gradual decrease in soot concentration. The oxygen contained in methanol helps to oxidize the soot.

3.2. The Influence of Exhaust Port

Figure 7 indicates the IP under different HSRs of exhaust ports. With the HSR of the exhaust port increasing, the IP first rises and then diminishes. Before the HSR of the exhaust port increases to 0.08, the IP increases linearly. The increase in the exhaust port height facilitates the overflow of residual gases in the cylinder, intensifying combustion. After the HSR of the exhaust port exceeds 0.08, the IP reduces slowly. The increase in the exhaust port height prolongs the exhausting time. The exhaust gas takes away a fresher charge, delaying combustion. The IP rises slightly with increasing methanol ratio. The oxygen in methanol strengthens combustion, but the low heat value of methanol confines the continuous improvement of IP. Bin addition, the maximum IP under different methanol ratios appeared at 0.11.
Figure 8 illustrates the ITE under different HSRs of exhaust ports. With the HSR of the exhaust port increasing, the ITE gradually rises. Before the HSR of the exhaust port increases to 0.08, the ITE increases linearly. Since the small exhaust port height leads to more residual gas in the cylinder, the residual gas hinders the entry of air, deteriorating combustion. When the HSR of the exhaust port increases from 0.08 to 0.1, the ITE rises slowly. After the HSR of the exhaust port exceeds 0.1, the ITE decreases slowly. This is consistent with the results of Reference [19]. The increase in the methanol ratio raises the indicated ITE. This accounts for the combustion promotion effect of the oxygen in methanol. The ITE increases by about 2.1–3.1% for every 5% increase in methanol.
Figure 9 shows the NOx under different HSRs of exhaust ports. With the HSR of the exhaust port increasing, the NOx emissions rise first and then decrease. Before the HSR of the intake port reaches 0.08, the NOx keeps a low level. This is because the small exhaust port height causes a lot of residual gas to stay in the cylinder, deteriorating the scavenging process. Fuel does not burn sufficiently, producing a low temperature. When the HSR of the exhaust port is increased to 0.11, the NOx emission reaches a peak. When the HSR of the exhaust port increases from 0.11 to 0.13. The NOx emissions reduce. This is because a larger exhaust port height raises the overflow of fresh charge into the exhaust manifold, lowering the combustion temperature. The increase in methanol ratio uniformly raises the NOx under the HSRs of the exhaust ports. The NOx increases by about 22–52% for every 5% increase in methanol. This is because oxygen in methanol promotes combustion, increasing the incylinder temperature.
Figure 10 illustrates the soot concentration under different HSRs of exhaust ports. Before the HSR of the exhaust port reaches 0.08, the soot concentration rises, resulting from a poor scavenging process. The smaller exhaust port height hinders the removal of exhaust gases, deteriorating combustion. After the HSR of the exhaust port exceeds 0.08, the soot concentration decreases. The larger exhaust port height improves the scavenging process, enhancing combustion. When the HSR of the exhaust port increases from 0.08 to 0.13, the increase in methanol ratio decreases the soot concentration with the exhaust port height increasing. This is because the oxygen in methanol promotes soot oxidation.

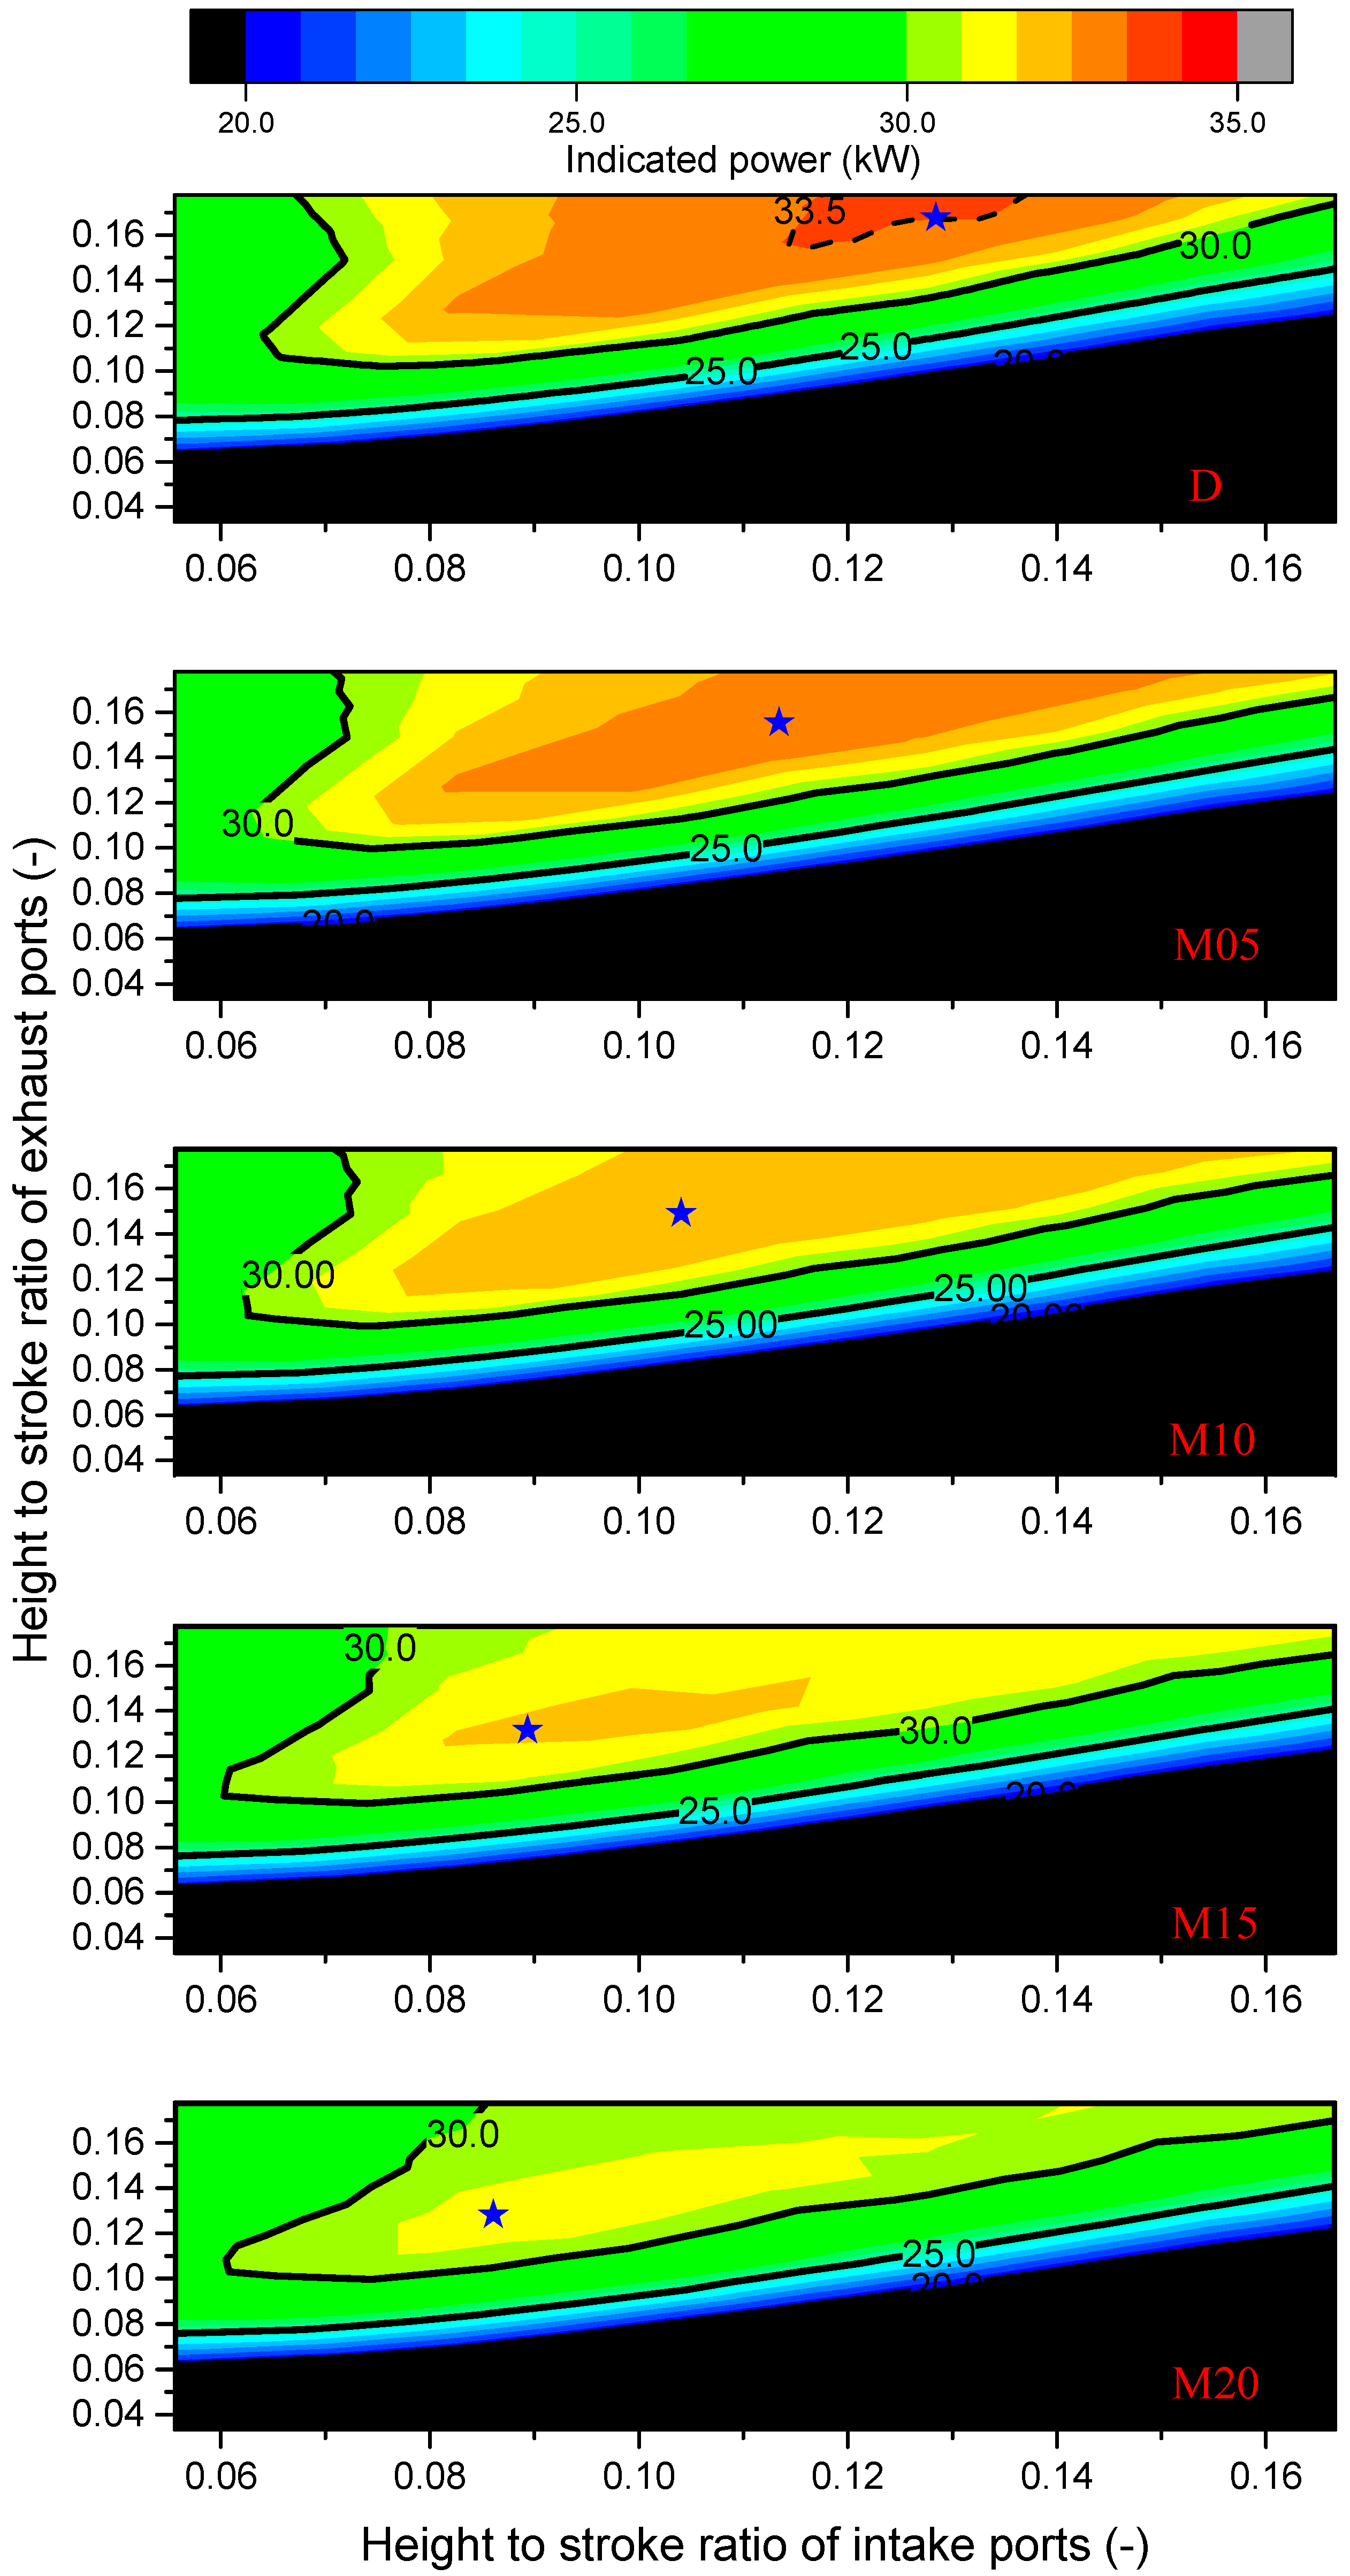
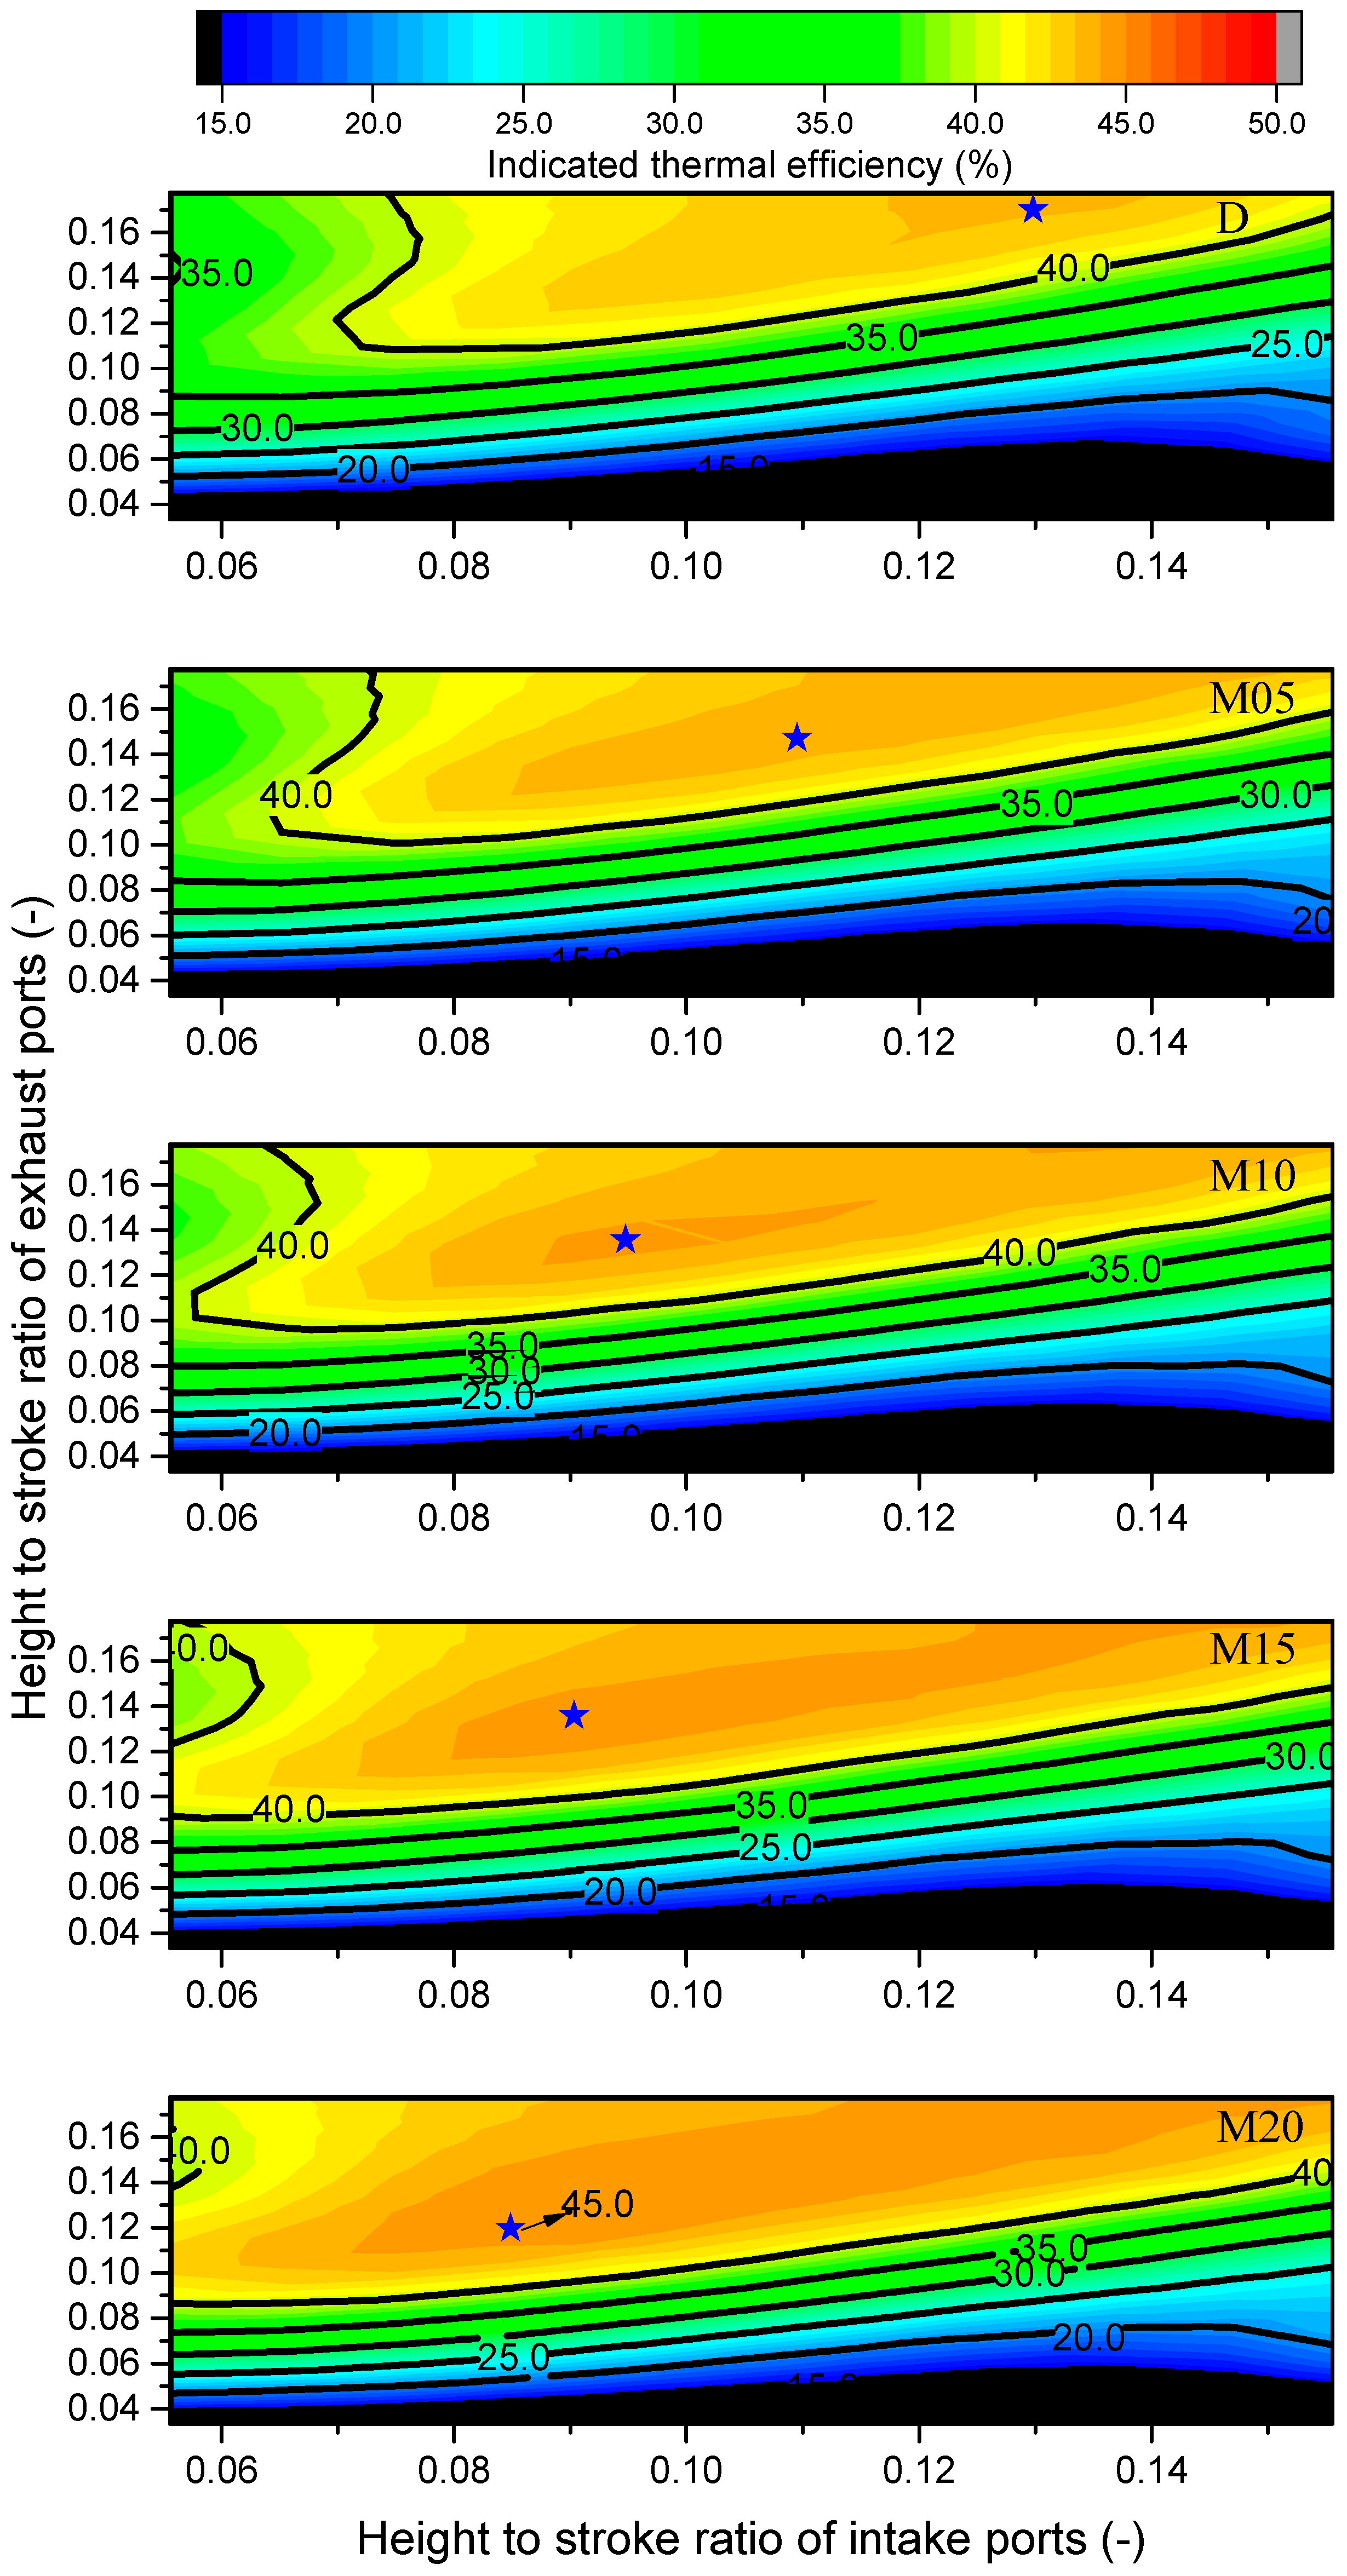
3.3. The Interaction of Intake and Exhaust Ports

Figure 11 illustrates the IP under the interaction of the intake and exhaust ports. For the fixed exhaust/intake port height, there is a maximum value for IP with intake/exhaust port heights increasing. The smaller port height confines gas entry from the intake manifold and escapes from the cylinder. However, the larger port height decreases the effective compression ratio. The optimal IP (the blue star) appears with the HSR of the intake port of 0.13 and the HSR of the exhaust port of 0.17. The HSR of ports for the optimal IP is reduced by the increasing methanol ratio. The area with an IP greater than 33.5 kW only appears in the condition of D. When the area with an IP greater than 30 kW remains unchanged, and the methanol ratio is below 15%. When the area with an IP greater than 30 kW decrease dramatically, the methanol ratio exceeds 15%. This means that the methanol in diesel weakens the power performance of the OP2S diesel engine. Its power performance is still maintained at a high level with the methanol ratio being below 15%.
Figure 12 illustrates the ITE under the interaction of the intake and exhaust ports. For the fixed exhaust/intake port height, there is a maximum value for ITE with intake/exhaust port heights increasing. The reason for these results of ITE is similar to the results of IP. The optimal ITE (the blue star) appears with the HSR of the intake port of 0.13 and the HSR of the exhaust port of 0.17. The HSR of ports for the optimal ITE is reduced by the increasing methanol ratio. The area with an IP greater than 45 kW only appears in the condition of M20. With the methanol ratio increasing, the area with an ITE greater than 40% rises. This means that the diesel mixed with methanol helps improve the fuel economy of OP2S diesel engines.
Figure 13 illustrates the NOx under the interaction of the intake and exhaust ports. When the HSR of the intake and exhaust ports are both large, NOx is the largest. With the methanol ratio increasing, the area with higher NOx reduces. The area with NOx greater than 490 ppm only appears in the condition of D. This means that the diesel mixed with methanol helps reduce NOx emissions. This is consistent with the results of Reference [20]. When the methanol ratio is below 10%, the area with NOx greater than 400 ppm gradually rises. After the methanol ratio exceeds 15%, the area with NOx greater than 400 ppm reduces significantly. That means the methanol ratio should be kept above 10% to reduce NOx emissions.
Figure 14 shows the soot concentration under the interaction of the intake and exhaust ports. When the HSR of the intake and exhaust ports are both large, the soot concentration is the least. With the methanol ratio increasing, the area with higher soot concentration reduces. The area with a soot concentration greater than 450 g/m3 only appears in the condition of D. This means that the diesel mixed with methanol helps reduce soot emissions. This is consistent with the results of Reference [20]. When the methanol blending ratio is below 10%, the area with a soot concentration of fewer than 0 g/m3 gradually increases. After the methanol blending ratio exceeds 15%, the area with a soot concentration of fewer than 0 g/m3 keeps constant. That means the methanol ratio should be kept at 10–15% to reduce soot emissions to balance low soot emissions and good power performance.

4. Conclusions

(1)
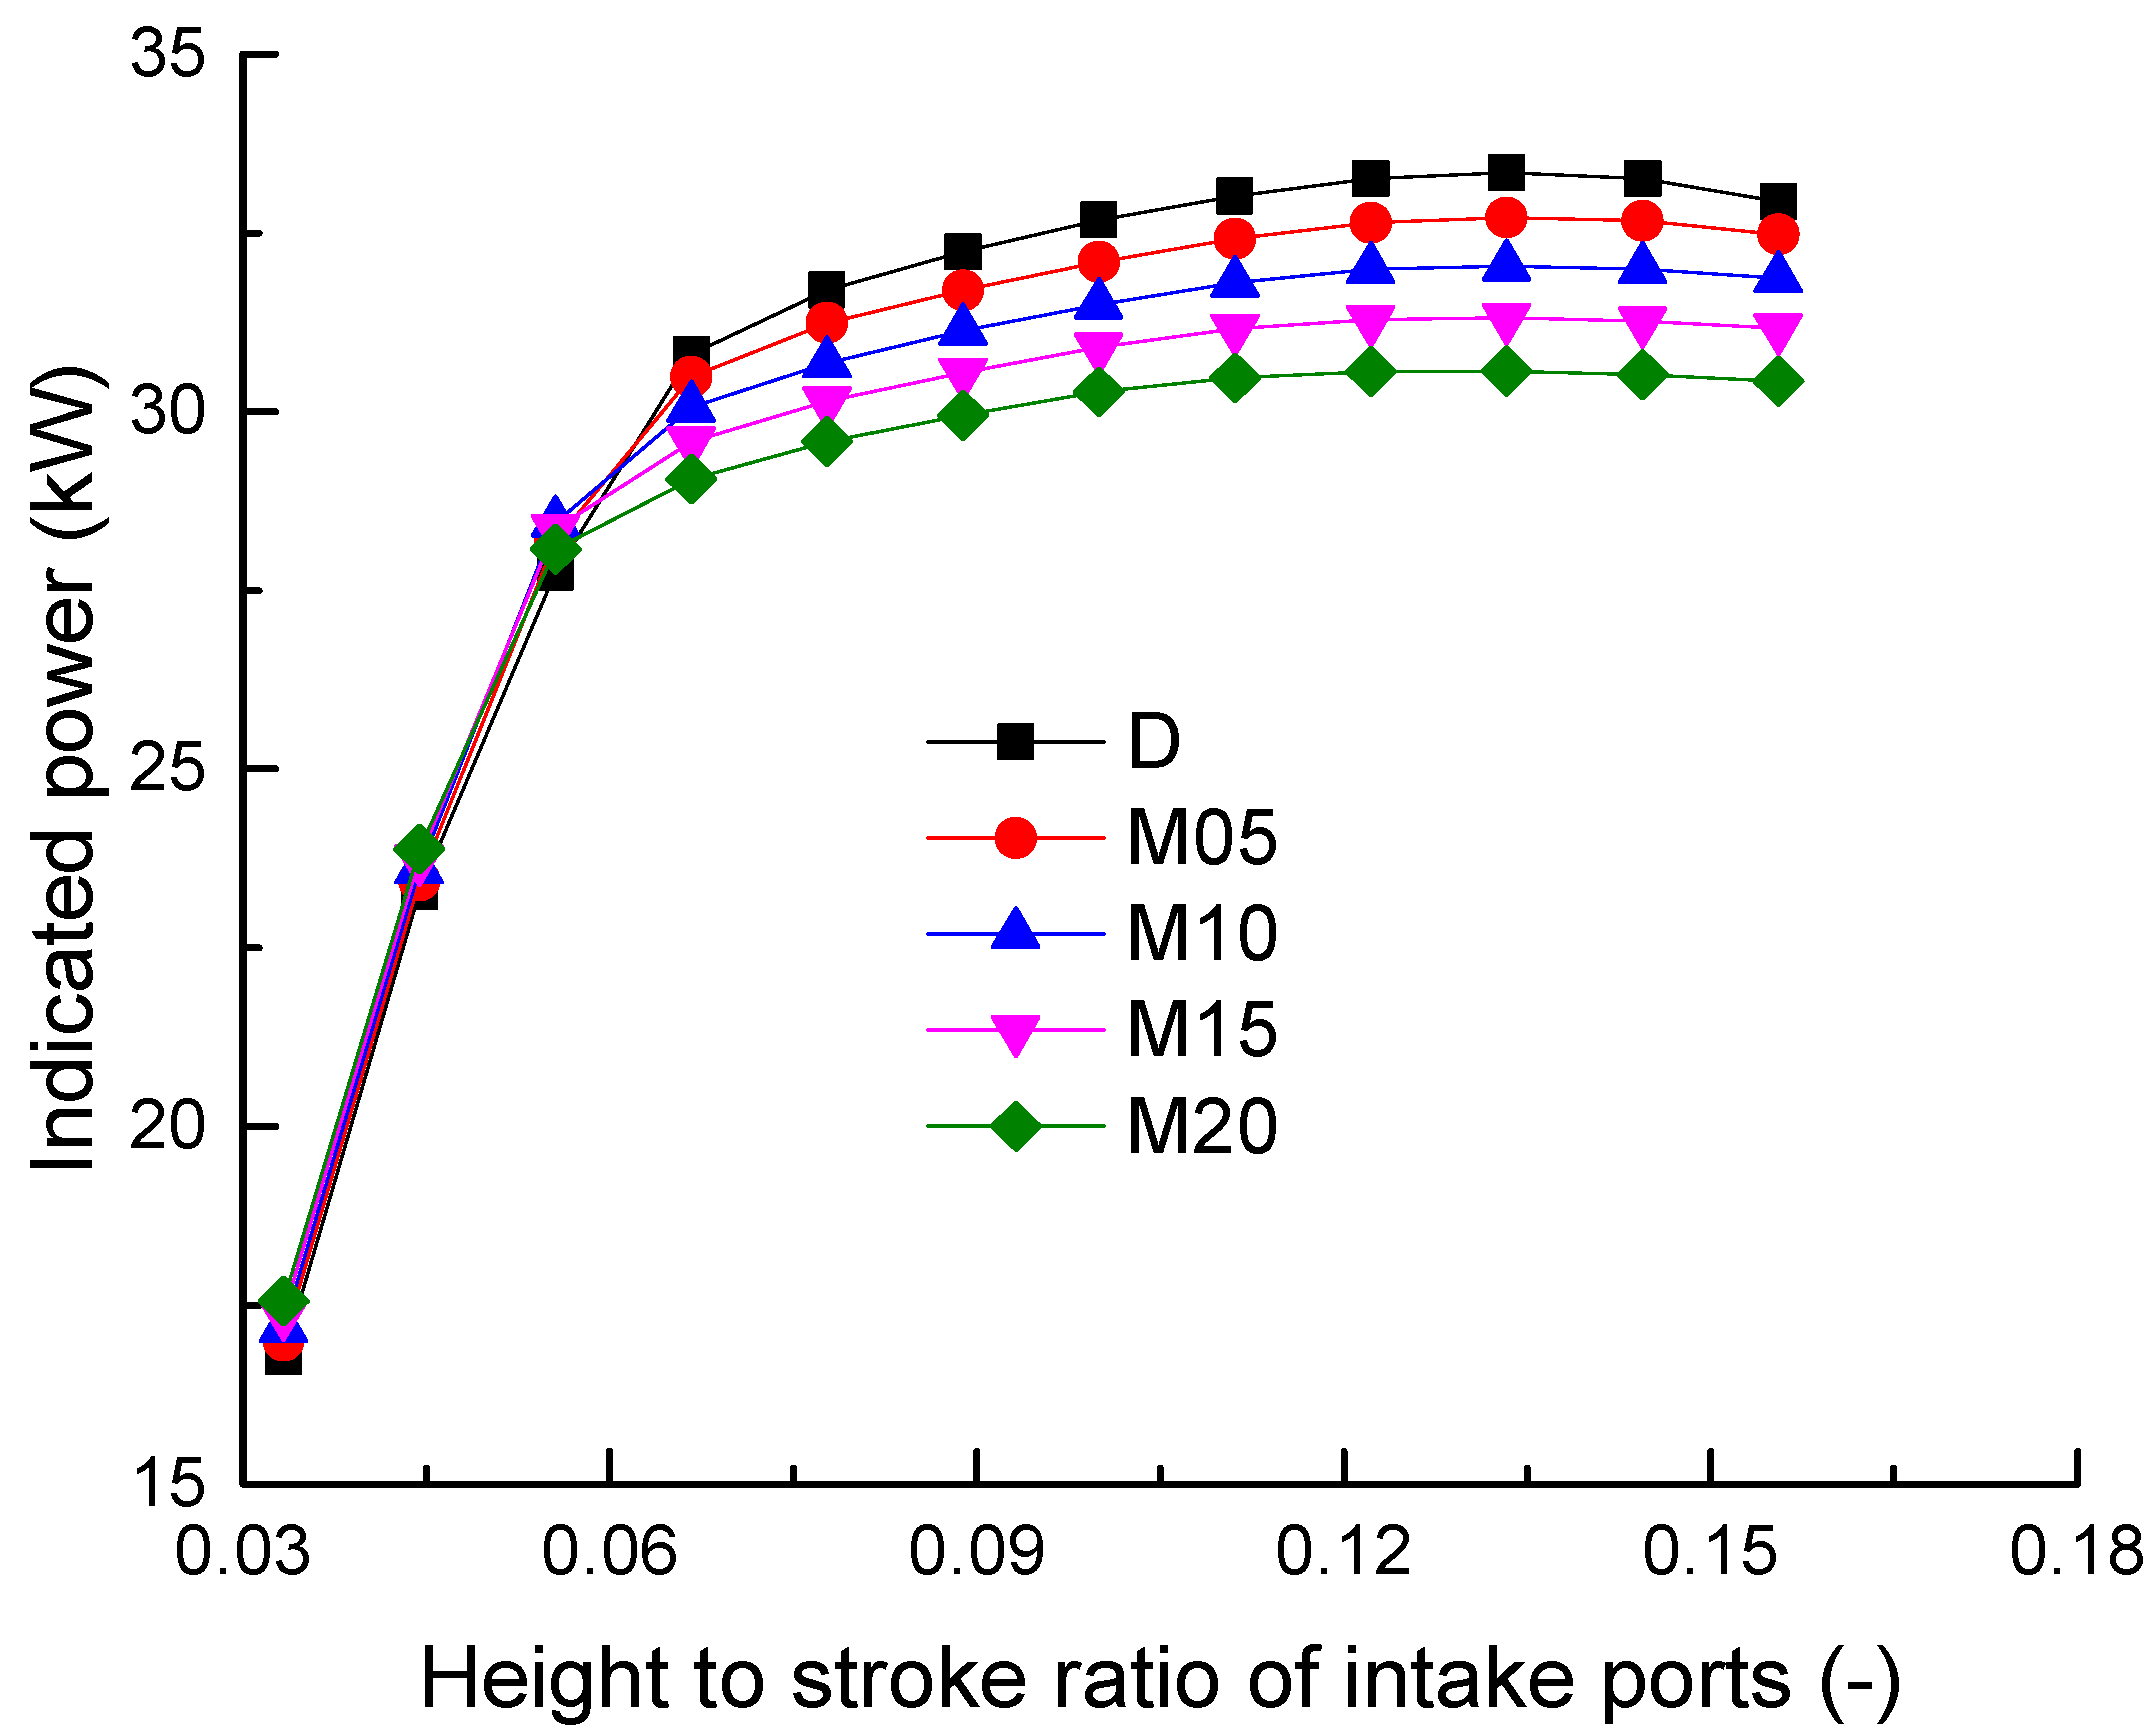
By increasing the intake air, the larger intake port height promotes complete combustion of fuel, enhancing the influence of the methanol blending ratio on the indicated power. By reducing the residual gas, the larger exhaust port height promotes no significant drop in IP with increasing methanol ratio, enhancing the influence of the methanol blending ratio on the ITE.
(2)
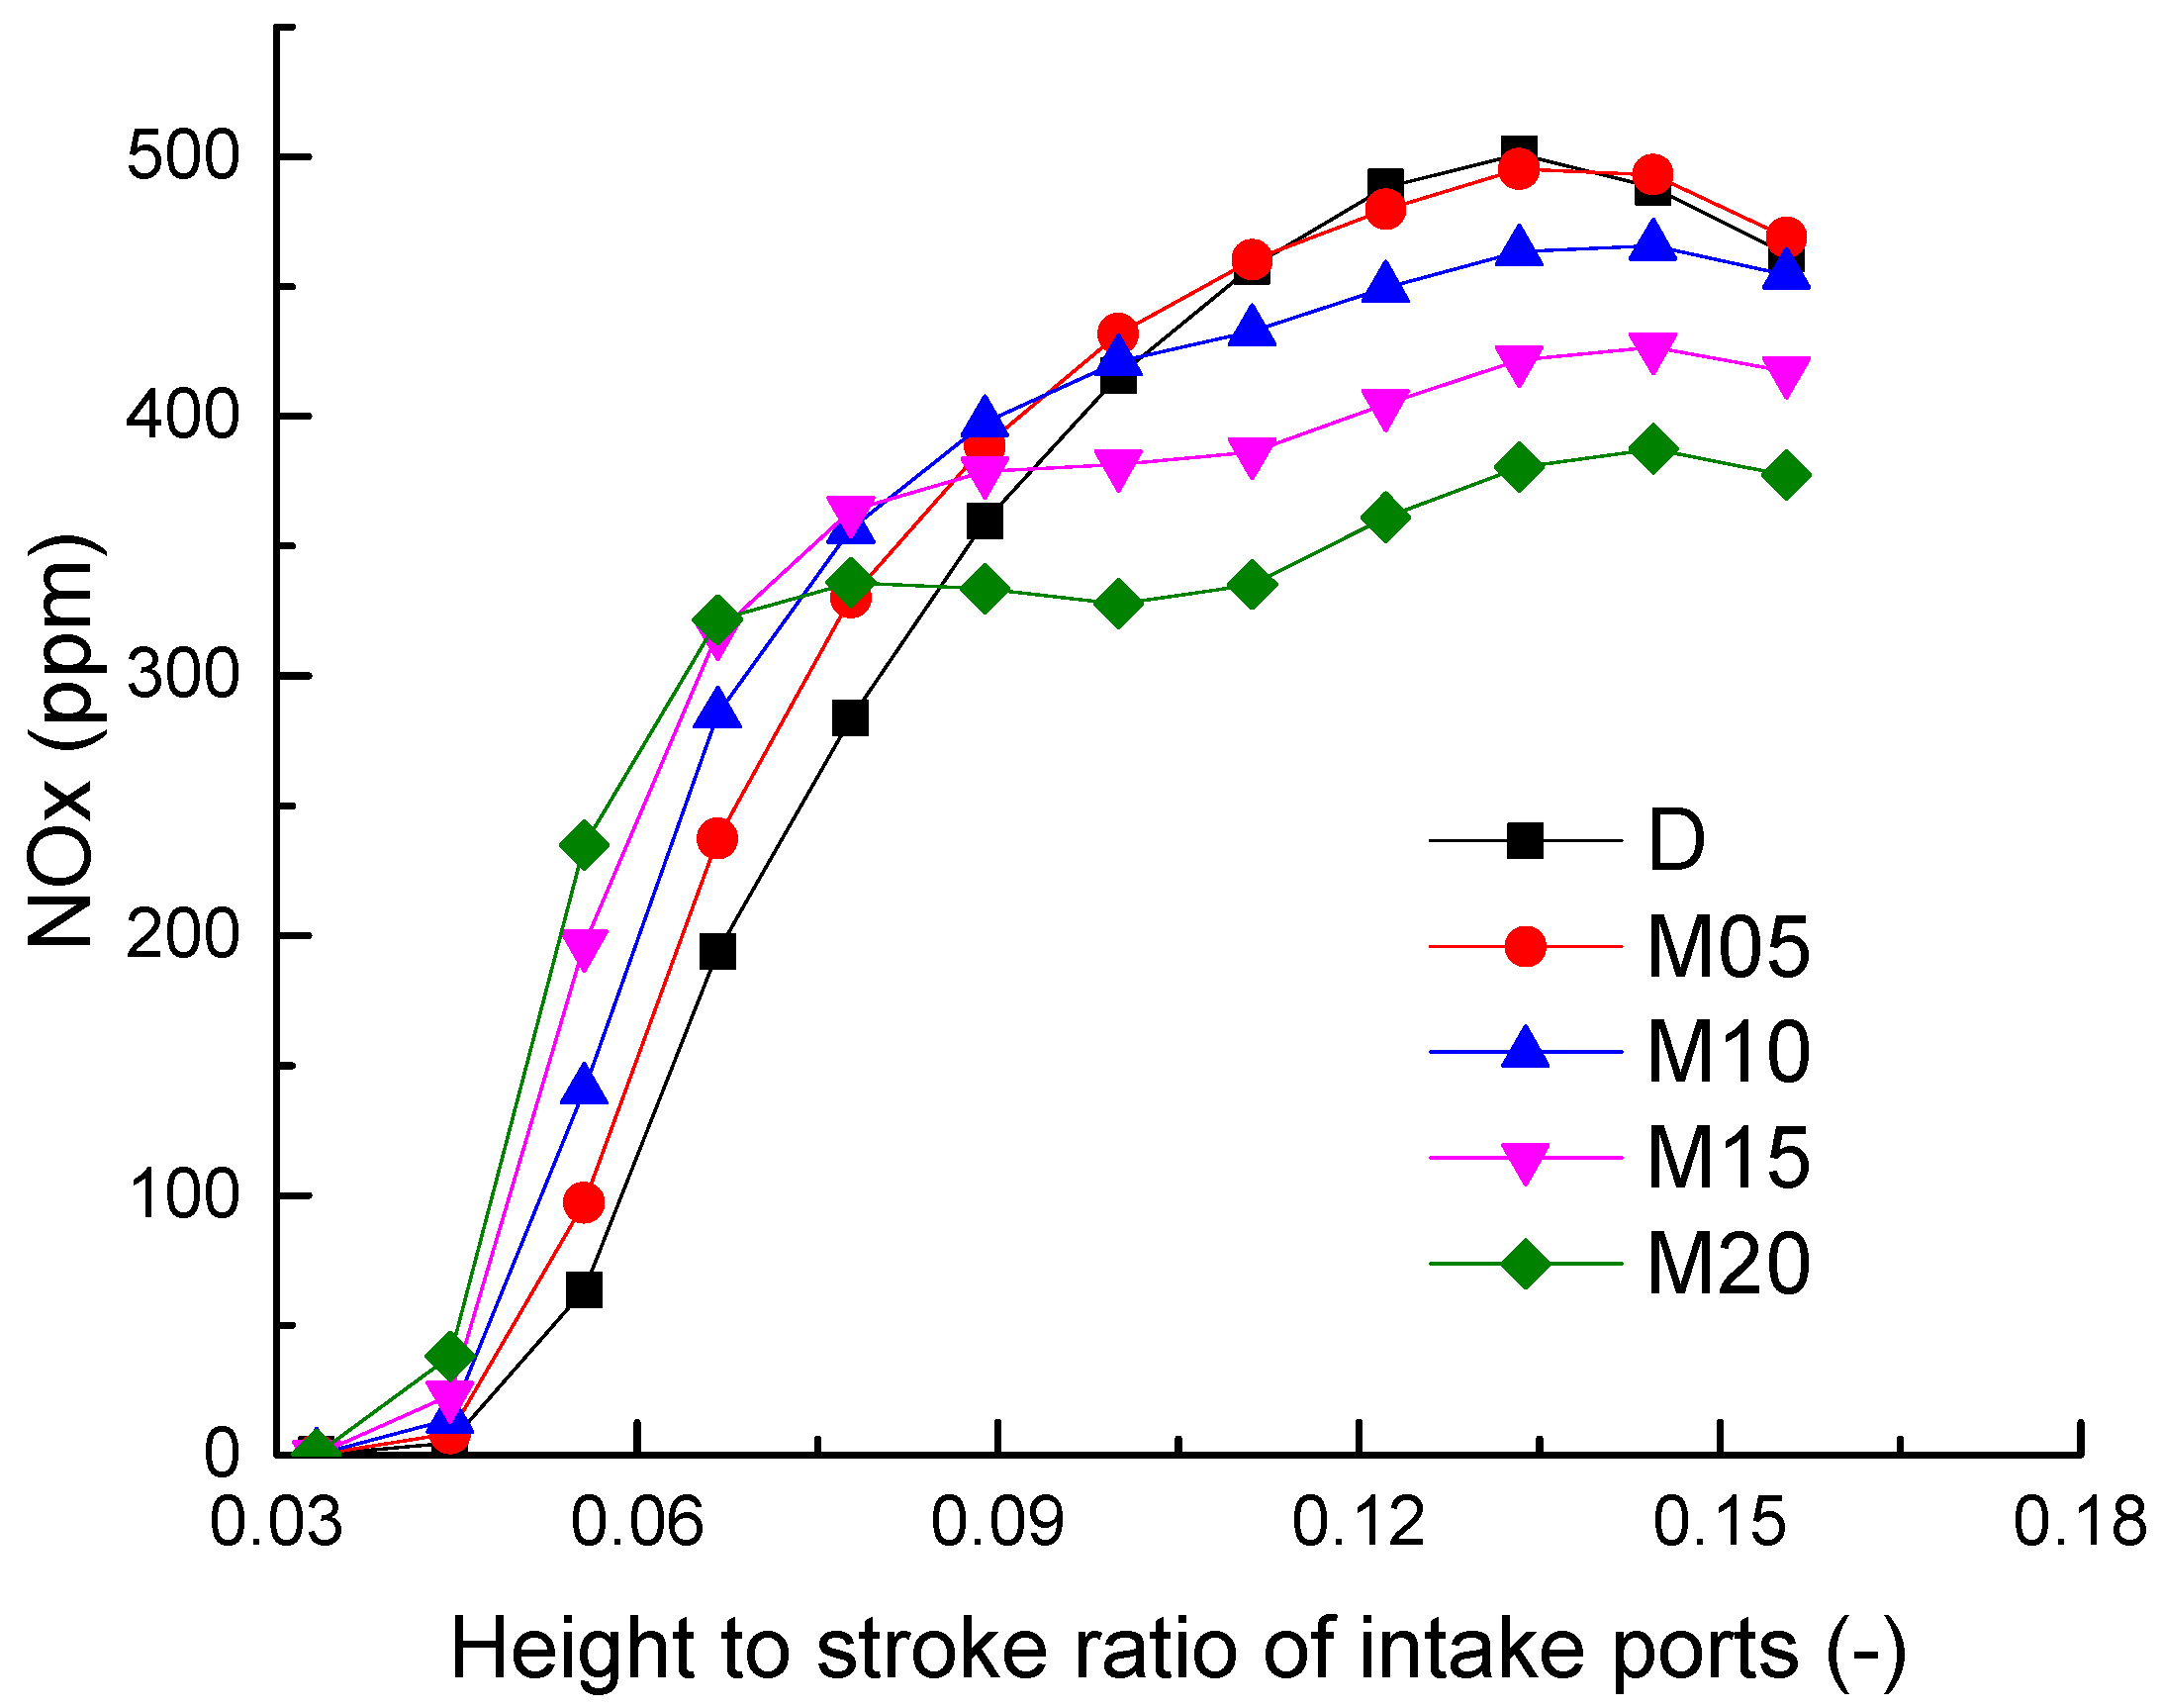
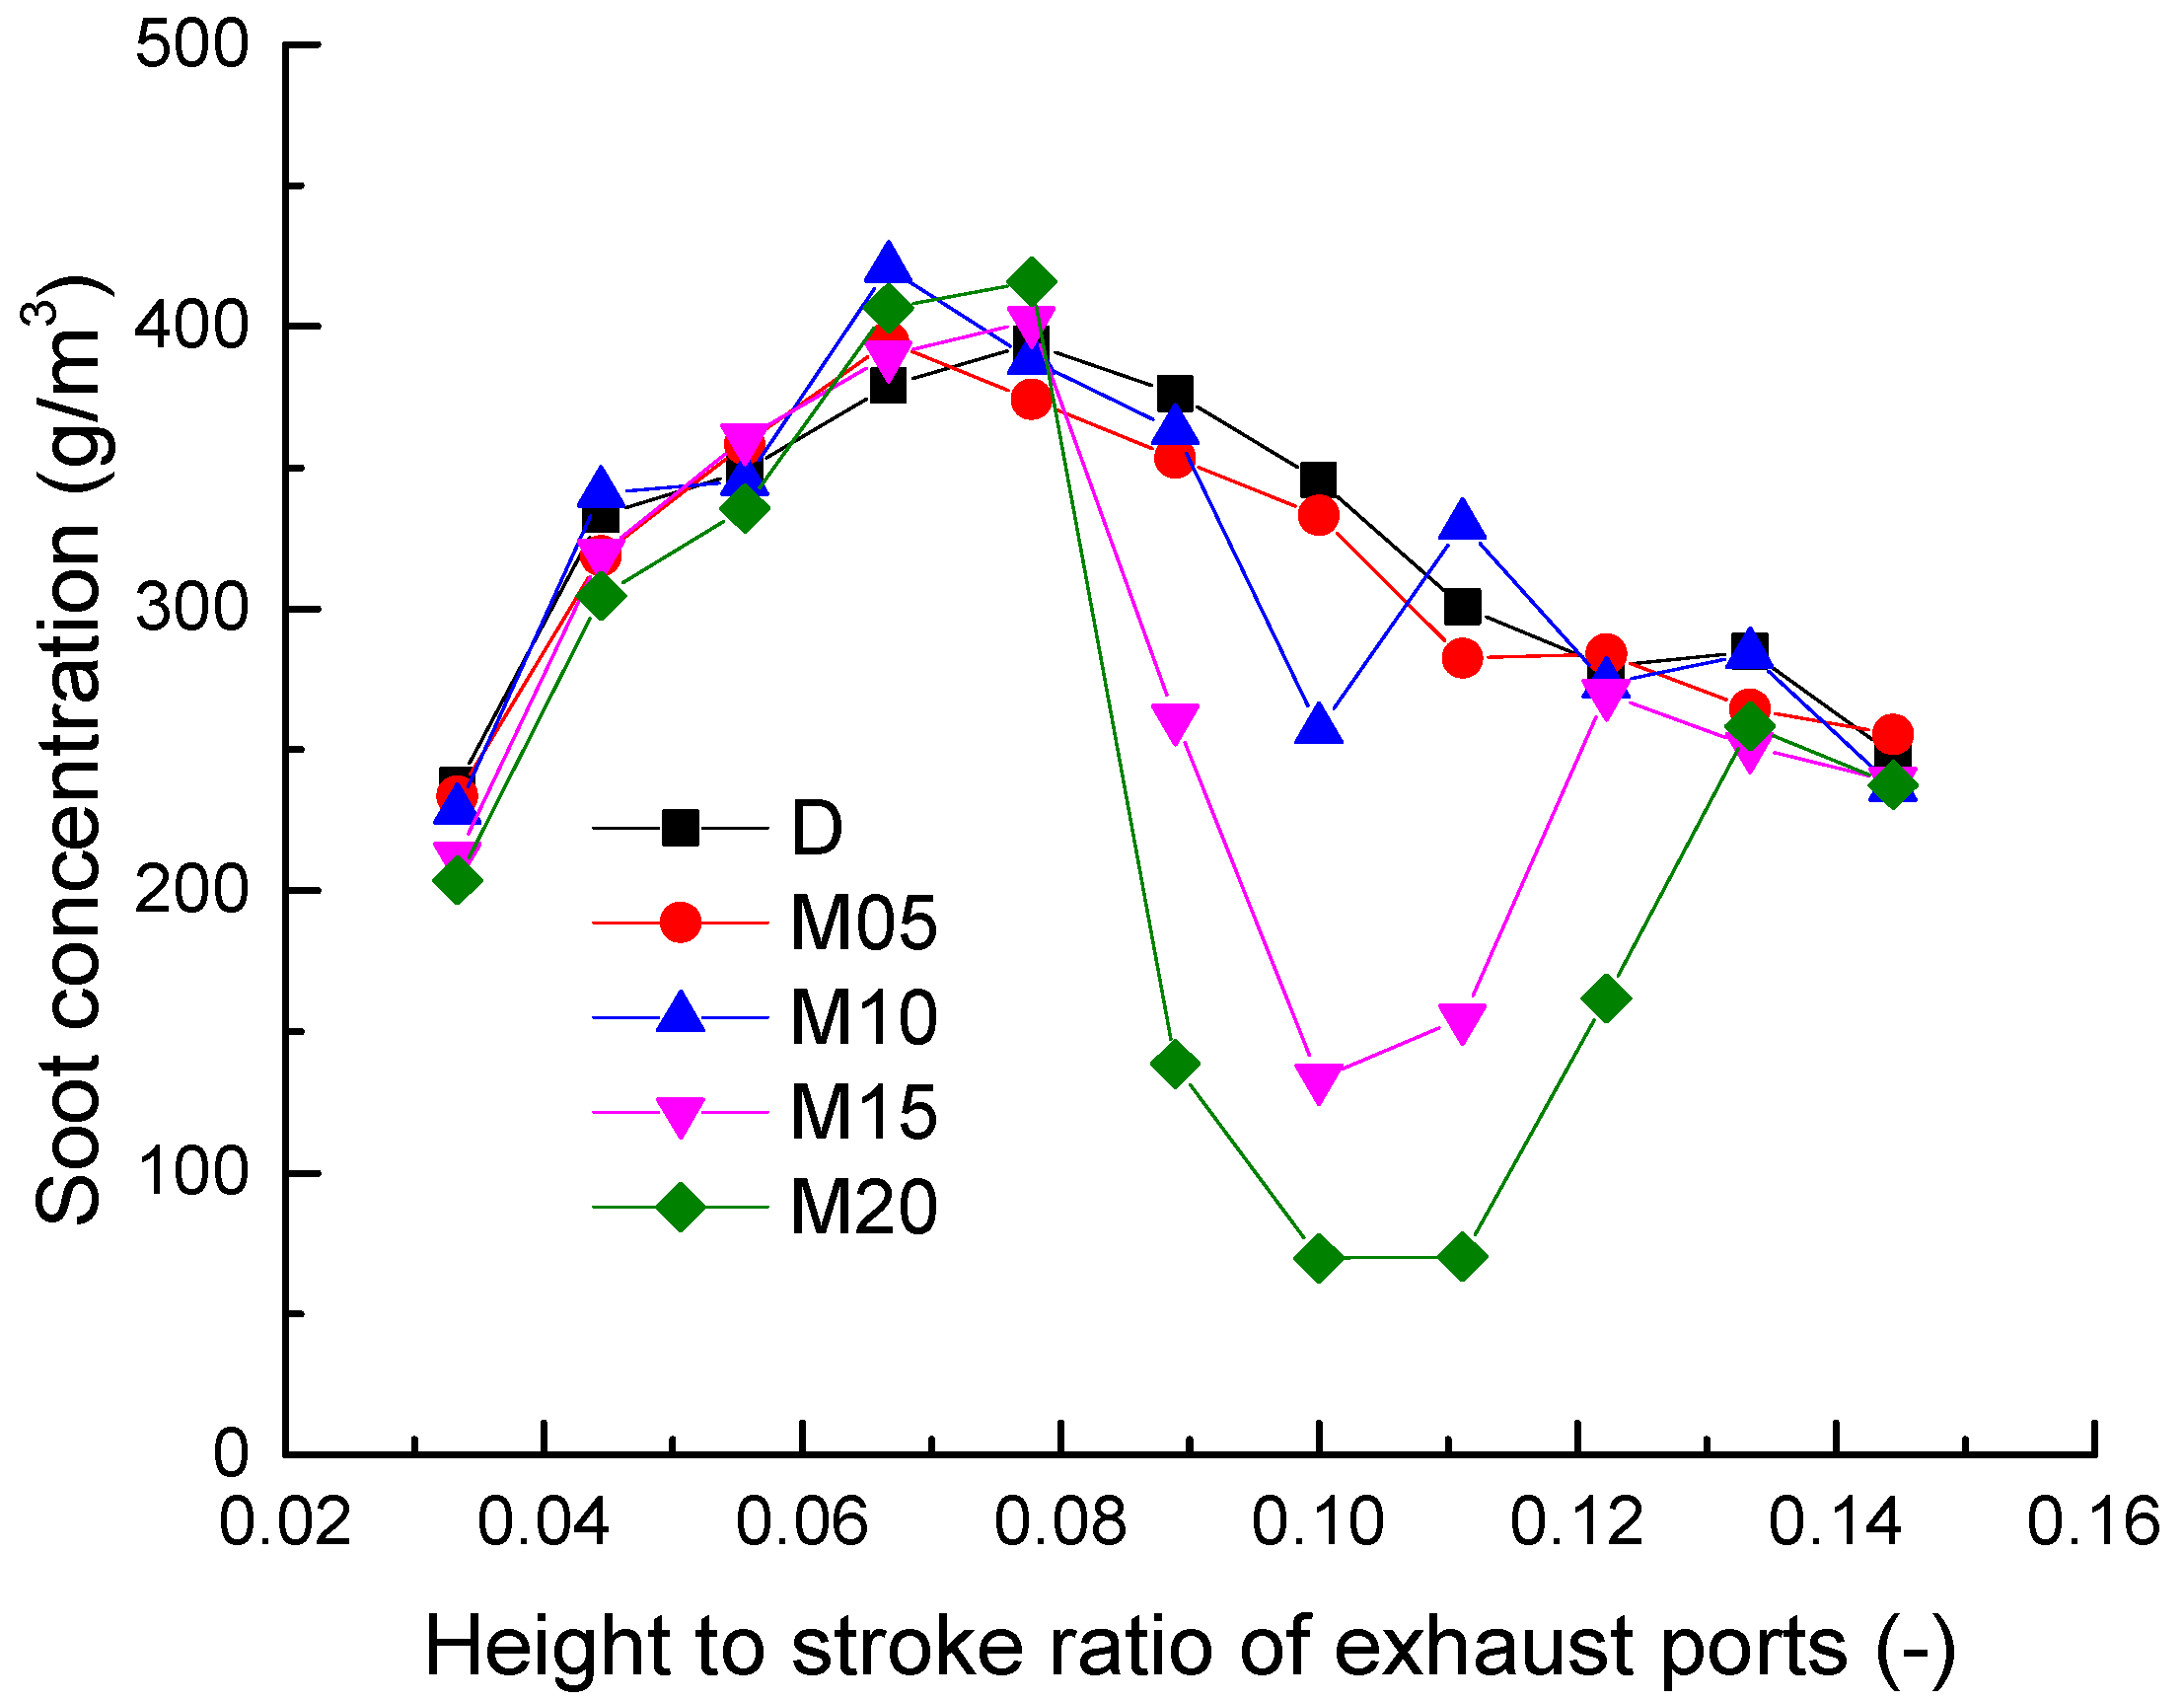
The increasing methanol ratio uniformly raises NOx under the HSR of the exhaust ports. However, it indicates a significant difference in NOx emissions under different HSRs of the intake ports. Before the HSR of the intake ports increases to 0.08, the increasing methanol ratio uniformly raises NOx. After the HSR of the intake ports exceeds 0.1, the increasing methanol blending ratio decreases NOx. The methanol increases oxygen to promote combustion but also reduce the total energy of fuel. In addition, the soot concentration indicates an opposite phenomenon compared with the NOx emissions.
(3)
Under the interaction of the intake and exhaust ports, when the HSR of the intake and exhaust ports are both large, the IP and the ITE are both the largest. The HSR of ports for the optimal IP and ITE is decreased by the increasing methanol ratio. The NOx emission shows the same phenomenon as IP and ITE, while the soot concentration indicates an opposite result. The methanol in diesel weakens power performance but improves fuel economy and emission performance in OP2S diesel engines. The methanol ratio should be kept to 10–15% to balance power and emission performances.

Author Contributions

W.Y. and L.Z. established the simulation model; F.M. verified the simulation model; D.X. and W.J. studied the effect of parameters on the performances of the OP2S diesel engine; Y.Z. and J.Z. analyzed the data, and W.Y. wrote the paper. All authors have read and agreed to the published version of the manuscript.

Funding

This research was supported by the Fundamental Research Program of Shanxi Province (grant No. 20210302123072).

Institutional Review Board Statement

Not applicable.

Informed Consent Statement

Not applicable.

Data Availability Statement

Not applicable.

Acknowledgments

The authors are grateful to the Fundamental Research Program of Shanxi Province (grant No. 20210302123072) for the provision of funding.

Conflicts of Interest

The authors declare no conflict of interest.

Abbreviations

HCCIHomogeneous charge compression ignition
HSRHeight-to-stroke ratio
ICEsInternal combustion engines
IPIndicated power
ITEIndicated thermal efficiency
LTCLow-temperature combustion
OP2SOpposed-piston two-stroke
RCCIReactivity-controlled compression ignition
WCRWidth-to-circumference ratio

References

  1. Kalghatgi, G. Development of Fuel/Engine Systems—The Way Forward to Sustainable Transport. Engineering 2019, 5, 510–518. [Google Scholar] [CrossRef]
  2. Su, W.; Zhang, Z.; Liu, R.; Qiao, Y. Development Trend for Technology of Vehicle Internal Combustion Engine. Chin. J. Eng. Sci. 2018, 20, 97–103. [Google Scholar] [CrossRef]
  3. Johnson, T.; Joshi, A. Review of Vehicle Engine Efficiency and Emissions; SAE Technical Paper; SAE International: Warrendale, PA, USA, 2018. [Google Scholar] [CrossRef]
  4. Falkner, R. The Paris Agreement and the new logic of international climate politics. Int. Aff. 2016, 92, 1107–1125. [Google Scholar] [CrossRef]
  5. Panda, K.; Ramesh, A. Parametric investigations to establish the potential of methanol based RCCI engine and comparison with the conventional dual fuel mode. Fuel 2022, 308, 122025. [Google Scholar] [CrossRef]
  6. Xu, C.; Zhuang, Y.; Qian, Y.; Cho, H. Effect on the performance and emissions of methanol/diesel dual-fuel engine with different methanol injection positions. Fuel 2022, 307, 121868. [Google Scholar] [CrossRef]
  7. Su, L.-W.; Li, X.-R.; Sun, Z.-Y. The consumption, production and transportation of methanol in China: A review. Energy Policy 2013, 63, 130–138. [Google Scholar] [CrossRef]
  8. Sayin, C.; Ilhan, M.; Canakci, M.; Gumus, M. Effect of injection timing on the exhaust emissions of a diesel engine using diesel–Methanol blends. Renew. Energy 2009, 34, 1261–1269. [Google Scholar] [CrossRef]
  9. Panda, K.; Ramesh, A. Diesel injection strategies for reducing emissions and enhancing the performance of a methanol based dual fuel stationary engine. Fuel 2021, 289, 119809. [Google Scholar] [CrossRef]
  10. Wei, L.; Yao, C.; Wang, Q.; Pan, W.; Han, G. Combustion and emission characteristics of a turbocharged diesel engine using high premixed ratio of methanol and diesel fuel. Fuel 2015, 140, 156–163. [Google Scholar] [CrossRef]
  11. Ma, B.; Yao, A.; Yao, C.; Chen, C.; Qu, G.; Wang, W.; Ai, Y. Multiple combustion modes existing in the engine operating in diesel methanol dual fuel. Energy 2021, 234, 121285. [Google Scholar] [CrossRef]
  12. Abani, N.; Chiang, M.; Thomas, I.; Nagar, N.; Zermeno, R.; Regner, G. Developing a 55% BTE Commercial Heavy-Duty Opposed-Piston Engine without a Waste Heat Recovery System. In Heavy-Duty-, On-und Off-Highway-Motoren 2016; Springer: Wiesbaden, Germany, 2017; pp. 292–310. [Google Scholar]
  13. Huo, M.; Huang, Y.; Hofbauer, P. Piston Design Impact on the Scavenging and Combustion in an Opposed-Piston, Opposed-Cylinder (OPOC) Two-Stroke Engine. SAE Paper 2015-01-1269. In Proceedings of the SAE 2015 World Congress & Exhibition, Detroit, IL, USA, 23 April 2015. [Google Scholar]
  14. Pirault, J.-P.; Flint, M. Opposed-Piston Engine Renaissance Power for the Future; Achates Power Inc.: San Diego, CA, USA, 2010. [Google Scholar]
  15. Ma, F.; Zhang, S.; Zhao, Z.; Wang, Y. Research on the Operating Characteristics of Hydraulic Free-Piston Engines: A Systematic Review and Meta-Analysis. Energies 2021, 14, 3530. [Google Scholar] [CrossRef]
  16. Ma, F.; Yang, W.; Xu, J.; Li, Y.; Zhao, Z.; Zhang, Z.; Wang, Y. Experimental Investigation of Combustion Characteristics on Opposed Piston Two-Stroke Gasoline Direct Injection Engine. Energies 2021, 14, 2105. [Google Scholar] [CrossRef]
  17. Patil, S.; Ghazi, A.; Redon, F.; Sharp, C.; Schum, D.; Headley, J. Cold Start HD FTP Test Results on Multi-Cylinder Opposed-Piston Engine Demonstrating Rapid Exhaust Enthalpy Rise to Achieve Ultra Low NOx (No. 2018-01-1378); SAE Technical Paper; SAE International: Warrendale, PA, USA, 2018. [Google Scholar]
  18. Yang, W.; Li, X.R.; Zhao, W.H.; Kang, Y.N.; Liu, F.S. Effect of Layered-Port VVT on Performance of Opposed-Piston Two-Stroke Diesel Engine. J. Energy Eng. 2019, 145, 04019027. [Google Scholar] [CrossRef]
  19. Ma, F.K.; Wang, J.; Feng, Y.N.; Zhang, Y.G.; Su, T.X.; Zhang, Y.; Liu, Y.H. Parameter Optimization on the Uniflow Scavenging System of an OP2S-GDI Engine Based on Indicated Mean Effective Pressure (IMEP). Energies 2017, 10, 368. [Google Scholar] [CrossRef] [Green Version]
  20. Asad, U.; Divekar, P.S.; Zheng, M. High efficiency ethanol–diesel dual-fuel combustion: Analyses of performance, emissions and thermal efficiency over the engine load range. Fuel 2022, 310, 122397. [Google Scholar] [CrossRef]
Figure 1. Model validation of the OP2S diesel engine.
Energies 15 02942 g001
Figure 2. Schematic of port structure parameters for the OP2S diesel engine.
Energies 15 02942 g002
Figure 3. Indicated power under different HSRs of intake ports.
Energies 15 02942 g003
Figure 4. Indicated thermal efficiency under different HSRs of intake ports.
Energies 15 02942 g004
Figure 5. NOx under different HSRs of intake ports.
Energies 15 02942 g005
Figure 6. Soot concentration under different HSRs of intake ports.
Energies 15 02942 g006
Figure 7. Indicated power under different HSRs of exhaust ports.
Energies 15 02942 g007
Figure 8. Indicated thermal efficiency under different HSRs of exhaust ports.
Energies 15 02942 g008
Figure 9. NOx under different HSRs of exhaust ports.
Energies 15 02942 g009
Figure 10. Soot concentration under different HSRs of exhaust ports.
Energies 15 02942 g010
Figure 11. Indicated power under the interaction of the intake and exhaust ports.
Energies 15 02942 g011
Figure 12. Indicated thermal efficiency under the interaction of the intake and exhaust ports.
Energies 15 02942 g012
Figure 13. NOx under the interaction of the intake and exhaust ports.
Energies 15 02942 g013
Figure 14. Soot concentration under the interaction of the intake and exhaust ports.
Energies 15 02942 g014
Table 1. Specifications of the OP2S diesel engine [17].
Engine ParameterValue
Bore [mm]85
Stroke [mm]2 × 90
Compression ratio [-]22
Intake temperature [K]320
Intake pressure [MPa]0.13
Back pressure [MPa]0.1
Rated speed [r/min]3000
Cycle fuel injection [mg/cycle]36
Table 2. Parameters of intake and exhaust ports.
Intake port height [mm]6810121416182022242628
HSR of intake ports0.0330.0440.0560.0670.0780.0890.1000.1110.1220.1330.1440.156
Exhaust port height [mm]68101214161820222426
HSR of exhaust ports0.0330.0440.0560.0670.0780.0890.1000.1110.1220.1330.144
Table 3. Fuel types.
Type100% Diesel5% Methanol + 95% Diesel10% Methanol + 90% Diesel15% Methanol + 85% Diesel20% Methanol + 80% Diesel
MarkDM05M10M15M20
Table 4. Fuel properties.
PropertiesDieselMethanol
Lower heating value [MJ/kg]42.519.7
Cetane number [-]48<5
Density [25 °C, kg/m3]840790
Boiling point [°C]28764.7
H/C ratio [-]0.160.33
Publisher’s Note: MDPI stays neutral with regard to jurisdictional claims in published maps and institutional affiliations.

