1. Introduction
The growing use of renewable biomass creates preconditions for the development of the biomass energy sector. Development is carried out on a regional basis due to the locality of biomass resources. Biomass cultivation, production, and consumption subjects are concentrated in the regions. They have the same business goals but quite different interests. The goal of the activity is a competitive energy price, which allows maintaining profitability in all sectors of biomass production and consumption. However, certain sectors may be interested in growing or reducing production for different reasons. A possible lack of coordination, self-activity of individual chains of activity, and insufficient control create preconditions for the shadow economy. It could be detrimental to both business and society, as there would be a risk of non-transparent parallel activities. By using them, it is possible to maintain a constant level of biomass raw material prices.
The spread of biomass-based renewable energy is significantly hampered by the lack of suitable trade conditions. In this case, it is important to properly regulate the market of raw materials for energy production in order to avoid distortions of competition and corruption. In addition, the efficiency and capacity of regional power plants need to be reviewed to prevent inefficient use of biomass. This goal could be achieved by investing in both infrastructure and research and development. The latter investment is significant because it encourages the use of new types of biomasses in energy sector.
The elements of the shadow economy in the biomass energy reveal itself in different aspects. At the same time, these aspects have different effects on a country’s or region’s economy. The theoretical model developed by [
1] predicts that controlling the level of corruption may limit the impact of the shadow economy on pollution. In terms of the use of biomass, this is linked to the necessity to ensure the production of quality green fuel while avoiding cheaper but potentially polluting fuels. Fuel can be contaminated with different substances—grease, varnish, and sometimes even radioactive fuel. The activities of the biomass energy sector ensure the production of quality fuels by preventing non-transparent trade of biomass. The combustion of quality biomass ensures a neutral impact on the environment, avoiding any pollution. Transparency in biomass consumption depends on the level of development and publicity of the biomass market. There are also two risks: the formation of shadow biomass market, with shadow wages being paid at the same time [
2]. It has a significant negative impact on the economy of the country and the region—the share of taxes paid is reduced not only in the assessment of the prepared and sold biomass production, but also in the assessment of the labor costs required for the preparation of the production. This situation has a negative social impact, with a reduction in the share of taxes paid reducing workers’ social security, which has an impact on the size of their future pensions. Biomass harvesting activities are largely carried out in the regions. The shadow economy is most affected by regions that receive less tax revenue and the resources they contain can be misused and accounted for. The shadow labor cost is equal to the marginal output of the worker [
3,
4,
5]. The ability to secure cheaper labor force is one of the key factors in the competitiveness of the shadow biomass supply market. These opportunities are possible in emerging markets. These markets have a lack of business transparency and significant social and business regulatory challenges. It hinders the development of sustainable business structures that to carry out tax obligations responsibly and ensure a transparent supply of biomass. The damage is multiplied by the value of the shadow economy compared to the traditional economy. The results of the study showed that the efficiency of the shadow economy is lower than that of the conventional economy in all cases [
6]. However, the shadow economy is hampering the transition to a green economy because biomass resources are wasted. Inefficient use of biomass resources prevents the creation of maximum added value that could be used to enrich the region and society. The shadow economy is an obstacle to the rapid transition of regions to green energy, as such fuels are sold at a lower price, thus reducing the competitiveness of transparent businesses. When a biomass market is non-existent within a country or region, there is an alternative market or shadow prices. They are determined by the time taken to absorb biomass substitutes. The faster the uptake of biomass, biogas, and other organic elements, the impact of the shadow economy, in the long run, is lower. Without the conditions for the transition to green energy or delaying the transition, the shadow economy is growing, to the detriment of legitimate business structures. The creation of a legal business structure forms the basis for growing or extracting biomass at competitive prices, securing fuel sales directions, eliminating the risk of the shadow economy. The current situation motivates to investigate the impact of the shadow economy on the energy sector. The study is relevant because the biomass energy sector brings together different economic and social elements that are felt by different groups of society. Other scientific studies lack empirical solutions to compare regions or countries in the aspect of shadow economy.
There is a lack of research in the scientific literature on the origin and impact of the shadow economy in terms of regions. In developing countries, shadow trade is recognized as a serious problem, reducing government revenue. However, the solution to the problem is left to the regional level. In this case, there is a lack of resources and tools to deal with the problem. In the biomass energy sector, this issue is particularly acute—in the absence of innovation, it is currently difficult to ensure the origin of biomass and real production volumes. At the same time, the scientific literature lacks methodological solutions that would allow to empirically assess the impact of the shadow economy on the biomass sector. It is not known which elements contribute most to the development of the shadow economy; in which strata they have the greatest influence. As the shadow economy originates in the regions, it becomes even more difficult to identify appropriate risk factors. In each region, there is a unique environment for the emergence of a shadow economy. There are no universal values in the scientific literature that describe the risk factors of the shadow economy in the biomass energy sector. This article presents the concept and characteristics of the shadow economy in the energy sector, thus filling the gap in the field of science. The phenomenon of the shadow economy in energy sector is relatively little investigated as it is a complex phenomenon. In this case, the scientific novelty is related to the development of the evaluation methodology. Its assistance examines the risks of the shadow economy at regional level. The article contributes to previous research studies by providing an opportunity to empirically test the extent of the shadow economy. The application of the methodology will allow monitoring the growth or decline of the shadow economy, while developing appropriate solutions to improve the economic situation in the region and the country.
The aim of the article is to develop a methodology for risk assessment of the shadow economy in the biomass energy sector and to apply it to the regions of developing countries. This is related to the study of the origin of the shadow economy, the identification of the necessary research indicators, the application of the developed empirical solution.
2. Literature Review
The origins of the shadow economy in the scientific literature are ambiguous. In some cases the national level is emphasized, in others the regional dimension is used. The latter is faced with multiple factors that may be different for each region. The negative effects of the shadow economy can be analyzed from the perspective of sustainable development, thus highlighting the main directions of adjustment. One of the key factors in the development of the shadow economy is market youth. Due to the lack of established operating principles, a medium for non-transparent activities exists and the level of innovation is still relatively low. This also reduces the potential of the sector. The main obstacles that prevent energy from biomass power plants from reaching their full potential are [
7]:
Despite considerable efforts to increase the contribution of biomass to energy provision, several difficulties had to be faced:
Market prices for fossil resources did not develop as predicted, making it difficult for biomass to compete without additional support;
The responsibility for the political framework and R&D funding was with different ministries; the integration of activities turned out to be difficult;
Due to the federal structure of Germany, even R&D funding was allocated to different ministries and programmes;
R&D priorities and budgets fluctuated heavily;
For decades, agriculture was the main political promoter of renewable biological resources and bioenergy. Environmental policy discovered the potential of bioenergy rather late;
A market which relies heavily on the political frame conditions is not too attractive for industry. Big energy companies tend to focus on their classical business; smaller ones sometimes do not survive the ups and downs of political support. Industrial interest was limited and so was the market uptake of R&D results.
The shadow economy can be associated with political risks-failure to block the actions of the shadow economy can damage traditional business structures [
8,
9,
10]. There are also exceptional production risks, which can also be created by aspects of the shadow economy. They can be of two types: when non-transparent agreements are observed to impede the conversion of biomass or when they are implemented during the conversion. There is an asymmetric link between energy production and the shadow economy [
11]. In this case, the emphasis is on the use of fossil fuels in energy production. The use of renewable energy can help reduce the size of the informal economy, as fuel extraction and energy dissipation are easier to trace than in the case of oil and gas [
12,
13,
14]. It is difficult for renewable energy operators to operate in the shadow market. In the case of the biomass energy sector, it can be argued that the shadow economy can develop in the biomass production sector [
15,
16]. This may be due to the incompetence of the sector and the potential difficulties in ensuring the traceability of fuel and the volume of its production. It could lead to excess fuel being placed on the market, fuel theft, or poor-quality fuel preparation. Political risks are also associated with the issuance of the necessary documents for the start of operations. The need for permits and the deadlines for issuing them can significantly change the project launch deadlines and payback period.
It is often this factor that reflects the inactivity of bureaucratic structures and the level of corruption in the area. The issued permits regulate the activities of companies in the production of energy, development of biomass harvesting business or justification of transportation volumes. Both local and state authorities are responsible for issuing permits. Bureaucratic constraints are most visible in a municipality whose inert activities tend to limit the actors involved. At the state level, there are difficulties in introducing new initiatives with inadequate redundancy requirements. Most of the conditions that contribute to the success of the sector are difficult to create from scratch [
17,
18,
19]. Changes in public policy are long, complex, often difficult to predict, so it is necessary for business entities to properly study the market, administrative requirements, and provide resources for contingencies.
Systematizing the impact of the shadow trade in biomass on a country or region distinguishes three strands based on the principles of sustainable development (
Table 1). These principles are inseparable from the transparent operation of the sector. Companies operating in the biomass energy sector seek to harmonize these principles in order to gain the full support of stakeholders. The shadow economy has a negative impact on different levels of the economy, while at the same time affecting the social cohesion of the regions and the state of the environment. The latter factors lead to a deterioration of the economic situation in the long run, as this makes it more difficult to carry out legal economic activities. In addition, illegally exploited state resources will negatively affect the country’s biomass supply in the future.
The potential to reduce the impact of the shadow economy are related with the use of smart technologies. The competitiveness of the biomass energy sector is considered to be growing at the moment when the biomass supply chain is balanced. The success of its management is inseparable from the control of different processes. Different strategies are used to manage the supply chain. In the case of the biomass energy sector, the supply chain can be designed and managed using cartographic data. This is particularly useful on non-consolidated forest holdings, where there are many small-scale forests in the regions. From an industrial point of view, these are not useful forests because their commercial potential is too low. In addition, they often lack maintenance, unlike in consolidated forest holdings. Having their classification and biological data allows their potential to be exploited more effectively. GIS (Geographic Information Systems) are highly valued for their ability to store, display and analyze cartographic data. Such systems can connect multiple layers of geographic features. Thus, a topographic map, a road network and an infrared satellite image can be combined to assess crop maturity, detect illegal plantations, or diagnose diseases [
20,
21]. This approach allows long-term biomass supply policies to be identified and the supply chain adjusted accordingly. It would allow for a long-term uninterrupted supply of biomass and cost management. The number of potential biomass resource generating areas would also be increased. The use of GIS would optimize the costs in the supply chain, thus increasing the competitiveness of companies in the energy supply process [
22]. At the same time, GIS would reduce the potential for shadow trade in the sector, when is a risk of overproduction or incorrect delivery of biomass to the power plant.
Balancing the supply chain would create a positive effect on all levels of sustainable development. Transparent use of biomass waste can significantly supplement the municipal budget with newly generated revenue [
23,
24,
25]. Balancing the supply chain would create a positive effect on all levels of sustainable development [
26,
27]. In this case, it is important to ensure transparency in the extraction and supply of fuel, avoiding the manifestations of the shadow economy. It can be stated that the main factor in preventing the elements of the shadow economy in the biomass production sector is a large-scale monitoring system that includes digital technologies, continuous data accounting, and accountability to both business entities and the society.
The phenomenon of the shadow economy in the energy sector is superficially studied in the scientific literature. There is a lack of empirical solutions that allow for a quantitative comparison of different territories. Theoretical constructs are often outdated, unsuitable for the ongoing green energy breakthrough. The damage to the economy from the shadow economy is fragmented, regardless of the specifics of the country or its regions. There is a lack of theoretical models that can be used to analyze the direction of the shadow economy, thus avoiding damage to the economy. The formulation of a new theoretical model achieves scientific novelty, as well as enables the analysis of the phenomenon of the shadow economy in the energy sector. The analysis of the sector will allow preventive actions to be taken to avoid losses to the state, the regions, and their inhabitants.
The specifics of the shadow economy and the ways to the elimination of the phenomenon can be conveyed in a theoretical model. The shadow economy is most pronounced through the biomass harvesting sector. This is due to less control over biomass production and supply processes, as well as opportunities for non-transparent employment. The elements of the shadow economy in the biomass energy sector affect all dimensions of sustainable development. The shadow market has a significant impact on legitimate businesses by reducing their competitiveness. The greatest risk for the development of shadow trade is in the biomass harvesting sector, which is located in regional areas. To this end, the impact of the economy is examined at the regional level. The activities most affected by the shadow economy are singled out. In the second case, measures are provided to prevent elements of the shadow economy. The shadow economy has the best conditions in the biomass harvesting sector, where it is relatively difficult to ensure transparency. Manifestations of the shadow economy are visible at all levels of factor market activity, thus creating a complex negative impact on legally operating businesses. According to
Figure 1, the factor market consists of a resource market and a human resources market. These are the main components that shape the scope of the sector’s activities. This market is then modified into end-use products that are placed on the market. The biomass energy sector has only recently begun to take shape due to the rapid development of renewable energy ideas. The new market operates primarily on the principle of monopoly competition—there are different business entities providing similar services in each region. During this phase of the market, employability, and business activity in certain regions are relatively effortless. In terms of monopolistic competition, there is a risk to the shadow economy, which can be caused both internally and externally. The situation can be addressed through a wide range of technological and managerial monitoring tools.
Figure 1 shows the structure of the factor market with the main drivers of the informal economy. In all cases, these factors create negative economic effects. The factor market summarizes the biomass harvesting sector, i.e., activities in rural areas. These activities cover a wide range of business entities, including biomass harvesting, users, industry, and biomass resource owners. It is these actors that make up the structure of the biomass energy sector.
Overcapacity is a main problem in the market of production factors. It could have a significant impact on both the economic and environmental situation of the regions. The threat of overproduction is often due to the irresponsible shadow extraction of biomass. The emergence of this phenomenon makes it difficult to ensure the quality of the biomass produced, as well as the compliance of extraction with the principles of sustainable development. Irresponsible extraction of biomass could have a long-term impact on the environment-promoting soil erosion, worsening the conditions for planting new plants, thus worsening the economic value in the long run. At the same time, the conditions for falling biofuel prices are being created, which is complicating the existence of legally operating business entities. They find it harder to compete with businesses that extract biomass illegally, bypassing environmental and quality requirements. The shadow economy affects the main actors in biomass production, consumers, as well as municipal waste managers-with the dominance of the shadow economy, the importance of waste incinerators is growing. However, this part can also be marked by a shadow-waste accounting and separation of recyclable waste are aspects that require control.
Another part of the market of production factors—human resources market—is arising problems that have a significant impact on the development of the region and the country. Illegal pay for work not only reduces the income of municipalities and state budgets, but at the same time impoverishes the employees. This is reflected in lower pensions and other social guarantees in the future. The short-term financial benefits lead to a decline in the number of people in the regions who want to work legally. In this way, they sacrifice future social guarantees for short-term benefits in the current period. The shadow economy in the labor market makes it more difficult for legal businesses to manage bio-waste, as a supply of illegally extracted or imported waste is formed. At the same time, the situation of industrial entities is aggravated, as the manifestations of illegal work reduce the competitiveness of legally operating entities and pose an existential threat to the survival of legal entities. The problems observed in the biomass market are in line with the impact of the shadow economy on the input market. However, overproduction can be generated by imports of low-quality biofuels from foreign countries. Unclear job accounting creates the conditions for illegal work. Overproduction, driven by cheaper but lower quality biofuels, is shaping the outflow of cash from the region and country. In this case, the main problems that affect the biomass market and reduce the competitiveness of companies operating in the sector are highlighted.
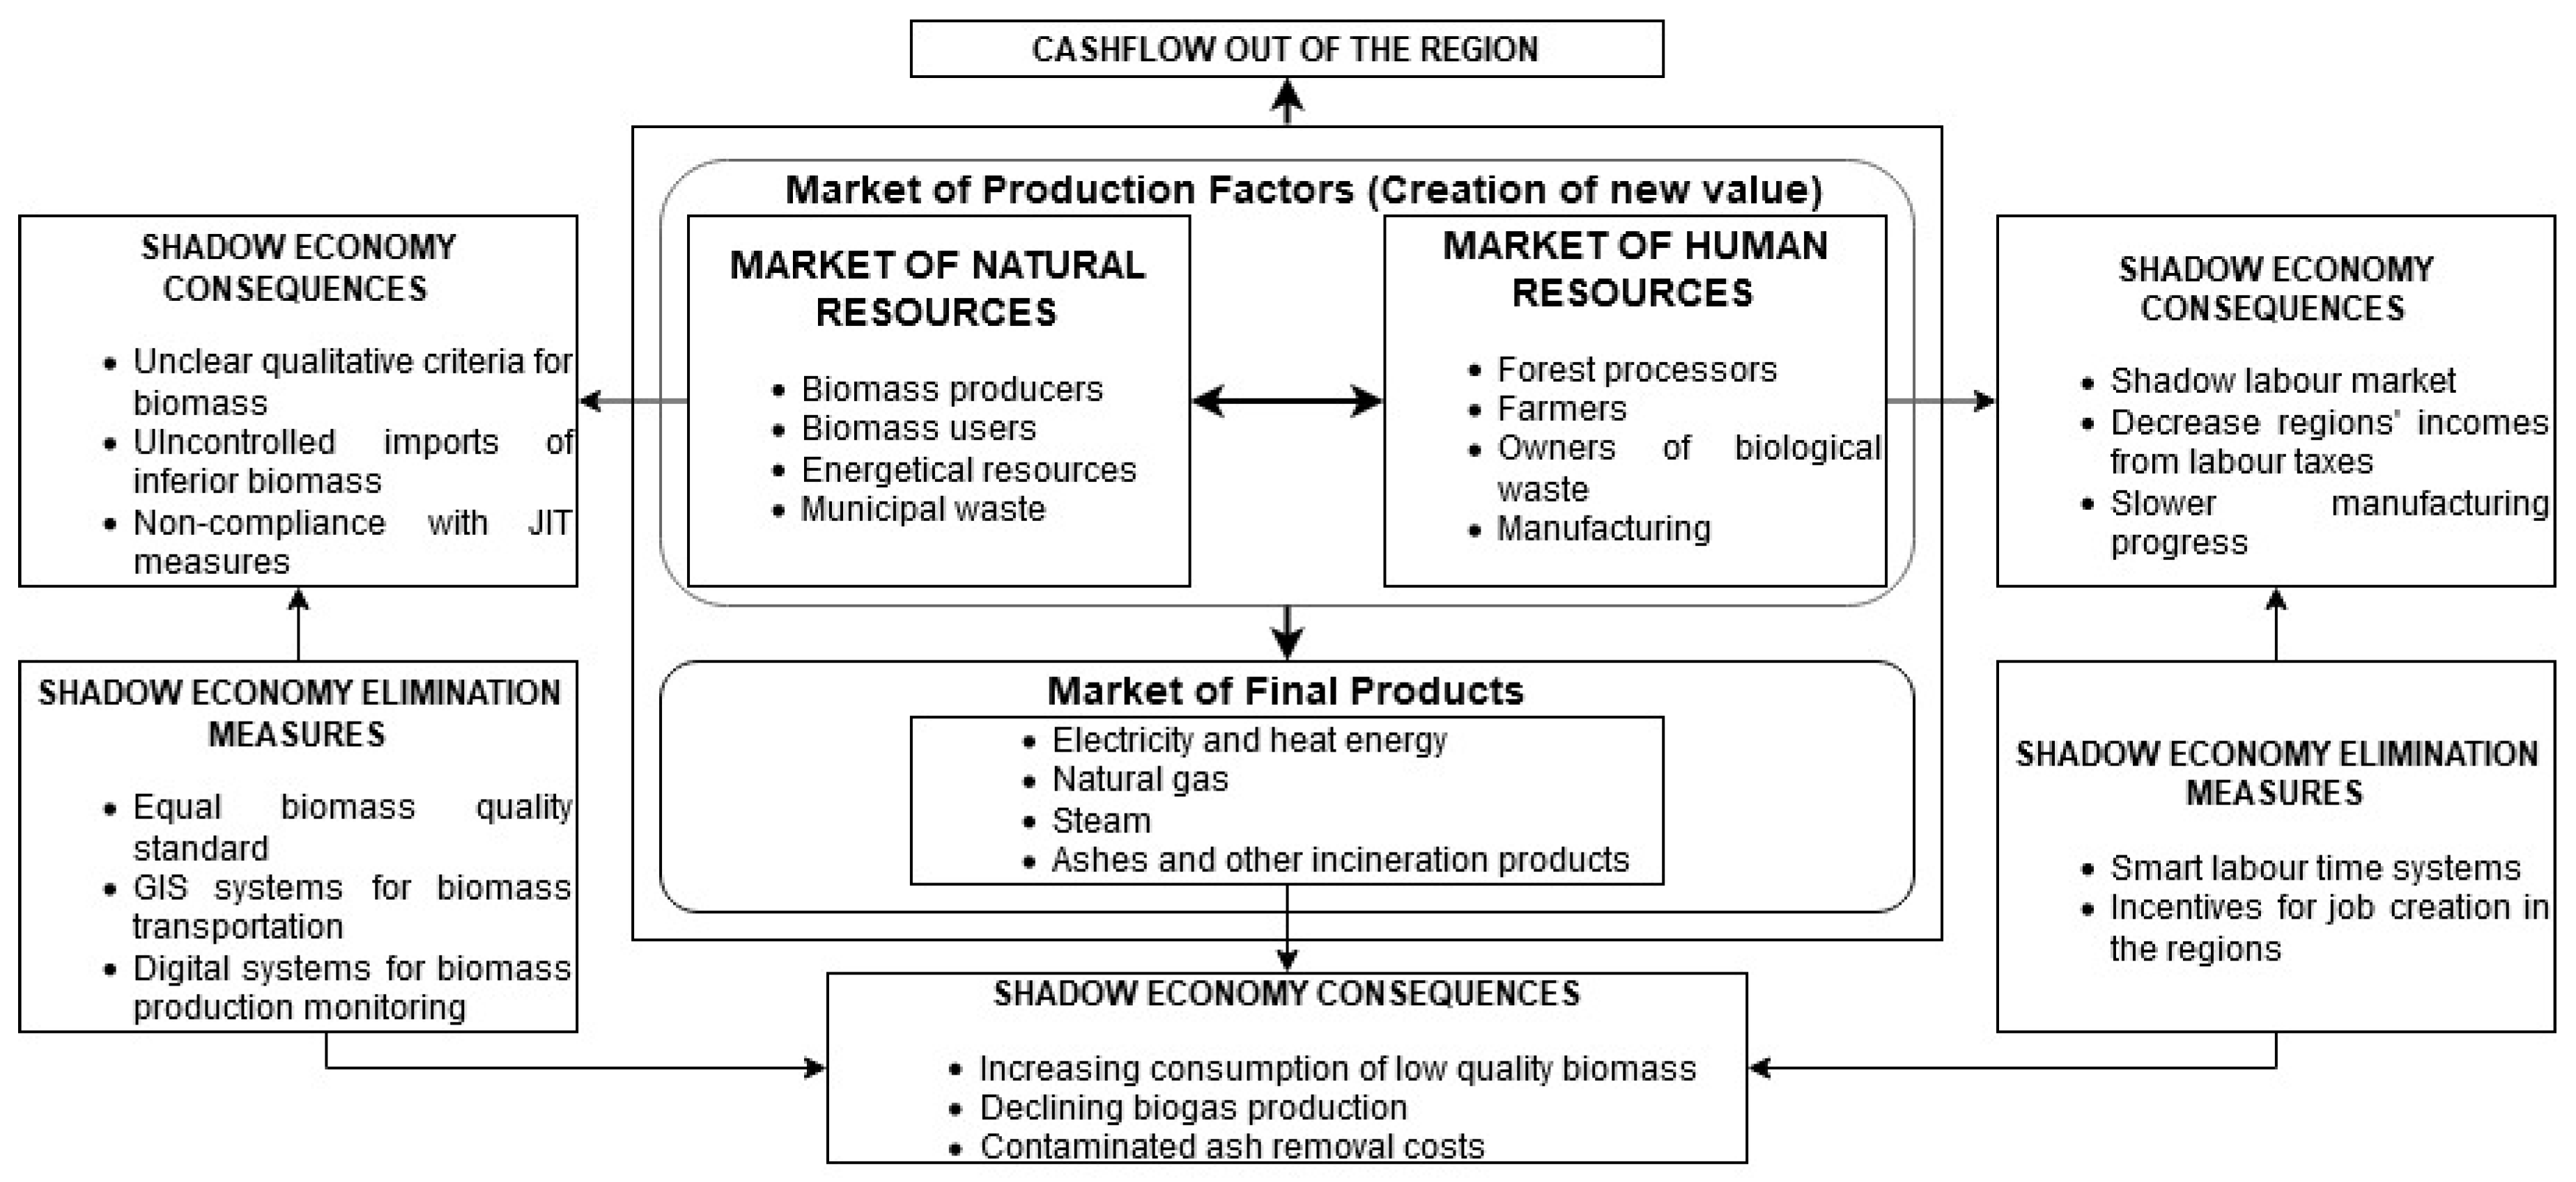
Figure 2 uses the example of Lithuanian regions, including the main sources of the shadow economy and the resulting consequences. The figure includes the whole process of biomass preparation and conversion into energy. All business subjects involved in this process can be considered as players in the sector.
The figure shows all stages of energy production, including the market for final products. The negative effects of the shadow economy are most pronounced in the market of energy production. In this market the outflow of cash flows from the country is formed. It is encouraged to import biomass that does not have high-quality properties. Poor quality biomass is often cheaper, but it can be extracted and imported into the country on the grounds of the shadow economy. The negative effects of the shadow economy on the market of production factors also affect the market for final products. The shadow economy in the market of final products is experiencing an increase in the use of low-quality biomass, as higher levels of low-quality biomass from the shade are needed to produce the same amount of energy. Low calorie substances reduce the potential for biogas extraction. Contaminated biomass generated in the shadow economy releases hazardous substances during incineration, and the ash left over from incineration is unsuitable for agriculture, road construction, etc. This turns the ash into waste that requires additional costs and financial resources to dispose of. In the case of Lithuanian regions, the shadow economy creates a complex negative impact that consistently permeates all levels of the biomass energy sector.
The negative impact on the legal economy is mitigated by eliminating the consequences of the shadow economy. In the case of the natural resources market, it is necessary to use intelligent systems to monitor the direction of biomass transport from the biomass field to the power plant. Monitoring systems for biomass production will avoid overproduction and waste of resources, thus protecting the environment. The problems in the human resources market are being addressed through the introduction of a centralized working time system, the management of which could be delegated to the tax administrator. The prevailing manifestations of the shadow economy in this market have profound negative effects, and the problem solving requires decisive regional and national decisions that encourage the choice of legal employment. All measures to prevent the shadow economy have a positive effect on the market for final products, as the restructuring of the factor market prevents the shadow economy from entering the energy sector.
3. Materials and Methods
Factor analysis is used to perform the research, in which the biomass harvesting sector of Lithuanian regions is investigated. The study aims to find causal links between biomass resources in municipalities, social costs, and the revenues from labor taxes. The study uses data from 2010–2020 from 50 Lithuanian municipalities that have district heating networks. Factor analysis is used to perform the research, in which the biomass harvesting sector of Lithuanian regions is investigated. The study aims to find causal links between biomass resources in municipalities, social costs and labor taxes paid. Factor analysis will identify those municipalities where the risk of the shadow economy in the biomass sector is particularly high. The data presented in
Table 2 are divided by sustainable development perspective. The decision is made because biomass is classified as a renewable energy source and shade reduction is one of the key components of the Environmental, Social, Governance (ESG) concept.
The logic of data selection is related to the aim to investigate the behavior of the population of the regions in the labor market. As the biomass harvesting sector is characterized by a structure of lower-skilled workers, the behavior of such workers is being studied. This situation poses a risk to the payment of shadow wages. This will make it possible to assess the extent of the shadow economy in the biomass harvesting sector, while proposing solutions to increase the sector’s transparency (
Table 3).
Factor analysis is used to group certain indicators according to their characteristics. The decision to use this method was made due to the abundance and complexity of the available data. Reliable methods must be used to link them to establish adequate data interfaces. Factor analysis allows you to process different groups of data with different units of measurement. In this case, the use of economic, social, and environmental data runs the risk of misinterpreting the data. The application of factor analysis eliminates the potential for material error. The main task of factor analysis is to divide the analyzed variables into groups that are united by certain directly difficult-to-name factors, considering the correlation between them [
33,
34]. In the transition from a large number of variables to certain factors, information is concentrated and better covered. Factor analysis is part of a general linear model family of procedures and operates under many of the same assumptions as multiple regression: linear relationships, interval data, but lacks high multiplicity and multidimensional normality to perform significance tests [
35,
36].
Factor analysis creates a table in which the rows are the rough variables observed, and the columns are the factors or latent variables that explain the greatest possible variation in these variables. The cells in this table are factor loads, and the value of the factors must be stimulated by seeing which variables are most loaded, by which factor this occurs. According to this information, it is necessary to collect the data needed for such a study to express the possibilities for factor analysis.
In this case, the principal component analysis (PCA) method is chosen. The decision was made based on the specifics of the method—the totality of the data is analyzed, and the groups of factors are determined accordingly. Based on these factors, the available components of the study are expected to be broken down according to the factors that best describe the factors. The PCA analyzes a data table that presents observations described by several dependent variables that are typically interrelated [
37]. Its purpose is to extract important information from a data table and express that information as a set of new rectangular variables called the principal components. The PCA also shows a pattern of similarity between observations and variables, showing them as points on maps. The PCA is an unsupervised method, and these types of methods are important in practical application [
38,
39]. The PCA is a computationally simplified version of a class for general dimensional reduction analysis [
40]. This analysis method used without considering the basic latent structure of the variables, using all variances of the variables. PCAs were developed decades ago when analyzes were mostly calculated manually. It is also not considered a true method of factor analysis, and scientists from statistics science do not agree on when a particular method should be used. The application of this method requires a tangible sample of data and an attempt to validate certain pre-research ideas.
4. Results
Firstly, data are monitored, whether the observed variables can be summarized by a set of factors. To achieve the goal, the analysis of the KMO criterion is performed. It is accepted that the value of KMO should be at least 0.6, otherwise it is not appropriate to apply factor analysis [
41]. In this and the following cases, the steps of the factor analysis are performed for two groups of indicators.
Table 4 provides information on those indicators that describe the biomass energy sector and the risk of shadow economy.
In the first case, the value is 0.715. It allows to state that the data are suitable for further factor analysis, specifically for factor formation. Similar actions are taken with risk indicators for the shadow economy. In this case, the value of KMO reaches 0.754, which confirms the suitability of the indicators for further analysis. As the results of the KMO criterion for both the biomass energy sector indicators and the shadow economy risk indicators are acceptable, further analysis is possible.
Factor rotation analysis is performed after KMO analysis. The aim is to understand the value generated by the indicators and the meaning of that value. It provides estimates of the correlations between each variable and the components evaluated. Factor rotation is performed when it is necessary to transform the data into an easier-to-interpret format. First, the analysis of positively classified indicators is performed (
Table 5). In order to unify the different dimensions of the analyzed indicators, normalized indicators are used in both cases. For both biomass energy sector indicators and shadow economy risk indicators, the VARIMAX method is used for rotation. The method was chosen to minimize the number of variables significantly associated with each factor [
42,
43]. This will allow to obtain results that reflect the situation, which will serve the further stages of the research.
The results presented in the table allow to state that the costs of biomass, the number of business entities and the collected personal income taxes strongly influence each other. In all three cases, the value of the indicator is greater than 0.6, which indicates a strong correlation. Meanwhile, the indicators for forestry and forest management projects are assigned to the second factor (values are 0.84 and 0.81, respectively), thus demonstrating the existence of a strong relationship between the factor and the variables. In the case of risk indicators for the shadow economy (
Table 6), the links between factors and variables are even stronger. In all cases, they amount to more than 0.85. The obtained results unambiguously prove the appropriate distribution of data groups into factors and data quality.
In the next stage of the research, the analysis of the indicators defining the positive value created is performed. Expenditure on biomass is treated as a positive value, indicating that biomass is procured domestically rather than externally (in the case of fossil fuel imports). The characteristics of the enterprises in the sector and the forest situation prevailing in the regions are also analyzed. In order to show the progress of the income of employees, the personal income tax is included in the indicators of positive value. The processed results in
Table 7 distinguish two sufficiently strong factors. Normalized values were used to obtain results. These results are the basis for obtaining index values.
Two factors can be distinguished from the indicators of the biomass energy sector. The first factor defines the current situation of the biomass sector in the region in terms of economic viability. The factor can be called the sector economic viability factor. The second factor relates to the forest situation in the region and the progress of forest management. The latter factor is important to show how the situation on the biomass market has changed and how this has affected the situation of regional forests in accordance with the principle of sustainable development. The second factor can be named as the forest situation factor. The factors are singled out clearly and unambiguously, thus avoiding possible interpretations. This suggests that the analysis of the factors of the biomass energy sector indicators is successful.
The indicators attributing the risks to the shadow economy are examined below. It should be emphasized that they are linked to both the economic and the social aspects of the regions. Optimizing these costs can significantly increase a region’s competitive advantage and attractiveness among the population and investors. Risk group indicators (
Table 8) are important in showing the extent and impact of biomass conversion on regional economic and social cohesion. As in the case of the biomass energy sector indicators studied previously, normalized values are used.
In the case of the risks of the shadow economy, the distribution of indicators is visible. In the first case, the indicators reflect the risk of the emergence of a shadow economy-people who work in a non-transparent way have an opportunity to claim compensation for heat. This is particularly the case in regions with high heat prices and a larger than average biomass sector. The result obtained can be named as an origin of the shadow economy factor. In the second case, the price of heat correlates with the number of people receiving the minimum wage. With low heat prices, there is a presumption of lower unemployment, as the fall in prices is due to local biomass production. At the same time, lower unemployment associated with lower heat prices indicates the region’s ability to control the scale of the informal economy. The factor is called the sector transparency factor. As in the first case, the naming of the values of these factors is unambiguous, thus avoiding possible interpretations.
In order to form the research tools needed for further evaluation, it is necessary to single out the percentages of the factors. The task is performed using the investigated square coefficient load, which, in this case, is reduced to a single sum as a percentage. According to statistical instruments, each indicator is given a specific percentage value, which is then focused on a single value for a specific factor [
44,
45]. This value is then used for further calculations with normalized indicators. In line with the prevailing logic of the previous research stages, the load analysis of the coefficients of the biomass harvesting sector indicators is performed first. It shows that the highest percentage is accumulated by the economic viability factor of the sector. However, the forest situation factor accounts for almost a third of the value of biomass energy sector indicators (
Table 9).
The load of squares in the shadow economy is presented in a similar way (
Table 10). In this case, the values of the origin factor of the shadow economy have a slightly higher weight than the transparency factor of the biomass sector. This is due to the specifics of the first factor—it consists exclusively of social indicators, which can be significantly affected by the risk of shadow factors. However, the transparency factor in the biomass sector helps to balance possible exceptions due to the effects of the shadow economy [
46]. This is relevant for regions that are just beginning to move towards more transparent management of biomass resources, which will increase the created added value.
Having the results of the analysis of factors and main components, a unified Shadow economy index (SEI) is created. The index consists of two parts, concentrating the data obtained during the calculation of the Regional Energy Activity Sub-Index (REAS) and the Regional Shadow Economy in the Energy Sector Sub-Index (RSEES). The sub-indices are obtained according to the loads of the square coefficient of the factors of both indicators and the extracted factors. The formula for the first sub-index is thus obtained:
The formula of the second sub-index is obtained analogously. As in the first case, the evaluation will consider the regional dimension. Summarizing the obtained results, the formula of the Regional Shadow Economy in the Energy Sector Sub-Index (RSEES) is formed:
The data for each region on the value-added activities and the costs to form a unified valuation index. It will assist to verify the results obtained in the theoretical part, thus showing the impact of the use of biomass on the regional economy. The shadow economy risk on biomass energy sector is calculated according to the formula:
Based on the data of Lithuanian regions and the developed index, the analysis of the impact of the shadow economy in the biomass sector is performed. The study is based on the 2010–2020 data. The study specifies the years 2010, 2015, and 2020. results, thus monitoring changes in the level of the shadow economy. The developed index is universal, adapted to evaluate and compare data from regions in different countries. The Lithuanian example is chosen as of the history of biomass use and the amount of data available for research.
In 2010, the size of the index was low in all municipalities, due to the fact that the development of biomass energy was relatively low. The country was dependent on imported fossil resources, and local biomass was used mainly in those regions that did not have access to gas networks. According to the data of 2010, the highest values of the index are in Eastern Lithuania, which is rich in wood resources. Meanwhile, in southern Lithuania, which was the first to use biomass, the influence of the shadow economy reduced the values of the index. Although the region is rich in biomass resources, their non-transparent management has led to a low index value. In Central Lithuania, the lowest values of the index are recorded. This is due to the underdevelopment of the biomass energy sector and weak economic activity.
In 2015, the values of the index increased mainly due to the growing consumption of biomass. This made it possible to monitor the change in the indicator and the impact of the shadow economy. Analyzing the dynamics of the index seeing is a clear trend—the value of the index is growing the slowest in Southern Lithuania, whose energy system is mainly based on local biomass. This is due to the components of the shadow economy, such as high unemployment and compensation rates and low personal income tax revenues. It shows that the municipalities of Southern Lithuania are unable to use the available natural resources to increase economic prosperity. On the other hand, the breakthrough of Western Lithuanian municipalities shows opportunities to develop regional economies with significantly less biomass resources. This suggests that less unaccounted for biomass is produced in these regions, which is a key driver of the sector’s shadow economy. Better resource accounting allows municipalities to generate more revenue from employee taxes.
In 2020, as biomass consumption continued to grow, the values of the index rose steadily across the country. The highest growth rate is observed in the municipalities of Eastern and Western Lithuania. At the same time, a paradoxical situation was observed—Central Lithuania, characterized by a relatively lower amount of biomass resources, started to outperform Southern Lithuania with the highest level of forestry and forest sector enterprises. This also confirms the ideas presented in the theoretical part that a large number of recipients of social benefits or other discounts results in a lower product in the regions. This assumption is confirmed by official data, but it cannot be ruled out that production volumes would also be higher included the shadow economy.
The analysis of the data showed that forested regions are not able to use the available competitive advantage (raw materials) and lag behind less forested regions, which later became involved in the biomass business. Unskilled workers in forested areas are likely to participate in the shadow labor market. This reduces the region’s performance and the amount of biomass produced in the region. The threat of shadows in the biomass energy sector stems from illegal work and unaccounted for biomass. Manifestations of the shadow economy in Lithuania are localized both geographically and economically. To reduce the level of the shadow economy, it is necessary to use smart biomass accounting technologies that prevent unaccounted biomass from entering the market. At the same time, this would reduce the level of shadow unemployment by ensuring the traceability and quality of prepared biomass.
5. Conclusions
In this research, a model of the impact of the shadow economy on the biomass energy sector was developed, assessing the markets for primary and final products. The main directions of the emerging shadow economy in the biomass energy sector have been found to be the extraction of poor-quality biomass using illegal work, stimulating deterioration of the environment and the violation of the principles of sustainable development. The case of Lithuania was chosen for the development of the model—he country has increased the consumption of biomass almost four times in a decade and created a sustainable biomass harvesting sector. However, the creation of a new business branch inevitably leads to certain control gaps that could be detrimental to the competitiveness of companies in the sector.
The development of the model has shown that the emergence of the shadow economy in the market of production factors affects not only the market participants in this market, but also the overall economic value created in the market for final products. Non-transparent biomass extraction and illegal work have the same negative effects and are often inseparable from the shadow activities.
In order to avoid elements of the shadow economy, it is recognized that investment is needed in the latest digital technologies, monitoring the process of biomass preparation from inception to its entry into power plants and its conversion into energy.
Preventing the shadow economy in the energy sector would enrich the region’s and the country’s economy by making employment policies more transparent, thus increasing tax collection. Businesses operating in the shadow market would become uncompetitive, thus freeing up space for legal business units. Controlling the shadow economy with energy would create the conditions to protect the environment by controlling biomass production, thus avoiding damage to forests or other land.
It is recommended to constantly monitor the data related to the amount of social allowance, unemployment, and minimum wage. A sudden growth in these indicators would indicate an increase in the size of the shadow economy. In this case, a regional analysis is needed to increase employment and regional incomes. States need to initiate legislative changes to ensure that the minimum wage is paid only for unskilled work. At the same time, it is necessary to strengthen the State Tax Inspectorate by providing opportunities to advise new businesses on tax issues.
6. Limitations of the Study and the Future Research
The main limitations of the study are the lack of data. In some cases, aggregated regional (non-municipal) data were provided, which limited the scope for analyzing aspects of specific municipalities. The problem was solved by selecting the most important indicators from all perspectives of sustainable development.
Future research is planned to continue research into the shadow economy through the prism of state losses. In addition, the further contribution of other parts of the energy sector to the reduction in the shadow economy will be explored.


