Article

Diagnostics on the Basis of the Frequency-Temperature Dependences of the Loss Angle Tangent of Heavily Moistured Oil-Impregnated Pressboard

1
Department of Electrical Devices High Voltage Technology, Faculty of Electrical Engineering Computer Science, Lublin University of Technology, 38A, Nadbystrzycka Str., 20-618 Lublin, Poland
2
Department of Electronics, Faculty of Electronics and Computer Science, Koszalin University of Technology, 2, Sniadeckich Str., 75-453 Koszalin, Poland
3
Department of Measurement and Application Electrical Engineering, University of Zilina, 8215/1 Univerzitná, 01026 Zilina, Slovakia
*
Author to whom correspondence should be addressed.
Energies 2022, 15(8), 2924; https://doi.org/10.3390/en15082924
Submission received: 13 March 2022 / Revised: 12 April 2022 / Accepted: 13 April 2022 / Published: 15 April 2022

Abstract

:
The aim of this study was to perform precision measurements of the frequency-temperature dependences of the loss angle tangent of the liquid-solid composite with the FDS Dirana meter. The composite consisted of heavily moistered oil-impregnated pressboard. The moisturization of the pressboard occurred in a manner as close as possible to the process of wetting the insulation in power transformers to a moisture content of (5.0 ± 0.2) wt. %. This value of moisture content was chosen because exceeding this value can lead to transformer failure. The measuring temperature range was from 293.15 K (20 °C) to 333.15 K (60 °C), with a step of 8 K. The measuring frequency range was 0.0001 Hz to 5000 Hz. It was observed that the shape of the frequency dependence of the loss angle tangent for a moisture content of 5.0 wt. % does not depend on the value of the measuring temperature. An increase in temperature leads to a shift of the waveforms into the higher frequency region. This is associated with a decrease in the relaxation time, and its value depends on the activation energy. It was found that a good fit of the waveforms, simulated by Dirana, to the actual tgδ waveforms obtained at temperatures between 293.15 K (20 °C) and 333.15 K (60 °C) requires the introduction of temperatures, higher than the actual insulation temperatures, into the program. It was found that estimating the moisture content for different temperatures using Dirana soft-ware for insulating an oil-impregnated pressboard produced large discrepancies from the actual content. Better results were obtained after an adjustment requiring manual temperature correction towards higher, compared to measured, temperatures. The moisture content estimated after correction by the Dirana meter ranges from of 4.5 wt. % to 5.7 wt. % and increases almost linearly with increasing measuring temperature. The average moisture content estimated by the Dirana meter for all measuring temperatures is 5.1 wt. % and is close to the actual content (5.0 ± 0.2) wt. %. The uncertainty of the estimate is ±0.43 wt. % and is more than twice as high as the true value.

1. Introduction

The insulation of oil transformers has hardly changed from the first constructions to the present day. For its construction, they use cellulose materials in the form of winding paper and pressboard. Once made, the core and windings are placed in a transformer tank, dried, and covered with insulating oil. This improves the insulation properties by impregnating the cellulose with oil. Practically until the end of the last century, the basic insulating materials were cellulose materials and petroleum-based mineral oil [1]. In the 20th century, improvements were made to increase the electrical strength of transformer insulation, including, first of all, the vacuum drying of insulation and treatment of mineral oil before it is filled into the tank, as a result of which oil moisture is reduced to 3–7 ppm and dissolved gases are removed [2,3,4]. Filling the ladle with oil is also done under vacuum. This improves the electrical strength of the insulation, accelerates impregnation, and reduces the probability of remaining gas bubbles, which are the source of partial discharges [5]. In the last few decades, aramid paper has started to be used for insulation in some transformers [6,7]. Increasingly, mineral oil has been replaced by other insulating liquids, such as synthetic and natural esters [8,9,10,11,12,13]. In recent years, an alternative to esters has emerged. Insulating bio-oils have been developed. Their production technology is identical to that of mineral oils, but they are made not from oil but from natural raw materials. One example of such oil is Nynas NYTRO BIO 300X [14]. Its electrical strength is similar to that of mineral oil [15]. The great advantages of this oil in comparison with mineral oil are lower viscosity and higher heat capacity [14,16,17,18]. This improves the cooling conditions of transformers. The high biodegradability of bio-oil makes it more environmentally friendly than mineral oil. The technology of manufacturing transformers using esters or bio-oils is the same as the technology using mineral oils.
The cellulose moisture content of a newly built transformer is approximately 0.8 by weight (wt. %). Power transformers are designed for a service life of at least 25 years. During this time, moisture penetrates slowly into the transformer tank, where the moisture dissolves in the oil. By circulating the oil, water molecules are delivered to the cellulose, which absorbs it. This is due to the fact that the solubility of moisture in the pressboard is about 1000 times higher than in the insulating oil [19]. Over a service life of more than 25 years, the concentration of water in the cellulose components of the insulation can reach a level of 5 wt. % or even higher. The value of 5 wt. % is in a way a limit value, which, if exceeded, may cause a threat of transformer breakdown [20,21,22]. The detection of the state of threat allows for its elimination through, for example, the vacuum drying of insulation. The best method for determining the moisture content in cellulose is the chemical Karl Fischer titration method [23]. Unfortunately, because the transformer is airtight, it is not possible to take a sample of the pressboard from it for chemical analysis. Non-destructive electrical methods are currently used to estimate the moisture state. Among these are Polarization Depolarization Current (PDC) [24,25,26], Frequency Domain Spectroscopy (FDS) [27,28,29,30], and Return Voltage Measurement (RVM) [31,32,33]. These methods are based on measurements of a number of electrical properties of the insulation, which depend on the level of cellulose moisture. Among the above-mentioned methods, the FDS method is currently considered to be the most effective one by the units dealing with diagnostics and repairs. Modern FDS meters, apart from the electrical parameters of the insulation, allow one, using dedicated software, to estimate the level of moisture in the pressboard. It has recently been established that the moisture content estimated by one of the FDS meters does not coincide with the actual water content of the cellulose component [34]. Undoubtedly, the pressboard impregnated with insulating oil is a two-phase composite material. Its absorption of moisture causes the composite to become three-phase. DC studies of the three-phase cellulose-insulating oil–moisture composite showed that its conductivity is determined by the presence of water. The conduction of the current takes place by the quantum mechanical phenomenon of electron tunnelling between water molecules [35], whereas in works [36,37] it was established that water in a three-phase composite is in the form of nanodrops with diameters of about 2.2 nm, containing about 200 water molecules each. There is a quantum mechanical phenomenon of electron tunnelling from one nanodrop to another, which causes current flow and dipole formation. This results in additional polarisation of the material [38,39]. An important factor in the tunnelling phenomenon is the dielectric relaxation time. After its expiry, the positive field of the charged well causes the electron to return to the well from which it started tunnelling. This results in the disappearance of the dipole. The value of the relaxation time is strongly influenced by the average distance between nanodrops, the dielectric permeability of the material, and the temperature [37].
Insulation condition diagnostics by the FDS method are largely based on measurements of the frequency dependence of the loss angle tangent [40]. The insulation system of power transformers is very complex. It is a complex cylindrical system, which includes barriers and baffles made of pressboard and oil ducts. CIGRE in publication [41] recommended the use of a simplified transformer insulation model. This is a series-parallel planar capacitor in which the barriers are replaced by one of thickness X and the baffles are replaced by one of width Y. A single oil channel was also created. The application of the XY CIGRE model in a certain way simplifies the analysis of the results of power transformer insulation diagnostics based on the frequency dependence of the loss angle tangent.
In [42], an analysis of the temperature-frequency dependence of tgδ(f) of a three-phase composite with a moisture content from 1 wt. % to 4 wt. % was performed. It was found that dielectric relaxation of dipoles, formed by electron tunnelling between water nanoparticles, occurs in the ultra-low and low-frequency regions. The shape of the tgδ(f) waveforms depends only on the moisture content, and their position with respect to the double-logarithmic coordinates is determined by temperature. In order to analyse the state of moisture in the cellulose component of power transformer insulation, laboratory tests using the FDS method should be carried out to obtain the so-called calibration characteristics, otherwise known as reference characteristics. Using them, it is possible to obtain information about the state of the solid component of the transformers’ insulation on the basis of their FDS tests.
The aim of this study was:
  • The moisturize the pressboard in a manner as close as possible to the process of wetting the insulation in power transformers to a moisture content of (5.0 ± 0.2) wt. %. This value of moisture content was chosen because exceeding this value can lead to transformer failure.
  • To carry out precision measurements of the frequency-temperature dependences of the loss angle tangent of the composite with the Dirana meter.
  • To match simulated waveforms with experimental waveforms using the meter software, estimating the moisture content of moisture-impregnated insulating oil. The quality of the moisture determination by the Dirana meter is gauged by comparing the results obtained with the actual moisture content.

2. Materials and Methods

2.1. Materials

For the preparation of samples for testing, a moisture method was developed that was as close as possible to the natural moisture process of the pressboard in power transformers [43]. The sample preparation process was as follows. The plate of the pressboard to be tested was vacuum-dried and, leaving it in vacuum, flooded with oil, which resulted in its impregnation. Then, the two plates of the pressboard were vacuum dried, moistened in the traditional way in atmospheric air [44,45,46,47,48,49], and impregnated with insulating oil. These plates served as the moisture source for the dry plate. The moisture source pressboard plates were then placed in a vessel, with oil underneath and above the dry impregnated sample. Supports were placed between the dry and moisture pressboard plates to prevent direct contact between them. Moisture from the damp plates penetrated into the oil. The oil delivered the water to the dry plate, where it was absorbed. This is a process identical to the wetting of the pressboard in transformers. The wetting process took about 18 months. Several wafers with a water content of (5.0 ± 0.2) wt. % were prepared for testing. This involved limiting the moisture content above which catastrophic failure of the transformer can occur. The insulating materials used in this study are intended for use in power transformers. In the study, the electrotechnical pressboard made by Weidman and mineral insulating oil made by Nynas were used. The oil was vacuum-treated at Energo Complex Sp. z o.o. (Piekary Slaskie, Poland). The moisture content of the oil was in the order of a few ppm.

2.2. Methods

The schematic diagram of the system (Figure 1), on which investigations of the tangent angle of loss of moisture pressboard were carried out, has been described in papers [50,51,52,53]. The measurements were performed using a three-electrode measuring capacitor.
A plate of pressboard is used for the test, moistened as described in Section 2.1. The pressboard is placed in a three-electrode measuring system between the voltage (3) and measuring electrodes (2). The system with the test sample is placed in a hermetic vessel flooded with insulating oil. The vessel is placed in a thermostat that maintains the set temperature over a number of hours. The uncertainty of temperature maintenance does not exceed ±0.01 K. Loss angle tangent measurements were performed with a DIRANA meter–FDS-PDC dielectric response analyser (OMICRON Energy Solutions GmbH, Berlin, Germany). In the frequency range from 10−3 Hz to 5000 Hz, 10 measurement points per decade were performed, and in the range from 10−4 Hz to 10−3 Hz, 6 points per decade were performed. Measurements were performed at six measurement temperatures from 293.15 K (20 °C) to 333.15 K (60 °C), with a step of 8 K.
The first temperature at which measurements were performed was 293.15 K (20 °C). Once stabilised, the measuring system was connected to the Dirana meter. Measurements were started at the highest frequency of 5000 Hz. Subsequent measurement frequencies were set up to a frequency of 0.0001 Hz. The next temperature was set, and after it had stabilised, further measurements were taken.

2.3. Tangent Angle Loss Measurements of Insulating Materials. Theoretical Background

The tests were carried out with a planar capacitor in a parallel equivalent diagram, shown in Figure 2a. In this figure, CP is the capacitance of an ideal capacitor, whereas RP is the ideal resistance. The conduction and capacitive current vectors, as well as the phase shift angle φ and loss angle δ, are shown in Figure 2b.
Frequency Domain Spectroscopy (FDS) meters measure, in parallel or series, equivalent schemes two fundamental values from which it is possible to determine other dielectric parameters. In the parallel equivalent scheme, these are the values of the phase shift angle φ and the admittance Y. In the series equivalent circuit diagram, these are the values of impedance Z and phase shift angle θ. The value of admittance (impedance) is determined from the quotient of the supply voltage amplitudes and the current [54]. The values of admittance and impedance are related to each other by the formula:
Y = V i = 1 Z ,
where: Yadmittance, Vsupply voltage amplitude, icurrent amplitude, and Zimpedance.
The phase shift angle in the parallel equivalent circuit φ is calculated from the difference of angles for which zero values appear on the current and voltage waveforms. During measurements in the series equivalent circuit, the value of the phase shift angle module, in this case denoted as θ, remains unchanged. Only its sign changes:
φ = θ .
To analyse the condition of the cellulose-oil insulation of power transformers, the most commonly used value is the tangent of the loss angle tgδ. To determine tgδ, the phase shift angle modulus φ is needed. According to the definition, the value of tgδ is (see Figure 2b):
t g δ = I R I C = cos φ sin φ = c t g φ .
It follows from Figure 2b that in a parallel substitution scheme:
I R = U R P ,
I C = U ω C P .
By substituting the values from Equations (4) and (5) into Equation (3), we obtain:
t g δ = I R I C = U R P U ω C P = 1 R P ω C P .
For a flat capacitor with a homogeneous dielectric, having losses:
R P = d σ S ,
where σconductivity, d—the thickness of tested insulating material, and S—the surface area of the lining of measuring capacitor.
C P = ε ε 0 S d ,
where εthe dielectric permeability of the tested material, ε0the dielectric permeability of the vacuum, d—the thickness of the tested insulation material, and S—the surface area of lining of the measuring capacitor.
By substituting Formulas (7) and (8) into Formula (6), we obtain:
t g δ = 1 R P ω C P = σ S d ω d ε ε 0 S = σ ω ε ε 0 .
Equation (9) shows that the loss angle tangent is a function of three variables: circular frequency, conductivity, and permeability. The conductivity σ describes the ability of a material to conduct the electric current. The dielectric permeability ε characterises the material’s ability to polarise. These parameters are electrical material parameters. The use of the tgδ value to measure the homogeneous insulating material in a planar capacitor provides some information about the quality of the insulation and eliminates the need to consider the geometrical dimensions of the insulation.

3. Study of Loss Tangent of Moistened Pressboard Impregnated by Oil

Figure 3 shows the frequency dependence of the loss angle tangent of a three-phase composite of pressboard–insulating oil–water, moistured in a manner maximally similar to the moisture process in transformers to a water content of (5.0 ± 0.2) wt. %. Measurements were made for six temperatures ranging from 293.15 K (20 °C) to 333.15 K (60 °C). Figure 3 shows that, similarly to the lower moisture contents analysed in [42], the changes of temperature do not cause any changes in the shape of the relation tgδ of the board impregnated with insulating oil and moistured in a manner maximally similar to moisture in power transformers up to the critical moisture content of (5.0 ± 0.2) wt. %. The shape of the tgδ(f) curve depends only on the moisture content.
As the temperature increases, a shift of the waveforms into the higher frequency region is observed. This is associated with a change in the relaxation time, defined by the formula [37]:
τ = τ m 0 exp 2 r R B exp Δ E τ k T ,
where τrelaxation time; τm0numerical value; RBthe radius of the electron localizationthe so-called Bohr radius; ∆Eτthe activation energy of the relaxation time; and r—the average distance between the potential wells, between which the electron is tunnelling.
The average distance between the potential wells is described by the formula:
r X ρ 100 u M H 2 O 1 3 .
In the test sample, the water concentration and with it the average distance between the potential wells are constant values. Therefore, only the temperature dependence of the relaxation time remains. On the basis of 6 curves of tgδ(f), obtained for different temperatures, using Formula (10) the value of the activation energy of the relaxation time of the loss angle tangent was determined, which is ΔEτ ≈ (0.871 ± 0.020) eV.
The next step of the study was to try to match the waveforms, generated by the Dirana meter software, to the experimental tgδ(f) relationships shown in Figure 3.
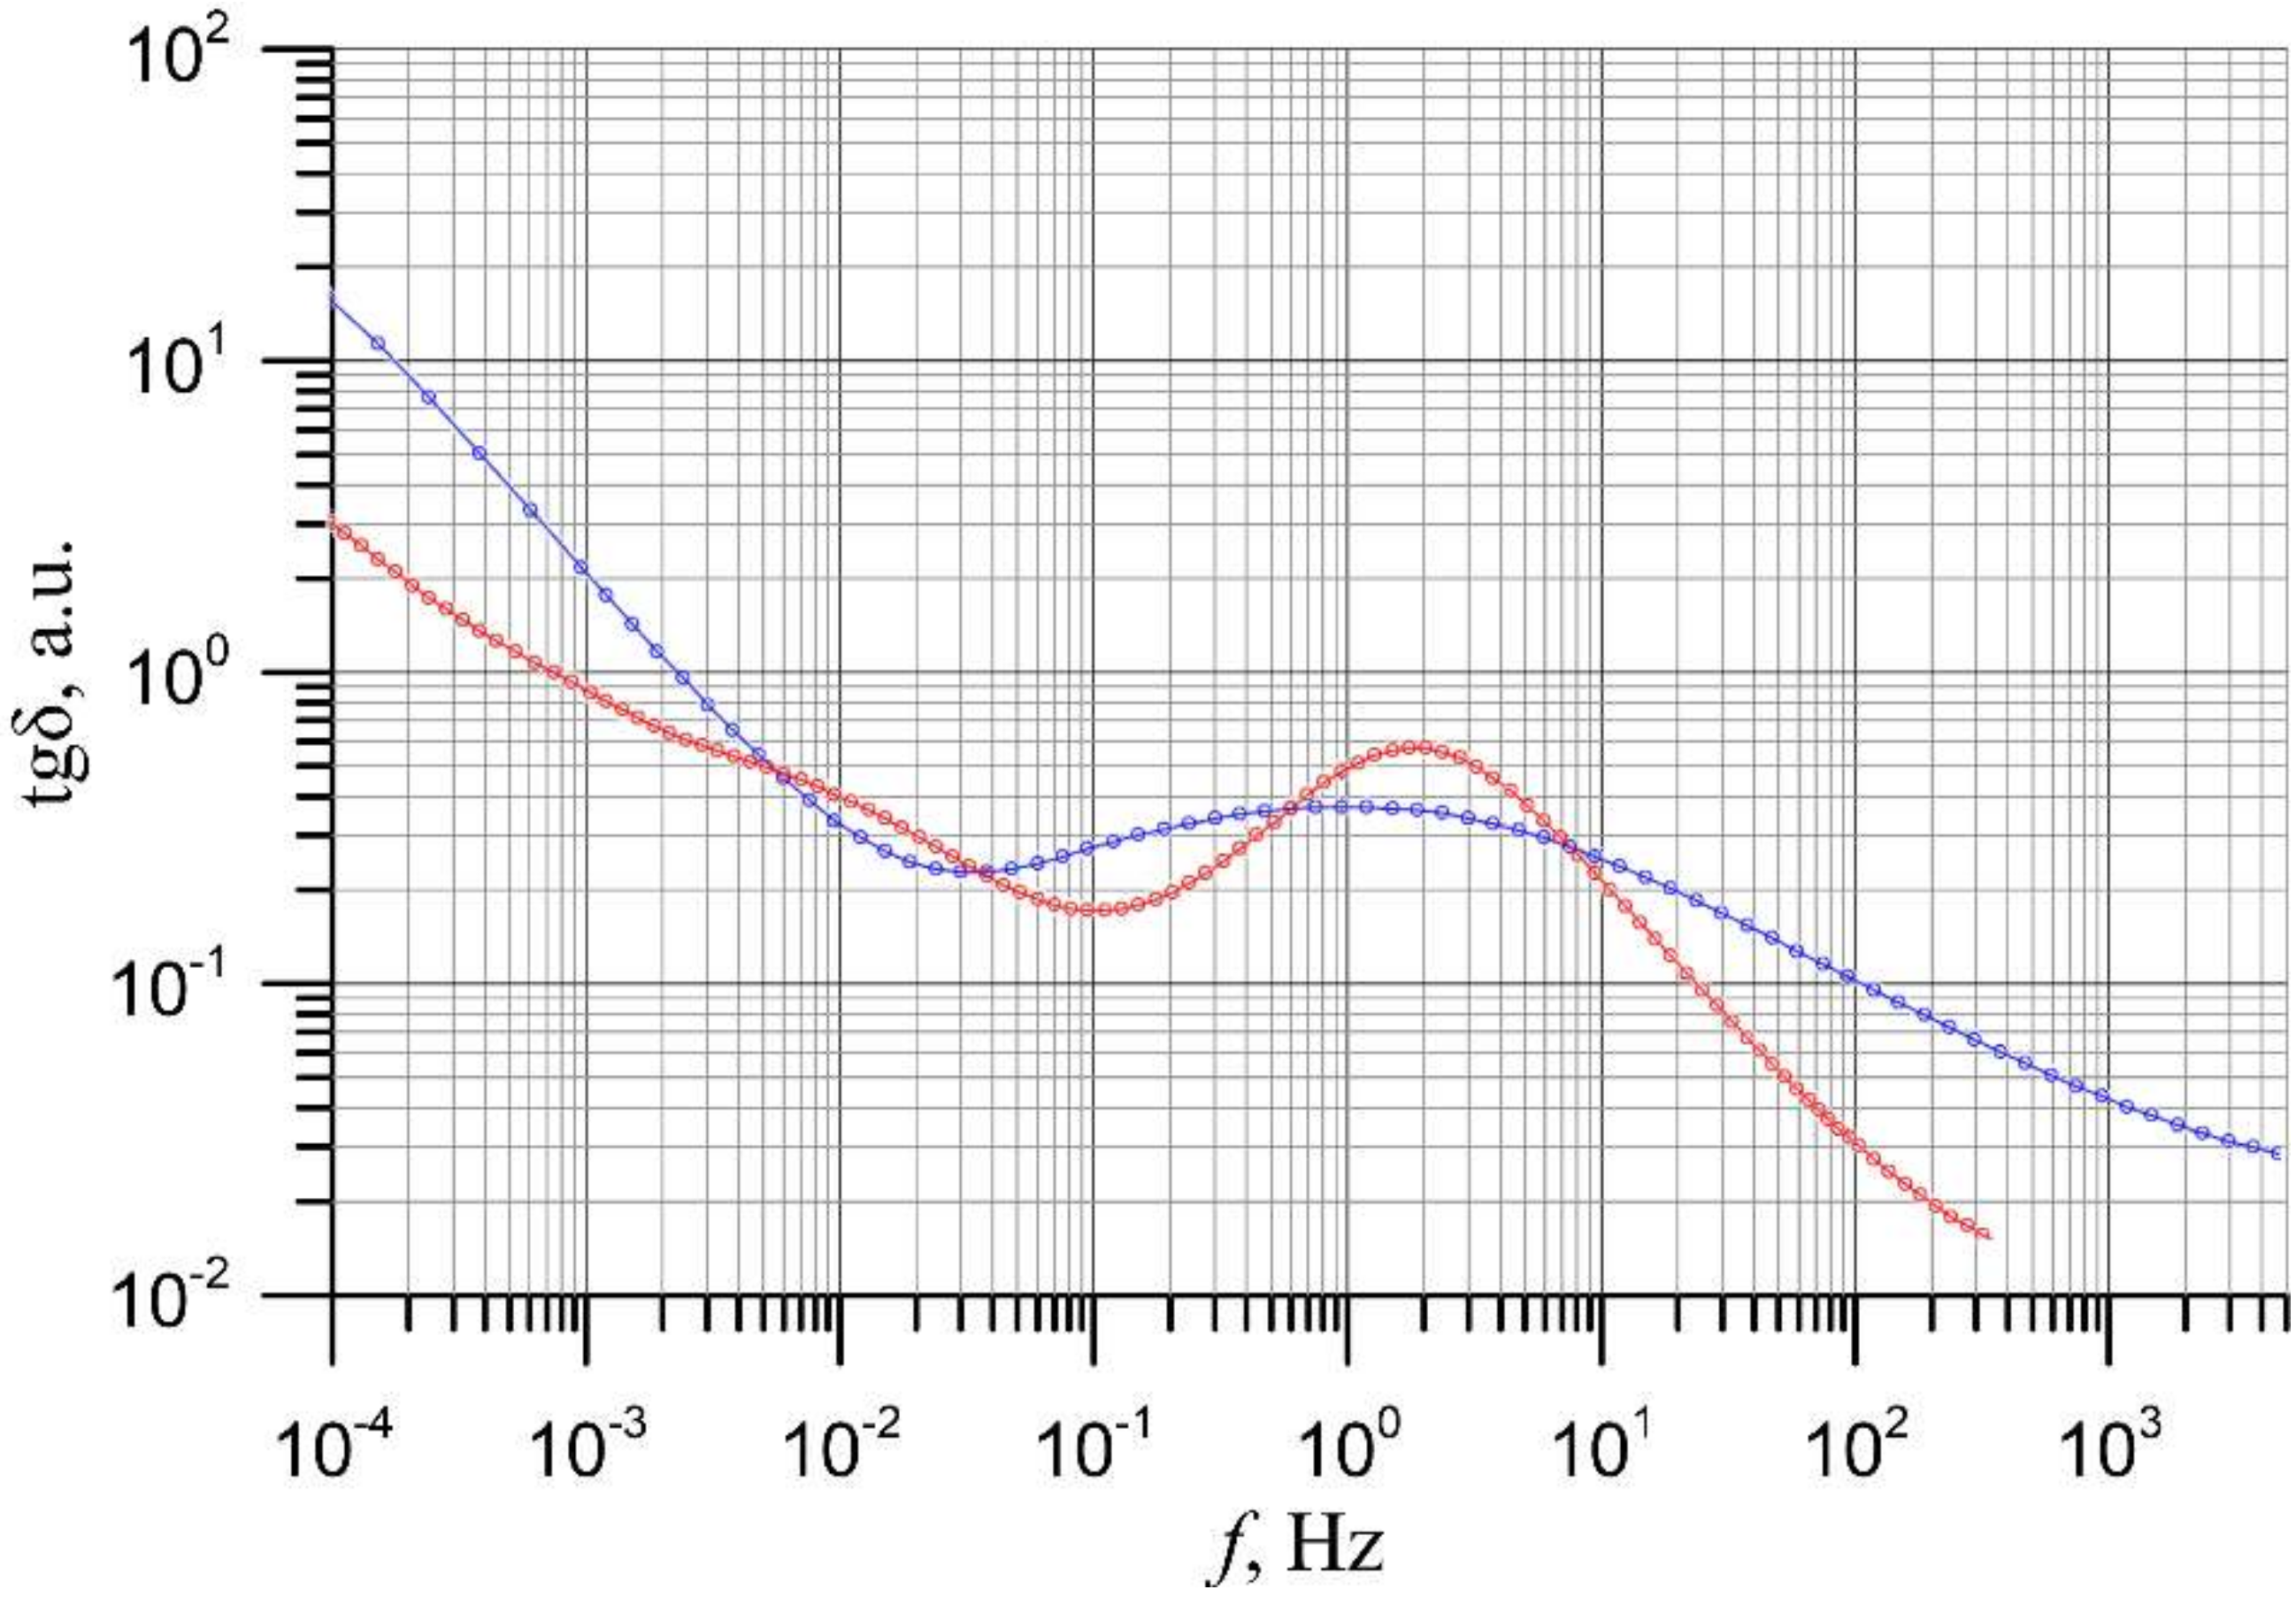
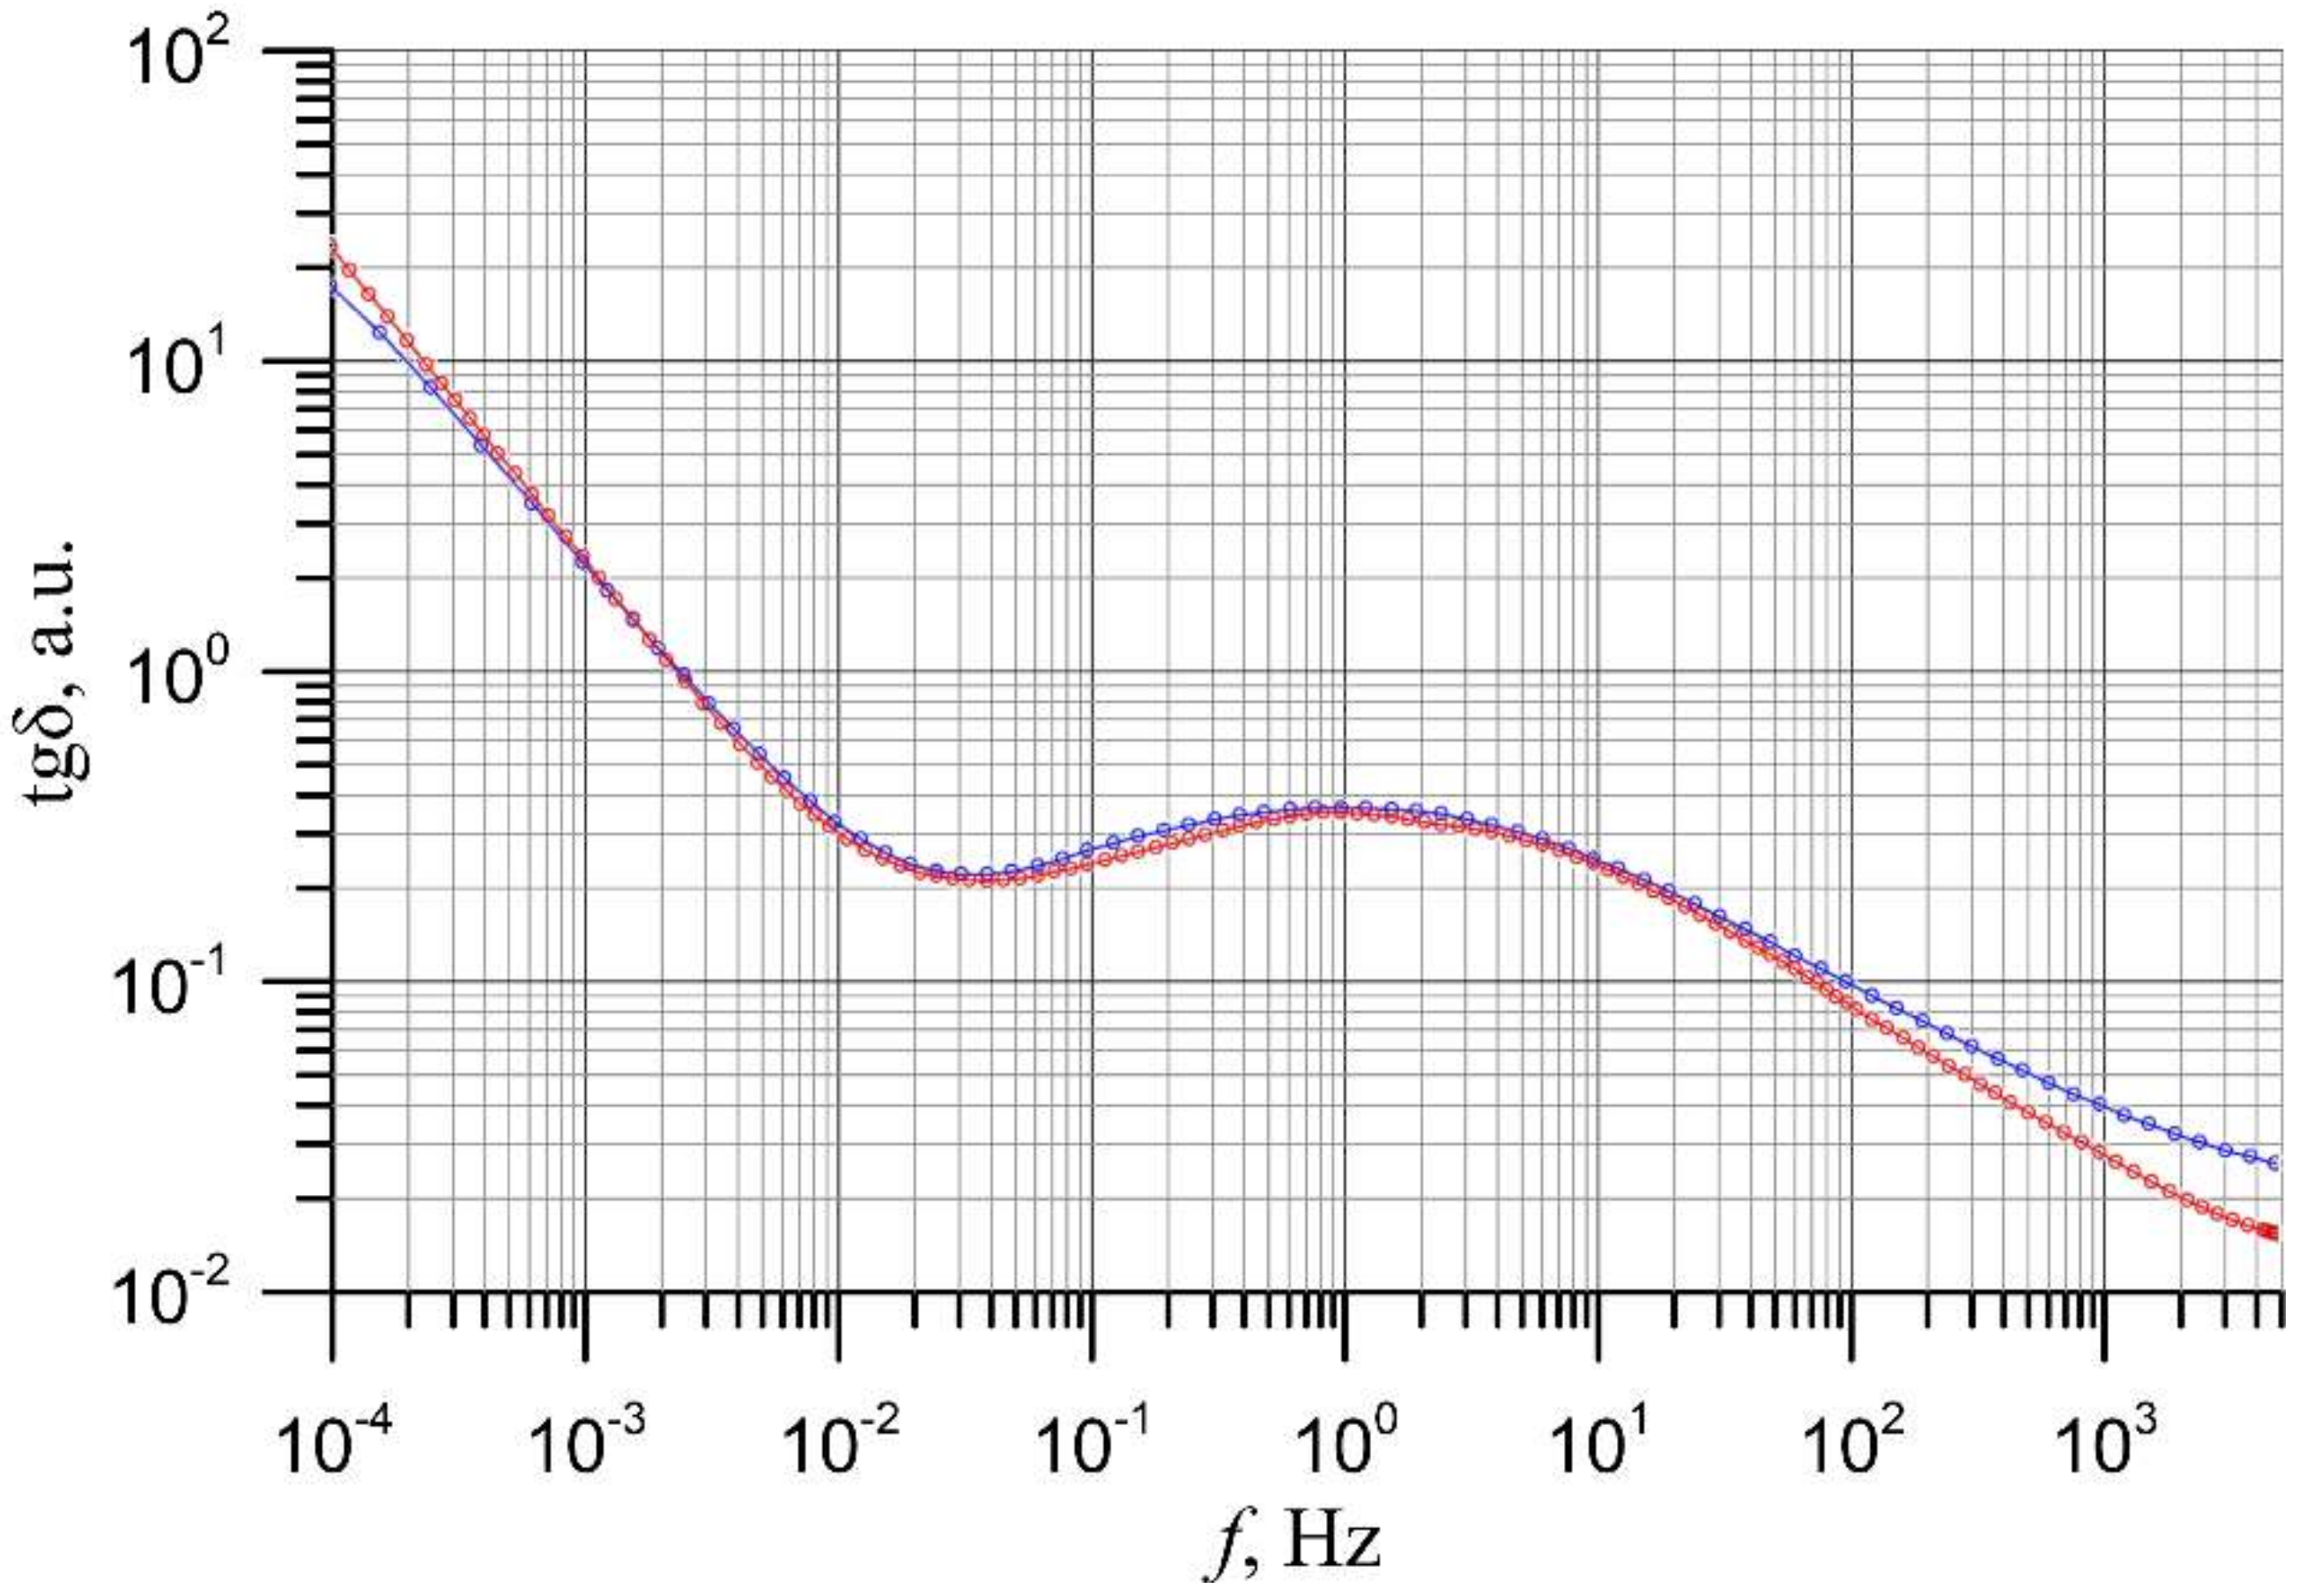
Figure 4 shows a screenshot of the computer screen showing the control panel of the Dirana program, the experimental relationship tgδ(f) obtained at 293.15 K (20 °C), and the fitted waveform. In addition, the program determined the values X = 5% and Y = 91%. This means that the oil content in the channels is very low and amounts to about 8.55% of the volume of the pressboard plate. This is a reflection of the real situation, as the pressboard plate was placed between the flat voltage and measuring electrodes. Therefore, the oil channel contains very little oil. This is due to the slight unevenness of the sample surface compared to the electrode planes. The meter estimated the moisture content at 3.3 wt. %. This is strongly underestimated compared to the actual value, which is (5.0 ± 0.2) wt. %. On the other hand, the shape of the fitted waveform is very far from the one obtained experimentally. On the control panel (Figure 4), there are windows that allow manual changes of the oil conductivity and temperature values. The changes we made to the oil conductivity over the entire changeable range did not improve the fit. On the other hand, changes in temperature significantly improved the quality of the fit. Figure 5 shows the experimental curve obtained at 293.15 K (20 °C) and the fitting results for a temperature of 331.15 K (58 °C), entered manually in the control panel. From the comparison with Figure 4, it is clear that the manual adjustment of the temperature towards increasing the temperature significantly improved the quality of the fit.
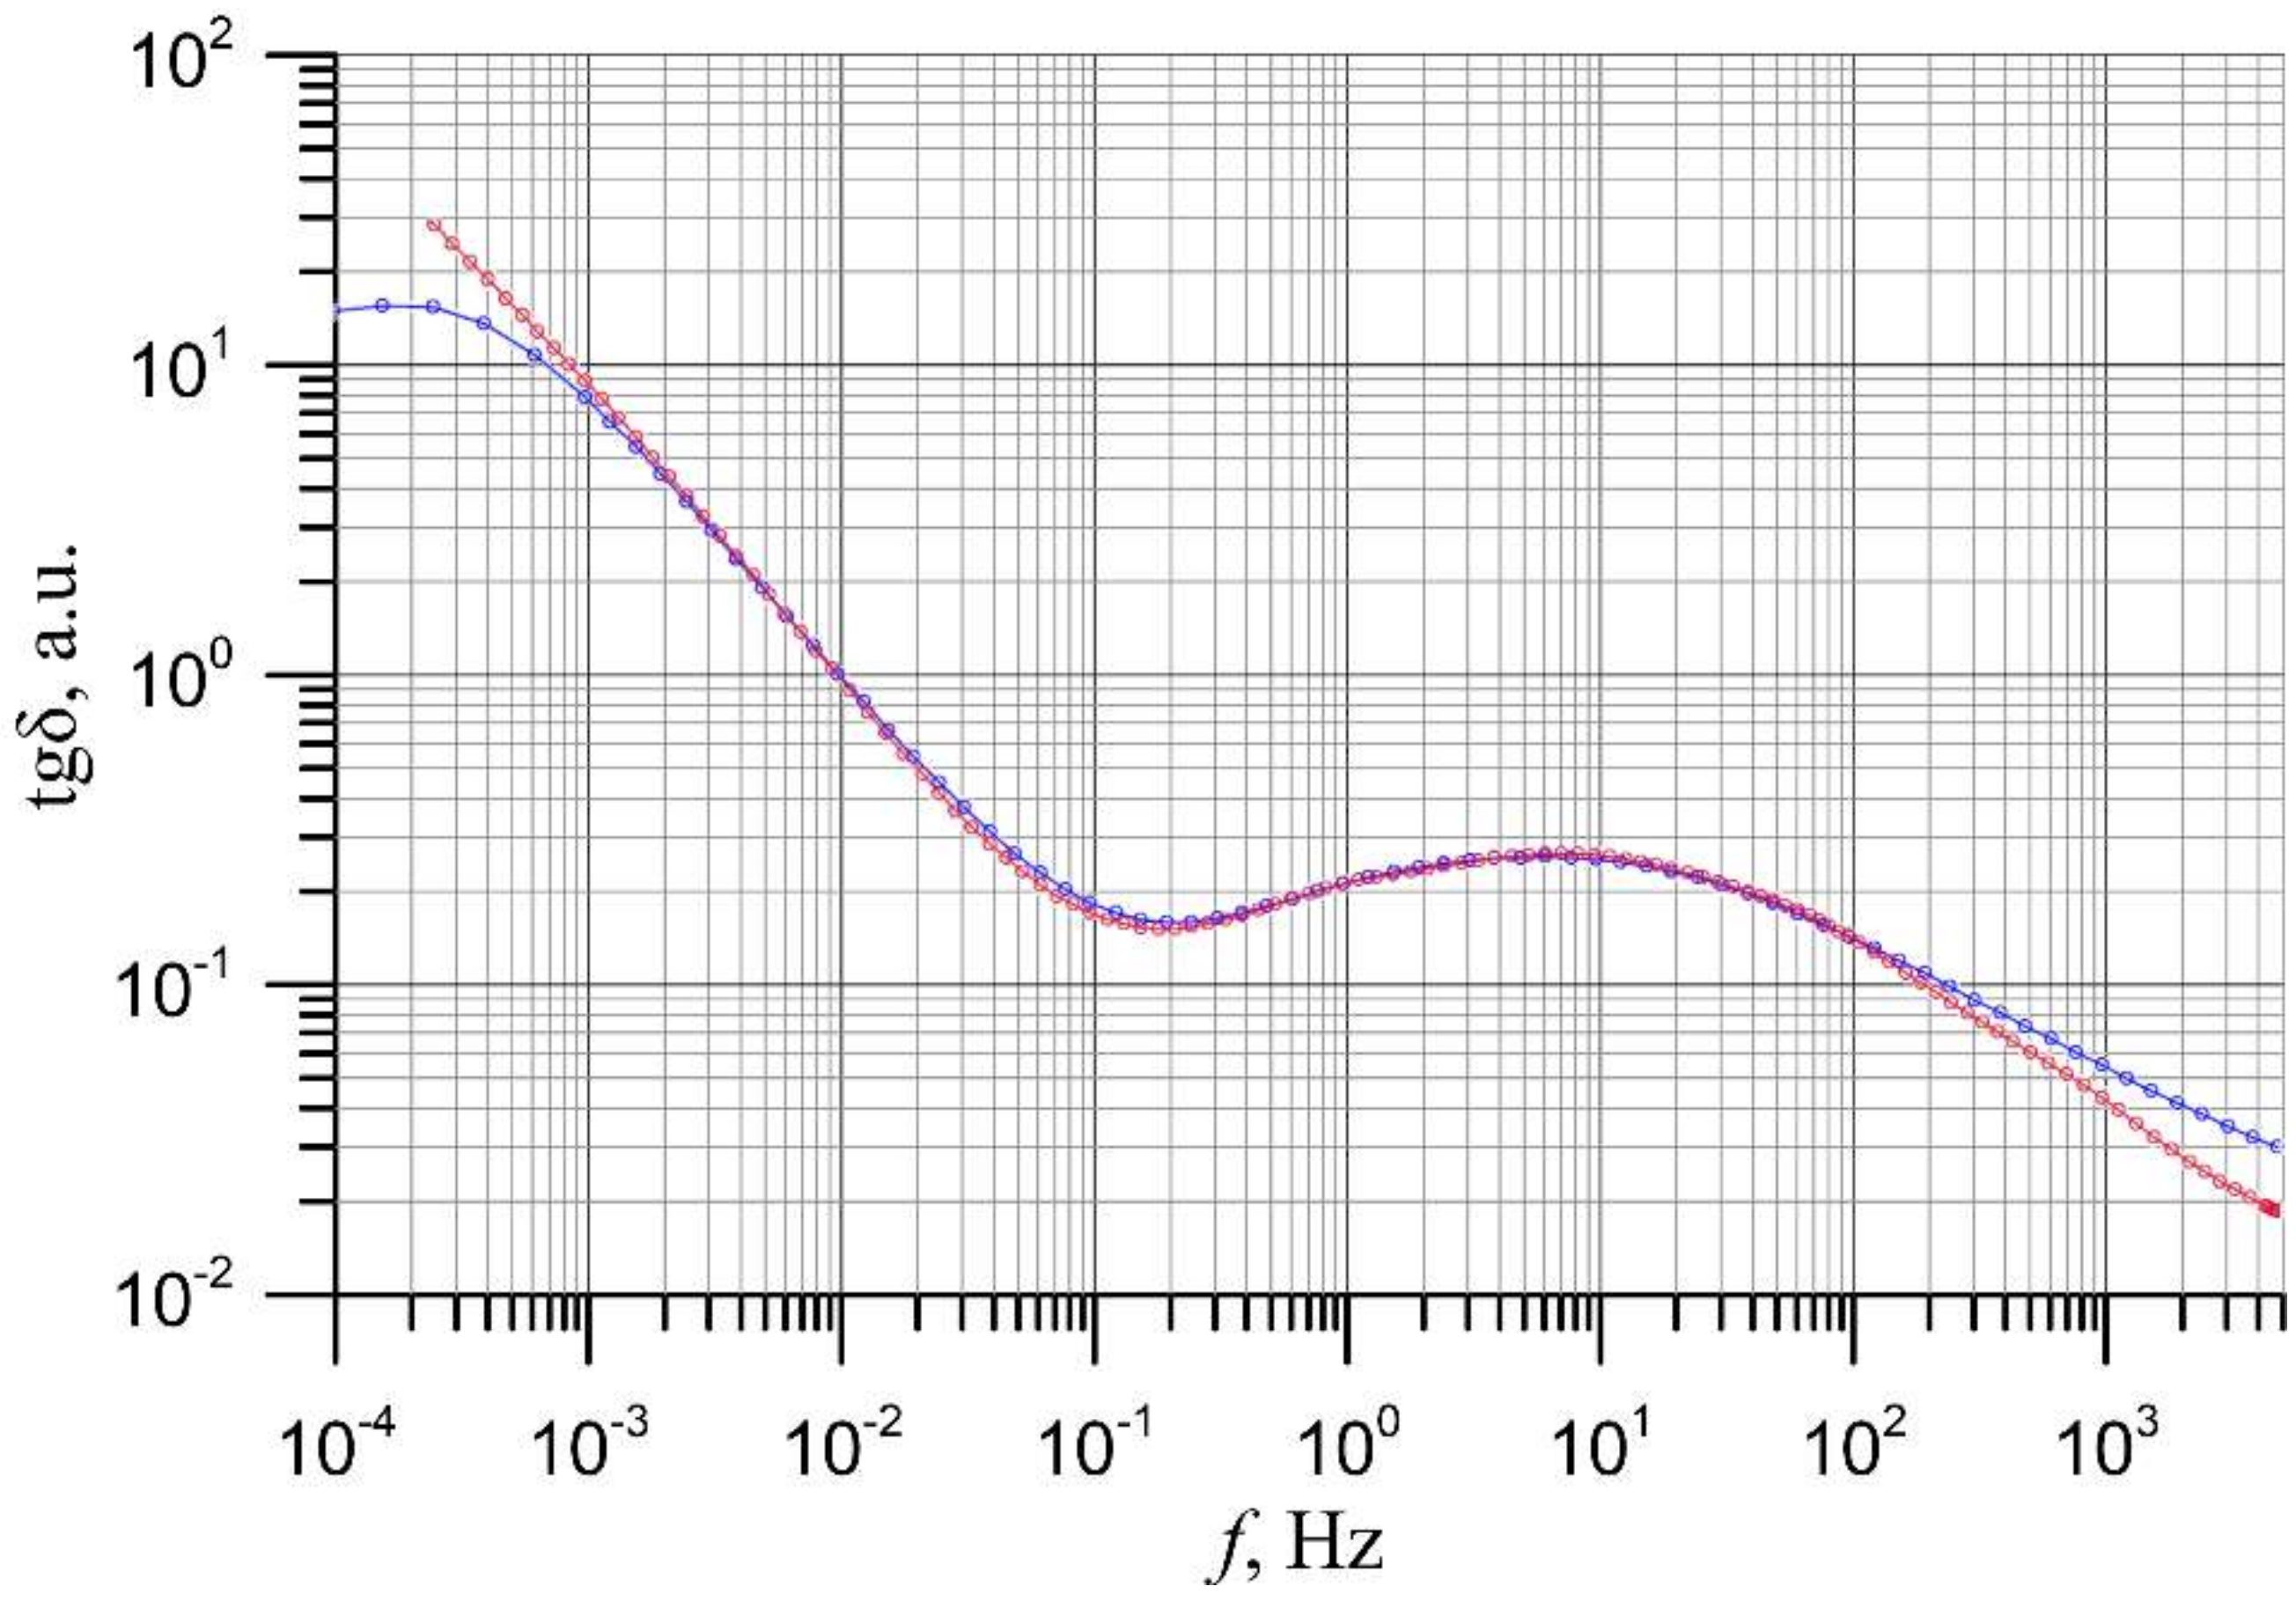
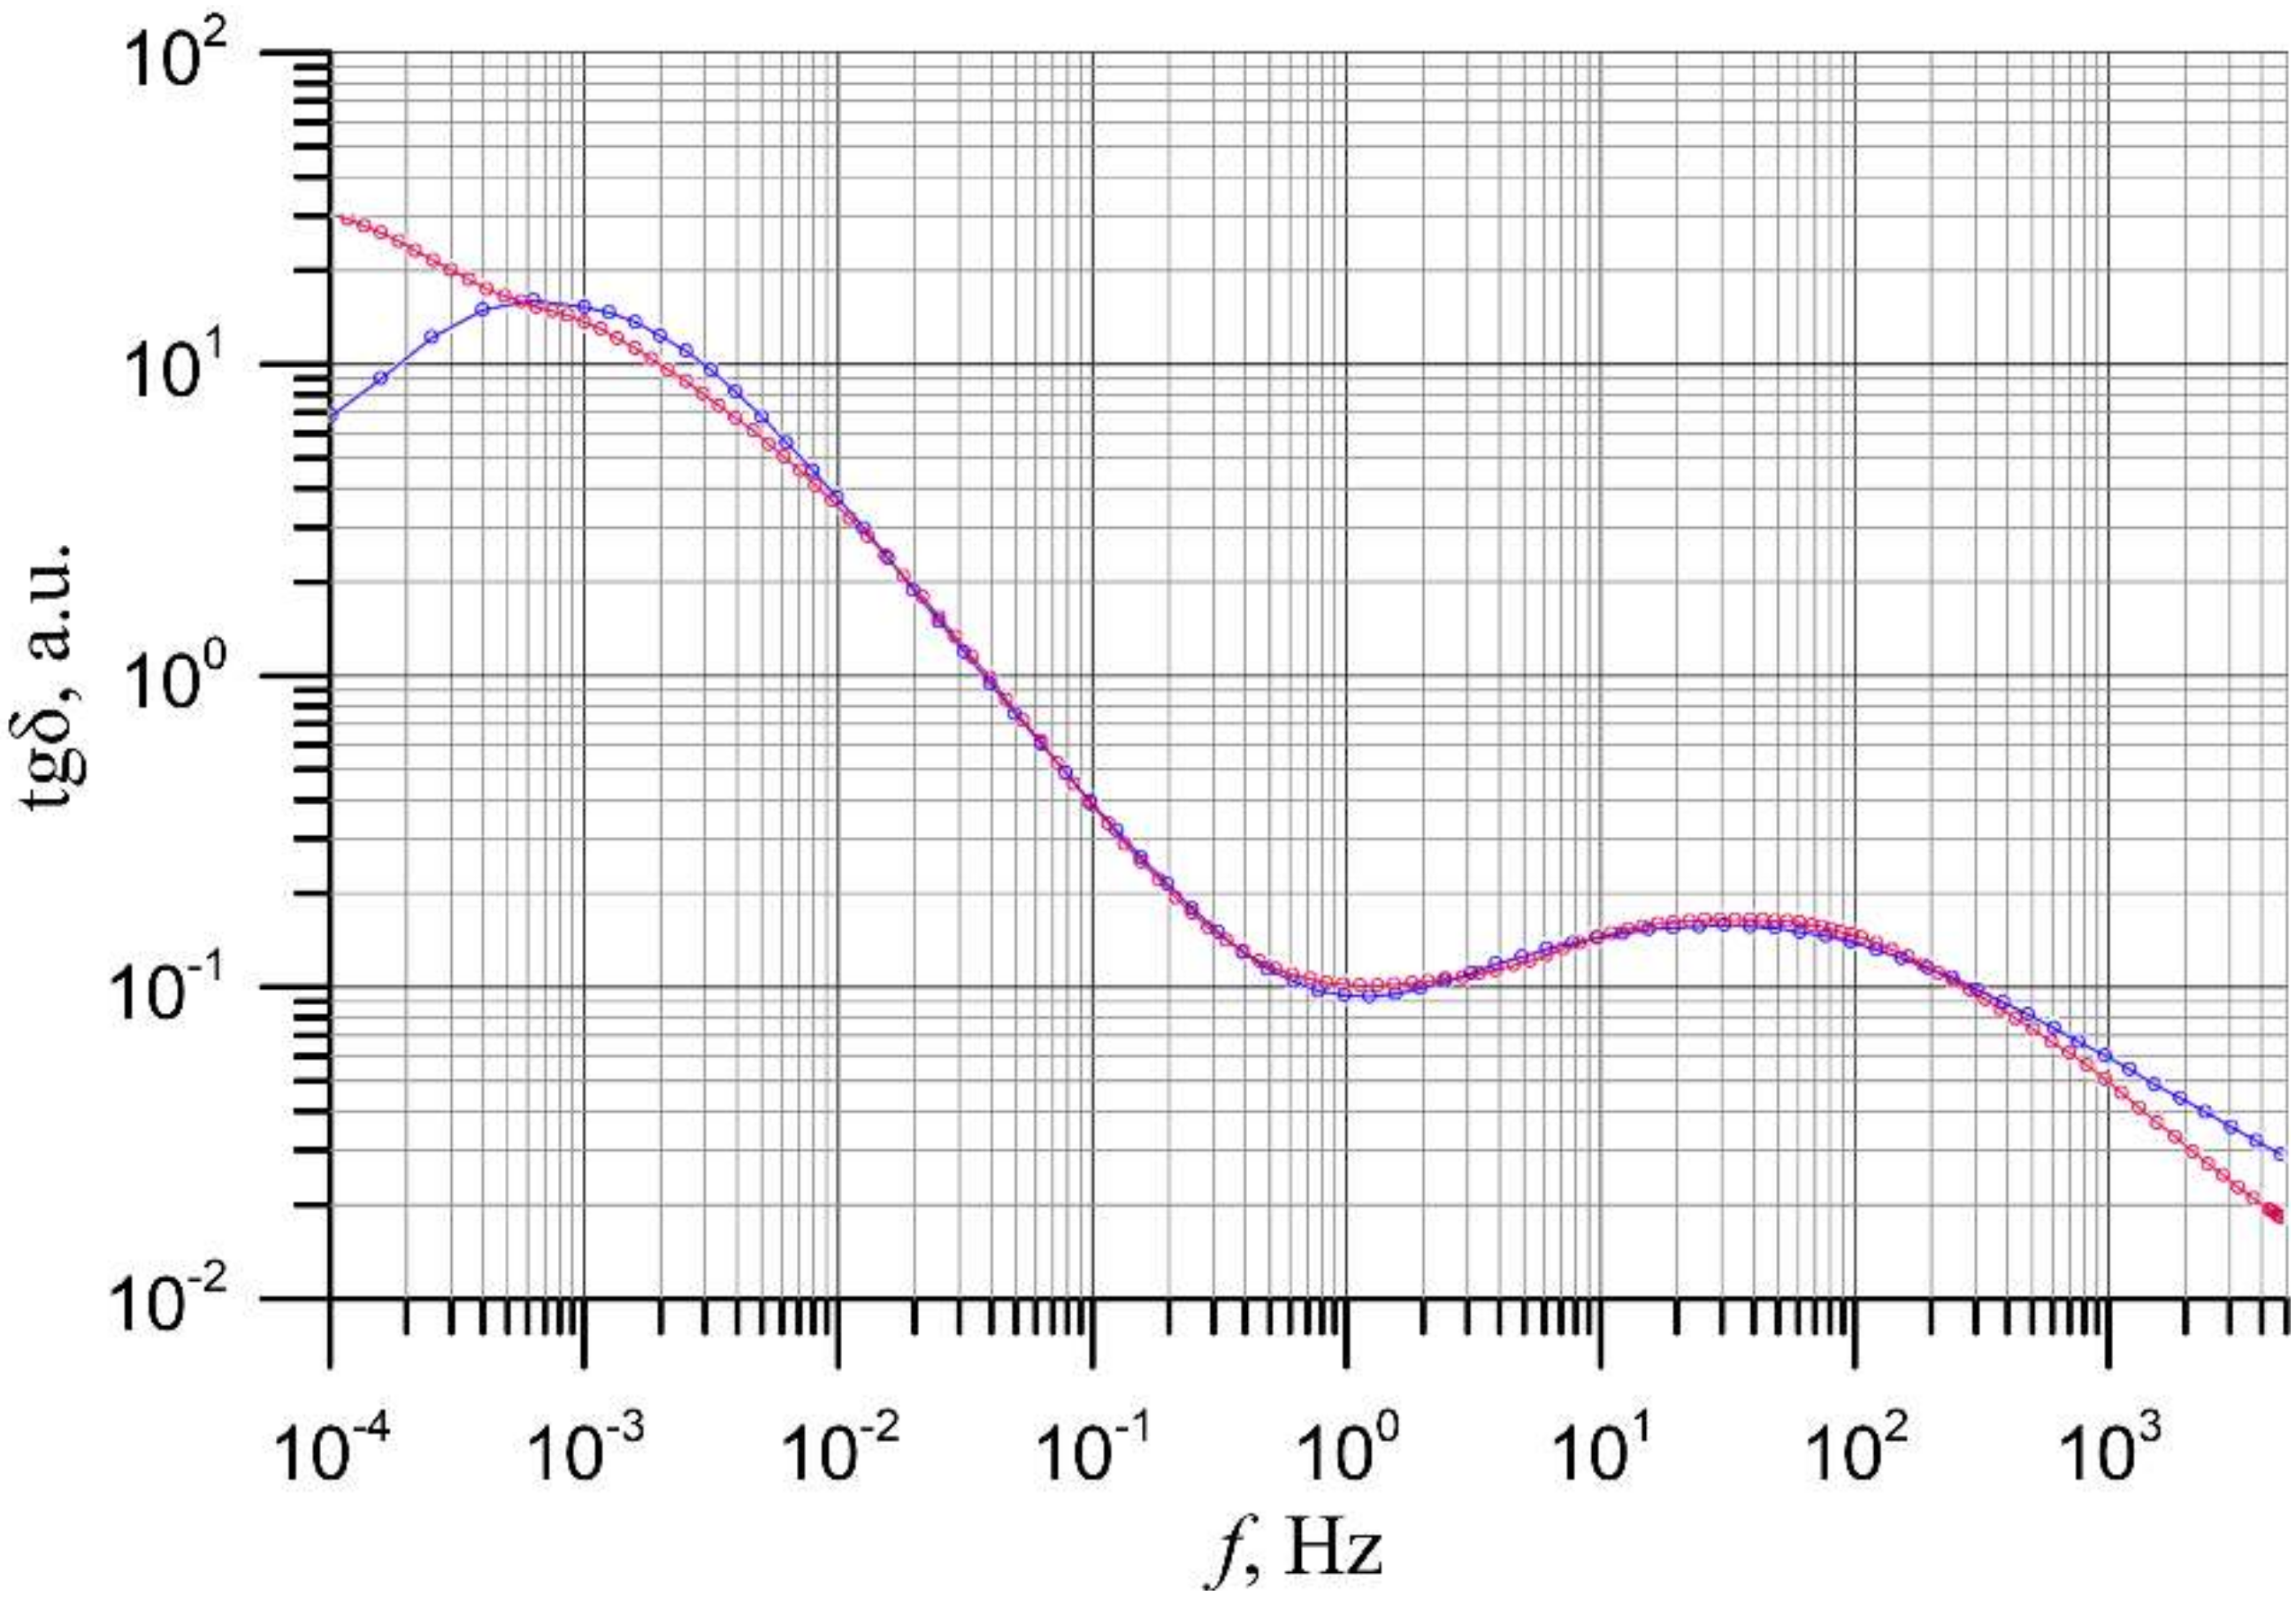
The shapes of the automatic fit from Figure 4 and the manual fit from Figure 5, performed at 293.15 K (20 °C) and 331.15 K (58 °C), respectively, are very different. This concerns, above all, the increase of the slope in the area below 100 mHz and the decrease of the maximum at 1 Hz with increasing temperature. This means that Dirana’s software did not take into account the fact that the shape of the waveforms, obtained experimentally for tgδ(f) of the pressboard, do not depend on temperature (Figure 3). Similar steps regarding the variation of the fitting temperature compared to the measurement temperature were performed for the other temperatures in Figure 3. Figure 6 and Figure 7 show, as examples, the fits for a measurement temperature of 309.15 K (36 °C) and 325.15 K (52 °C).
For a measuring temperature of 309.15 K (36 °C), an improvement in the quality of the fit was obtained when the temperature of 334.15 K (61 °C) was manually entered into the software.
The experimental curve obtained at 325.15 K (52 °C) satisfactorily coincides with the fit performed after manually introducing a temperature of 340.15 K (67 °C). An analysis of the waveforms obtained by fitting to the experimental waveforms determined at temperatures from 293.15 K (20 °C) to 333.15 K (60 °C) showed that satisfactory quality requires the manual correction of the fitting temperatures in the direction of their increase in relation to the measured values.
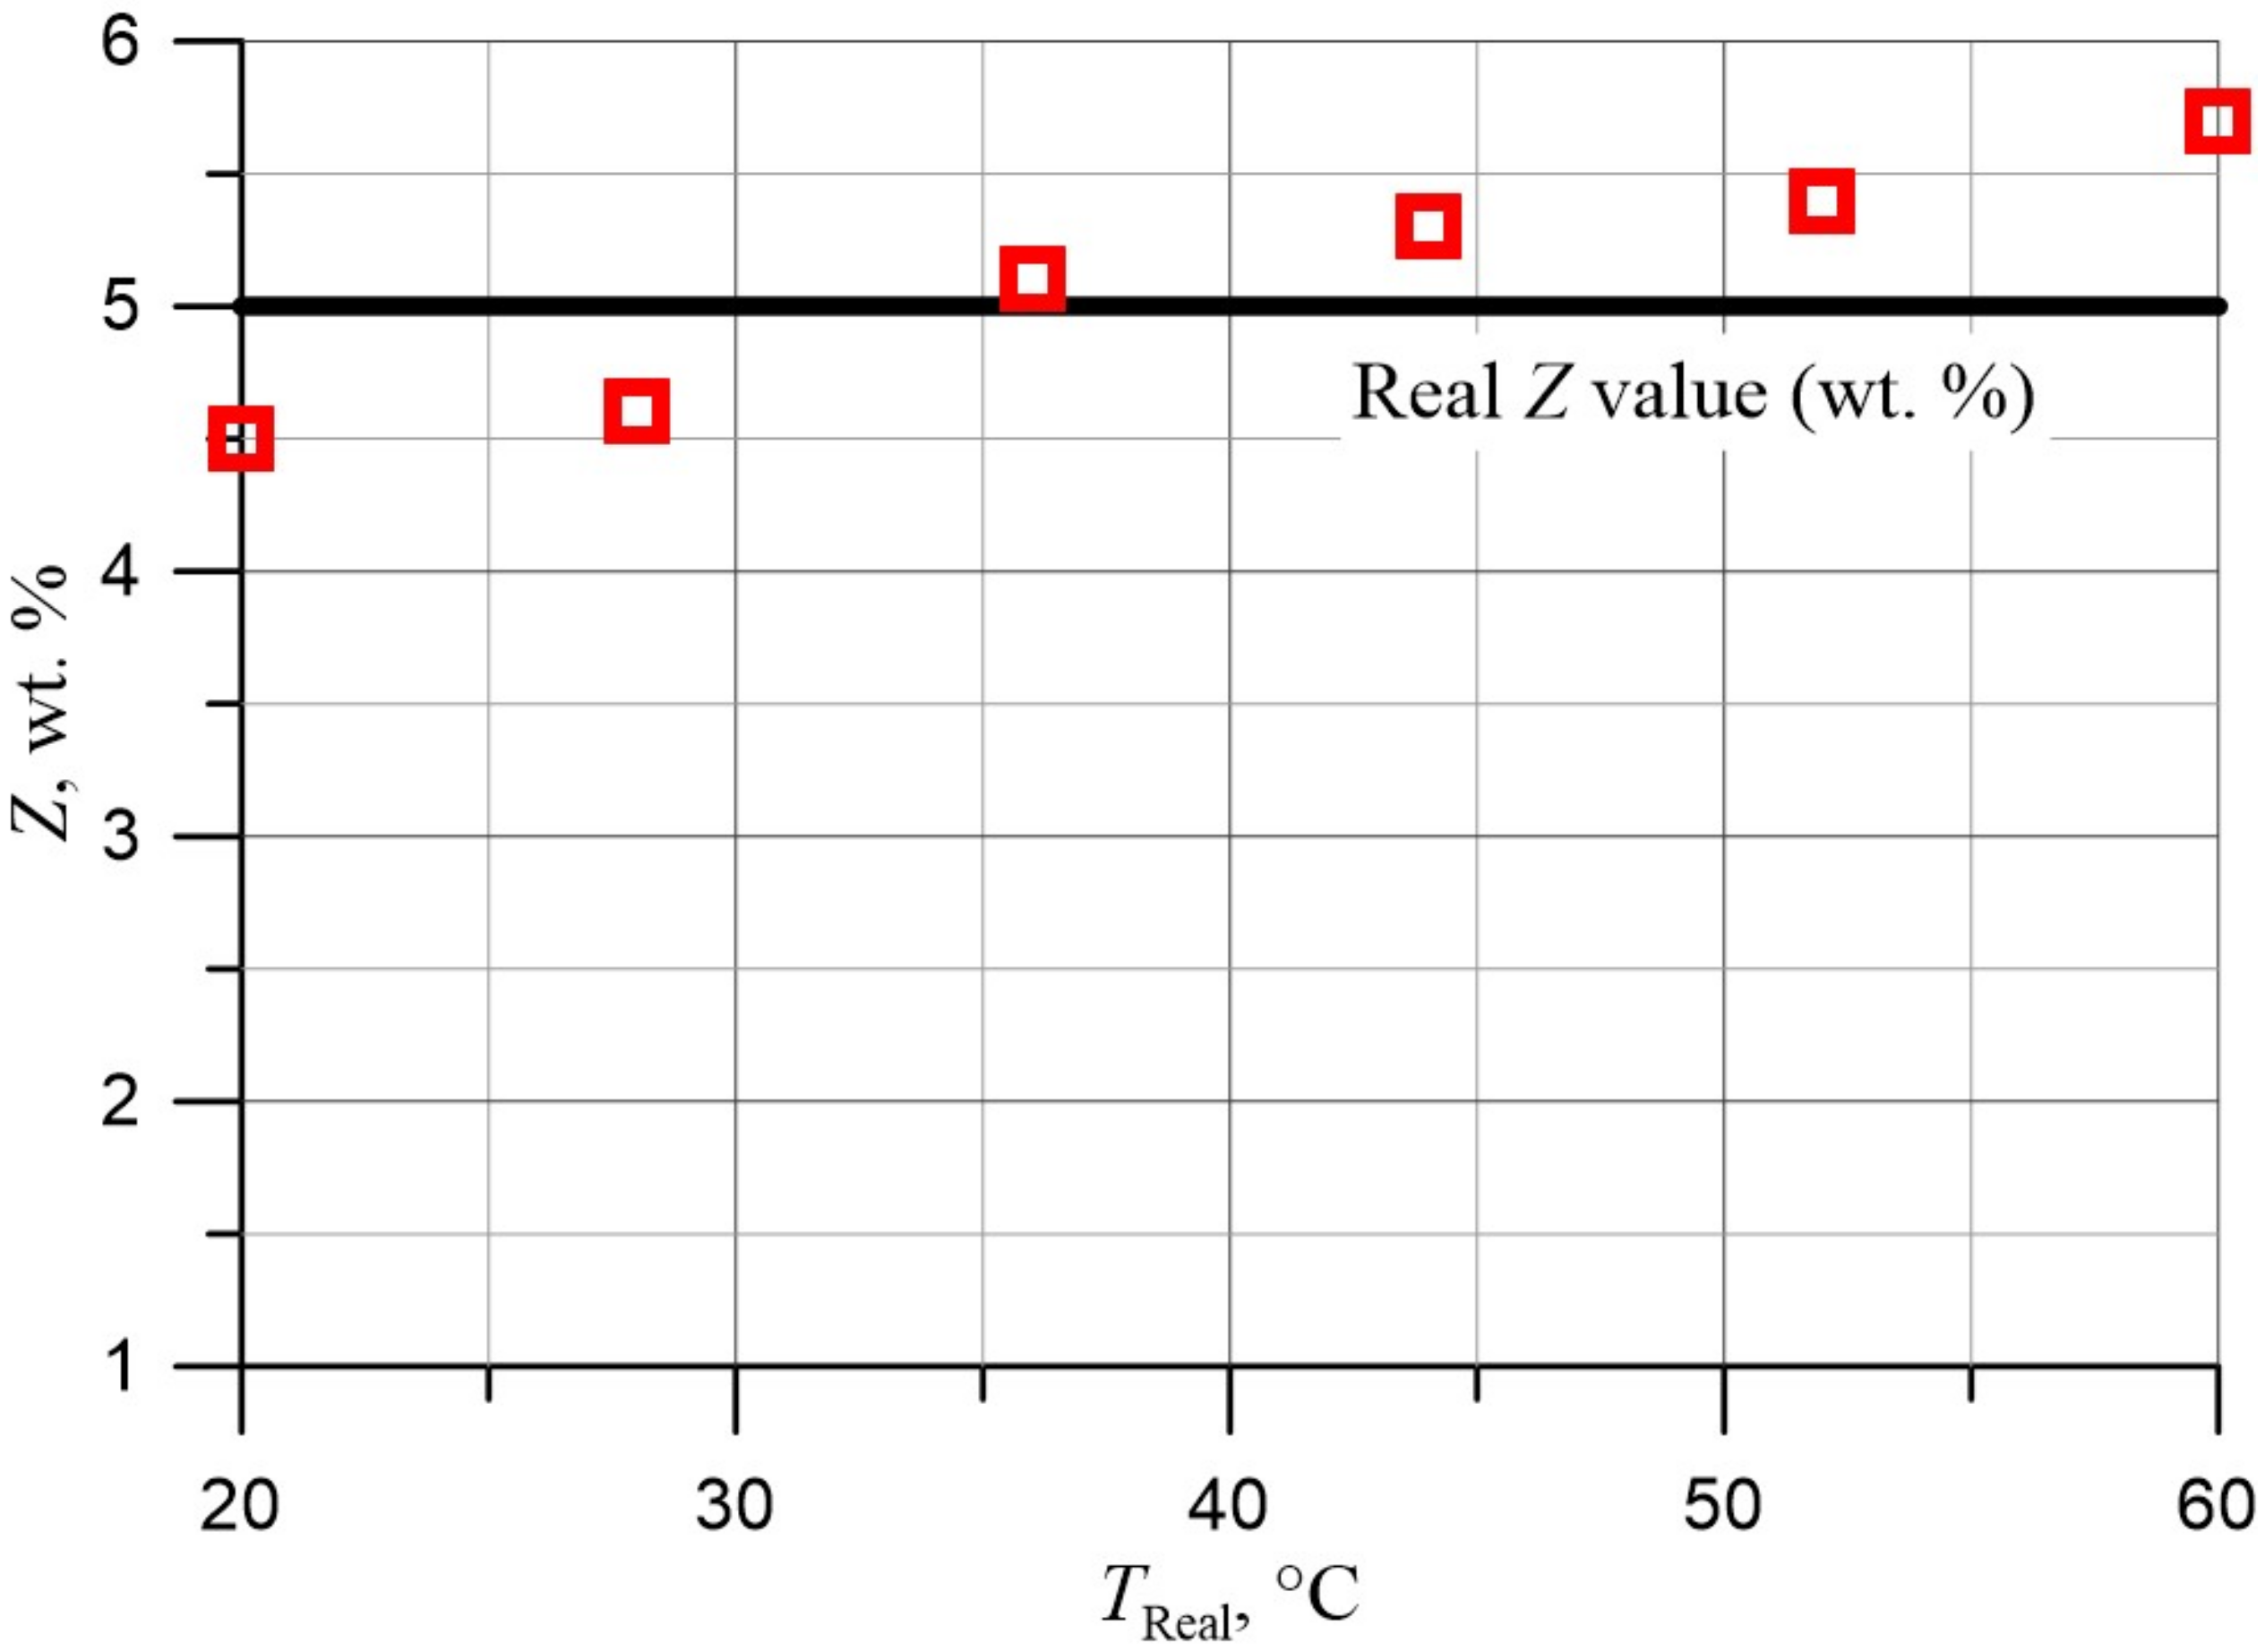
Figure 8 shows the dependence of the manually introduced temperature, needed to obtain a satisfactory fit to the experimental relations tgδ(f) of the composite of pressboard–insulating oil–water with a content of (5.0 ± 0.2) wt. % on the measurement temperature. It can be seen from the figure that obtaining a satisfactory fit requires the manual correction of the temperature in the direction of an increase compared to the measurement temperature. Figure 9 shows the dependence of the moisture content, as estimated by the Dirana meter after manual temperature correction to obtain a satisfactory fit, as a function of the measurement temperature.
Figure 9 shows that the average moisture content of the pressboard-oil-water composite determined after manual temperature adjustment is (5.1 ± 0.43) wt. % and is close to the actual content of (5.0 ± 0.2) wt. %. The uncertainty of measurement is more than twice the actual value and is ±0.43% or approximately ±8.3%. An increase in the measuring temperature results in an almost linear increase in the Dirana Meter’s estimated moisture value from 4.5 wt. % to 5.7 wt. %. This means that the estimated moisture value significantly depends on the measuring temperature. This is contrary to the conditions of the experiment, in which a sample with a strictly defined water content was used. It has not been ruled out that the increase in the estimated water content observed in Figure 9 with increasing measurement temperature is related to the fact that the activation energy of the relaxation time used in the Dirana meter software is slightly different from that specified in this paper. This means that in order to correctly determine the state of moisture in the paper-oil insulation on the basis of the frequency dependence analysis of the loss angle tangent, the parameters of the physical model must be precisely determined. The model describes the temperature dependence of conduction (defined by conductivity) and dielectric relaxation (defined by dielectric permittivity). This is because the loss angle tangent, which serves as the basis for moisture estimation, is a function of both of these material parameters.

4. Conclusions

The paper presents the results of investigations of the loss angle tangent determined by the FDS method for cellulose-oil insulation with a limiting water content in the blanket of (5.0 ± 0.2) wt. %, moistened in a manner as close as possible to the actual moistening process in power transformers. This water content was chosen because exceeding it risks the catastrophic failure of the transformer. The measuring temperature range was from 293.15 K (20 °C) to 333.15 K (60 °C) with a step of 8 K. The measuring frequency range was 0.0001 Hz to 5000 Hz. The moisture content of the actual water content (5.0 ± 0.2) wt. % of the insulating oil impregnated blanket was estimated using Dirana software.
It was observed that the shape of the frequency dependence of the loss angle tangent for a moisture content of (5.0 ± 0.2) wt. % does not depend on the value of the measuring temperature. An increase in temperature leads to a shift of the waveforms into the higher frequency region. This is associated with a decrease in the relaxation time. Its value depends on the activation energy, the value of which was determined in this paper as ΔEτ ≈ (0.871 ± 0.020) eV. It was found that a good fit of the waveforms, simulated by Dirana, to the actual tgδ waveforms obtained at temperatures between 293.15 K (20 °C) and 333.15 K (60 °C) requires the introduction of temperatures, higher than the actual insulation temperatures, into the program. As the fitting temperature changes, changes in the shape of the fitted waveforms occur. This is inconsistent with the experimental results, which show the independence of the shape of the waveforms from temperature.
It was found that estimating the moisture content for different temperatures using Dirana software for insulating an oil-impregnated pressboard produced large discrepancies from the actual content. Better results were obtained after an adjustment requiring manual temperature correction towards higher, compared to measured, temperatures. The moisture content estimated after correction by the Dirana meter ranges from a minimum value of 4.5 wt. % to a maximum value of 5.7 wt. % and increases almost linearly with increasing measuring temperature. The average moisture content estimated by the Dirana meter for all measuring temperatures is 5.1 wt. % and is close to the actual content (5.0 ± 0.2) wt. %. The uncertainty of the estimate is ±0.43 wt. % and is more than twice as high as the true value. An important result of the research is the fact that the dependence of the moisture content estimated by the Dirana gauge software depends on the measuring temperature. Its conformity with the actual content of the pressboard sample used in the study occurs only at the measuring temperature of 309.15 K (36 °C). For the other measuring temperatures, it is either lower or higher than the actual content. It follows that in order to improve the quality of the determination of the state of moisture of paper-oil insulation on the basis of FDS analysis, it is necessary to use a physical model, which accurately describes the processes of conduction, defined by conductivity, and of dielectric relaxation, defined by dielectric permeability. Both of these parameters unambiguously determine the temperature dependence of the experimental value of the loss angle tangent, on the basis of which the moisture content is estimated.

Author Contributions

Conceptualization, T.N.K. and K.K.; methodology, T.N.K. and K.K.; software, K.K. and P.O.; validation, T.N.K.; formal analysis, T.N.K., K.K. and A.P.; investigation, K.K. and P.O.; resources, T.N.K., K.K. and M.G.; data curation, K.K.; writing—original draft preparation, T.N.K. and K.K.; writing—review and editing, T.N.K., A.P. and M.G.; visualization, K.K.; supervision, T.N.K.; funding acquisition, T.N.K., K.K. and P.O. All authors have read and agreed to the published version of the manuscript.

Funding

The research was supported by the subsidy of the Ministry of Education and Science (Poland) for the Lublin University of Technology as funds allocated for scientific activities in the scientific discipline of Automation, Electronics, and Electrical Engineering—grants: FD-20/EE-2/702, FD-20/EE-2/703, and FD-20/EE-2/705.

Conflicts of Interest

The authors declare no conflict of interest.

References

  1. Rouse, T.O. Mineral insulating oil in transformers. IEEE Electr. Insul. Mag. 1998, 14, 6–16. [Google Scholar] [CrossRef]
  2. Graczkowski, A.; Gielniak, J. Influence of impregnating liquids on dielectric response of impregnated cellulose insulation. In Proceedings of the IEEE International Conference on Solid Dielectrics-ICSD, Potsdam, Germany, 4–9 July 2010; pp. 513–516. [Google Scholar]
  3. Fabre, J.; Pichon, A. Deteriorating processes and products of paper in oil application to transformers. In Proceedings of the International Conference on Large High Voltage Electric Systems (CIGRE), Paris, France, 15–25 June 1960; p. 137. [Google Scholar]
  4. Liu, J.; Zhang, H.; Geng, C.; Fan, X.; Zhang, Y. Aging Assessment Model of Transformer Insulation Based on Furfural Indicator under Different Oil/Pressboard Ratios and Oil Change. IEEE Trans. Dielectr. Electr. Insul. 2021, 28, 1061–1069. [Google Scholar] [CrossRef]
  5. Hussain, M.R.; Refaat, S.S.; Abu-Rub, H. Overview and Partial Discharge Analysis of Power Transformers: A Literature Review. IEEE Access. 2021, 9, 64587–64605. [Google Scholar] [CrossRef]
  6. Wolny, S.; Krotowski, A. Analysis of Polarization and Depolarization Currents of Samples of NOMEX®910 Cellulose–Aramid Insulation Impregnated with Mineral Oil. Energies 2020, 13, 6075. [Google Scholar] [CrossRef]
  7. Zukowski, P.; Rogalski, P.; Koltunowicz, T.N.; Kierczynski, K.; Subocz, J.; Zenker, M. Cellulose Ester Insulation of Power Transformers: Researching the Influence of Moisture on the Phase Shift Angle and Admittance. Energies 2020, 13, 5511. [Google Scholar] [CrossRef]
  8. Prevost, T.; Franchek, M. Conductor Insulation Tests in Oil Aramid vs. Kraft. IEEE Electr. Insul. Mag. 1989, 5, 10–14. [Google Scholar] [CrossRef]
  9. Przybylek, P.; Moranda, H.; Moscicka-Grzesiak, H.; Szczesniak, D. Application of Synthetic Ester for Drying Distribution Transformer Insulation-The Influence of Cellulose Thickness on Drying Efficiency. Energies 2019, 12, 3874. [Google Scholar] [CrossRef] [Green Version]
  10. Das, A.K.; Chatterjee, S. Impulse performance of synthetic esters based-nanofluid for power transformer. Mater. Res. Express 2018, 5, 125026. [Google Scholar] [CrossRef]
  11. Rozga, P.; Beroual, A.; Przybylek, P.; Jaroszewski, M.; Strzelecki, K. A Review on Synthetic Ester Liquids for Transformer Applications. Energies 2020, 13, 6429. [Google Scholar] [CrossRef]
  12. Cybulski, M.; Przybylek, P. Application of Molecular Sieves for Drying Transformers Insulated with Mineral Oil, Natural Ester, or Synthetic Ester. Energies 2021, 14, 1719. [Google Scholar] [CrossRef]
  13. Zukowski, P.; Kierczynski, K.; Koltunowicz, T.N.; Rogalski, P.; Subocz, J.; Korenciak, D. AC conductivity measurements of liquid-solid insulation of power transformers with high water content. Measurement 2020, 165, 108194. [Google Scholar] [CrossRef]
  14. Wolmarans, C.P.; Abrahams, R.; Pahlavanpour, B. Biodegradable electroinsulating fluids based on low viscosity hydrocarbons. Energetyka 2021, 9, 649–652. [Google Scholar]
  15. NYTRO® BIO 300X–The new bio-based alternative from Nynas. Transform. Technol. Mag. 2020, 46–51. Available online: https://www.transformer-technology.com/community-hub/in-focus/1642-nytro-bio-300x-the-new-bio-based-alternative-from-nynas.html (accessed on 20 February 2022).
  16. Fernández, I.; Ortiz, A.; Delgado, F.; Renedo, C.; Pérez, S. Comparative evaluation of alternative fluids for power transformers. Electr. Power Syst. Res. 2013, 98, 58–69. [Google Scholar] [CrossRef]
  17. MIDEL 7131 Increased Fire Safety; M&I Materials Ltd.: Manchester, UK, 2016.
  18. Liu, Q.; Wang, Z. Streamer characteristic and breakdown in synthetic and natural ester transformer liquids with pressboard interface under lightning impulse voltage. IEEE Trans. Dielectr. Electr. Insul. 2011, 18, 1908–1917. [Google Scholar] [CrossRef]
  19. Oommen, T.V. Moisture Equilibrium in Paper Oil Systems. In Proceedings of the 16th Electrical/Electronics Insulation Conference, Chicago, IL, USA, 3–6 October 1983; pp. 162–166. [Google Scholar]
  20. Rahman, M.F.; Nirgude, P. Partial discharge behaviour due to irregular-shaped copper particles in transformer oil with a different moisture content of pressboard barrier under uniform field. IET Gener. Transm. Distrib. 2019, 13, 5550–5560. [Google Scholar] [CrossRef]
  21. Hill, J.; Wang, Z.; Liu, Q.; Krause, C.; Wilson, G. Analysing the power transformer temperature limitation for avoidance of bubble formation. High Volt. 2019, 4, 210–216. [Google Scholar] [CrossRef]
  22. Garcia, B.; Villarroel, R.; Garcia, D. A Multiphysical model to study moisture dynamics in transformers. IEEE Trans. Power Deliv. 2019, 34, 1365–1373. [Google Scholar] [CrossRef]
  23. IEC 60814:2.0–Insulating Liquids–Oil-Impregnated Paper and Pressboard–Determination of Water by Automatic Coulometric Karl Fischer Titration. Available online: https://www.en-standard.eu/iec-60814-1997-insulating-liquids-oil-impregnated-paper-and-pressboard-determination-of-water-by-automatic-coulometric-karl-fischer-titration/ (accessed on 11 February 2022).
  24. Zheng, H.; Liu, J.; Zhang, Y.; Ma, Y.; Shen, Y.; Zhen, X.; Chen, Z. Effectiveness Analysis and Temperature Effect Mechanism on Chemical and Electrical-Based Transformer Insulation Diagnostic Parameters Obtained from PDC Data. Energies 2018, 11, 146. [Google Scholar] [CrossRef] [Green Version]
  25. Mishra, D.; Haque, N.; Baral, A.; Chakravorti, S. Assessment of interfacial charge accumulation in oil-paper interface in transformer insulation from polarization-depolarization current measurements. IEEE Trans. Dielectr. Electr. Insul. 2017, 24, 1665–1673. [Google Scholar] [CrossRef]
  26. Zaengl, W.S. Applications of dielectric spectroscopy in time and frequency domain for HV power equipment. IEEE Electr. Insul. Mag. 2003, 19, 9–22. [Google Scholar] [CrossRef]
  27. Yang, L.; Chen, J.; Gao, J.; Zheng, H.; Li, Y. Accelerating frequency domain dielectric spectroscopy measurements on insulation of transformers through system identification. IET Sci. Meas. Technol. 2018, 12, 247–254. [Google Scholar] [CrossRef]
  28. Qi, B.; Dai, Q.; Li, C.; Zeng, Z.; Fu, M.; Zhuo, R. The Mechanism and Diagnosis of Insulation Deterioration Caused by Moisture Ingress into Oil-Impregnated Paper Bushing. Energies 2018, 11, 1496. [Google Scholar] [CrossRef] [Green Version]
  29. Liu, J.; Fan, X.; Zhang, Y.; Zhang, C.; Wang, Z. Aging evaluation and moisture prediction of oil-immersed cellulose insulation in field transformer using frequency domain spectroscopy and aging kinetics model. Cellulose 2020, 27, 7175–7189. [Google Scholar] [CrossRef]
  30. Zhukowski, P.; Subocz, J.; Kołtunowicz, T.N. Analysis of dielectric response in the frequency domain moist and oil impregnated pressboard. Prz. Elektrotechniczny 2012, 88 (Suppl. 11b), 251–254. [Google Scholar]
  31. Islam, M.M.; Lee, G.; Hettiwatte, S.N. A review of condition monitoring techniques and diagnostic tests for lifetime estimation of power transformers. Electr. Eng. 2018, 100, 581–605. [Google Scholar] [CrossRef]
  32. Gutten, M.; Brncal, P.; Sebok, M.; Kucera, M.; Korenciak, D. Analysis of insulating parameters of oil transformer by time and frequency methods. Diagnostyka 2020, 21, 51–56. [Google Scholar] [CrossRef]
  33. Martínez, M.; Pleite, J. Improvement of RVM test interpretation using a Debye equivalent circuit. Energies 2020, 13, 323. [Google Scholar] [CrossRef] [Green Version]
  34. RVM 5462-Advanced Automatic Recovery Voltage Meter for Diagnosis of Oil Paper Insulation, HAEFELY. Available online: http://mldt.pl/files/rvm.PDF (accessed on 20 January 2022).
  35. Broadbent, S.R.; Hammersley, J.M. Percolation processes: I. Crystals and mazes. Math. Proc. Camb. Philos. Soc. 1957, 53, 629–641. [Google Scholar] [CrossRef]
  36. Żukowski, P.; Kołtunowicz, T.N.; Kierczyński, K.; Subocz, J.; Szrot, M. Formation of water nanodrops in cellulose impregnated with insulating oil. Cellulose 2015, 22, 861–866. [Google Scholar] [CrossRef] [Green Version]
  37. Żukowski, P.; Kierczyński, K.; Kołtunowicz, T.N.N.; Rogalski, P.; Subocz, J. Application of elements of quantum mechanics in analysing AC conductivity and determining the dimensions of water nanodrops in the composite of cellulose and mineral oil. Cellulose 2019, 26, 2969–2985. [Google Scholar] [CrossRef] [Green Version]
  38. Żukowski, P.W.; Kantorow, S.B.; Kiszczak, K.; Mączka, D.; Rodzik, A.; Stelmakh, V.F.; Czarnecka-Such, E. Study of the Dielectric Function of Silicon Irradiated with a Large Dose of Neutrons. Phys. Status Solidi 1991, 128, K117–K121. [Google Scholar] [CrossRef]
  39. Zukowski, P.W.; Rodzik, A.; Shostak, Y.A. Dielectric constant and ac conductivity of semi-insulating Cd1-xMnxTe semiconductors. Semiconductors 1997, 31, 610–614. [Google Scholar] [CrossRef]
  40. Mitrofanov, G.A.; Strel’nikov, M.Y. Measurement of the dielectric loss-tangent of transformer oil. Ind. Lab. 2000, 66, 108–111. [Google Scholar]
  41. Life Management Techniques for Power Transformers. 2003. Available online: https://e-cigre.org/publication/227-life-management-techniques-for-power-transformers (accessed on 27 January 2022).
  42. Żukowski, P.; Kołtunowicz, T.N.; Kierczyński, K.; Rogalski, P.; Subocz, J.; Szrot, M.; Gutten, M.; Sebok, M.; Korenciak, D. Dielectric losses in the composite cellulose–mineral oil–water nanoparticles: Theoretical assumptions. Cellulose 2016, 23, 1609–1616. [Google Scholar] [CrossRef] [Green Version]
  43. Rogalski, P.; Kierczyński, K.; Żukowski, P. Method of moistening an electrotechnical pressboard impregnated with insulating oil, RP Pat. 239240. Wiadomości Urzędu Patentowego 2021, 33, 7. (In Polish) [Google Scholar]
  44. Setayeshmehr, A.; Fofana, I.; Eichler, C.; Akbari, A.; Borsi, H.; Gockenbach, E. Dielectric spectroscopic measurements on transformer oil-paper insulation under controlled laboratory conditions. IEEE Trans. Dielectr. Electr. Insul. 2008, 15, 1100–1111. [Google Scholar] [CrossRef]
  45. Koch, M.; Prevost, T. Analysis of dielectric response measurements for condition assessment of oil-paper transformer insulation. IEEE Trans. Dielectr. Electr. Insul. 2012, 19, 1908–1915. [Google Scholar] [CrossRef]
  46. Blennow, J.; Ekanayake, C.; Walczak, K.; García, B.; Gubanski, S.M. Field experiences with measurements of dielectric response in frequency domain for power transformer diagnostics. IEEE Trans. Power Deliv. 2006, 21, 681–688. [Google Scholar] [CrossRef]
  47. Ekanayake, C.; Gubanski, S.M.; Graczkowski, A.; Walczak, K. Frequency Response of Oil Impregnated Pressboard and Paper Samples for Estimating Moisture in Transformer Insulation. IEEE Trans. Power Deliv. 2006, 21, 1309–1317. [Google Scholar] [CrossRef]
  48. Samarasinghe, W.M.S.C.; Kumara, J.R.S.S.; Fernando, M.A.R.M.; Gunawardena, A.U.A.W. Aging assesment of transformer pressboard insulation by micro-strip ring resonator at GHz frequencies. IEEE Trans. Dielectr. Electr. Insul. 2017, 24, 1923–1930. [Google Scholar] [CrossRef]
  49. Fafana, I.; Hemmatjou, H.; Meghnefi, F.; Farzaneh, M.; Setayeshmehr, A.; Borsi, H.; Gockkenbach, E. On the frequency domain dielectric response of oil-paper insulation at low temperatures. IEEE Trans. Dielectr. Electr. Insul. 2010, 17, 799–807. [Google Scholar] [CrossRef]
  50. Rogalski, P. Measurement Stand, Method and Results of Composite Electrotechnical Pressboard-Mineral Oil Electrical Measurements. Devices Methods Meas. 2020, 11, 187–195. [Google Scholar] [CrossRef]
  51. Zukowski, P.; Rogalski, P.; Kierczynski, K.; Koltunowicz, T.N. Precise Measurements of the Temperature Influence on the Complex Permittivity of Power Transformers Moistened Paper-Oil Insulation. Energies 2021, 14, 5802. [Google Scholar] [CrossRef]
  52. Zukowski, P.; Rogalski, P.; Koltunowicz, T.N.; Kierczynski, K.; Subocz, J.; Sebok, M. Influence of temperature on phase shift angle and admittance of moistened composite of cellulose and insulating oil. Measurement 2021, 185, 110041. [Google Scholar] [CrossRef]
  53. Zukowski, P.; Rogalski, P.; Koltunowicz, T.N.; Kierczynski, K.; Bondariev, V. Precise measurements of the temperature-frequency dependence of the conductivity of cellulose–insulating oil–water nanoparticles composite. Energies 2020, 14, 32. [Google Scholar] [CrossRef]
  54. Waygood, A. An Introduction to Electrical Science, 2nd ed.; Taylor & Francis Group: Abingdon, UK; Routledge: New York, NY, USA, 2019. [Google Scholar]
Figure 1. The cross-section of the measuring capacitor with the electrical diagram of the stand: 1—DIRANA meter–FDS-PDC dielectric response analyser (OMICRON Energy Solutions GmbH, Berlin, Germany), 2—measuring electrode, 3—voltage electrode, 4—protection electrode, 5—insulator, 6—pressboard, 7—temperature recorder Agilent 34970A, 8—thermostat, and 9—computer.
Energies 15 02924 g001
Figure 2. A parallel equivalent diagram of the insulating material (a) and indication diagram for a parallel equivalent diagram (b). V—supply voltage amplitude, IRconduction current amplitude, ICoffset current amplitude, RPresistance, CPcapacitance, φphase shift angle, and δloss angle.
Energies 15 02924 g002
Figure 3. The frequency dependences of the tangent of the angle of loss of the composite pressboard–insulating oil–water with the content of (5.0 ± 0.2) wt. % for the measured temperatures from 293.15 K to 333.15 K. Pointsresults of measurements.
Energies 15 02924 g003
Figure 4. The experimental dependence of tgδ(f) of a composite of pressboard–insulating oil–water with a content of (5.0 ± 0.2) wt. % for a measurement temperature of 293.15 K (20 °C)blue points, and the waveform fitted by the Dirana meter softwarered points.
Energies 15 02924 g004
Figure 5. The experimental dependence of tgδ(f) of a composite of pressboard–insulating oil–water with (5.0 ± 0.2) wt. % for a measurement temperature of 293.15 K (20 °C)blue points, and the waveform fitted by a Dirana meter for a manually entered temperature of 331.15 K (58 °C)red points.
Energies 15 02924 g005
Figure 6. The experimental dependence of tgδ(f) of a composite of the pressboard–insulating oil–water composite with a content of (5.0 ± 0.2) wt. % for a measuring temperature of 309.15 K (36 °C)—blue points, and the waveform fitted by a Dirana meter for a manually entered temperature of 334.15 K (61 °C)—red points.
Energies 15 02924 g006
Figure 7. The experimental dependence of tgδ(f) of a composite of pressboard–insulating oil–water with (5.0 ± 0.2) wt. % for a measurement temperature of 325.15 K (52 °C)blue points, and the waveform fitted by a Dirana meter for a manually entered temperature of 340.15 K (67 °C)red points.
Energies 15 02924 g007
Figure 8. The dependence of the manually entered fitting temperature on the measurement temperature needed to satisfactorily fit the experimental tgδ(f) relationships of a (5.0 ± 0.2) wt. %. pressboard-insulating oil-water composite.
Energies 15 02924 g008
Figure 9. The dependence of the water content estimated with the Dirana gauge software on the measuring temperature of a composite of pressboard–insulating oil–water with a content of (5.0 ± 0.2) wt. %.
Energies 15 02924 g009
Publisher’s Note: MDPI stays neutral with regard to jurisdictional claims in published maps and institutional affiliations.