Article

Efficient Plasma Technology for the Production of Green Hydrogen from Ethanol and Water

1
Faculty of Chemistry, Warsaw University of Technology, Noakowskiego 3, 00-664 Warsaw, Poland
2
Faculty of Electrical Engineering, Warsaw University of Technology, Pl. Politechniki 1, 00-661 Warsaw, Poland
*
Author to whom correspondence should be addressed.
Energies 2022, 15(8), 2777; https://doi.org/10.3390/en15082777
Submission received: 22 February 2022 / Revised: 1 April 2022 / Accepted: 8 April 2022 / Published: 10 April 2022
(This article belongs to the Special Issue Advances in Biomass Energy Conversion and Thermochemical Processes)

Abstract

:
This study concerns the production of hydrogen from a mixture of ethanol and water. The process was conducted in plasma generated by a spark discharge. The substrates were introduced in the liquid phase into the reactor. The gaseous products formed in the spark reactor were hydrogen, carbon monoxide, carbon dioxide, methane, acetylene, and ethylene. Coke was also produced. The energy efficiency of hydrogen production was 27 mol(H2)/kWh, and it was 36% of the theoretical energy efficiency. The high value of the energy efficiency of hydrogen production was obtained with relatively high ethanol conversion (63%). In the spark discharge, it was possible to conduct the process under conditions in which the ethanol conversion reached 95%. However, this entailed higher energy consumption and reduced the energy efficiency of hydrogen production to 8.8 mol(H2)/kWh. Hydrogen production increased with increasing discharge power and feed stream. However, the hydrogen concentration was very high under all tested conditions and ranged from 57.5 to 61.5%. This means that the spark reactor is a device that can feed fuel cells, the power load of which can fluctuate.

1. Introduction

Hydrogen energy can be an excellent solution to two challenges: increasing energy production and reducing the environmental impact of human activity. Fuel cells enable the production of clean electricity from hydrogen. However, there is currently no viable technology to produce “green” hydrogen. Presently used industrial methods for hydrogen production are mainly based on the processing of fossil fuels. The electrolysis of water is of marginal importance due to the high cost of the hydrogen produced in this way. Other methods of producing hydrogen from renewable resources are constantly being researched to improve efficiency. “Green” hydrogen can be produced in the process of splitting water [1,2,3,4,5] and raw materials obtained from biomass, e.g., biogas [6,7], bio-alcohols [8,9,10,11,12,13,14,15,16,17,18,19,20,21,22,23,24,25,26,27,28,29,30], and bio-oils [30,31]. Among the raw materials derived from biomass, ethanol is the most convenient. Ethanol is easy to obtain, store, and transport. It is also a relatively safe compound for health and the environment. The steam reforming of ethanol (R1) and the water-steam gas reaction (R2) allow the production of six moles of hydrogen from one mole of ethanol.
C2H5OH + H2O → 2CO + 4H2
CO+H2O ⇆ CO2 + H2
Producing hydrogen from ethanol is complex, and many different competing reactions are possible. For example, hydrocarbons and coke are produced in these reactions. Due to the competitive reactions, the efficiency of hydrogen production is much lower than is theoretically possible. Therefore, research is focused on finding conditions for hydrogen production from ethanol that will enable the selectivity of hydrogen formation to be maximized.
Plasma methods offer many possibilities for controlling the chemical process. They are diverse because plasma can be produced in various conditions, e.g., microwave, barrier, gliding, corona, or spark discharges. Different results are obtained depending on the type of discharge and the process conditions. D. Czylkowski et al. [8] reported that in a microwave discharge, gaseous products of ethanol decomposition were H2, CO, CO2 CH4, C2H2, C2H4, C2H6, and O2. In producing hydrogen from ethanol, the presence of oxygen is very rarely reported. Apart from D. Czylkowski, H. Barankova et al. [9,10] also reported that they detected oxygen in the intermediates by spectroscopy. T. Zhu et al. [11] confirmed the presence of H2, CO, CO2, CH4, C2H2, C2H4, C2H6, CH3OH, and CH3CHO during their research on the process taking place in the liquid mixture of water and ethanol in the microwave discharge. B. Wang et al. [12] reported that in the gliding discharge, the products of ethanol decomposition were H2, CO, CO2, CH4, C2H2, C2H4, and C2H6. This research was conducted in the mixture of ethanol and argon. C.M. Du et al. [13] reported that H2, CO, CO2, and CH4 were produced from the mixture of water, ethanol, and air in the gliding discharges. Unfortunately, the authors did not mention nitrogen oxides, which may be generated in the gliding discharge [32,33]. B. Wang et al. [14] reported that H2, CO, CO2, CH4, C2H2, C2H4, C2H6, C3H6, and C3H8 were produced from the mixture of water, ethanol, and argon in the barrier discharge. However, in our previous studies [15,16] and the research of Y.P. Hu [17], the presence of C3H6, C3H8, and C2H2 was not found in the products of the barrier discharge process. Moreover, in these studies [15,16,17], the hydrogen production process was carried out in the mixture of water and ethanol, without additional gases facilitating plasma formation. X. Zhu et al. [18] reported that H2, CO, CO2, CH4, C2H4, and C2H6 were produced from the mixture of water and ethanol in the corona discharge. Y. Xin et al. [19] reported that H2, CO, CO2, CH3OH, carbon nanoparticles, and macromolecular substances (CxHyOz) were produced from the mixture of water and ethanol in the spark discharge.
In addition to the type of discharge and components facilitating plasma formation, another essential factor is the power supply system. Different results were obtained in the same reactor depending on the power supply system. This was demonstrated in our previous studies [34] on the decomposition of volatile organic compounds and the studies by R. Burlica et al. on the formation of hydrogen peroxide from water [35].
Despite many studies conducted in various research centers, no cost-effective technology for hydrogen production from ethanol has been developed yet. Therefore, new technical solutions aimed at achieving higher energy efficiency are tested. For example, N. Saksono et al. [28] used plasma electrolysis of an ethanol solution with potassium hydroxide.
In this work, plasma was generated in the spark discharge powered by a sinusoidal current with a frequency of 15,300 Hz. The spark discharge was generated in small reactors; hence, it could be used in portable systems. The plasma generated in a spark discharge is a non-equilibrium plasma, in which electrons have enough energy that bonds in ethanol, and water can dissociate upon colliding with them. Additionally, the gas temperature in the discharge channel reaches several thousand degrees. These two factors, high temperature, and high-energy electrons, favor endothermic reactions, which has been confirmed by our research on the decomposition of volatile organic compounds [36,37]. Hydrogen production from a mixture of water and ethanol is also an endothermic process, and a spark discharge should give excellent results. Additionally, a spark reactor can be repeatedly switched on and off without auxiliary operation, e.g., heating or purging. This would make it an excellent method of feeding fuel cells operating periodically.

2. Materials and Methods

Figure 1 shows the apparatus used in this research. The liquid mixture of water and ethanol was fed to the spark reactor. A constant ethanol/water molar ratio equal to 3 was used. It is a stoichiometric ratio concerning the R3 reaction, which is a total and balanced record of R1 and R2 reactions.
C2H5OH + 3H2O → 2CO2 + 6H2
The feed flow was regulated with a mass flow controller (Bronkhorst/EIEWIN, flow measurement accuracy ±2%) in the range from 0.32 to 1.42 mol/h. The quartz casing of the spark reactor had an inner diameter of 8 mm. The electrodes were made of stainless steel and had a diameter of 3.2 mm. Above the electrodes, there was a quartz fiber layer with a thickness of ~10 mm. Subsequently, the vapors of the substrates passed through the plasma zone of a volume of ~0.09 ccm. Water and ethanol molecules collided with high-energy electrons in this region, and chemical reactions were initiated. After passing the plasma zone, the gases were filtered. The filtered gases were directed to a water cooler condensed water and ethanol. The condensate composition was analyzed using a Thermo Scientific Trace 1300 gas chromatograph (standard error 2.3%) with a single quadrupole mass detector. The cooled gases were analyzed with an HP6890 gas chromatograph (standard error 4.9%), and an APAR AR236/2 sensor. The AR236/2 sensor was used to measure the water vapor content (humidity measurement accuracy ±2.5%, temperature measurement accuracy 0.5 °C) and gas temperature, while the HP6890 chromatograph with a thermal conductivity detector allowed the concentration of gaseous products to be measured. The amounts of produced gases were measured with an Illmer-Gasmesstechnik gas meter (accuracy 0.1 dm3).
We previously used the described apparatus and measurement methodology in the research of hydrogen production from a mixture of methanol and water [38].
The production of a particular gaseous compound (F[i], mol/h) was calculated from Formula (1):
F[i] = Q · ci/V
where Q is the gas flow at standard conditions (dm3/h), ci is the fraction of the compound in the cooled gas, and V is the standard molar volume of gas (22.4 dm3/mol).
The ethanol conversion (x, %) was calculated from Formula (2):
x = (F0[EtOH] − F[EtOH])/F0[EtOH]
where F[EtOH] is the flow rate of ethanol at the reactor outlet (mol/h), and F0[EtOH] is the feed flow rate of ethanol (mol/h).
The hydrogen yield (Y, %) was calculated from Formula (3):
Y = F[H2]/(6 · F0[EtOH]) · 100%
The energy efficiency of hydrogen production (E, mol(H2)/kWh) was calculated from Formula (4):
E = 1000 · F[H2]/P
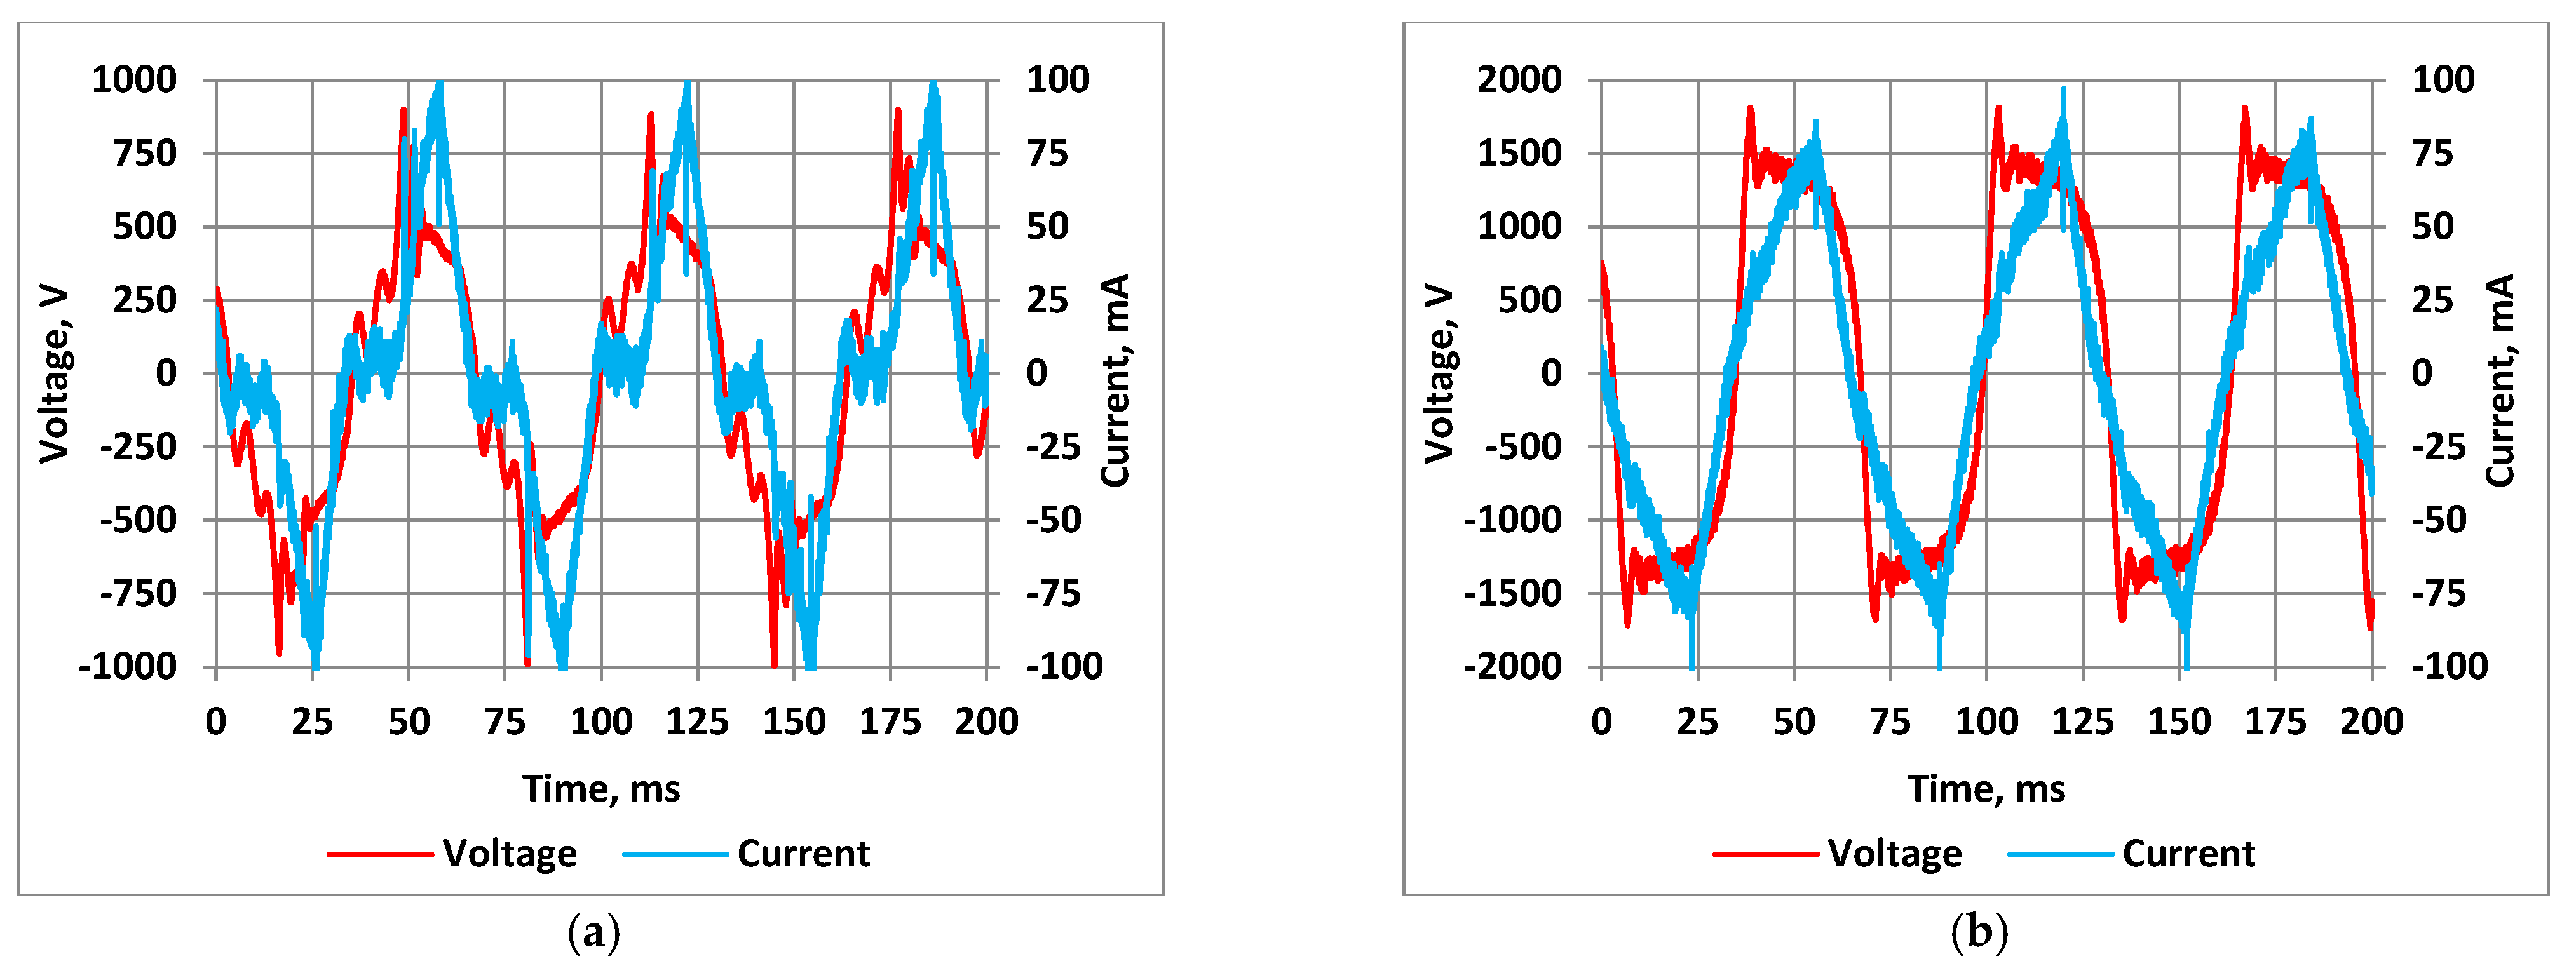
The discharge power (P) ranged from 15 to 55 W, and it was measured using a Tektronix TDS 3032B oscilloscope (vertical accuracy ±2%, time base accuracy 20 ppm), Tektronix P6015A (attenuation 1000:1 ± 3%), and TCP202 probes (accuracy ±3%). Figure 2 shows the voltage and current waveforms recorded at the minimum and maximum discharge power.
The selectivity of ethanol conversion to coke (Sc, %) was calculated from Formula (5):
Sc = Gc/(Mc · F0[EtOH] · x) · 100%
where Gc is the coke weight stream (g/h), and Mc is the molar mass of carbon (12 g/mol).
The root mean square velocity (vk, m/s) of the particles was calculated from Formula (6):
vk = √( 3 ∙ kB ∙ T/m)
where kB is the Boltzmann constant (1.38 ∙ 10−23 J/K), m is the particle mass (kg), and T is the temperature (K).

3. Results and Discussion

3.1. The Effect of the Discharge Power

This section presents and discusses the effect of the discharge power on producing hydrogen from a mixture of water and ethanol. The research was carried out for a steady feed stream equal to 1 mol/h. This feed stream was optimal in our previous studies conducted in the barrier discharge [15].
If the process was run according to the reactions R1 and R2, and the ethanol conversion was complete, the hydrogen and carbon dioxide concentrations would be 75% and 25%, respectively. However, competitive reactions caused the hydrogen concentration to be lower and they reached 57–58% (Table 1). Carbon monoxide was the second most concentrated gas product. Its concentration was 23–24%. The following product was methane, with the concentration ranging from 3.7 to 4.4%. The concentration of carbon dioxide was slightly lower than that of methane and ranged from 3.2 to 4.3%. Acetylene and ethylene were also formed, and their concentrations ranged from 1.2 to 3.1% and 1.1 to 2.0%, respectively. The high concentration of CO indicates that the reaction R2 is ineffective. R2 is a subsequent reaction inhibited by H2 produced in the reaction R1.
The composition of the gases practically did not depend on the discharge power. On this basis, it can be concluded that the discharge power did not significantly affect the mechanism of chemical reactions taking place in the spark discharge. This is because chemical reactions are initiated in collisions with high-energy electrons and depend on the energy of the electrons and their numbers. In the spark discharge, the electron density ranges from 1016 to 1018 per ccm [39,40]. This is not much compared to the number of molecules, which for an ideal gas under standard conditions is 2.7 × 10¹⁹ per ccm. However, there are many times more collisions with electrons than collisions between other particles because electrons are much more mobile than gas molecules due to their low mass. The root mean square velocity of the particles strictly depends on the particle mass according to Formula (6).
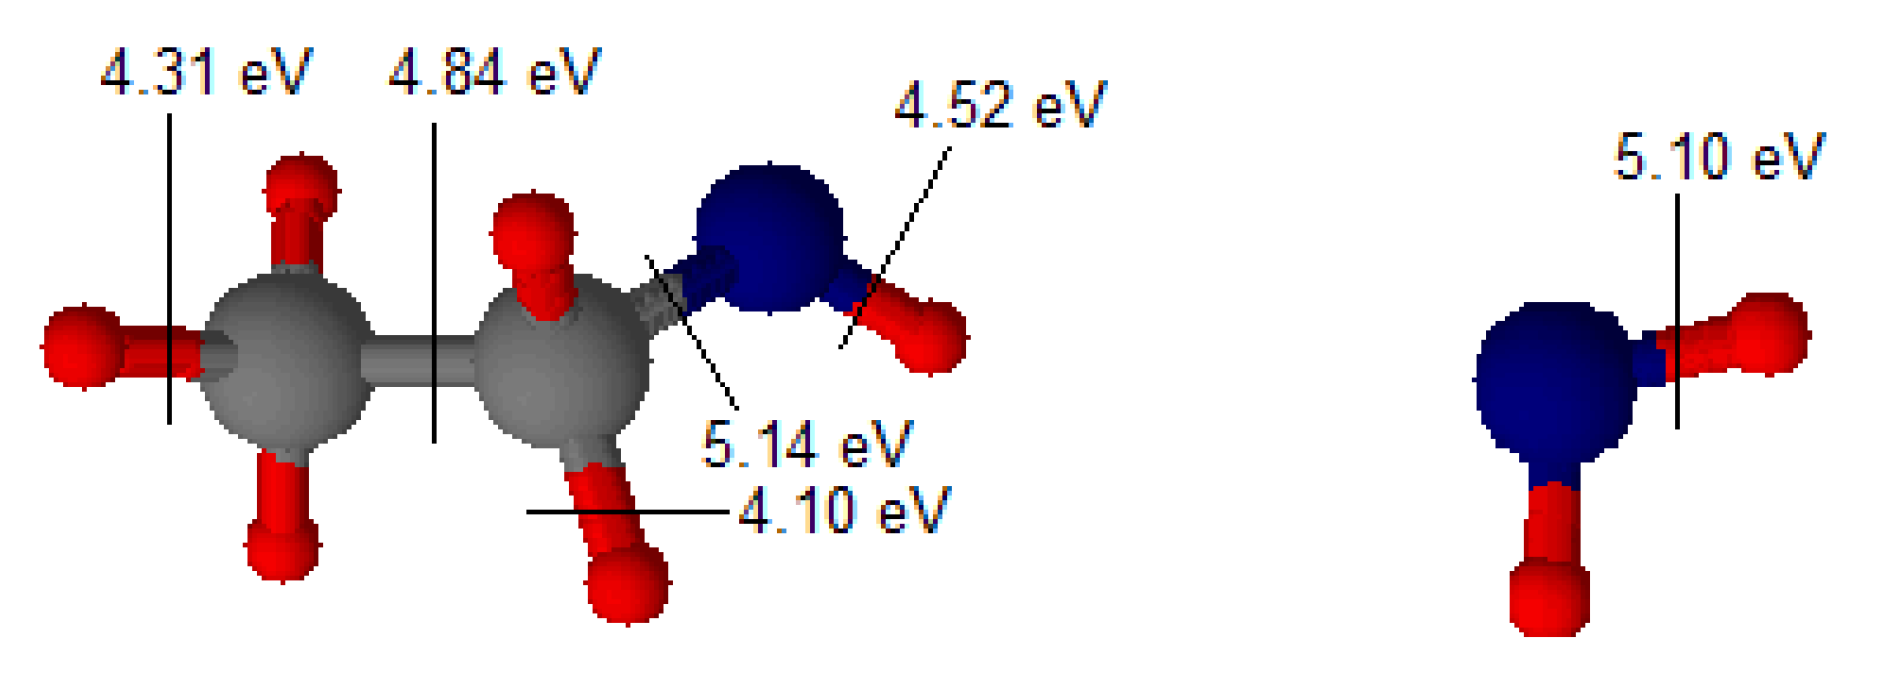
Only some of the collisions lead to the dissociation of ethanol and water. For the collision, the electron must have sufficiently high energy to break one of the bonds. The energy of bonds in ethanol ranges from 4.10 to 5.14 eV [41,42]. The energy bond is presented in Figure 3. The energy of O-H bonding in water is 5.10 eV [43]. Only some of the electrons have such high energy. However, collisions with electrons with lower energy lead to an increase in the internal energy of the particle (R4, R5) and enable its transformation in subsequent collisions (R6–R13):
C2H5OH + e → C2H5OH* + e
H2O + e → H2O* + e
C2H5OH* + e → CH3CH2O· + H· + e
C2H5OH* + e → CH3CHOH· + H· + e
C2H5OH* + e → C2H5· + OH· + e
C2H5OH* + e → CH2CH2OH· + H· + e
C2H5OH* + e → CH3· + CH2OH· + e
C2H5OH* + e → CH4 + CH2O + e
C2H5OH* + e → CH3CHO + H2 + e
H2O* + e → H· + OH· + e
Ethanol molecules that have obtained a sufficiently high internal energy can also decay into stable products (R14–R18):
C2H5OH* → CO + CH4 + H2
C2H5OH* → C2H4 + H2O
C2H5OH* → CH3CHO + H2
C2H5OH* → CO + C + 3H2
C2H5OH* + H2O* → 2CO + 4H2
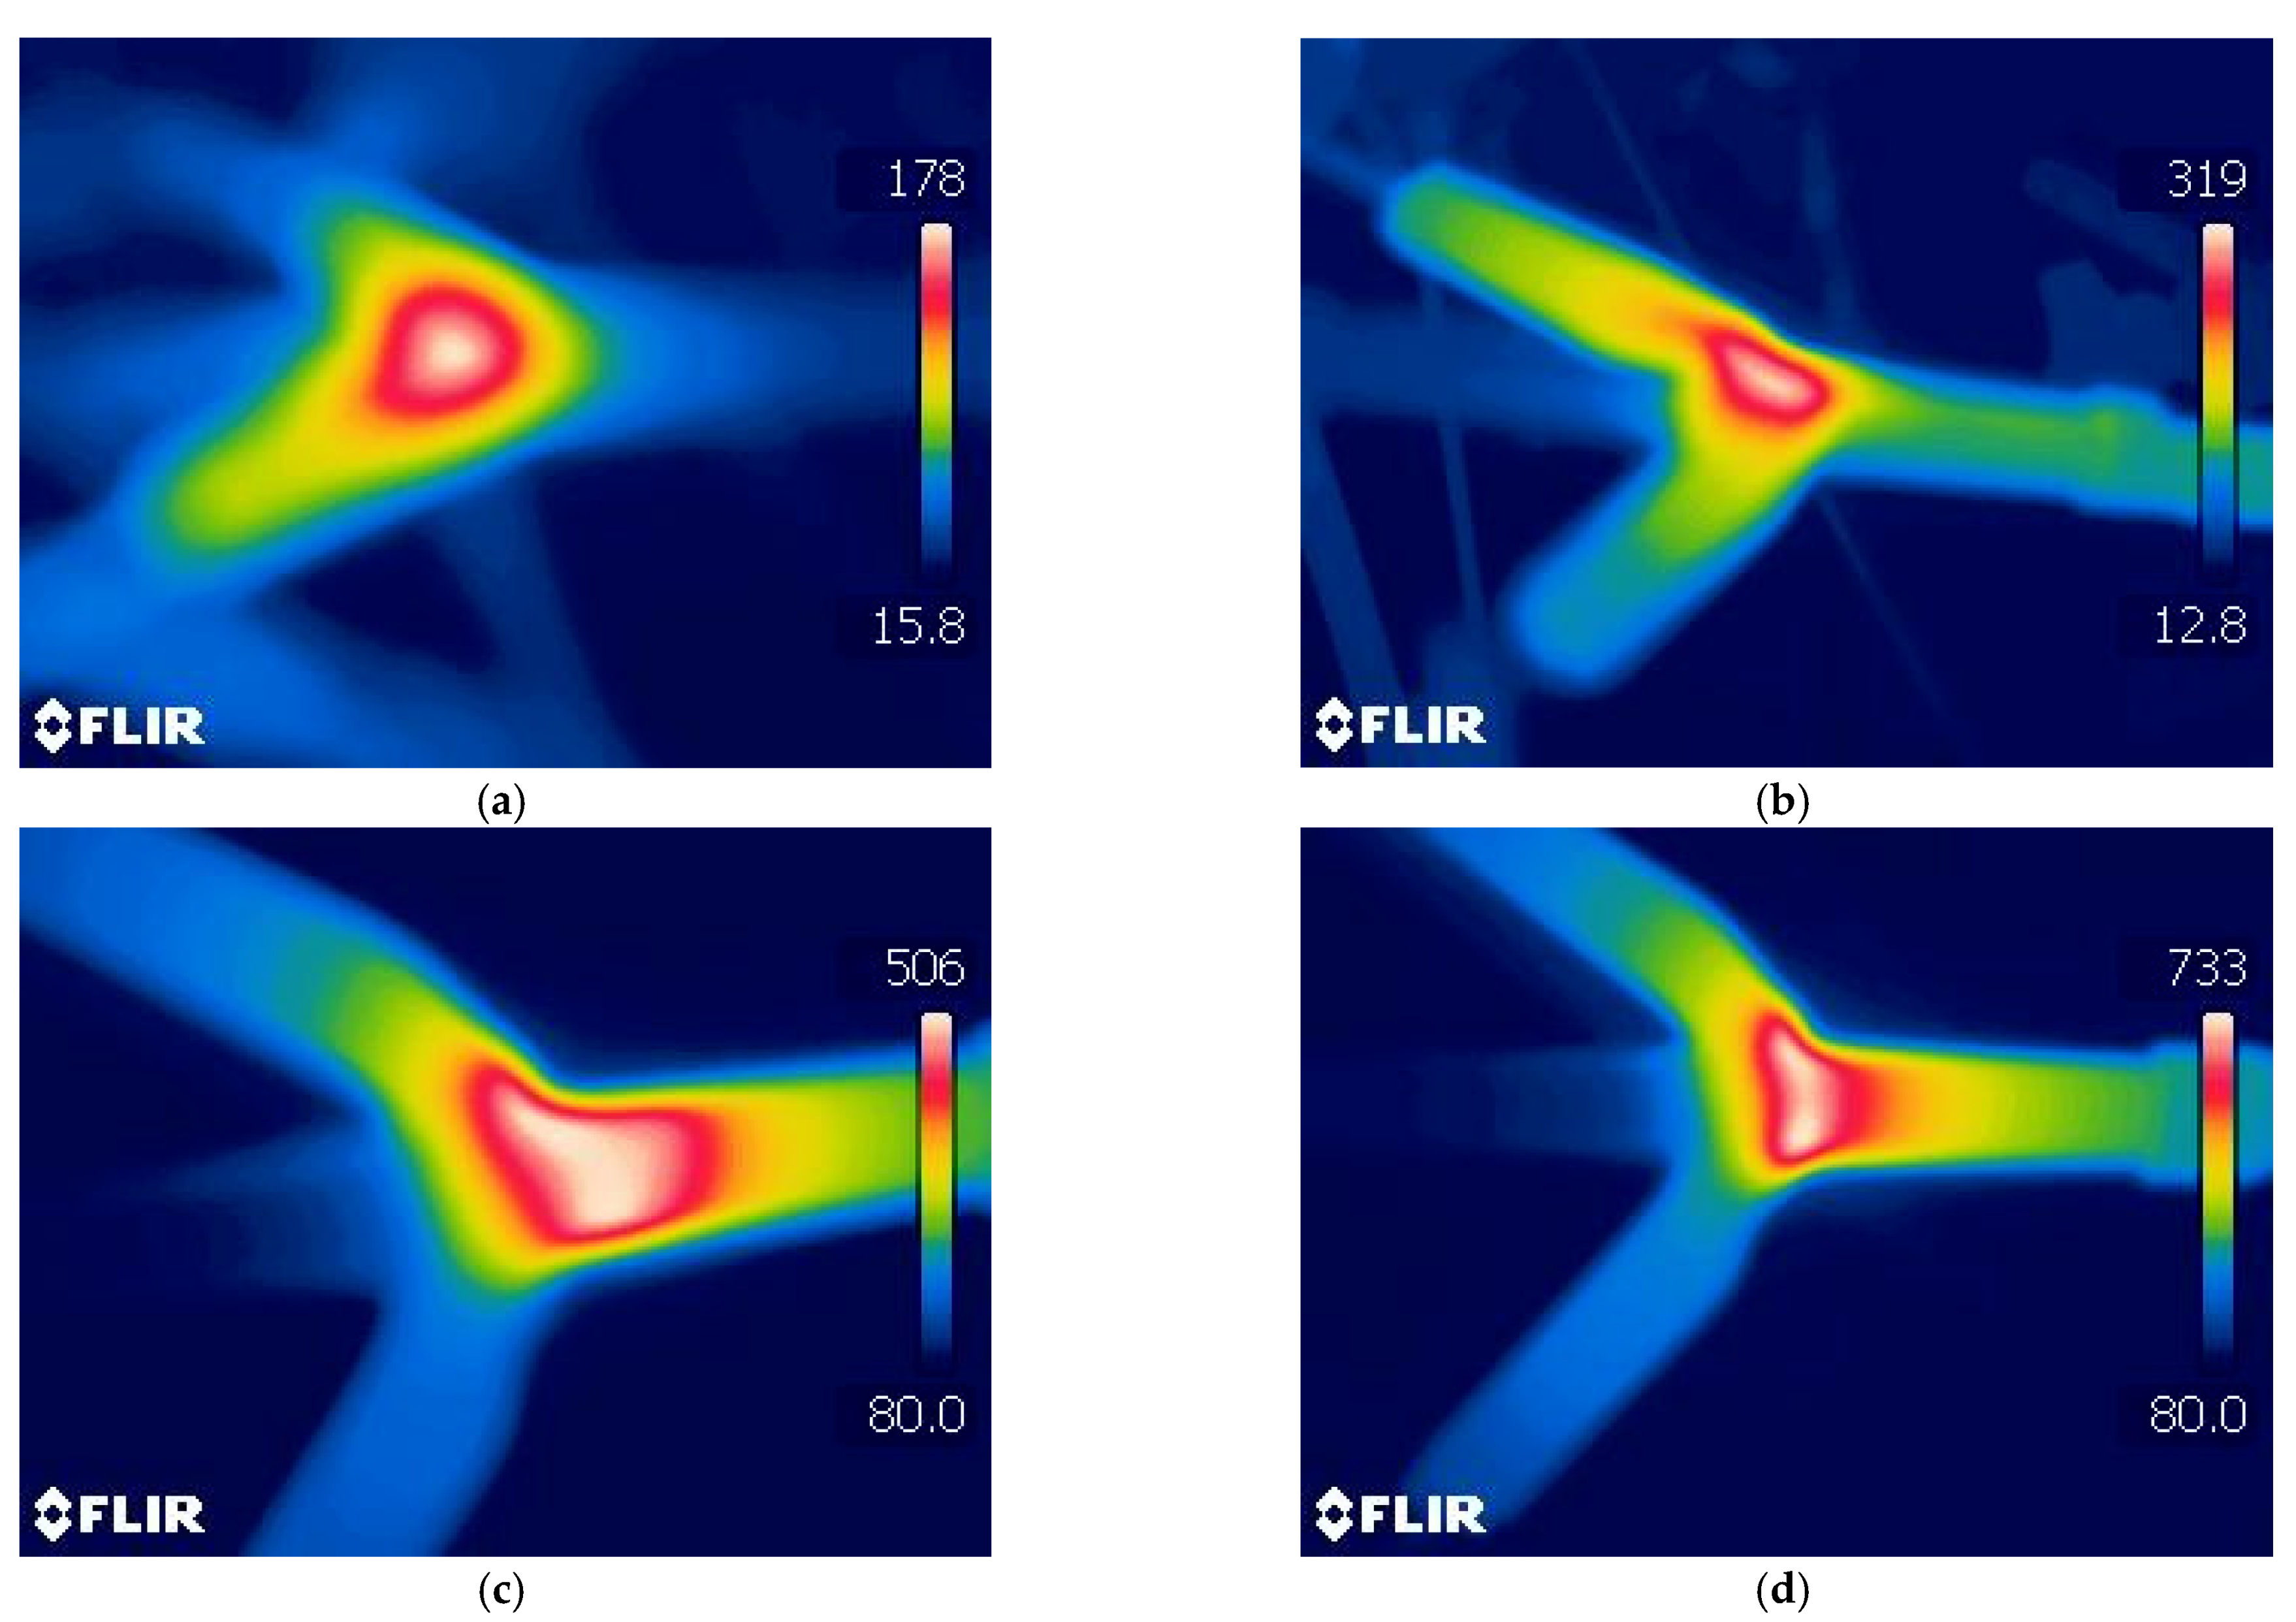
L. Dvonc and M. Janda [39] observed that the electron density increased with the temperature of the gases. The change was significant. The electron density was ~1016 per ccm at a gas temperature of ~900 K, and at a gas temperature of ~1400 K, the electron density was ~1018 per ccm. In the spark reactor, the temperature increased with the discharge power (Figure 4). The measurement of the gas temperature in the plasma zone was infeasible. However, the images from a thermal imaging camera show that the temperature of the reactor wall in the discharge area increased with the discharge power. This means that the temperature of the gases also increased with the increasing discharge power. Thanks to this, the number of electrons increased, and there were more collisions. Moreover, the average electron energy may increase with the discharge power. However, these changes are often insignificant because the electric field affects the average electron energy [39]. The electric field does not change much for the established geometry of the reactor. But even a small increase in the average electron energy due to the power increase has a positive effect. The higher the average energy of the electrons, the more energy is transferred from the electrons to the molecules in each collision. After a smaller number of collisions, they can decay. The sequence of possible reactions of radicals and intermediate products formed in collisions of electrons with ethanol and water was presented in detail in our previous work [16].
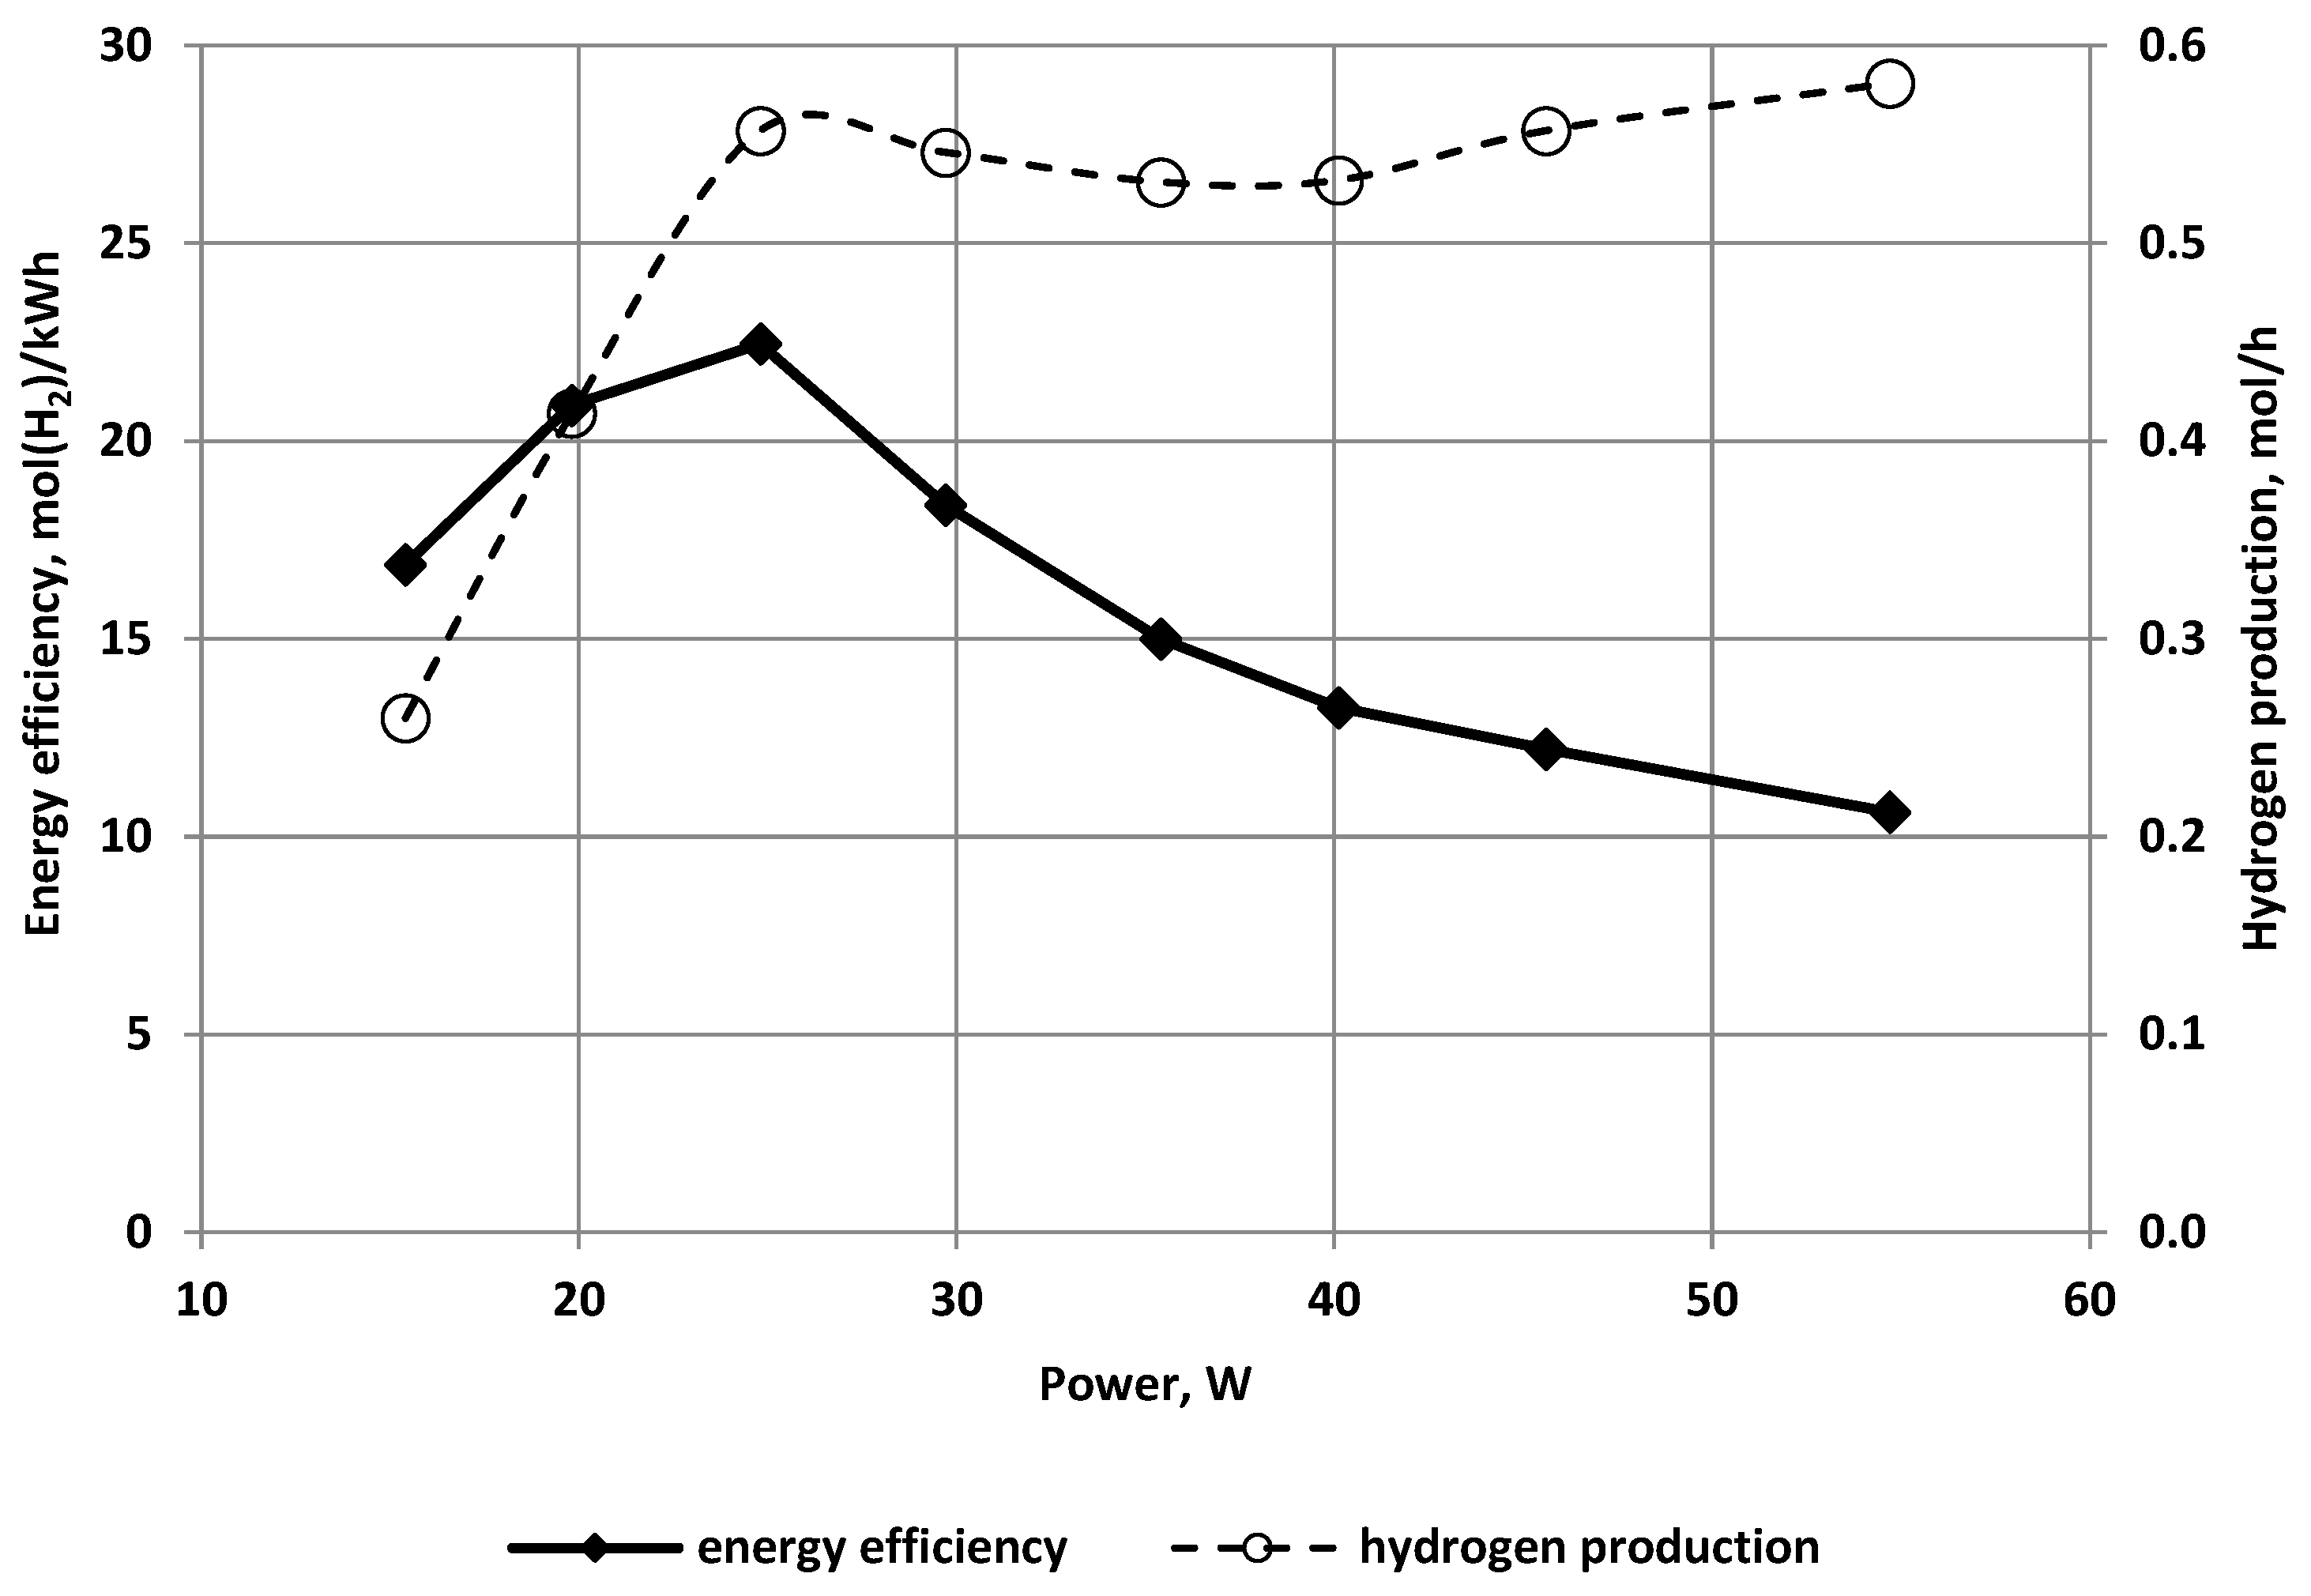
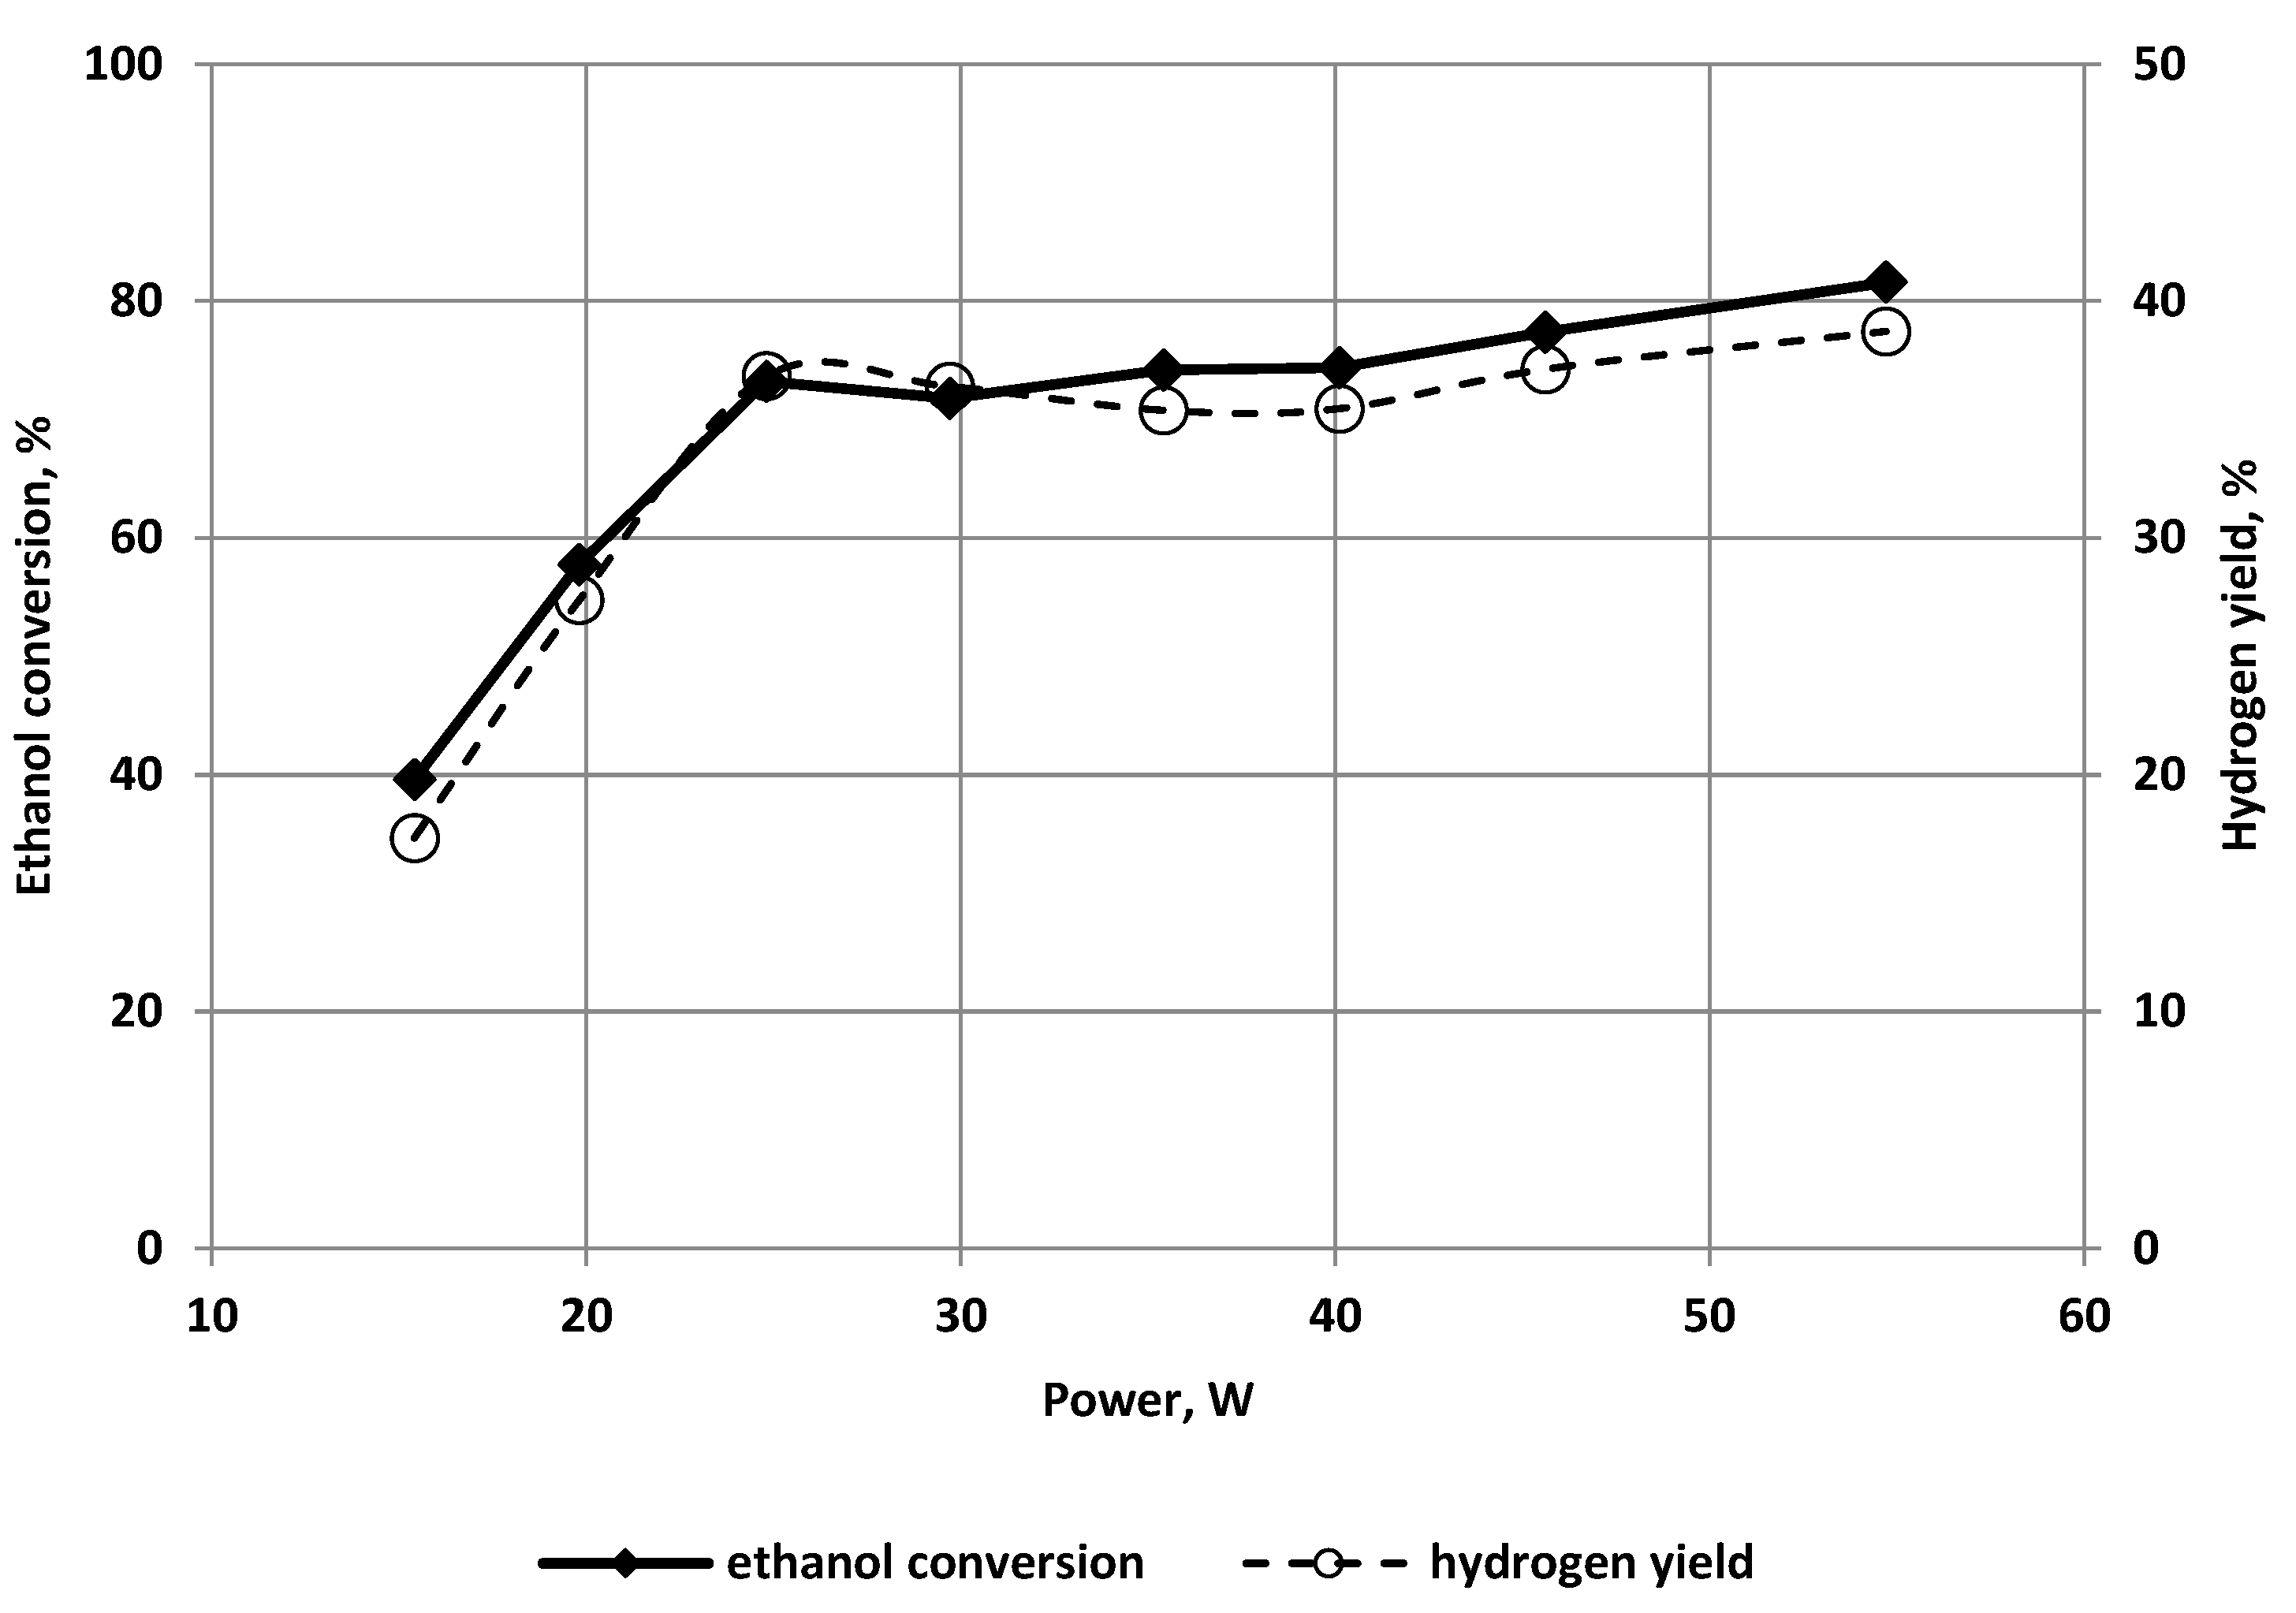
Although the gas composition did not change with the discharge power change, the hydrogen production increased with the increase in power because the ethanol conversion increased (Figure 5 and Figure 6). Figure 5 and Figure 6 illustrate that hydrogen production, ethanol conversion, and hydrogen production efficiency increased rapidly with increasing power from 15 to 25 W. A further power increase resulted in a slow increase in these parameters. This resulted in a reduction in the energy yield of hydrogen production. The highest energy efficiency of 22.5 mol(H2)/kWh was obtained with a power of ~25 W (Figure 5). This is 36% of the theoretical energy efficiency for hydrogen production in the reaction R3. If the reactants are introduced into the reactor in the liquid phase, the enthalpy of reaction R3 is 341.68 kJ, which corresponds to the energy efficiency of hydrogen production of 62 mol(H2)/kWh. In the literature, a different enthalpy value of 173.54 kJ is also found, which corresponds to the energy efficiency of hydrogen production of 124.5 mol(H2)/kWh. These values are correct when reactants are vaporized in a heat exchanger and introduced into a reactor in the gas phase. These values ignore the energy used to evaporate the substrates, which is a very energy-consuming operation. Additionally, any omission of heating the substrates to temperatures higher than the standard temperature causes the demonstrated energy efficiency of hydrogen production to be higher than theoretically possible.
Usually, hydrogen production from alcohols is more energy-efficient than hydrogen production from water. D. G. Rey et al. [4] reported that the energy efficiency of hydrogen production from water was 1.1 mol H2/kWh. N. R. Panda and D. Sahu [23] reported that the energy efficiency of hydrogen production from methanol was 1.2 mol H2/kWh. B. Sarmiento et al. [44] reported that the energy efficiency of hydrogen production from ethanol was 3.3 mol H2/kWh. The studies mentioned above were carried out in the barrier discharge. The same principle is confirmed by comparing the work carried out in the corona discharge. J. M. Kirkpatrick and B. R. Locke [5] produced hydrogen from water with energy efficiency of 0.12 mol H2/kWh, while X. Zhu et al. [18] produced hydrogen from ethanol with energy efficiency of 10 mol H2/kWh. Therefore, alcohols are an attractive raw material.

3.2. The Effect of the Feed Flow

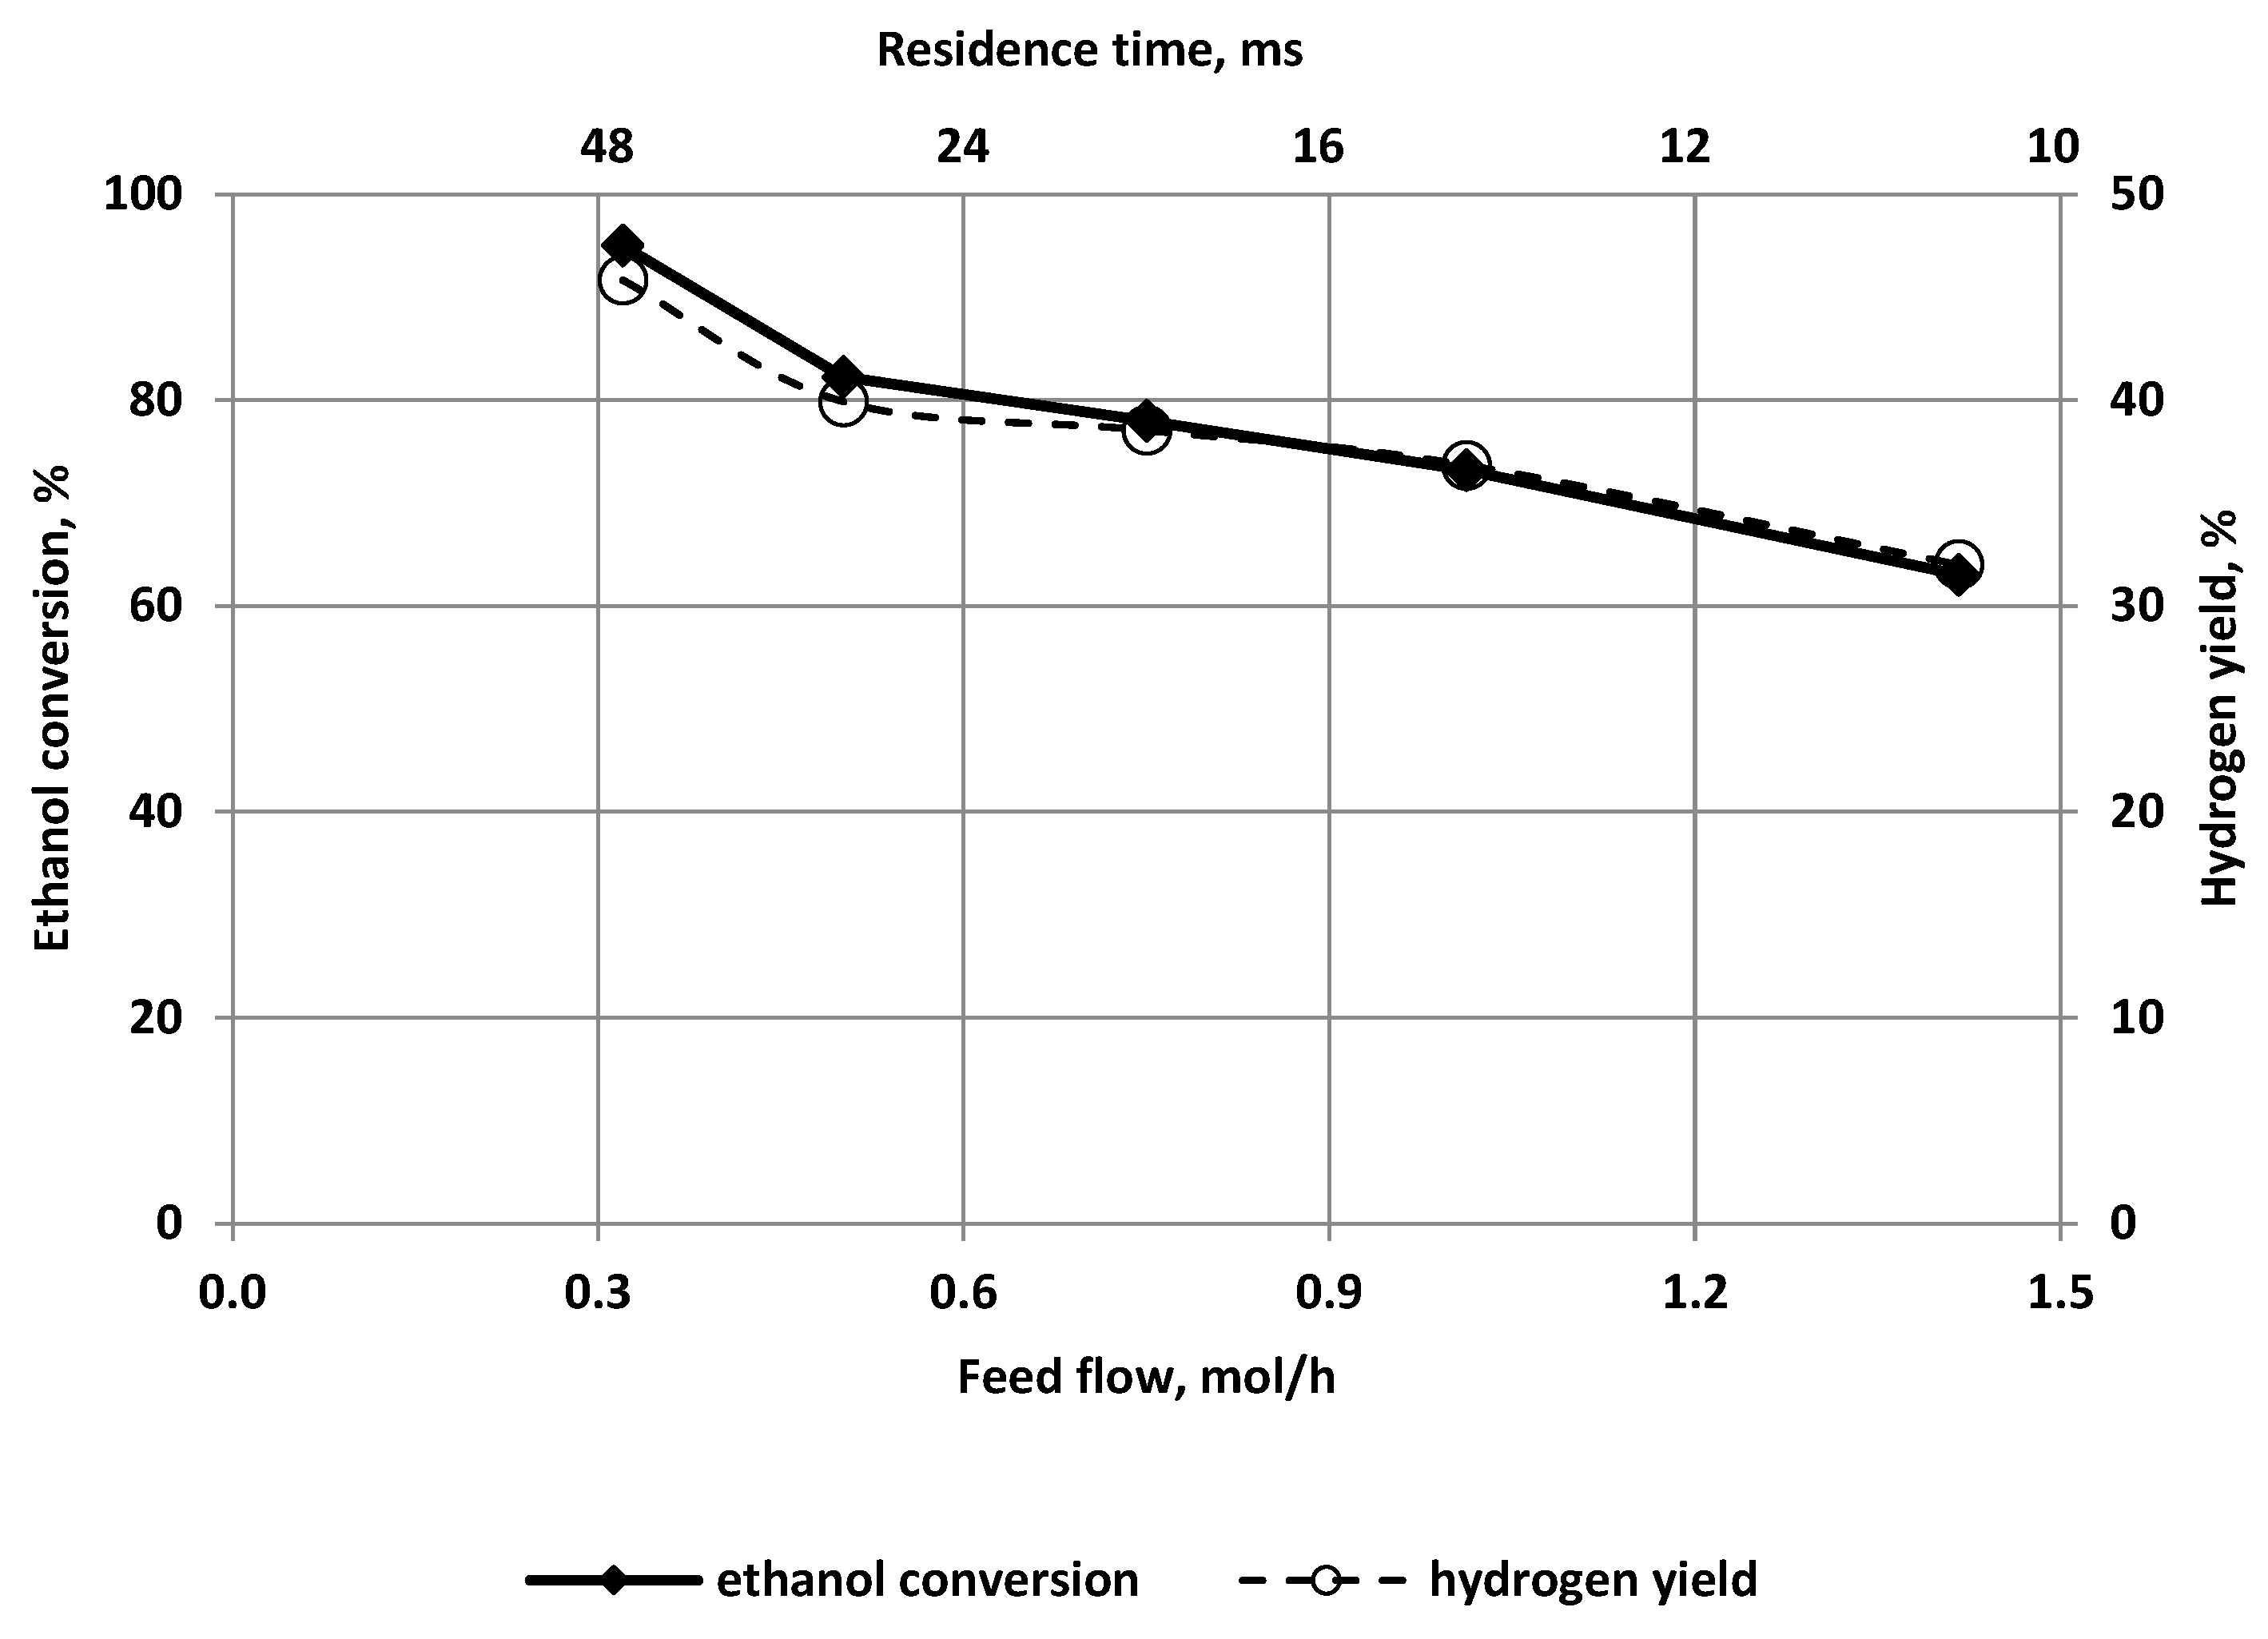
The feed flow influence on hydrogen production was studied for the power of 25 W. For this power, the energy efficiency reached the maximum (Figure 5). A feed flow influences the course of chemical reactions because it affects the residence time of reactants. Long residence times of reactants in a reactor and high conversions can be achieved when a low feed flow is used. The confirmation of this principle can be seen in Figure 7. The ethanol conversion and hydrogen yield decreased with increasing feed flow because the residence time of the reagents decreased.
In cases where many chemical reactions occur, the reduction of the residence time often affects the product’s composition. In producing hydrogen from a mixture of water and ethanol, the product of sequential reactions is carbon dioxide. Therefore, its concentration increased with the increase of the average residence time of the reactants in the reactor (Table 2). The concentrations of CO, C2H2, and C2H4 decreased as they were consumed in the sequential reactions generating CO2 and H2.
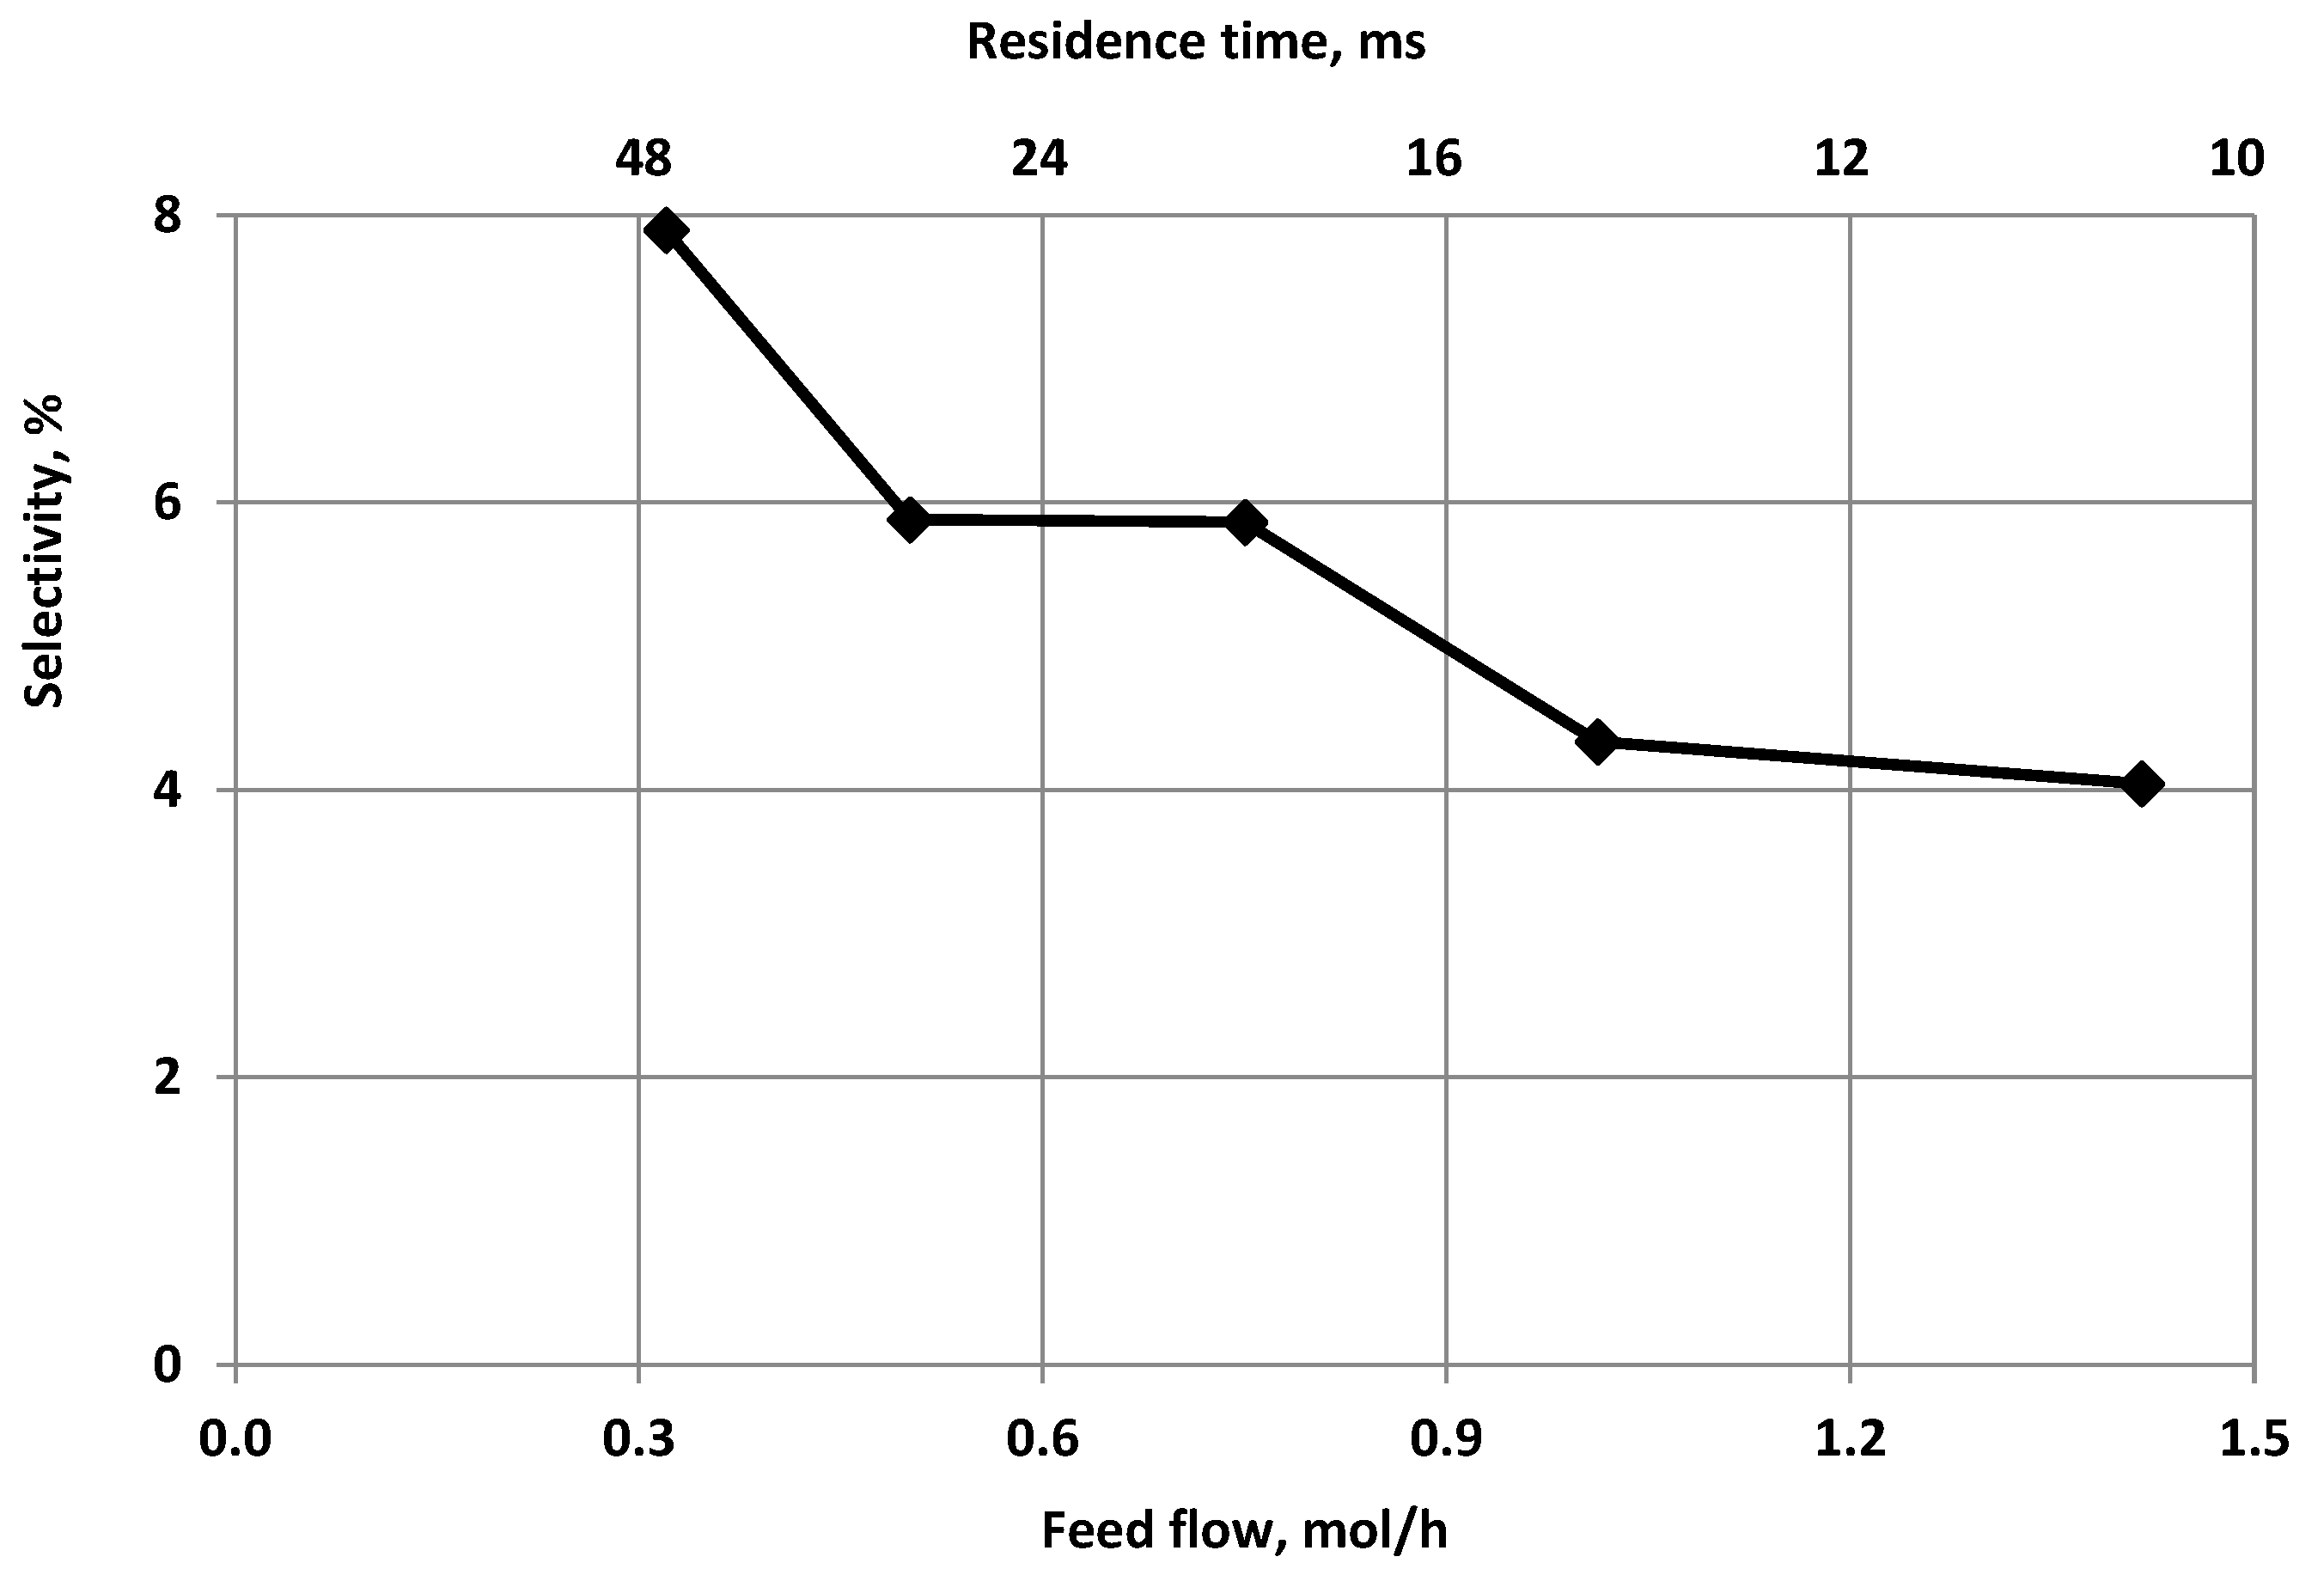
The decrease in the selectivity of the ethanol conversion to coke with the increase in the flow rate of the reactants (Figure 8) also results from the shortening of the residence time of the reactants.
Coke can be formed not only from the decomposition of ethanol (R17) but also in several sequential reactions (R19–R21):
2CO ⇆ C + CO2
CO + H2 ⇆ C + H2O
CO2 + 2H2 ⇆ C + 2H2O
Surprisingly, the concentration of CH4 remained unchanged, although similarly to C2H2 and C2H4, its concentration should decrease with the progress of steam reforming of hydrocarbons. The consumption of CH4 in the reforming was probably compensated by the production of CH4 in the methanation (R22) and Sabatier (R23) reactions. The high concentration of H2 and CO promoted methanation (R22), and the increase in the CO2 concentration accelerated the Sabatier reactions (R23):
3H2 + CO ⇆ CH4 + H2O
4H2 + CO2 ⇆ CH4 + 2H2O
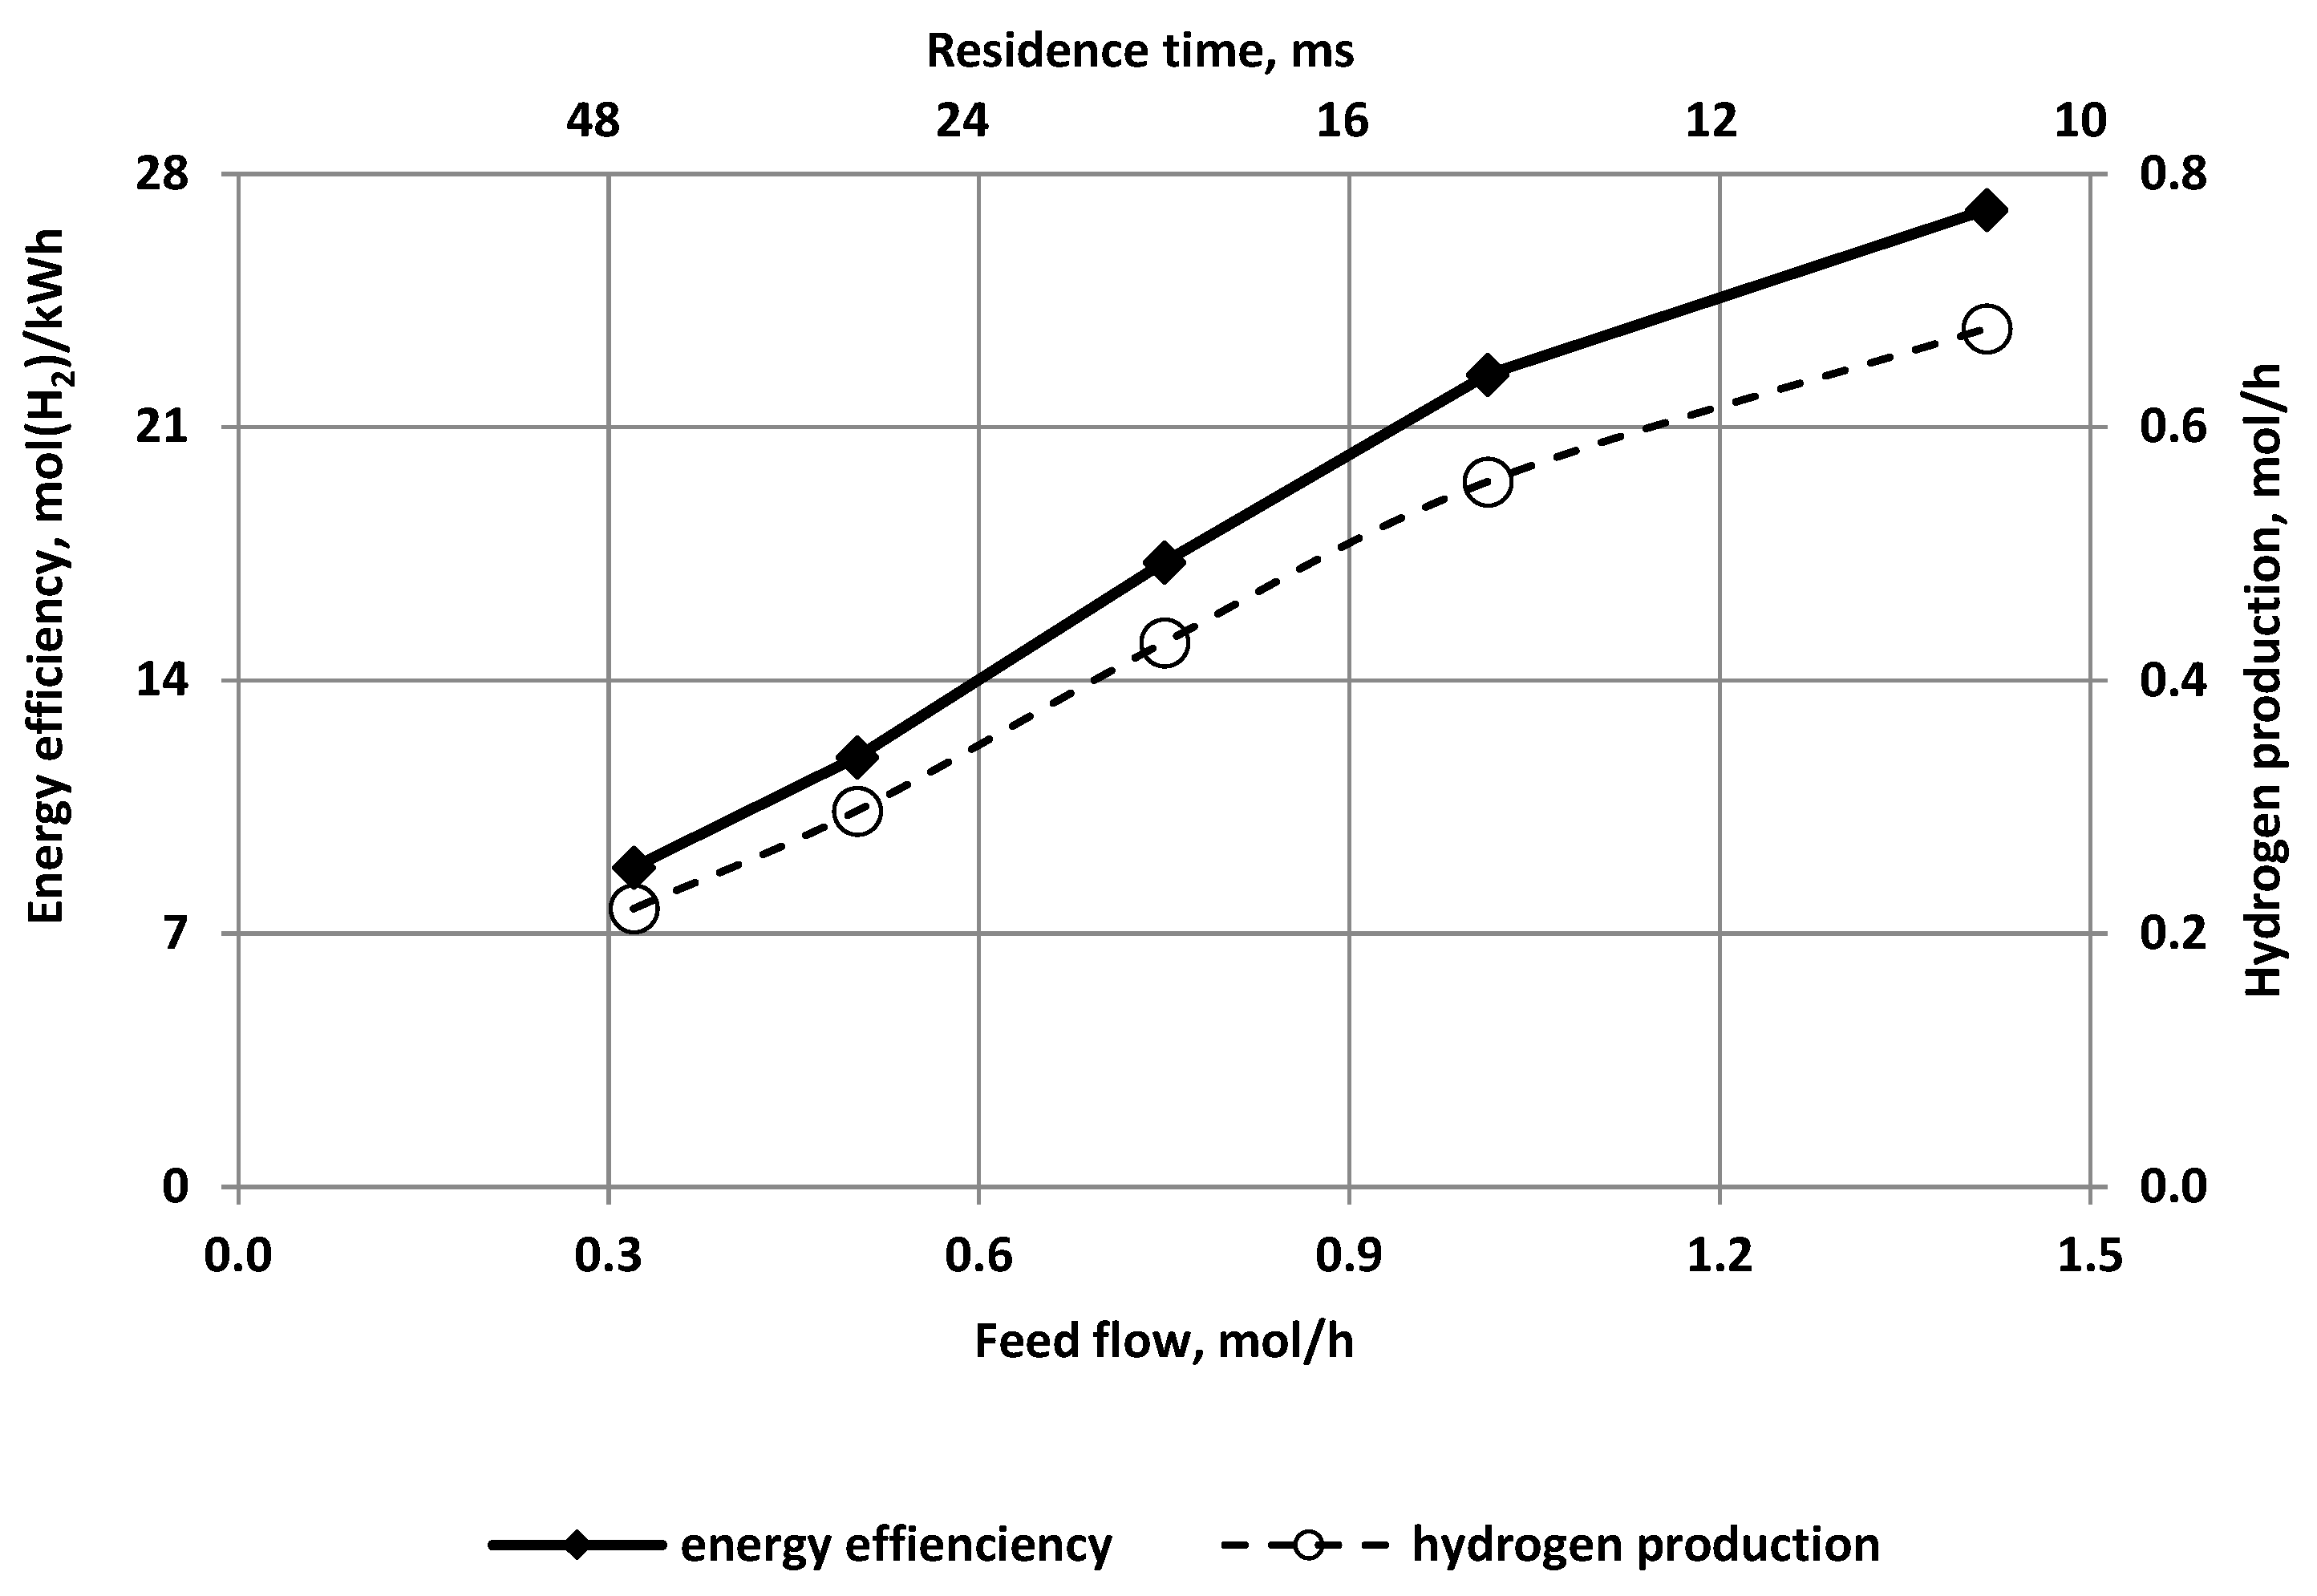
The increase in the feed flow increased the hydrogen production and the energy efficiency of hydrogen production (Figure 9). The increase in hydrogen production resulted from the introduction of more reactants into the reactor so that even with a lower conversion, the production was higher. On the other hand, the increase in the energy efficiency of hydrogen production resulted from the decrease in ethanol conversion. Low ethanol conversion means that the system is further away from thermodynamic equilibrium as the short residence time of the reactants prevented reaching this equilibrium. The greater the shift of the system from equilibrium, the faster the chemical reactions run because there are many substrates and few reaction products. Therefore, the increase in the feed flow caused a decrease in ethanol conversion and a greater shift of the composition of the reaction mixture from the state of thermodynamic equilibrium. As a result, the rate of chemical reactions was faster. A faster reaction rate resulted in better utilization of the energy fed to the reactor. The disadvantages of reducing the residence time of the reactants were low ethanol conversions and a significant amount of substrate was left unused. The same effect of changing the feed flow was observed previously in the barrier discharge reactor [15]. Additionally, in other plasma processes, reducing the plasma treatment time while maintaining the same discharge power reduced the conversion of substrates [45].

4. Conclusions

Ethanol can be an excellent raw material for the production of green hydrogen as it is produced in the fermentation process from biomass. CO2 emitted in the production of ethanol and hydrogen is re-consumed by plants. As a result, hydrogen production from ethanol is a zero-emission method. Unfortunately, despite extensive research, a cost-effective method of producing hydrogen from ethanol has not yet been developed. The main problem is coke formation causing deactivation of catalysts. The use of excess water reduces coking but requires more energy to heat water, making the hydrogen production process unprofitable. From an energy point of view, it is most advantageous to use a stoichiometric water to ethanol ratio equal to 3, which makes it impossible to use catalysts. On the other hand, coke does not interfere with plasma reactors’ operation if they are correctly constructed. In this work, a plasma reactor was used, in which plasma was generated by a spark discharge insensitive to coking. The coke was removed from the reactor by the gaseous product stream. A significant advantage of the spark discharge was the possibility of generating it from a mixture of water and ethanol without introducing additional gases facilitating electric breakdown. The reactor used was characterized by high flexibility. The tests were conducted with a feed flow from 0.32 to 1.42 mol/h and discharge power from 15.4 to 54.7 W.
The discharge power affected the ethanol conversion, hydrogen production, and energy efficiency of the hydrogen production. The ethanol conversion and hydrogen production increased with increasing discharge power, while the energy yield was maximum at 25 W.
The feed flow influenced ethanol conversion, hydrogen production, energy efficiency, and gas composition. The ethanol conversion decreased with increasing the feed flow, while the hydrogen production and energy efficiency increased. The concentrations of H2, CO2, C2H2, and C2H4 decreased with the increase in the feed flow, while the concentration of CO increased. The CH4 concentration did not change. Increasing the feed flow reduced the selectivity of ethanol conversion to coke, which is a favorable phenomenon.
Although the efficiency of hydrogen production changed with the change of process conditions, the concentration of hydrogen was consistently high and ranged from 57.5 to 61.5%. Carbon monoxide was also formed in large quantities. Much less carbon dioxide, methane, acetylene, and ethylene were produced. The concentration of hydrogen is sufficient to supply solid oxide fuel cells with such gas. Typically, carbon monoxide and hydrocarbons do not interfere with the operation of these cells. In the high operating temperature of these cells, these compounds will be oxidized, and the heat of their oxidation heats the cell.
The high concentration of carbon monoxide (21–24.3%) in the produced gas indicates that hydrogen production can be significantly increased by increasing the CO conversion in the water-gas shift reaction. This reaction occurs to a small extent in a spark discharge, evidenced by a low CO2 concentration (3.7–6.1%).

Author Contributions

Conceptualization, B.U.; methodology, B.U., M.M. and Ł.N.; validation, B.U. and K.K.; formal analysis, B.U.; investigation, B.U., Ł.N. and M.M.; resources, B.U. and K.K.; data curation, B.U.; writing—original draft preparation, B.U.; writing—review and editing, B.U.; supervision, B.U.; funding acquisition, B.U. and K.K. All authors have read and agreed to the published version of the manuscript.

Funding

This research was funded by Warsaw University of Technology, grant number I-Chem.2 and the APC was funded by Warsaw University of Technology.

Institutional Review Board Statement

Not applicable.

Informed Consent Statement

Not applicable.

Data Availability Statement

Not applicable.

Conflicts of Interest

The authors declare no conflict of interest. The funders had no role in the design of the study; in the collection, analyses, or interpretation of data; in the writing of the manuscript, or in the decision to publish the results.

References

  1. Jozwiak, L.; Balcerzak, J.; Tyczkowski, J. Plasma-Deposited Ru-Based Thin Films for Photoelectrochemical Water Splitting. Catalysts 2020, 10, 278. [Google Scholar] [CrossRef] [Green Version]
  2. Kierzkowska-Pawlak, H.; Tyczkowski, J.; Jarota, A.; Abramczyk, H. Hydrogen production in liquid water by femtosecond laser-induced plasma. Appl. Energy 2019, 247, 24–31. [Google Scholar] [CrossRef]
  3. Burlica, R.; Hnatiuc, B.; Hnatiuc, E.; Ursachi, M. Effect of electrical current on H2/H2O2 generation in non-thermal plasma gliding arc reactors. Environ. Eng. Manag. J. 2011, 10, 579–583. [Google Scholar] [CrossRef]
  4. Dey, G.R.; Zode, S.D.; Namboodiri, V. Application of plasma for efficient H2 production: A realism of copper electrode in single dielectric barrier discharge reactor. Phys. Plasmas 2018, 25, 103508. [Google Scholar] [CrossRef]
  5. Kirkpatrick, M.J.; Locke, B.R. Hydrogen, Oxygen, and Hydrogen Peroxide Formation in Aqueous Phase Pulsed Corona Electrical Discharge. Ind. Eng. Chem. Res. 2005, 44, 4243–4248. [Google Scholar] [CrossRef]
  6. García, R.; Gil, M.; Rubiera, F.; Chen, D.; Pevida, C. Renewable hydrogen production from biogas by sorption enhanced steam reforming (SESR): A parametric study. Energy 2020, 218, 119491. [Google Scholar] [CrossRef]
  7. Kim, H.J.; Chun, Y.N. Conversion of Biogas to Renewable Energy by Microwave Reforming. Energies 2020, 13, 4093. [Google Scholar] [CrossRef]
  8. Czylkowski, D.; Hrycak, B.; Jasiński, M.; Dors, M.; Mizeraczyk, J. Hydrogen production by conversion of ethanol injected into a microwave plasma. Eur. Phys. J. D 2017, 71, 321. [Google Scholar] [CrossRef]
  9. Baránková, H.; Bardos, L.; Bardos, A. Non-Conventional Atmospheric Pressure Plasma Sources for Production of Hydrogen. MRS Adv. 2018, 3, 921–929. [Google Scholar] [CrossRef]
  10. Bardos, L.; Baránková, H.; Bardos, A. Production of Hydrogen-Rich Synthesis Gas by Pulsed Atmospheric Plasma Submerged in Mixture of Water with Ethanol. Plasma Chem. Plasma Process. 2016, 37, 115–123. [Google Scholar] [CrossRef] [Green Version]
  11. Zhu, T.; Sun, B.; Zhu, X.; Wang, L.; Xin, Y.; Liu, J. Mechanism analysis of hydrogen production by microwave discharge in ethanol liquid. J. Anal. Appl. Pyrolysis 2021, 156, 105111. [Google Scholar] [CrossRef]
  12. Wang, B.; Ge, W.; Lü, Y.; Yan, W. H2 production by ethanol decomposition with a gliding arc discharge plasma reactor. Front. Chem. Sci. Eng. 2013, 7, 145–153. [Google Scholar] [CrossRef]
  13. Du, C.; Ma, D.; Wu, J.; Lin, Y.; Xiao, W.; Ruan, J.; Huang, D. Plasma-catalysis reforming for H2 production from ethanol. Int. J. Hydrogen Energy 2015, 40, 15398–15410. [Google Scholar] [CrossRef]
  14. Wang, B.; Lü, Y.; Zhang, X.; Hu, S. Hydrogen generation from steam reforming of ethanol in dielectric barrier discharge. J. Nat. Gas Chem. 2011, 20, 151–154. [Google Scholar] [CrossRef]
  15. Ulejczyk, B.; Nogal, Ł.; Młotek, M.; Krawczyk, K. Hydrogen production from ethanol using dielectric barrier discharge. Energy 2019, 174, 261–268. [Google Scholar] [CrossRef]
  16. Ulejczyk, B.; Nogal, Ł.; Młotek, M.; Falkowski, P.; Krawczyk, K. Hydrogen production from ethanol using a special multi-segment plasma-catalytic reactor. J. Energy Inst. 2021, 95, 179–186. [Google Scholar] [CrossRef]
  17. Hu, Y.; Li, G.; Yang, Y.; Gao, X.; Lu, Z. Hydrogen generation from hydro-ethanol reforming by DBD-plasma. Int. J. Hydrogen Energy 2012, 37, 1044–1047. [Google Scholar] [CrossRef]
  18. Zhu, X.; Hoang, T.; Lobban, L.L.; Mallinson, R.G. Low CO content hydrogen production from bioethanol using a combined plasma reforming–catalytic water gas shift reactor. Appl. Catal. B Environ. 2010, 94, 311–317. [Google Scholar] [CrossRef]
  19. Xin, Y.; Sun, B.; Zhu, X.; Yan, Z.; Zhao, X.; Sun, X. Hydrogen production from ethanol decomposition by pulsed discharge with needle-net configurations. Appl. Energy 2017, 206, 126–133. [Google Scholar] [CrossRef]
  20. Burlica, R.; Shih, K.-Y.; Hnatiuc, B.; Locke, B.R. Hydrogen Generation by Pulsed Gliding Arc Discharge Plasma with Sprays of Alcohol Solutions. Ind. Eng. Chem. Res. 2011, 50, 9466–9470. [Google Scholar] [CrossRef]
  21. Chernyak, V.Y.; Iukhymenko, V.V.; Iukhymenko, K.V.; Oberemok, Y.A.; Tretiakov, D.D.; Fedirchyk, I.I. Plasmochemical Synthesis of Optically Active Substances. IEEE Trans. Plasma Sci. 2021, 49, 1050–1054. [Google Scholar] [CrossRef]
  22. Ulejczyk, B.; Nogal, Ł.; Jóźwik, P.; Młotek, M.; Krawczyk, K. Plasma-Catalytic Process of Hydrogen Production from Mixture of Methanol and Water. Catalysts 2021, 11, 864. [Google Scholar] [CrossRef]
  23. Panda, N.R.; Sahu, D. Enhanced hydrogen generation efficiency of methanol using dielectric barrier discharge plasma methodology and conducting sea water as an electrode. Heliyon 2020, 6, e04717. [Google Scholar] [CrossRef] [PubMed]
  24. Tsymbalyuk, A.N.; Levko, D.S.; Chernyak, V.Y.; Martysh, E.V.; Nedybalyuk, O.A.; Solomenko, E.V. Influence of the gas mixture temperature on the efficiency of synthesis gas production from ethanol in a nonequilibrium plasma. Tech. Phys. 2013, 58, 1138–1143. [Google Scholar] [CrossRef]
  25. Palma, V.; Ruocco, C.; Meloni, E.; Ricca, A. Influence of Catalytic Formulation and Operative Conditions on Coke Deposition over CeO2-SiO2 Based Catalysts for Ethanol Reforming. Energies 2017, 10, 1030. [Google Scholar] [CrossRef] [Green Version]
  26. Matus, E.; Sukhova, O.; Ismagilov, I.; Kerzhentsev, M.; Stonkus, O.; Ismagilov, Z. Hydrogen Production through Autothermal Reforming of Ethanol: Enhancement of Ni Catalyst Performance via Promotion. Energies 2021, 14, 5176. [Google Scholar] [CrossRef]
  27. Ulejczyk, B.; Jóźwik, P.; Młotek, M.; Krawczyk, K. A Promising Cobalt Catalyst for Hydrogen Production. Catalysts 2022, 12, 278. [Google Scholar] [CrossRef]
  28. Saksono, N.; Batubara, T.; Bismo, S. Hydrogen production by plasma electrolysis reactor of KOH-ethanol solution. IOP Conf. Ser. Mater. Sci. Eng. 2016, 162, 012010. [Google Scholar] [CrossRef]
  29. Saksono, N.; Sasiang, J.; Rosalina, C.D.; Budikania, T. Hydrogen Generation by Koh-Ethanol Plasma Electrolysis Using Double Compartement Reactor. IOP Conf. Ser. Mater. Sci. Eng. 2018, 316, 012011. [Google Scholar] [CrossRef] [Green Version]
  30. Nedybaliuk, O.A.; Chernyak, V.Y.; Fedirchyk, I.I.; Demchina, V.P.; Popkov, V.S.; Bogaenko, M.V.; Iukhymenko, V.V.; Klochok, N.V.; Martysh, E.V.; Bortyshevsky, V.A.; et al. Plasma-Catalytic Reforming of Biofuels and Diesel Fuel. IEEE Trans. Plasma Sci. 2017, 45, 1803–1811. [Google Scholar] [CrossRef]
  31. Tande, L.; Resendiz-Mora, E.; Dupont, V. Bioh2, Heat and Power from Palm Empty Fruit Bunch via Pyrolysis-Autothermal Reforming: Plant Simulation, Experiments, and CO2 Mitigation. Energies 2021, 14, 4767. [Google Scholar] [CrossRef]
  32. Bo, Z.; Yan, J.; Li, X.; Chi, Y.; Cen, K. Nitrogen dioxide formation in the gliding arc discharge-assisted decomposition of volatile organic compounds. J. Hazard. Mater. 2009, 166, 1210–1216. [Google Scholar] [CrossRef] [PubMed]
  33. Benstaali, B.; Boubert, P.; Cheron, B.G.; Addou, A.; Brisset, J.L. Density and Rotational Temperature Measurements of the OH° and NO° Radicals Produced by a Gliding Arc in Humid Air. Plasma Chem. Plasma Process. 2002, 22, 553–571. [Google Scholar] [CrossRef]
  34. Ulejczyk, B.; Schmidt-Szałowski, K.; Nogal, Ł.; Kuca, B.; Krawczyk, K.; Młotek, M. Decomposition of carbon tetrachloride in the reactor of dielectric barrier discharge with different power supplies. Eur. Phys. J. Appl. Phys. 2013, 61, 24324. [Google Scholar] [CrossRef]
  35. Burlica, R.; Finney, W.C.; Locke, B.R. Effects of the Voltage and Current Waveforms and Discharge Power on Hydrogen Peroxide Formation in Water-Spray Gliding Arc Reactors. IEEE Trans. Ind. Appl. 2013, 49, 1098–1103. [Google Scholar] [CrossRef]
  36. Ulejczyk, B.; Krawczyk, K.; Młotek, M.; Schmidt-Szałowski, K.; Nogal, Ł.; Kuca, B. A comparison of carbon tetrachloride decomposition using spark and barrier discharges. Open Chem. 2014, 13, 509–516. [Google Scholar] [CrossRef]
  37. Krawczyk, K.; Jodzis, S.; Lamenta, A.; Kostka, K.; Ulejczyk, B.; Schmidt-Szalowski, K. Carbon Tetrachloride Decomposition by Pulsed Spark Discharges in Oxidative and Nonoxidative Conditions. IEEE Trans. Plasma Sci. 2011, 39, 3203–3210. [Google Scholar] [CrossRef]
  38. Ulejczyk, B.; Nogal, Ł.; Młotek, M.; Krawczyk, K. Enhanced production of hydrogen from methanol using spark discharge generated in a small portable reactor. Energy Rep. 2021, 8, 183–191. [Google Scholar] [CrossRef]
  39. Dvonč, L.; Janda, M. Study of Transient Spark Discharge Properties Using Kinetic Modeling. IEEE Trans. Plasma Sci. 2015, 43, 2562–2570. [Google Scholar] [CrossRef]
  40. Janda, M.; Martišovitš, V.; Hensel, K.; Dvonč, L.; Machala, Z. Measurement of the electron density in Transient Spark discharge. Plasma Sources Sci. Technol. 2014, 23, 065016. [Google Scholar] [CrossRef] [Green Version]
  41. Oguri, T.; Shimamura, K.; Shibuta, Y.; Shimojo, F.; Yamaguchi, S. Bond dissociation mechanism of ethanol during carbon nanotube synthesis via alcohol catalytic CVD technique: Ab initio molecular dynamics simulation. Chem. Phys. Lett. 2014, 595–596, 185–191. [Google Scholar] [CrossRef]
  42. Matus, M.H.; Nguyen, M.T.; Dixon, D.A. Theoretical Prediction of the Heats of Formation of C2H5O•Radicals Derived from Ethanol and of the Kinetics of β-C−C Scission in the Ethoxy Radical. J. Phys. Chem. A 2006, 111, 113–126. [Google Scholar] [CrossRef]
  43. Maksyutenko, P.; Rizzo, T.R.; Boyarkin, O.V. A direct measurement of the dissociation energy of water. J. Chem. Phys. 2006, 125, 181101. [Google Scholar] [CrossRef] [PubMed]
  44. Sarmiento, B.; Brey, J.J.; Viera, I.G.; Gonzales-Elipe, A.R.; Cortino, J.; Roco, V.J. Hydrogen production by reforming of hydrocarbons and alcohols in a dielectric barrier discharge. J. Power Sources 2007, 169, 140–143. [Google Scholar] [CrossRef]
  45. Sahu, D. Degradation of Industrial Phenolic Wastewater Using Dielectric Barrier Discharge Plasma Technique. Russ. J. Appl. Chem. 2020, 93, 905–915. [Google Scholar] [CrossRef]
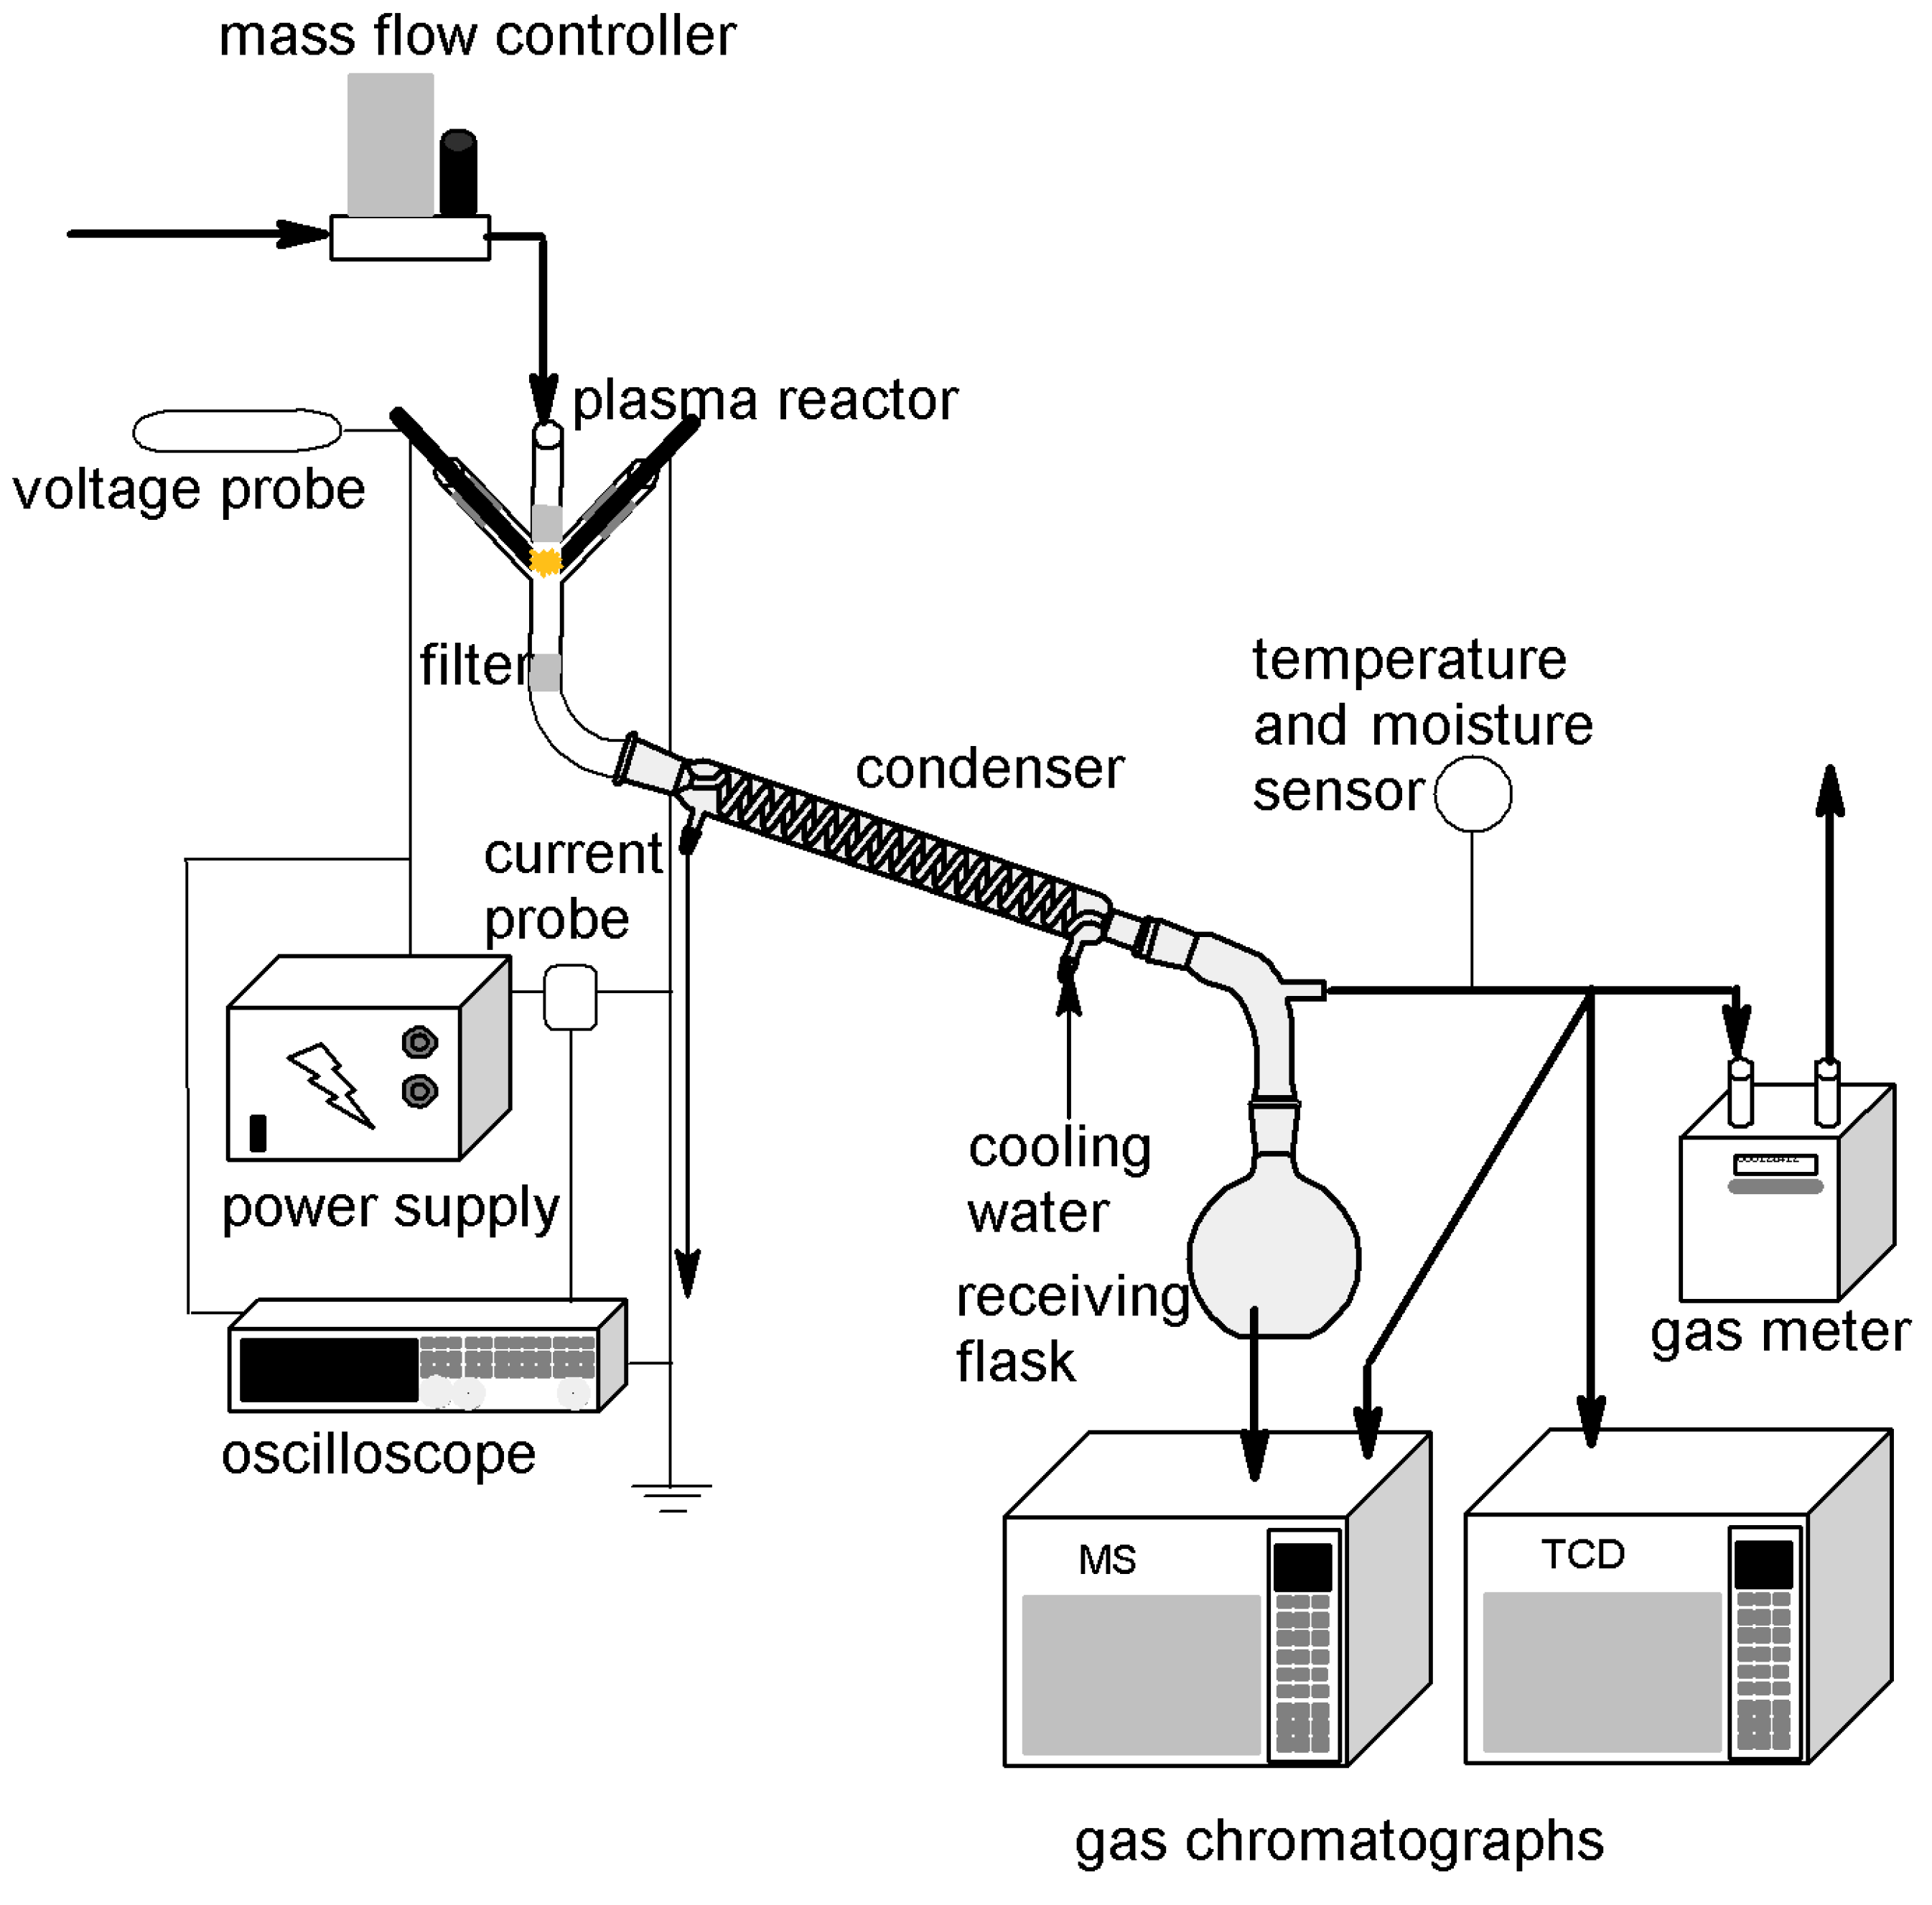
Figure 1. The scheme of the apparatus.
Energies 15 02777 g001
Figure 2. The waveforms of voltage and current at the discharge power: (a) 15.4 W, (b) 54.7 W.
Energies 15 02777 g002
Figure 3. The energy bond in ethanol and water.
Energies 15 02777 g003
Figure 4. The reactor wall temperature for various discharge power: (a) 15.4 W, (b) 24.8 W, (c) 40.1 W, (d) 54.7 W. Feed flow—1 mol/h.
Energies 15 02777 g004
Figure 5. The effect of the discharge power on the energy efficiency and hydrogen production. Feed flow—1 mol/h.
Energies 15 02777 g005
Figure 6. The effect of the discharge power on the ethanol conversion and hydrogen yield. Feed flow—1 mol/h.
Energies 15 02777 g006
Figure 7. The effect of the feed flow on the ethanol conversion and hydrogen yield. Discharge power—25 W.
Energies 15 02777 g007
Figure 8. The effect of the feed flow on the selectivity of ethanol conversion to coke. Discharge power—25 W.
Energies 15 02777 g008
Figure 9. The effect of the feed flow on the energy efficiency and hydrogen production. Discharge power—25 W.
Energies 15 02777 g009
Table 1. The effect of the discharge power on the composition of the cooled gas. Feed flow—1 mol/h.
Power, WConcentration, %
H2COCH4CO2C2H2C2H4C2H5OHH2O
15.457.123.34.33.23.12.05.02.0
19.857.923.64.33.81.41.95.12.0
24.857.223.44.44.31.21.15.22.1
29.758.224.34.03.51.41.15.32.1
35.457.523.93.83.41.91.95.42.2
40.157.724.03.83.41.91.95.12.1
45.657.724.03.73.51.91.95.22.1
54.757.523.93.83.42.02.05.32.1
Table 2. The effect of the discharge power on the composition of the cooled gas. Feed flow—1 mol/h.
Feed Flow Rate mol/hResidence Time, msConcentration, %
H2COCH4CO2C2H2C2H4C2H5OHH2O
0.324561.521.04.26.12.02.01.21.9
0.502958.921.54.25.41.71.84.42.0
0.751958.622.64.24.71.41.55.02.0
1.011458.223.44.44.31.21.15.22.1
1.421058.024.34.33.71.11.05.42.2
Publisher’s Note: MDPI stays neutral with regard to jurisdictional claims in published maps and institutional affiliations.