Article

Study on Anode Catalyst Layer Configuration for Proton Exchange Membrane Fuel Cell with Enhanced Reversal Tolerance and Polarization Performance

1
State Key Laboratory of Engines, 135 Yaguan Rd., Tianjin 300350, China
2
Powertrain Department, General Institute of FAW, Changchun 130011, China
*
Authors to whom correspondence should be addressed.
These authors contributed equally to this work.
Energies 2022, 15(8), 2732; https://doi.org/10.3390/en15082732
Submission received: 9 March 2022 / Revised: 30 March 2022 / Accepted: 6 April 2022 / Published: 8 April 2022
(This article belongs to the Special Issue Design, Testing and Fault Diagnosis for Fuel Cells)

Abstract

:
Hydrogen starvation leads to the extreme deterioration of fuel cell performance due to the induced voltage reversal and carbon corrosion in the anode catalyst layer (ACL) and gas diffusion layer. In this paper, reversal-tolerant anodes (RTAs) with different ACL configurations are proposed, where IrOx/C is used as a water electrolysis catalyst. Experimental results show that the separate IrOx/C catalyst layer of MEA samples, layered reversal-tolerant catalyst-coated membrane (layered-RTA), and reversal-tolerant gas diffusion electrode (GDE-RTA) significantly enhance the reversal tolerance and cell performance compared to conventional anode and common RTA consisting of a homogeneous catalyst layer mixed with IrOx/C and Pt/C (hybrid-RTA). Of these, GDE-RTA possessed a reversal tolerance time of 86 min, a power density of 1.42 W cm−2, and a minimum degradation rate of 2.4 mV min−1, suggesting it to be the best RTA structure. Cyclic voltammetry and electrochemical impedance spectrum were used to detect the properties of each sample. Additionally, the degradation mechanisms of the three RTAs are thoroughly investigated and discussed by means of microstructural characterization through scanning electron microscopy and transmission electron microscopy. This work provides novel ideas for the fabrication of a robust RTA by tuning the ACL configuration, which is practical for the commercialization of fuel cells.

1. Introduction

As hydrogen utilization is becoming a shortcut to carbon neutrality, proton exchange membrane fuel cells (PEMFCs) are receiving unprecedented attention [1,2,3,4]. Fuel cell vehicles (FCVs) powered by PEMFCs are considered to be a green transportation method, as they consume hydrogen and oxygen, while only producing water. However, durability is a key limiting factor for the widespread commercialization of fuel cells, with the cells exhibiting degradation in performance under severe operating conditions such as variable loads, open-circuit voltage (OCV) conditions, CO poisoning, and fuel starvation [5,6,7,8,9,10,11,12]. In particular, cell voltage reversal induced by fuel starvation happens in the stack in the case of the water flooding or erratic load increment, which leads to extensive damage to the anode catalyst layer (ACL) within a short period of time via the carbon corrosion reaction (CCR), shown as Equations (1) and (2) [13,14].
C + 2 H 2 O CO 2 + 4 H + + 4 e ,   E 298 K 0 = 0.21   V SHE  
C + H 2 O CO + 2 H + + 2 e ,   E 298 K 0 = 0.518   V SHE  
Methods such as optimizing control approaches of PEMFCs and material-based innovation of anode have been proposed to mitigate the performance deterioration caused by voltage reversal, therein developing reversal tolerance anode (RTA) is the most effective solution.
The common implementation to an RTA is introducing water electrolysis catalyst [15,16,17,18,19,20,21] into the anode, which induces oxygen evolution reaction (OER) instead of CCR to satisfy the charge conservation according to Equation (3).
H 2 O 1 2 O 2 + 2 H + + 2 e ,   E 298 K 0 = 1.229   V SHE    
Recently, researchers have developed a variety of high-performance OER catalysts for RTA to enhance the durability of PEMFCs. Labi et al. [22] synthesized an IrOx catalyst supported on graphitized XC72R as the OER catalyst to build an RTA, whose membrane electrode assembly (MEA) showed equivalent performance to the commercial MEA at a current loading of 1 A cm−2 and exhibited 18.2% potential loss at a current loading of 1.2 A cm−2 after a 25 min reversal test. Roh et al. [21] deposited monodisperse IrOx (5 nm) on Pt/C as the anode catalyst, and the obtained MEA achieved a 240 min cell reversal time, almost 4-fold that of the conventional IrOx. Lee et al. [23] prepared a Pt-IrOx/C catalyst for RTA with different commercial carbon supports and found that Pt-IrOx anchored on more defective carbon support exhibited a longer tolerance time (44 h) for a higher surface area of support, enhancing the OER activity and CO tolerance of the catalyst.
Despite novel OER catalysts, the configuration of the ACL has a paramount impact on the reversal tolerance properties. Pan et al. [24] reported that the thickness of the RTA catalyst layer had an impact on reversal tolerance, where a 2 µm ultra-thin catalyst layer, higher ionomer/carbon ratio, and Pt loading could prolong the reversal time. Litster et al. [25] put forward an RTA containing a hydrogen oxidation reaction (HOR) catalyst layer with Pt black and a 13 µm thin Ti OER layer, where the modified MEA showed a cell voltage degradation rate of 0.049% loss per reversal minute, and an approximately 310-fold increase in reversal time compared to that of the MEA with the conventional anode. Zhou et al. [26] used IrO2/RuO2 as a water electrolysis catalyst and investigated the performance decay mechanism of RTA with different OER catalyst distribution, and the results showed that spraying OER catalyst on the surface of the HOR catalyst layer contributed to obtaining a robust anode. Although building a separate OER catalyst layer was proved to be efficient for enhancing the durability of RTA, the distinct characteristics of different OER catalyst locations should be further discussed.
Three types of RTAs were prepared in the present work by altering the loading method of the IrOx/C catalyst, including common hybrid ACL, layered deposition of Pt/C and IrOx/C onto the proton exchange membrane (PEM), and loading IrOx/C onto the microporous layer of the gas diffusion layer (GDL) to build a reversal-tolerant gas diffusion electrode (GDE). The reversal tolerance time (RTT) is deemed to be the core index of the fabricated MEAs. Additionally, electrochemical diagnostic techniques including polarization, electrochemical impedance spectroscopy (EIS), and cyclic voltammetry (CV) were employed to evaluate the state of the MEAs, while microstructure characterizations such as scanning electron microscopy (SEM) and transmission electron microscopy (TEM) were used to investigate the degradation mechanism of the three RTAs.

2. Experimental Section

2.1. Materials

OER catalyst IrOx/C was prepared according to the literature [17,22,23]: 1.0 g H2IrCl6⋅6H2O (Sigma Aldrich, St. Louis, MO, USA) and 50 mL ethylene glycol (Aladdin, Shanghai, China) were added into tube, followed by ultrasonication till clarified liquid obtained. Next, graphitized Vulcan XC72R support was added into the solution, and sonicated for another 30 min to obtain homogeneous mixture, then adjusted the mixture to pH 11 with 0.1 M NaOH. Thereafter, microwave method was used to induce the formation of IrOx at 900 W for 2 min, and extra solvent was evaporated to obtain crude product. Finally, the crude was purified with deionized water and then calcined in air at 420 °C for 30 min to obtain the target IrOx/C; the amount of IrOx in the OER catalyst was fixed at 40 wt%. Specifically, 40% Pt/C with graphitized support (HPEC 130, Hydrogine Technology) and 60% Pt/C composed of poriferous support (HPEC 150, Hydrogine Technology) were chosen as anode and cathode catalyst respectively, in order to satisfy the requirements of durability and high power density. The proton exchange membrane (PEM), GDL, and ionomer resin were GORE M735.18, Toray HGX001, and Nafion® D520, respectively. In addition, other materials were at least chemically pure and used without further purification.

2.2. MEA Preparation

Firstly, 0.75 g catalyst was added into tube and wetted with 10.0 g deionized water, then 9 g Nafion ionomer and 30 g ethanol were added sequentially. Thereafter, the received ink was dispersed by high-speed shearing for at least 30 min, maintaining the temperature of the system below 10 °C. Next, catalyst-coated membranes (CCMs) were prepared by ultrasonic spraying, where the Pt/C loadings on the anode and cathode were 0.05 mg cm−2 and 0.3 mg cm−2, respectively, resulting in a normal MEA being obtained, with a conventional anode as a contrast. When it comes to MEA samples with different RTA configurations, the first approach is to prepare a common RTA by creating a hybrid Pt/C and IrOx/C catalyst layer (defined as hybrid-RTA), the second method is spraying IrOx/C ink onto the surface of the ACL to obtain a layer-by-layer reversal-tolerant CCM (named layered-RTA), and the last way is depositing IrOx/C onto the anode GDL to build a reversal-tolerant GDE (labeled as GDE-RTA). Specifically, the loading of IrOx/C is the same as for the anode Pt/C catalyst, at 0.05 mg cm−2, and all MEAs were pressed under 5 N m, with an active area of 50 cm2 (Figures S1 and S2). The structural schematic diagram and detailed description of the aforementioned MEAs are presented in Figure 1 and Table 1, respectively.

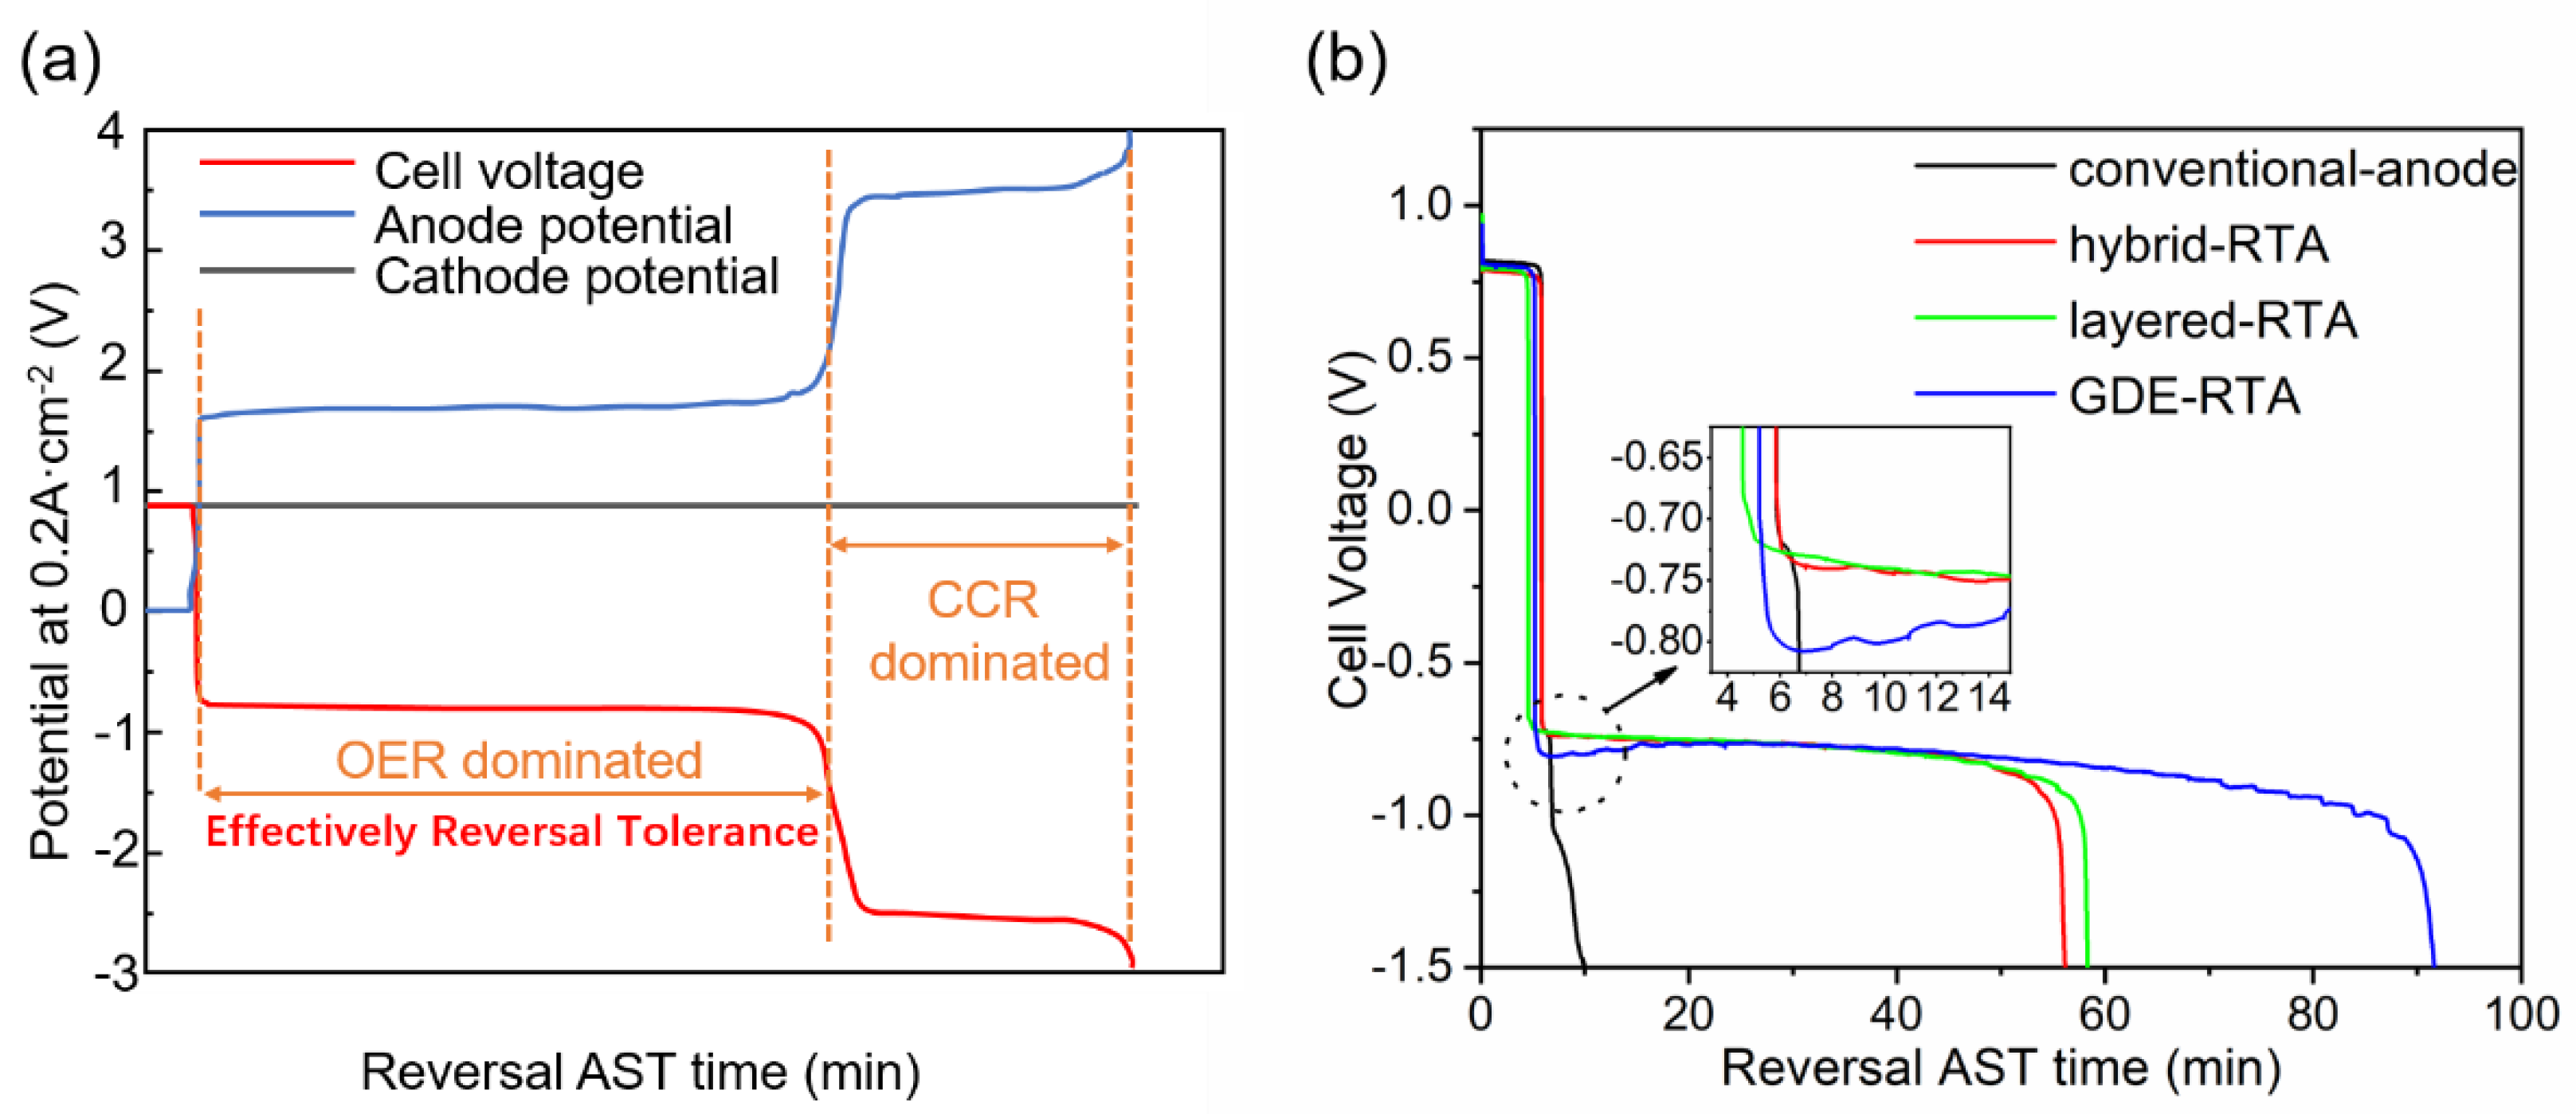
2.3. Reversal Tolerance Accelerated Stress Test (AST)

The reversal tolerances of the prepared MEAs were distinguished on the basis of chronopotentiometry, carried out on an Arbin LBT21084. As for the AST method, 0.2 A cm−2 DC electronic load was applied to a single cell, and the supplied H2 was replaced by 100% RH humidified N2 to simulate fuel starvation at the anode.

2.4. Electrochemical Diagnostics

I-V polarization testing of the MEAs was carried out using the fuel cell test system manufactured by Ningbo Bate Technology Co., Ltd. H2 was fed to the anode while air was fed to the cathode with a back pressure of 80 kPa, and the stoichiometric ratio of anode and cathode (λA/C) was 1.5/2. In addition, the anode and cathode were humidified to 70% RH and 80% RH, respectively, when the cell was operating at 75 °C. Cell performance decay rate (DR, mV min−1) was calculated using Equation (4):
DR = V BOT V EOT RTT  
where VBOT refers to the initial voltage at rated current density at the beginning of the reversal test (BOT), while VEOT is the measured voltage at rated current density at the end of the reversal test (EOT).
A Gamry electrochemical workstation (Reference 600) was used to further diagnose the state of MEA. The Ohmic resistance (ROhm) of a single cell was determined by EIS at a constant current load of 1 A cm−2. The electrochemical surface area (ECSA, m2 g−1) was used to evaluate the activation of the anode via CV measurements, in accordance with Equation (5):
ECSA = S C × v × M  
where S refers to the integral area of the HOR section (mA V), C is a constant for the HOR of 0.21 mC cm−2, v is the voltage sweep rate of 0.05 V s−1, and M stands for the weight of Pt on the electrode. Moreover, 0.5 SLPM 100% RH N2 was supplied to the anode, while the cathode served as a reference, corresponding to a value of 0.5 SLPM of fully humidified H2 under these conditions.

2.5. Microstructure Characterizations

The cross-section images of RTA were obtained by means of fragile breaking in liquid nitrogen and investigated using SEM (EVO MA 15, ZEISS). The particle size distribution of Pt and IrOx nanodots was determined on the basis of TEM (JEM-2100F), and the catalyst powder was scraped from the anode catalyst layer of the MEAs.

3. Results and Discussion

3.1. Reversal Durability of Prepared MEAs

Reversal tolerance is one of the essential abilities for the practical application of MEAs, and the RTT makes sense for evaluating anode durability. As can be seen in the schematic diagram shown in Figure 2a, the cell voltage displays three platforms during reversal AST. The first platform at around 0.8 V terminates as soon as the anode runs out of H2; then, the second platform at around −0.8 V is an OER-dominated region where the water electrolysis reaction supplies protons to satisfy the cell circuit; and the last platform below −1.5 V is a CCR-dominated region. According to the voltage reversal failure criterion [27], severe CCR will be greatly accelerated when the cell voltage is below −1.5 V, and even more dramatic at more negative potentials. Pt nanoparticles will fall from the carbon support and aggregate—circumstances that will lead to the complete damage of the MEAs. However, fuel cells should be able to meet the requirement that they can be reloaded even when undergoing reversal operation. Herein, −1.5 V is defined as the termination of the AST in this work, because the OER-dominated region is effectively reversal tolerant, thus protecting MEAs from anode catalyst failure.
All samples were pre-activated before the reversal AST, and then fuel starvation AST was carried out. Figure 2b presents the cell voltage during the accelerated durability test. The cell voltage drops to negative just a few seconds after H2 is replaced at the anode by fully humidified N2 at a constant current load of 0.2 A cm−2. It can be seen that the conventional anode without IrOx/C presents −1.5 V at almost 4.5 min after the cell voltage becomes minus, and the MEAs will rapidly break down if cell reversal continues. With respect to the three types of RTAs, the water electrolysis reaction is predominant at a voltage plateau of around −0.8 V, sustaining the current loop, and this process lasts for dozens of minutes, until an inflection point subsequently appears at which the voltage drops to −1.5 V. Specifically, the hybrid-RTA- and layered-RTA-type MEAs exhibit RTTs of about 50 min and 54 min, respectively, whereas the time is prolonged to 86 min when the MEA is composed of an anode with GDE-RTA. Therefore, we can preliminarily draw the conclusion that the conventional anode is hardly capable of cell reversal tolerance but introducing IrOx/C as catalyst is an effective means to build RTA. Furthermore, it should be noted that RTA with independent HOR and OER catalyst layers prolongs the RTT of MEAs, and in particular, spraying IrOx/C on the MPL to build GDE-RTA is much more effective. For hybrid-RTA, Pt/C and IrOx/C mix intensively, while Pt nanoparticles have already been proven to facilitate CCR [28,29,30,31] and give rise to sintering of IrOx, which restrains water electrolysis but accelerates cell failure. Interestingly, it can be found that GDE-RTA exhibits lower OER potential at the beginning of the reversal (−0.807 V) compared with hybrid-RTA and layered-RTA (around −0.726 V) in the enlarged image. We suggest that a protection hysteresis exists when the independent OER catalyst layer is loaded onto the GDL, because in this case, water electrolysis may not supply the proton for the anode half-reaction as early as the point at which hydrogen starvation occurs. In other words, the proton generated by OER in GDE needs a longer time to be transferred to the Pt/C layer, and during this time, the cell displays a more negative voltage with a greater degree of CCR, so as to be in accordance with the law of conservation of matter.

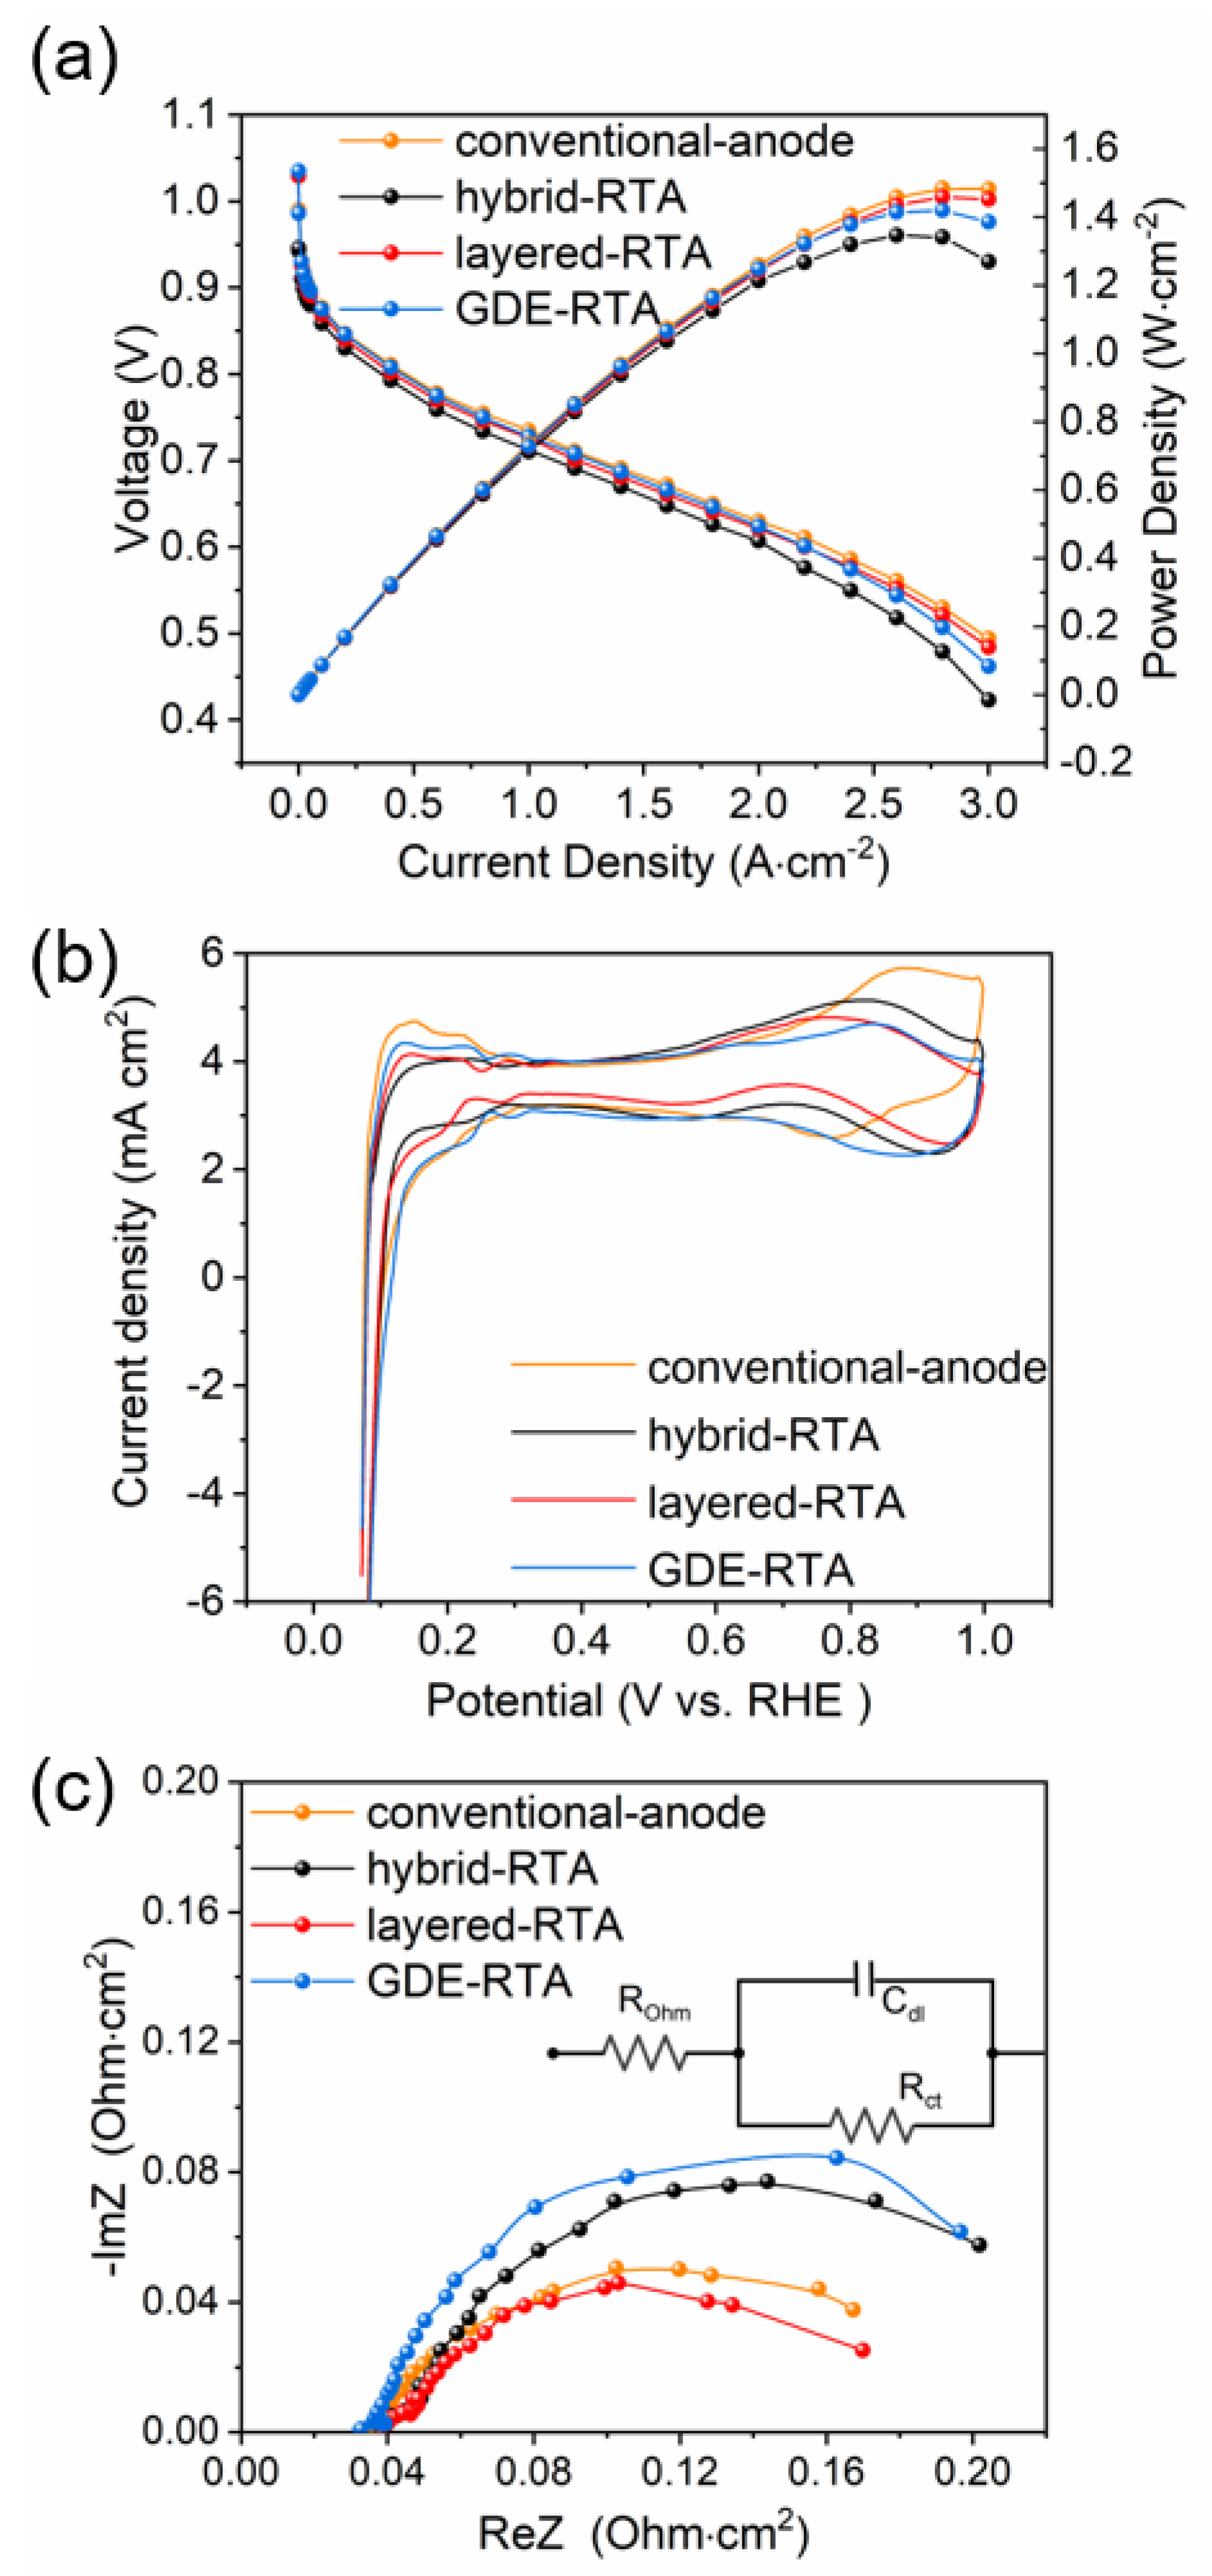
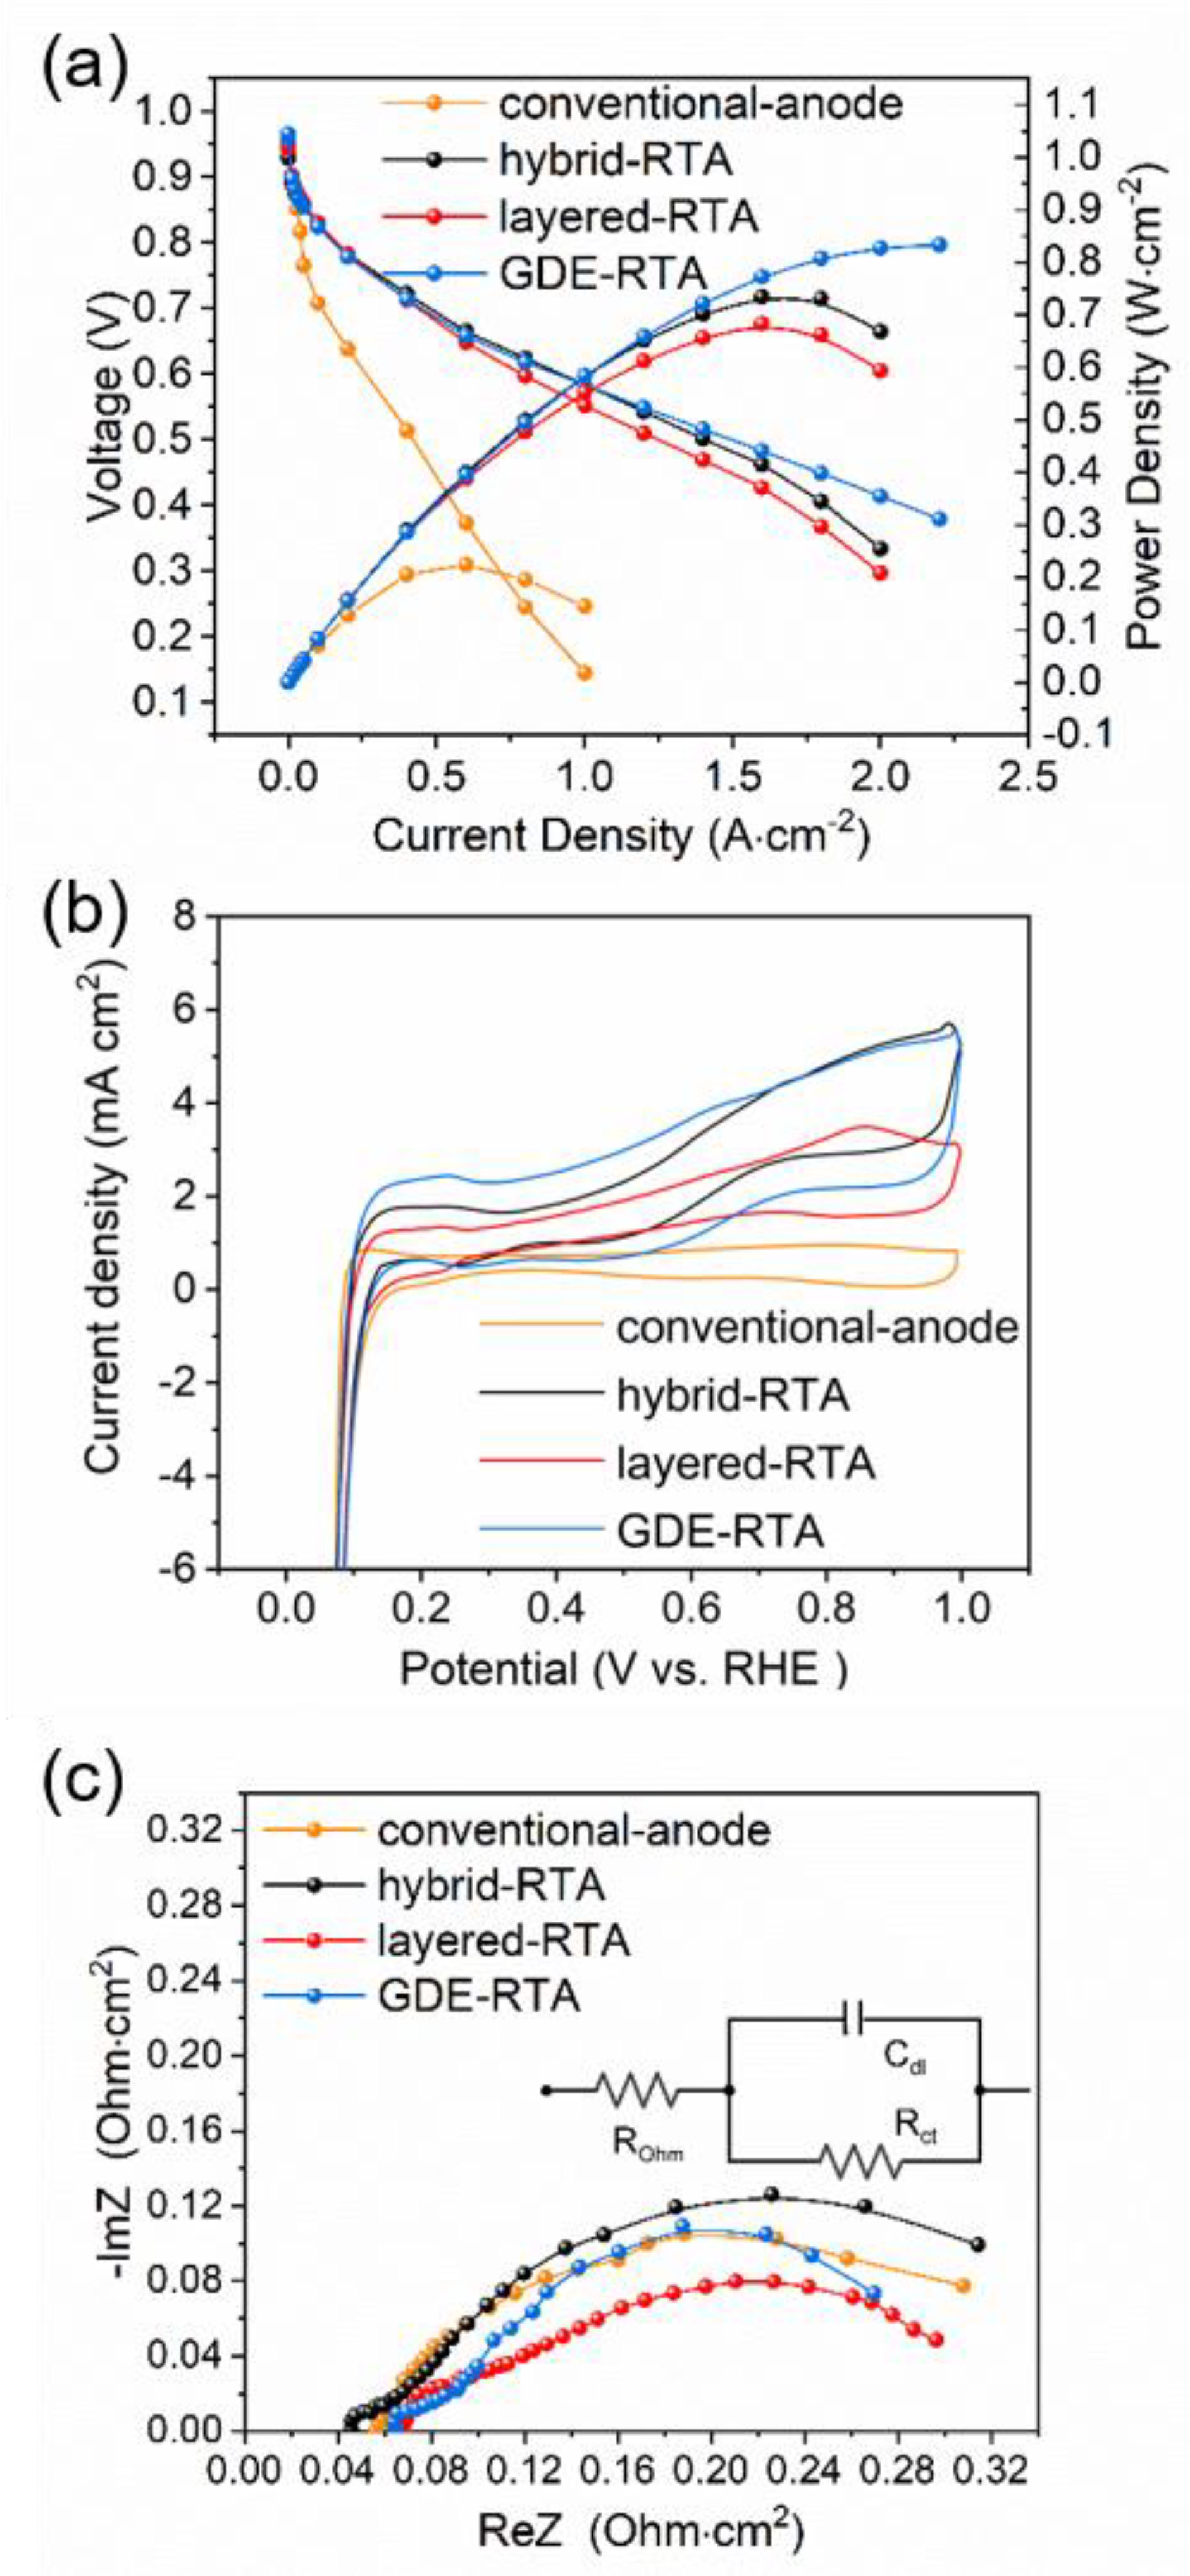
3.2. Electrochemical Characterization of Prepared MEAs

While MEAs with different RTA configurations show variant values of RTT, further electrochemical diagnostics were carried out to investigate the differences among the three types of RTA before and after the cell reversal AST. In practical fuel cell applications, power density and durability are of equal importance for a robust MEA, but with poor cell performance can also be unwelcome. Thus, cell polarization performance is the other essential evaluation criterion for MEAs with RTA. Additionally, electrochemical measurements including CV and EIS were used to determine the operating state of the three samples.
With respect to the fresh MEA samples, the conventional anode exhibits the highest cell performance, with a peak power density (PPD) of 1.48 W cm−2 and layered-RTA exhibits the second highest cell performance, with a peak power density (PPD) of 1.46 W cm−2, followed by GDE-RTA of 1.42 W cm−2 and hybrid-RTA of 1.35 W cm−2 (Figure 3a). It can be observed that the CV curves of the prepared MEAs presented in Figure 3b are significantly different from that of the conventional anode; in particular, the H desorption peak is indistinct. This phenomenon is consistent with the HOR catalyst loading being the same as for the OER catalyst (0.05 mg cm−2), while the absence of IrOx/C will interfere with the CV diagnosis of the Pt electrode [32]. However, in MEAs with an independent IrOx/C layer (layered-RTA and GDE-RTA), a more obvious H desorption signal appears than in hybrid-RTA with blended IrOx/C and Pt/C. According to the data listed in Table 2, the ECSA values of the conventional anode, hybrid-RTA, layered-RTA, and GDE-RTA are 36.8, 14.7, 27.4, and 28.7 m2 g−1, respectively. Although the interference of IrOx/C distorts the ECSA of the anode to some extent, the result still demonstrates that layered-RTA and GDE-RTA present better HOR catalytic activity than the hybrid-RTA type. This is in accordance with the conclusion presented in the literatures [18,26] that the hybrid IrOx/C nanoparticles cover the redox active sites of Pt/C to a limited extent, which adversely affects the HOR catalytic activity of anode. Therefore, ECSA analysis of MEA anodes provides an accessible explanation for layered-RTA and GDE-RTA displaying better polarization performance than hybrid-RTA.
For EIS characterization of prepared MEAs, the obtained Nyquist diagrams and equivalent circuit model are shown in Figure 3c. The intercept of the real axis refers to the Ohmic resistance (ROhm) detected at a high frequency of about 1 kHz, while the semiarc diameter at a low frequency of about 10 Hz is the coupling value of ROhm and the charge transfer resistance (Rct) of a single cell. On the basis of the high-frequency resistance, the four kinds of MEA possess the same ROhm value of about 0.0038 Ω cm2, which demonstrates that all single cells have been well assembled and that different IrOx/C depositing modes have a no-effect level impact on the internal resistance of cell. Nevertheless, GDE-RTA exhibits a lower power density than hybrid-RTA at high current density (>2.4 A cm−2), which can possibly be attributed to the fact that the IrOx/C layer in GDL increases the Rct value, especially in high-load operating conditions, when fast gas–liquid mass transfer and reactions occur. Usually, current density is set at 0.6 V, as the rated current density, and the cell voltage falloff at rated current density is set as the performance decay reference standard in this work. In this work, the rated current density of the three reversal-tolerant MEAs is 2 A cm−2, and the initial cell voltage (VBOT) of each sample is recorded in Table 2.
Figure 4 shows the electrochemical characterization of aged MEAs with three RTA structures at the end of the reversal test (EOT), and the corresponding analysis data are summarized in Table 3. In brief, all samples exhibit an obvious decrease in cell performance following reversal AST, such as lower PPD, decreased ECSA, and significantly increased ROhm.
Since the carbon support corrosion of the anode catalyst is time-dependently correlated with cell reversal, the degradation of the conventional anode is not apparent following the cell reversal test at short operation times of between 0 and −1.5 V. Therefore, in order to evaluate the reversal tolerance of the conventional anode according to its actual state, the reversal AST was immediately repeated five times in order to prolong the total reversal time to about 17 min. The corresponding results can be found in Figure S3 and Table S1 of the Supplementary Materials. Interestingly, the RTT becomes shorter with increasing iterations of the AST, while the voltage at 0.2 A cm−2 decreases simultaneously. This accounts for the cumulative corrosion of the carbon support exhibited by the conventional anode under such continuous reversal circumstances, leading to a sharp decay in the catalytic activity of the anode. Furthermore, the conventional anode displays significant performance degradation on the basis of the electrochemical characterization presented in Figure 4. Specifically, the EOT power density is 0.21 W cm−2, which represents an 85.8% decline when compared to the fresh sample, while the ROhm increases to 0.057 Ω cm2. It is worth noting that the anode ECSA is only 5.4 m2 g−1 with a retention of 14.6%, which is the main reason for the decline in performance. Moreover, aged conventional anodes cannot obtain their DR, because the cell is unable to be loaded to rated current density.
With respect to the three modified MEAs, hybrid-RTA, layered-RTA, and GDE-RTA display PPD values of 0.73, 0.68, and 0.83 W cm−2, respectively, with attenuation rates of 45.9%, 53.42%, and 41.5%, respectively. From the perspective of performance degradation at rated current density (2 A cm−2), hybrid-RTA shows a decrease in voltage from 0.607 V to 0.334 V, layered-RTA has a VBOT of 0.621 V and a VEOT of 0.297 V, and GDE-RTA exhibits voltages of 0.624 V and 0.414 V before and after reversal AST. It can be observed that layered-RTA exhibits the most severe DR value of 6.0 mV min−1, followed by hybrid-RTA at 5.5 mV min−1; meanwhile, GDE-RTA exhibits the minimum DR value, at 2.4 mV min−1.
Although water electrolysis dominates the reaction in the range from −0.7 V to −1.5 V [20,33], cumulative degradation of the cell occurs during the reversal test as a result of carbon support corrosion, which can also be detected on the basis of the ECSA shrinkage in the anode. As shown in Figure 4b, three atypical CV curves were obtained for hybrid-RTA, layered-RTA, and GDE-RTA after the reversal AST, which can be attributed to mutual interference between the consequent sintering of Pt or IrOx nanoparticles. Although all CV curves present a distorted shape, the H desorption characteristic peak still reflects the HOR catalytic ability of ACL. The ECSA of the MEAs after AST shows the tendency GDE-RTA > hybrid-RTA > layered-RTA, which is in accordance with the polarization performance following the reversal test. Moreover, it can be observed that a much wider double electrode layer appears when IrOx/C is applied on GDL to prepare GDE-RTA, which is an indication that carbon support collapse in the separated Pt/C and IrOx/C layers is enlarging the interface interval to some extent. As shown in Figure S4 and Table S2, the cathode ECSA hardly changes following cell reversal, demonstrating that decreasing cell performance is only a consequence of anode degradation.
In addition to this, the impedance of the three EOT samples increased according to the Nyquist curves in Figure 4c, whereby layered-RTA and GDE-RTA exhibit significantly higher ROhm values of 0.068 Ω cm2 and 0.064 Ω cm2 than the hybrid-RTA, with a value of 0.046 Ω cm2. In essence, this indicates that the separated IrOx layer in the anode possesses a much higher electrical resistivity (5 × 10⁻⁷ Ω m−1) compared to the Pt layer (2.2 × 10⁻⁷ Ω m−1), where the electric conduction via carbon support is substantially reduced due to severe corrosion. Additionally, it is believed that the collapse of the carbon support induced by CCR creates a poor contact region between the independent HOR and OER catalyst layers, contributing to higher ROhm. Additionally, the Rct of all MEAs displays obvious growth in the low-frequency region of the EIS curves, validating the notion that carbon collapse and corrosion imped the transport of protons and water generated by the cell reaction, while increasing Rct in turn exacerbates the degradation of cell performance [34]. Furthermore, iR-corrected I-V curves of the modified MEAs after AST are presented in Figure S5, where it can be seen that GDE-RTA possesses an apparent advantage over the other two samples, while layered-RTA presents an equivalent EOT cell performance.

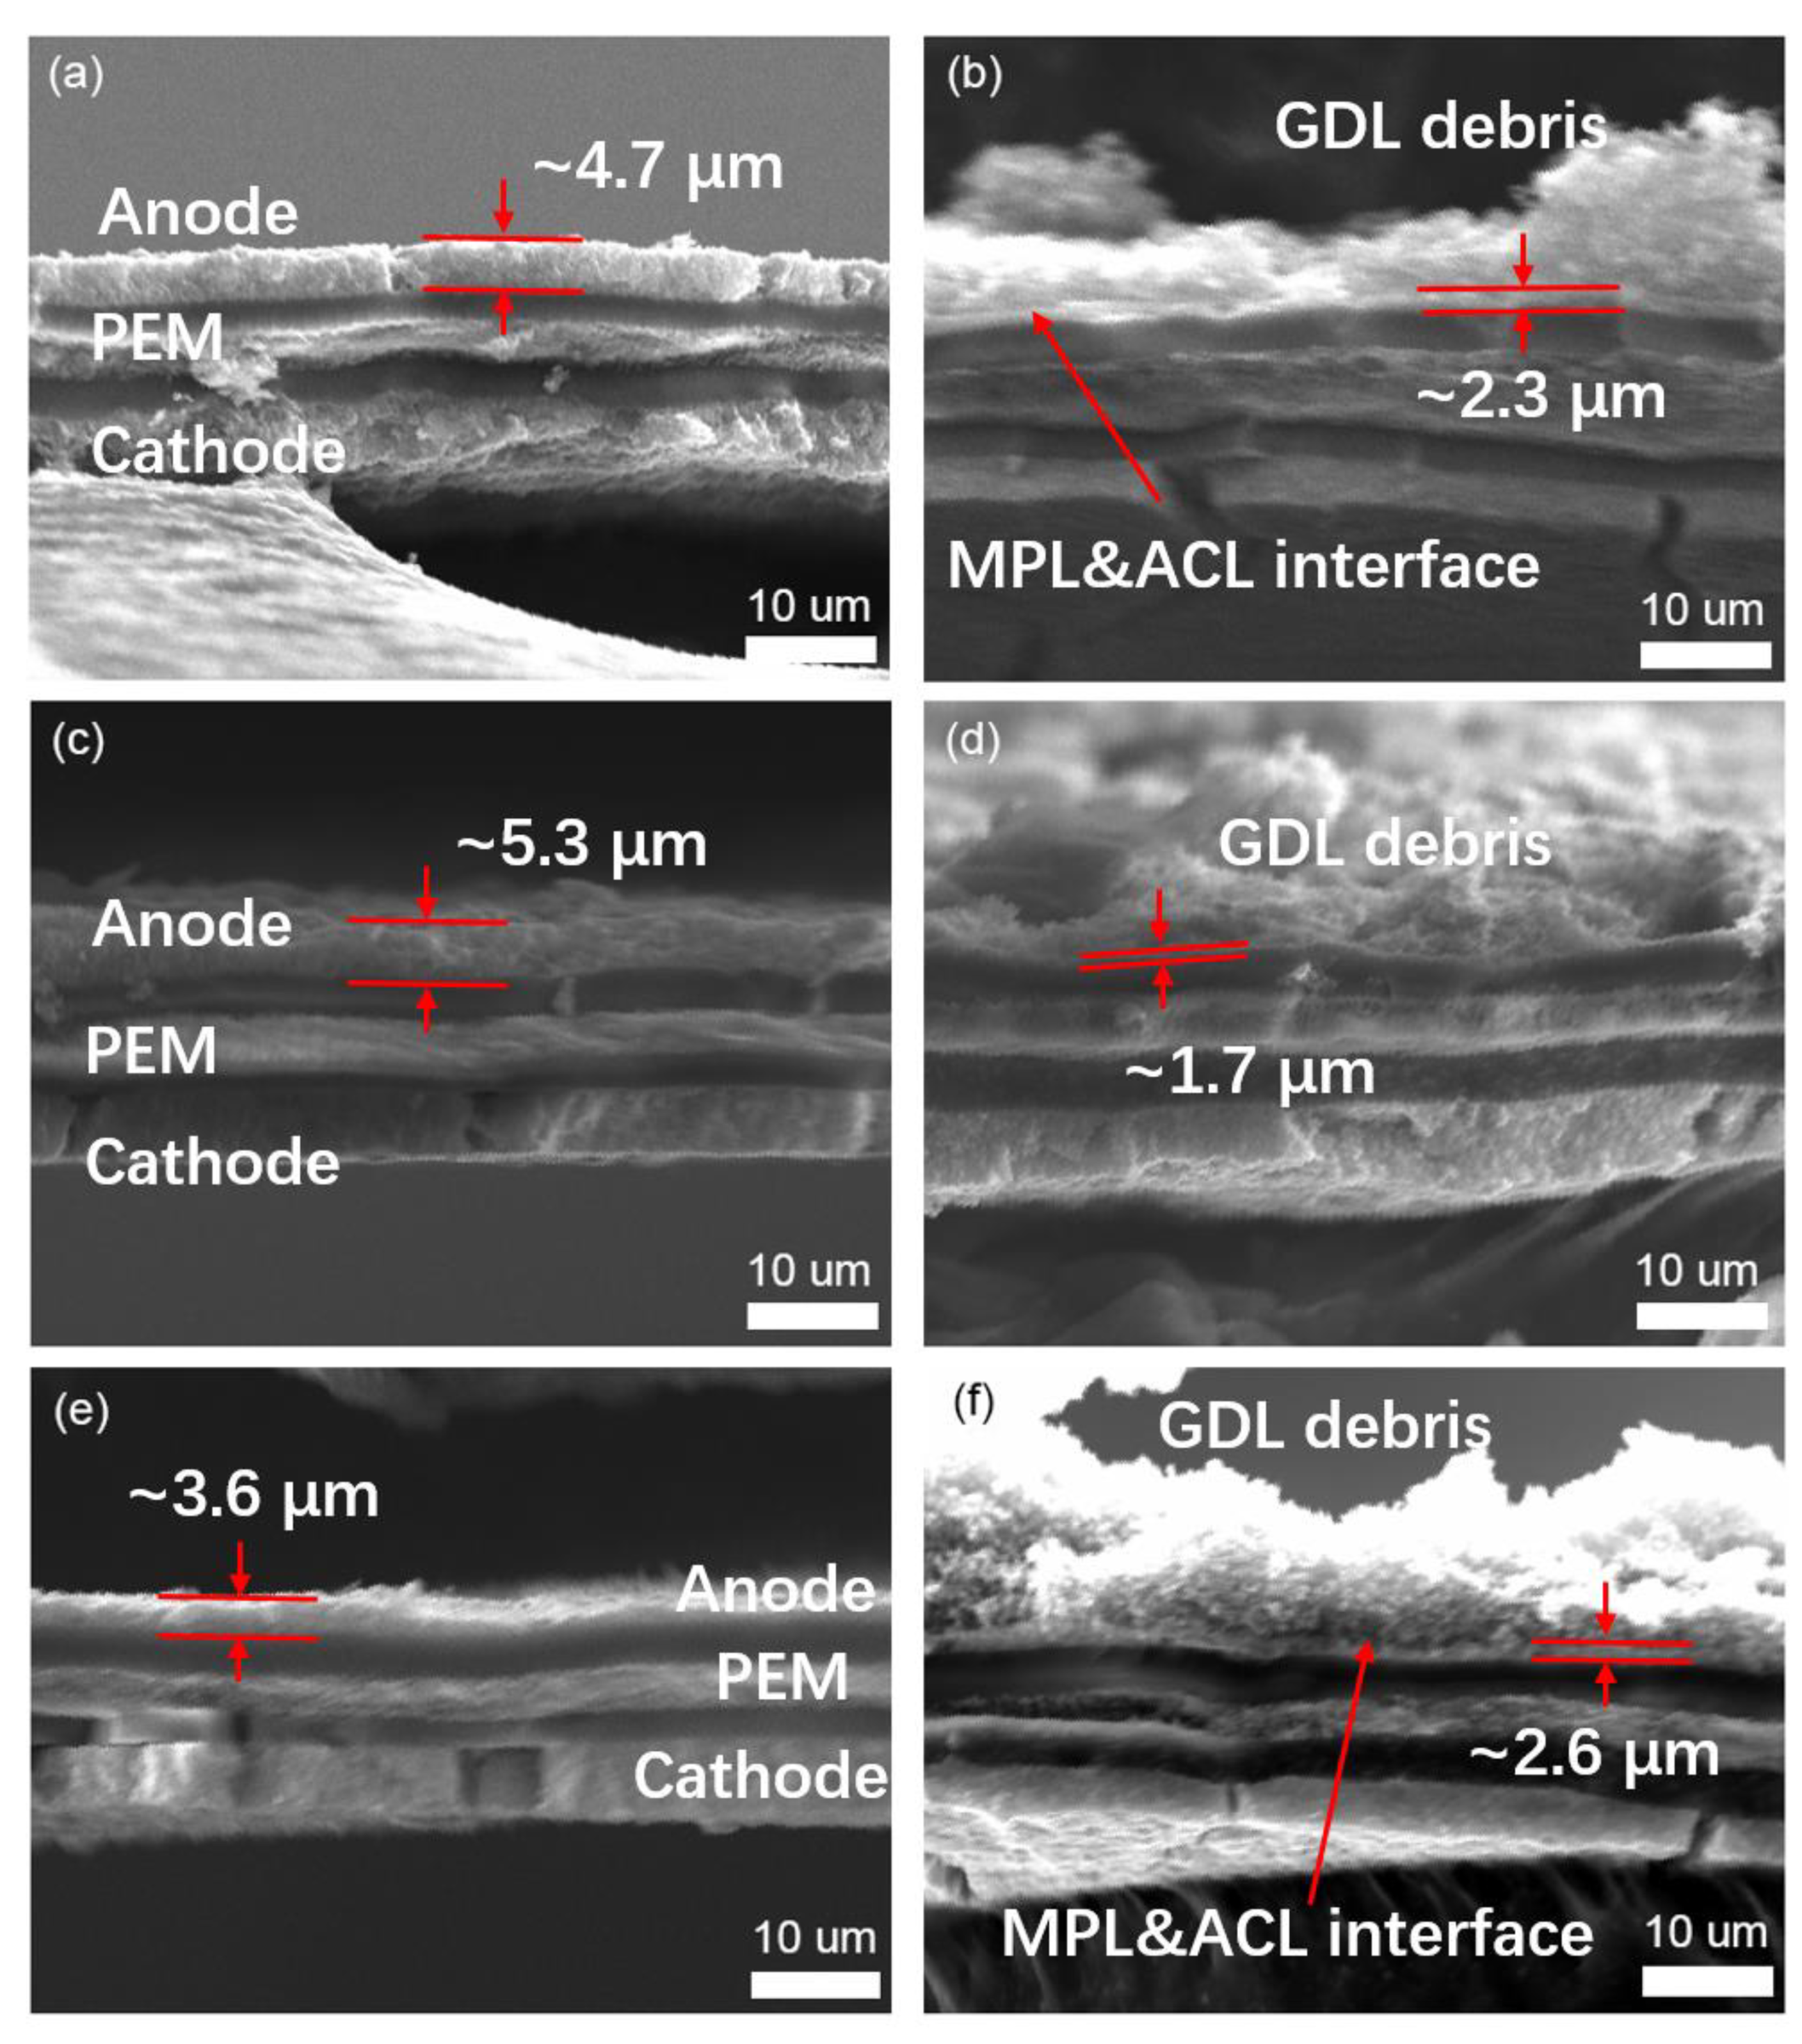
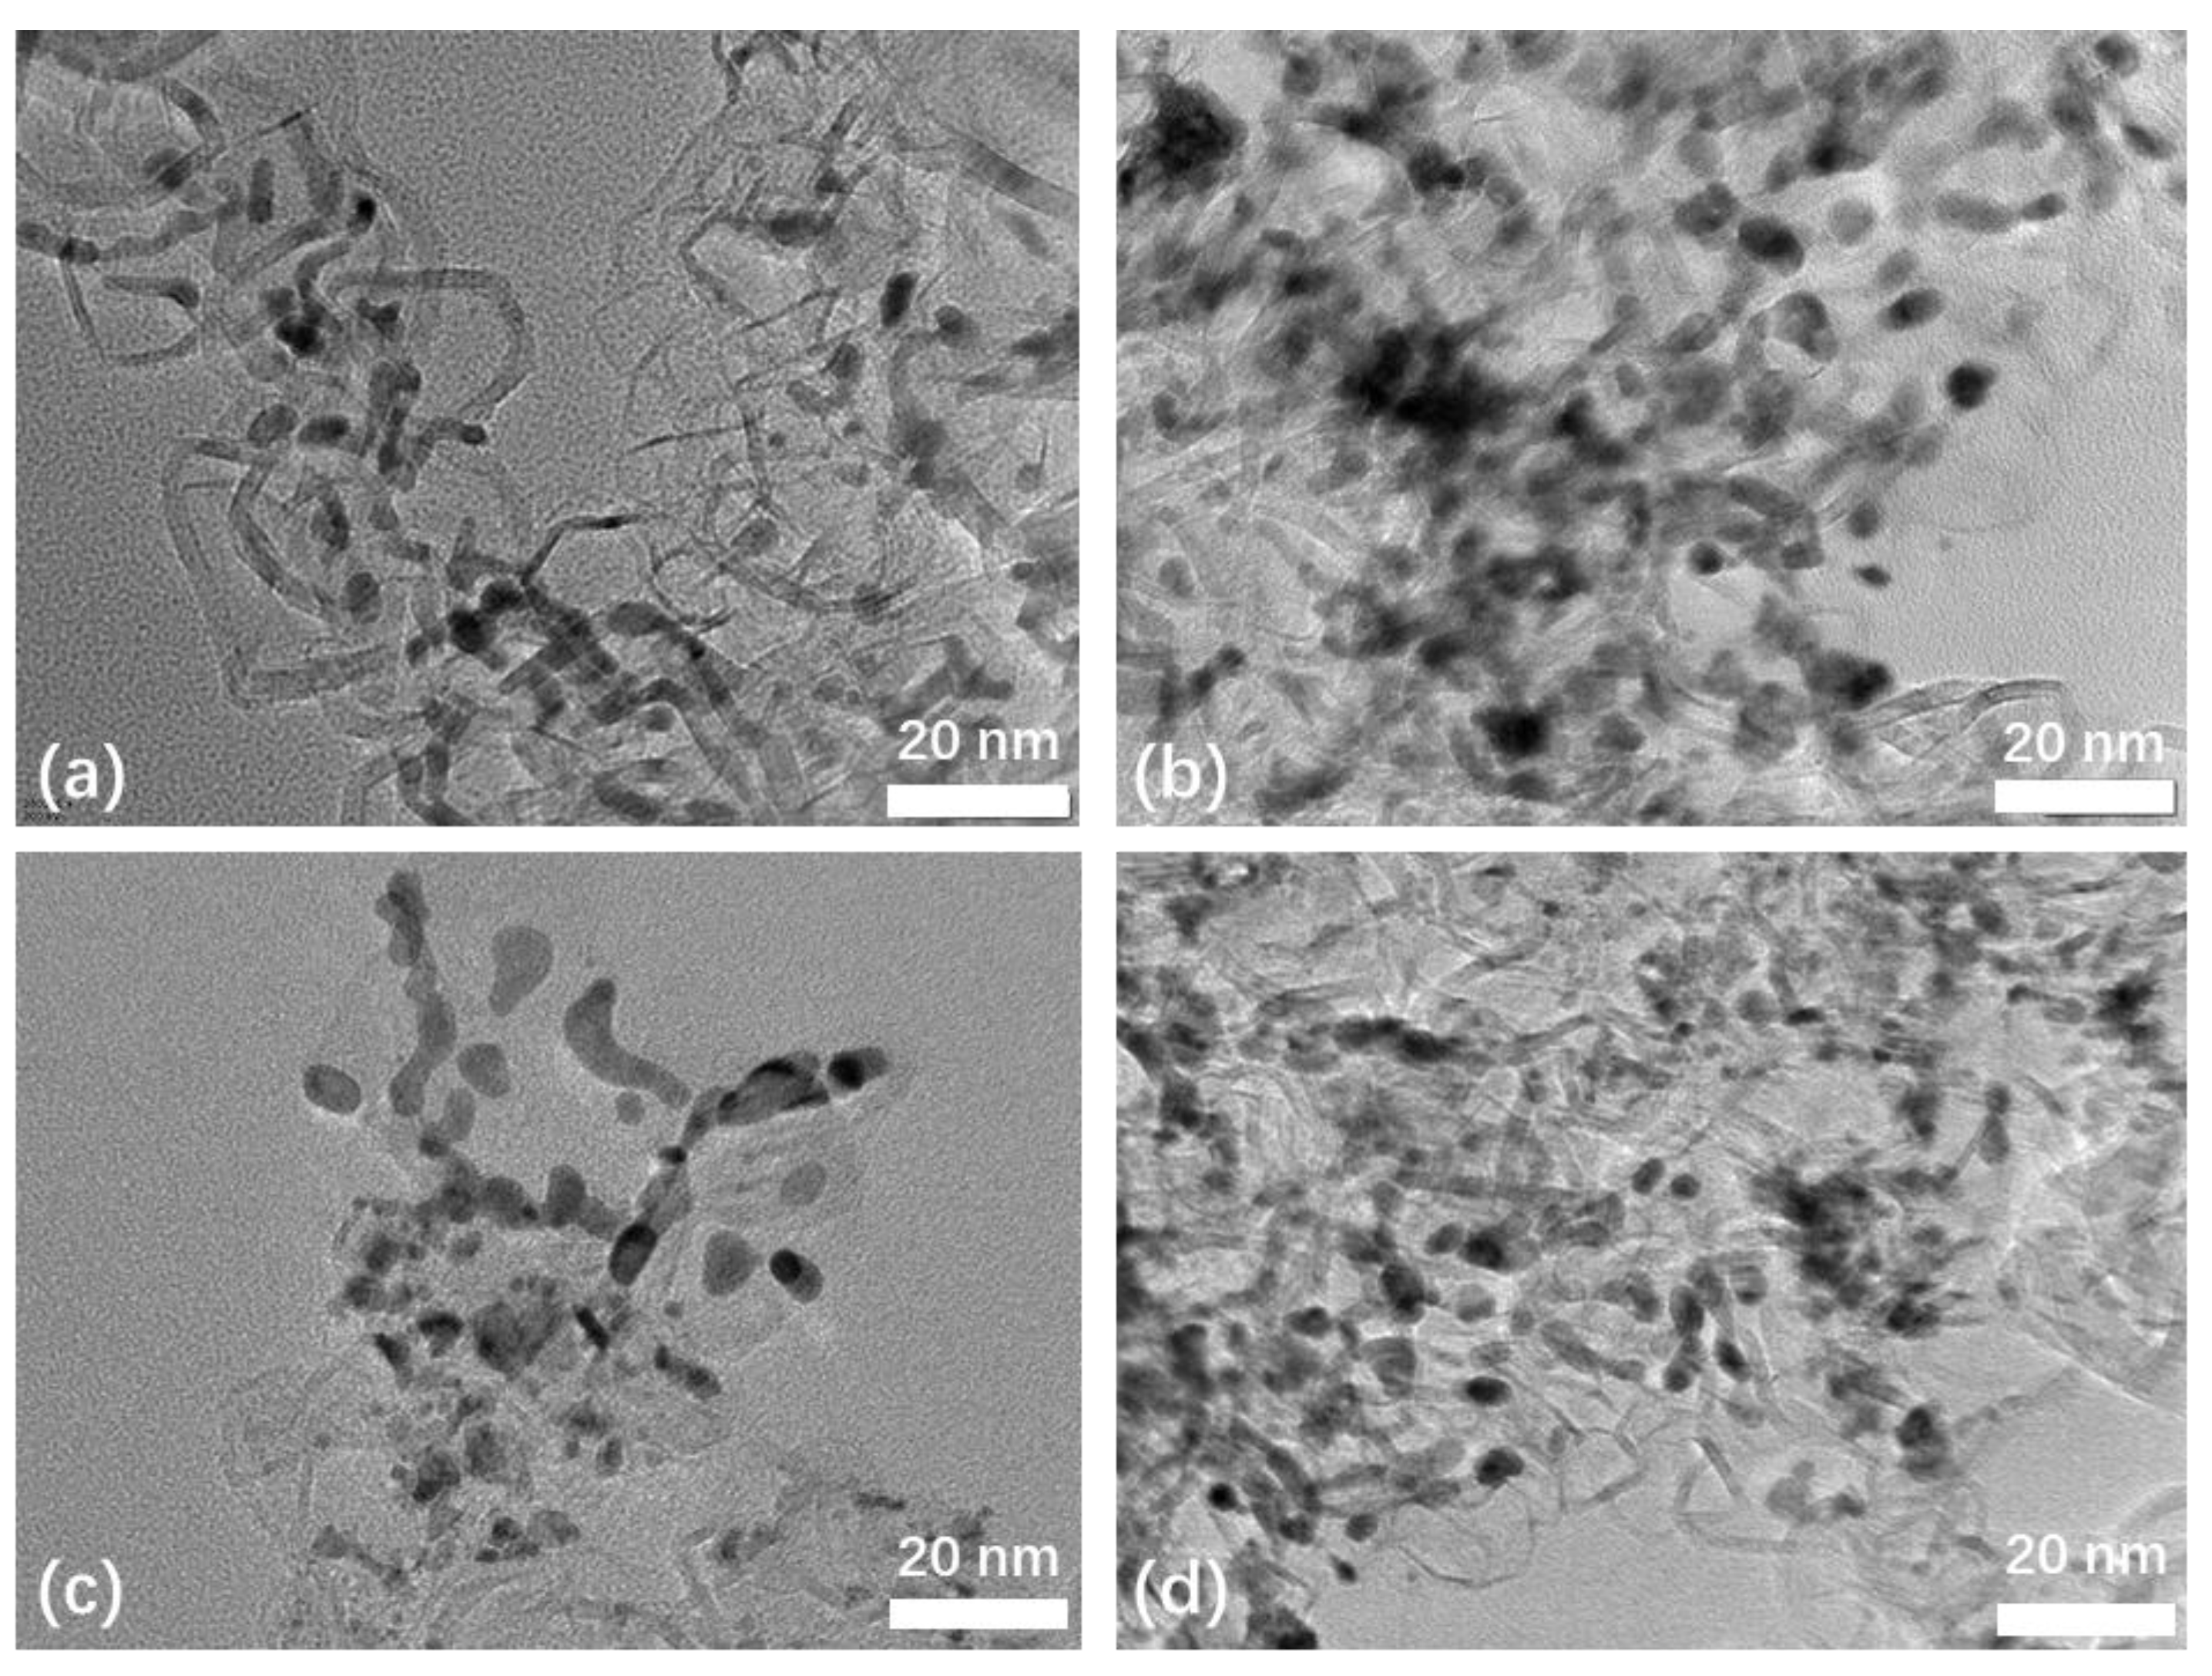
3.3. Micromorphology Characterization of Prepared MEAs

As stated above, GDE-RTA not only has the longest RTT, but also demonstrates the best polarization performance after reversal AST among the three MEAs with different RTA structures. Although layered-RTA exhibits longer RTT and higher initial performance than hybrid-RTA, it displays the fastest DR among the three prepared samples. Herein, the degradation characteristics of ACL for hybrid-RTA, layered-RTA and GDE-RTA were investigated carefully on the basis of micromorphological characterization, including SEM and TEM.
Figure 5 shows the cross-section SEM images of the MEAs with three types of RTA before and after the accelerated reversal tests on the cells. As can be seen, the fresh MEA samples hybrid-RTA, layered-RTA, and GDE-RTA possess ACL thicknesses of 4.7 μm, 5.3 μm, and 3.6 μm, which is within the margin of error, respectively, while the reversal AST thins the catalyst layers to 2.3 μm, 1.7 μm, and 2.6 μm, respectively. On the basis of our calculations, hybrid-RTA shows a reduction in ACL thickness of 51.1%, while layered-RTA exhibits the largest thickness attenuation of 67.9%, and GDE-RTA exhibits the minimum thickness reduction of 27.8%. These findings are consistent with the decay in cell performance, where GDE-RTA has the highest EOT power density with the minimum catalyst layer deterioration and layered-RTA shows the most severe voltage fall off due to the extensive damage of ACL. In addition, the largest ACL shrinkage being obtained for layered-RTA indirectly proves a hypothesis wherein the independent water electrolysis catalyst layer loses support and aggregates when the Pt/C layer collapses, significantly speeding up the sintering of IrOx/C nanoparticles, leading the whole RTA to fail prematurely. Additionally, comparing the enlarged image of fresh and aged ACL (Figure S6), the collapse defects caused by carbon support corrosion can be clearly observed. Moreover, there is a lot of GDL debris attached to all of RTAs following the reversal test because of the surface corrosion and oxidation of the MPL. Specifically, chemical bonds including carbonyl, anhydride, ether, and so on are formed during the carbon support oxidation of MPL and ACL [35,36], inducing a tight bond between ACL and MPL, which causes the anode GDL to not be able to be separated completely. As shown in Figure S7, the MPL of GDL after reversal AST has been destroyed to such an extent that the carbon fiber basal layer is exposed. In summary, microstructural changes in RTAs can be easily detected via SEM, where carbon support corrosion results in a thinner ACL. The induced catalyst sintering and collapse defects inside the catalyst layer reduce catalytic activity while increasing transfer resistance [34], ultimately resulting in an extreme decline in polarization performance.
TEM was performed to investigate the sintering of the catalyst; Pt/C and IrOx/C powder were obtained from the catalyst layer using a slicker, and ultraphonically redispersed for sample preparation. For the BOT MEAs, the noble metal nanodots show a mean grain diameter of approximately 3.8 nm and a uniform distribution on the surface of c the arbon support (Figure 6a), whereas there is an obvious increase in the average particle size of the samples after reversal AST, in the order layered-RTA > hybrid-RTA > GDE-RTA. In this regard, aged layered-RTA possesses a maximum Pt or IrOx agglomeration of 7.3 nm (Figure 6c), which is in agreement with the SEM images, in which the sample exhibits the most severe ACL attenuation after the reversal test. Meanwhile, the active dot diameter of GDE-RTA rose to a mere 5.6 nm (Figure 6d), which validates the assumption that a separate OER catalyst layer on GDL may indeed mitigate carbon corrosion and catalyst sintering. In addition, the EOT hybrid-RTA possesses larger catalyst clusters, with a diameter of 6.0 nm (Figure 6b), than GDE-RTA, which can be explained by the fact that randomly distributed Pt nanoparticles promote the carbon corrosion of IrOx/C [28,29,30,31]. Moreover, the carbon supports of the three aged ACLs exhibit vague shapes, especially for layered-RTA, and this finding is consistent with CCR during the cell reversal.

4. Conclusions

Three kinds of RTA with different configurations were prepared in this work, with IrOx/C being introduced into ACL as a water electrolysis catalyst and loaded using various methods. The experimental results show that building a separate IrOx/C catalyst layer on GDL makes a great contribution to enhancing the reversal tolerance of the anode, because GDE-RTA possessed the highest durability, with an RTT of 84 min, and the lowest voltage decay rate, at 2.4 mV min−1, at rated current density (2 A cm−2). Additionally, an independent OER catalyst layer effectively avoids IrOx/C covering the redox active sites of Pt/C, such that layered-RTA and GDE-RTA exhibited PPD values of 1.46 W cm−2 and 1.42 W cm−2, respectively, which were higher than that obtained for hybrid-RTA (1.35 W cm−2). After reversal AST, hybrid-RTA, layered-RTA, and GDE-RTA displayed PPD values of 0.73, 0.68, and 0.83 W cm−2, respectively, with attenuation rates of 45.9%, 53.42%, and 41.5%, respectively. The decreased anode ECSA and increased ROhm demonstrated that CCR was presented and caused the cumulative degradation of the cell, even with RTAs. Subsequently, the microstructure of the RTAs was determined on the basis of SEM and TEM in order to investigate their degradation characteristics. The layered-RTA, with the worst EOT cell performance among the three samples, exhibited the greatest attenuation of catalyst layer thickness, at 67.9%, as well as the sintering of noble metal nanodots to an average diameter of 7.3 nm. In general, loading water electrolysis catalyst onto the GDL is the preferable way to prepare MEAs with superior cell reversal tolerance.

Supplementary Materials

The following are available online at https://www.mdpi.com/article/10.3390/en15082732/s1, Figure S1: Image of prepared 50 cm2 MEA sample piece; Figure S2: Image of fabricated single cell in electrochemistry test; Figure S3: The continuous five times cell reversal AST of conventional-anode; Figure S4: Cathode CV curves before (BOT) and end (EOT) of the reversal AST, (a) conventional-anode, (b) hybrid-RTA, (c) layered-RTA, (d) GDE-RTA; Figure S5: I-V curves and power density after iR-corrected for MEAs after AST; Figure S6: Enlarged SEM images of fresh ACL and aged ACL after AST; Figure S7: SEM images of pristine GDL (pressed) and aged GDL after AST; Table S1: Steady state voltage at 0.2 A cm2 and RTT for conventional-anode; Table S2: ECSA before and after reversal AST for MEAs Cathode.

Author Contributions

Conceptualization, X.S., C.R. and K.J.; methodology, X.S. and C.R.; formal analysis, X.S., S.J., B.W. and Y.W.; investigation, H.Z.; resources, L.H.; data curation, C.R.; writing—original draft preparation, X.S. and C.R.; writing—review and editing, B.W., L.H. and K.J.; supervision, K.J. All authors have read and agreed to the published version of the manuscript.

Funding

This research was supported by the National Natural Science Foundation of China (grant No. 51920105010), Science and Technology Development Program of Jilin Province (Grant 20200501010GX), and the Natural Science Foundation of Tianjin (China) for Distinguished Young Scholars (Grant No. 18JCJQJC46700).

Institutional Review Board Statement

Not applicable.

Informed Consent Statement

Not applicable.

Conflicts of Interest

The authors declare no conflict of interest.

References

  1. Wang, Y.; Diaz, D.F.R.; Chen, K.S.; Wang, Z. Materials, technological status, and fundamentals of PEM fuel cells—A review. Adroher. Mater. Today 2020, 32, 178–203. [Google Scholar] [CrossRef]
  2. Olabi, A.G.; Wilberforce, T.; Abdelkareem, M.A. Fuel cell application in the automotive industry and future perspective. Energy 2021, 214, 118955. [Google Scholar] [CrossRef]
  3. Zhao, J.; Li, X. A review of polymer electrolyte membrane fuel cell durability for vehicular applications: Degradation modes and experimental techniques. Energy Convers. Manag. 2019, 199, 112022. [Google Scholar]
  4. Wang, X.X.; Swihart, M.T.; Wu, G. Achievements, challenges and perspectives on cathode catalysts in proton exchange membrane fuel cells for transportation. Nat. Catal. 2019, 2, 578–589. [Google Scholar] [CrossRef]
  5. Park, J.-H.; Yim, S.-D.; Kim, T.; Park, S.-H.; Yoon, Y.-G.; Park, G.-G.; Yang, T.-H.; Park, E.-D. Understanding the mechanism of membrane electrode assembly degradation by carbon corrosion by analyzing the microstructural changes in the cathode catalyst layers and polarization losses in proton exchange membrane fuel cell. Electrochim. Acta 2012, 83, 294–304. [Google Scholar] [CrossRef]
  6. Zhao, X.; Hayashi, A.; Noda, Z.; Kimijima, K.; Yagi, I.; Sasaki, K. Evaluation of change in nanostructure through the heat treatment of carbon materials and their durability for the start/stop operation of polymer electrolyte fuel cells. Electrochim. Acta 2013, 97, 33–41. [Google Scholar] [CrossRef]
  7. Zhang, S.; Yuan, X.; Wang, H.; Merida, W.; Zhu, H.; Shen, J.; Wu, S.; Zhang, J. A review of accelerated stress tests of MEA durability in PEM fuel cells. Int. J. Hydrogen Energy 2009, 34, 388–404. [Google Scholar] [CrossRef]
  8. Wang, F.; Yang, D.; Li, B.; Zhang, H.; Hao, C.; Chang, F.; Ma, J. Investigation of the recoverable degradation of PEM fuel cell operated under drive cycle and different humidities. Int. J. Hydrogen Energy 2014, 39, 14441–14447. [Google Scholar] [CrossRef]
  9. Fan, X.; Zhao, M.; Li, T.; Zhang, L.; Jing, M.; Yuan, W.; Li, C. In situ self-assembled N-rich carbon on pristine graphene as a highly effective support and cocatalyst of short Pt nanoparticle chains for superior electrocatalytic activity toward methanol oxidation. Nanoscale 2021, 13, 18332–18339. [Google Scholar] [CrossRef]
  10. Jomori, S.; Nonoyama, N.; Yoshida, T. Analysis and modeling of PEMFC degradation: Effect on oxygen transport. J. Power Sources 2012, 215, 18–27. [Google Scholar] [CrossRef]
  11. Jung, N.; Chung, D.Y.; Ryu, J.; Yoo, S.J.; Sung, Y.-E. Pt-based nanoarchitecture and catalyst design for fuel cell applications. Nano Today 2014, 9, 433–456. [Google Scholar] [CrossRef]
  12. Cherevko, S.; Kulyk, N.; Mayrhofer, K.J.J. Durability of platinum-based fuel cell electrocatalysts: Dissolution of bulk and nanoscale platinum. Nano Energy 2016, 29, 275–298. [Google Scholar] [CrossRef]
  13. Jung, D.W.; Park, S.; Kim, S.H.; Kim, J.B.; Oh, E.S. Durability of polymer electrolyte membrane fuel cell with Pt/CNTs catalysts in cell reversal conditions by hydrogen starvation. Fuel Cells 2011, 11, 866–874. [Google Scholar] [CrossRef]
  14. Chen, H.; Zhao, X.; Zhang, T.; Pei, P. The reactant starvation of the proton exchange membrane fuel cells for vehicular applications: A review. Energy Convers. Manage. 2019, 182, 282–298. [Google Scholar] [CrossRef]
  15. Ioroi, T.; Yasuda, K. Highly reversal-tolerant anodes using Ti4O7-supported platinum with a very small amount of water-splitting catalyst. J. Power Sources 2020, 450, 227656. [Google Scholar] [CrossRef]
  16. You, E.; Lee, S.W.; You, D.; Lee, B.; Pak, C. Effect of Metal Composition and Carbon Support on the Durability of the Reversal-Tolerant Anode with IrRu Alloy Catalyst. Catalysts 2020, 10, 932. [Google Scholar] [CrossRef]
  17. Hong, B.K.; Mandal, P.; Oh, J.-G.; Litster, S. On the impact of water activity on reversal tolerant fuel cell anode performance and durability. J. Power Sources 2016, 328, 280–288. [Google Scholar] [CrossRef]
  18. Jang, I.; Hwang, I.; Tak, Y. Attenuated degradation of a PEMFC cathode during fuel starvation by using carbon-supported IrO2. Electrochim. Acta 2013, 90, 148–156. [Google Scholar] [CrossRef]
  19. Tovini, M.F.; Damjanovic, A.M.; El-Sayed, H.A.; Speder, J.; Eickes, C.; Suchsland, J.-P.; Ghielmi, A.; Gasteiger, H.A. Degradation Mechanism of an IrO2 Anode Co-Catalyst for Cell Voltage Reversal Mitigation under Transient Operation Conditions of a PEM Fuel Cell. J. Electrochem. Soc. 2021, 168, 064521. [Google Scholar] [CrossRef]
  20. Mandal, P.; Hong, B.K.; Oh, J.-G.; Litster, S. Understanding the voltage reversal behavior of automotive fuel cells. J. Power Sources 2018, 397, 397–404. [Google Scholar] [CrossRef]
  21. Roh, C.-W.; Kim, H.-E.; Choi, J.; Lim, J.; Lee, H. Monodisperse IrOx deposited on Pt/C for reversal tolerant anode in proton exchange membrane fuel cell. J. Power Sources 2019, 443, 227270. [Google Scholar] [CrossRef]
  22. Labi, T.; van Schalkwyk, F.; Andersen, S.M.; Morgen, P.; Ray, S.C. Increasing fuel cell durability during prolonged and intermittent fuel starvation using supported IrOx. J. Power Sources 2021, 490, 229568. [Google Scholar] [CrossRef]
  23. Kim, H.-E.; Shin, S.; Lee, H. Pt-IrOx catalysts immobilized on defective carbon for efficient reversal tolerant anode in proton exchange membrane fuel cells. J. Catal. 2021, 395, 404–411. [Google Scholar] [CrossRef]
  24. Chen, W.; Cai, C.; Li, S.; Tan, J.; Pan, M. Thickness effects of anode catalyst layer on reversal tolerant performance in proton exchange membrane fuel cell. Int. J. Hydrogen Energy 2021, 46, 8749–8757. [Google Scholar] [CrossRef]
  25. Hu, L.; Hong, B.K.; Oh, J.-G.; Litster, S. Reversal Tolerant Anodes Using Protective Layers for Highly Robust Automotive Fuel Cells. ACS Appl. Energy Mater. 2021, 4, 119–127. [Google Scholar] [CrossRef]
  26. Zhou, X.; Yang, Y.; Li, B.; Zhang, C. Advanced Reversal Tolerant Anode in Proton Exchange Membrane Fuel Cells: Study on the Attenuation Mechanism during Fuel Starvation. ACS Appl. Mater. Inter. 2021, 13, 2455–2461. [Google Scholar] [CrossRef]
  27. Moore, C.E.; Afsahi, F.; Young, A.P.; Gyenge, E.L. Vibrating Powders: Electrochemical Quartz Crystal Microbalance Study of IrO2 and Pt/C Catalyst Layers for Voltage Reversal Tolerant Anodes in Fuel Cells. J. Phys. Chem. C 2019, 123, 23361–23373. [Google Scholar] [CrossRef]
  28. Lim, K.H.; Lee, W.H.; Jeong, Y.; Kim, H. Analysis of carbon corrosion in anode under fuel starvation using on-line mass spectrometry in polymer electrolyte membrane fuel cells. J. Electrochem. Soc. 2017, 164, F1580–F1586. [Google Scholar] [CrossRef]
  29. Linse, N.; Gubler, L.; Scherer, G.G.; Wokaun, A. The effect of platinum on carbon corrosion behavior in polymer electrolyte fuel cells. Electrochim. Acta 2011, 56, 7541–7549. [Google Scholar] [CrossRef]
  30. Li, W.; Lane, A.M. Investigation of Pt catalytic effects on carbon support corrosion of the cathode catalyst in PEM fuel cells using DEMS spectra. Electrochem. Commun. 2009, 11, 1187–1190. [Google Scholar] [CrossRef]
  31. Maillard, F.; Bonnefont, A.; Micoud, F. An EC-FTIR study on the catalytic role of Pt in carbon corrosion. Electrochem. Commun. 2011, 13, 1109–1111. [Google Scholar] [CrossRef]
  32. Zhao, S.; Yu, H.; Maric, R.; Danilovic, N.; Capuano, C.B.; Ayers, K.E.; Mustain, W.E. Calculating the electrochemically active surface area of iridium oxide in operating proton exchange membrane electrolyzers. J. Electrochem. Soc. 2015, 162, F1292–F1298. [Google Scholar] [CrossRef] [Green Version]
  33. Lee, S.W.; Lee, B.H.; Kim, T.-Y.; Baik, C.; Kim, M.S.; Chai, G.S.; Pak, C. Multifunctional non-Pt ternary catalyst for the hydrogen oxidation and oxygen evolution reactions in reversal-tolerant anode. Catal. Commun. 2019, 130, 105758. [Google Scholar] [CrossRef]
  34. Cai, C.; Rao, Y.; Zhou, J.; Zhang, L.; Chen, W.; Wan, Z.; Tan, J.; Pan, M. Carbon corrosion: A novel termination mechanism of the water electrolysis plateau during voltage reversal. J. Power Sources 2020, 473, 228542. [Google Scholar] [CrossRef]
  35. Labata, M.F.; Li, G.; Ocon, J.; Chuang, P.-Y.A. Insights on platinum-carbon catalyst degradation mechanism for oxygen reduction reaction in acidic and alkaline media. J. Power Sources 2021, 487, 229356. [Google Scholar] [CrossRef]
  36. Kangasniemi, K.H.; Condit, D.A.; Jarvi, T.D. Characterization of vulcan electrochemically oxidized under simulated PEM fuel cell conditions. J. Electrochem. Soc. 2004, 151, E125–E132. [Google Scholar] [CrossRef]
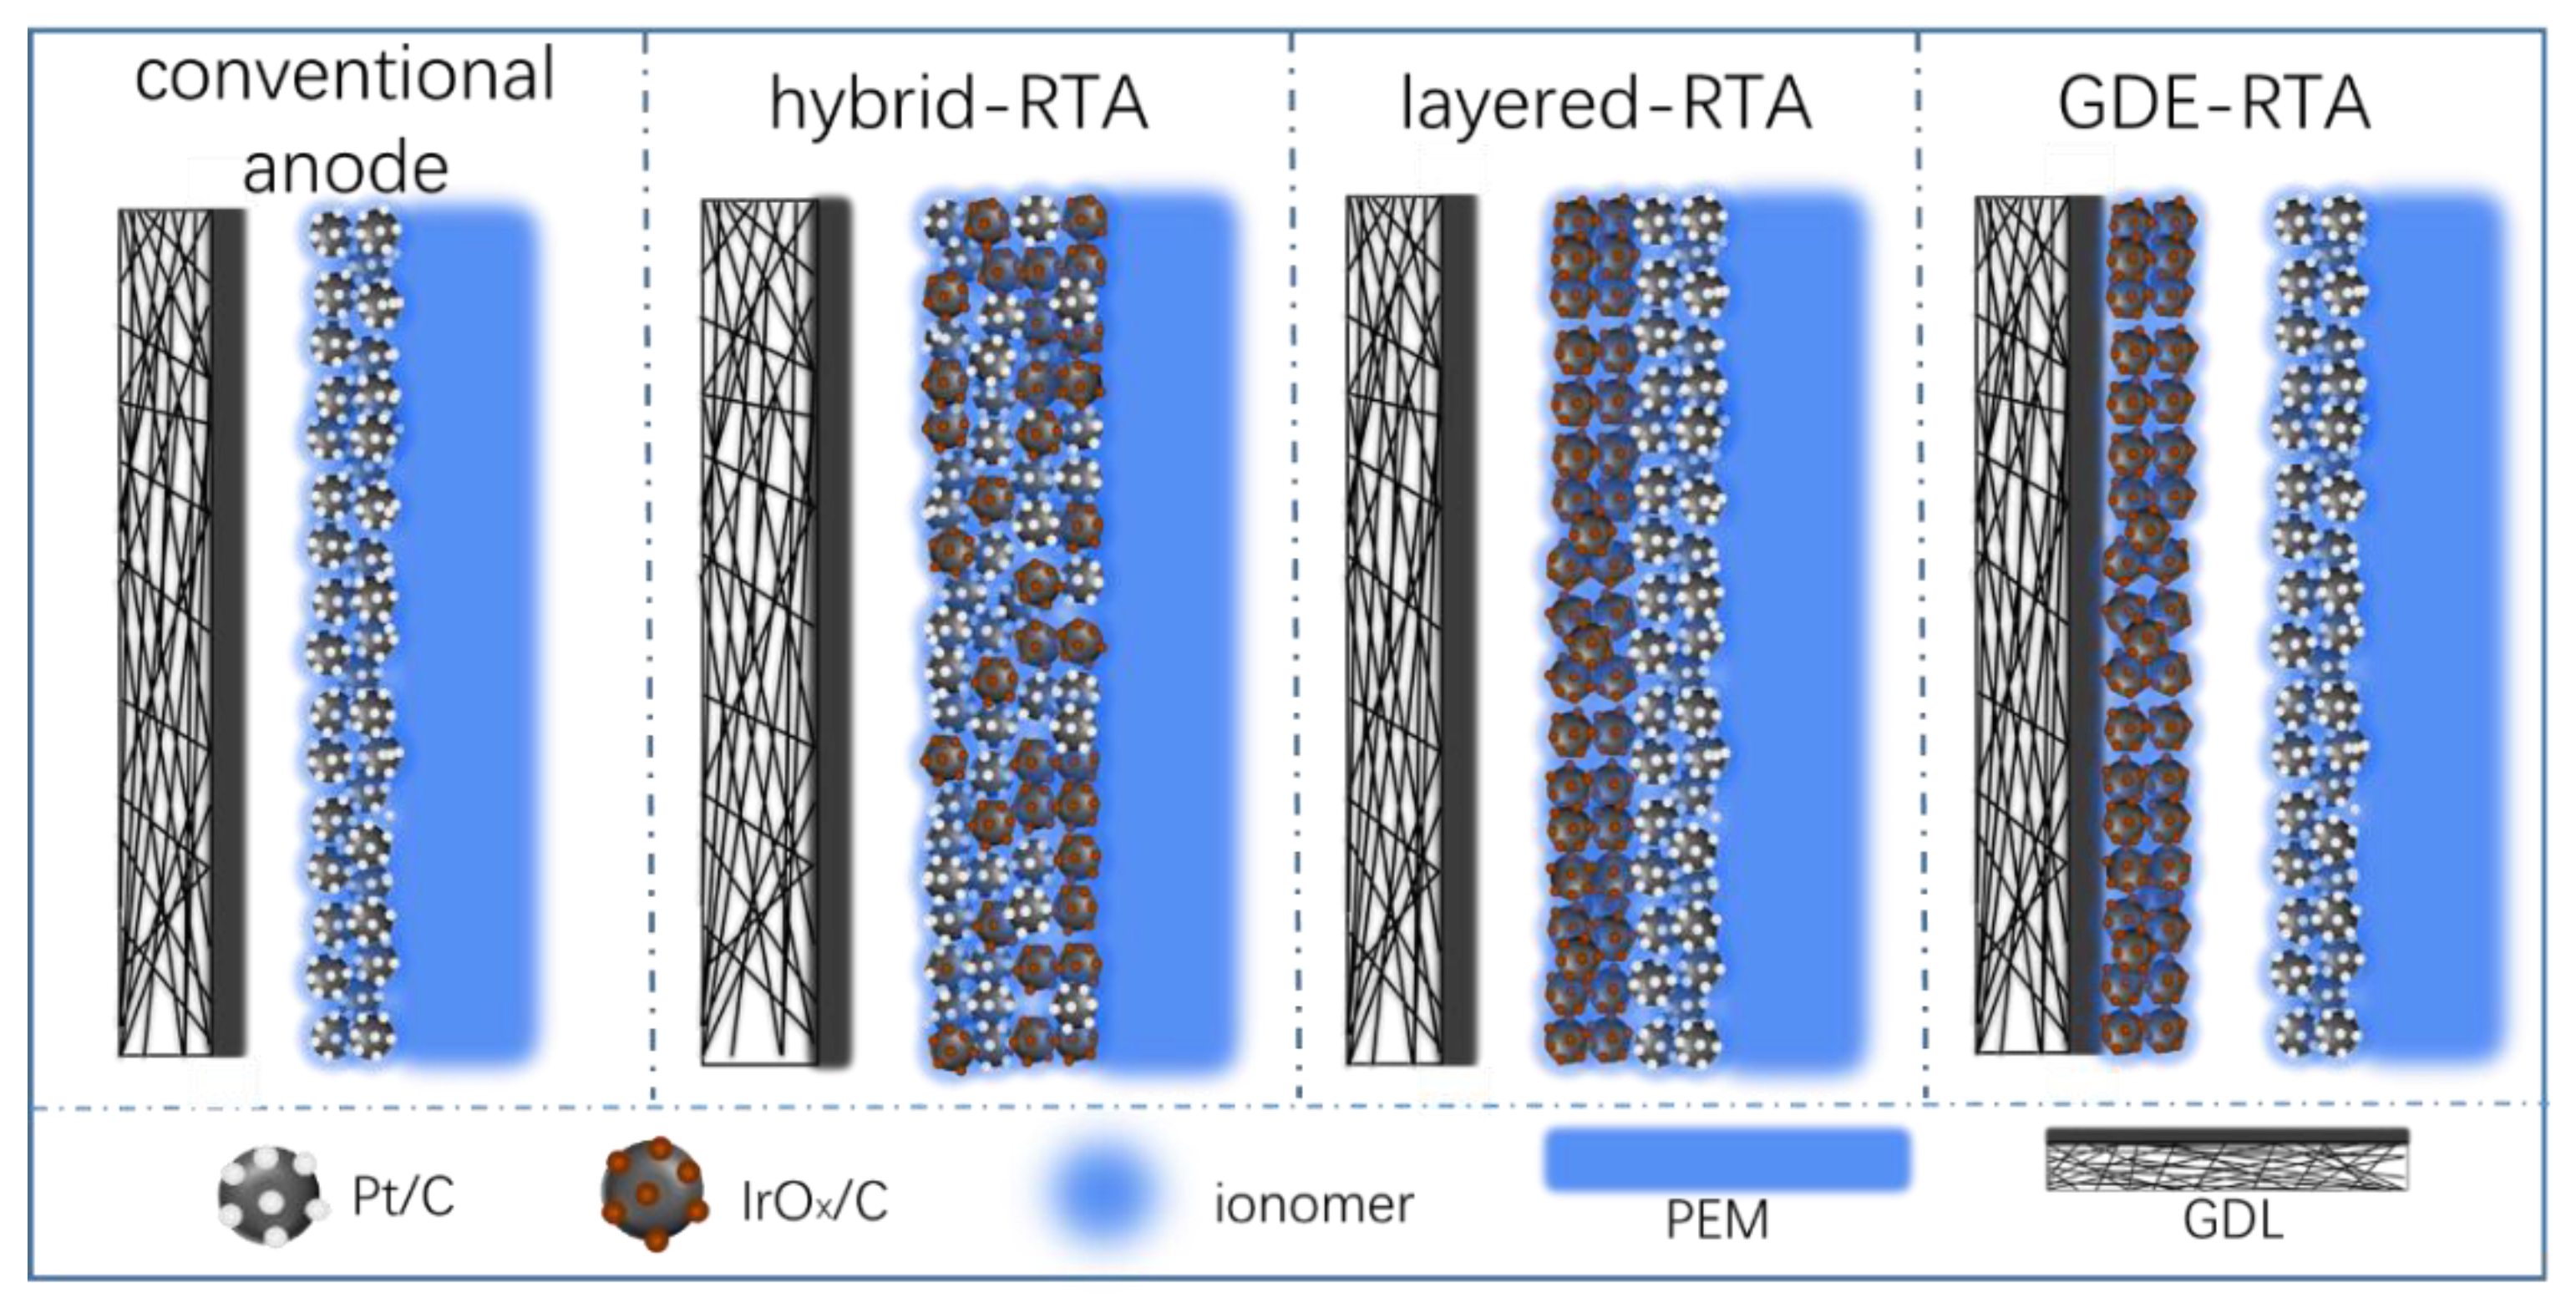
Figure 1. Schematic diagram for three types of MEA with different RTA configurations.
Energies 15 02732 g001
Figure 2. Schematic diagram of cell reversal tolerance (a) and cell voltage–RTT curves (b) of prepared MEAs with different RTA structures.
Energies 15 02732 g002
Figure 3. Electrochemical characterization of fresh MEAs: I–V and power density curves (a), cyclic voltammograms (b), and Nyquist diagrams (c).
Energies 15 02732 g003
Figure 4. Electrochemical characterization of MEAs after cell reversal: AST, I–V, and power density curves (a), cyclic voltammograms (b), and Nyquist diagram (c).
Energies 15 02732 g004
Figure 5. Cross-section images of fresh and aged MEAs with different RTA structures: fresh MEA sample for hybrid-RTA (a), layered-RTA (c), and GDE-RTA (e). MEA samples after reversal AST for hybrid-RTA (b), layered-RTA (d), and GDE-RTA (f).
Energies 15 02732 g005
Figure 6. TEM images of fresh ACL (a) and aged ACL: hybrid-RTA (b), layered-RTA (c), and GDE-RTA (d).
Energies 15 02732 g006
Table 1. Detailed description of MEAs with different RTA configurations.
SamplesRTA ConfigurationACL on PEMAnode GDL
Conventional anodeone-fold layerPt/Cordinary
Hybrid-RTAone-fold layerPt/C + IrOx/Cordinary
Layered-RTAlayer-by-layerPt/C + IrOx/Cordinary
GDE-RTAseparate locationsPt/CIrOx/C loaded
Table 2. Reversal tolerance time and electrochemical data analysis of fresh MEAs.
SamplesRTTPPDVBOTECSAROhm
(min)(W cm−2)(V)(m2 g−1)(Ω cm2)
Conventional anode4.51.480.62936.80.038
Hybrid-RTA501.350.60714.70.038
Layered-RTA541.460.62127.40.038
GDE-RTA861.420.62428.70.038
Table 3. Electrochemical data analysis and voltage decay rate of aged MEAs.
SamplesPPDVEOTDRECSAROhm
(W cm−2)(V)(mV min−1)(m2 g−1)(Ω cm2)
Conventional anode0.21--5.40.057
Hybrid-RTA0.730.3345.510.80.046
Layered-RTA0.680.2976.06.90.068
GDE-RTA0.830.4142.412.30.064
Publisher’s Note: MDPI stays neutral with regard to jurisdictional claims in published maps and institutional affiliations.

