Article

Novel Terahertz Spectroscopy Analysis for the Electrode with Carbon Nanotubes (CNTs) in Lithium-Ion Batteries

1
Department of Electric Engineering, Chosun University, 309, Pilmun-daero, Dong-gu, Gwangju 61452, Korea
2
Department of Physics Education, Chosun University, 309, Pilmun-daero, Dong-gu, Gwangju 61452, Korea
3
Advanced Photonics Research Institute, Gwangju Institute of Science and Technology (GIST), Gwangju 61005, Korea
4
Advanced Center for Photon Science Technology, Gwangju Institute of Science and Technology (GIST), Gwangju 61005, Korea
5
Department of Physics and Photon Science, Gwangju Institute of Science and Technology (GIST), Gwangju 61005, Korea
6
Department of Graphic Arts Information Engineering, Pukyong National University, Busan 485471, Korea
*
Author to whom correspondence should be addressed.
These authors contributed equally to this work.
Energies 2022, 15(7), 2665; https://doi.org/10.3390/en15072665
Submission received: 4 March 2022 / Revised: 29 March 2022 / Accepted: 1 April 2022 / Published: 5 April 2022
(This article belongs to the Topic Energy Storage and Conversion Systems)

Abstract

:
In this study, to use carbon nanotubes (CNTs) as a conductive material instead of carbon black in cathode electrodes, their dispersions were prepared in 1-Methyl-2-pyrrolidinone (NMP) solvent by using an ultrasonic horn, and their dispersion stability was analyzed using CNTs on the formation of the network between cathode electrode constituent materials comprised of cathode material, CNTs, and current collectors, and their correlation with electrochemical performance results were investigated using various analytical techniques. Particularly, in the analysis, terahertz time domain spectroscopy (THz-TDS), a new non-destructive analysis method, was used to analyze and compare the various optical properties of the cathode’s slurries that co-existed with CNTs and cathode material, suggesting the suitability of its analytical use in the field of materials dispersion and the slurry manufacturing process for lithium-ion batteries (LIBs). In the investigated results, the sample with the highest dispersion stability of CNTs uniformly formed the networks of CNTs and cathode material in the electrode, which results in the highest electrical conductivity among all samples, and as a result, the best performance in electrochemical evaluations.

1. Introduction

Global warming due to the use of fossil fuels, the main energy source of mankind, has become a major issue in the environment around the world, threatening human life and the earth. Efforts to reduce this adverse environmental impact are required to increase the demand for renewables and promote more efficient energy use [1,2,3]. Lithium-ion batteries (LIBs) are taking an important position in regards to storing and using them as needed in various industrial fields and living areas, from traditional portable devices to the energy storage system (ESS) and electrical vehicles [4]. In particular, as the electric vehicle market is rapidly expanding, charging speed and mileage are becoming important keys in determining consumer purchasing power, so the main performance factors such as high energy density, high power (quick charge), and high safety of batteries are considered most important [3,5,6,7].
The cathode and anode electrodes in the LIBs are composed of the current collector that collects electrons, the active material that stores or releases lithium ions, the conductive material to facilitate the flow of electrons between the active materials, and the binder to maintain the bond between the current collector, active material, and conductive material. These components are manufactured through the process of casting on the current collector in the form of a slurry uniformly dispersed in a solvent such as NMP (N-Methyl-2-pyrrolidone) or distilled water using a mixer. To improve the energy density, it is important to increase the amount of active material among the electrode constituent materials and to minimize the conductive material and binder. In addition, increasing the loading amount of the slurry casting on the current collector is an additional energy density improvement method. For quick charging/discharging with a high current, it is important to improve the conductivity of lithium ions and electrons. To this end, numerous researchers have been studying the nanoscale approach of active materials with short lithium-ion diffusion pathways and the formation of composite materials, including various carbon materials such as carbon nanotubes, carbon nanofibers, and graphene [8,9,10,11,12,13,14,15,16,17,18]. However, these have the drawbacks of lowering the energy density in terms of gravimetric or volumetric energy of the active materials in the electrode. Therefore, there is no doubt that the use of high-conductivity conductive materials and their uniform electrode distribution are important factors to ensure high conductivity and high content of active materials in the electrode.
Among carbon materials, carbon nanotubes (CNTs), which have been widely considered as a conductive carbon material with a one-dimensional (1D) structure, have attracted particular attention in the industry due to their high electrical conductivity [19]. In the case of LIBs, if CNTs are applied to the electrode instead of carbon black (e.g., Super-P, Ketjen black), the electrical conductivity of the electrode can be improved, so various studies related to this have been reported [20,21,22]. Currently, carbon black is the most widely used conductive material in LIBs. When CNTs replace it, charging/discharging with high current density is possible, resulting in improved charging/discharging speed, and high energy can be achieved by reducing the conductive material content or increasing the active material loading on both the cathode and anode. However, for CNTs to be used as the conductive material, it is easily agglomerated by the high aspect ratio, van der Waals force, and high surface area, which are inherent characteristics of CNTs in slurry preparation [23,24], so it must be uniformly dispersed with the active materials in a solvent such as NMP or distilled water. The non-uniformity of material dispersion due to the high inter-particle aggregation of CNTs lowers the electron conductivity of the electrode, weakens the adhesion between the current collector and the electrode constituent materials, thereby increasing the electrode resistance or causing problems such as detachment of the materials from the electrode. This results in the increase of the defect rate due to the generation of impurities in the manufacturing process and high variation in electrochemical performance, make it impossible to achieve high energy density, high power (quick charging), and a long cycle life.
From the perspective of the production process, the traditional way to evaluate the degree of dispersion in the manufacturing process is to measure the viscosity and particle size analysis, and visually check it using a grinder gauge and so on. Furthermore, after electrode manufacturing, a certain portion of the electrode is collected, followed by conductivity measurement physically through the probe-type conductivity meter and direct observation through a scanning electron microscope (SEM); finally, a causal relationship is determined after cell performance evaluations. However, these methods sometimes have the disadvantages of measurement and observer error, lower reproducibility, and taking a long time due to many processes. From these points of view, rapid analysis of materials dispersion and distribution, along with high reliability, will be an important factor that can further save cost and time in the manufacturing process.
In this report, the dispersion characteristics of CNTs in NMP solvent were studied regarding the use of CNTs instead of carbon black, which is mainly used as a conductive material for the cathode in LIBs. Three samples with different dispersion conditions were evaluated for dispersion stability by using a dispersion analyzer, a light transmission method. Each CNTs dispersion sample was prepared with the cathode electrode containing active material NCM622, and then assembled into coin-type half-cells to evaluate cell performance. The correlation between CNTs dispersion stability and electrochemical properties was investigated through prepared electrodes and cell evaluations. In particular, using THz-TDS, a new analysis method for understanding the characteristics of LIBs’s slurry composed of dispersed materials, we confirmed the possibility of accurately and quickly analyzing cathode electrode slurries in a non-destructive way.

2. Materials and Methods

2.1. Materials

The multi-walled CNTs powder was purchased from Tokyo Chemical Industry Co., Ltd., Tokyo, Japan, with a length of 5–15 μm and a diameter of 10–20 nm. NCM622 cathode was obtained from LGChem. The 1-Methyl-2-pyrrolidinone (NMP) solvent was purchased from Sigma-Aldrich with anhydrous, 99.5% grade. The electrolyte was obtained from Panax Etec.

2.2. Dispersion Preparation of CNTs

To prepare 5 wt% of CNTs dispersion, 5 g of CNTs and 95 g of NMP solvent were placed in a container and prepared using an ultrasonic horn disperser for 24 h, which is referred to as samples A, B, and C. Samples were prepared with the same method as sample A, and only the ultrasonic time was performed for 48 h and 72 h, respectively.

2.3. Material Characterization

The dispersion stability of the CNTs was measured using a dispersion analyzer (LUMiSizer, LUM GmbH, Berlin, Germany) with the near-infrared ray of 870 nm during 4000 rpm centrifugation for 40 h. The distribution of the materials casting on the aluminum current collector was observed using scanning electron microscopy (SEM) (SU8200, Hitachi, Tokyo, Japan). The 4-tip probe-type conductivity meter (RM3545, Hioki, Japan) was used to measure the electrical conductivity of the materials cast electrode. For the terahertz time-domain spectroscopy (THz-TDS) measurements, we fabricated a thin film by coating the cathode slurries containing CNTs dispersion samples (A, B, and C) on a Si wafer. The diameter and thickness of the samples were 10 mm and 718 ± 4 µm, respectively. A schematic diagram of the experimental setup is provided in Figure S2 of the Supplementary Materials. A femtosecond laser (mode-locked Ti: sapphire laser) operating at a center wavelength of 800 nm with a repetition rate of 1 kHz and a pulse width of 190 fs was used as the light source (Hurricane, Spectra-Physics, Santa Clara, CA, USA). The laser beam was divided by a beam-splitter into two paths; one goes to the THz generation path and the other goes to the detection path. A THz beam generated from 1 mm thick ZnTe was focused on the sample using a pair of parabolic mirrors. The THz beam transmitted through the sample was then focused by another pair of parabolic mirrors onto 0.5 mm thick ZnTe used as electro-optic sampling for detection. This system can measure in the range of 0.3–2.5 THz. To reduce the signal attenuation caused by moisture, the entire system was placed inside an acrylic box that was purged with dry nitrogen, in which the humidity was below 1%. THz-TDS was used to measure the THz signal transmitted through the cathode films and the bare silicon (as a reference). The frequency-domain output THz signals were obtained in time-domain THz signals using the Fourier transform analysis of the input and output time-domain THz signals [25,26,27,28].

2.4. Electrochemical Characterization

All three cathode electrodes containing samples A, B, and C, respectively, were prepared with an equal composition ratio, and the constituent materials are active material (NCM622), binder (PVDF, Polyvinylidene fluoride), and conductive material (CNTs) in the mass ratio of 97:2:1. The loading amount of the prepared electrodes was approximately 7 mg/cm2. We used 1.15 M LiPF6 in ethylene carbonate (EC)/ethyl-methyl carbonate (EMC)/dimethyl carbonate (DEC) = 3/5/2 (v/v) and a microporous polyethylene (PE) as the electrolyte and separator, respectively. A 2032R coin-type half-cell was assembled in an argon-filled glove box. All cells were charged and discharged at 0.1 C (1C = 185 mA/g) at 25 °C in the voltage range of 2.75 to 4.3 V during the initial 2 cycles for formation, and the charging condition at that time was CC-CV (constant current-constant voltage) mode with a cut-off at 0.05 C. For cycling life evaluation, the tested cells were conducted charging and discharging at 5 C at 25 °C. In the evaluation of charging characteristics at 25 °C, the cell was conducted for 3 cycles for each C-rate, increasing the charging C-rate from 0.2 C up to 3 C, and the discharging at each C-rate was fixed at 0.2 C. After each C-rate was completed, 1 cycle of 0.2 C charging/discharging in CC-CV mode with a cut-off condition at 0.05 C in CV mode was added to recover the chargeable capacity. In the evaluation of discharging characteristics at 25 °C, the cell was conducted for 3 cycles at each C-rate with increasing C-rate of discharging from 0.2 C up to 5 C, and the charging at each C-rate was fixed at 0.2 C. Data collected from charging and discharging characteristics, including cycling life evaluation, were normalized based on the discharging capacity of the initial formation.

3. Results and Discussion

To measure the dispersion stability of the prepared CNTs dispersed samples, it was analyzed by using a dispersion analyzer. 
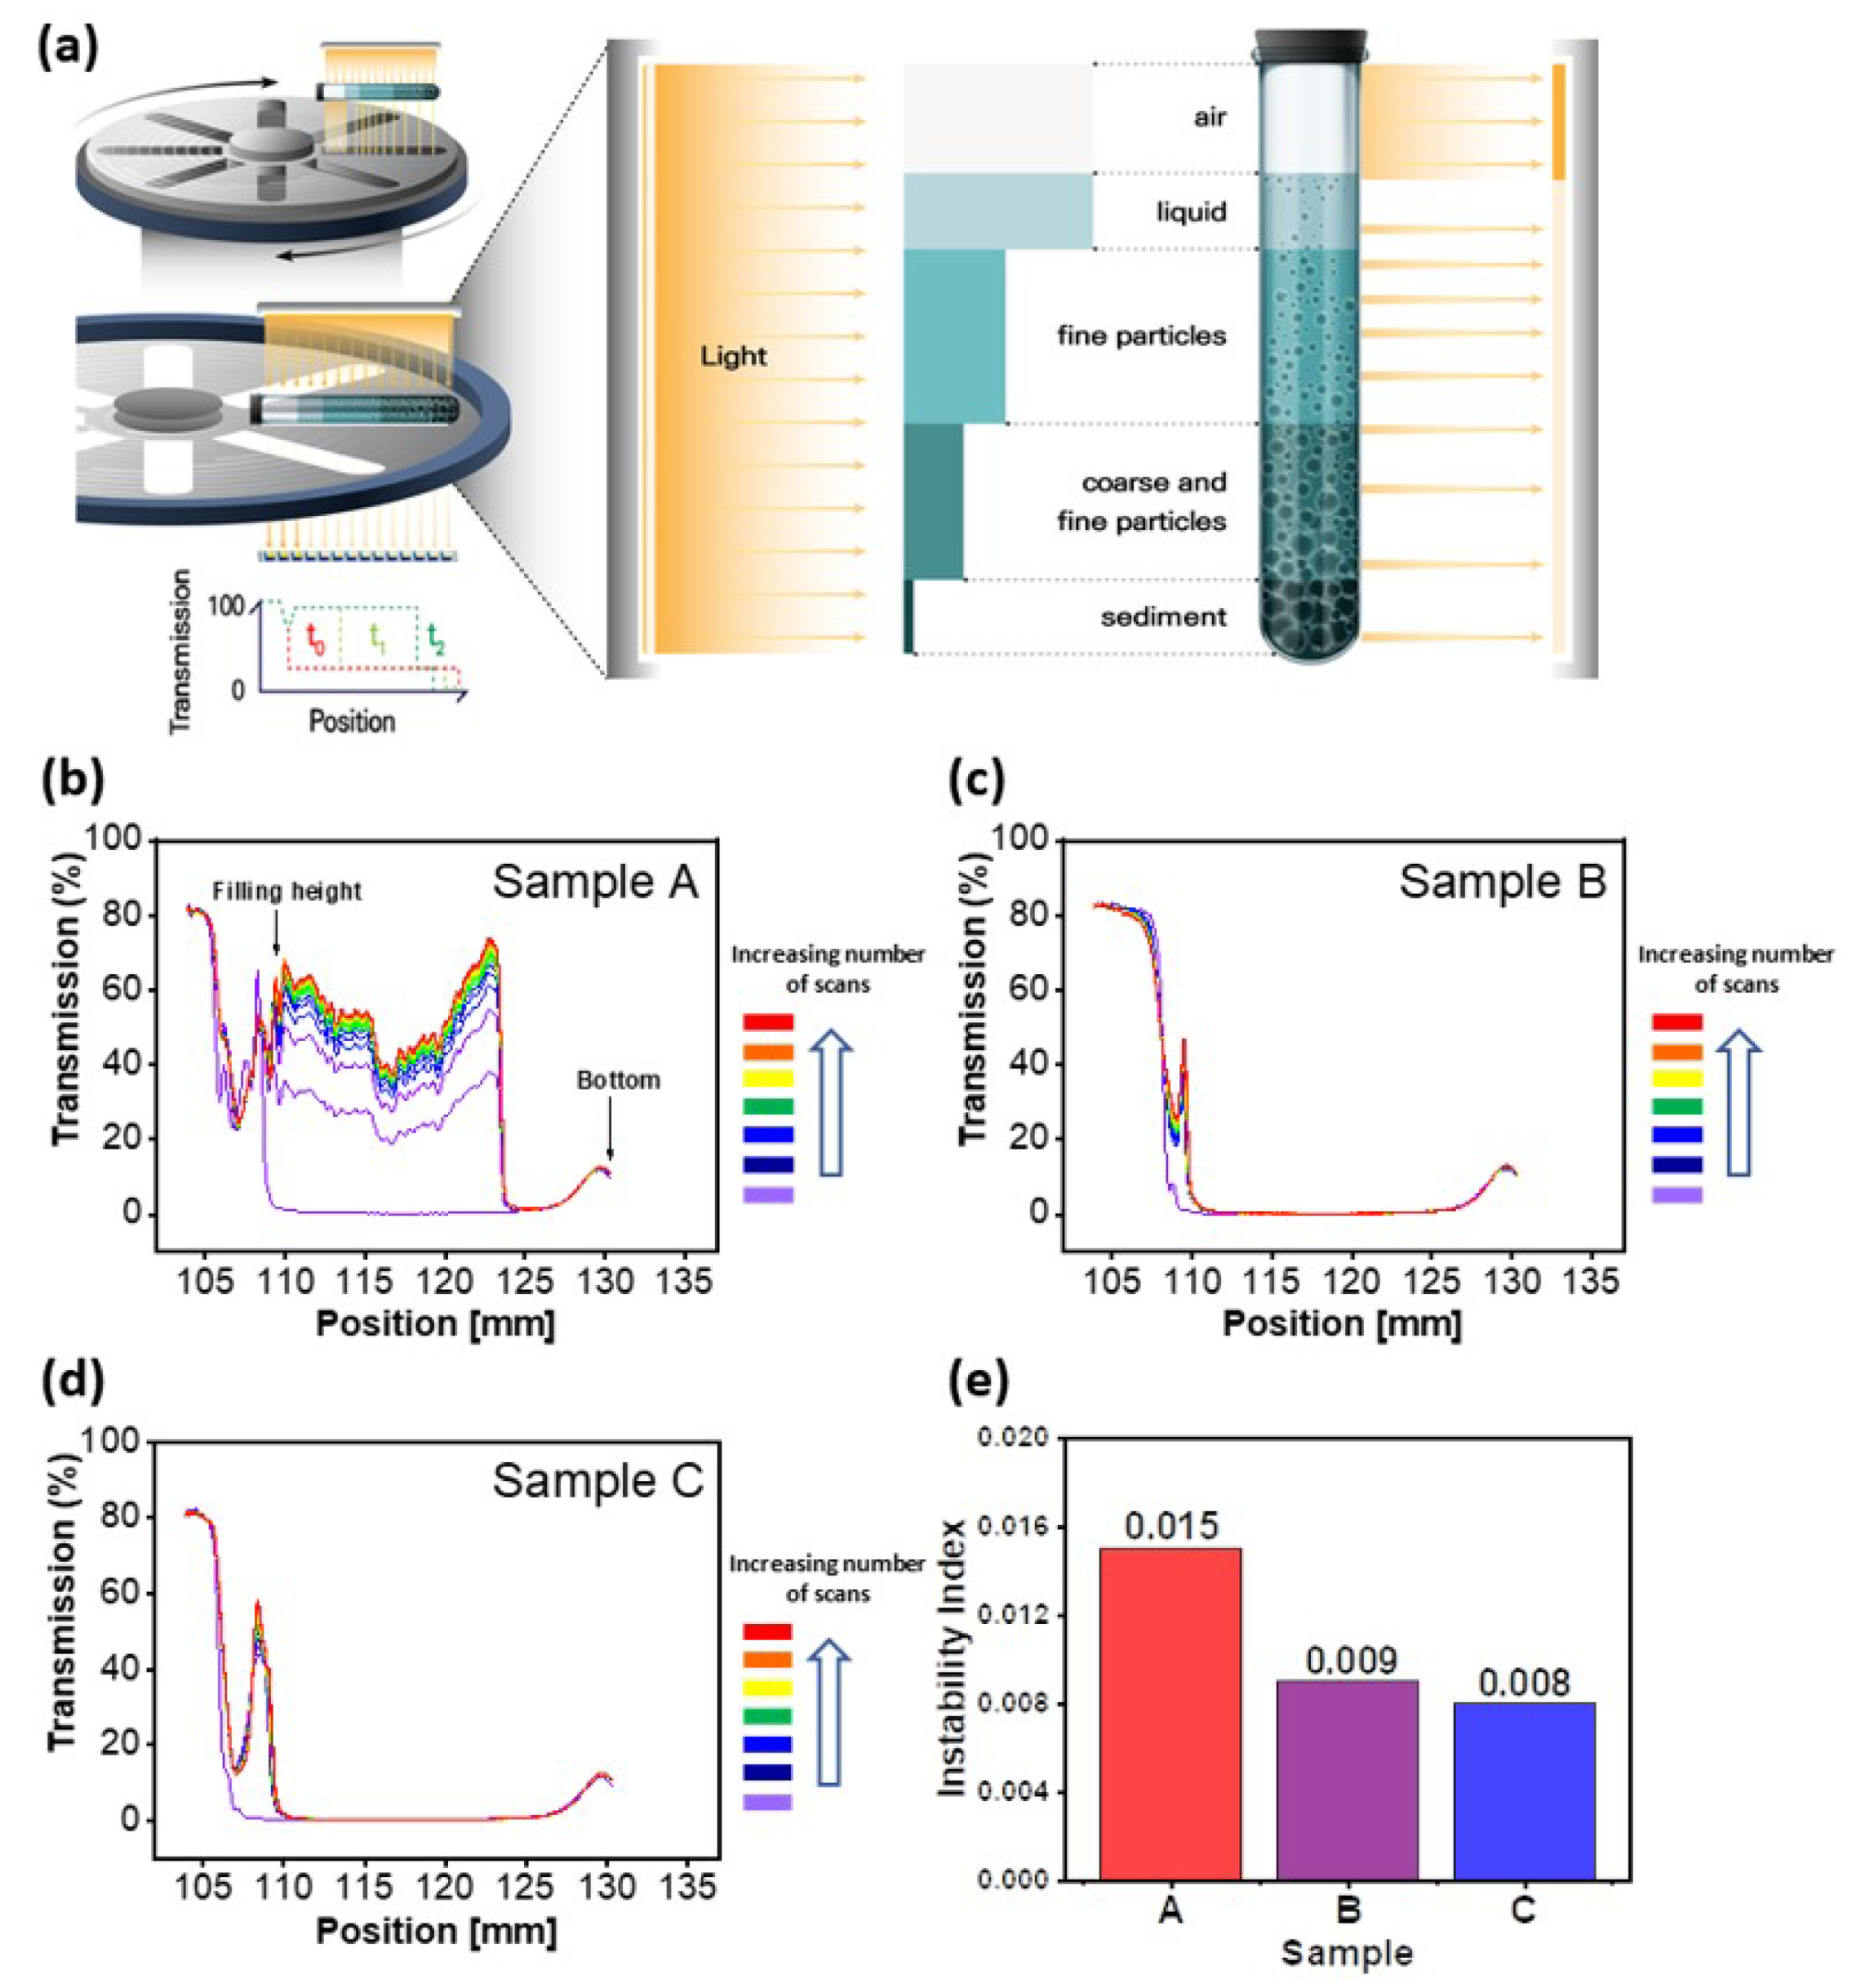
Figure 1a is a schematic view regarding the measurement of the dispersion analyzer. Samples are put in a sampling tube and de-mixing is accelerated by high-speed centrifugation for a set time. During this process, samples are irradiated with near-infrared rays at set time intervals and the degree of transmittance is detected, thereby analyzing the dispersion stability of the samples. Three samples with CNTs dispersed in NMP solvent were each loaded into polyamide tubes in equal amounts and measured every 2 h at a centrifugation speed of 4000 rpm (approx. 1878 G) for 40 h. The peak at a position of approx. 110 mm in Figure 1b–d indicates the filling height of the sample tube and is due to the boundary between the sample and air in the tube. On the other hand, the broad peak at a position of approx. 130 mm is a phenomenon caused by the scattering of part of the scanned light by the tube bottom structure, which occurs during measurement. In the case of sample A (Figure 1b), between the positions of approx. 110 mm and approx. 123 mm, the transmission peaks are gradually increasing overall as the number of measurements increases, except for the first graph measured before the start of centrifugation. It is believed that as the measurement time increased, the fine CNTs particles agglomerated while de-mixing was accelerated by centrifugation, which resulted in an increased amount of transmitted light signals. On the other hand, above the 123 mm position, it was shown that the peak change hardly occurred, as the number of measurements increased due to the failure of the light source to penetrate the sediments accumulating from the bottom of the sample tube to a height of approx. 123 mm. Particularly, although the number of measurements increased, the peak at a position of approx. 123 mm, the boundary of the sediments, hardly shifted to a lower position. This phenomenon is believed to be because the sedimentation of the fine particles is formed very slowly or densely, or because the agglomerated fine particles are suspended in the solvent. Unlike sample A, samples B and C showed little increase in transmission, despite the increase in the number of measurements, indicating that samples B and C had better dispersion in the NMP and higher dispersion stability compared to sample A. Figure 1e showed the instability index based on the measurements for each sample, which can be calculated by dividing the sum of the differences in transmission for each measurement frequency by the maximum possible transmission of the sample, with a higher value indicating lower dispersion stability [29]. For three calculated samples, sample A showed the highest instability index of 0.015, and samples B and C were 0.009 and 0.008, respectively, indicating a higher dispersion stability than sample A.
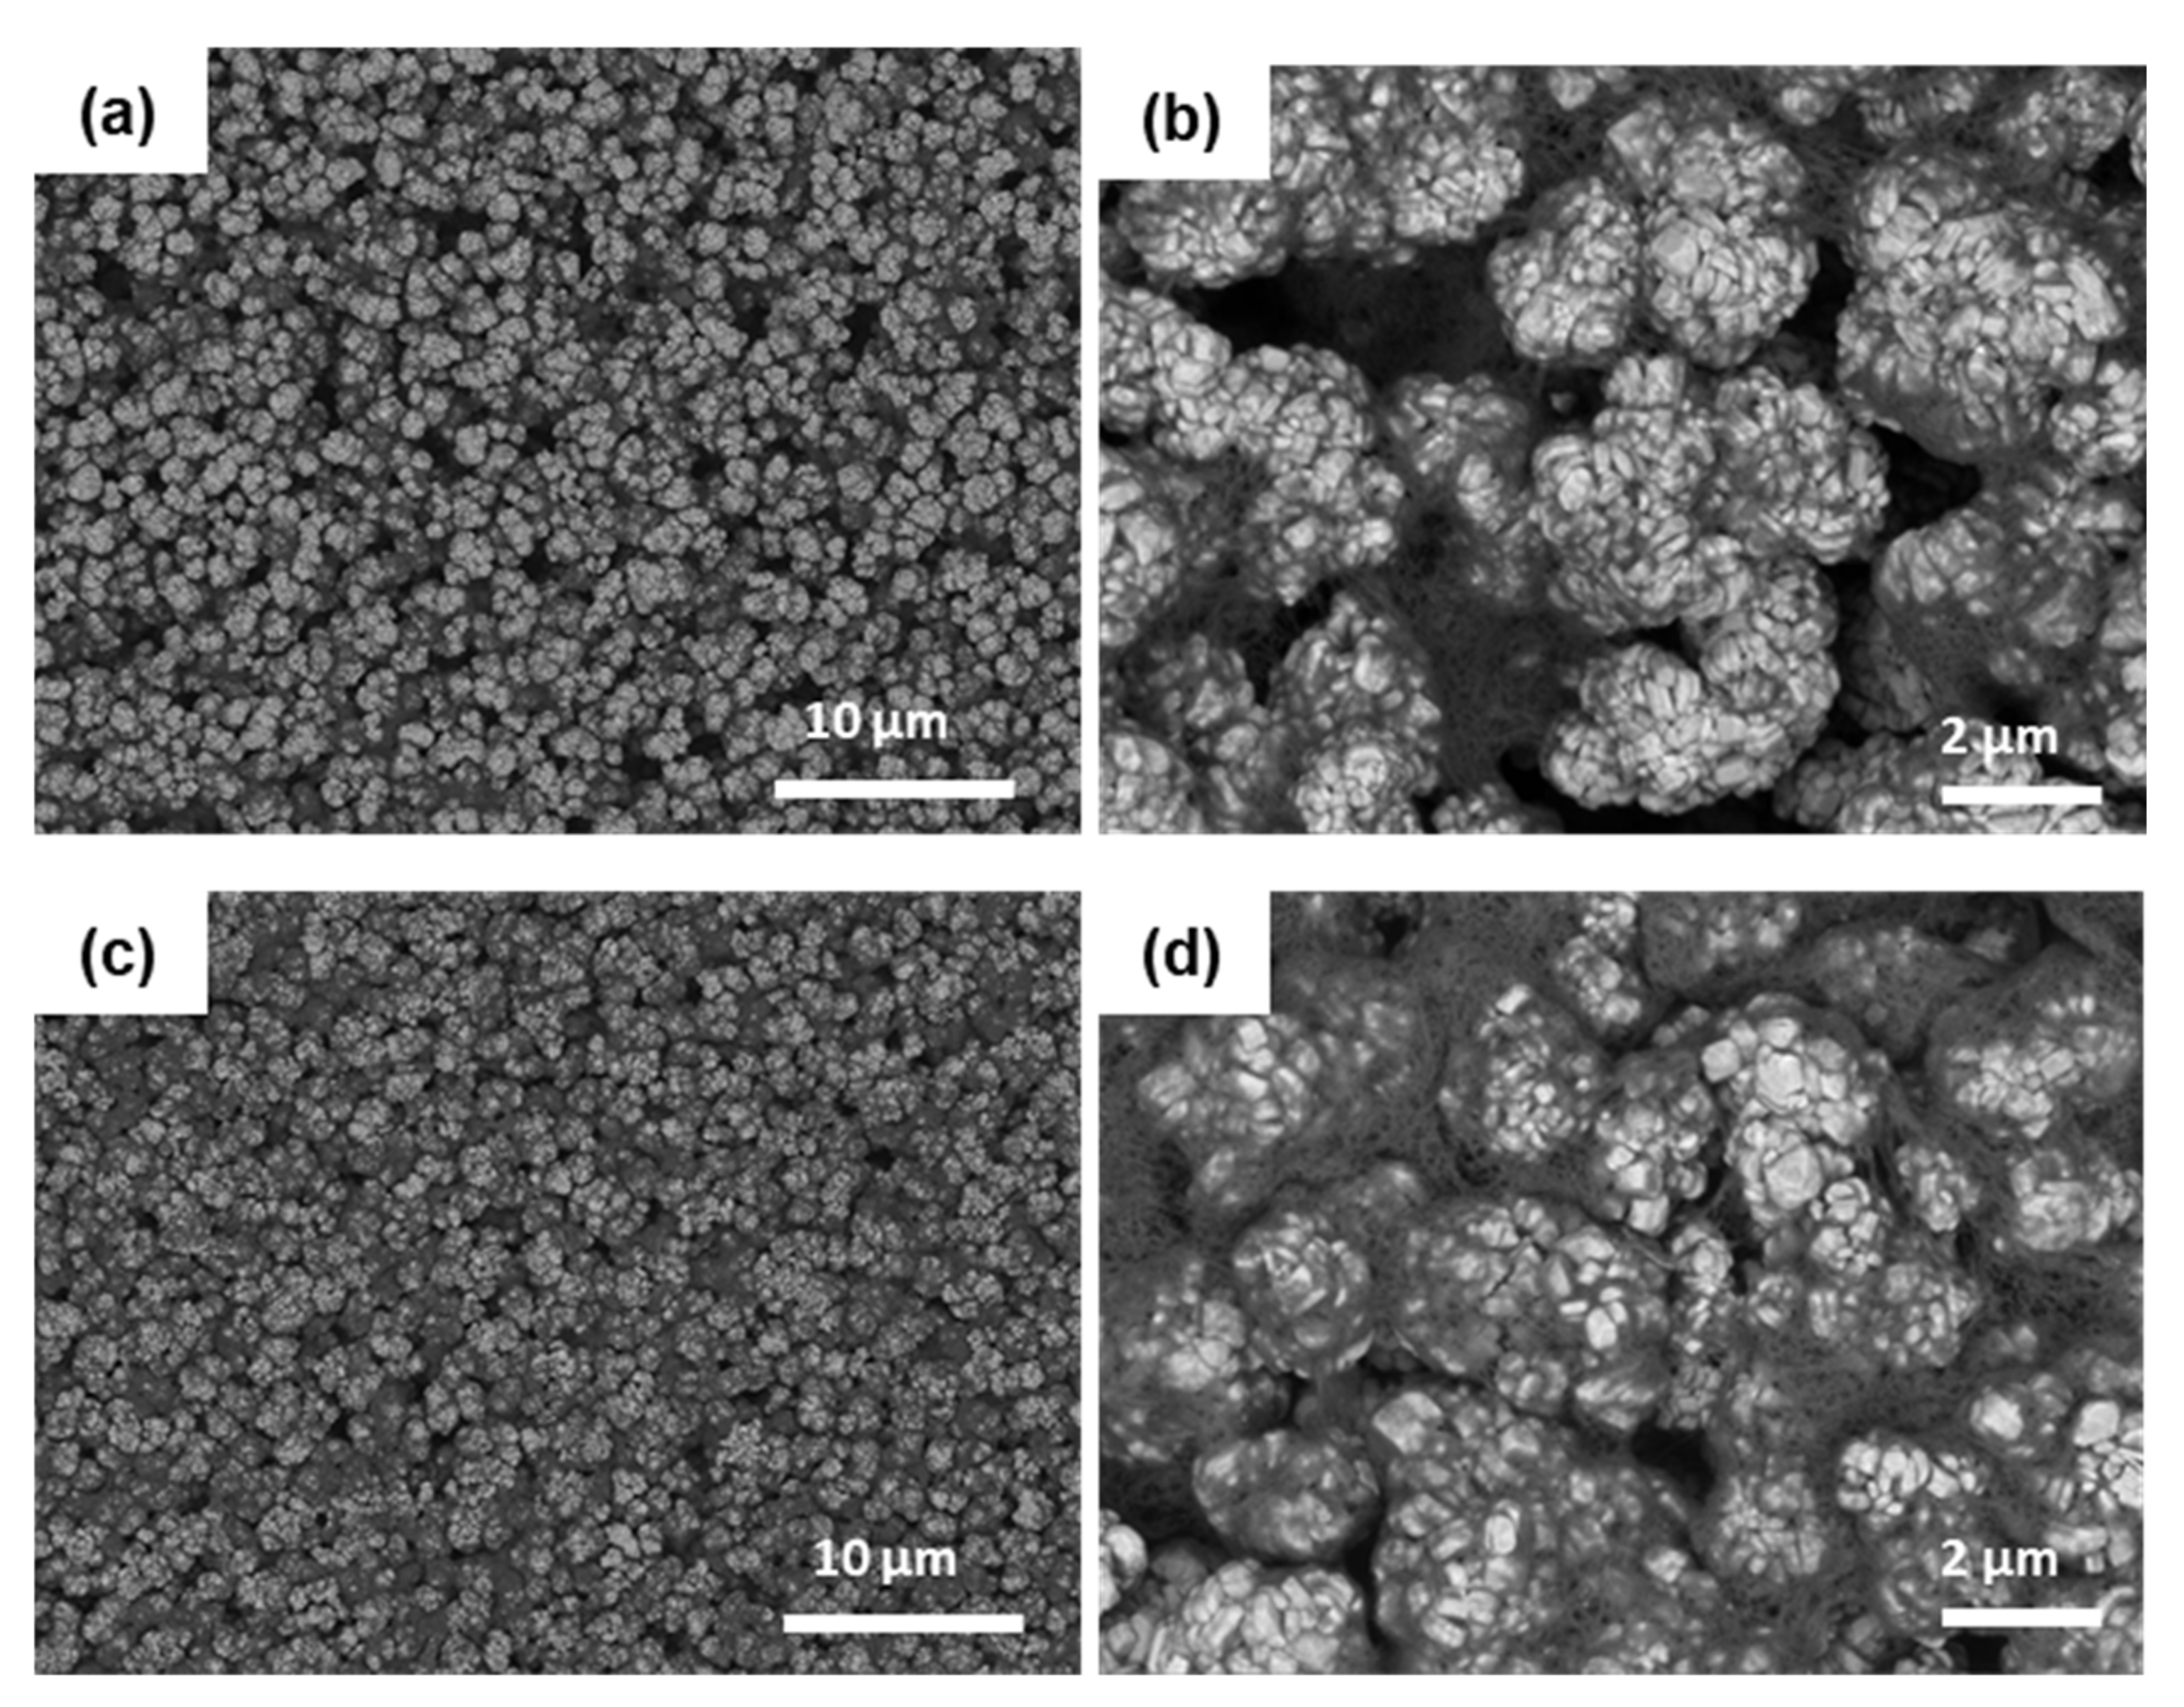
To evaluate the effect of the dispersion stability of CNTs on the formation of internal networks between constituent materials during electrode manufacturing, dispersed CNTs samples were used to fabricate electrodes to which NCM622 cathode material was employed. For the fabricated electrodes using samples A and C, a scanning electron microscope (SEM) was employed to observe the dispersion characteristics of the cathode active material and CNTs, and this is shown in Figure 2. The bright spherical morphologies in the observed SEM images represent the NCM622 cathode materials, and the dark slender morphologies represent CNTs. As shown in Figure 2b, compared to Figure 2d from sample C, the CNTs particles from sample A were not evenly distributed and aggregated in some areas. On the other hand, in the case of the cathode electrode containing sample C, it was shown that the CNTs particles were relatively uniformly distributed in the cathode electrode particles. Figure S1 shows the results of observing the secondary electrons (SE) signal and the backscattered electrons (BSE) signal of the SEM to confirm the difference in this distribution more statistically. The distribution of the color difference between light and dark in SE mode due to the difference in electronic conductivity between materials was subdivided from light gray to dark black, and the composition ratio was extracted from the images. In the BSE mode, as the atomic number difference between the transition metal of the cathode material and the carbon of the CNTs was large; it was observed with the composition ratio by dividing it into white and black images, respectively. It was possible to calculate the area of CNTs distributed on the electrode surface by subtracting the value of the pore (and/or blank) area calculated in SE mode from the black area calculated in BSE mode. In the case of a sample with low dispersion stability of CNTs in the configuration of cathode material and CNTs, the detection area of the cathode material is large and CNTs are reduced by self-agglomeration, while the sample with excellent dispersion stability is evenly distributed with cathode material. The basis of this calculation is that, in the case of a sample with low dispersion stability of CNTs, the surface of the cathode material is greatly exposed due to the aggregation of CNTs, so the detection area of the cathode material is large and the detection area of the CNTs is small. On the other side, in the case of a sample with good dispersion stability, CNTs are uniformly distributed with the cathode material, so the detection area of the cathode material is small and the detection area of the CNTs is larger compared to that of the low dispersion stability. The proportion of CNTs detection area calculated in Figure S1a,b showed that sample C had a higher area compared to sample A. Through these results, it was confirmed that sample C, which had higher dispersion stability, was more evenly distributed in the electrode manufactured together with the cathode material.
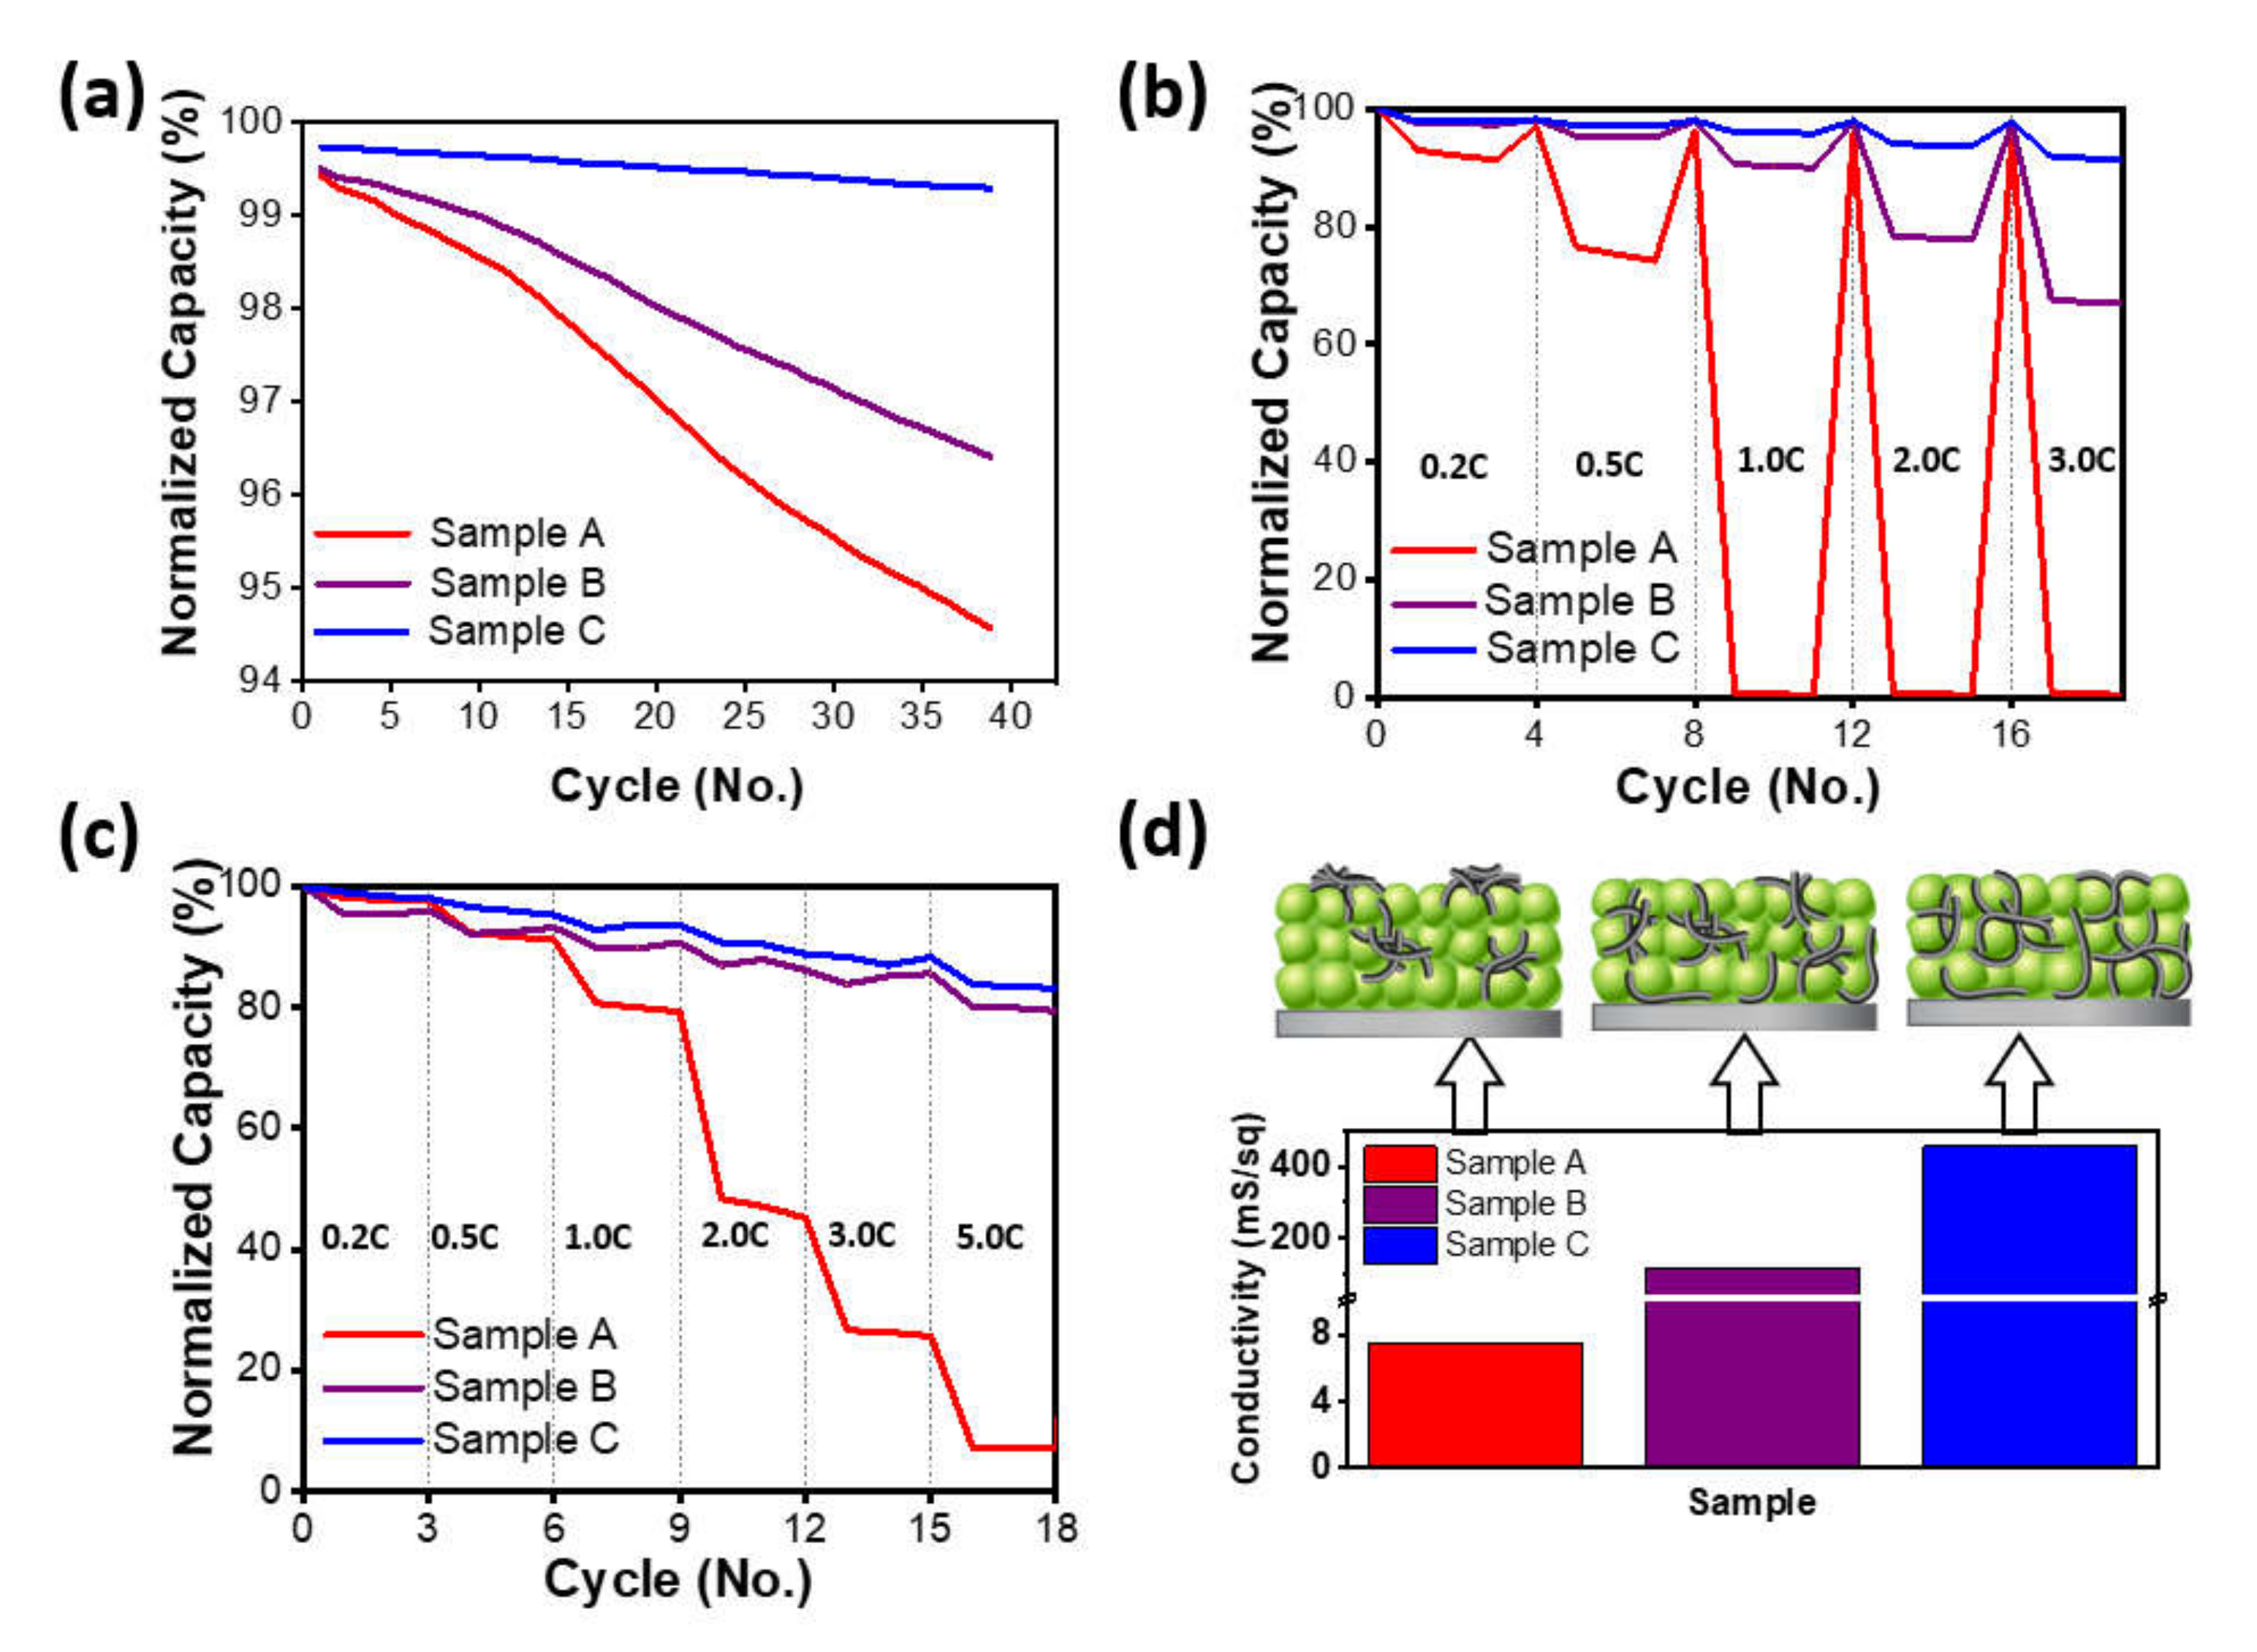
Figure 3 shows the electrochemical properties of the cycle life at 5 C, the charging and discharging rate characteristics under increasing charging or discharging rates up to 3 C and 5 C, respectively, through coin-type half-cells, and the measurement results of electric conductivity via a four-probe contact method for each electrode. Figure 3a shows the normalized discharging capacity for charging and discharging at 5 C at 25 °C. In the case of sample C, it was 99.7% in the first cycle at 5 C, showing the highest capacity retention compared to samples A and B, which were 99.4% and 99.5%, respectively. After 39 cycles, samples A and B were 94.6% and 96.4%, respectively, representing 4.8% points and 3.1% points, respectively, a capacity decrease compared to those of the first cycle, and sample A showed the largest capacity decrease among all samples. However, for sample C, despite the high C-rate cycling, it decreased only 0.4% points to 99.3% after 39 cycles, indicating the highest capacity retention among all samples. In Figure 3b, which evaluated the charging characteristics as the charging rate increased, the capacity of sample A was significantly inferior among the three samples, and even at a rate of 1 C or higher, the capacity became zero. Remarkably, in the case of sample C, the third capacities of 2 C and 3 C were 93.7% and 91.5%, respectively, showing the best capacity retention. In Figure 3c, which evaluated the discharging characteristics as the discharging rate increased, with a similar tendency to the results of the charging characteristics in Figure 3b, sample A showed a sharp decrease of capacity after 0.5 C, and the third capacity at 3 C and 5 C showed 25.6% and 7.3%, respectively. Sample B and C showed a tendency of high capacity retention even with an increasing discharging rate compared to sample A, and they showed high capacity retention of 79.4% and 83.2%, respectively, even at a 5 C rate. To determine the correlation between these cell evaluation properties and the conductivity characteristics of the electrodes, each electrode was measured with a four-tip probe-type electrical conductivity meter, and the results are shown in Figure 3d. The electrical conductivities of the prepared electrodes were 7.6 mS/sq, 114.8 mS/sq, and 454.5 mS/sq for samples A, B, and C, respectively. Sample A showed very low electrical conductivity, while sample C showed the highest conductivity among those samples, which corresponds to the results of the cell performance evaluation. These results show that the formation of the network organically between electrode materials composed of CNTs, cathode material, and the current collector not only ensures stable conductivity of the electrode, but also enables the expression of high conductivity properties by CNTs, thereby suppressing the increase in resistance of the cell during fast charging (or fast discharging). Therefore, it was confirmed that securing dispersion stability of materials with low dispersibility such as CNTs is an important factor for application to electrodes.
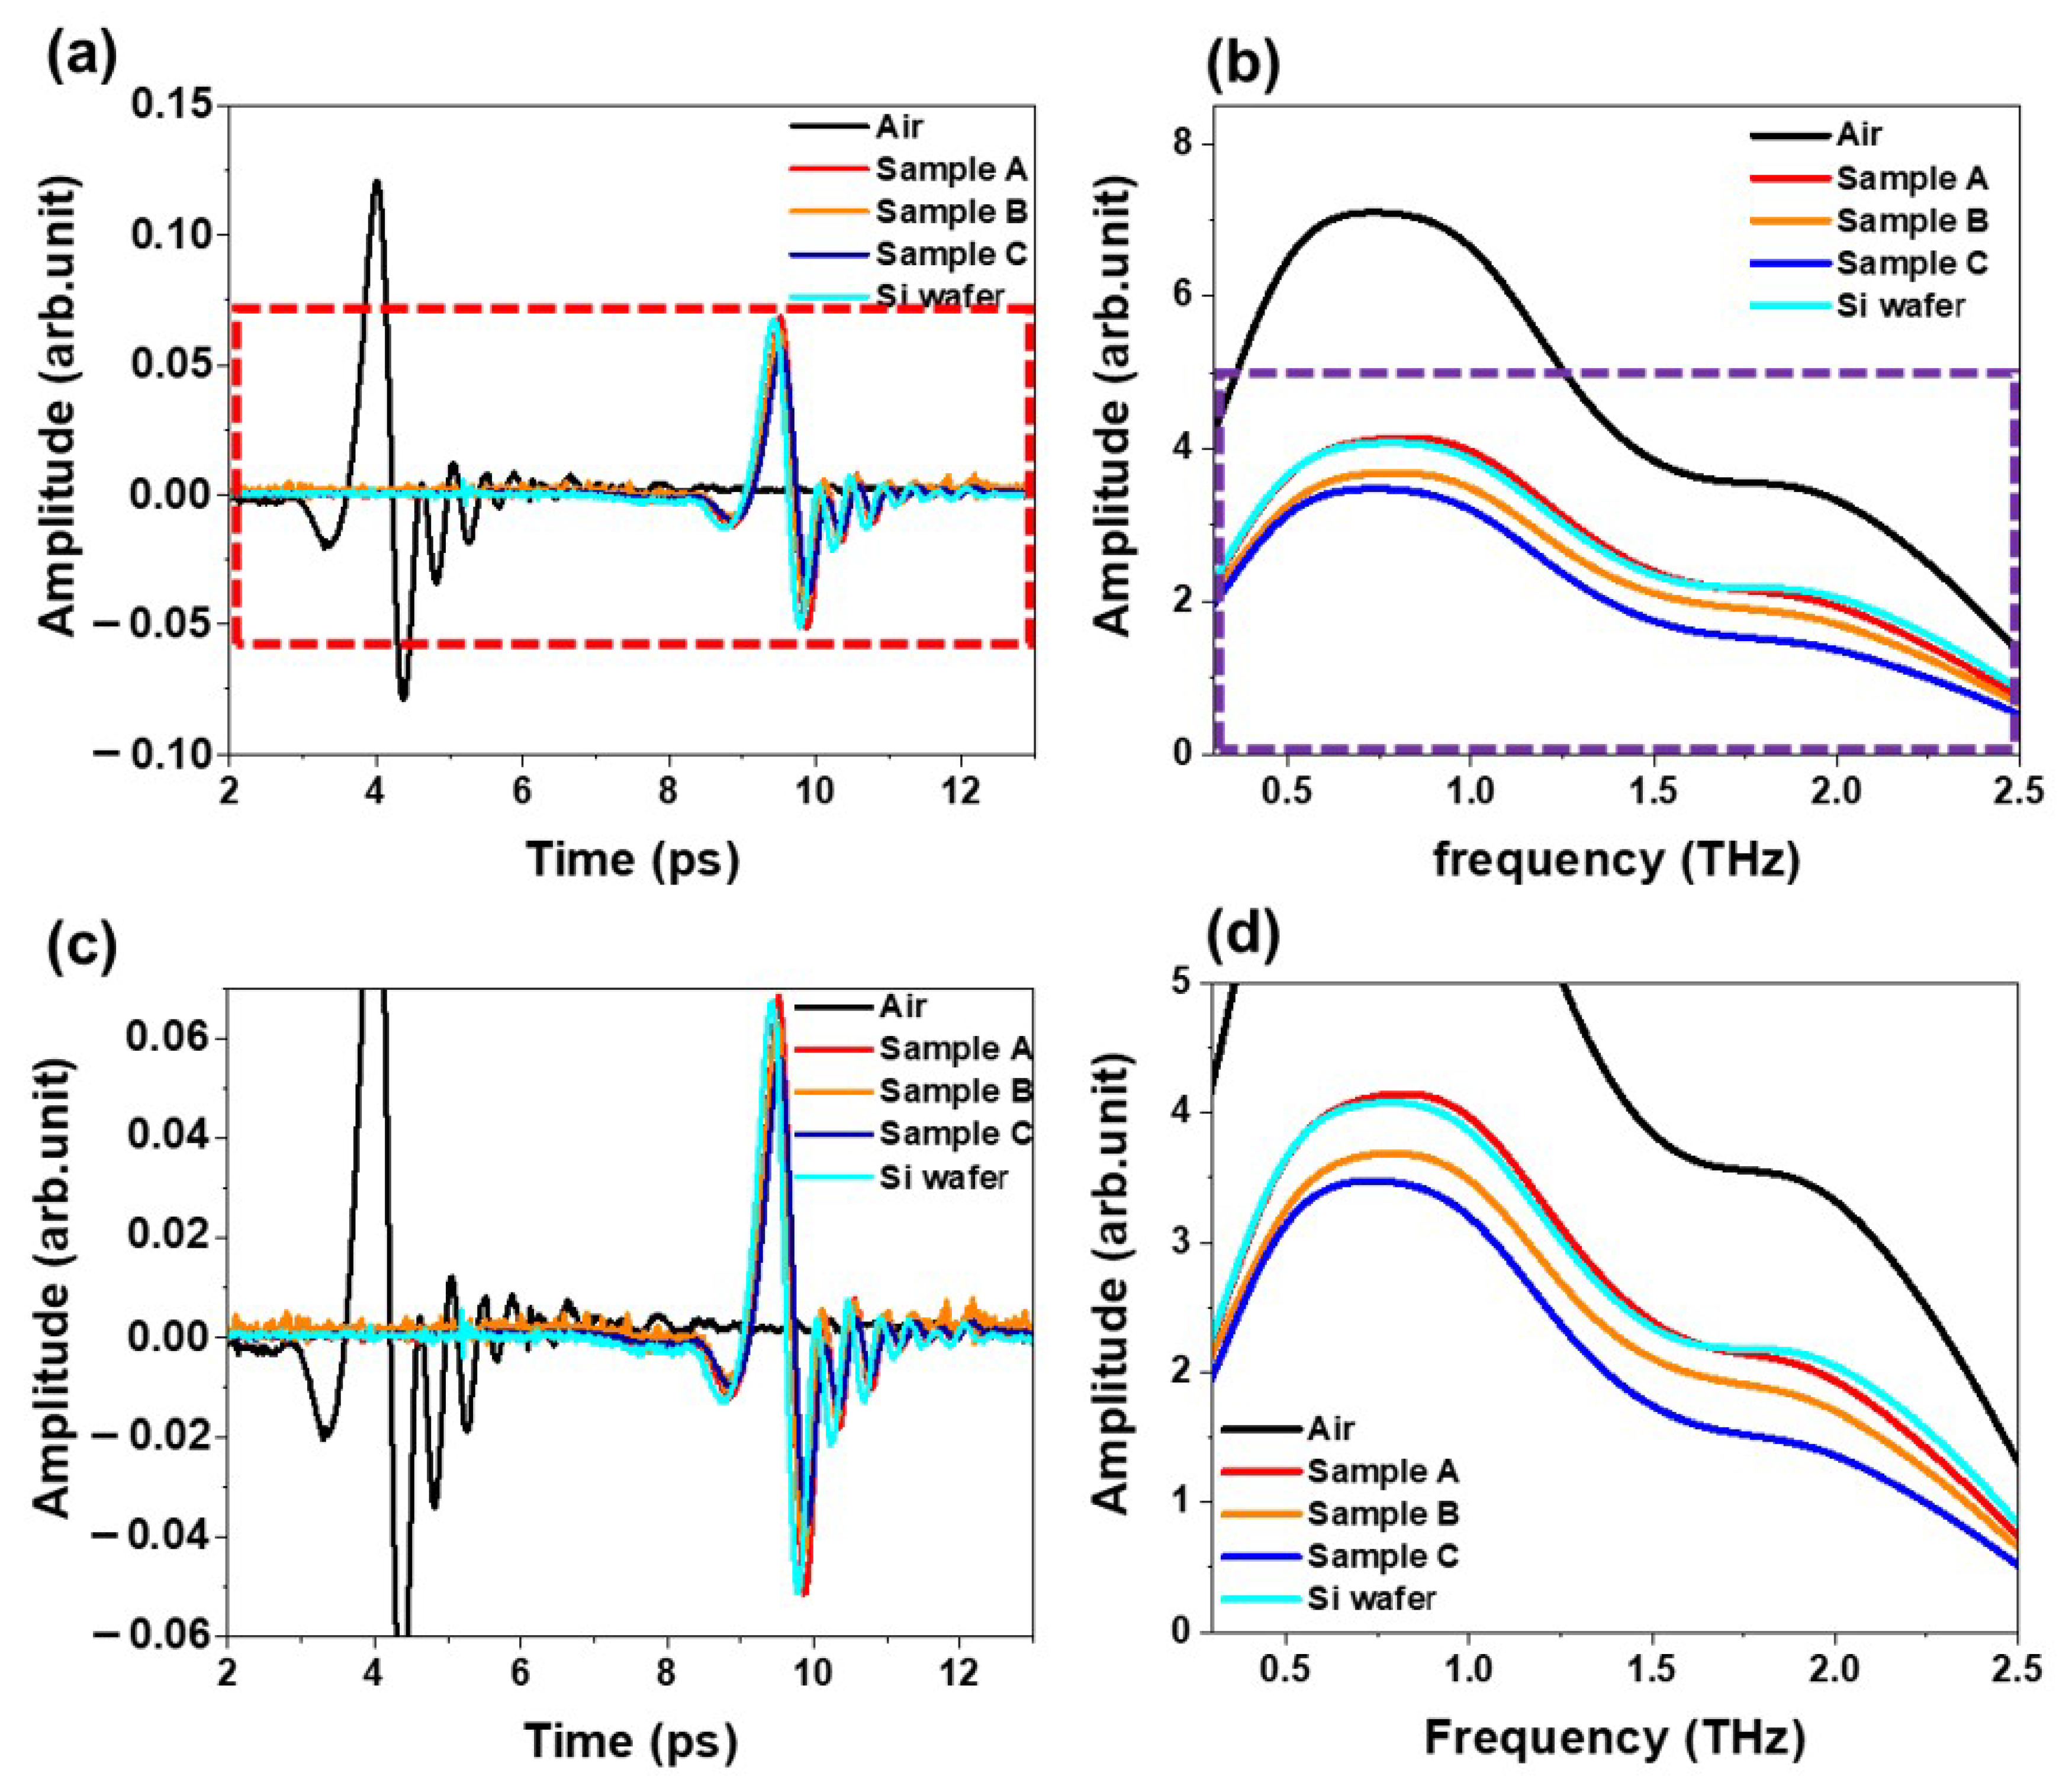
Figure 4 shows the time-domain waveform and their corresponding Fourier-transform frequency spectra of the transmitted THz pulse through the air, bare silicon, and three different cathode films containing CNTs dispersion samples (A, B, and C), respectively. The frequency-domain output THz signals were obtained from the time-domain THz signals using the Fourier-transform analysis of the input and output time-domain THz signals. As expected, the cathode films exhibit a smaller amplitude and a longer arrival time to the detector than that of the air. The relative amplitude of the samples is as follows; sample A > sample B > sample C.
The frequency-domain output THz signal value includes the absorption and refractive index. We obtained the optical constant and conductivity using the transmission amplitude ratio and the following equations. The transmission amplitude ratio A(ω) and phase difference φ (ω) of sample and reference fields can be calculated as [30,31]:
E s a m ω E r e f ω = 4 n ω n ω + 1 2 e α d 2 + i ω n ω 1 d c = A ω e i φ
where c is the speed of light, d represents the sample thickness, and ω is the angular frequency. From Equation (1), we can derive the absorption coefficient α(ω) and the real index of refraction n ω :
α ω = 2 d ln A ω n ω + 1 2 4 n ω
n ω = 1 + c ω d φ ω
The real refractive index n ω value was obtained from the phase difference between the input and output THz pulse. The complex dielectric constant is related to the index of refraction as follows:
ε r ω = n 2 + c 2 ω α 2   ,   ε i ω = c ω n α
According to the Drude model, the complex dielectric constant and the conductivity are given by [32]:
ε ω = ε 4 π N e 2 m ω 2 + Γ 2 + i 4 π N e 2 Γ m ω 2 + Γ 2
σ ω = i ε 0 ω p 2 ω + i Γ   ,   ω p 2 = N e 2 ε 0 m
where ε is the dielectric constant at infinity frequency, N is a carrier, m is the effective mass of the sample, e is the electronic charge, ε 0 is free-space permittivity, and Γ is damping rate. We obtained the constant (N, Γ , ε ) by the Drude model fitting on dielectric constant data, and then calculated the frequency-dependent real conductivity.
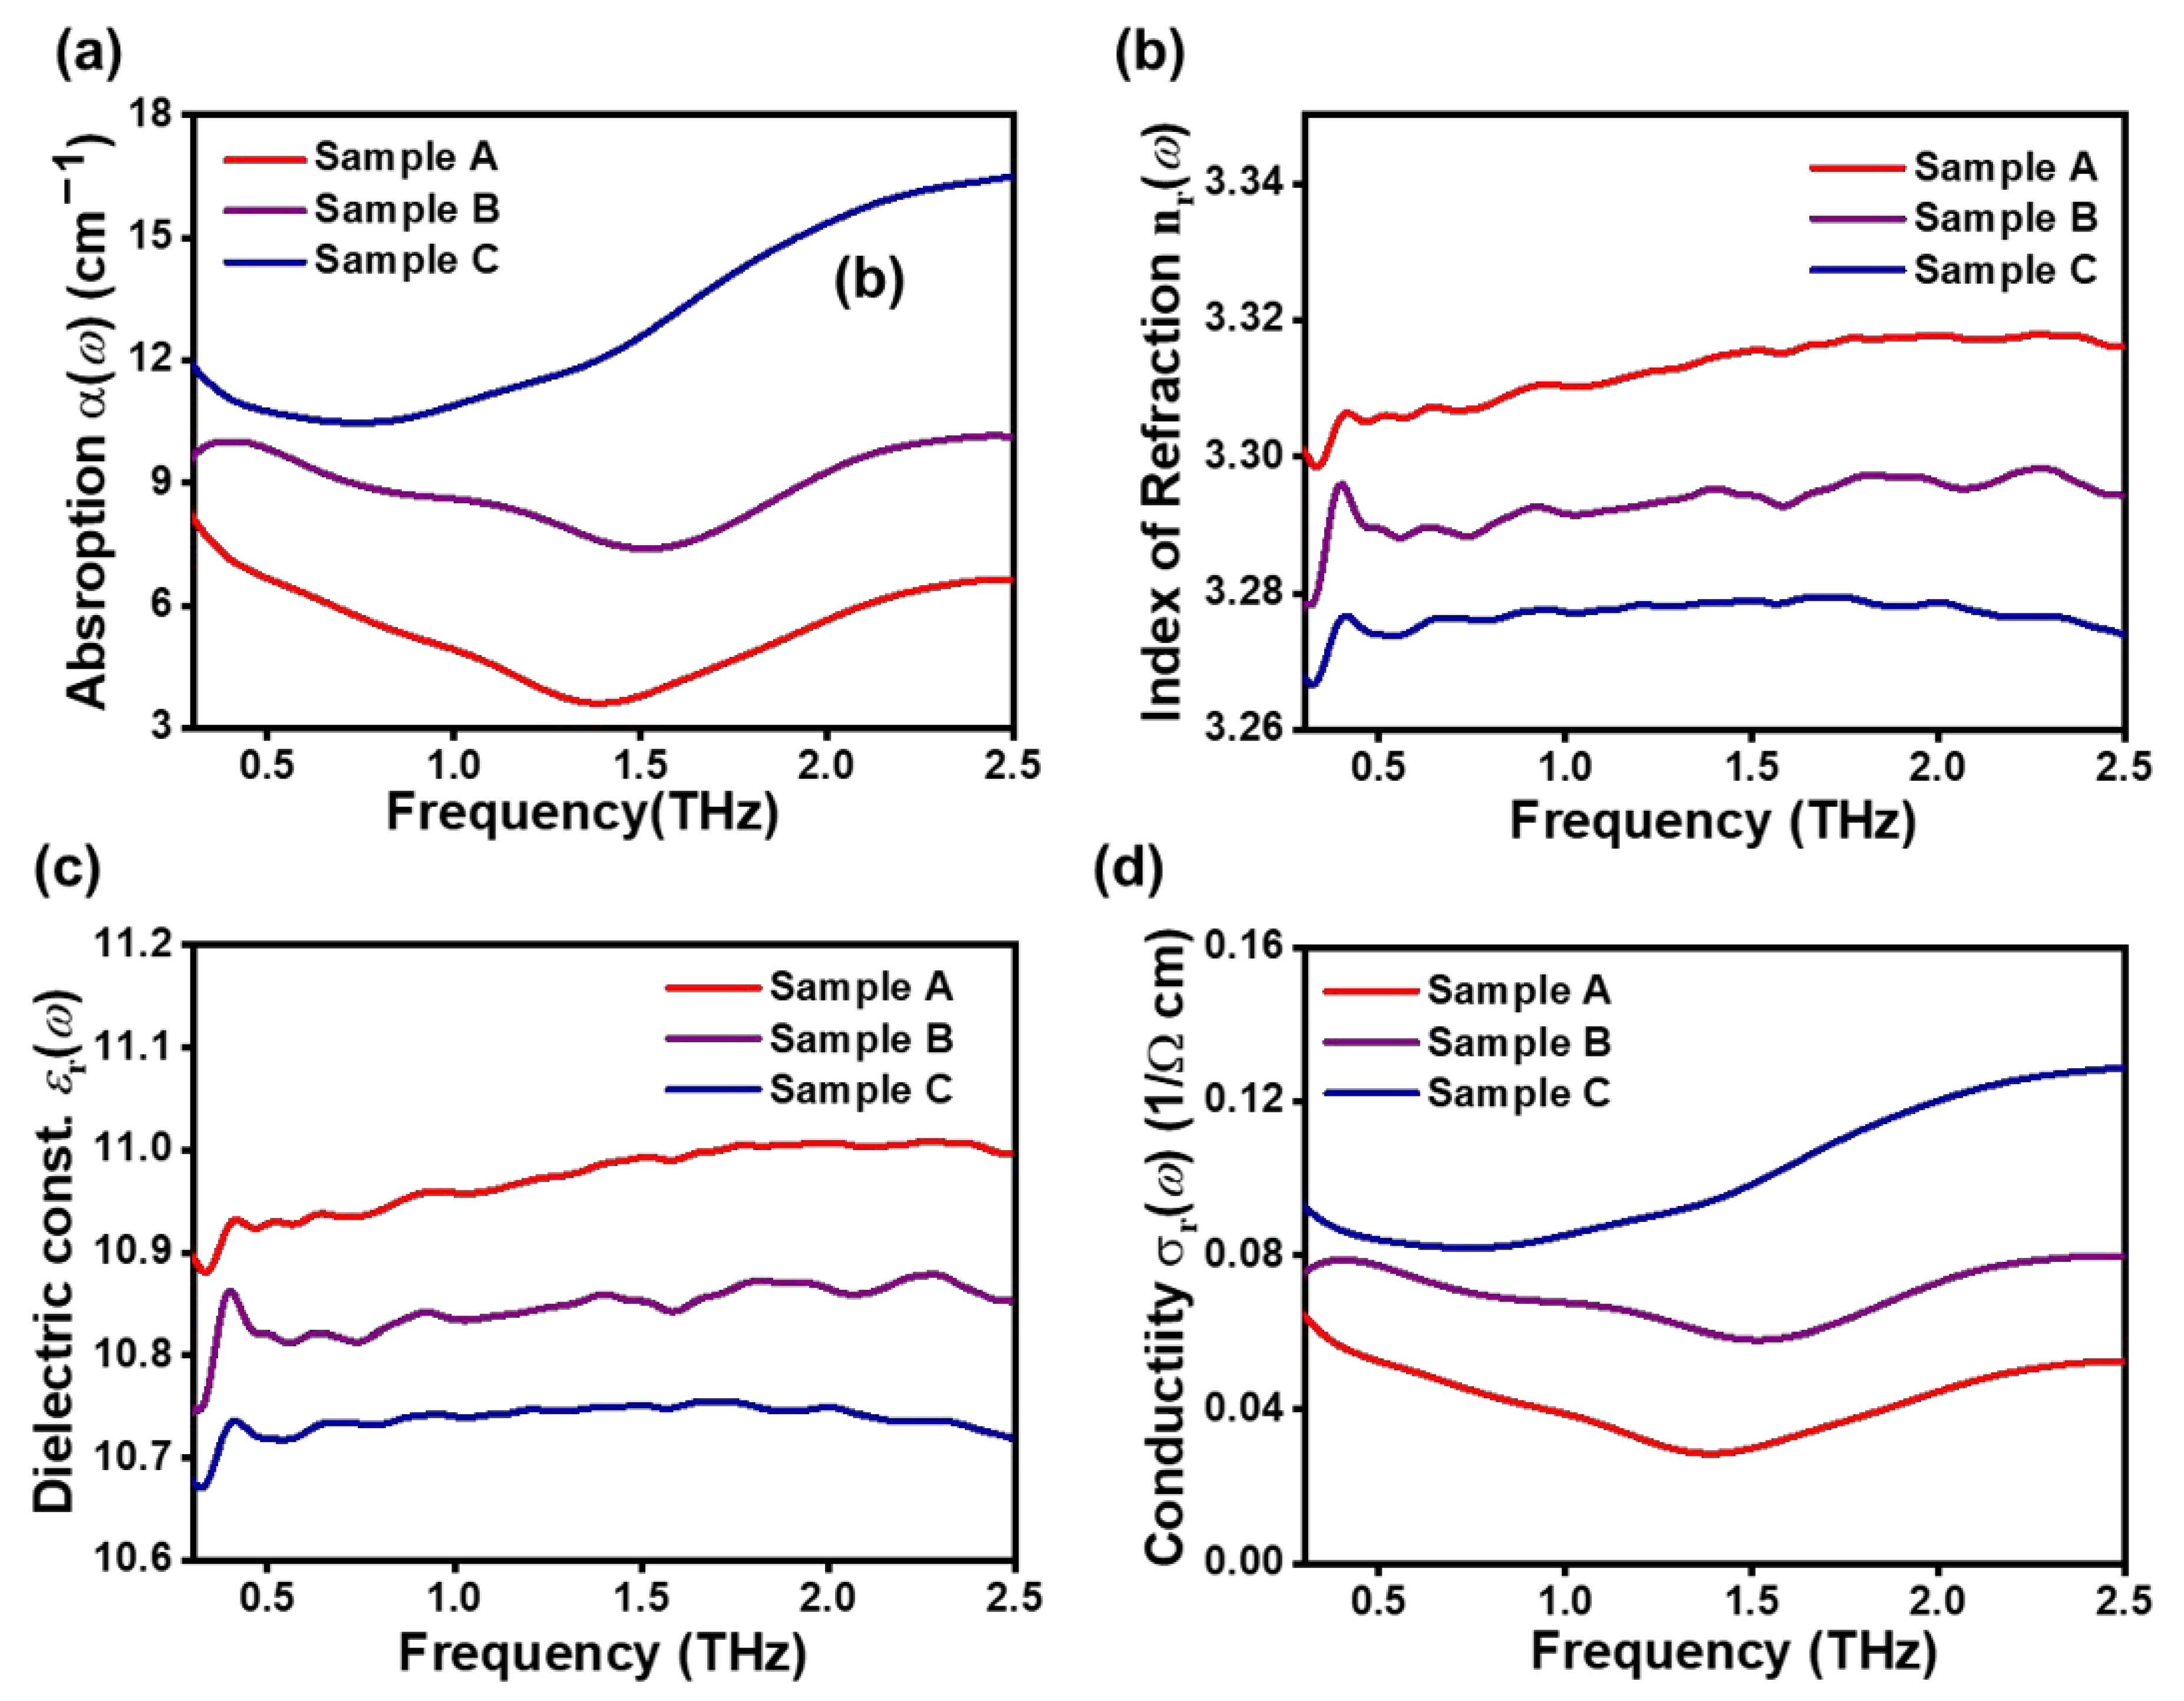
The optical constants and conductivity of the samples are shown in Figure 5. The absorption coefficient α(ω) and the real part index of refraction n ω obtained from THz-TDS data, using Equations (2) and (3), are presented in Figure 5a,b respectively. The α(ω) value of sample A is smaller than that of samples B and C. The n ω spectra are almost flat in the range of 0.5–2.5 THz, and the values at 1 THz for samples A, B, and C are 3.27, 3.29, and 3.31, respectively. The different α(ω) and n ω values for the samples A, B, and C are caused by the different states of CNTs dispersion. As previously described, the degree of CNTs dispersion in each sample was different, and sample A was at the lowest degree of CNTs dispersion. Furthermore, its electric conductivity was also the lowest. As explained above, it is calculating the spectra for the relative dielectric constant ε r ω knowing the n ω . Figure 5c shows the real part of the complex dielectric function spectra for samples A, B, and C. The resulting ε r ω spectra are almost flat in the range of 0.5–2.5 THz, as we observed previously for the n ω dependences presented in Figure 5b. The conductivity calculation is based on Equations (5) and (6). Figure 5d displays real conductivity σ( ω ) data for the samples. The σ( ω ) values decrease in the order C > B > A. This result is in good agreement with the conductivity values obtained from the four-point contact electrical conductivity measurement in Figure 3d. We found that the conductivity of the electrode prepared from the slurry containing the cathode material increased with an increase in the degree of CNTs dispersion. Therefore, the THz-TDS method may be used as a useful tool to analyze the dispersion degree of slurries containing materials that are difficult to disperse such as CNTs, and to have insight into the fast estimation of electrochemical performances, whereas it takes a long time to get a conventional electrochemical estimation.

4. Conclusions

In this study, the effect of dispersion stability of CNTs on the formation of electrodes during cathode electrode manufacturing was analyzed in various methods, and the correlation between them was verified through cell evaluations. The sample with high dispersion stability of CNTs showed a uniform distribution with the cathode material in the electrode analysis, which confirmed that the networks between the constituent materials in the electrode were well-formed and exhibited excellent electrochemical properties. In particular, using THz-TDS, a new non-destructive analysis technique, we performed the analysis of cathode slurries that co-existed with cathode material and CNTs, indicating that the analysis results correspond to other analyzes and electrochemical results. Based on a non-destructive method, high reliability, and speed, THz-TDS is expected to be actively utilized in the material dispersion and distribution analysis related to slurry characteristics during the manufacturing process of LIBs, compared to customary ways for electrochemical analysis for LIBs.

Supplementary Materials

The following are available online at https://www.mdpi.com/article/10.3390/en15072665/s1, Figure S1. SEM and BSE images of (a) sample A and (b) sample C. (c,d) Collected data and calculated results based on color composition from SE and BSE signals. Figure S2. Schematic diagram of terahertz time-domain spectroscopy (THz-TDS) measurement.

Author Contributions

Conceptualization, J.K. and G.B.J.; Data curation, D.B.P. and M.J.; Formal analysis, N.E.Y. and B.S.; Investigation, N.E.Y., B.S. and P.O.; Methodology, J.K., G.B.J. and P.O.; Project administration, Y.S.; Software, D.B.P. and M.J.; Supervision, Y.S.; Validation, P.O.; Writing—original draft, J.K. and G.B.J.; Writing—review and editing, Y.S.; All authors have read and agreed to the published version of the manuscript.

Funding

This study was supported by a research fund from Chosun University, 2018 (2018-207827-01).

Institutional Review Board Statement

Not applicable.

Informed Consent Statement

Not applicable.

Data Availability Statement

Not applicable.

Conflicts of Interest

The authors declare no conflict of interest.

References

  1. Verma, P.; Maire, P.; Novák, P. A review of the features and analyses of the solid electrolyte interphase in Li-ion batteries. Electrochim. Acta 2010, 55, 6332–6341. [Google Scholar] [CrossRef]
  2. Son, Y.; Lee, J.S.; Son, Y.; Jang, J.H.; Cho, J. Recent advances in lithium sulfide cathode materials and their use in lithium sulfur batteries. Adv. Energy Mater. 2015, 5, 1500110. [Google Scholar] [CrossRef]
  3. Degirmenci, K.; Breitner, M.H. Consumer purchase intentions for electric vehicles: Is green more important than price and range? Transp. Res. Part D Transp. Environ. 2017, 51, 250–260. [Google Scholar] [CrossRef] [Green Version]
  4. Etacheri, V.; Marom, R.; Elazari, R.; Salitra, G.; Aurbach, D. Challenges in the development of advanced Li-ion batteries: A review. Energy Environ. Sci. 2011, 4, 3243–3262. [Google Scholar] [CrossRef]
  5. Kim, J.; Oh, J.; Lee, H. Review on battery thermal management system for electric vehicles. J. Appl. Therm. Eng. 2019, 149, 192–212. [Google Scholar] [CrossRef]
  6. Zeng, X.; Li, M.; Abd El-Hady, D.; Alshitari, W.; Al-Bogami, A.S.; Lu, J.; Amine, K. Commercialization of lithium battery technologies for electric vehicles. Adv. Energy Mater. 2019, 9, 1900161. [Google Scholar] [CrossRef]
  7. Sun, P.; Bisschop, R.; Niu, H.; Huang, X. A review of battery fires in electric vehicles. Fire technol. 2020, 56, 1361–1410. [Google Scholar] [CrossRef]
  8. Lee, K.T.; Cho, J. Roles of nanosize in lithium reactive nanomaterials for lithium ion batteries. Nano Today 2011, 6, 28–41. [Google Scholar] [CrossRef]
  9. Wu, X.-L.; Guo, Y.-G.; Su, J.; Xiong, J.-W.; Zhang, Y.-L.; Wan, L.-J. Carbon-nanotube-decorated nano-LiFePO4@C cathode material with superior high-rate and low-temperature performances for lithium-ion batteries. Adv. Energy Mater. 2013, 3, 1155–1160. [Google Scholar] [CrossRef]
  10. Son, Y.; Park, M.; Son, Y.; Lee, J.-S.; Jang, J.-H.; Kim, Y.; Cho, J. Quantum confinement and its related effects on the critical size of GeO2 nanoparticles anodes for lithium batteries. Nano Lett. 2014, 14, 1005–1010. [Google Scholar] [CrossRef]
  11. Son, Y.; Son, Y.; Choi, M.; Ko, M.; Chae, S.; Park, N.; Cho, J. Hollow silicon nanostructures via the kirkendall effect. Nano Lett. 2015, 15, 6914–6918. [Google Scholar] [CrossRef] [PubMed]
  12. Yue, Y.; Liang, H. Micro-and nano-structured vanadium pentoxide (V2O5) for electrodes of lithium-ion batteries. Adv. Energy Mater. 2017, 7, 1602545. [Google Scholar] [CrossRef]
  13. Zhao, C.; Wada, T.; De Andrade, V.; Gürsoy, D.; Kato, H.; Chen-Wiegart, Y.-C.K. Imaging of 3D morphological evolution of nanoporous silicon anode in lithium ion battery by X-ray nano-tomography. Nano Energy 2018, 52, 381–390. [Google Scholar] [CrossRef]
  14. Cai, X.; Liu, W.; Zhao, Z.; Li, S.; Yang, S.; Zhang, S.; Gao, Q.; Yu, X.; Wang, H.; Fang, Y. Simultaneous encapsulation of nano-si in redox assembled rGO film as binder-free anode for flexible/bendable lithium-ion batteries. ACS Appl. Mater. Interfaces 2019, 11, 3897–3908. [Google Scholar] [CrossRef] [PubMed]
  15. Wang, M.-S.; Wang, G.-L.; Wang, S.; Zhang, J.; Wang, J.; Zhong, W.; Tang, F.; Yang, Z.-L.; Zheng, J.; Li, X. In situ catalytic growth 3D multi-layers graphene sheets coated nano-silicon anode for high performance lithium-ion batteries. Chem. Eng. J. 2019, 356, 895–903. [Google Scholar] [CrossRef]
  16. Zhang, Y.; Wang, L.; Xu, H.; Cao, J.; Chen, D.; Han, W. 3D chemical cross-linking structure of black phosphorus@CNTs hybrid as a promising anode material for lithium ion batteries. Adv. Funct. Mater. 2020, 30, 1909372. [Google Scholar] [CrossRef]
  17. Gao, M.; Tang, Z.; Wu, M.; Chen, J.; Xue, Y.; Guo, X.; Liu, Y.; Kong, Q.; Zhang, J. Self-supporting N, P doped Si/CNTs/CNFs composites with fiber network for high-performance lithium-ion batteries. J. Alloy. Compd. 2021, 857, 157554. [Google Scholar] [CrossRef]
  18. Zhu, W.; Kierzek, K.; Wang, S.; Li, S.; Holze, R.; Chen, X. Improved performance in lithium ion battery of CNT-Fe3O4@graphene induced by three-dimensional structured construction. Colloids Surfaces A Physicochem. Eng. Asp. 2021, 612, 126014. [Google Scholar] [CrossRef]
  19. Popov, V.N. Carbon nanotubes: Properties and application. Mater. Sci. Eng. R Rep. 2004, 43, 61–102. [Google Scholar] [CrossRef]
  20. Landi, B.J.; Ganter, M.J.; Cress, C.D.; Dileo, R.A.; Raffaelle, R.P. Carbon nanotubes for lithium ion batteries. Energy Environ. Sci. 2009, 2, 638–654. [Google Scholar] [CrossRef]
  21. Wang, G.; Li, H.; Zhang, Q.; Yu, Z.; Qu, M. The study of carbon nanotubes as conductive additives of cathode in lithium ion batteries. J. Solid State Electrochem. 2011, 15, 759–764. [Google Scholar] [CrossRef]
  22. Wu, Y.; Wang, J.; Jiang, K.; Fan, S. Applications of carbon nanotubes in high performance lithium ion batteries. Front. Phys. 2014, 9, 351–369. [Google Scholar] [CrossRef]
  23. Raffaelle, R.; Landi, B.; Harris, J.; Bailey, S.; Hepp, A. Carbon nanotubes for power applications. Mater. Sci. Eng. B 2005, 116, 233–243. [Google Scholar] [CrossRef]
  24. Yoo, J.-K.; Oh, Y.; Park, T.; Lee, K.E.; Um, M.-K.; Yi, J.-W. Optimization of carbon nanotubes as conductive additives for high-energy-density electrodes for lithium-ion batteries. Energy Technol. 2019, 7, 1800845. [Google Scholar] [CrossRef]
  25. Jung, G.B.; Myung, Y.; Cho, Y.J.; Sohn, Y.J.; Jang, D.M.; Kim, H.S.; Lee, C.-W.; Park, J.; Maeng, I.; Son, J.-H.; et al. Terahertz spectroscopy of nanocrystal−carbon nanotube and −graphene oxide hybrid nanostructures. J. Phys. Chem. C 2010, 114, 11258–11265. [Google Scholar] [CrossRef]
  26. Lloyd-Hughes, J.; Jeon, T.-I. A Review of the Terahertz Conductivity of Bulk and Nano-Materials. J. Infrared Millim. Terahertz Waves 2012, 33, 871–925. [Google Scholar] [CrossRef]
  27. Wang, Y.; Duan, G.; Zhang, L.; Ma, L.; Zhao, X.; Zhang, X. Terahertz dispersion characteristics of super-aligned Multi-walled carbon nanotubes and enhanced transmission through subwavelength apertures. Sci. Rep. 2018, 8, 2087. [Google Scholar] [CrossRef] [PubMed]
  28. Koroliov, A.; Chen, G.; Goodfellow, K.M.; Vamivakas, A.N.; Staniszewski, Z.; Sobolewski, P.; El Fray, M.; Łaszcz, A.; Czerwinski, A.; Richter, C.P.; et al. Terahertz time-domain spectroscopy of graphene nanoflakes embedded in polymer matrix. Appl. Sci. 2019, 9, 391. [Google Scholar] [CrossRef] [Green Version]
  29. Detloff, T.; Sobisch, T.; Lerche, D. Instability index. Dispers. Lett. Tech.l 2013, 4, 1–4. [Google Scholar]
  30. Duvillaret, L.; Garet, F.; Coutaz, J.-L. A reliable method for extraction of material parameters in terahertz time-domain spectroscopy. IEEE J. Sel. Top. Quantum Electron. 1996, 2, 739–746. [Google Scholar] [CrossRef] [Green Version]
  31. Kumar, S.; Kamaraju, N.; Karthikeyan, B.; Tondusson, M.; Freysz, E.; Sood, A.K. Terahertz spectroscopy of single-walled carbon nanotubes in a polymer film: Observation of low-frequency phonons. J. Phys. Chem. C 2010, 114, 12446–12450. [Google Scholar] [CrossRef]
  32. Kang, C.; Maeng, I.H.; Oh, S.J.; Lim, S.C.; An, K.H.; Lee, Y.H.; Son, J.-H. Terahertz optical and electrical properties of hydrogen-functionalized carbon nanotubes. Phys. Rev. B 2007, 75, 085410. [Google Scholar] [CrossRef] [Green Version]
Figure 1. (a) Schematic view of dispersion stability analyzer. (bd) Transmission profiles of dispersed carbon nanotube (CNT) samples A, B, and C, which were scanned every 2 h during centrifugation for 40 h. (e) Instability index of those samples.
Energies 15 02665 g001
Figure 2. Scanning electron microscope (SEM) images of fabricated electrodes by mixing the cathode material with Sample A and C dispersions. (a,c) Low magnification SEM images of fabricated electrodes by Sample A and C, respectively. (b,d) High magnification SEM images of (a,c), respectively.
Energies 15 02665 g002
Figure 3. (a) Normalized reversible discharge capacity versus cycle graph of sample A, B, and C at 5.0 C. (b) Charge character graph of those samples under different charging C-rates from 0.2 C up to 3.0 C. (c) Discharge character graph of those samples under different discharging C-rates from 0.2 C up to 5.0 C. (d) Conductivity measurement graph of fabricated cathode electrodes including CNT samples by using a four-point probe resistance measurement.
Energies 15 02665 g003
Figure 4. (a) Time-domain waveform of the transmitted THz pulse, (b) and its corresponding Fourier-transform frequency spectra of air, Si wafer, and samples (A, B, and C). (c,d) These are enlarged graphs of the square dotted lines shown in (a,b), respectively.
Energies 15 02665 g004
Figure 5. (a) Absorption α(ω); (b) real part of refractive index nr(w); (c) real dielectric constant ε r ω ; and (d) real conductivity σr(w) of samples (A, B, and C).
Energies 15 02665 g005
Publisher’s Note: MDPI stays neutral with regard to jurisdictional claims in published maps and institutional affiliations.

