Article

Solar Technology and District Cooling System in a Hot Climate Regions: Optimal Configuration and Technology Selection

1
Department of Mechanical and Industrial Engineering, College of Engineering, Qatar University, Doha P.O. Box 2713, Qatar
2
Engineering Management and Decision Sciences, College of Science and Engineering, Hamad Bin Khalifa University, Doha P.O. Box 34110, Qatar
*
Author to whom correspondence should be addressed.
Energies 2022, 15(7), 2657; https://doi.org/10.3390/en15072657
Submission received: 15 February 2022 / Revised: 16 March 2022 / Accepted: 22 March 2022 / Published: 5 April 2022
(This article belongs to the Topic District Heating and Cooling Systems)

Abstract

:
With the increasing need for cooling and the concerns for pollution due to fossil fuel-based energy use, renewable energy is considered an add-on to cooling technologies. The climatic condition in the Middle East, analyzed in this paper, provides the potential to integrate solar energy with the cooling system. Due to the availability of various solar energy and cooling technologies, multiple configurations of solar-cooling systems can be considered to satisfy the cooling demand. The research presented in this paper aims to assess and compare these configurations by considering the energy prices and the installation area. The proposed model is formulated in Mixed-Integer Linear Programming and optimizes the holistic system design and operation. The economic, renewable energy use, and environmental performances of the optimal solution for each configuration are analyzed and compared to the base grid-DCS configuration. Results show that the electricity tariff and the available installation area impact the economic competitiveness of the solar energy integration. When electricity tariff is subsided (low), the conventional grid-based DCS is the most competitive. The PV-DCS configuration is economically competitive among the solar assisted cooling systems, and it can contribute to reducing the environmental impact by 58.3%. The PVT-DCS configuration has the lowest operation cost and the highest environmental performance by decreasing the global warming potential by 89.5%. The T-DCS configuration becomes economically competitive only at high electricity tariffs.

1. Introduction

In 2016, the total electricity consumption for the cooling required nearly 10% of the electricity consumed globally. From an environmental perspective, the cooling-related CO2 emissions have tripled since 1990 and reached 1135 MT in 2016; the share of cooling to the total emissions from buildings represents 12% over the same period [1]. In the case of Qatar, the consumption for annual cooling demand is more than 14TWh, and it represents about 36% of the annual electricity consumption [2]. Out of this consumption, more than 50% is required for cooling during the summer season [3]. The district cooling system (DCS) is a centralized plant for the production and circulation of chilled water through a network of insulated pipes laid underground [4]. The system comprises a central plant, including the heat rejection system, pumps, chillers, distribution network, and customer interconnection. These systems provide a cooling load to a range of buildings (residential, commercial, industrial, and office). The investigation of Gang et al. [5] concerning the performance of district cooling systems showed that DCS could save 13% of electricity consumption, and its operation cost is lower by 10% than individual cooling at the building level. In Qatar, the Planning and Statistics Authority (PSA) shows that up to 2018, 41 district cooling plants were in operation, 40 projects were under construction, and 21 projects were being designed using grid-based electricity. The data produced by PSA show that about 16,334,588 MWh of electricity has been saved with the operational district cooling plants compared to the individual cooling system installed in the buildings [6]. This saving contributed to reducing emissions by 7,350,564 (103 tons) of CO2-equivalent per year [6].
To further develop sustainable district cooling systems, renewable energy integration is one of the most promising alternatives [7,8,9,10]. Solar energy is a good candidate for integration in hot regions like the Middle East. In this region, the solar irradiance is abundant during the whole year, easily accessible, and high solar irradiance occurs during the period that requires high cooling demand. Data on solar radiation can be obtained via typical meteorological year data or by using an advanced predictive model [11]. Solar energy is used through photovoltaic, thermal, and hybrid technologies, like cooling technologies such as absorption and vapor compression chillers. Integration of these technologies can provide different configurations (Table 1), which can be analyzed for their suitability for district cooling applications; however, it should be noted that such integrations are also impacted by the energy prices and the area available for installation.
The proposed integrated solar-district cooling system is connected to the electricity grid [12], which allows the exchange of electricity during peak and low solar irradiation periods. The synergy between the generated and consumed energy, respectively, by the solar collector (thermal, electric, or both) and the cooling process (absorption and vapor compression) and the grid connection is considered coherent. The cooling demand is required and varies throughout the day. Similarly, the solar irradiation intensity is not constant. Consequently, the design, components inter-connections, and operational policies should satisfy the cooling demand by adjusting the cooling production. Therefore, there is a need for a systemic optimization approach that leads to an optimal system design and operation. This will allow finding the optimal components selection, including the cooling technologies and operational policies (quantity to be produced and stored during each period) while minimizing the overall costs. The proposed mixed-integer linear programming (MILP) model captures all these aspects and seeks to optimize each configuration design without requiring multi-models to imitate each configuration.
Further discussion in this paper is divided into five sections. In Section 2, the literature review on solar cooling technology is given. Section 3 introduces the problem description and formulation. The experiments and results are given in Section 4. The conclusions, limitations, and future research are given in Section 5.

2. Literature Review

Research on solar-assisted cooling applications has been initiated for more than four decades (after the energy crisis in the 1970s). During the last decade, the number of research on solar energy for cooling applications has doubled due to the increasing need for cooling and the availability of improved solar cooling technologies. The bibliometric analysis on solar cooling technology shows that the most studied systems are solar thermal cooling systems using the thermal collector and thermally activated chiller (mainly absorption), solar combined power/cooling, and photovoltaic (PV) compression chillers [13]. Hybrid technology (photovoltaic-thermal) is also the subject of many types of research [14,15,16,17,18] and its applications [19,20,21]. Most current applications are focused on building-level operations, for example, water heating [22], heating and cooling [23], drying [24], and other applications such as desalination [25] and industrial [26]. The solar heating and cooling program (IEA SHC task 60) [27,28,29,30,31,32] of the International Energy Agency (IEA) also recommends further investigation concerning the use of solar hybrid technology in cooling applications, the interaction of local electricity use versus grid injection. Therefore, there is an increasing interest in solar hybrid technology in the cooling application, but the applications are lacking for district cooling.
The main approach used in studying solar cooling technology is a simulation using the predefined model components in the tool library. The optimization focuses on the process parameter to improve system efficiency for a given design. Abid et al. [33] analyzed and compared the thermodynamics behavior of different absorption cycles (single, double, triple, and quadruple effect), evacuated solar tube collectors, and hybrid nanofluids. They concluded that the collector efficiency is higher when using hybrid nanofluids. Asadi et al. [34] used the thermo-economic analysis to evaluate an integrated 10 kW single-effect ammonia-water absorption chiller with diverse solar collectors. They concluded that integrating the evacuated tube collectors with the chillers can provide an economical solution. Weber et al. [35] studied integrated water ammonia absorption chillers and concentrated solar collectors and the performance of the different control and operation strategies. Bellos and Tzivanidis [36] investigated the performance of a solar cooling system that comprises an absorption chiller and nanofluids using plate collectors; they found that nanofluids improve the thermal efficiency by 2.5%, the exegetic performance by 4%, and increase in refrigeration by 0.84%. The authors have also studied the parametric analysis and the optimization of a combined ejector-absorption chiller and parabolic collector system and concluded that the ejector increases the system COP, and the optimized system can achieve a performance enhancement of more than 60% for the respective evaporating and condenser temperature of 12.5 °C and 30 °C [37]. Shehadi [38] simulated different absorption chiller components for a range temperature to optimize the chiller COP. The author finds that the optimum COP of the system is 0.776 when the evaporator, condenser (and absorber), and generator temperatures, respectively, are equal to 10 °C, 30 °C, and more than 70 °C. Saleh and Mosa [39] optimize the solar absorption chiller in a hot climate by using a flat plate solar collector with a single-effect water-lithium bromide absorption chiller. Results show that a coating of solar collector is necessary to produce the required operating temperature (70–80 °C) of the chiller. The authors show that their system improved the COP beyond 0.8. Iranmanesh and Mehrabian [40] used a genetic algorithm to optimize an integrated double-effect bromide water absorption chiller and evacuated tube collector system. They concluded that the reduction of auxiliary energy could be achieved by optimizing mass flow rates of hot water passing through the generator and collector. Alobaid et al. [41] reviewed the solar-driven absorption cooling with photovoltaic thermal systems. The authors mentioned that the solar absorption chiller saved 50% of primary energy with electrical PVT efficiency in the range 10–35%, the solar-assisted cooling COP in the range 0.1–0.91, the thermal collector efficiency in the range 0.06–0.64. Alghool et al. [42] developed a MILP model to optimize integrated solar-assisted DCS, the optimal solution that provides the design and operational variables of the system.
The literature review shows that the optimization approach is mainly used for the process parameters rather than the holistic system design and operation. The cost is commonly used when optimizing solar cooling technologies, and the hybrid technology application in district cooling is lacking. Additionally, a model that supports decision-makers in assessing and selecting the appropriate configuration among different alternatives (Table 1) in the context of local energy prices and the area available for installation is also lacking.
Understanding modeling, optimizing, and assessing these configurations becomes necessary for decision-makers. Hence, the proposed MILP model optimizes each configuration design, including the component sizing and related technology, the components interconnection, and the operational policies to satisfy the cooling demand during each period. Furthermore, the performance analysis used in this paper is based on sustainable district cooling guidelines (IEA 2019) [43] by analyzing the environmental benefits of alternative energy production systems, which reduces the emission of greenhouse gasses (GHG) and increase the use of renewable energy with continuity and reliability of energy supply. Hence a set of performance indicators are used to assess the system from the economic, renewable energy use, and environmental perspectives as defined in [33].
The research in this paper aims to:
Develop a generalized model to optimize the design and operation of each configuration, and thus without the need for multi-models to imitate each one.
Develop and implement the performance indicators of the system based on the numerical results of the proposed model.
Compare the diverse configurations performances (economic, renewable energy use, and environmental) by considering the local context (energy price and available installation area).

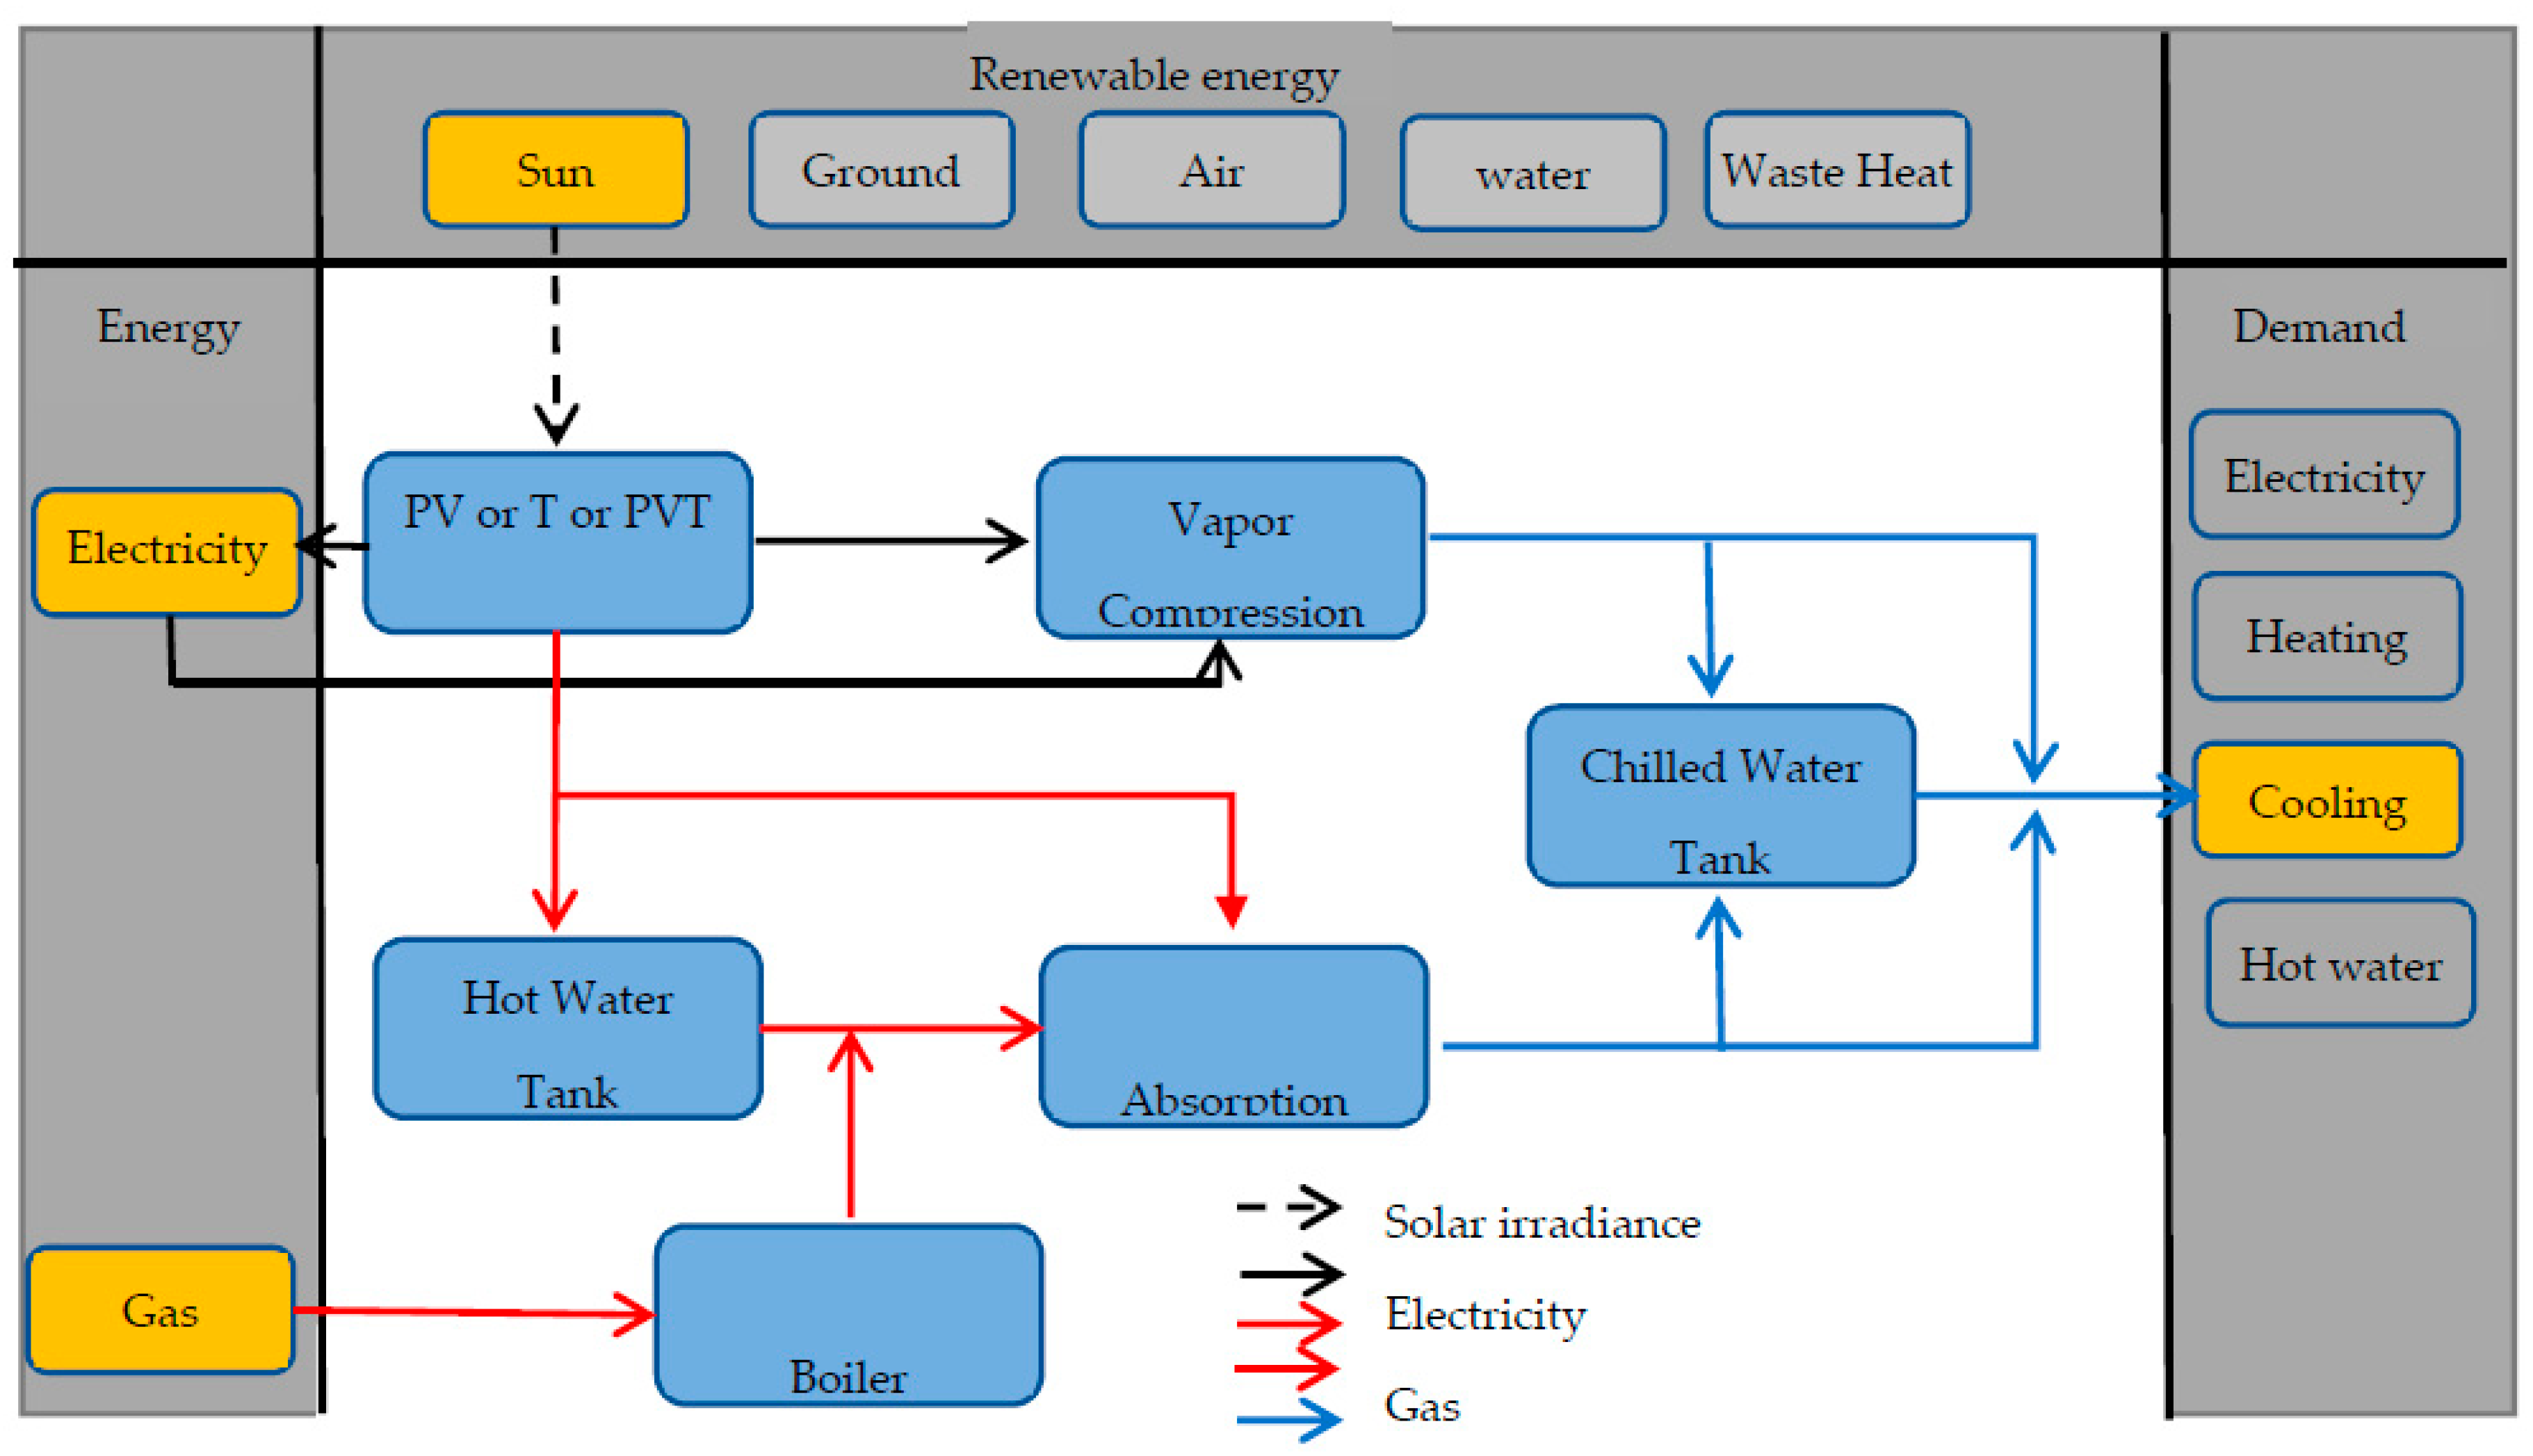
3. Problem Description and Formulation

It is worth noting that The TRNSYS is one of the tools that can be used to simulate the configurations mentioned in this paper once the design is fixed. It can help consolidate the design through specific analysis. However, modeling becomes necessary to optimize the design of each configuration and select the appropriate components, including the technology. Such a step is necessary to compare further the different configurations based on the economic and environmental aspects and perform other analyses such as the effect of the electricity tariff and the reserved installation area.
Figure 1 shows the proposed integrated system diagram. It is composed mainly of (i) solar collector representing a given technology (photovoltaic, thermal, and hybrid), (ii) vapor compression chiller, (iii) absorption chiller, (iv) chilled water storage tank, (v) hot water storage tank, (vi) auxiliary boiler. The system is connected to the electricity grid. It is worth noting that the inclusion of hot water and chilled water thermal energy storage and the auxiliary boiler is not mandatory in the system. However, their inclusion contributes to lowering the total system cost.
Figure 1 also shows the energy flow, hot water, chilled water, gas, and electricity between the different system components. Based on the used collector technology (photovoltaic, thermal, hybrid), the collected solar irradiance is transformed into electricity, hot water, or both. The generated electricity drives the vapor compression chiller. In the case of extra-generation during the peak sunlight, the surplus electricity is sold back to the grid. If the generated electricity by the solar collector is insufficient, the grid feeds the system with the needed electricity. The hot water generated feeds the absorption chiller. The surplus heat generated during the peak irradiance will be stored in a hot water storage tank to be used by the absorption chiller during limited irradiance periods. Suppose the generated hot water by the solar collector plus the inventory level of the hot water storage tank is insufficient to run the absorption chiller, or the hot water temperature is under the operating temperature of the absorption chiller (80 °C). In that case, the auxiliary boiler is activated to provide the requested amount of heat. The chilled water produced by the vapor-compression and absorption chillers feeds the building to satisfy the cooling demand. Extra chilled water is produced and stored in the chilled water storage tank during peak irradiance.
The integration of these components forms an interconnected system with intertwined behaviors. The proposed model captures all these interdependencies and provides an optimal solution based on an approximated annual hourly cooling demand and solar irradiance (8760 h).

3.1. Problem Formulation

The proposed model assumes that the cooling load is deterministic, the solar collector efficiency is constant, the system operates in a steady-state, and the cool-losses are negligible. The efficiencies of the auxiliary boiler, vapor compression, and absorption chiller are assumed as constant. It is worth noting that chiller performance depends on the parameters such as the partial load ratio and the weather conditions. Integrating these aspects in the model requires additional decision variables and constraints. Such an addition increases problem complexity in terms of total numbers of binary variables, non-integers variables, and constraints, making it unlikely that the real life-size problem of the solar energy-DCS integrated system could be optimally solved. Therefore, the developed model is based on a trade-off between the model breadth (number of components, operational decisions, and time horizon length) and model depth (degree of fidelity of component model in terms of efficiency) that aims at providing a solution in a reasonable computational time. Hence, it can support decision-makers to ensure the feasibility of such an integrated system and select the appropriate configuration in the context of energy prices and available installation areas for the solar collector. The detailed proposed model nomenclature is given below.
Figure 2 shows the organization of the proposed model is similar to [44]. The model is fed with solar irradiance, cooling demand, energy tariff, and component attributes (capacity, cost, efficiency). The core of the optimization process is composed of the structure and the behavior. The structure refers to the design, including the definition block (components) and internal block reflecting the interconnection between the components (Figure 1). The behavior (operation) refers to the system activities related to energy (E, G, H, C) production, consumption, and storage (CI, HI). The model’s output is the optimal design and operation that minimizes the objective function, which represents the configuration’s economic performance. The renewable energy use and environmental performance are obtained after the post-treatment of the numerical value of the optimal solution for each configuration.
The optimal design seeks to find the required components and their interactions. Each component is presented by a design variable (binary or non-integer). For example, if the vapor compression chiller (i) is selected, the related design variable ( y i ) takes the value one and zero otherwise, which is similar for the absorption chiller ( z j ), hot water tank ( u k ), chiller water tank ( v m ), and the auxiliary boiler ( w n ). However, the design variable (x) represents the area to be installed for solar collector technology. If the variable (x > 0), the considered configuration (1 or 2 or 3) is economically competitive than the base configuration (grid-DCS). Otherwise, when (x = 0), the base configuration is optimal.
The optimal operation seeks to find the quantity of chilled water (C), hot water (H), and electricity (E) to be produced, consumed, and stored (CI, HI) for each period to satisfy the cooling demand. It is worth noting that every component has attributes (constant parameters in the proposed model) such as capacity, efficiency, and costs (acquisition and maintenance). Some of these parameters are used in the model constraints to define the feasible region. Others (cost parameters) are used in the objective function to evaluate the solution’s fitness.
The objective function (Equation (1)) minimizes the total annualized cost and includes three terms: the first term is for the capital cost for all implemented equipment; the second term is the operating cost of the running equipment (boiler and vapor compression chiller) that is required energy from outside the system, and the third term is for the maintenance cost.
Minimize   C t o t a l = C i n v + C o p r + C m a
The investment cost (Equation (2)) includes all installed equipment (solar collector, vapor compression chiller, absorption chiller, hot water storage tank, chilled water storage tank, and auxiliary boiler) [45]. The annualized investment cost is obtained by summing the product of each selected equipment’s fixed cost ( F c ) by its amount to be installed and the capital recovery factor ( C R F   =   r ( 1 + r ) n ( 1 + r ) n 1 ). The area to be installed for the solar collector (thermal, photovoltaic, or hybrid) is represented by the variable (x). For the remaining, each piece of equipment is represented by its design binary variable ( y ,   z ,   u ,   v ,   w ). Each technology is represented by a set of elements and identified by its index in the summation (Equation (2)). For example, index (i) represents various vapor compression chillers candidates, and each one is characterized by its attributes such as capacity, acquisition and maintenance costs, and efficiency.
c i n v = ( C R F ) ( F c C o l x + i F c i V c y i + j F c j A b z j + k F c k H w t u k + m F c m C w t v m + n F c n B o w n )
The operating cost (Equation (3)) represents the yearly (8760 h) sum of the running cost for all implemented equipment in the district cooling and requiring energy from outside the system, which are the boiler and the vapor compression chiller [46]. The first term in Equation (3) is the cost for running the auxiliary boiler. It is equal to the product of the gas price ( P G a s ) and the amount of gas consumed by the boiler ( G B o ). The second term in Equation (3) represents the cost related to the net electricity of the system. The net electricity cost is equal to the product of the electricity cost ( P E l e c ) and the difference between the amount of electricity purchased ( E G r i d V c ) and sold to the grid ( E C o l G r i d ). If the purchase and selling costs are different, the feed-in tariff coefficient ( α ) is used as a correction factor. If the solar panel electricity yield is more than the need of the electric chiller, the extra generated electricity is sold to the grid and will be counted as an income. Consequently, the overall system cost will be decreased. Contrary, if the solar collector-generated electricity is insufficient, the system will purchase electricity from the grid, and the overall system cost increases.
C o p r = t   P G a s G t B o + t     P E l e c ( E t G r i d V c α . E t C o l G r i d )
The annual maintenance cost equals the sum of the annual cost of maintaining all the system components. The maintenance cost of each element is equal to the product of its maintenance cost ( F m ) and the installed amount. The installed amount for the vapor compression, absorption chiller, hot and chilled water tanks, and the auxiliary boiler is equal to its design binary variable ( y ,   z , u , v , w ). For the solar panel is equal to the installed area ( x ).
c m a = F m C o l x + i F m i V c y i + j F m j A b z j + k F m k H w t u k + m F m m C w t v m + n F m n B o w n
The constraints for the model are classified into three blocks. The definition block describes the system in terms of structure (components). The internal block describes the system layout or components interconnection and translates the energy balance. The activities block describes the system’s elements behavior in terms of consumed, generated, and stored energy.

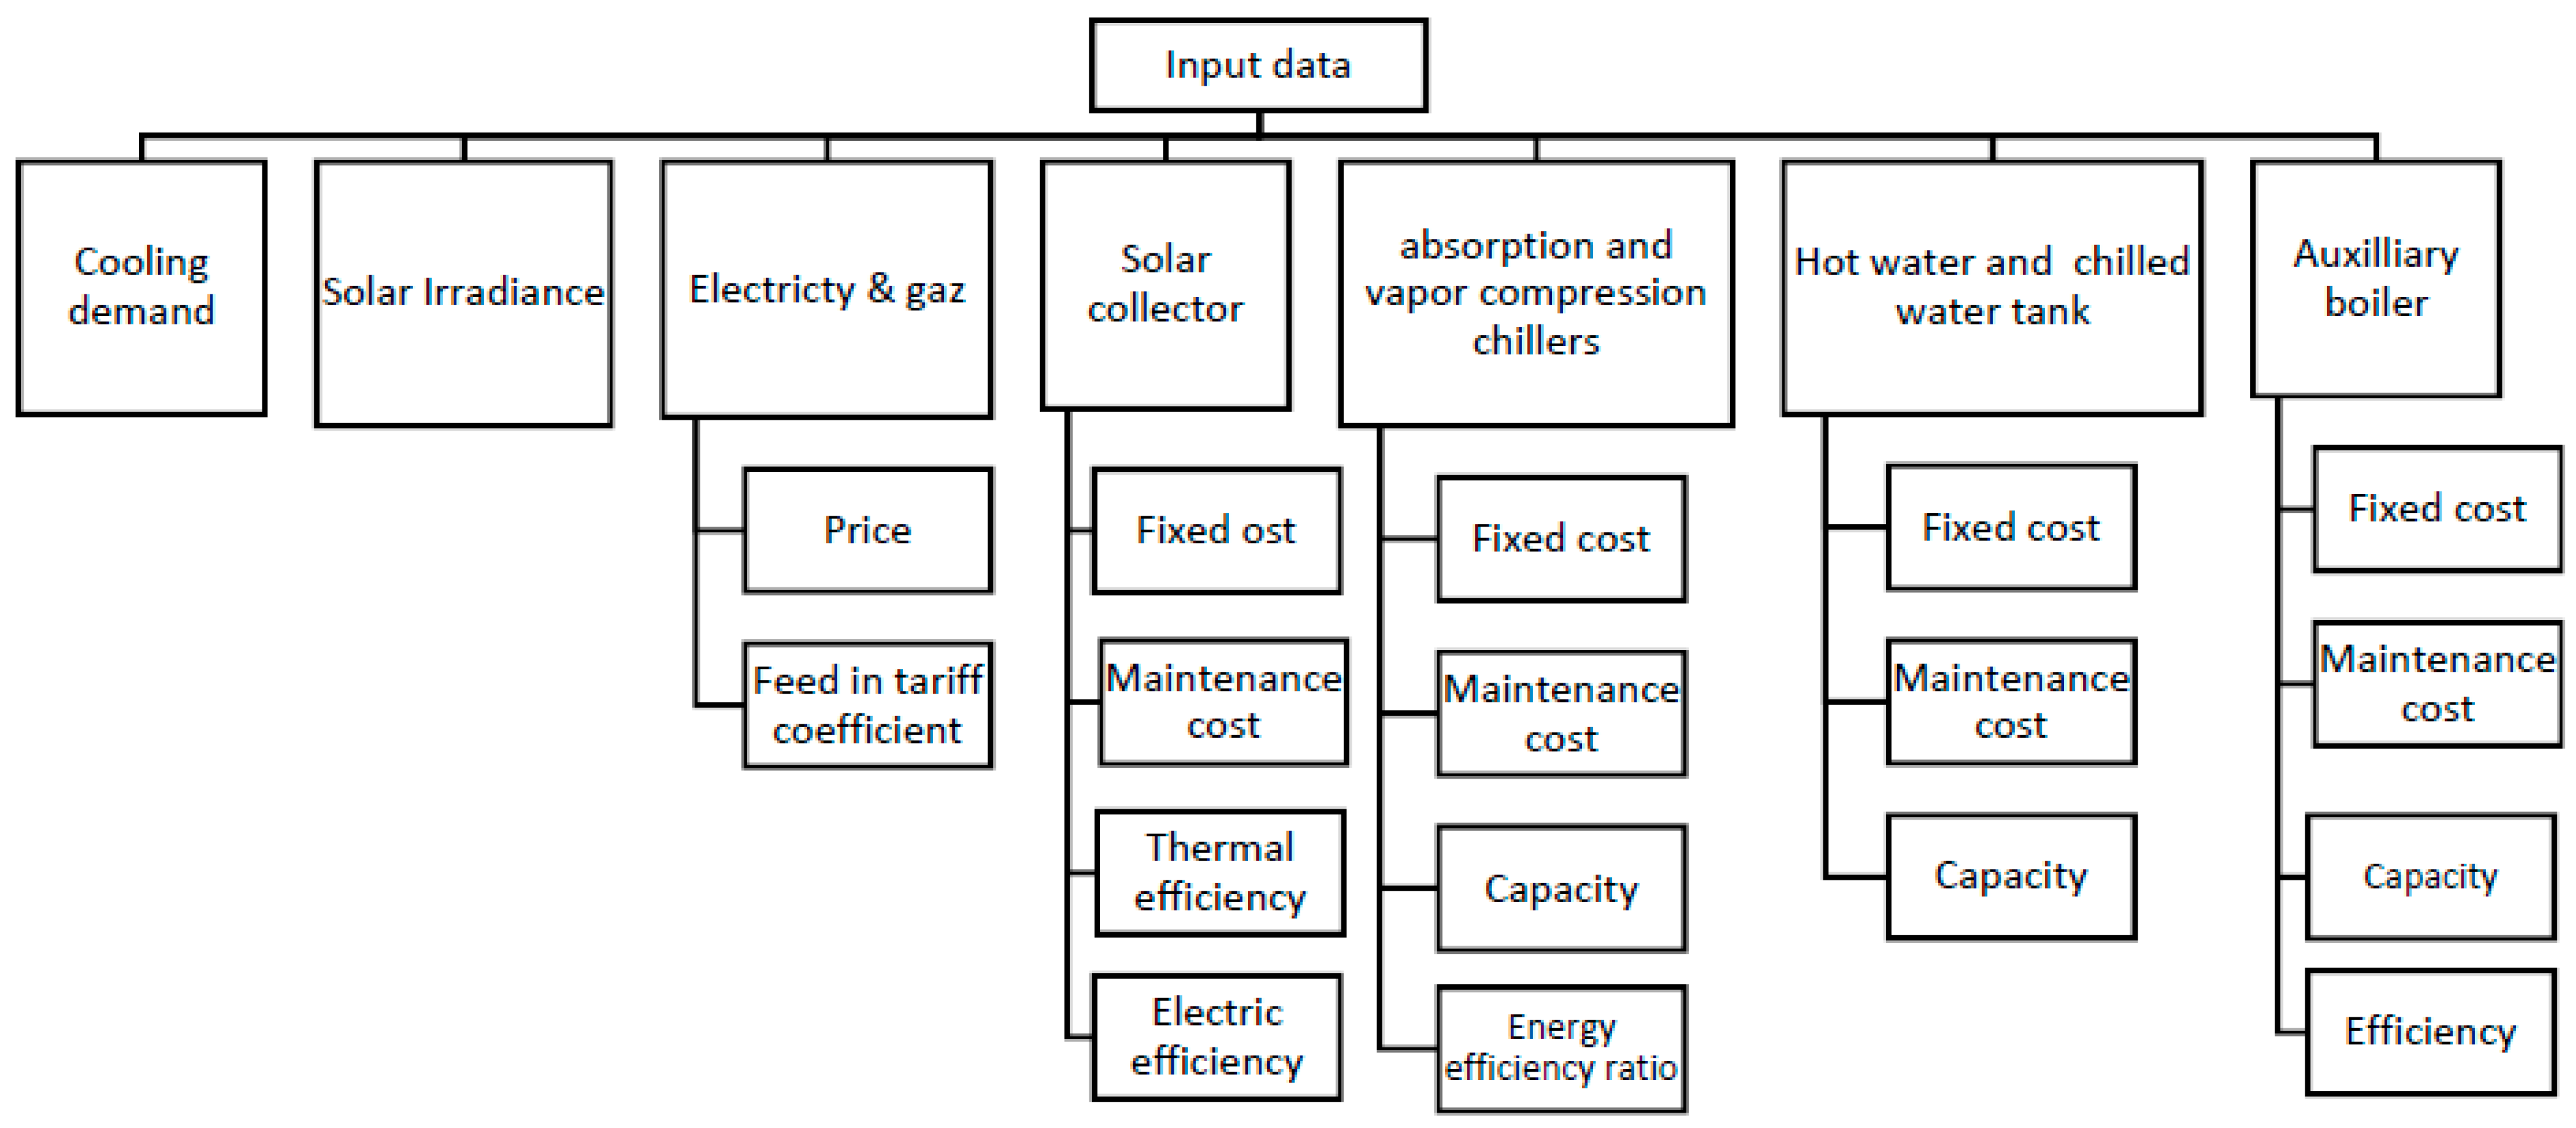
3.1.1. Definition Block

Constraints (5)–(9) define the system structure in terms of components. Six components are integrated into the proposed system: solar collector, vapor compression chiller, absorption chiller, hot water storage tank, chilled water storage tank, and auxiliary boiler.
x A
Constraint (5) ensures that the total installed area of the solar collector does not exceed the available area (A). The available area for installing solar collectors depends on the building type. In the urban region, government institutions like universities and hospitals cover a great area and generally have more available space than commercial and residential buildings.
i y i + j z j 1
Constraint (6) ensures that two technologies of the chilling process (vapor compression and absorption) are a candidate to produce the chilled water to satisfy the cooling demand, and at least one technology should be selected. Therefore, the system structure may contain an absorption chiller, electric chiller, or both.
k u k 1
m v m 1
n w n 1
Constraints (7)–(9) ensure that selecting the hot water storage tank, chilled water storage tank, and the auxiliary boiler is optional. Their selection contributes to decreasing the total cost.

3.1.2. Internal Block

The constraints (10)–(18) describe the interconnection between the system components (the system layout). Hence, they describe the energy balance (arrow in Figure 1).
H t C o l = H t C o l H w t + H t C o l A b
E t C o l = E t C o l G r i d + E t C o l V c
Constraint (10) imposes the solar collector ( C o l ) thermal energy balance (H). It shows that the hot water produced (H) by the solar collector (col) is delivered to the hot water storage tank ( C o l H w t ) and the absorption chiller ( C o l A b ). Constraint (11) imposes the electric energy balance ( E ) for the solar collector ( C o l ), ensuring that the produced electricity ( E ) equals the amount delivered to the grid ( C o l G r i d ) and vapor compression chiller ( C o l V c ).
H t C o l H w t + H I ( t 1 ) H w t = H t H w t A b + H I ( t ) H w t
Constraint (12) imposes the energy balance for the hot water storage tank ( H w t ). It imposes that the sum of hot water received from the solar collector ( C o l H w t ) and the inventory level ( H I ) at the period (t − 1) equals the sum delivered to the absorption chiller ( H w t A b ) and the inventory level ( H I ) at the period t.
C t V c C w t + C t A b C w t + C I ( t 1 ) C w t = C t C w t B l d + C I t C w t
Like constraints (12) and (13) imposes the energy balance for the chilled water storage tank ( C w t ). It imposes that the sum of chilled water ( C ) received from the absorption ( A b C w t ) and vapor compression chillers ( V c C w t ) plus the inventory level ( C I ) at the period (t − 1) equals the amount delivered to the building ( C w t B l d ) plus the inventory level ( C I ) at the period t.
H t A b = H t C o l A b + H t H w t A b + H t B o A b
C t A b = C t A b B l d + C t A b C w t
Constraints (14) and (15) represent the absorption chiller’s ( A b ) hot water ( H ) and chilled water ( C ) balances. The left-hand side of constraint (14) reflects the needed hot water to operate the absorption chiller as the sum of hot water provided by the solar collector ( C o l A b ), the hot water storage tank ( H w t A b ), and the auxiliary boiler ( B o A b ). However, constraint (15) defines that the produced chilled water by the absorption chiller equals the quantity delivered to the building ( b B l d ) and the chilled water storage tank ( A b C w t ).
E t V c = E t C o l V c + E t G r i d V c
C t V c = C t V c B l d + C t V c C w t
Constraints (16) and (17) impose the vapor compression chiller’s ( V c ) electricity ( E ) and chilled water ( C ) balances. The left-hand side of constraint (16) reflects the needed electricity to operate the vapor compression chiller, and the right-hand side represents the electricity delivered from the solar collector ( C o l V c ) and the grid ( G r i d V c ). Constraint (17) represents the balance of chilled water ( C ); the chilled water produced equals the amount delivered to the building ( V c B l d ) and the chilled water storage tank ( V c C w t ).
C t V c B l d + C t A b B l d + C t C w t B l d = d t
Constraint (18) imposes the thermal energy balance (C) for the building cooling demand satisfaction ( d ). It enforces that the cooling demand is assumed by the amount of chilled water delivered from the vapor compression chiller ( V c B l d ), the absorption chiller ( A b B l d ), and the chilled water storage tank ( C w t B l d ).

3.1.3. Activities Block

The constraints (19)–(28) describe the behavior of each system-components in terms of activities, which are energy generation (electricity (E), cooling (C), heat (H)), consumption (electricity and heat), and storage (chilled (CI) and hot water (HI)).
E t C o l S t   x   η e l e c C o l
H t C o l S t   x   η t h e r C o l
Constraints (19) and (20) ensure that the amount of electricity ( E ) and the amount of hot water ( H ) produced by the solar collector (Col) do not exceed the capacity of the installed area (x). The solar irradiance, electric and thermal efficiency of the solar collector are respectively S, η e l e c , and η t h e r .
H I t H w t k Q k H w t u k
C I t C w t m Q m C w t v m
Constraints (21)–(22) ensure that the inventory level of hot water ( H I ) and chilled water ( C I ) does not exceed respectively, the installed capacity ( Q ) of the hot water tank (Hwt) and chilled water tank (Cwt).
H t B o A b n Q n B o w n  
H t B o A b = n w n G ( n , t ) B o   η n B o
Constraint (23) ensures that heat production ( H ) of the auxiliary boiler (Bo) does not exceed its installed capacity ( Q ). Constraint (24) ensures that the relationship between the heat generated ( H ) and the required amount of gas ( G ) in the boiler can be expressed as a linear expression using the efficiency ( η B o ). The efficiency is considered constant during heat production.
C t A b j Q j A b z j
C t A b = j z j H ( j , t ) A b   E E R j A b
Constraint (25) ensures that the amount of chilled water ( C ) produced by the installed absorption chiller (Ab) does not exceed the chiller capacity ( Q ). Constraint (26) expresses the linear relationship between the cooling energy and the required heat in the absorption chiller by using the energy efficiency ratio (EER) which is considered as a constant.
C t V c j Q i V c y i
C t V c = i y i E ( i , t ) V c E E R i V c
Similar to constraints (25)–(27) ensures that the amount of chilled water ( C ) produced by the installed vapor compression chiller (Vc) does not exceed the chiller capacity ( Q ). The energy efficiency ratio (EER) of the vapor compression chiller defines the linear relationship between the cooling energy ( C ) produced and the required electricity ( E ).
Linearization:
The right-hand side of constraints (24), (26) and (28) contain a product of binary and non-integers variables w n G ( n , t ) B o , z j   H ( j , t ) A b , and y i   E ( i , t ) V c , which can be linearized by performing a variable change and using the BigM method [42].

3.1.4. Assessment Indicators

The performance indicators for integrated solar systems and their definition are introduced in SHC Task60\Report D1 [24]. They are classified into three sub-categories: economic, energy, and environmental. These indicators allow the assessment of the system over a certain period. The numerical results obtained from the proposed model allow the calculation of these indicators and the assessment of configurations over one running year (8760 h).
Economic indicators:
The model objective function represents the economic indicator and includes the annualized capital, operational, and maintenance costs.
Energy indicators:
The energy indicators assess the system based on renewable energy use and saving.
-
The solar electrical fraction is expressed as the ratio of the yield of electricity and electric chiller consumption: f P V T , e l e c = t E t C o l t E t V c .
-
The solar thermal fraction is expressed as the yield heat and the absorption chiller consumption: f P V T , t h e r = t H t C o l t H t A b .
-
The renewable energy fraction is expressed as the ratio of the sum of the heat and electricity yield and the sum of absorption and electric chillers consumption: f r e n = t ( E t C o l + H t C o l ) t ( E t V c + H t A b ) .
-
The system’s final energy saving for gas is expressed as the ratio of the heat yield and the efficiency of the selected boiler. If the optimal system design does not include boiler, an efficiency reference of 0.85 is considered:   F E s a v , g a s s y s = t H t C o l η B o .
-
The system’s final energy-saving for electricity equals the electricity yield:   F E s a v , e l e c s y s = t E t C o l .
Environment indicators:
The environmental indicators assess the system based on the non-renewable use and its impact on global warming.
-
The non-renewable primary energy consumption (kWh oil-equivalents) is expressed as the sum of the primary energy of the gas and net electricity consumption. The primary energy consumption for gas is equal to the product of the quantity consumed and its cumulated energy demand (CED = 1.06). The primary energy consumption for electricity is equal to the product of the net quantity consumed and the cumulated energy demand for electricity (CED = 2.89) P E s y s = t C E D G a s   G t B o + t   C E D E l e c ( E t G r i d V c E t C o l G r i d   ) .
-
The global warming potential (Kg CO2-equivalents) is expressed as the sum of the global warming potential for each nonrenewable energy consumed. Similar to the calculation of the P E s y s in the G W P s y s , the CED is replaced by the GWP factor for each type of non-renewable energy. ( G W P G a s = 0.228   and G W P E l e c   =   0.524 ). G W P s y s = t G W P G a s G t B o + t   G W P E l e c   ( E t G r i d V c E t C o l G r i d   ) .

4. Numerical Results

The proposed MILP model is coded and implemented using AIMMS 4.82.6.10 software, solved with CPLEX 20.1 branch and bound algorithm on Intel(R) Core(TM) i7-1165G7 [email protected] GHz with 48 GB RAM. The MILP model is generalized to represent four system configurations: each configuration represents an integrated energy source for DCS. The model parameters setting of the solar collector efficiency η t h e r   and η e l e c allow the selection of the desired system. Therefore, the proposed model imitates integrating all solar technology with a district cooling system in addition to the grid-powered DCS without the need for multi-models. Table 2 illustrates the setting parameters for each configuration. For example, to optimize configuration (2), which represents a photovoltaic integrated district cooling system, the thermal efficiency parameter of the model should be set to zero. Similarly, to optimize the base configuration (Grid-DCS), the thermal and electric efficiency should be set to zero.
The optimal selection of the cooling technology is performed (i) via the presence of constraint (5), where both technologies (absorption and electric chillers) are a candidate for the system design without forcing a specific one, (ii) the objective function, which includes the investment, maintenance, and operation costs. This latter considers the energy costs (electricity and gas) for running the system. It is worth noting that the integrated system is connected to the grid, and both cooling technologies are the candidates. Therefore, the optimal solution of configurations 1, 2, and 3 may lead to configuration 4, which refers to us as the base system (Grid-DCS), which means that the integration of the solar technology is not competitive compared to the Grid-DCS.
Figure 3 summarizes the structure of the data used in the model. The solar collector cost and efficiency are collected from IEA. SHC TASK 60 report [47] and solar collector providers. The remaining system components (absorption chiller, vapor compression chiller, hot water, chiller water TES, and auxiliary boiler) data such as capacity, fixed cost, coefficient of performance, and the cooling load estimation are taken from the data paper [48]. The electricity cost is collected from the energy provider KAHRAMAA [49]. The electricity tariff in Qatar is subsidized, and there is a plan to remove these subsidies by employing the time of use or dynamic pricing schemes [3]. Currently, the electricity price ( P E l e c ) depends on the customer category (productive farms, residential, industrial, hotel, commercial, and government). The average tariff is $0.055 /kWh, and the feed-in-tariff coefficient (α) is set to one. The gas cost fluctuates over time; therefore, an average tariff of $0.017 kWh is considered [50]. The life span (n) considered of the study system is 25 years, and the interest rate (r) is 6%. The maximum allowed area (A) for the solar collector installation is set to 6000 m2. The solar irradiance represents the typical meteorological year 2016 (TMY) of Doha/Qatar. The peak cooling load considered is 10,000 kW. The objective function is obtained by running the system for one year, equivalent to an 8760 hourly period.
Table 3 details the solar collector used parameters values. The detailed characteristics of chillers, storage tanks, and auxiliary data can be found in [42]. The set size column in Table 3 represents the number of elements for each set.
In research, hybrid solar technology (PVT) is less investigated in district cooling applications than the others. Therefore, configuration (1) detailed optimal solution is presented for illustration in the following section.

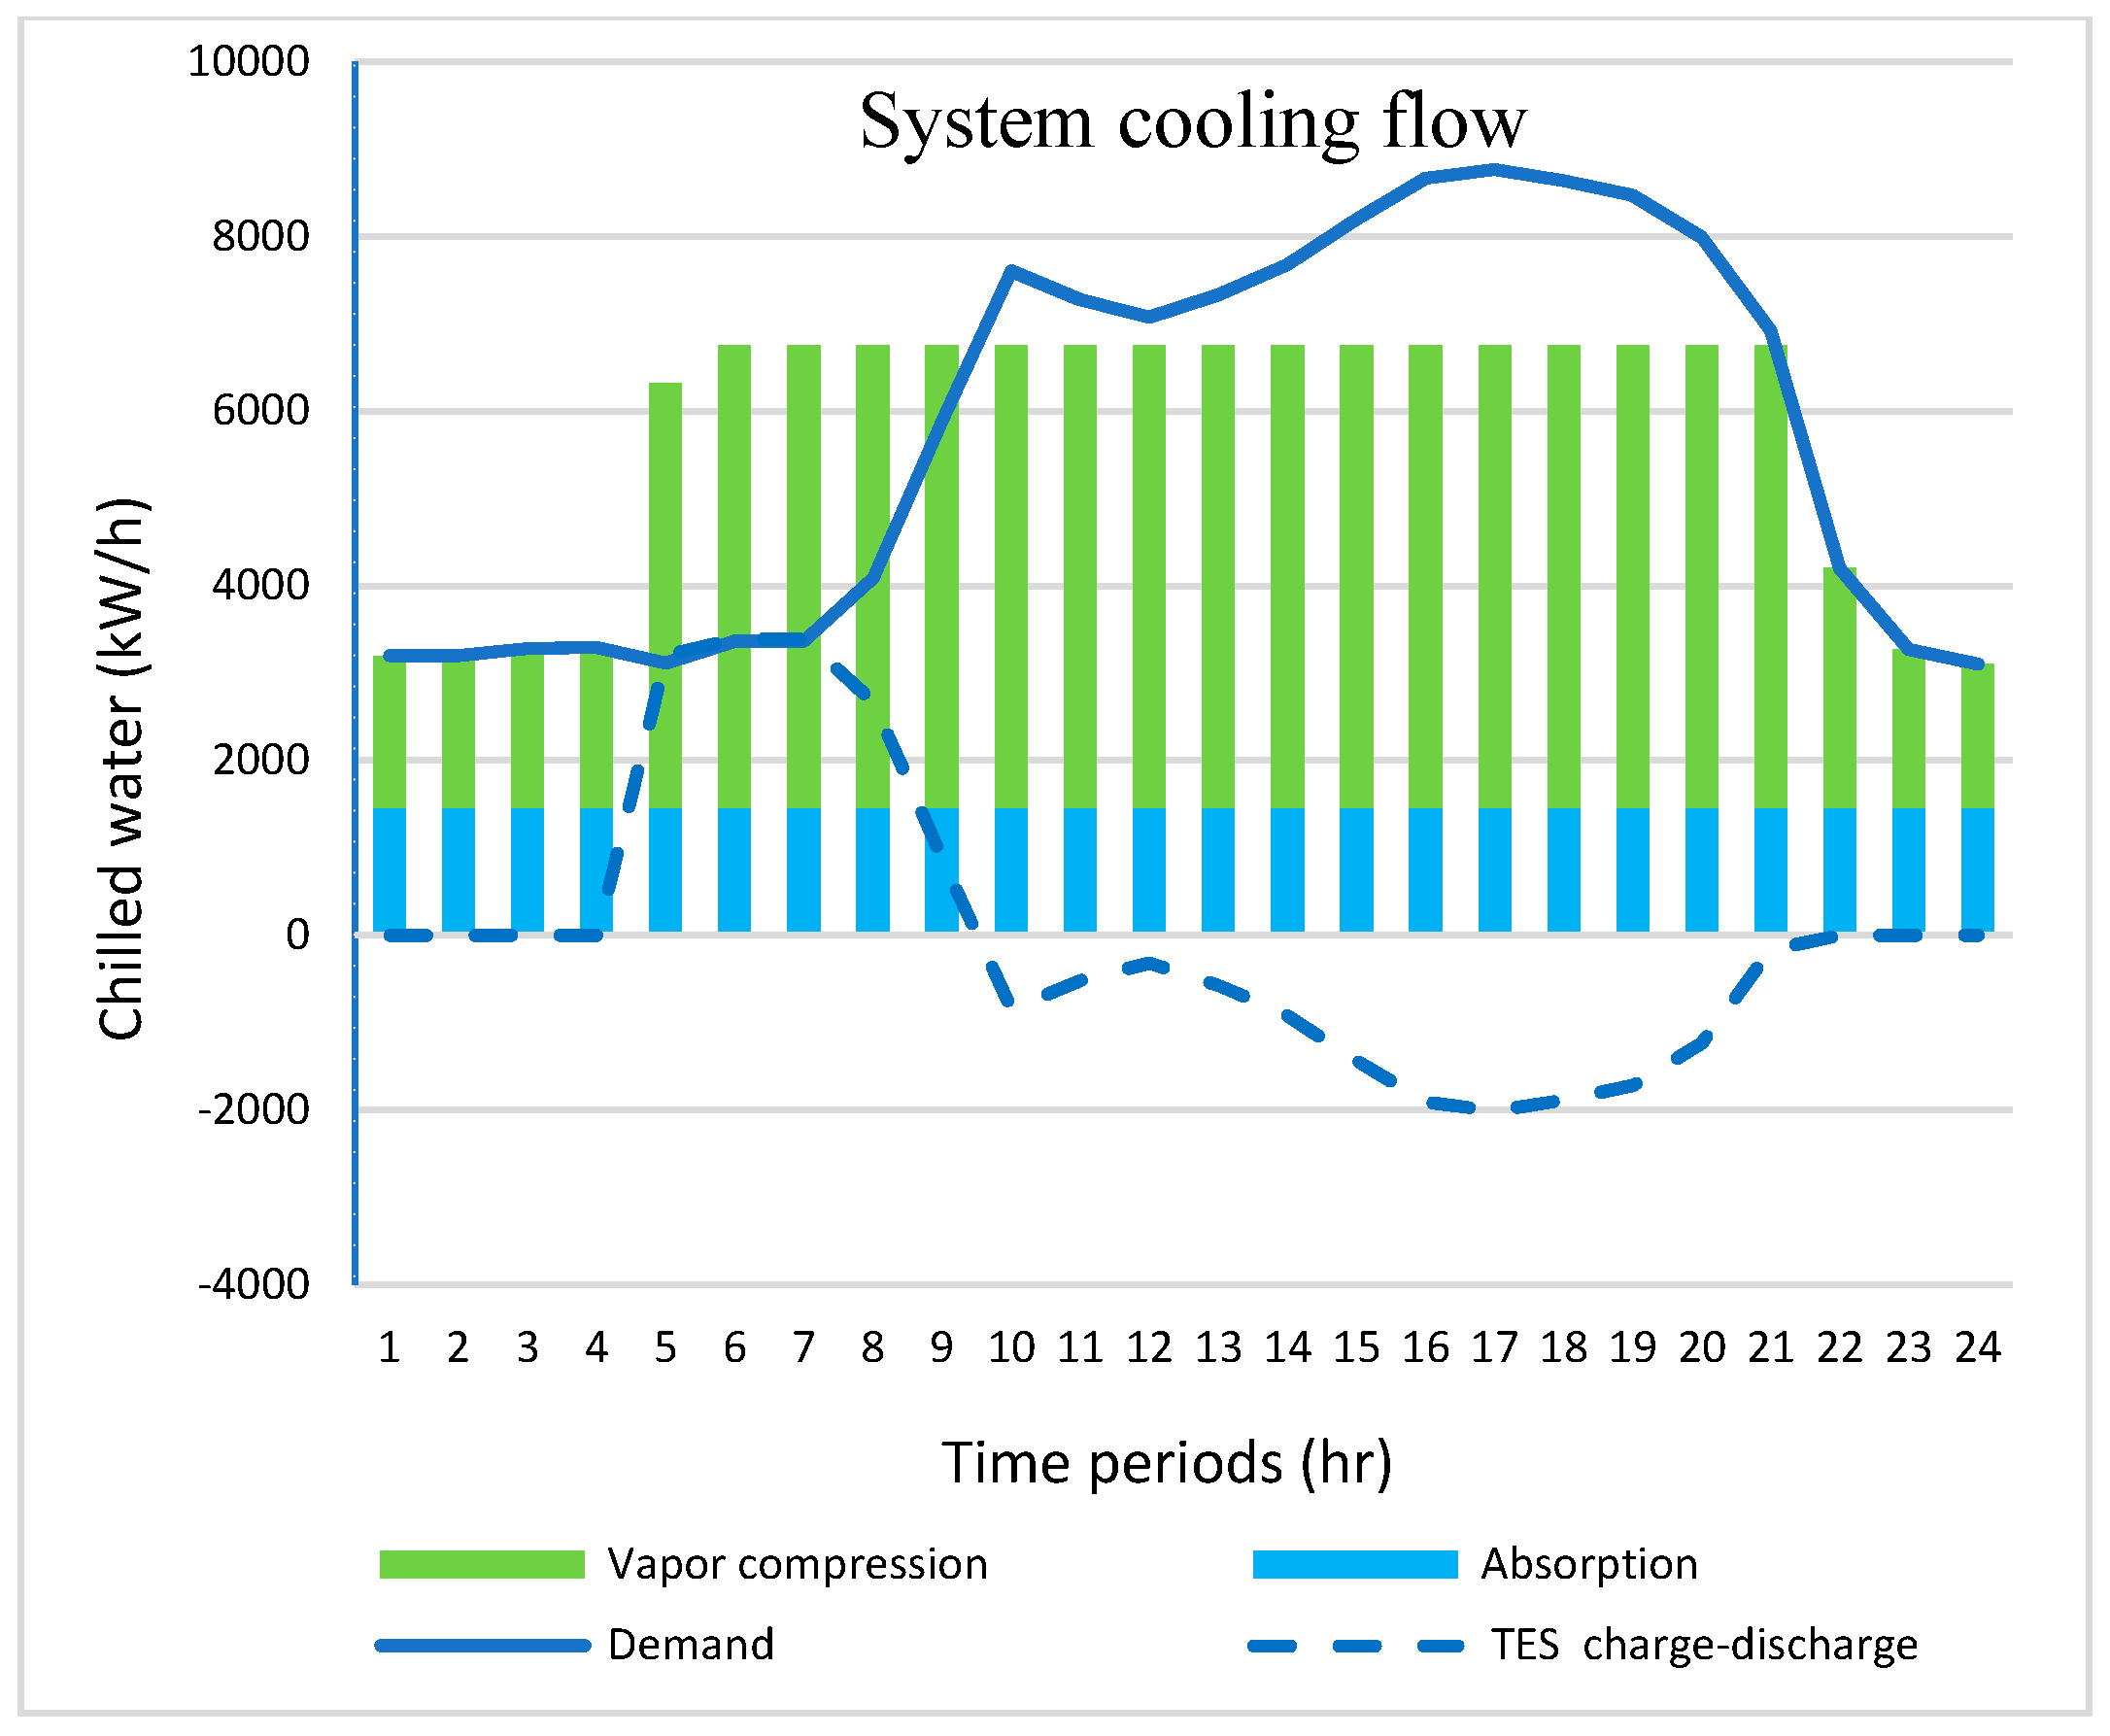
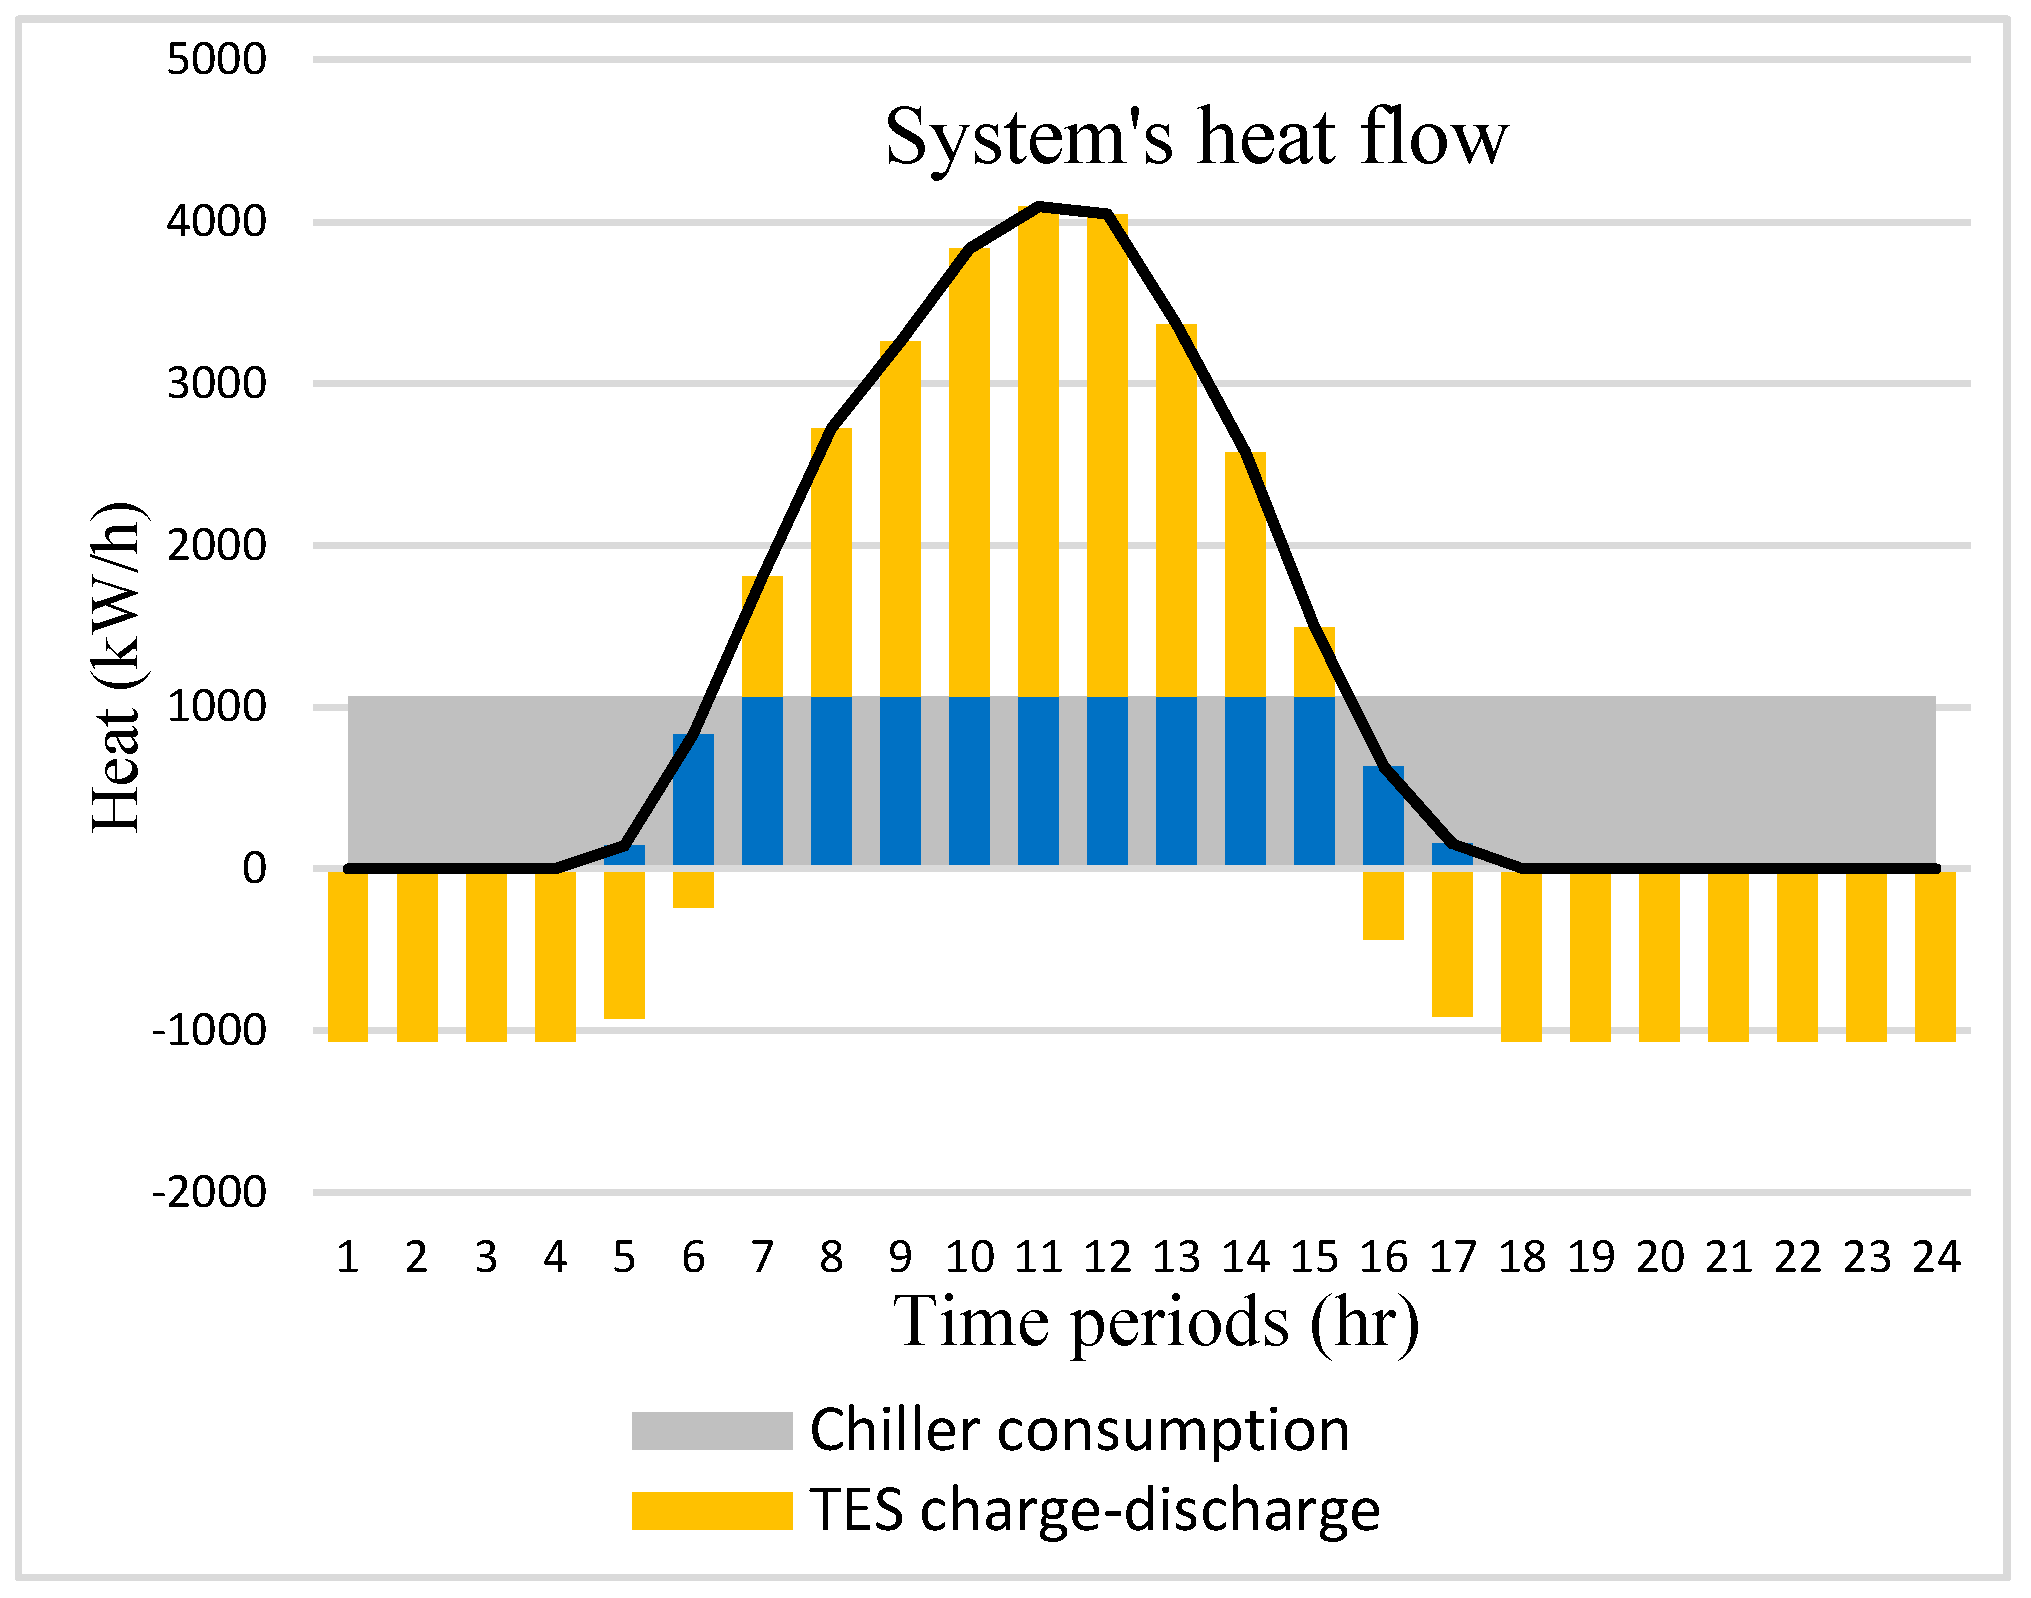
4.1. Integration of Hybrid Solar Collector and DCS

Figure 4 shows the cooling load and the solar irradiance patterns for a typical summer day. The cooling demand is over the whole day with an important load from 11 AM to 10 PM. The solar irradiance is present from 6 AM to 6 PM, with a peak at 1 PM. The storage becomes essential to profit from extra energy (hot water and electricity) during the peak irradiance. The connection to the grid allows for selling the surplus generated electricity and purchasing when needed.
The optimal design of the integrated system is analyzed in terms of design, cost, electricity flow, heat flow, and cooling flow. The detailed energy and environmental characteristics of the system are calculated based on the numerical results of the model. The implementation of these indicators allowed us to further compare the different configurations from an energy and environmental perspective.
Table 4 shows the optimal design for the configuration (1). The optimal installed area is equal to the maximum allowed (6000 m2). Both cooling technologies (vapor compression and absorption) are selected, with capacities of 5300 and 1454 kW. Two storage tanks for hot and chilled water are selected with the same capacity of 63,000 kW. However, the auxiliary boiler is not selected in the optimal design. The investment and maintenance cost of configuration (1) is higher by 416% compared to the base configuration. However, the total cost is lower by 5.25%. This is due to the low operation cost (129,363$) in comparison with the base configuration (321,286$), which is equivalent to decreasing the energy bill by more than 59%.
Figure 5 shows the system electricity flow. The generated electricity feeds the electric chiller during the daytime, and the excess is transmitted to the grid. During the absence of solar irradiance, the grid supplies the chiller. The installed area covers 45.07% of the annual DCS electricity consumption. The annual generated electricity equals 1,930,012 kWh, which is considered energy saved.
Figure 6 shows the system heat flow. The generated solar heat feeds the absorption chiller during the peak solar irradiance. The excess heat is stored in the hot water tank; during the absence of solar irradiance, the stored hot water operates the absorption chiller. In contrast to electricity, the heat generated covers 100% of the absorption chiller need and saves the equivalent of 9,055,221 kWh of natural gas. Considering the electricity and the heat generated, renewable energy covers 80.36% of the total energy to operate the district cooling. The yearly primary energy consumption and the global warming potential are 6,797,412 kWh oil-equivalent and 1,232,472 kg CO2-equivalent, which contributes to decreasing the environmental impact of the Grid-DCS configuration by 59.74% (Table 5).
Figure 7 shows the system cooling flow. Absorption and electric chiller contribute to satisfying the cooling load demand. The absorption chiller is running all day hours with its total capacity. However, the electric chiller production is adjusted to supply the complement. The surplus production during the morning hours (5 a.m. to 9 a.m.) is stored in the chilled water tank and used during the peak hours (Figure 7). The absorption chiller ensures 21.15% of the annual cooling demand, and the electric chiller production supplies the remaining amount. Table 5 summarizes the performance of configuration 1 and the base configuration.

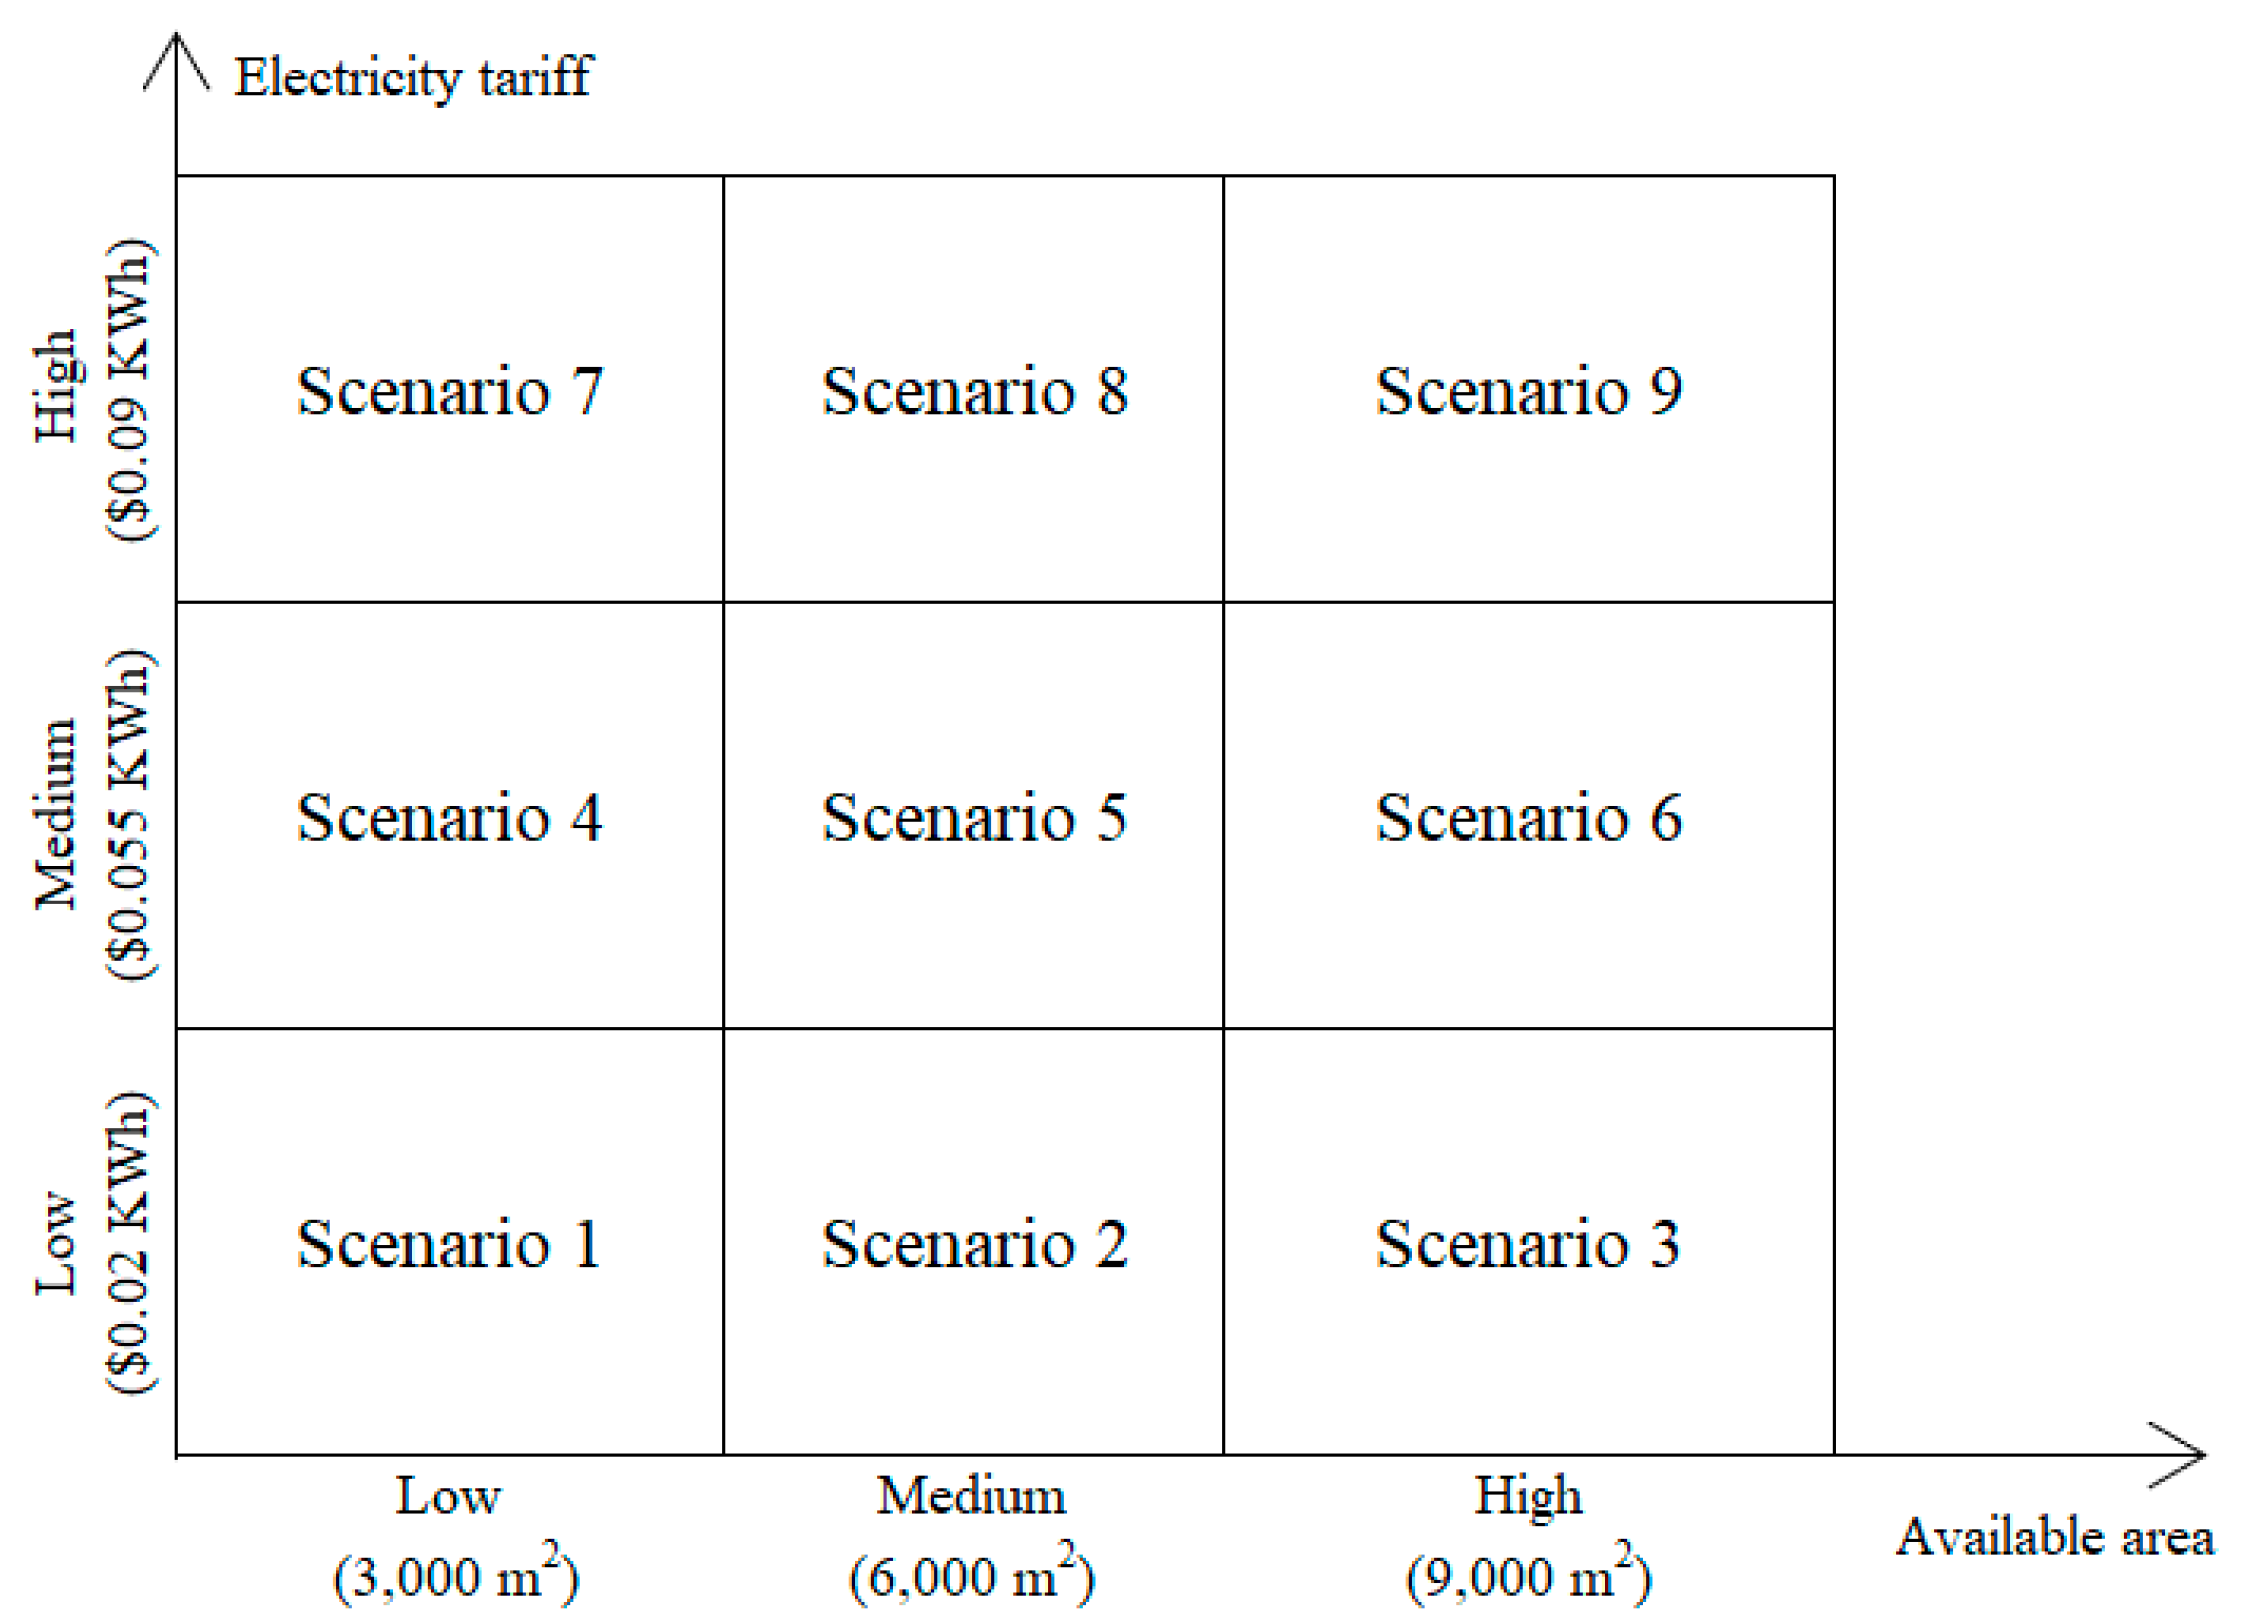
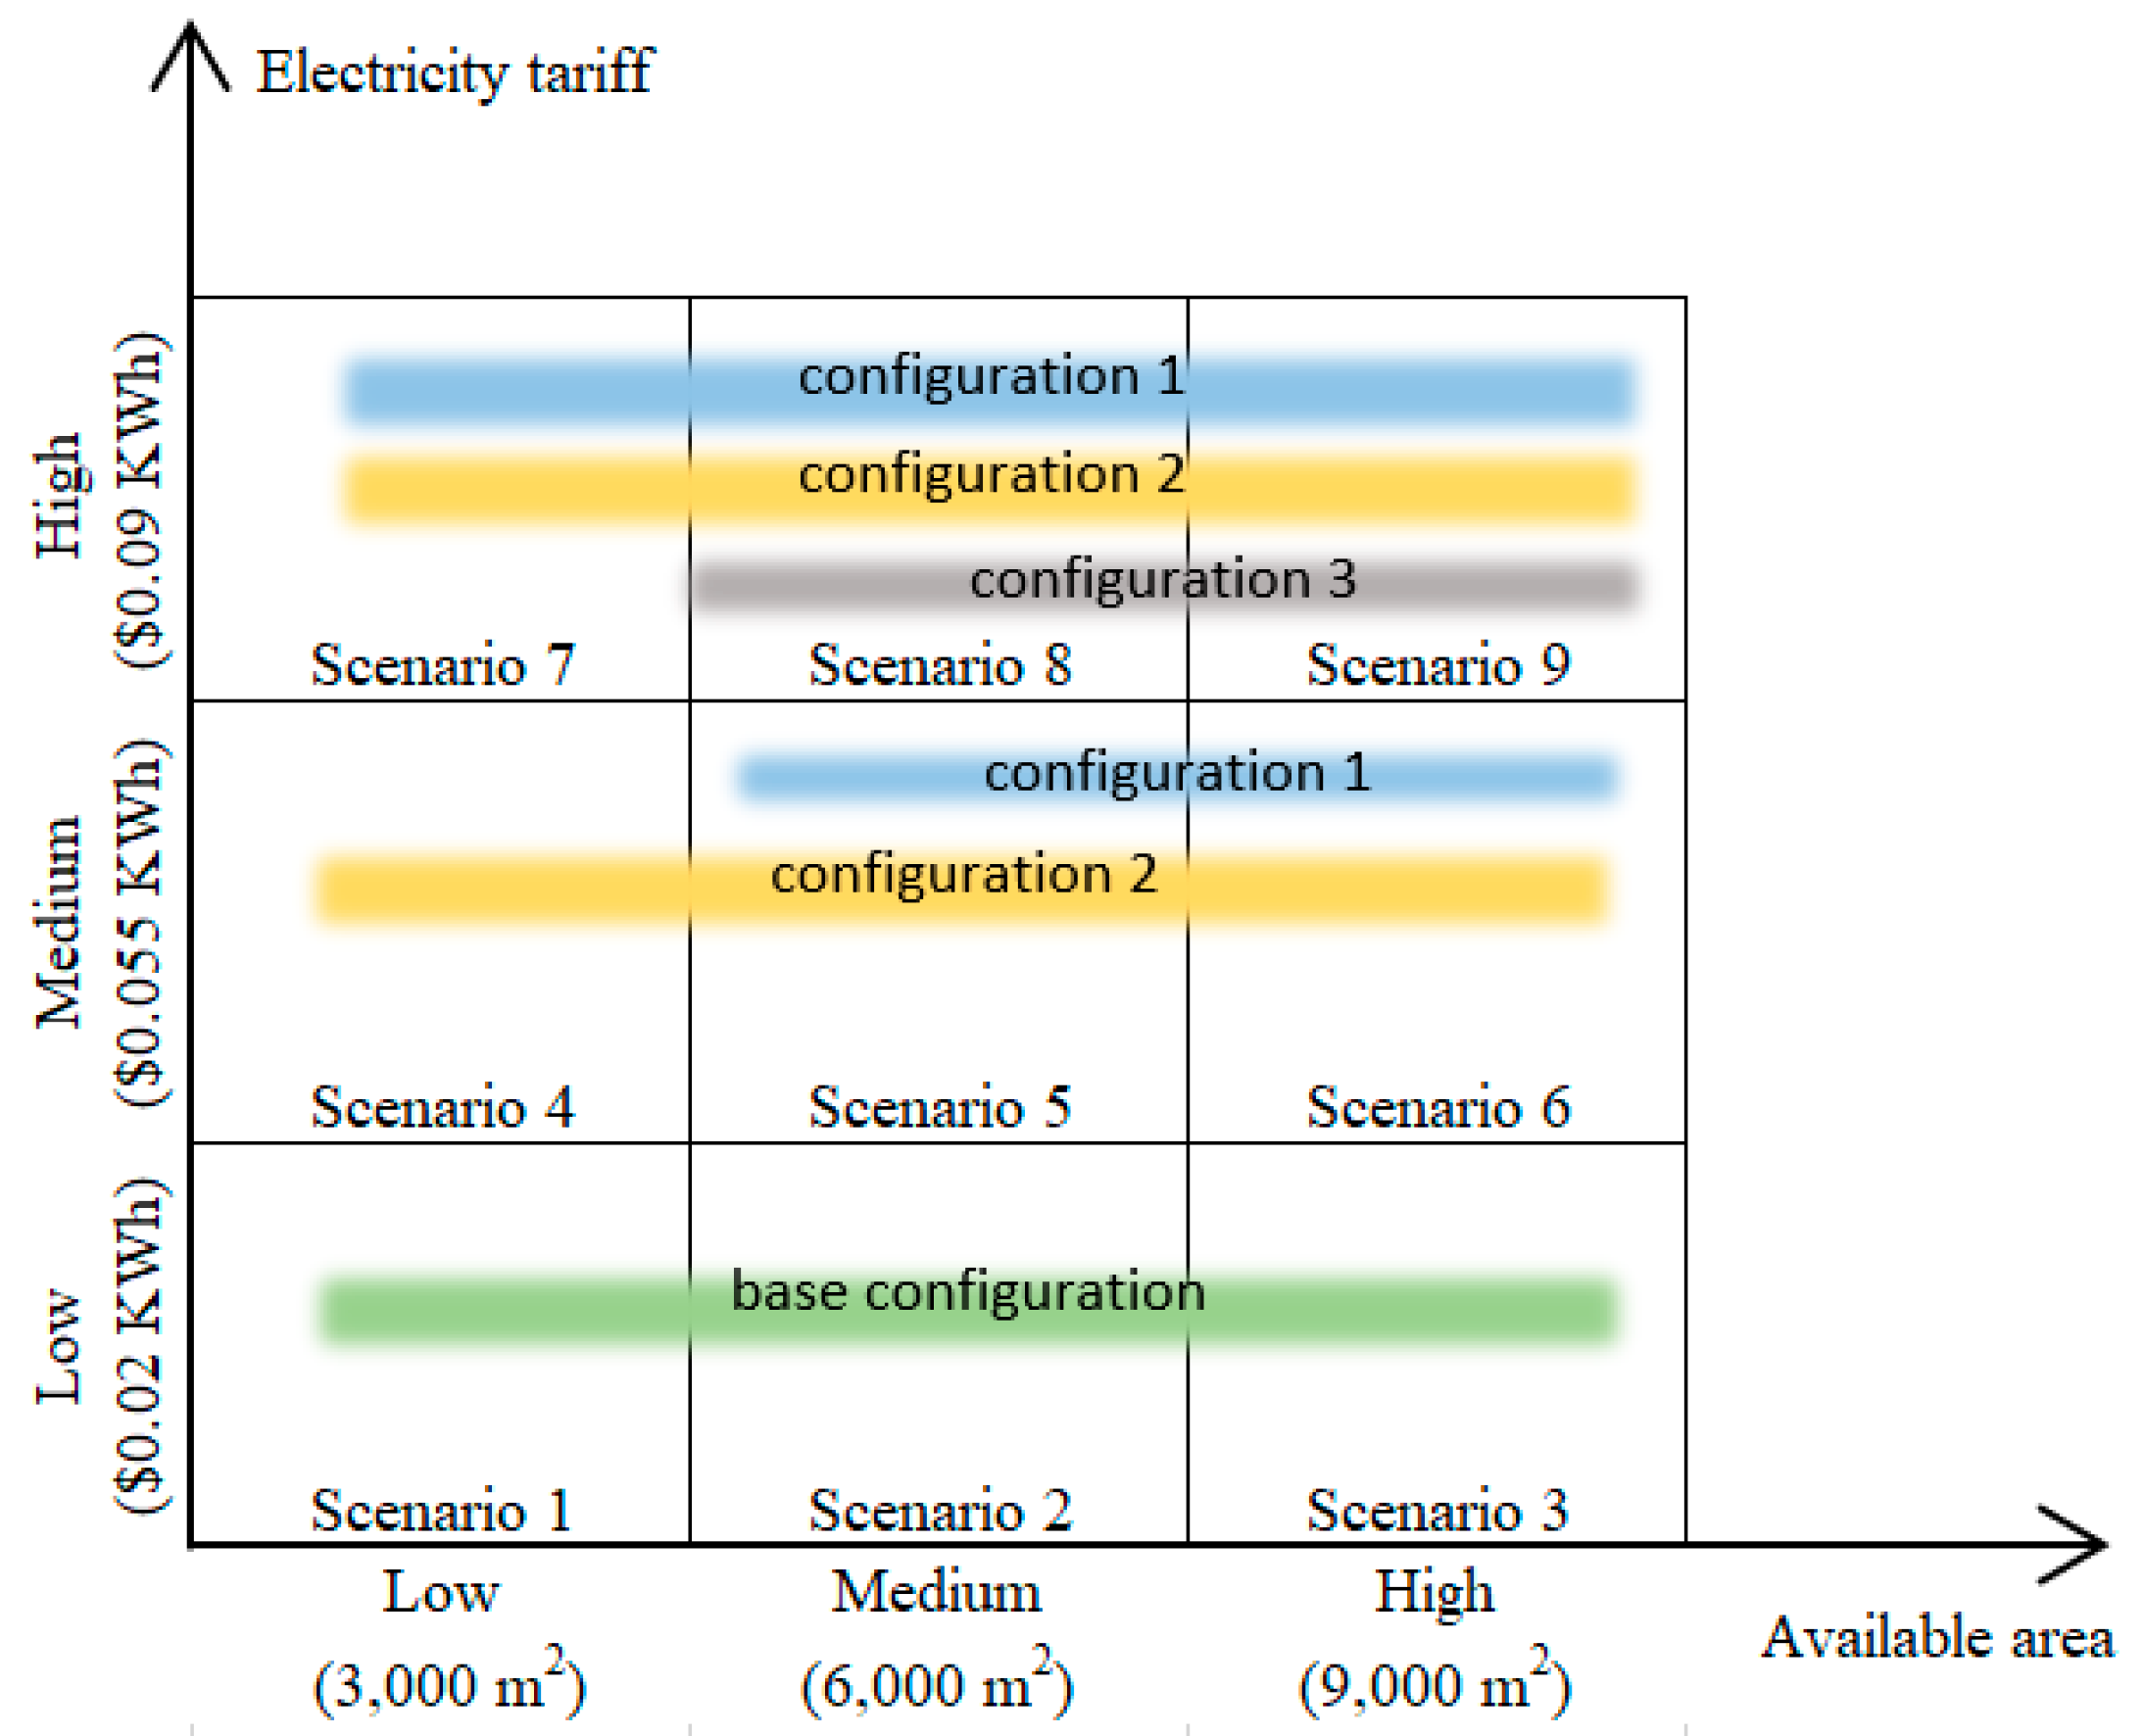
4.2. Scenarios and Configurations Assessment

In Qatar, the electricity price ( P E l e c ) depends on the customer category (productive farms, residential, industrial, hotel, commercial, and government). The government encourages investment in sectors like agriculture, industry, and tourism by subsidizing electricity with different degrees. Moreover, the applied tariff for residential and government institutions is different. The electricity tariff is in the range ($0.02 kWh, $0.09 kWh) [43]. In the urban region, the available installation area for the solar collector is not identical for all buildings. It may depend on the area of the building, the presence of parking, and the unused area. To reflect this local context, 9 scenarios are designed (Figure 8). For the electricity, low, medium, and high tariffs represent $0.02 kWh, $0.055 kWh, and $0.09 kWh. Low, medium, and high availability for the installation area is considered consecutively representing 3000 m2, 6000 m2, and 9000 m2. For example, scenario 5 represents medium area availability and energy tariff.

4.2.1. Optimal Configuration (Economic Assessment)

All scenarios are simulated for the three configurations and the base Grid-DCS by varying the electricity tariff (PElec) and the available installation area (A). Figure 9 shows the optimal configuration based on the economic assessment (objective function). At low electricity tariffs (Scenarios 1–3), the base configuration (Grid-DCS) is more competitive than configurations 1–3.
When the electricity tariff increases (medium or high), the solar cooling configurations become more competitive than the base. However, configuration 3 (T-DCS) is competitive only at high tariffs. Configuration 1 is competitive at medium electricity tariff when the available area is medium and above.
This is true for configuration 3 at a high electricity tariff. Therefore, the available installation area may impact the competitiveness of the solar cooling configuration.

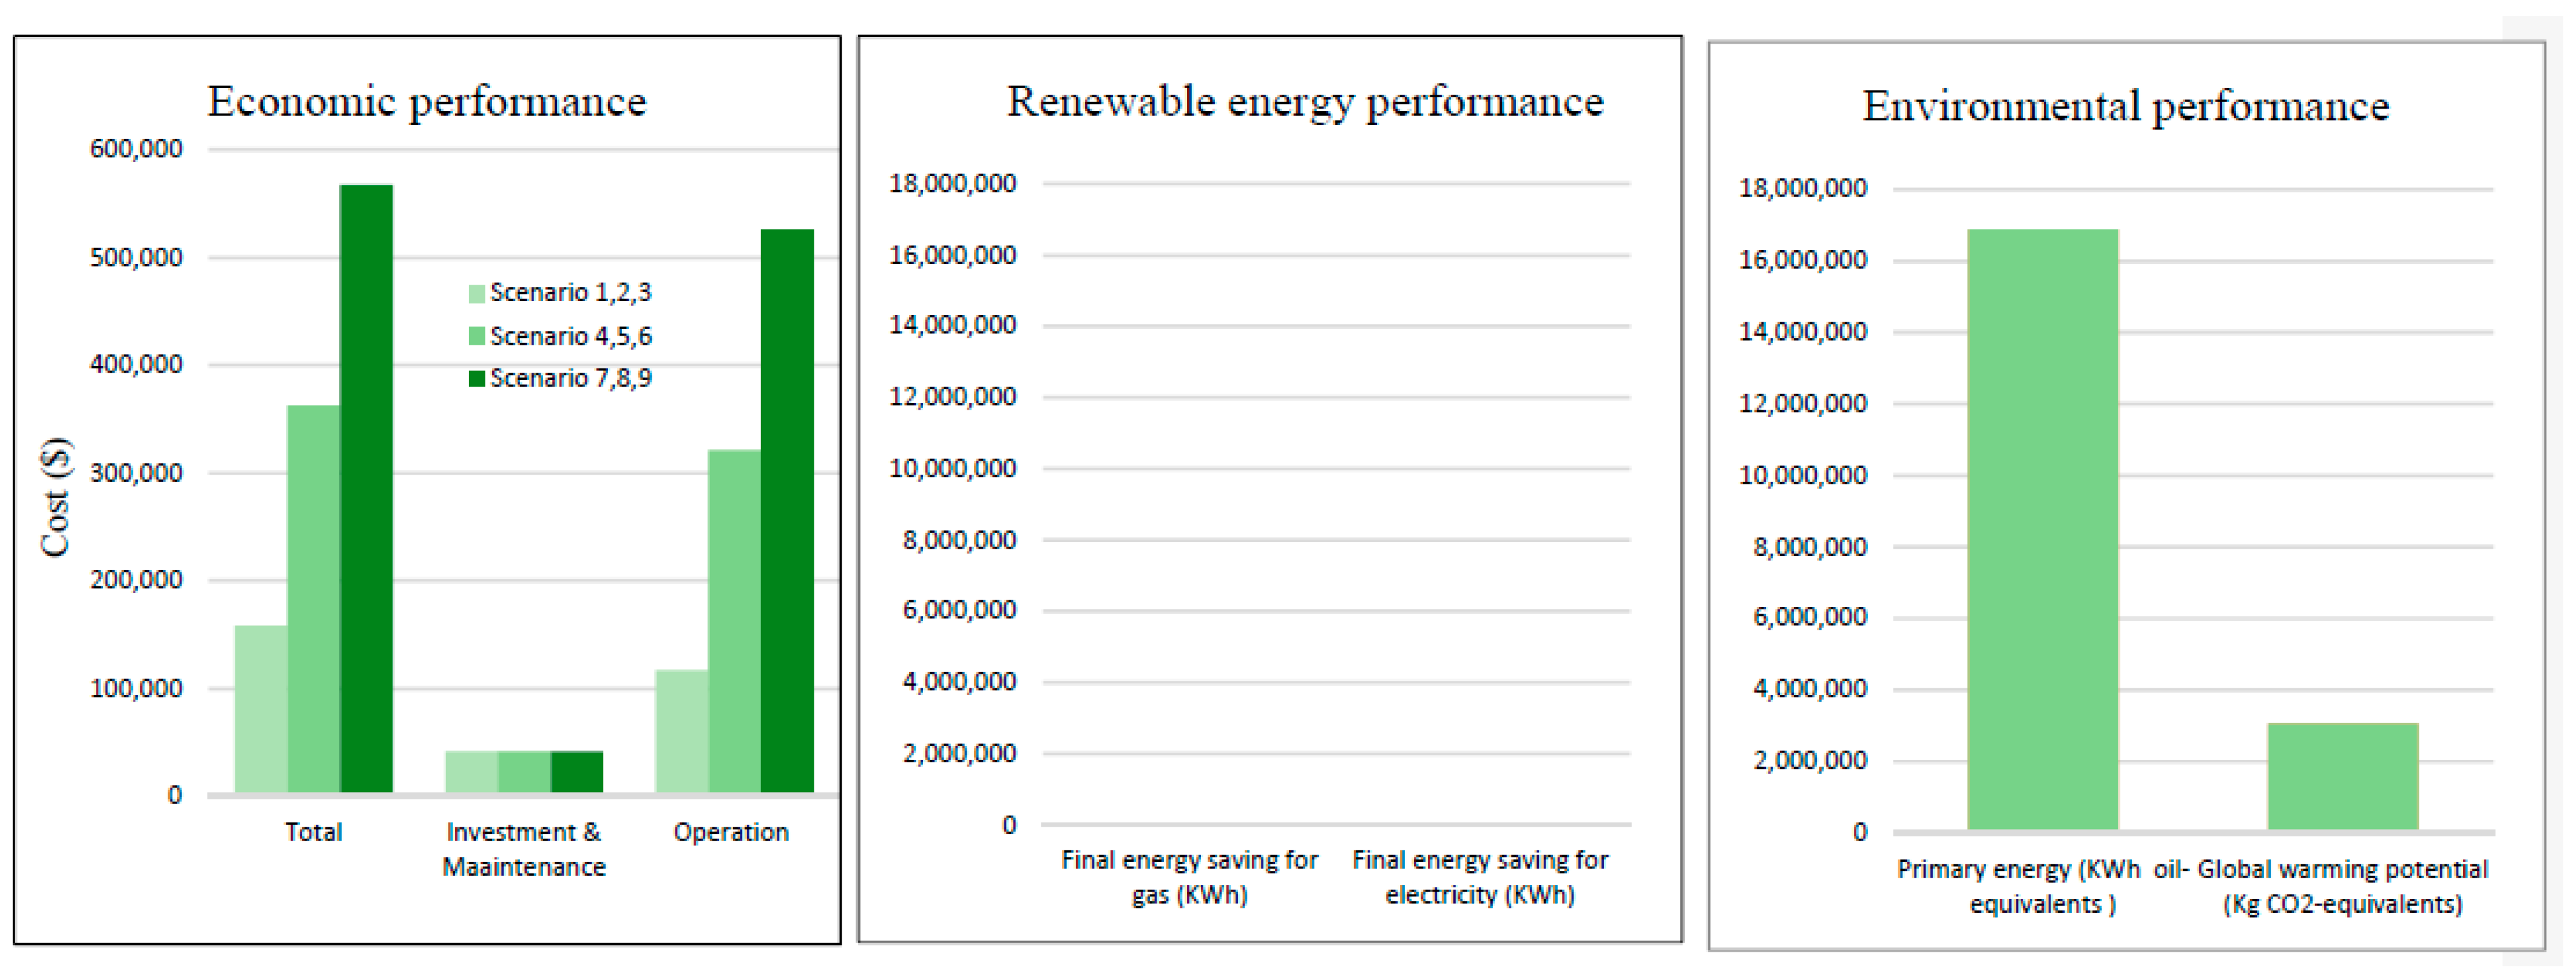
4.2.2. Base Configuration Performance

The Grid-DCS is considered base configuration; the economic, energy, and environmental performance are as follows. Concerning the economic performance, the investment and maintenance cost remains unchanged for all scenarios since the design is composed only of an electric chiller and chilled water tank. However, the operation cost varies and depends on the electricity tariff, impacting the total cost. The base configuration is powered exclusively by grid electricity. Hence, the final energy saving (renewable energy) is considered null. The electricity generation in the power plant is mainly based on fossil fuels, and their combustion generates CO2 emissions. The yearly electricity consumption of the Grid-DCS contributes to the consumption of 16,882,130 kWh oil-equivalents of primary energy and the emissions of 3,060,981 kg CO2-equivalents (Figure 10).

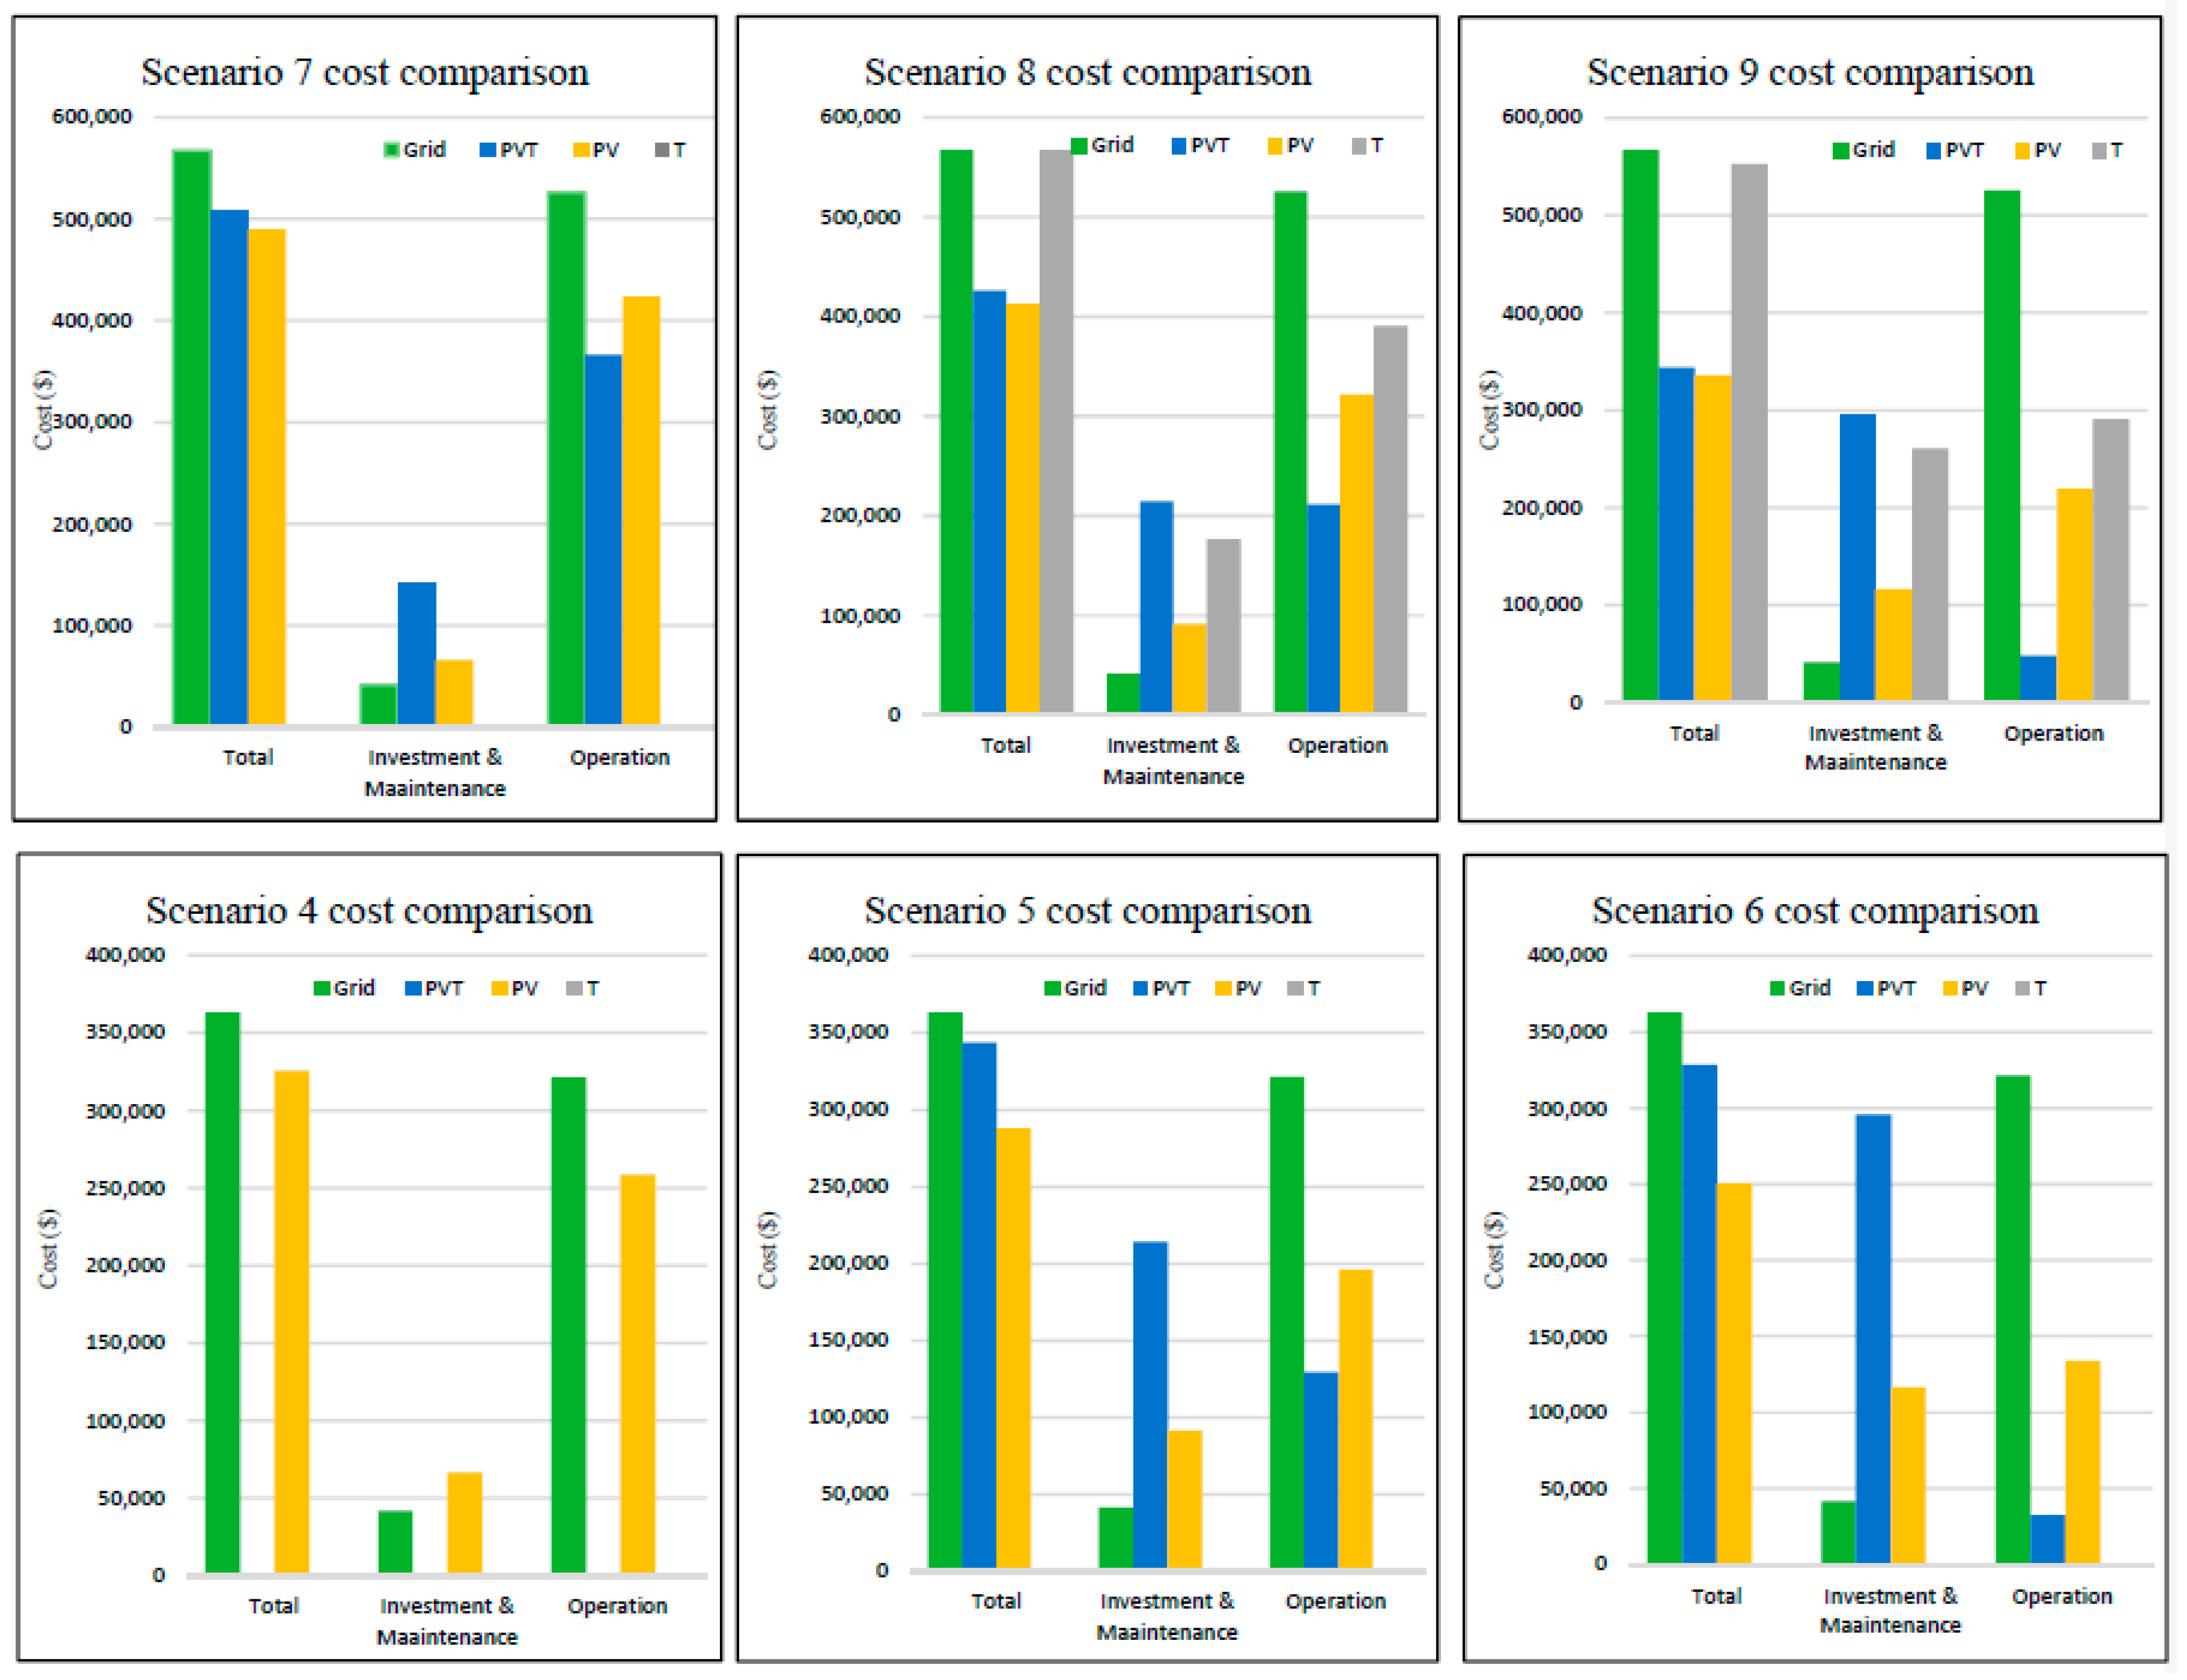
4.2.3. Economic Performance Comparison (Scenarios 4 to 9)

At a low electricity tariff (Scenarios 1–3), The Grid-DCS is the optimal configuration, and the economic performance is detailed in Figure 10. For the remaining Scenarios (Figure 11), the investment and maintenance cost of the Grid-DCS system is the lowest due to the absence of an absorption chiller, hot water tank, and solar collector in the system design. However, the operation cost is the highest among the other configurations due to the grid electricity consumption. The total cost of the PV system is the lowest. The investment and maintenance cost of the PV system is less by 40% to 60% than PVT and T systems due to the absence of absorption chiller and hot water tank in the design, and superior by 60% to 180% than the Grid-DCS configuration mainly due to the PV panel installation cost. The operation cost of the PVT system is the lowest due to the heat and electricity cogeneration. The total cost of the PVT system is slightly superior to the PV system and is in the range of 2% to 4% in the case of high electricity tariff and 19% to 31% for the medium tariff. However, the operation cost of the PVT-DCS configuration is lower by 59% to 89% compared to the Grid-DCS configuration, when electricity tariff is medium, and by 30% to 90% when electricity tariff is high. The T system is more competitive than the base configuration at high electricity tariffs and medium or high available areas. The total cost is almost similar to the base configuration (−2%). This is explained by compensating for the operation cost-saving and the investment cost.

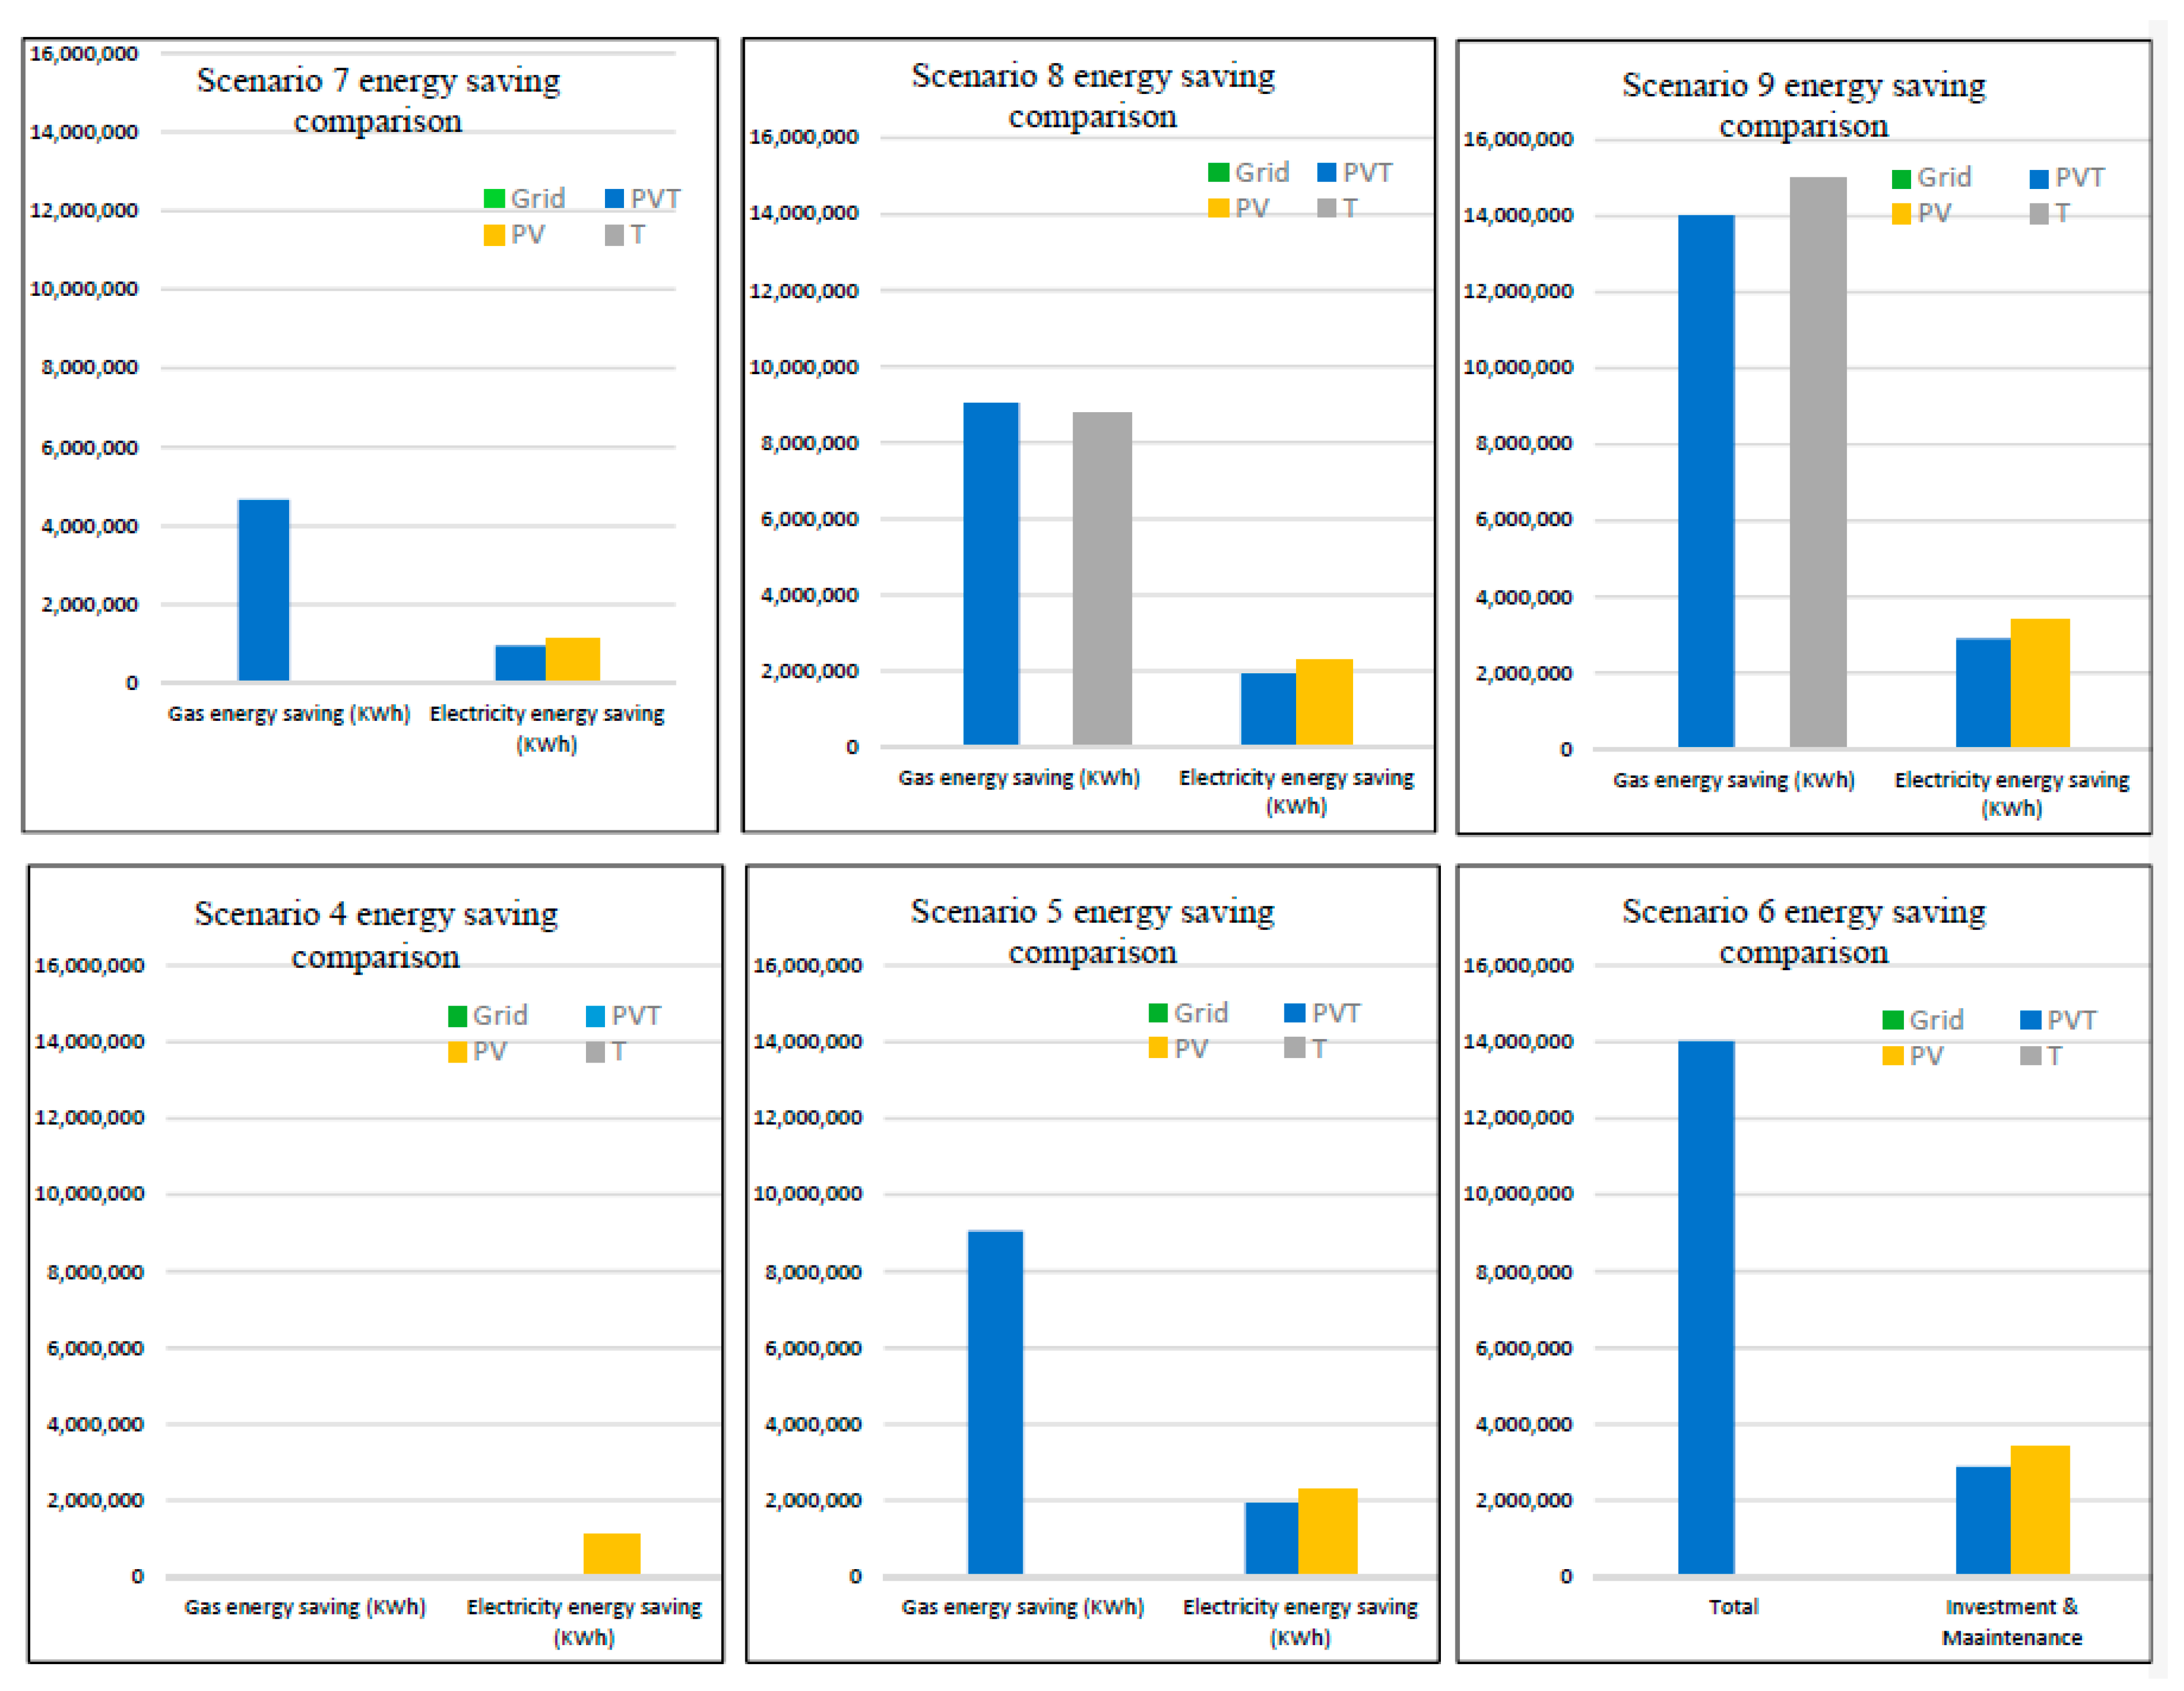
4.2.4. Energy Saved and Renewable Energy Fraction Comparison (Scenarios 4 to 9)

At low electricity tariff (Scenarios 1–3), The Grid-DCS is the optimal configuration based on the economic performance, and the energy performance is detailed in Figure 10. Figure 12 shows renewable energy use saving performance for the remaining Scenarios (4–9). The equivalent energy saved (gas or electricity) depends on the renewable energy generated by the installed area. The gas equivalent saved is proportional to the produced heat and depends on the solar radiation, thermal efficiency, and the installed area. The electricity saved is equal to the electricity generated and depends on the solar radiation, electric efficiency, and the installed area. The hybrid solar technology generates both heat and electricity, which is not the case for photovoltaic and thermal. Consequently, the renewable fraction is superior to PV and T systems. The maximum renewable energy fraction achieved by the PVT, PV, and T systems are respectively 94.70%, 58.30%, and 79.26% for the high installation area scenarios. The minimum fraction for PVT and PV systems are, respectively, 54.82% and 19.43% for the low installation area scenarios. The minimum for the T system is 63.23% for the medium installation area scenario (Figure 13).

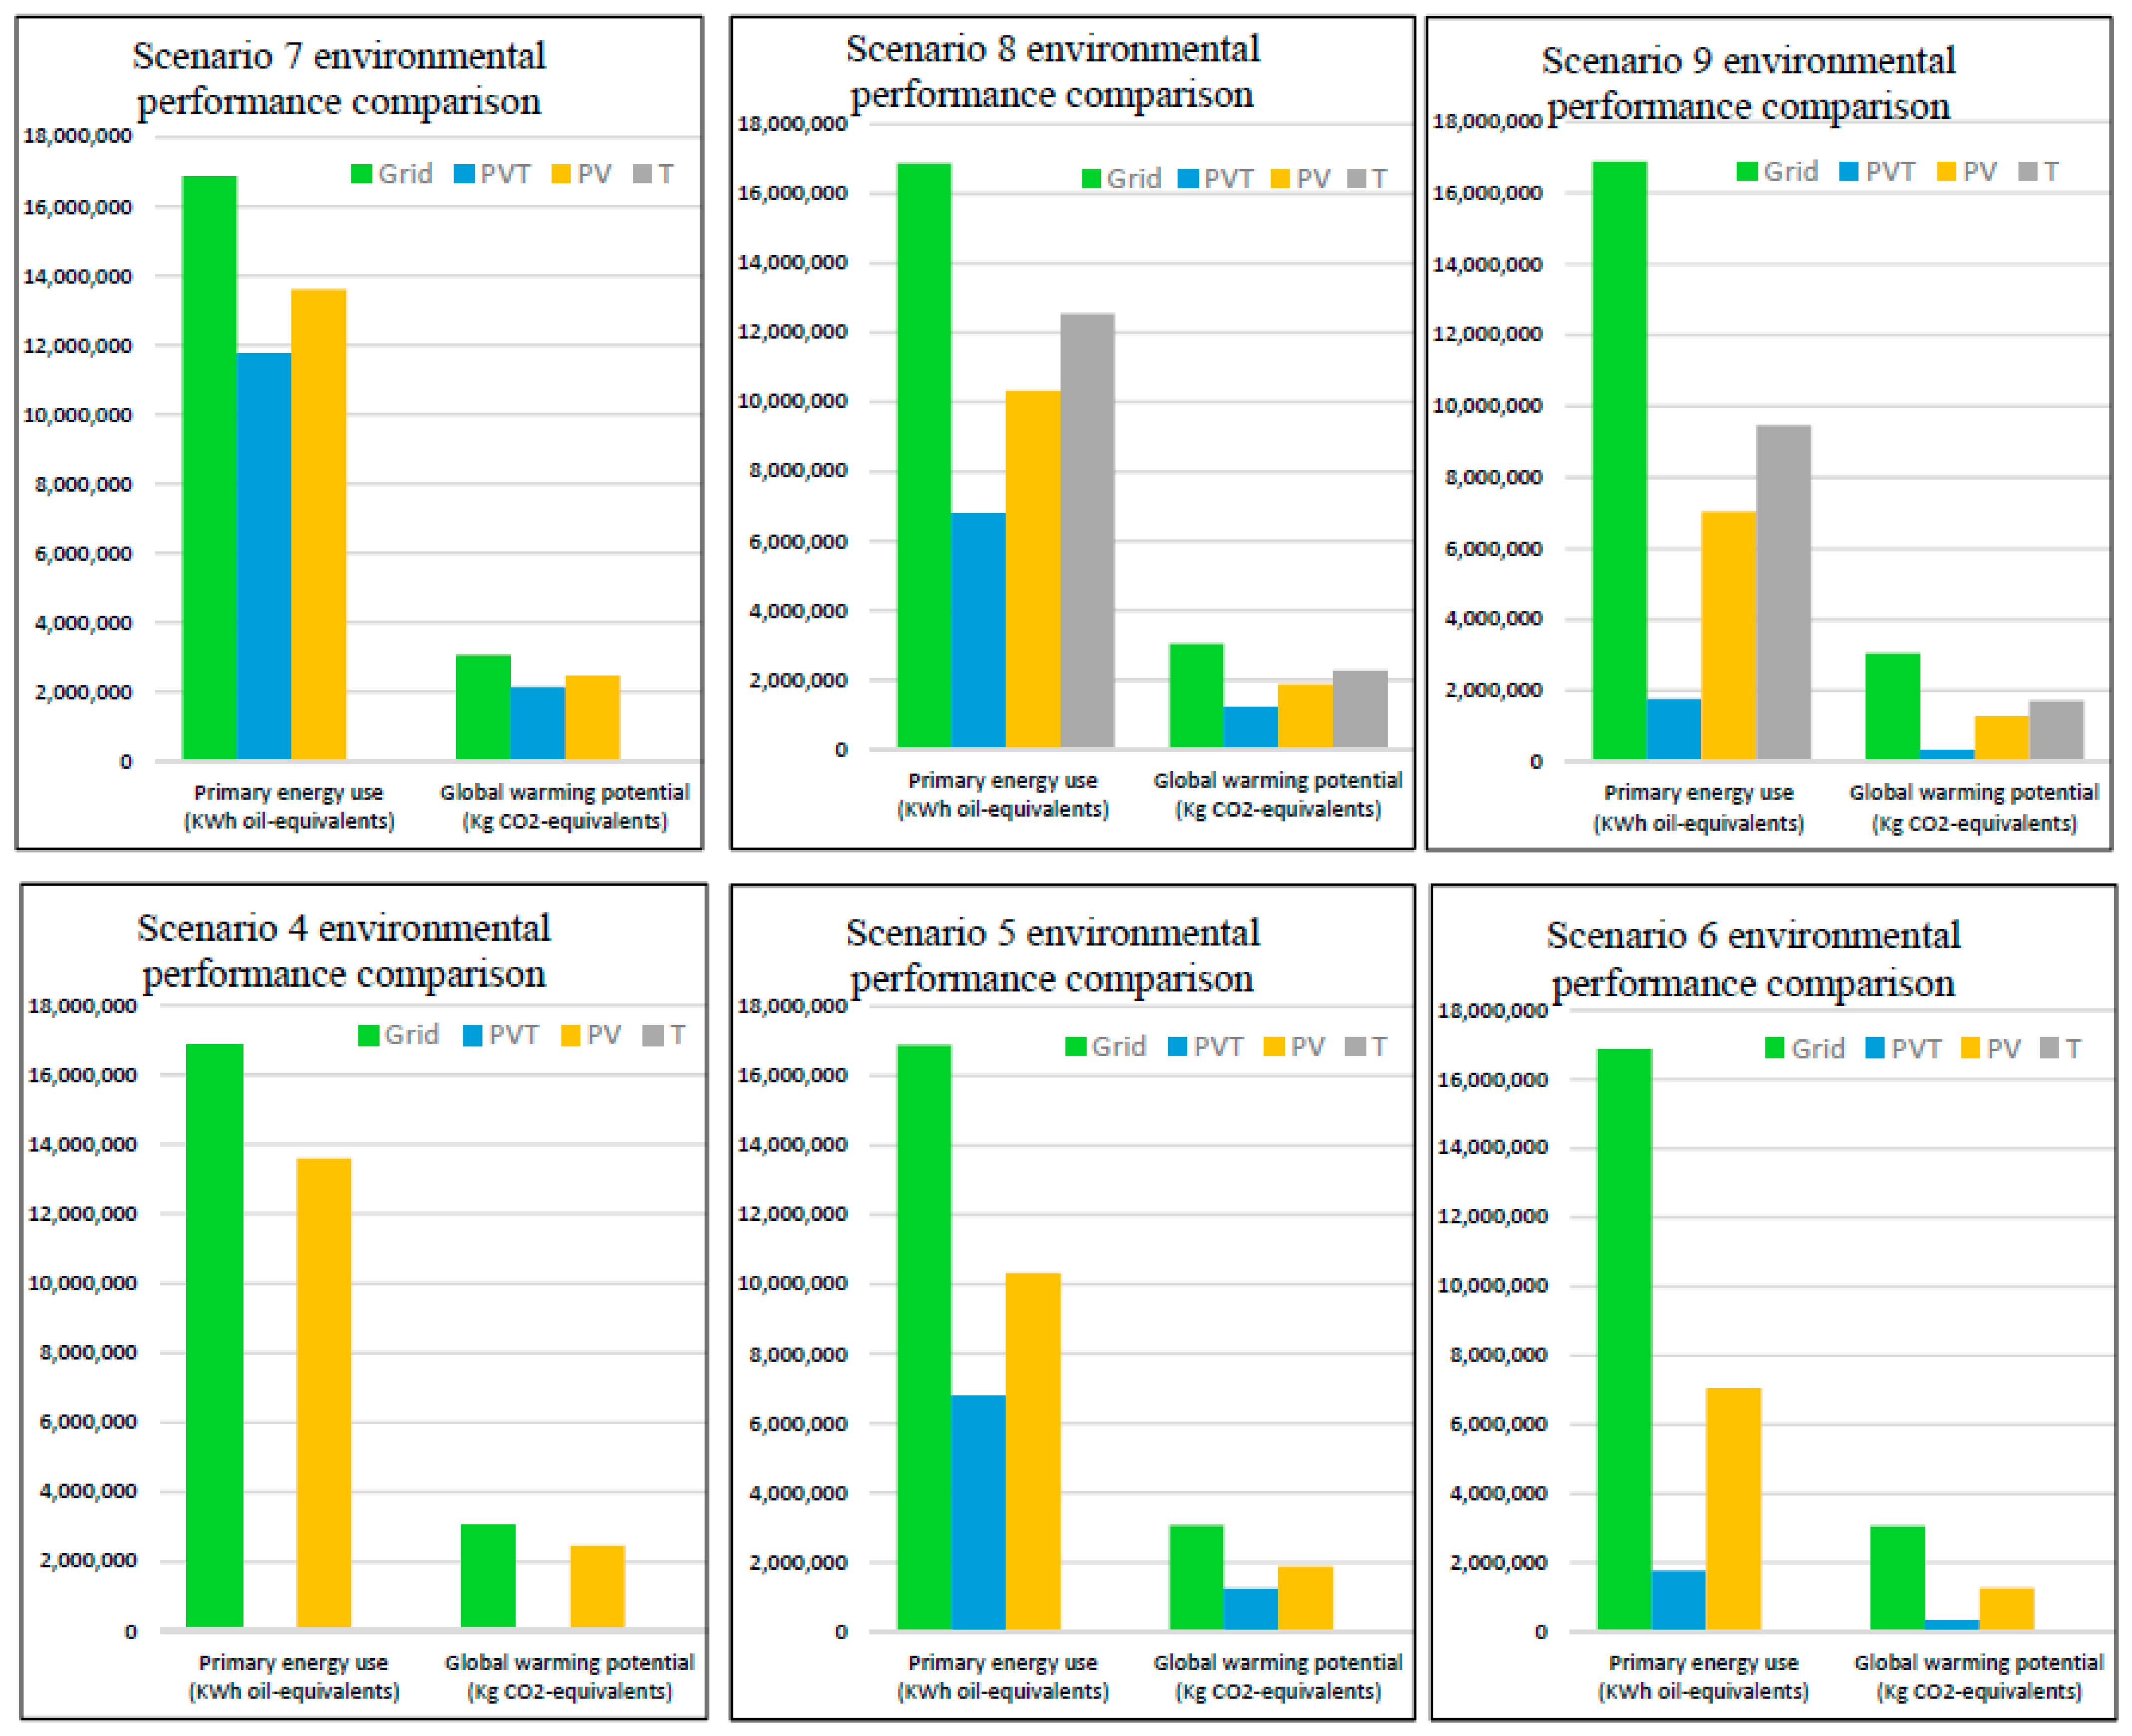
4.2.5. Environmental Performance Comparison (Scenarios 4 to 9)

At low electricity tariff (Scenarios 1–3), The Grid-DCS is the optimal configuration, and the environmental performance is detailed in Figure 10.
Figure 14 shows the environmental performance for the remaining Scenarios (4–9). The Grid-DCS system has the highest primary energy use and global warming potential. Unlike, the hybrid technology has the lowest primary energy use and global warming potential. For high available installation areas, the PVT system reduces the environmental impact by 89.5% compared to the Grid-DCS system, by 59.74% in medium installation area scenarios, and by 30.33% in the case of low installation area scenarios. The PV system reduces the environmental impact by 58.3%, 38.87%, 19.43% when the installation area is high, medium, and low. The T system reduces the environmental impact by 43.76% and 25.71% when the installation area is high and medium.

5. Conclusions, Limitations, and Future Research

In the hot climatic regions, the abundance in solar irradiation and high cooling load patterns form a synergy that can be exploited for an ideal sustainable integrated system. Various solar and cooling technologies exist, implying different possible configurations that satisfy the cooling demand. Therefore, this paper focused on optimizing and assessing solar cooling systems in comparison to the conventional Grid-based district cooling system. The optimal solution leads to the best sizing of the system components, including the technology selection and the optimal production policy in terms of energy generation, hot and chilled water production, and storage.
The assessment and the comparison of the four configurations is performed based on the economic, renewable energy use, and environmental performances. The electricity tariff and available installation area shape the local building context. Therefore, nine scenarios are simulated by varying these parameters. The analysis made in this paper shows that:
-
The electricity tariff and the available installation area impact the integration of solar energy. When electricity tariff is medium or high, the more installed the area is, the better it is for the total cost, renewable energy use, and the environmental impact.
-
At a low electricity tariff rate (subsidized), the conventional Grid-based DCS remains the most competitive among the other configurations. However, the environmental performance is the worst. The annual assessment of 10,000 kW district cooling system powered with grid-electricity shows that 16,882,130 kWh oil-equivalent of primary energy is consumed, which impacts the environment by 3,060,981 kg CO2-equivalent.
-
The PV-DCS configuration is the most competitive among solar-assisted cooling systems. The annual total cost is less by 2% to 4% than PVT-DCS configuration when electricity tariff is high, and less by 19% to 31% when electricity tariff is medium. It reduces the environmental impact compared to the Grid-DCS configuration by 58.3%, 38.87%, 19.43% when the installation area is high, medium, and low.
-
The PVT-DCS configuration has the lowest operation cost among solar-assisted cooling systems and is lower by 59% to 89% than the Grid-DCS configuration, when electricity tariff is medium, and by 30% to 90% when electricity tariff is high. The PVT system also has the best environmental performance by decreasing the primary energy use and the global warming potential by 89.5% compared to the Grid-DCS system, by 59.74% in medium installation area scenarios, and by 30.33% in the case of low installation area scenarios.
-
The T-DCS configuration is more economically competitive than the conventional Grid-DCS configuration only at high electricity tariffs and medium to high available installation areas. The total system cost is slightly less than the Grid-DCS configuration (−2%). Despite the high renewable energy fraction in the range 63.23% and 79.26%, respectively, for medium and high installation areas, the environmental performance is relatively lower than PVT and PV systems. The T system reduces the environmental impact by 43.76% and 25.71% when the installation area is high, and medium compared to the Grid-DCS configuration.

Limitations and Future Research

The proposed model has some limitations. The model assumes that the chiller efficiency is constant during the operation. In general, the efficiency outcomes can be varied. Therefore, the energy consumption pattern can change, exhibiting nonlinear effects in terms of energy requirements and the cooling load supply. However, this would increase the complexity of the model. Therefore, further research can focus on changing the solution approach by decomposing the problem and developing a heuristic to solve the sub-problems.
It should be further noted that the exploitation of solar energy is based on solar irradiation and weather conditions, and these factors are stochastic by nature. Therefore, the model can be extended by considering the probabilistic distribution of irradiance and its impact on electricity and thermal energy generation.
The current model does not consider heating and cooling losses. Therefore, further research can extend to heat losses to establish a more efficient configuration.
The proposed model focuses on the system’s conceptual design, which is one of the earlier stages of the system life cycle development. Further research can focus on the system measurement and the predictive control aspects when the system development reaches advanced stages, such as preliminary and final designs.

Author Contributions

Conceptualization, R.I.; methodology, R.I.; software, R.I.; validation, R.I. and T.Y.E.; formal analysis, R.I.; investigation, R.I. and T.Y.E.; resources, T.Y.E.; data curation, R.I.; writing—original draft preparation, R.I.; writing—review and editing, R.I., T.Y.E., S.P. and A.E.; visualization, R.I. and T.Y.E.; supervision, T.Y.E. and S.P.; project administration, T.Y.E.; funding acquisition, T.Y.E., S.P. and M.A.-S. All authors have read and agreed to the published version of the manuscript.

Funding

This publication was made possible by the [NPRP10-0129-170280] from the Qatar National Research Fund (a member of The Qatar Foundation). The statements made herein are solely the responsibility of the authors. The publication of this article was funded by the Qatar National Library.

Institutional Review Board Statement

Not applicable.

Informed Consent Statement

Not applicable.

Data Availability Statement

Not applicable.

Conflicts of Interest

The authors declare that they have no known competing financial interest or personal relationships that could have appeared to influence the work reported in this paper.

Nomenclature

Latin symbols
d Cooling load demand (kW)
S Solar radiation (kW/m2)
AMaximum solar collector area (m2)
RInterest rate (%)
nEconomic life (year)
Q Maximum Capacity (kW)
E E R Energy Efficiency Ratio (%)
F c Fixed investment cost per installed unit ($)
F m Fixed maintenance cost per installed unit ($)
P Price of energy career ($/kW)
y Binary variable for vapor compression chiller
z Binary variable for absorption chiller
u Binary variable for hot water tank
v Binary variable for chilled water
w Binary variable for auxiliary boiler
x Variable for solar collector installed area (m2)
E Variable for electricity flow (kW)
G Variable for gas flow (kW)
H Variable for heat flow (kW)
H I Variable for heat inventory (kW)
C Variable for cool flow (kW)
C I Variable for cool inventory (kW)
Greek symbols
η Efficiency
αFeed in tariff coefficient
Subscripts and superscripts
t Time period (hour)
i Type of vapor compression chiller
j Type of absorption chiller
k Type of hot water tank
m Type of chilled water tank
n Type of auxiliary boiler
ColType solar collector (T, PV, PVT)
VcVapor compression chiller
AbAbsorption chiller
HwtHot water storage tank
CwtChilled water storage tank
BoAuxiliary boiler
GridElectric grid
Bldbuilding
TherThermal
ElecElectricity
GasFuel (natural gas)
NetNet
Abbreviations
CRFCapital Recovery Factor
DCSDistrict Cooling System

References

  1. International Energy Agency. The Future of Cooling Opportunities for Energy-Efficient air Conditioning. Available online: https://www.iea.org (accessed on 6 December 2021).
  2. Saffouri, F.; Bayram, I.S.; Koc, M. Quantifying the cost of cooling in Qatar. In Proceedings of the 2017 9th IEEE-GCC Conference and Exhibition (GCCCE), Manama, Bahrain, 8–11 May 2017; IEEE: Piscataway, NJ, USA; pp. 1–9. [Google Scholar]
  3. Bayram, I.S.; Saffouri, F.; Koc, M. Generation, analysis, and applications of high-resolution electricity load profiles in Qatar. J. Clean. Prod. 2018, 183, 527–543. [Google Scholar] [CrossRef] [Green Version]
  4. Rezaie, B.; Rosen, M.A. District heating and cooling: Review of technology and potential enhancements. Appl. Energy 2012, 93, 2–10. [Google Scholar] [CrossRef]
  5. Gang, W.; Wang, S.; Gao, D.; Xiao, F. Performance assessment of district cooling systems for a new development district at planning stage. Appl. Energy 2015, 140, 33–43. [Google Scholar] [CrossRef]
  6. The Planning and Statistics Authority. District Cooling System Statistics. Available online: https://www.psa.gov.qa/en/statistics/Statistical%20Releases/Environmental/CoolingStatistics/Cooling_Statistics_2018_AE.pdf (accessed on 6 December 2021).
  7. Eveloy, V.; Ayou, D.S. Sustainable district cooling systems: Status, challenges, and future opportunities, with emphasis on cooling-dominated regions. Energies 2019, 12, 235. [Google Scholar] [CrossRef] [Green Version]
  8. Gang, W.; Wang, S.; Xiao, F.; Gao, D.C. District cooling systems: Technology integration, system optimization, challenges and opportunities for applications. Renew. Sustain. Energy Rev. 2016, 53, 253–264. [Google Scholar] [CrossRef]
  9. Li, Y.; Rezgui, Y.; Zhu, H. District heating and cooling optimization and enhancement—Towards integration of renewables, storage and smart grid. Sustain. Energy Rev. 2017, 72, 281–294. [Google Scholar] [CrossRef]
  10. Inayat, A.; Raza, M. District cooling system via renewable energy sources: A review. Sustain. Energy Rev. 2019, 107, 360–373. [Google Scholar] [CrossRef]
  11. Mustafa, J.; Alqaed, S.; Almehmadi, F.A.; Jamil, B. Development and comparison of parametric models to predict global solar radiation: A case study for the southern region of Saudi Arabia. J. Therm. Anal. Calorim. 2022. [Google Scholar] [CrossRef]
  12. Alqaed, S.; Mustafa, J.; PHallinan, K.; Elhashmi, R. Hybrid CHP/Geothermal Borehole System for Multi-Family Building in Heating Dominated Climates. Sustainability 2020, 12, 7772. [Google Scholar] [CrossRef]
  13. Saikia, K.; Vallès, M.; Fabregat, A.; Saez, R.; Boer, D. A bibliometric analysis of trends in solar cooling technology. Sol. Energy 2020, 199, 100–114. [Google Scholar] [CrossRef]
  14. Ramos, F.; Cardoso, A.; Alcaso, A. Hybrid photovoltaic-thermal collectors: A review. In Emerging Trends in Technological Innovation; Luis, M., Camarinha-Matos, P.P., Luis, R., Eds.; Springer: Berlin/Heidelberg, Germany, 2010; Volume 314, pp. 477–484. [Google Scholar]
  15. Chow, T.T. A review on photovoltaic/thermal hybrid solar technology. Appl. Energy 2010, 87, 365–379. [Google Scholar] [CrossRef]
  16. Chow, T.T.; Tiwari, G.N.; Menezo, C. Hybrid solar: A review on photovoltaic and thermal power integration. Int. J. Photoenergy 2012, 2012, 307287. [Google Scholar] [CrossRef] [Green Version]
  17. Joshi, S.S.; Dhoble, A.S. Photovoltaic -thermal systems (PVT): Technology review and future trends. Renew. Sustain. Energy Rev. 2019, 92, 848–882. [Google Scholar] [CrossRef]
  18. Hamzat, A.K.; Sahin, A.Z.; Omisanya, M.I.; Alhems, L.M. Advances in PV and PVT cooling technologies: A review. Sustain. Energy Technol. Assess. 2021, 47, 101360. [Google Scholar] [CrossRef]
  19. Kumar, R.; Rosen, M.A. A critical review of photovoltaic–thermal solar collectors for air heating. Appl. Energy 2011, 88, 3603–3614. [Google Scholar]
  20. Ul Abdin, Z.; Rachid, A. A survey on applications of hybrid PV/t panels. Energies 2021, 14, 1205. [Google Scholar] [CrossRef]
  21. Herez, A.; El Hage, H.; Lemenand, T.; Ramadan, M.; Khaled, M. Review on photovoltaic/thermal hybrid solar collectors: Classifications, applications and new systems. Sol. Energy 2020, 207, 1321–1347. [Google Scholar] [CrossRef]
  22. Barbu, M.; Darie, G.; Siroux, M. A parametric study of a hybrid photovoltaic thermal (PVT) system coupled with a domestic hot water (DHW) storage tank. Energies 2020, 13, 6481. [Google Scholar] [CrossRef]
  23. Moreno, A.; Chemisana, D.; Fernández, E.F. Hybrid high-concentration photovoltaic-thermal solar systems for building applications. Appl. Energy 2021, 304, 117647. [Google Scholar] [CrossRef]
  24. Tiwari, S.; Agrawal, S.; Tiwari, G.N. PVT air collector integrated greenhouse dryers. Renew. Sustain. Energy Rev. 2018, 90, 142–159. [Google Scholar] [CrossRef]
  25. Alqaed, S.; Mustafa, J.; Almehmadi, F.A. Design and energy requirements of a photovoltaic-thermal powered water desalination plant for the middle east. Int. J. Environ. Res. Public Health 2021, 18, 1001. [Google Scholar] [CrossRef] [PubMed]
  26. Pakere, I.; Lauka, D.; Blumberga, D. Solar power and heat production via photovoltaic thermal panels for district heating and industrial plant. Energy 2018, 154, 424–432. [Google Scholar] [CrossRef]
  27. Alois, R. 2020 Subsidies for PVT Collectors in Selected Countries. Available online: https://www.iea-shc.org/Data/Sites/1/publications/IEA-SHC-Task60-D6-Subsidies-PVT.pdf (accessed on 6 December 2021).
  28. Lämmle, M.; Herrando, M.; Ryan, G. Basic Concepts of PVT Collector Technologies, Applications and Markets. Available online: https://www.iea-shc.org/Data/Sites/1/publications/IEA-SHC-Task60-D5-Basic-Concepts-of-PVT-Technologies.pdf (accessed on 6 December 2021).
  29. Hadorn, J.; Zenhusern, D. Collection of Documents Prepared along the Task for Industry and Market. Available online: https://www.iea-shc.org/Data/Sites/1/publications/IEA-SHC-Task60-Docs.pdf (accessed on 6 December 2021).
  30. Hadorn, J.; Lämmle, M.; Kramer, L.; Munz, G.; Ryan, G.; Herrando, M.; Brottier, L. Design Guidelines for PVT Collectors. Available online: https://www.iea-shc.org/Data/Sites/1/publications/IEA-SHC-Task60-B2-Design-Guidelines-for-PVT-Collectors.pdf (accessed on 6 December 2021).
  31. Al-Waeli, A.H.; Sopian, K.; Kazem, H.A.; Chaichan, M.T. Novel criteria for assessing PV/t solar energy production. Case Stud. Therm. Eng. 2019, 16, 100547. [Google Scholar] [CrossRef]
  32. Zenhäusern, D. Key Performance Indicators for PVT Systems. Available online: https://www.iea-shc.org/Data/Sites/1/publications/IEA-SHC-Task60-D1-Key-Performance-Indicators.pdf (accessed on 6 December 2021).
  33. Abid, M.; Khan, M.S.; Ratlamwala, T.A.H.; Malik, M.N.; Ali, H.M.; Cheok, Q. Thermodynamic analysis and comparison of different absorption cycles driven by evacuated tube solar collector utilizing hybrid nanofluids. Energy Convers. Manag. 2021, 246, 114673. [Google Scholar] [CrossRef]
  34. Asadi, J.; Amani, P.; Amani, M.; Kasaeian, A.; Bahiraei, M. Thermo-economic analysis and multi-objective optimization of absorption cooling system driven by various solar collectors. Energy Convers. Manag. 2018, 173, 715–727. [Google Scholar]
  35. Weber, C.; Berger, M.; Mehling, F.; Heinrich, A.; Núñez, T. Solar cooling with water–ammonia absorption chillers and concentrating solar collector—Operational experience. Int. J. Refrig. 2014, 39, 57–76. [Google Scholar] [CrossRef]
  36. Bellos, E.; Tzivanidis, C. Performance analysis and optimization of an absorption chiller driven by nanofluid-based solar flat plate collector. J. Clean. Prod. 2018, 174, 256–272. [Google Scholar] [CrossRef]
  37. Bellos, E.; Tzivanidis, C. Parametric analysis and optimization of a cooling system with ejector-absorption chiller powered by solar parabolic trough collectors. Energy Convers. Manag. 2018, 168, 329–342. [Google Scholar] [CrossRef]
  38. Shehadi, M. Optimizing solar cooling systems. Case Stud. Therm. Eng. 2020, 21, 100663. [Google Scholar] [CrossRef]
  39. Saleh, A.; Mosa, M. Optimization study of a single-effect water–lithium bromide absorption refrigeration system powered by flat-plate collector in hot regions. Energy Convers. Manag. 2014, 87, 29–36. [Google Scholar] [CrossRef]
  40. Iranmanesh, A.; Mehrabian, M.A. Optimization of a lithium bromide–water solar absorption cooling system with evacuated tube collectors using the genetic algorithm. Energy Build. 2014, 85, 427–435. [Google Scholar] [CrossRef]
  41. Alobaid, M.; Hughes, B.; Calautit, J.K.; O’Connor, D.; Heyes, A. A review of solar-driven absorption cooling with photovoltaic thermal systems. Renew. Sustain. Energy Rev. 2017, 76, 728–742. [Google Scholar] [CrossRef] [Green Version]
  42. Alghool, D.M.; Elmekkawy, T.Y.; Haouari, M.; Elomri, A. Optimization of design and operation of solar-assisted district cooling systems. Energy Convers. Manag. X 2020, 6, 100028. [Google Scholar] [CrossRef]
  43. Calderoni, M.; Dourlens-Qaranta, S.; Sreekumar, B.B.; Lennard, Z.; Rämä, M.; Klobut, K.; Wang, Z.; Duan, X.; Zhang, Y.; Nilsson, J.; et al. Sustainable District Cooling Guidelines; VTT: Espoo, Finland, 2019. [Google Scholar]
  44. Ismaen, R.; El Mekkawy, T.Y.; Pokharel, S.; Al-Salem, M. System requirements and optimization of multi-chillers district cooling plants. Energy 2022, 246, 123349. [Google Scholar] [CrossRef]
  45. Awjah Almehmadi, F.; Hallinan, K.P.; Mulford, R.B.; Alqaed, S.A. Technology to Address Food Deserts: Low Energy Corner Store Groceries with Integrated Agriculture Greenhouse. Sustainability 2020, 12, 7565. [Google Scholar] [CrossRef]
  46. Sameti, M.; Haghighat, F. Hybrid solar and heat-driven district cooling system: Optimal integration and control strategies. Sol. Energy 2019, 183, 260–275. [Google Scholar] [CrossRef]
  47. Ramschak, T. Available online: https://task60.iea-shc.org/Data/Sites/1/publications/IEA-SHC-Task60-A1-Existing-PVT-Systems-and-Solutions.pdf (accessed on 6 December 2021).
  48. Alghool, D.; Elmekkawy, T.; Haouari, M.; Elomri, A. Data of the design of solar-assisted district cooling systems. Data Brief 2020, 30, 105541. [Google Scholar] [CrossRef]
  49. KAHRAMA. Qatar General Electricity & Water Corporation. Available online: https://www.km.qa/CustomerService/Pages/Tariff.aspx (accessed on 6 December 2021).
  50. Natural Gas-Monthly Price (Qatari Riyal per Million Metric British Thermal Unit)-Commodity Prices-Price Charts, Data, and News-IndexMundi. Available online: https://www.indexmundi.com/ (accessed on 6 December 2021).
Figure 1. Integrated solar collector and mix-technologies DCS Diagram.
Energies 15 02657 g001
Figure 2. Framework of the developed model.
Energies 15 02657 g002
Figure 3. Structure of used data.
Energies 15 02657 g003
Figure 4. Cooling load and solar for a typical summer day.
Energies 15 02657 g004
Figure 5. System’s electricity flow for a typical August day.
Energies 15 02657 g005
Figure 6. System’s heat flow.
Energies 15 02657 g006
Figure 7. Cooling demand satisfaction.
Energies 15 02657 g007
Figure 8. Scenario setting.
Energies 15 02657 g008
Figure 9. Optimal economic configuration.
Energies 15 02657 g009
Figure 10. Base configuration economic, energy, and environmental performances.
Energies 15 02657 g010
Figure 11. Scenarios’ cost comparison.
Energies 15 02657 g011
Figure 12. Scenarios’ energy saved comparison.
Energies 15 02657 g012
Figure 13. Scenarios’ renewable energy fraction comparison.
Energies 15 02657 g013
Figure 14. Scenarios’ environmental performance comparison.
Energies 15 02657 g014
Table 1. Solar-cooling configurations.
ConfigurationIntegration
Configuration 1Integrated Photovoltaic Thermal (PVT) solar collector-district cooling system
Configuration 2Integrated Photovoltaic (PV) solar collector-district cooling system
Configuration 3Integrated Thermal (T) solar collector-district cooling system
Base configurationConventional district cooling system powered with grid electricity
Table 2. Model’s features.
Parameter η T H E R η   E L E C Integration
System
Configuration 1 η t h e r   > 0   η e l e c   > 0 Integrated Photovoltaic Thermal (PVT)-DCS
Configuration 2 η t h e r   = 0   η e l e c   > 0 Integrated Photovoltaic (PV)-DCS
Configuration 3 η t h e r   > 0   η e l e c   = 0 Integrated Thermal (T)-DCS
Base configuration ( η t h e r   = 0 and η e l e c   = 0 ) or A = 0Conventional district cooling system Grid-DCS
Table 3. Solar collectors’ parameters and set size.
ConfigurationSolar CollectorSet Size
η t h e r     η e l e c   F c C o l IJKMN
Configuration 1 (PVT-DCS)0.700.18300 $/m256774
Configuration 2 (PV-DCS)0.000.20100 $/m2
Configuration 3 (T-DCS)0.750.00250 $/m2
Base configuration (Grid–DCS)0.000.000 $
Table 4. Optimal design characteristics and costs for base configuration and configuration 1.
Base Configuration (Grid)Configuration 1 (PVT)
Capacity/AmountEfficiencyCapacity/AmountEfficiency
PVT--6000 m20.7 and 0.18
electric chiller6330 kW6.75300 kW6.7
Absorption chiller--1454 kW1.36
Hot water TES--63,000 kW-
Chilled water TES63,000 kW-63,000 kW-
Boiler----
Total cost362,822343,758
Investment & maintenance costs41,535214,395
Operation cost321,286129,363
Table 5. Annual performances of configuration (1) and base configuration.
EconomicEnergy IndicatorsEnvironmental Indicators
Total Cost
($)
f P V T , e l e c
(%)
f P V T , t h e r
(%)
f r e n
(%)
F E s a v , g a s s y s
kWh Equivalent
F E s a v , e l e c s y s
kWh Equivalent
P E s y s
kWh Oil-Equivalent
G W P s y s
Kg CO2-Equivalent
Configuration 1343,75845.0710080.369,055,2211,930,0126,797,4121,232,472
Base configuration362,8220000016,882,1303,060,981
Publisher’s Note: MDPI stays neutral with regard to jurisdictional claims in published maps and institutional affiliations.

