
A Multi-Step Time-Series Clustering-Based Seq2Seq LSTM Learning for a Single Household Electricity Load Forecasting


Abstract
:1. Introduction
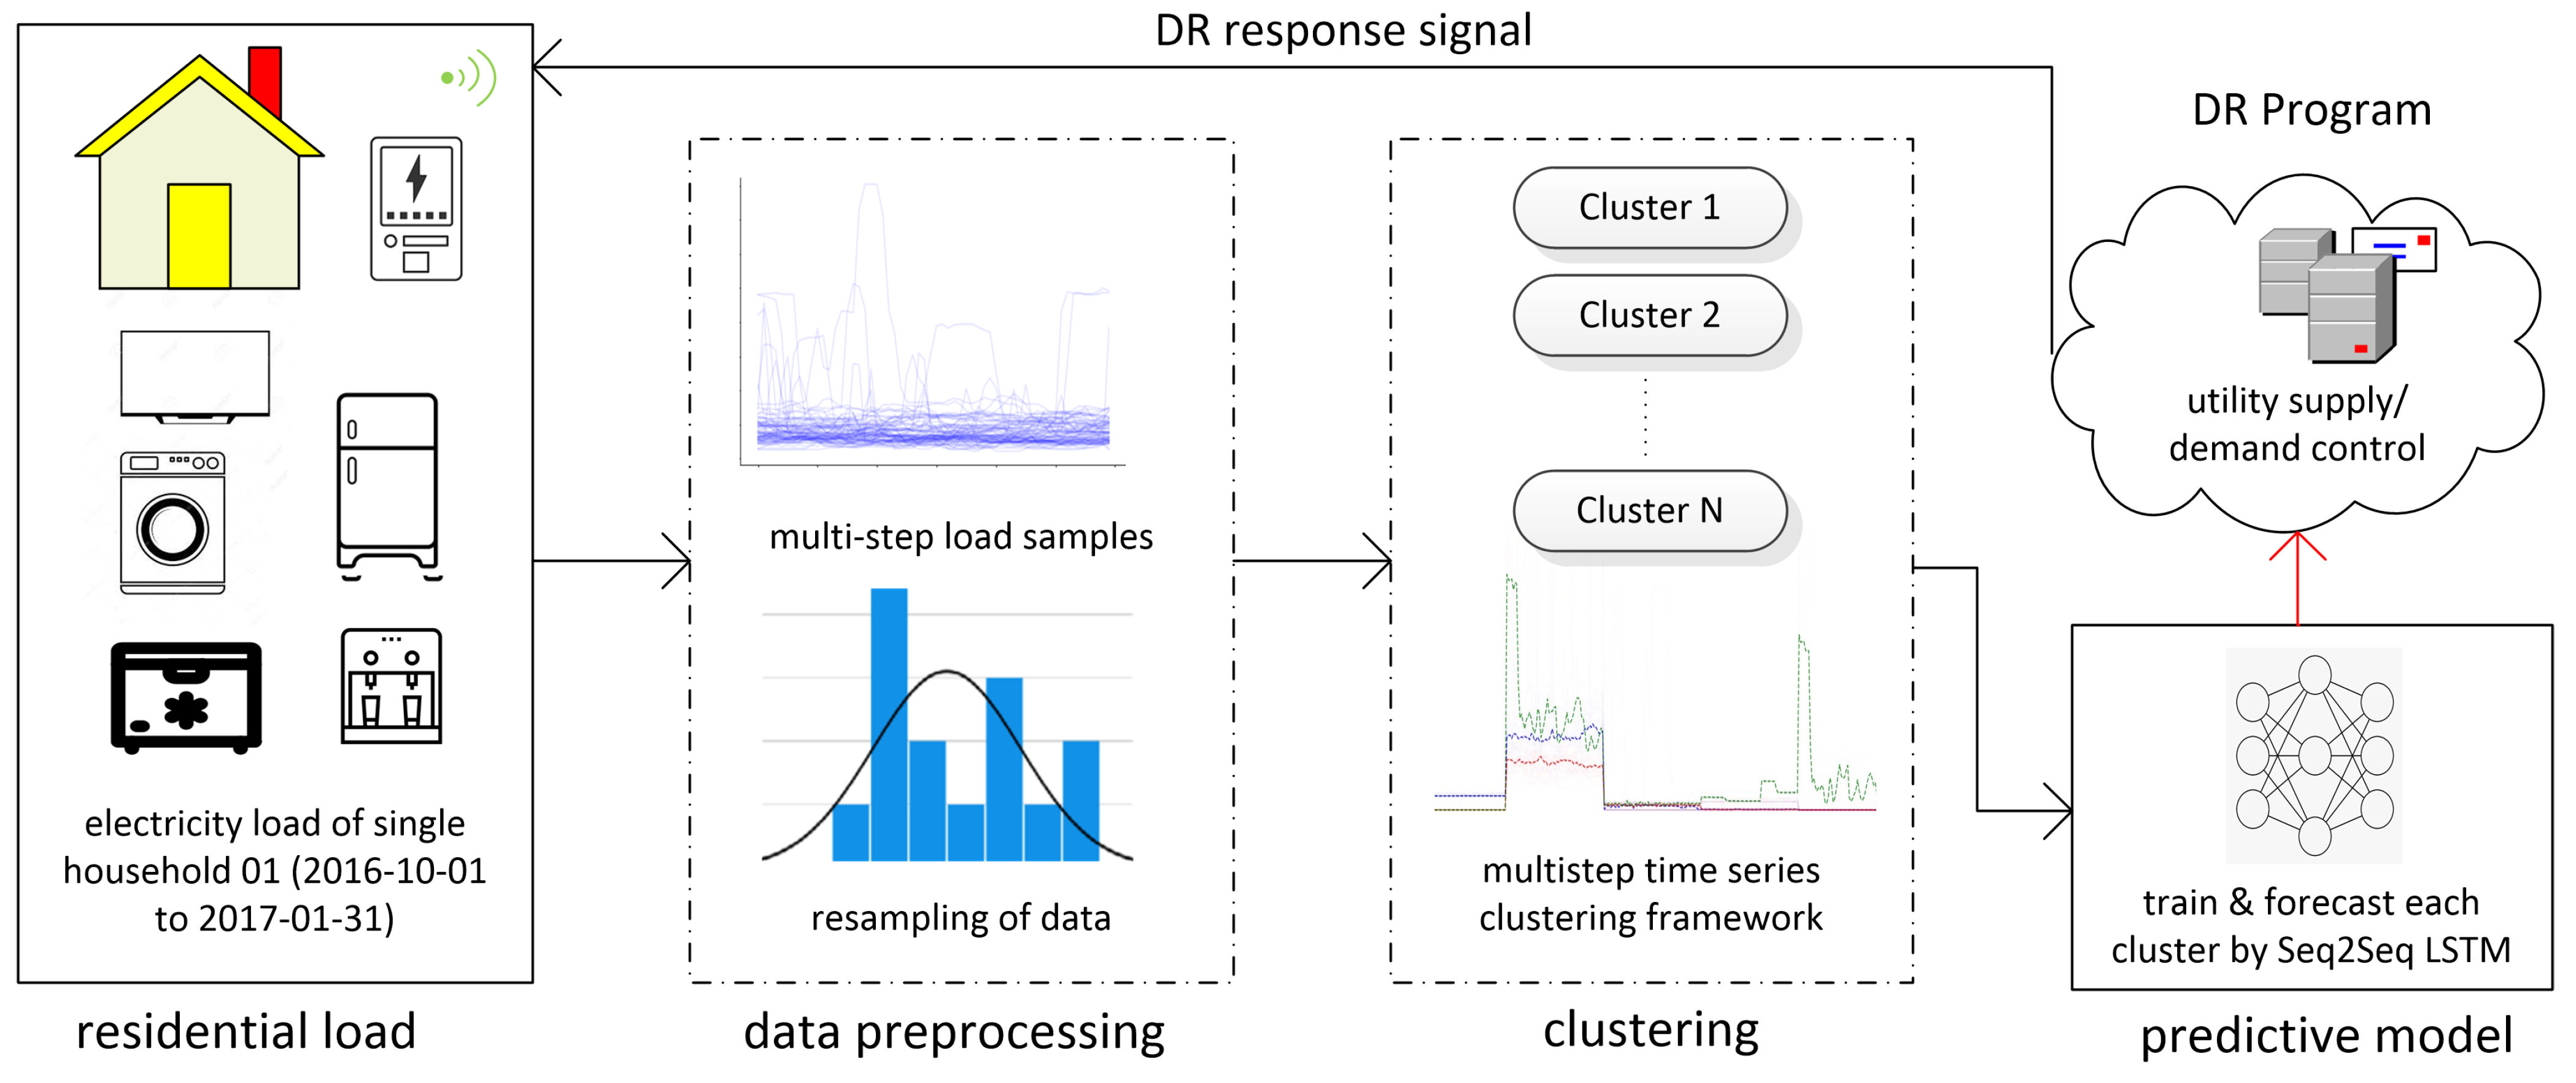
- This paper proposes deep learning-based multi-step time-series Seq2Seq LSTM framework for the electricity load forecasting.
- This paper takes on a new vision which combines the Seq2Seq LSTM and clustering to improve the efficiency of the DR program and provides multistep lookback analysis of a single household.
- Different from the aggregated residential load, in this paper, a multi-step time-series electric load clustering and forecasting for a single household is proposed, which deals load forecasting to a DR program for supply and demand control.
2. System Model
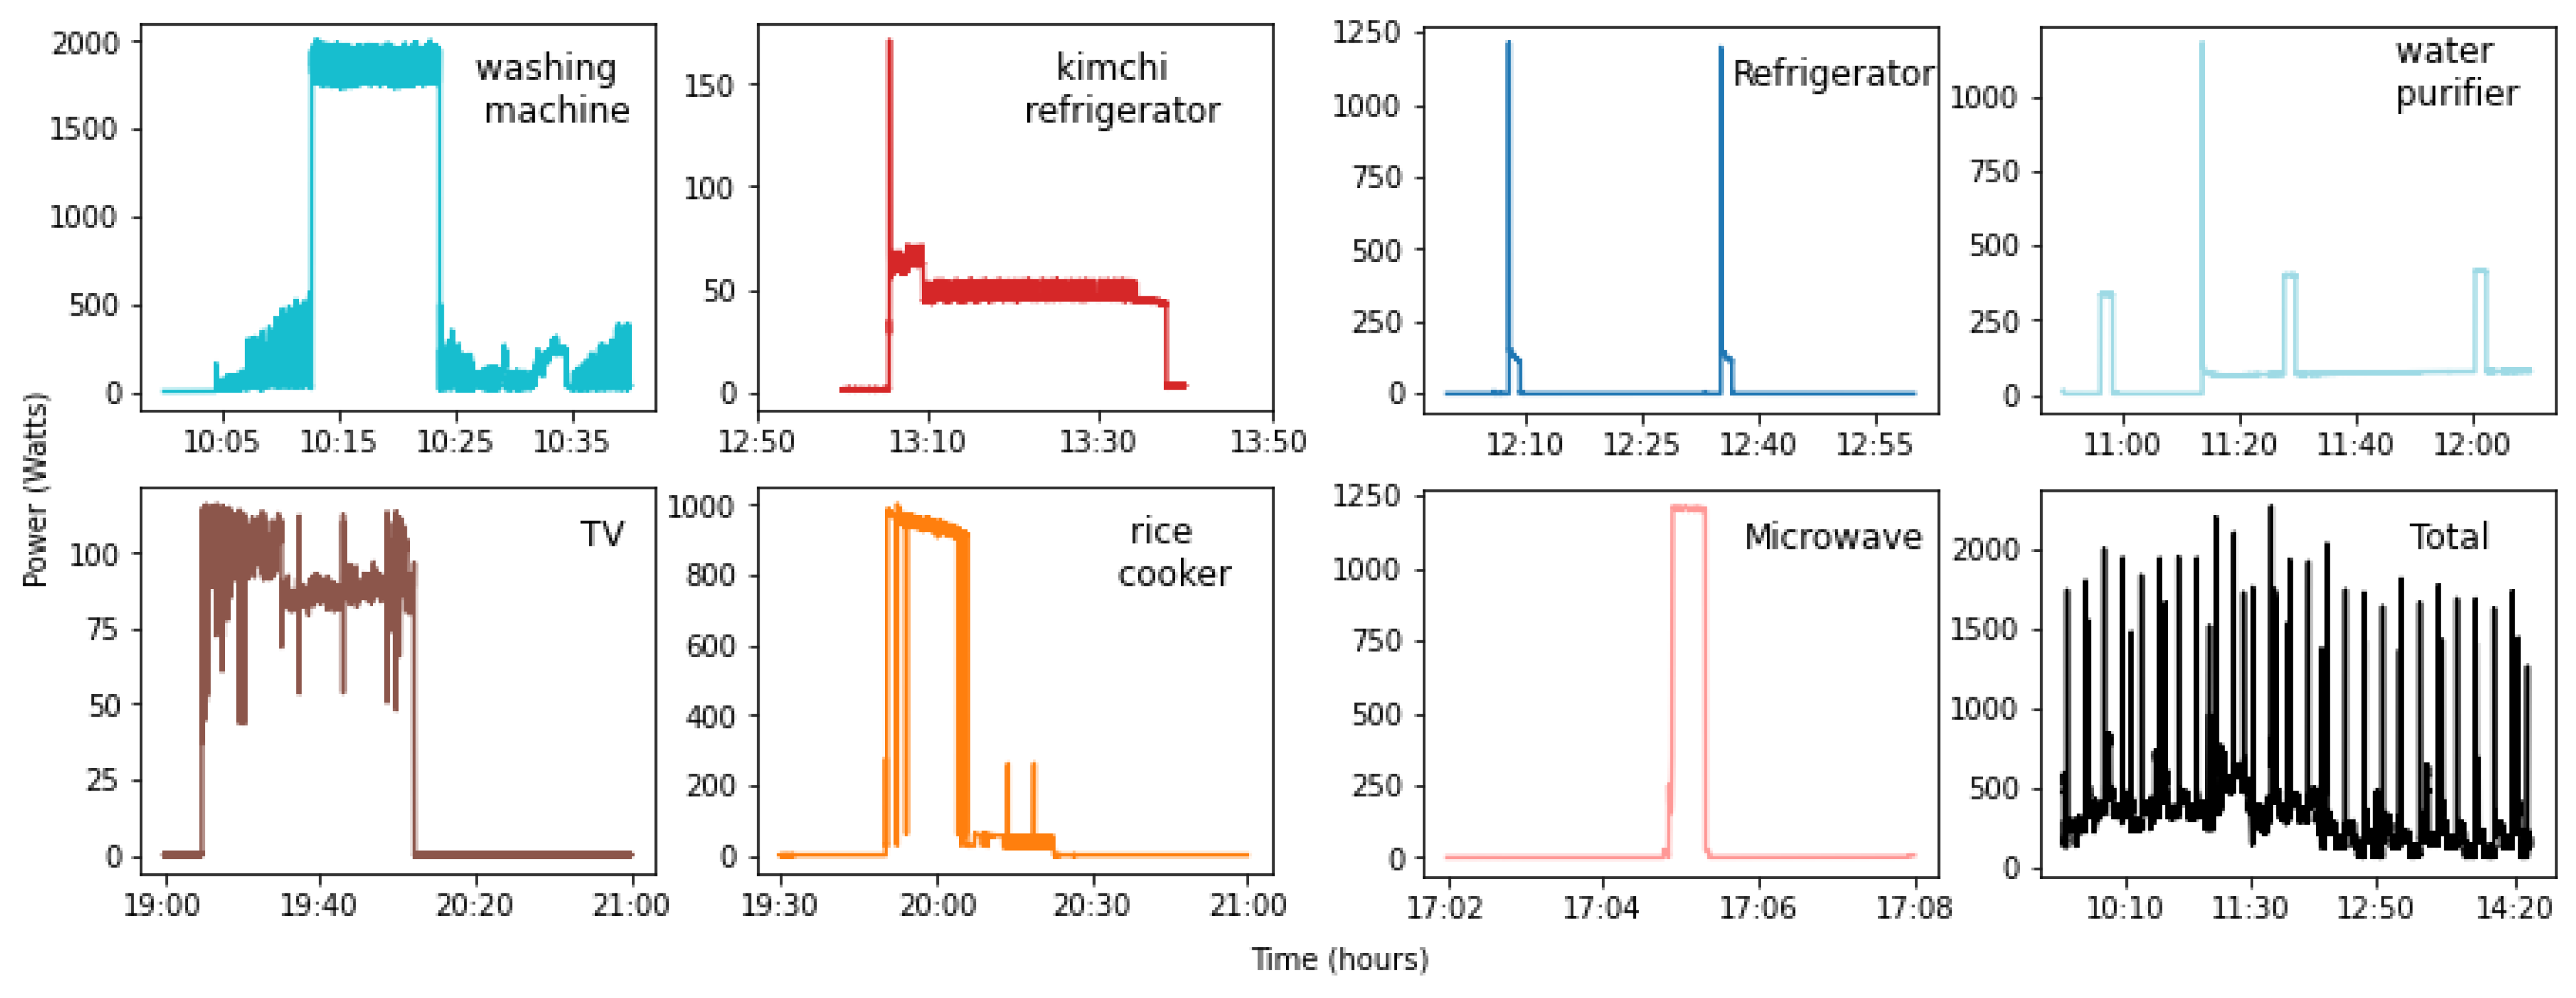
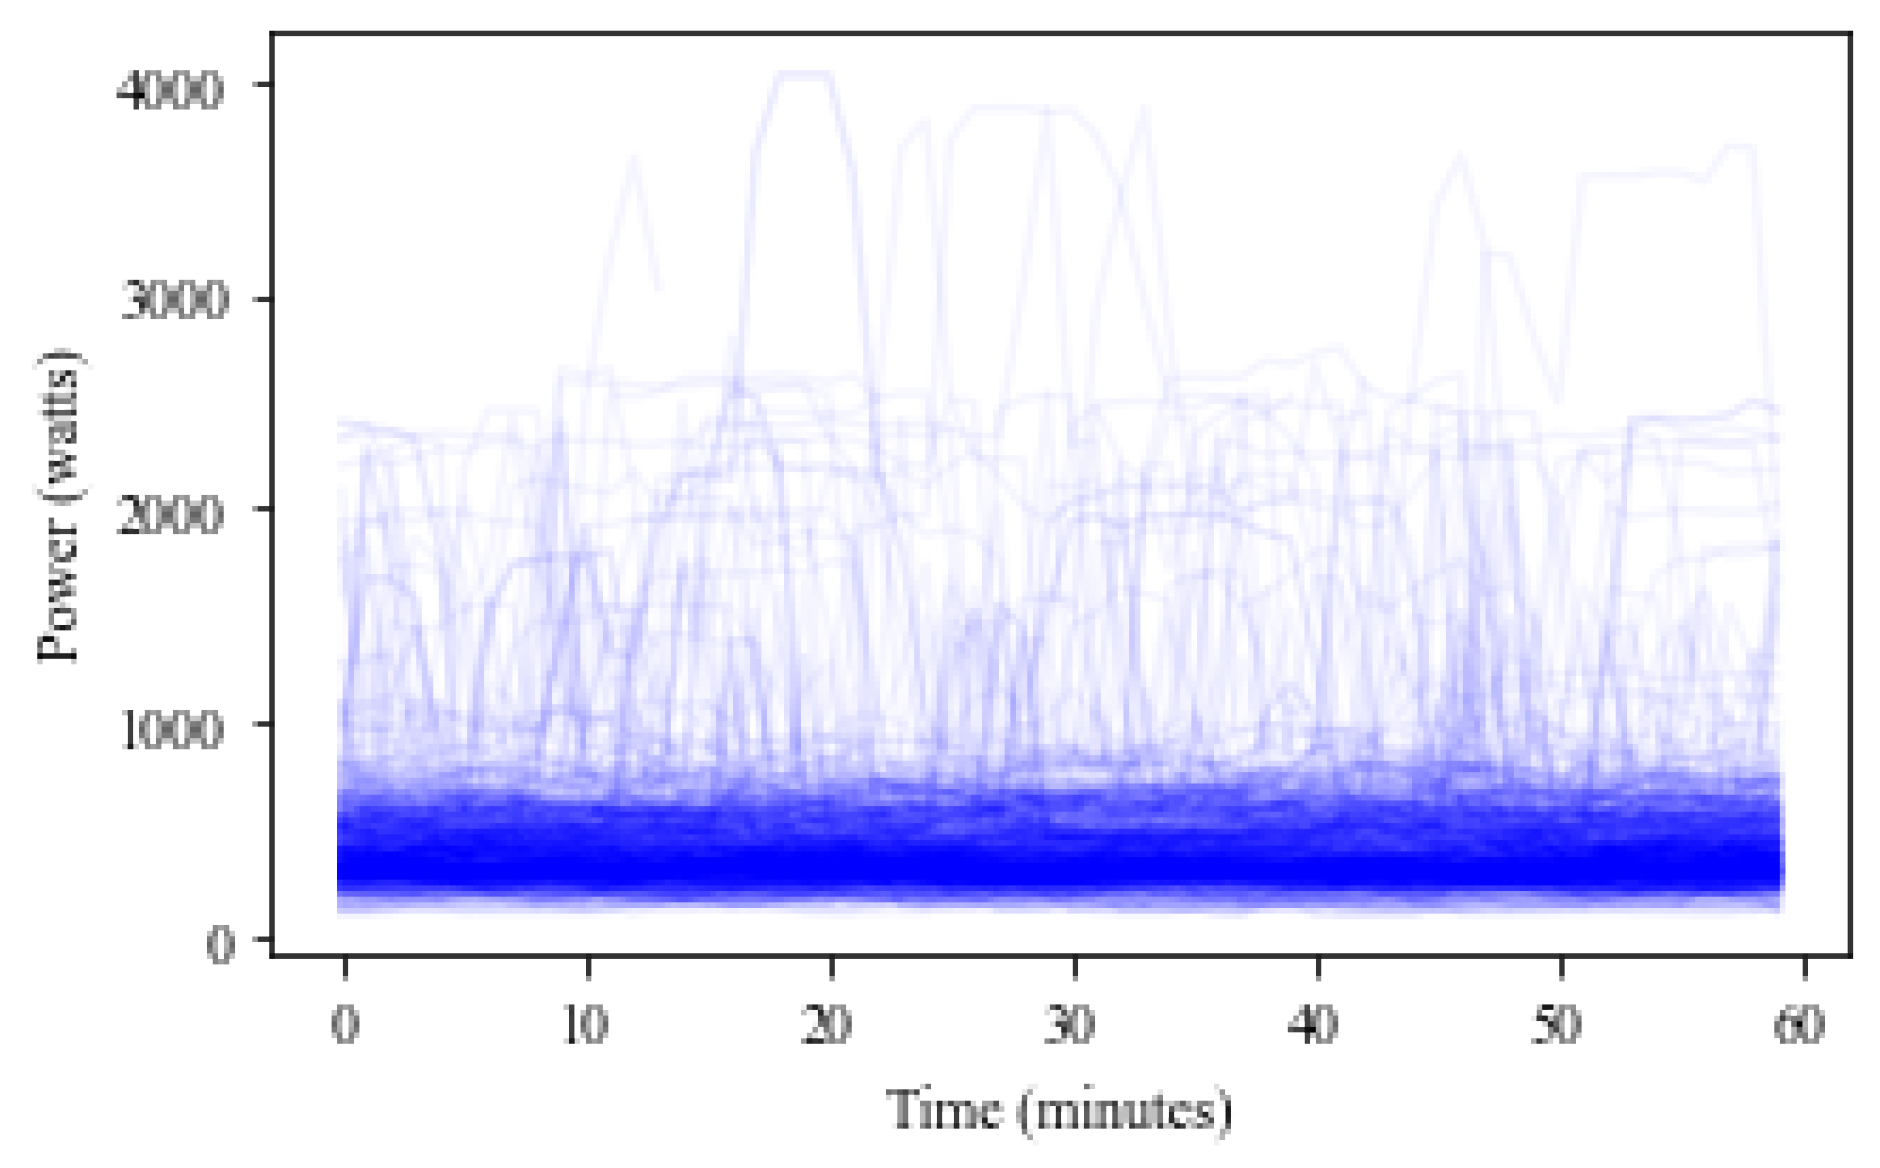
Data Preprocessing
3. Proposed Framework
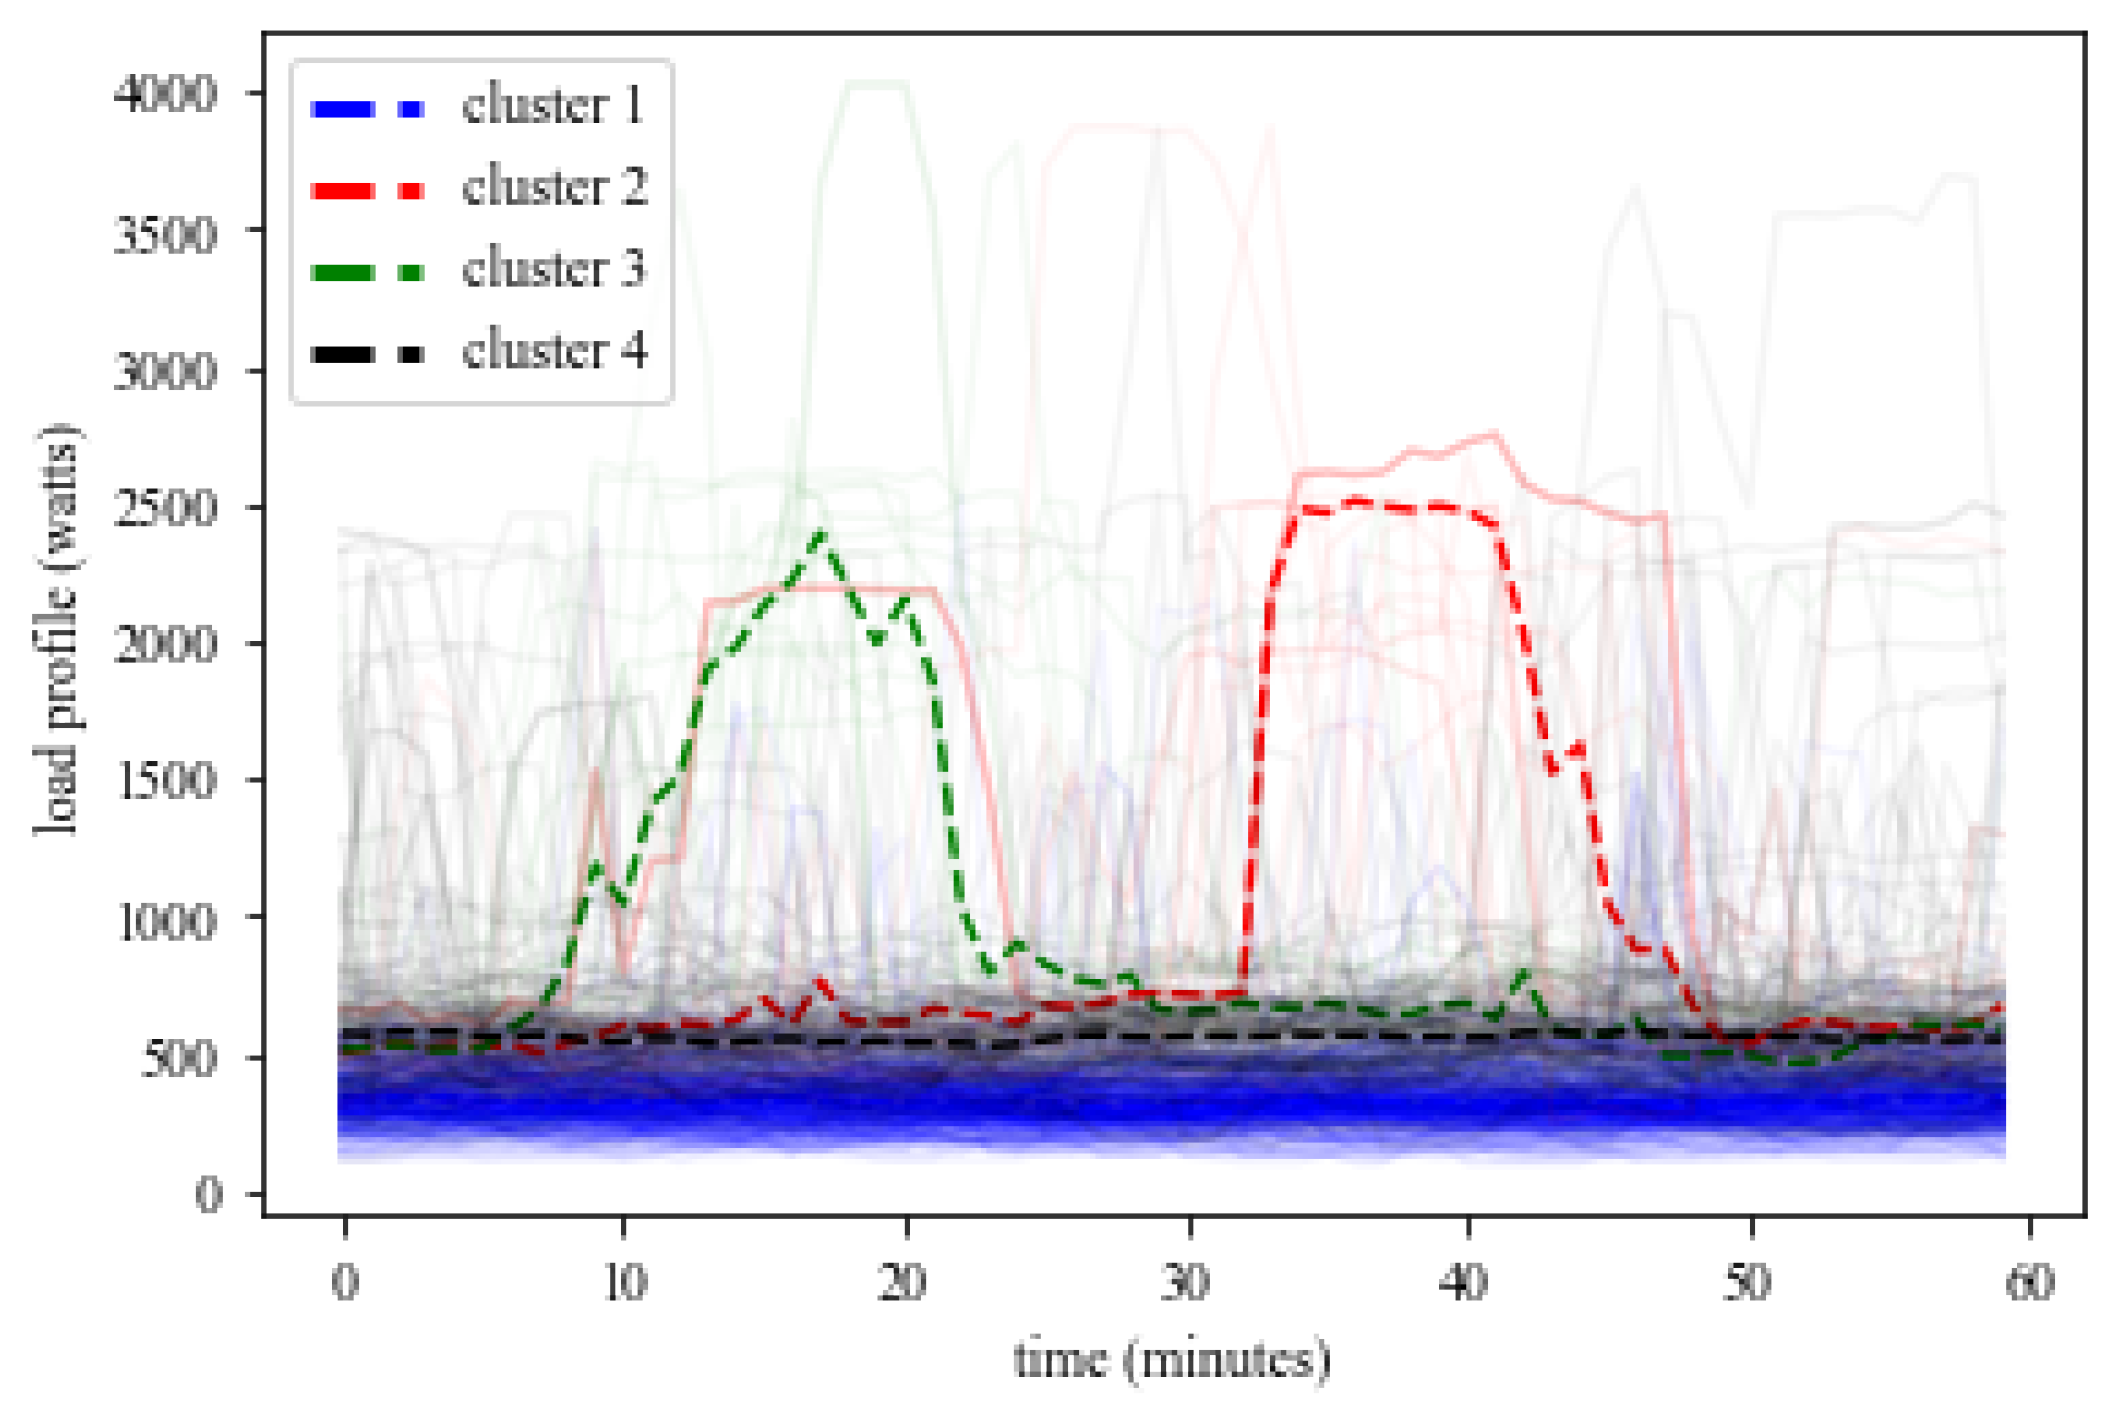
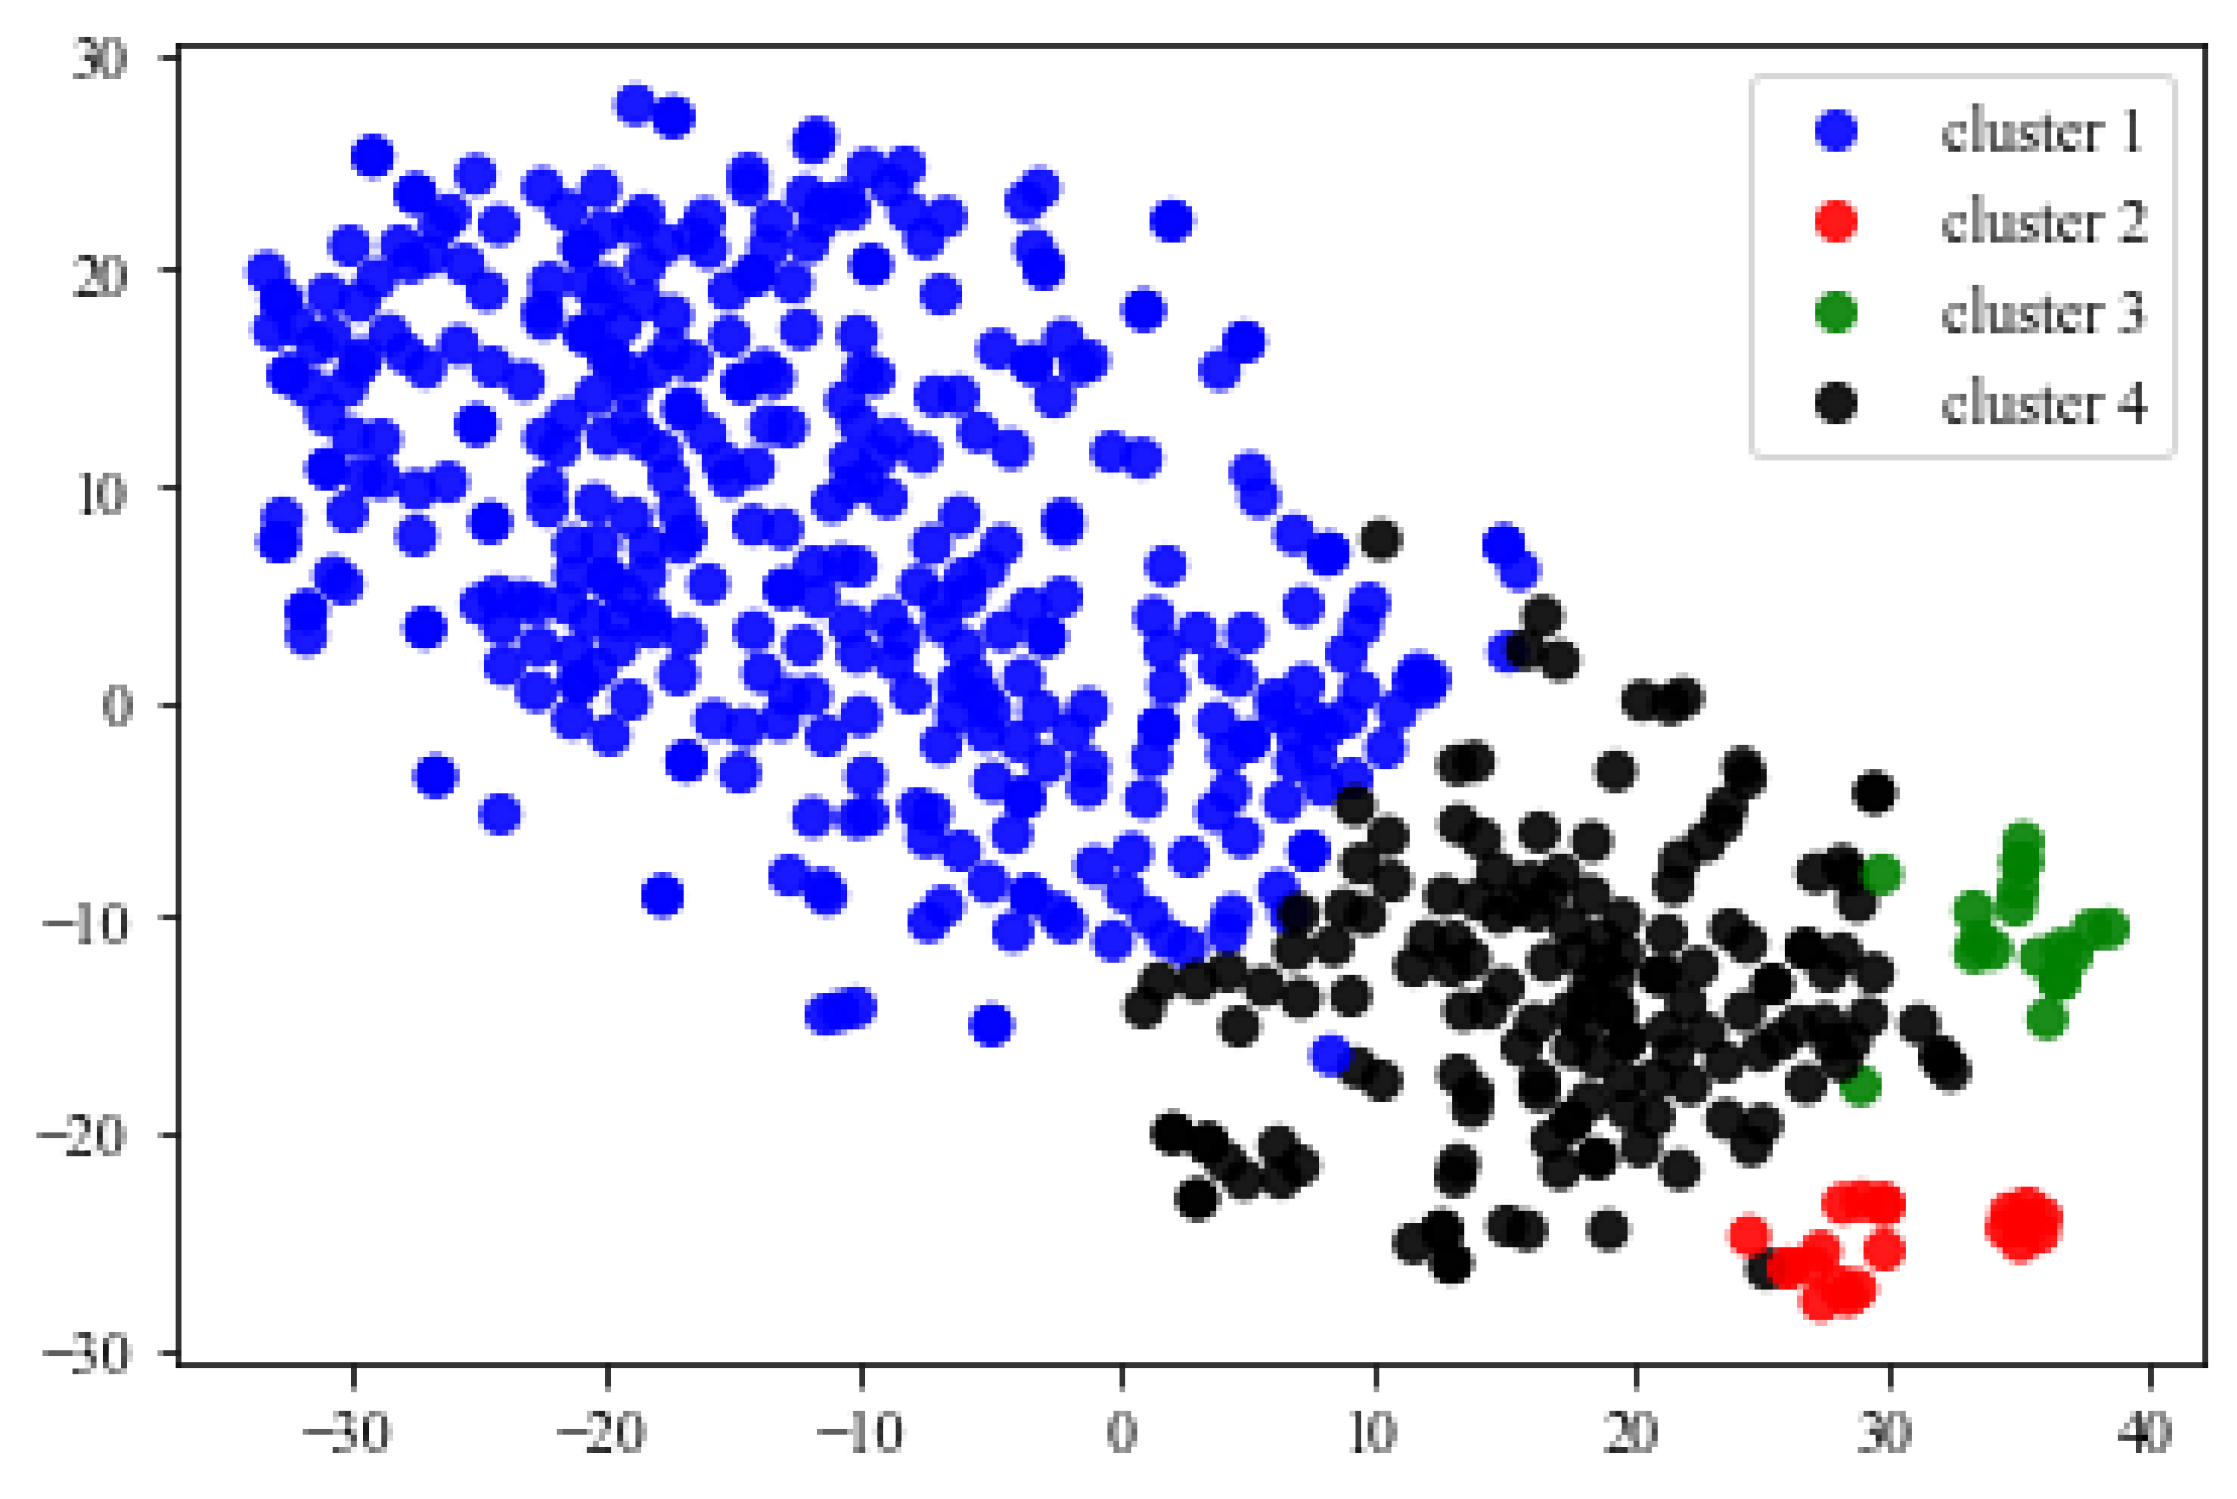
3.1. Multi-Step Time-Series Electric Load Clustering
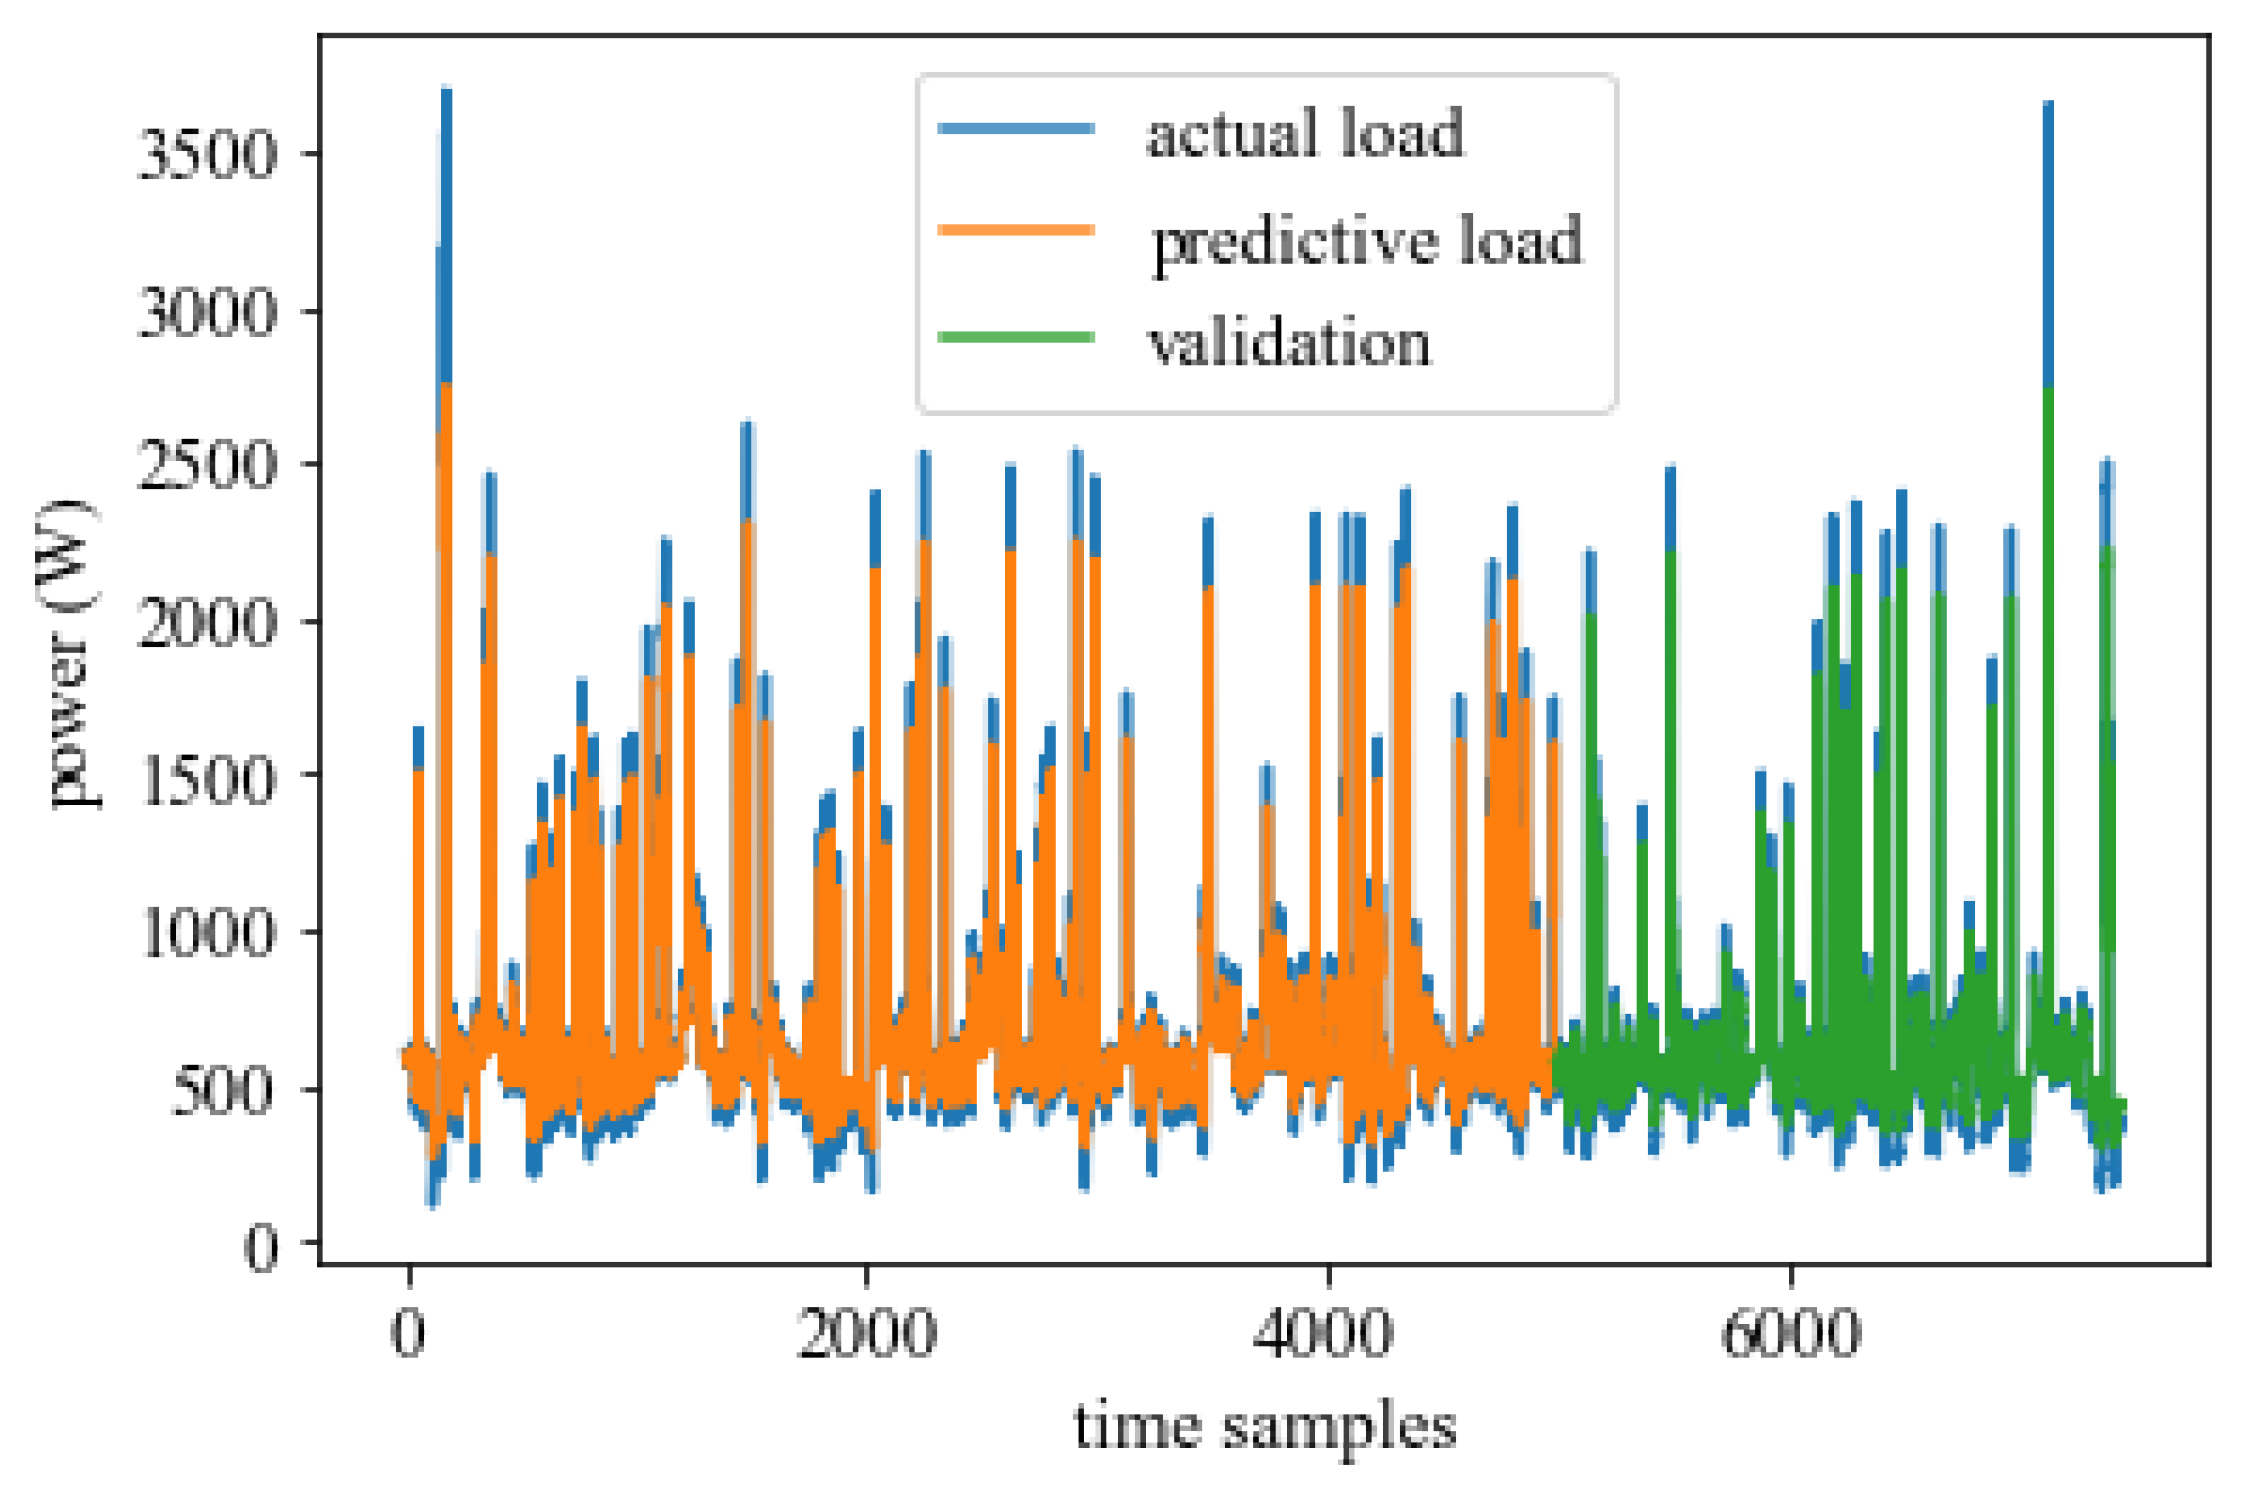
3.2. Forecast Multiload Profiles
4. Numerical Analysis
5. Conclusions
Author Contributions
Funding
Institutional Review Board Statement
Informed Consent Statement
Conflicts of Interest
References
- Ghosal, A.; Conti, M. Key management systems for smart grid advanced metering infrastructure: A survey. IEEE Commun. Surv. Tutor. 2019, 21, 2831–2848. [Google Scholar] [CrossRef] [Green Version]
- Desai, S.; Alhadad, R.; Chilamkurti, N.; Mahmood, A. A survey of privacy preserving schemes in IoE enabled smart grid advanced metering infrastructure. Clust. Comput. 2019, 22, 43–69. [Google Scholar] [CrossRef]
- Zainab, A.; Ghrayeb, A.; Syed, D.; Abu-Rub, H.; Refaat, S.S.; Bouhali, O. Big data management in smart grids: Technologies and challenges. IEEE Access 2021, 9, 73046–73059. [Google Scholar] [CrossRef]
- Masood, Z.; Ardiansyah; Choi, Y. Energy-Efficient Optimal Power Allocation for SWIPT Based IoT-Enabled Smart Meter. Sensors 2021, 21, 7857. [Google Scholar] [CrossRef]
- Chi, H.R.; Tsang, K.F.; Chui, K.T.; Chung, H.S.H.; Ling, B.W.K.; Lai, L.L. Interference-mitigated ZigBee-based advanced metering infrastructure. IEEE Trans. Ind. Inform. 2016, 12, 672–684. [Google Scholar] [CrossRef]
- Daki, H.; El Hannani, A.; Aqqal, A.; Haidine, A.; Dahbi, A. Big Data management in smart grid: Concepts, requirements and implementation. J. Big Data 2017, 4, 1–19. [Google Scholar] [CrossRef] [Green Version]
- Kotsiopoulos, T.; Sarigiannidis, P.; Ioannidis, D.; Tzovaras, D. Machine Learning and Deep Learning in Smart Manufacturing: The Smart Grid Paradigm. Comput. Sci. Rev. 2021, 40, 100341. [Google Scholar] [CrossRef]
- Janiesch, C.; Zschech, P.; Heinrich, K. Machine learning and deep learning. Electron. Mark. 2021, 31, 685–695. [Google Scholar] [CrossRef]
- Gantassi, R.; Gouissem, B.B.; Othmen, J.B. Routing protocol LEACH-K using K-means algorithm in wireless sensor network. In Proceedings of the Workshops of the International Conference on Advanced Information Networking and Applications, Caserta, Italy, 15–17 April 2020; pp. 299–309. [Google Scholar] [CrossRef]
- Gantassi, R.; Ben Gouissem, B.; Cheikhrouhou, O.; El Khediri, S.; Hasnaoui, S. Optimizing quality of service of clustering protocols in large-scale wireless sensor networks with mobile data collector and machine learning. Sec. Commun. Netw. 2021, 2021, 5531185. [Google Scholar] [CrossRef]
- Nguyen, G.; Dlugolinsky, S.; Bobák, M.; Tran, V.; García, Á.L.; Heredia, I.; Malík, P.; Hluchỳ, L. Machine learning and deep learning frameworks and libraries for large-scale data mining: A survey. Artif. Intell. Rev. 2019, 52, 77–124. [Google Scholar] [CrossRef] [Green Version]
- Hong, Y.; Zhou, Y.; Li, Q.; Xu, W.; Zheng, X. A deep learning method for short-term residential load forecasting in smart grid. IEEE Access 2020, 8, 55785–55797. [Google Scholar] [CrossRef]
- Shobol, A.; Ali, M.H.; Wadi, M.; TüR, M.R. Overview of big data in smart grid. In Proceedings of the 2019 8th International Conference on Renewable Energy Research and Applications (ICRERA), Brasov, Romania, 3–6 November 2019; pp. 1022–1025. [Google Scholar] [CrossRef]
- Li, N.; Wang, L.; Li, X.; Zhu, Q. An effective deep learning neural network model for short-term load forecasting. Concurr. Comput. Pract. Exp. 2020, 32, e5595. [Google Scholar] [CrossRef]
- Kim, S.H.; Lee, G.; Kwon, G.Y.; Kim, D.I.; Shin, Y.J. Deep learning based on multi-decomposition for short-term load forecasting. Energies 2018, 11, 3433. [Google Scholar] [CrossRef] [Green Version]
- Choi, H.; Ryu, S.; Kim, H. Short-term load forecasting based on ResNet and LSTM. In Proceedings of the 2018 IEEE International Conference on Communications, Control, and Computing Technologies for Smart Grids (SmartGridComm), Aalborg, Denmark, 29–31 October 2018; pp. 1–6. [Google Scholar] [CrossRef]
- Mohammad, F.; Kim, Y.C. Energy load forecasting model based on deep neural networks for smart grids. Int. J. Syst. Assur. Eng. Manag. 2020, 11, 824–834. [Google Scholar] [CrossRef]
- Jeong, D.; Park, C.; Ko, Y.M. Short-term electric load forecasting for buildings using logistic mixture vector autoregressive model with curve registration. Appl. Energy 2021, 282, 116249. [Google Scholar] [CrossRef]
- Syed, D.; Abu-Rub, H.; Ghrayeb, A.; Refaat, S.S.; Houchati, M.; Bouhali, O.; Bañales, S. Deep learning-based short-term load forecasting approach in smart grid with clustering and consumption pattern recognition. IEEE Access 2021, 9, 54992–55008. [Google Scholar] [CrossRef]
- Zhou, B.; Meng, Y.; Huang, W.; Wang, H.; Deng, L.; Huang, S.; Wei, J. Multi-energy net load forecasting for integrated local energy systems with heterogeneous prosumers. Int. J. Electr. Power Energy Syst. 2021, 126, 106542. [Google Scholar] [CrossRef]
- Masum, S.; Liu, Y.; Chiverton, J. Multi-step time series forecasting of electric load using machine learning models. In Proceedings of the International Conference on Artificial Intelligence and Soft Computing, Zakopane, Poland, 3–7 June 2018; pp. 148–159. [Google Scholar] [CrossRef] [Green Version]
- Yang, Y.; Shang, Z.; Chen, Y.; Chen, Y. Multi-objective particle swarm optimization algorithm for multi-step electric load forecasting. Energies 2020, 13, 532. [Google Scholar] [CrossRef] [Green Version]
- Nugraha, G.D.; Musa, A.; Cho, J.; Park, K.; Choi, D. Lambda-based data processing architecture for two-level load forecasting in residential buildings. Energies 2018, 11, 772. [Google Scholar] [CrossRef] [Green Version]
- Deng, Z.; Wang, B.; Xu, Y.; Xu, T.; Liu, C.; Zhu, Z. Multi-scale convolutional neural network with time-cognition for multi-step short-term load forecasting. IEEE Access 2019, 7, 88058–88071. [Google Scholar] [CrossRef]
- Izonin, I.; Tkachenko, R.; Kryvinska, N.; Tkachenko, P. Multiple linear regression based on coefficients identification using non-iterative SGTM neural-like structure. In Proceedings of the International Work-Conference on Artificial Neural Networks, Gran Canaria, Spain, 12–14 June 2019; pp. 467–479. [Google Scholar] [CrossRef]
- Tkachenko, R.; Izonin, I. Model and principles for the implementation of neural-like structures based on geometric data transformations. In Proceedings of the International Conference on Computer Science, Engineering and Education Applications, Kiev, Ukraine, 18–20 January 2018; pp. 578–587. [Google Scholar] [CrossRef]
- Ribeiro, M.H.D.M.; Stefenon, S.F.; de Lima, J.D.; Nied, A.; Mariani, V.C.; Coelho, L.d.S. Electricity price forecasting based on self-adaptive decomposition and heterogeneous ensemble learning. Energies 2020, 13, 5190. [Google Scholar] [CrossRef]
- Bouktif, S.; Fiaz, A.; Ouni, A.; Serhani, M.A. Optimal deep learning LSTM model for electric load forecasting using feature selection and genetic algorithm: Comparison with machine learning approaches. Energies 2018, 11, 1636. [Google Scholar] [CrossRef] [Green Version]
- Kim, T.Y.; Cho, S.B. Predicting residential energy consumption using CNN-LSTM neural networks. Energy 2019, 182, 72–81. [Google Scholar] [CrossRef]
- Yildiz, B.; Bilbao, J.I.; Dore, J.; Sproul, A. Household electricity load forecasting using historical smart meter data with clustering and classification techniques. In Proceedings of the 2018 IEEE Innovative Smart Grid Technologies-Asia (ISGT Asia), Singapore, 22–25 May 2018; pp. 873–879. [Google Scholar] [CrossRef]
- Shin, C.; Lee, E.; Han, J.; Yim, J.; Rhee, W.; Lee, H. The ENERTALK dataset, 15 Hz electricity consumption data from 22 houses in Korea. Sci. Data 2019, 6, 1–13. [Google Scholar] [CrossRef] [PubMed]
- Ayub, M.; El-Alfy, E.S.M. Impact of Normalization on BiLSTM Based Models for Energy Disaggregation. In Proceedings of the 2020 International Conference on Data Analytics for Business and Industry: Way Towards a Sustainable Economy (ICDABI), Sakheer, Bahrain, 26–27 October 2020; pp. 1–6. [Google Scholar] [CrossRef]
- Anderson, D.R.; Burnham, K.P.; Thompson, W.L. Null hypothesis testing: Problems, prevalence, and an alternative. J. Wildl. Manag. 2000, 64, 912–923. [Google Scholar] [CrossRef]
- Sherstinsky, A. Fundamentals of recurrent neural network (RNN) and long short-term memory (LSTM) network. Phys. D Nonlinear Phenom. 2020, 404, 132306. [Google Scholar] [CrossRef] [Green Version]
- Sutskever, I.; Vinyals, O.; Le, Q.V. Sequence to sequence learning with neural networks. Adv. Neural Inform. Process. Syst. 2014, 27, 1–9. [Google Scholar]
- Bock, S.; Weiß, M. A proof of local convergence for the Adam optimizer. In Proceedings of the 2019 International Joint Conference on Neural Networks (IJCNN), Budapest, Hungary, 14–19 July 2019; pp. 1–8. [Google Scholar] [CrossRef]
- Srivastava, N.; Hinton, G.; Krizhevsky, A.; Sutskever, I.; Salakhutdinov, R. Dropout: A simple way to prevent neural networks from overfitting. J. Mach. Learn. Res. 2014, 15, 1929–1958. [Google Scholar]
- Ahsan, M.M.; Mahmud, M.; Saha, P.K.; Gupta, K.D.; Siddique, Z. Effect of data scaling methods on machine learning algorithms and model performance. Technologies 2021, 9, 52. [Google Scholar] [CrossRef]
- Memarzadeh, G.; Keynia, F. Short-term electricity load and price forecasting by a new optimal LSTM-NN based prediction algorithm. Electr. Power Syst. Res. 2021, 192, 106995. [Google Scholar] [CrossRef]
- Veeramsetty, V.; Reddy, K.R.; Santhosh, M.; Mohnot, A.; Singal, G. Short-term electric power load forecasting using random forest and gated recurrent unit. Electr. Eng. 2022, 104, 307–329. [Google Scholar] [CrossRef]
- Mughees, N.; Mohsin, S.A.; Mughees, A.; Mughees, A. Deep sequence to sequence Bi-LSTM neural networks for day-ahead peak load forecasting. Expert Syst. Appl. 2021, 175, 114844. [Google Scholar] [CrossRef]


| Parameters | Value |
|---|---|
| Forecasting model | GRU, RNN, BiLSTM, Seq2Seq LSTM |
| Training dataset | of the total input |
| Testing dataset | of the total input |
| Validation split | of the train dataset |
| Minmax normalization | to 1 |
| Regularization | dropout each layer |
| Number of sequence | 64 units |
| Number of lookback | 60, 120, and 180 periods |
| Nnumber of maximal epochs | 100 |
| Optimization algorithm | Adam |
| Testing evaluation metrics | MAE, MAPE, RMSE |
| Forecasting Models | MAE | MAPE | RMSE |
|---|---|---|---|
| LSTM 60 timesteps | 44.3 | 11.93 | 92.91 |
| RNN 60 timesteps | 55.7 | 17.99 | 102.37 |
| GRU 60 timesteps | 39.2 | 12.20 | 84.97 |
| BiLSTM 60 timesteps | 40.3 | 12.32 | 88.41 |
| Seq2Seq LSTM 60 timesteps (proposed) | 35.1 | 10.93 | 82.75 |
| LSTM 120 timesteps | 50.9 | 16.22 | 98.35 |
| RNN 120 timesteps | 61.2 | 20.10 | 109.28 |
| GRU 120 timesteps | 36.6 | 10.87 | 82.71 |
| BiLSTM 120 timesteps | 47.2 | 13.23 | 91.63 |
| Seq2Seq LSTM 120 timesteps (proposed) | 46.5 | 12.22 | 86.50 |
| LSTM 180 timesteps | 48.9 | 13.09 | 99.50 |
| RNN 180 timesteps | 67.3 | 22.47 | 113.92 |
| GRU 180 timesteps | 42.9 | 13.25 | 88.60 |
| BiLSTM 180 timesteps | 41.6 | 11.19 | 89.75 |
| Seq2Seq LSTM 180 timesteps (proposed) | 38.5 | 13.32 | 88.65 |
Publisher’s Note: MDPI stays neutral with regard to jurisdictional claims in published maps and institutional affiliations. |
© 2022 by the authors. Licensee MDPI, Basel, Switzerland. This article is an open access article distributed under the terms and conditions of the Creative Commons Attribution (CC BY) license (https://creativecommons.org/licenses/by/4.0/).
Share and Cite
Masood, Z.; Gantassi, R.; Ardiansyah; Choi, Y. A Multi-Step Time-Series Clustering-Based Seq2Seq LSTM Learning for a Single Household Electricity Load Forecasting. Energies 2022, 15, 2623. https://doi.org/10.3390/en15072623
Masood Z, Gantassi R, Ardiansyah, Choi Y. A Multi-Step Time-Series Clustering-Based Seq2Seq LSTM Learning for a Single Household Electricity Load Forecasting. Energies. 2022; 15(7):2623. https://doi.org/10.3390/en15072623
Chicago/Turabian StyleMasood, Zaki, Rahma Gantassi, Ardiansyah, and Yonghoon Choi. 2022. "A Multi-Step Time-Series Clustering-Based Seq2Seq LSTM Learning for a Single Household Electricity Load Forecasting" Energies 15, no. 7: 2623. https://doi.org/10.3390/en15072623
APA StyleMasood, Z., Gantassi, R., Ardiansyah, & Choi, Y. (2022). A Multi-Step Time-Series Clustering-Based Seq2Seq LSTM Learning for a Single Household Electricity Load Forecasting. Energies, 15(7), 2623. https://doi.org/10.3390/en15072623