Article

Power Generation Prediction of Building-Integrated Photovoltaic System with Colored Modules Using Machine Learning

1
Photovoltaics Research Department, Korea Institute of Energy Research, 152 Gajeong-ro, Youseong-gu, Daejeon 34129, Korea
2
Corporate R&D Center, SG Energy Co., Ltd., 75, Sinilseo-ro 85 beon-gil, Daedeok-gu, Daejeon 34325, Korea
*
Author to whom correspondence should be addressed.
Energies 2022, 15(7), 2589; https://doi.org/10.3390/en15072589
Submission received: 16 March 2022 / Revised: 29 March 2022 / Accepted: 31 March 2022 / Published: 1 April 2022

Abstract

:
The building-integrated photovoltaic (BIPV) system is provoking mention as a technology for generating the energy consumed in cities with renewable sources. As the number of BIPV systems increases, performance diagnosis through power-generation predictions becomes more essential. In the case of a colored BIPV module that has been installed on a wall, it is more difficult to predict the amount of power generation because the shading loss varies based on the entrance altitude of the irradiance. Recently, artificial intelligence technology that is able to predict power by learning the output data of the system has begun being used. In this paper, the power values of colored BIPV systems that have been installed on walls are predicted, and the system output values are compared. The current-voltage (I–V) curve data are measured to predict the power required changing the intensity of the irradiance, and the linear regression model is derived for the changes in the voltage and current at a maximum power operating point and during irradiance changes. To improve the power prediction accuracy by considering the shading loss of colored BIPVs, a new model is proposed via neural network machine learning (ML). In addition, the accuracy of the proposed prediction models is evaluated by comparing the metrics such as RMSE, MAE, and R2. As a result of testing the linear regression model and the proposed ML model, the R2 values for the voltage and current values of the proposed ML model were 5% higher for voltage and 2% higher for current. From this result, the proposed ML model of the RMSE about real power improved by more than 50% (0.0754 kW) compared to the simulation model (0.1581 KW). The proposed model demonstrates high-accuracy power estimations and is expected to help diagnose the performance of BIPV systems with colored modules.

1. Introduction

According to ‘IEA (2020) World Energy Statistics and Balances’, building energy accounts for about 35% of global energy consumption and about 38% of carbon dioxide emissions [1]. In the case of South Korea, buildings larger than 1000 m2 have been required to be zero-energy buildings since 2020 in order to reduce national greenhouse gas emissions by 2030. The mandatory zero-energy building policy is a system that mandates the use of new and renewable energy facilities in buildings to replace the use of fossil-fuel-based energy in buildings with new and renewable sources of energy. To comply with this policy, the barriers and challenges for applying the BIPV system for zero-energy city realization in Europe were categorized and detailed [2]. Research was also conducted to optimize energy production and consumption by developing a geographical urban units delimitation (GUUD) model combined with geographical information systems (GIS) as a cellular approach for net-zero city realization [3]. A conference was held to extract the definitions of ‘confusion’ from the existing zero-energy building and refurbish them [4].
The most widely applied source of renewable energy in zero-energy buildings is solar. The photovoltaic (PV) modules that can be applied to buildings are called building-integrated photovoltaic (BIPV) modules, and PV modules serve the dual function of being a power generator and a building skin that is able to replace conventional building materials [5]. Studies have been conducted on how to improve the efficiency of solar cells to increase the output of PV modules in terms of power generation. Among them, crystalline silicon solar cells increase efficiency by improving the method for increasing the purity of the wafer and the process of the solar cell [6,7]. Recently, a third-generation solar cell technology, perovskite solar cells, has been developed, and various studies are being conducted on the material and structure of these new types of solar cells [8,9].
BIPV systems have mainly been installed on the roofs of buildings, but recently installations on the walls of buildings are becoming more common [10]. A general ground-type photovoltaic system requires an installation area. However, a BIPV does not require a separate installation area. A BIPV can be installed on the roofs, windows, or walls of buildings. According to a paper that conducted a 3D city model analysis, the irradiance on building facades was analyzed as having economic potential [11]. In general, BIPV modules that have been manufactured using crystalline silicon solar cells have poor aesthetics. In order to overcome this issue, technological developments for the production of colored BIPV modules are being carried out. As a technology to implement color in PV modules, colored PV cells, encapsulant, and bulk materials for front/back cover are used. [12,13].
With the development of energy policies and module technology for the development of colored BIPVs, the number of BIPV systems applied to buildings is increasing. As the number of BIPV systems increases, a monitoring system to manage power generation has become more essential. A general monitoring system is used for the purposes of checking the amount of electricity generated by the system. Research was conducted to improve accuracy and reduce costs by developing the hardware and software used in monitoring systems [14,15]. However, since the monitoring system only measures the PV system’s current in power generation, it is difficult to check whether the PV system is normal. Therefore, various studies have been conducted to predict the amount of power generation in PV systems. Studies have been conducted to develop a simplified model to predict the power generation of a PV system and to compare it with TRNSYS and PVsyst [16]. A study statistically predicting power generation using the correlation between weather variables and PV power has been published [17]. As a power generation forecasting technology, a model reflecting irradiance variations caused by cloud shadow and a model analyzing irradiance data were developed, and their performance was validated via a comparative analysis with data measured from PV power plants [18,19]. Other results for power generation predictions in BIPV systems using a PV module with a thermal model and meteorological data have also been presented [20]. Using power generation prediction technology, it is possible to diagnose solar power performance and failure.
Recently, artificial intelligence (AI) technology that is able to predict power by learning the output data of the system has started to be used [21]. For short-term power predictions in BIPV systems, another study evaluated a learning algorithm using a recurrent neural network and improved the prediction accuracy by applying feature engineering [22]. Among machine learning methods, linear regression coefficients were applied to the NN, QSVM, and TREE algorithms to improve the accuracy of power generation predictions in BIPV systems [23]. The effect of environmental parameters on the output power of the PV module was analyzed, and the output of the PV system was predicted by training several multiple-regression models and artificial neural network-based prediction models [24]. A new procedure based on the PNN classifier was studied for DC fault detection, as well as for the diagnosis of PV systems, and its effectiveness was verified in a grid-connected system [25].
However, in past power generation prediction methods that have used big data, if data measured during a system failure are included, then the prediction error of the power increases. The shading loss that is due to the colored dot pattern on colored BIPV modules is the main cause of the difficulty in predicting the power. In particular, in the case of a colored BIPV module installed on a wall, it is more difficult to predict the power generation because the shading loss varies based on the entrance altitude of the irradiance.
In this paper, the output I–V curve data were measured to predict the power required to change the intensity of the irradiance, and the linear regression equation was derived to determine the change in the voltage and current at the maximum power operating point and to change the irradiance. Commercial power prediction tools (PVsyst and Solar Pro) have a prediction error for specific cases because the prediction model does not accurately reflect solar cell characteristics. The fill factor of solar cells increases as the irradiance intensity decreases. A power prediction model that applies the fill factor characteristic has a more accurate response. The power of colored BIPV systems that have been installed on walls was predicted, and the system output values were compared. Using these results, a predicting method for colored BIPV systems that are different from other commercial systems was presented. To improve the power prediction accuracy by considering the shading loss of colored BIPV systems, meteorological data were measured for 7 months and data calculated with a linear regression model were generated as training data. For the generated data, a new model with an improved power prediction accuracy that was developed based on neural network machine learning was proposed. In addition, the superiority of the proposed prediction method was validated by comparing the error rate (such as RMA and RMSE) of the prediction method by considering the amount of contamination or reflection in the surface and the predictions for the amount of power generation were determined through data learning using the environmental data.

2. Colored BIPV Systems with Data Measuring Equipment

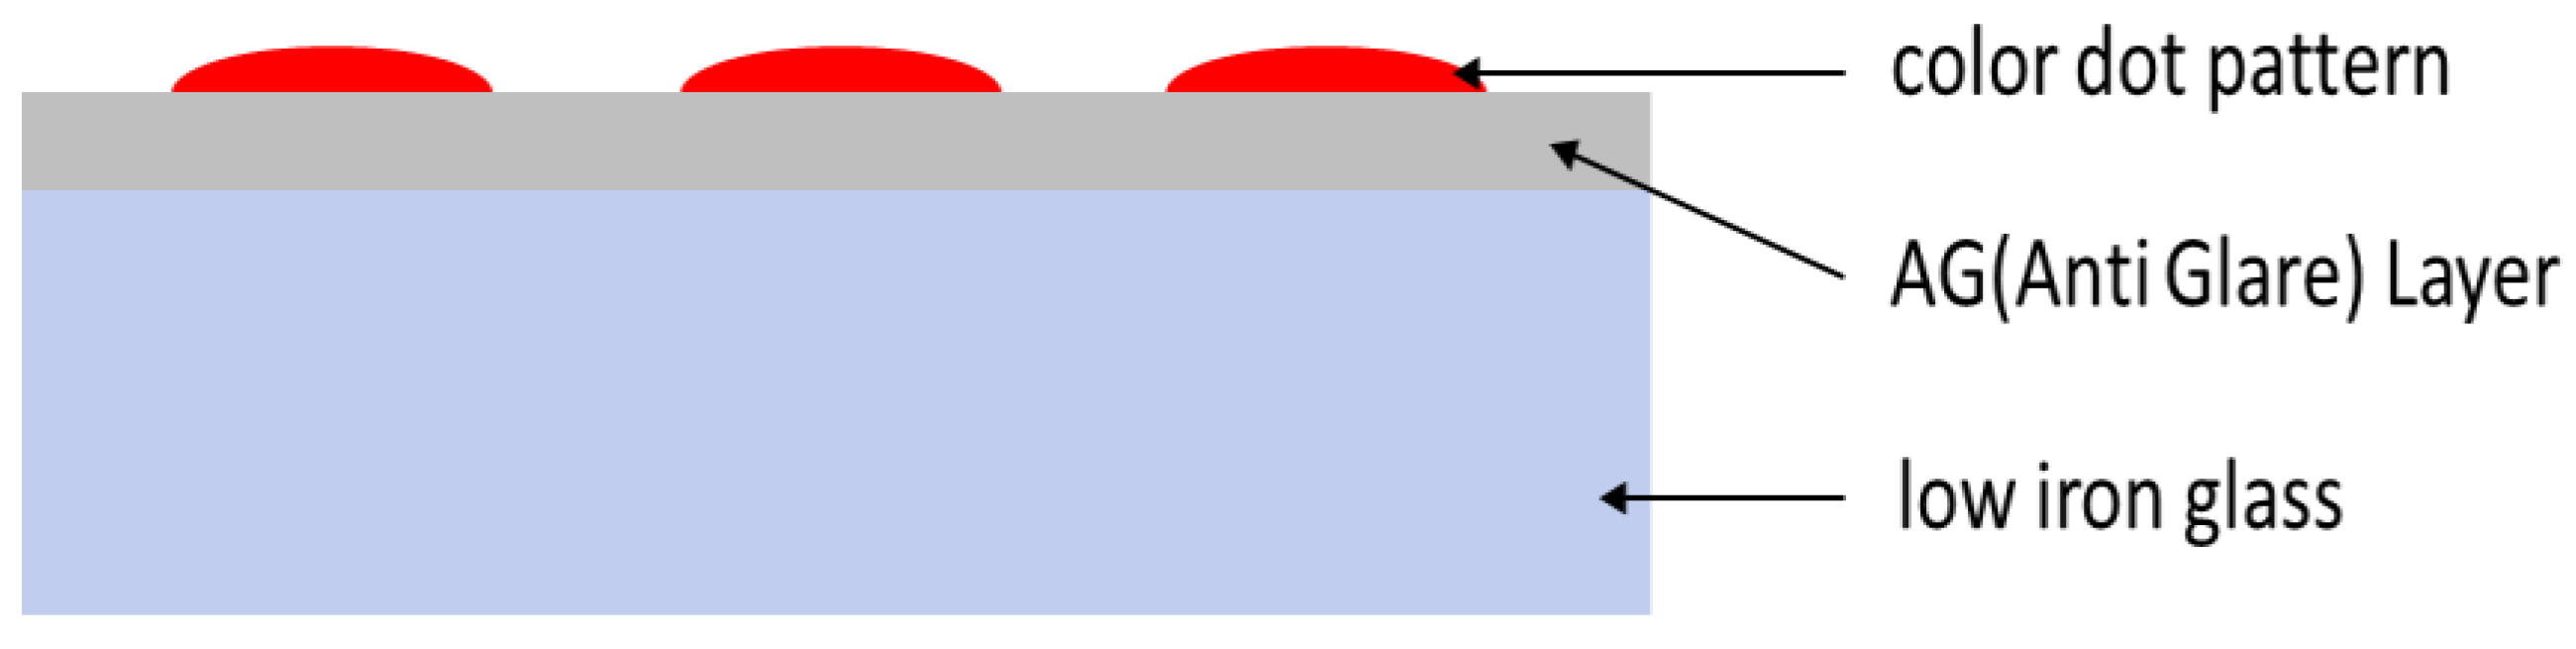
2.1. A Colored BIPV Module Implementation Method and Structure

The colored BIPV module was manufactured by the general PV module manufacturing method. When it was manufactured, instead of using a general module frame, an aluminum sidebar was attached to the back of the module to fix it to a wall. A piece of colored glass with a thickness of 5 mm was used on the front of the module to create various colors, as shown in Figure 1. Additionally, a black back sheet was used on the back.
The colored glass was created by printing colored ceramic pigments using the screen-printing method, and it was then fired to have a coverage of about 25% on low-iron glass that had been treated with an anti-glare (AG) layer. The structure of the manufactured colored glass is shown in Figure 2. Figure 3 shows an enlarged photo of the red glass, showing the fusion of the red ceramic pigments on the crystal portion of the AG layer. The colored BIPV module that was manufactured using the dot pattern method has the same electrical characteristics with no output deviations for the different colors. Table 1 shows the electrical characteristics of each of the colored BIPV modules.

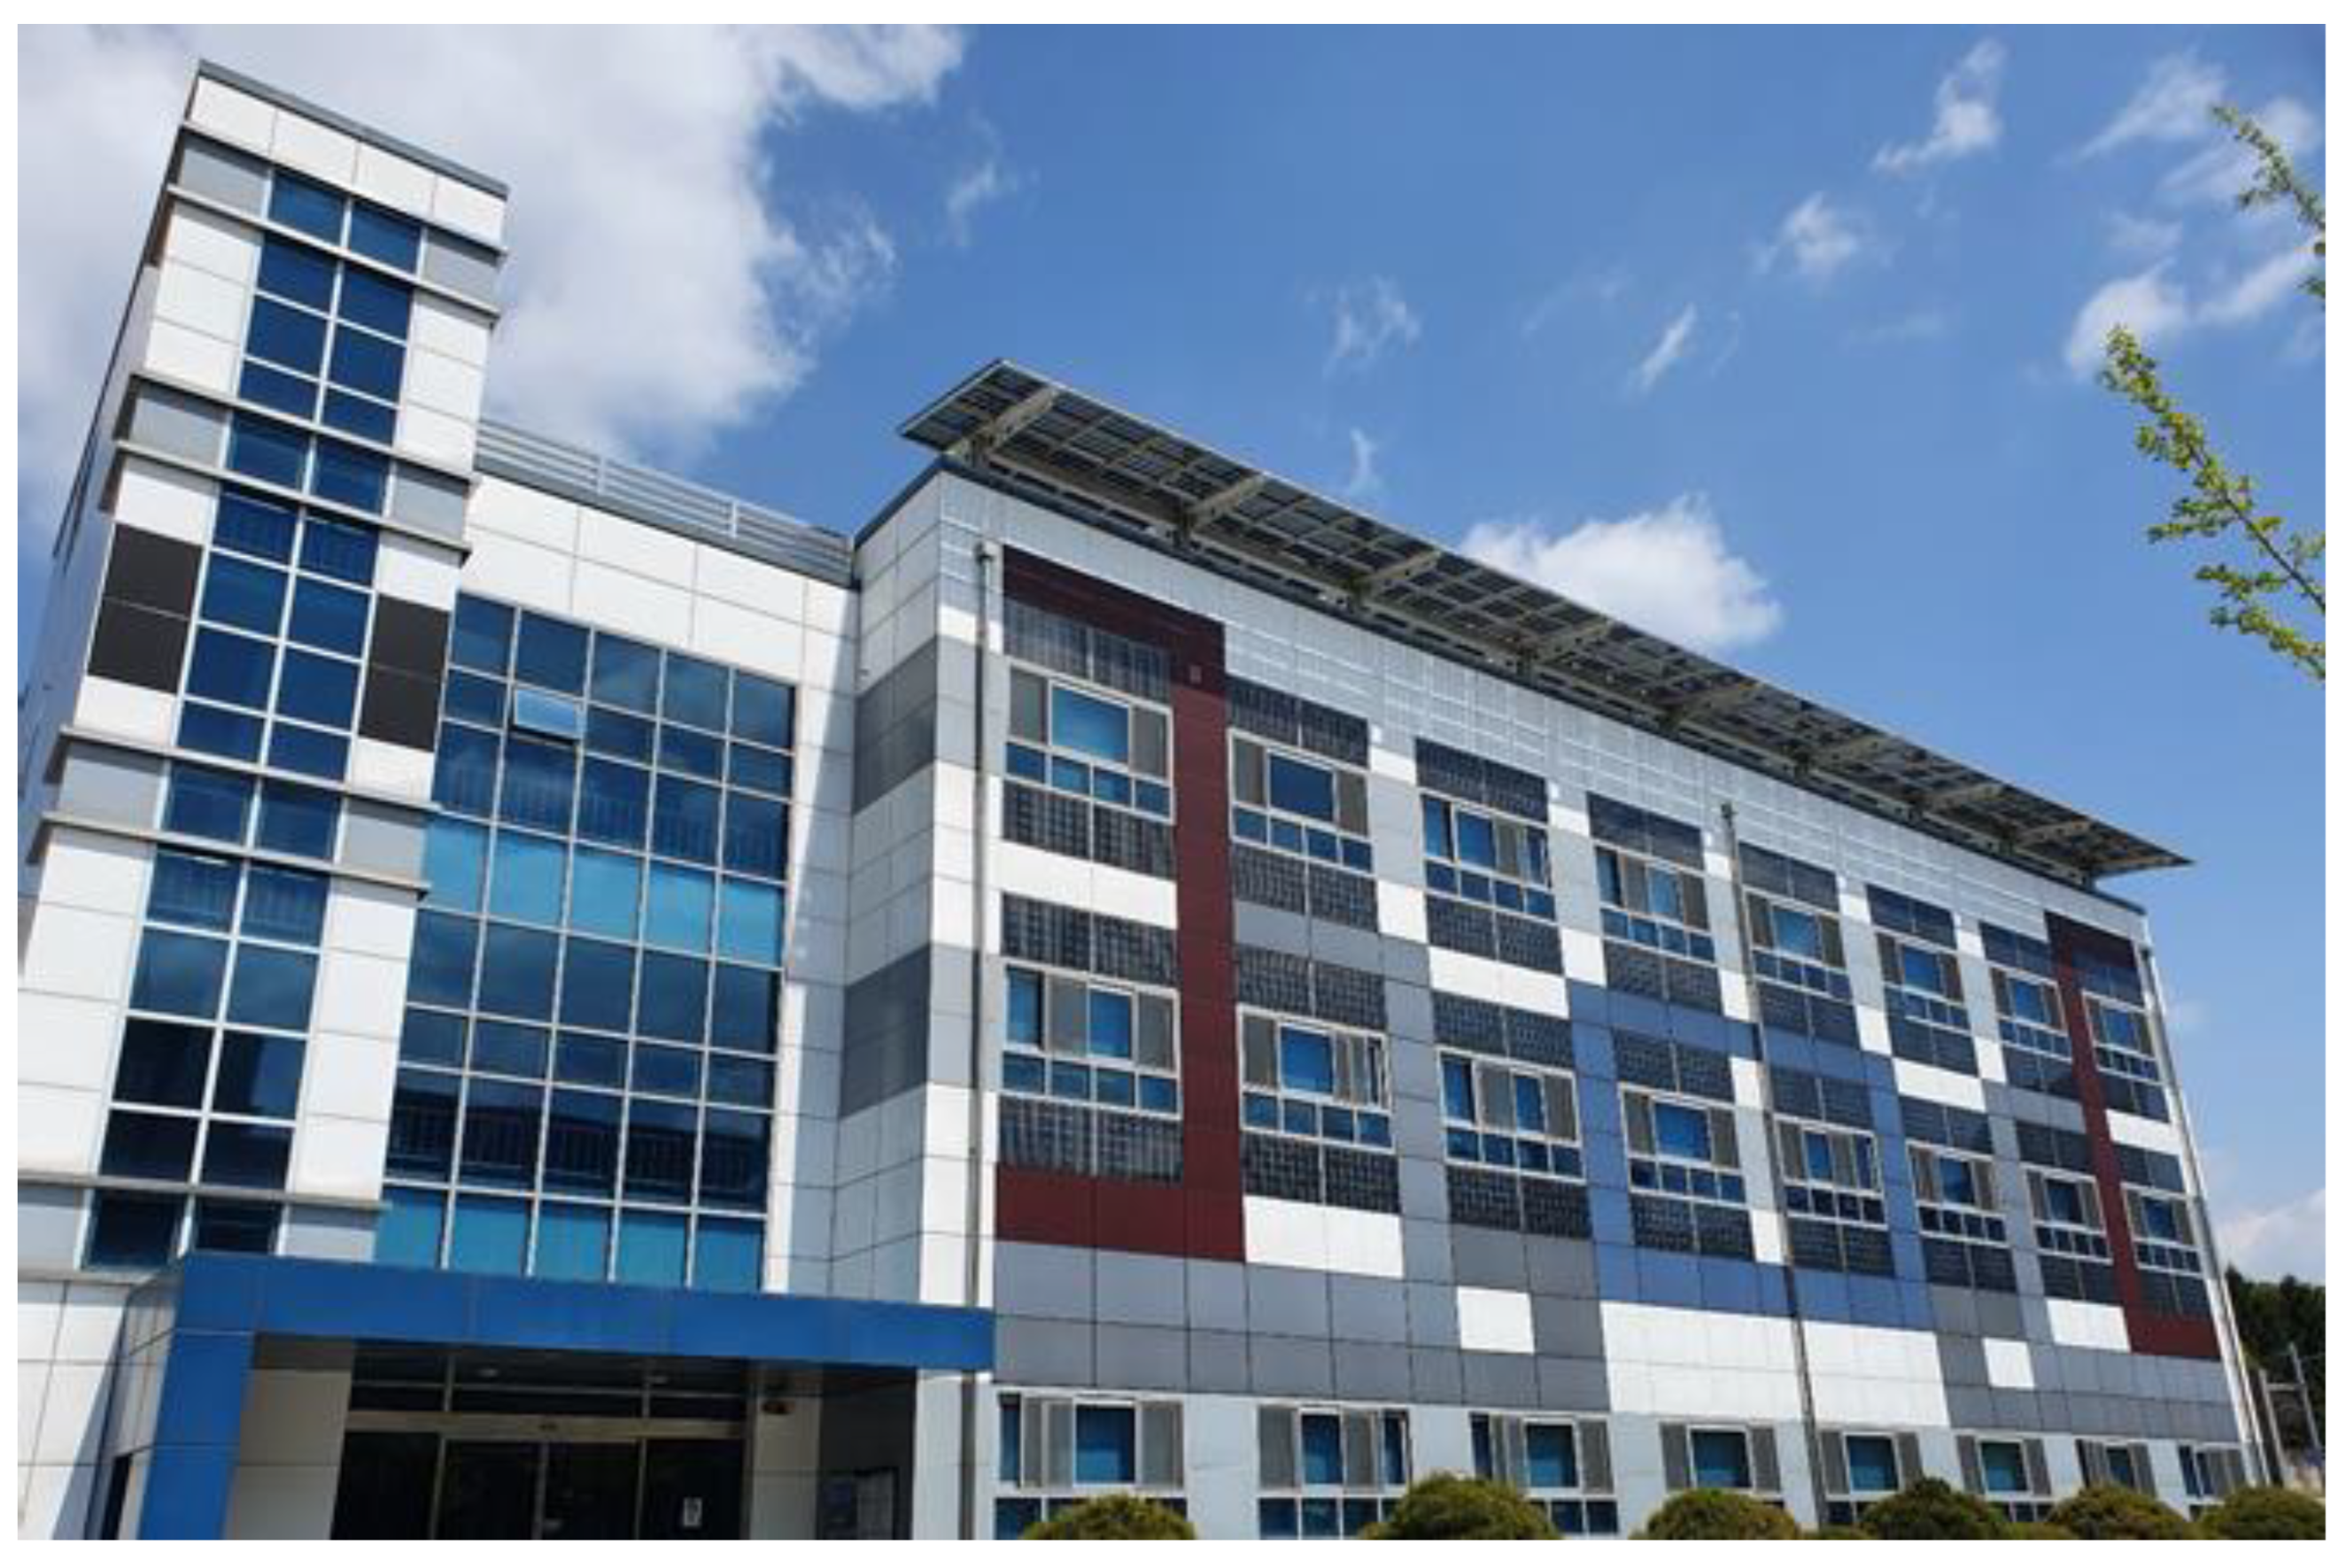
2.2. BIPV System Integration

Figure 4 shows the colored BIPV system that was installed on the wall of a building. Four different colored BIPV modules were applied: red, dark gray, light gray, and sky blue. The colored BIPV modules were installed on the south-facing exterior wall of a building located in Daejeon, Korea. Table 2 shows the electrical characteristics and array configuration of the colored BIPV modules that were installed on the building. Three inverters were used in the colored BIPV systems, and Table 3 shows the specific details of the inverters. The modules were connected in series with 26 modules (8 red modules, 7 dark gray modules, 11 light gray modules), 28 modules (7 dark gray modules, 4 light gray modules, 17 sky blue modules), and 26 modules (11 red modules, 5 dark gray modules, 10 light gray modules). Each string was connected with three inverters and they are shown as Groups 1, 2, and 3.

2.3. Data Measuring Equipment

The actual inverter and meteorological data were acquired using Campbell’s CR1000 data logger, and data were collected from the inverter and pyranometer at a 1 Hz sampling rate and stored as 10 min average values. A pyranometer was installed at the same 90° as the module installation angle to measure the inclination irradiance. The module temperature data were measured by attaching a K-type thermocouple to the back of the module. The specifications of the pyranometer and thermocouple are shown in Table 4 and Table 5.

3. Power Generation Prediction Model

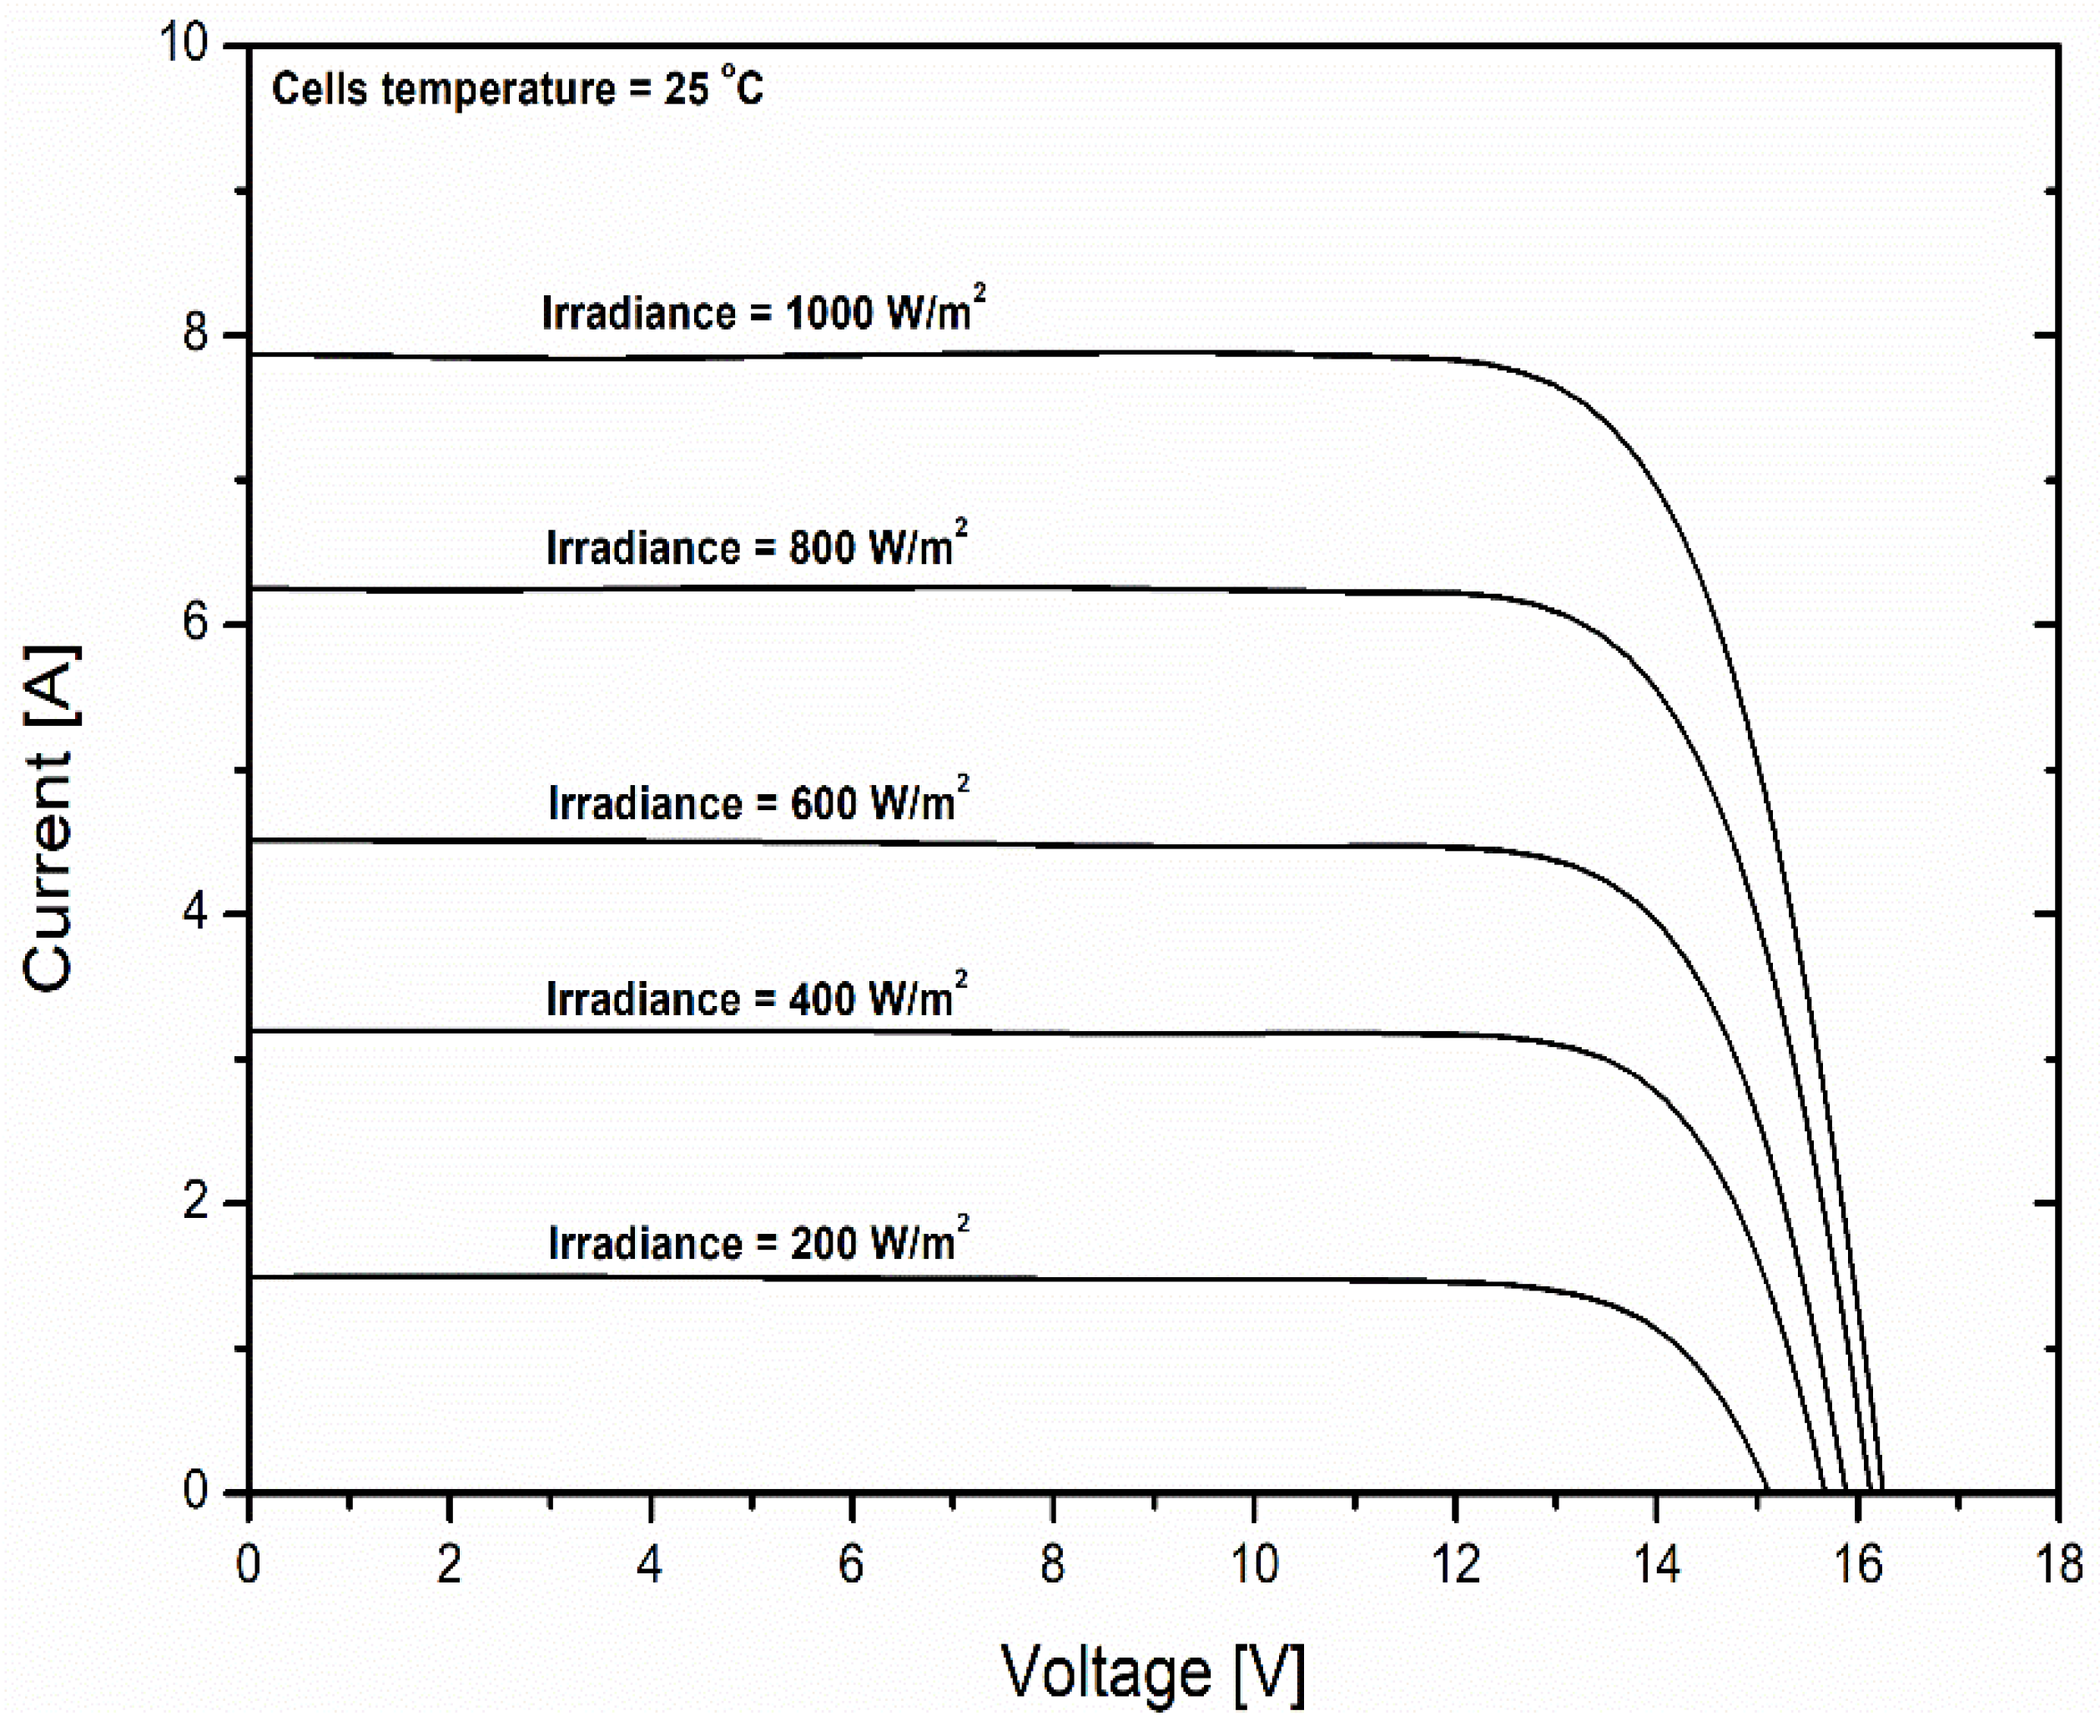
3.1. Proposed Simulation Model Using the I–V Curve

This study proposes a power generation prediction model using the output characteristics of colored BIPV modules based on I–V curve measurements. Since the colored BIPV modules that have been applied to buildings have the same output, the red module was used as the colored BIPV module for I–V curve measurements. The I–V curve was measured using PV simulator equipment (WPSS-2.0 x 1.5H-50 x 6, AM1.5G). Figure 5 shows the colored BIPV module that was used in the experiment and the PV simulator that was used to measure the I–V curve. PV simulator equipment is generally measured under STC (standard test condition: 25 °C, 1000 W/m2, AM1.5). A filter was applied to the PV simulator to measure the I–V curve according to variations in the irradiance. The irradiance was adjusted to 200, 400, 600, and 800 W/m2 using 20, 40, 60, and 80% filters. The filter used is shown in Figure 6. The I–V curve of the colored BIPV module was measured by dividing the irradiance by 200, 400, 600, 800, and 1000 W/m2 at a temperature condition of 25 °C. Figure 7 and Table 6 show the results of the I–V curve according to irradiance.
Figure 8 shows the I M P P and V M P P values based on the irradiance required for the power generation predictions. The R 2 (coefficient of determination) is a coefficient that explains the suitability of the regression equation and always has a value of 0 R 2 1 . The closer the R 2 is to 1, the higher the fit of the regression equation. Additionally, the closer the R 2 is to 0, the lower the fit of the regression equation. The I M P P and V M P P values for the changes in the irradiance are represented as regression equations. The regression equation for I M P P is represented as a linear function, and the R 2 is 1. The regression equation for V M P P is represented as a power series function, and the R 2 is 0.95.
I M P P and   V M P P for the irradiance determined by regression analysis are represented as Equations (1) and (2). Equations (1) and (2) correspond to a case where the temperature condition is 25 °C. The voltage coefficient for temperature should be considered because the voltage decreases as the temperature increases. The voltage coefficient for temperature for the colored BIPV modules is 0.3%/°C. If the temperature coefficient is considered in Equation (2), it can be expressed as Equation (3). The current temperature coefficient is not considered because the current is not affected by temperature changes. Power generation predictions based on the I–V curve are calculated using Equations (1) and (3):
I M P P = 0.0075 G + 0.0026
V M P P = 1.021 × 10 4 · G 1.907 + 13.36
V M P P _ T e m p = ( 1.021 × 10 4 × G 1.907 + 13.36 ) ( 1 0.003 ( T 25 ) )

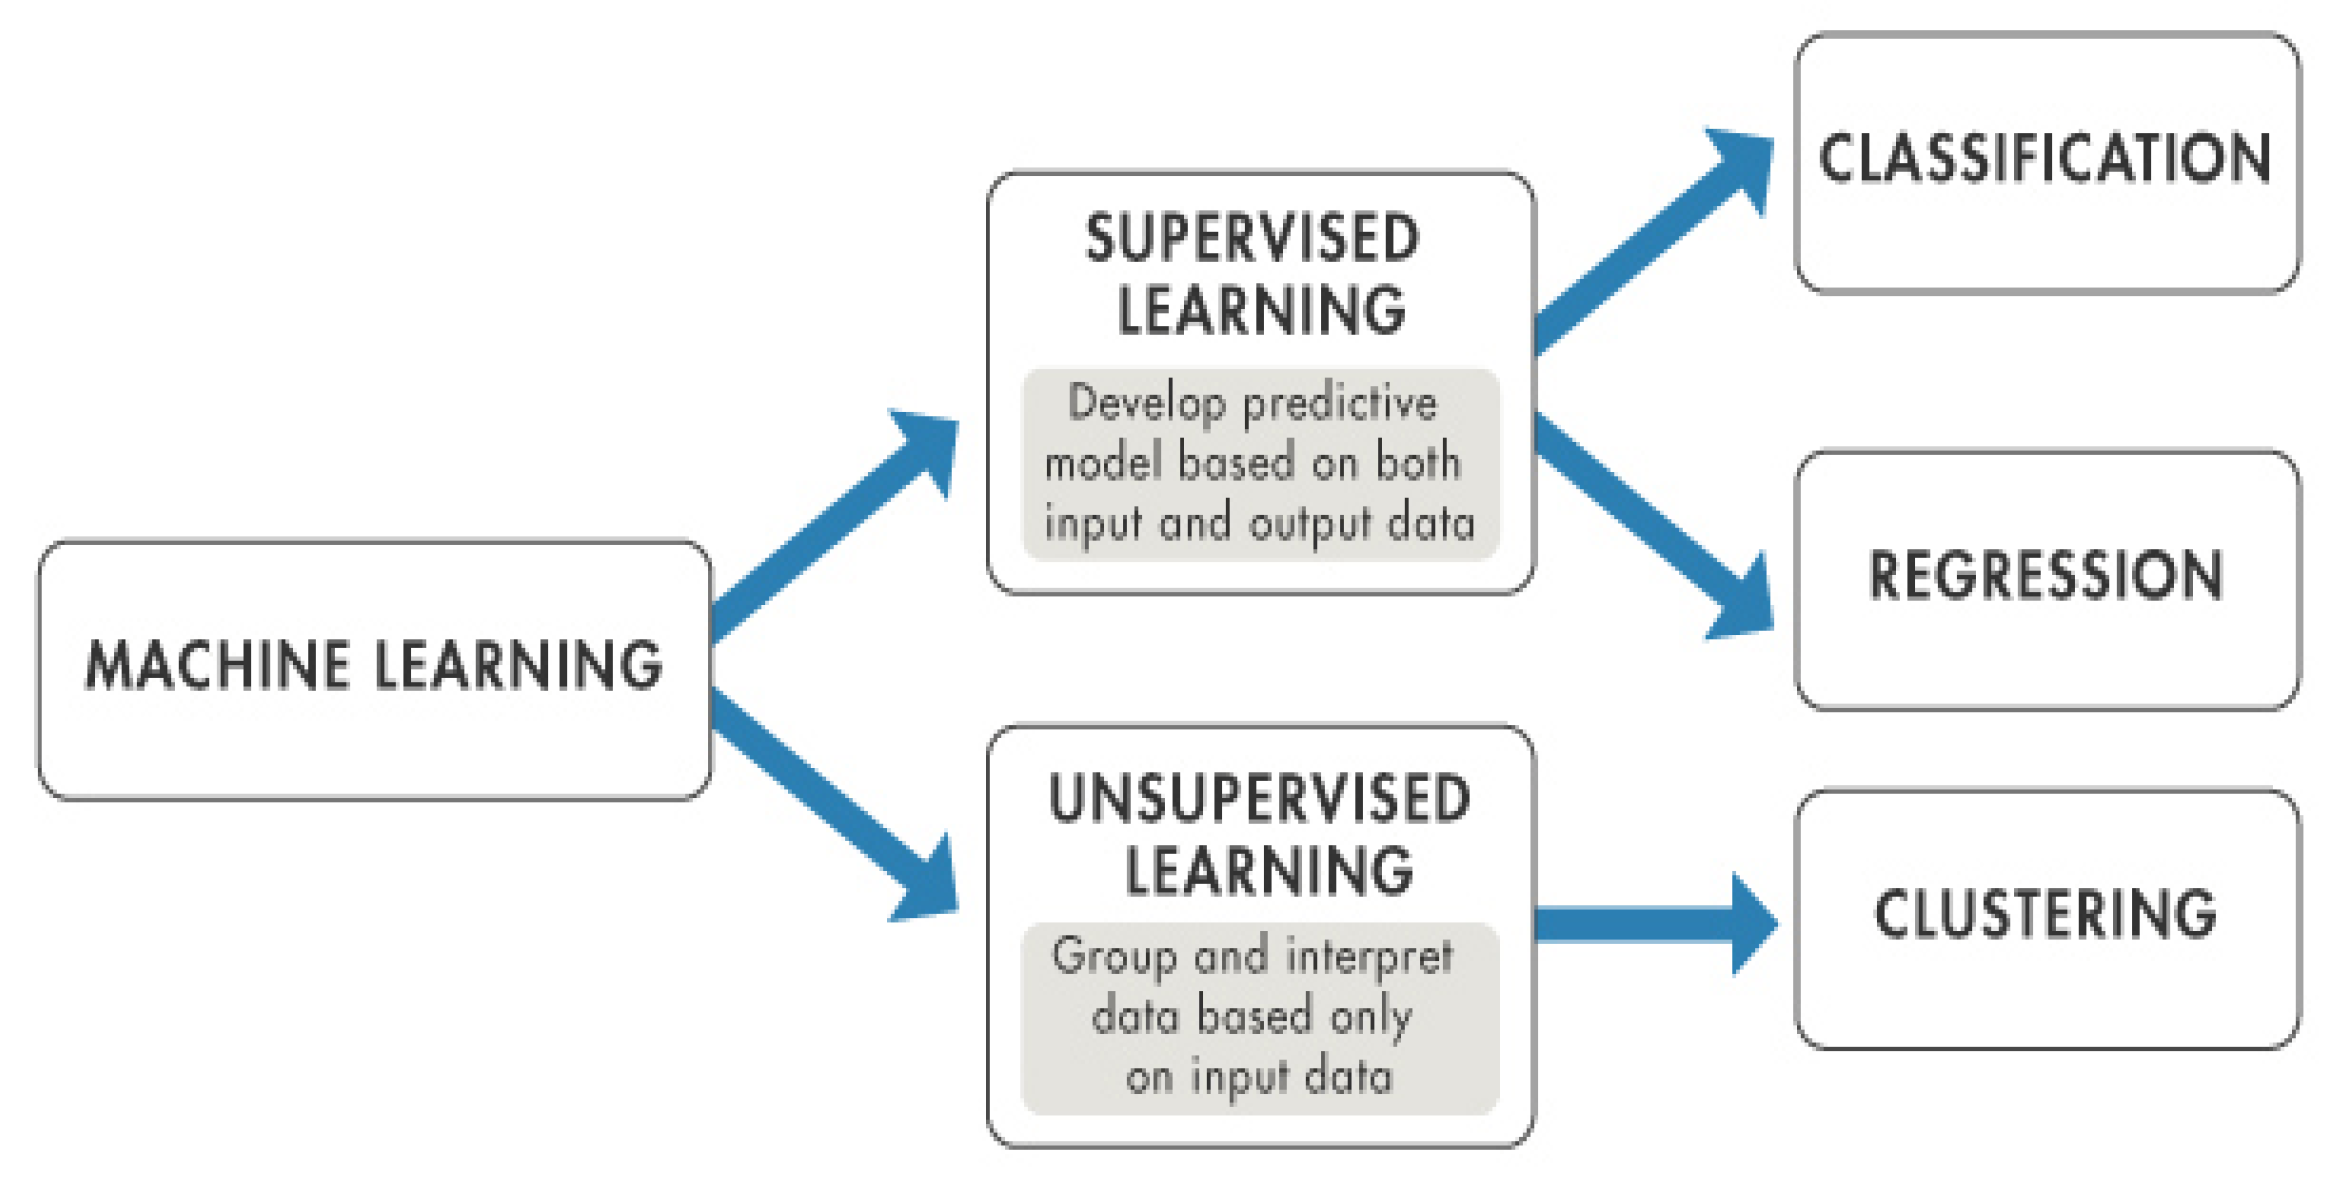
3.2. Proposed Machine Learning Model Using Historical Data

This study proposes a power generation prediction model that uses machine learning (ML), as well as meteorological data and the inverter output data stored in the data acquisition system. Table 7 shows the format of the data measured in the system. The data column consists of time, irradiance, surface temperature on the PV module, the DC input voltage, the DC input current, and the DC power.
Matlab (a statistics and machine learning toolbox) was used to predict the power generation. Figure 9 shows the classification of the machine learning techniques. In this study, a supervised learning linear regression technique that can predict the future output values of the model by training the model using input/output data was used. Regression learning techniques were mainly used to predict continuous response variables such as temperature changes or power demand fluctuations. Matlab regression learning techniques include various ones such as linear regression and neural networks. A power generation prediction model was proposed using the neural network (minimize tool strip) technique in ML, which is a high-accuracy technique.
To train a regression neural network model, the Regression Learner app in the Matlab Statistics and Machine Learning ToolboxTM was used. The regression neural network voltage and current models were fully connected, as were the feedforward neural networks with 10 hidden layers and the ReUL (Rectified Linear Unit) activation function. The ReUL function performs a threshold operation on each element of the input, where any value less than zero is set to zero; that is, it is as presented in Equation (4):
f ( x ) = { x ,     x 0 0 ,     x < 0
Figure 10 shows the proposed machine learning process. The proposed method prepares a training data set by making voltage and current estimated data using a photovoltaic mathematical physical model. The input variables for the classic ML method for power generation to predict the PV array are the irradiance and surface temperature of the module, and the target variable is power, as shown Table 8. In the proposed method, the target variables are voltage and current, not power. The power can be obtained by predicting the voltage and current. Since the DC array and the pyranometer are installed outside of the PV plant, soiling of the PV module surface often occurs. If the soiling is severe, then the prediction error becomes large. To reduce the correlation error between irradiance and power when soiling or shading occurs, a machine learning model using the linear regression model value (Equations (1) and (3)) that was calculated based on the I–V experimental data as an input variable was proposed. In general, the target variable of the ML method for predicting the power generation used to monitor PV systems is power. The target variables of the proposed ML are voltage and current. The advantage of using voltage and current is that it is easy to check whether there is a system failure.
As shown in Table 8, the proposed ML model was trained using the estimated voltage and current values that were derived from the experimental model as input variables. The estimated voltage and current values are derived from Equations (1) and (3). The voltage model is trained using irradiance, the surface temperature of the module, and the estimated voltage data as input variables. In addition, the current model was trained using irradiance, the surface temperature of module, and the estimated current data as input variables. The power of the proposed model was calculated as the product of the predicted voltage and current.

4. Data Analysis and Discussion

The proposed model was trained, verified, and tested using the output data from a 3 kW BIPV system and environmental sensor data. The data collection campaign ran from 16 March to 15 October 2021. Data sets with irradiances of 300 W/m2 or less were deleted. When the amount of irradiance is less than 300, the data set is inaccurate because of the frequent stoppage of the inverter, resulting in poor model accuracy. The data from 16 March to 30 September 2021 were used for model training, and the data from 1 to 15 October were used for model testing. Figure 11a shows the partial irradiance data used for training, and Figure 11b shows the partial measurement power and estimation power of the linear regression model using the I–V-measured data.
Differences can be observed between the power measured using the linear regression model using the I–V curve data and the real power of the inverter. The cause of these power differences can be estimated by stopping the inverter in the low irradiation section and the shading of the colored dot pattern on the glass surface of the PV module. For these reasons, the real power is lower than the power estimated by the linear regression model. In this paper, the ML model was proposed to accurately predict the amount of power generated by the BIPV module installed on a wall. It was assumed that the learning data were collected under the normal operating conditions of the BIPV system. In Figure 11c, it was confirmed that the DC array voltage of the actual inverter demonstrated a significant difference from the value of the linear regression model. The real inverter voltage fluctuated by a larger amount than the estimated model value. In addition, the measured current was lower than the estimated current in Figure 11d. It was considered that the irradiance that was incident to the solar cell was less than the measured irradiance because of shading losses in the dot pattern on the surface of the colored glass. A shading loss caused by the dot pattern depends on the entrance altitude of the irradiance.
The results that were obtained using the proposed ML method in Table 8 to increase the prediction accuracy according to the BIPV power generation environment and colored module characteristics are as follows: Figure 12 and Figure 13 are response plots that correspond to the training and testing data for the voltage and current. Overall, the distribution of the true responses and the predicted responses is similar, but there is an error for a specific value. This is because this value had a low correlation that was due to the inverter ceasing to operate or to irradiance fluctuations in the low-current section under the 10 min data average acquisition condition.
Table 9, Table 10, Table 11 and Table 12 show the results evaluating the performance of the proposed ML model using the training and testing data. The accuracy of the proposed ML model was evaluated as the root mean square error (RMSE), mean absolute error (MAE), and coefficient of determination (R2). The proposed ML model has a lower RSME than the linear regression model for both the voltage and current. In addition, since the voltage model has a low coefficient of determination, it was confirmed that the current value significantly affected power generation predictions.
Figure 14 shows a comparison of the actual measurement data, the prediction values of the linear regression model, and the prediction values of the ML model for the testing data with irradiances of 300 W/ m 2 or more. It was confirmed that the ML model made predictions that were closer to the power, voltage, and current data than the linear regression model. Table 13 shows the RMSE and MAE of the simulation and machine learning models for the output. The result was that the RMSE of the ML model was reduced by more than 50% compared to the linear regression model. According to the analysis result, the proposed ML model can improve the accuracy of power generation predictions.

5. Results

In this paper, ML was used to predict the power generation of a colored BIPV system installed on a wall. The color implementation method of the commercial colored BIPV modules was analyzed, and the I–V curves were measured according to variations in the irradiation. A linear regression model was proposed for voltage and current that used the measured I–V curve, and this model was compared with the measured data. The proposed linear regression model did not adequately reflect the losses caused by dots on the glass surface of the colored modules and by the voltage fluctuations in the inverter. To improve this model, we proposed an ML model that predicts the power generation by learning the irradiance, module temperature, and voltage and current calculated by the proposed linear regression model. About 6.5 months of data were collected from BIPV systems, and the ML model was trained using 6 months of data and tested using 0.5 months of data. The results are summarized below:
(1)
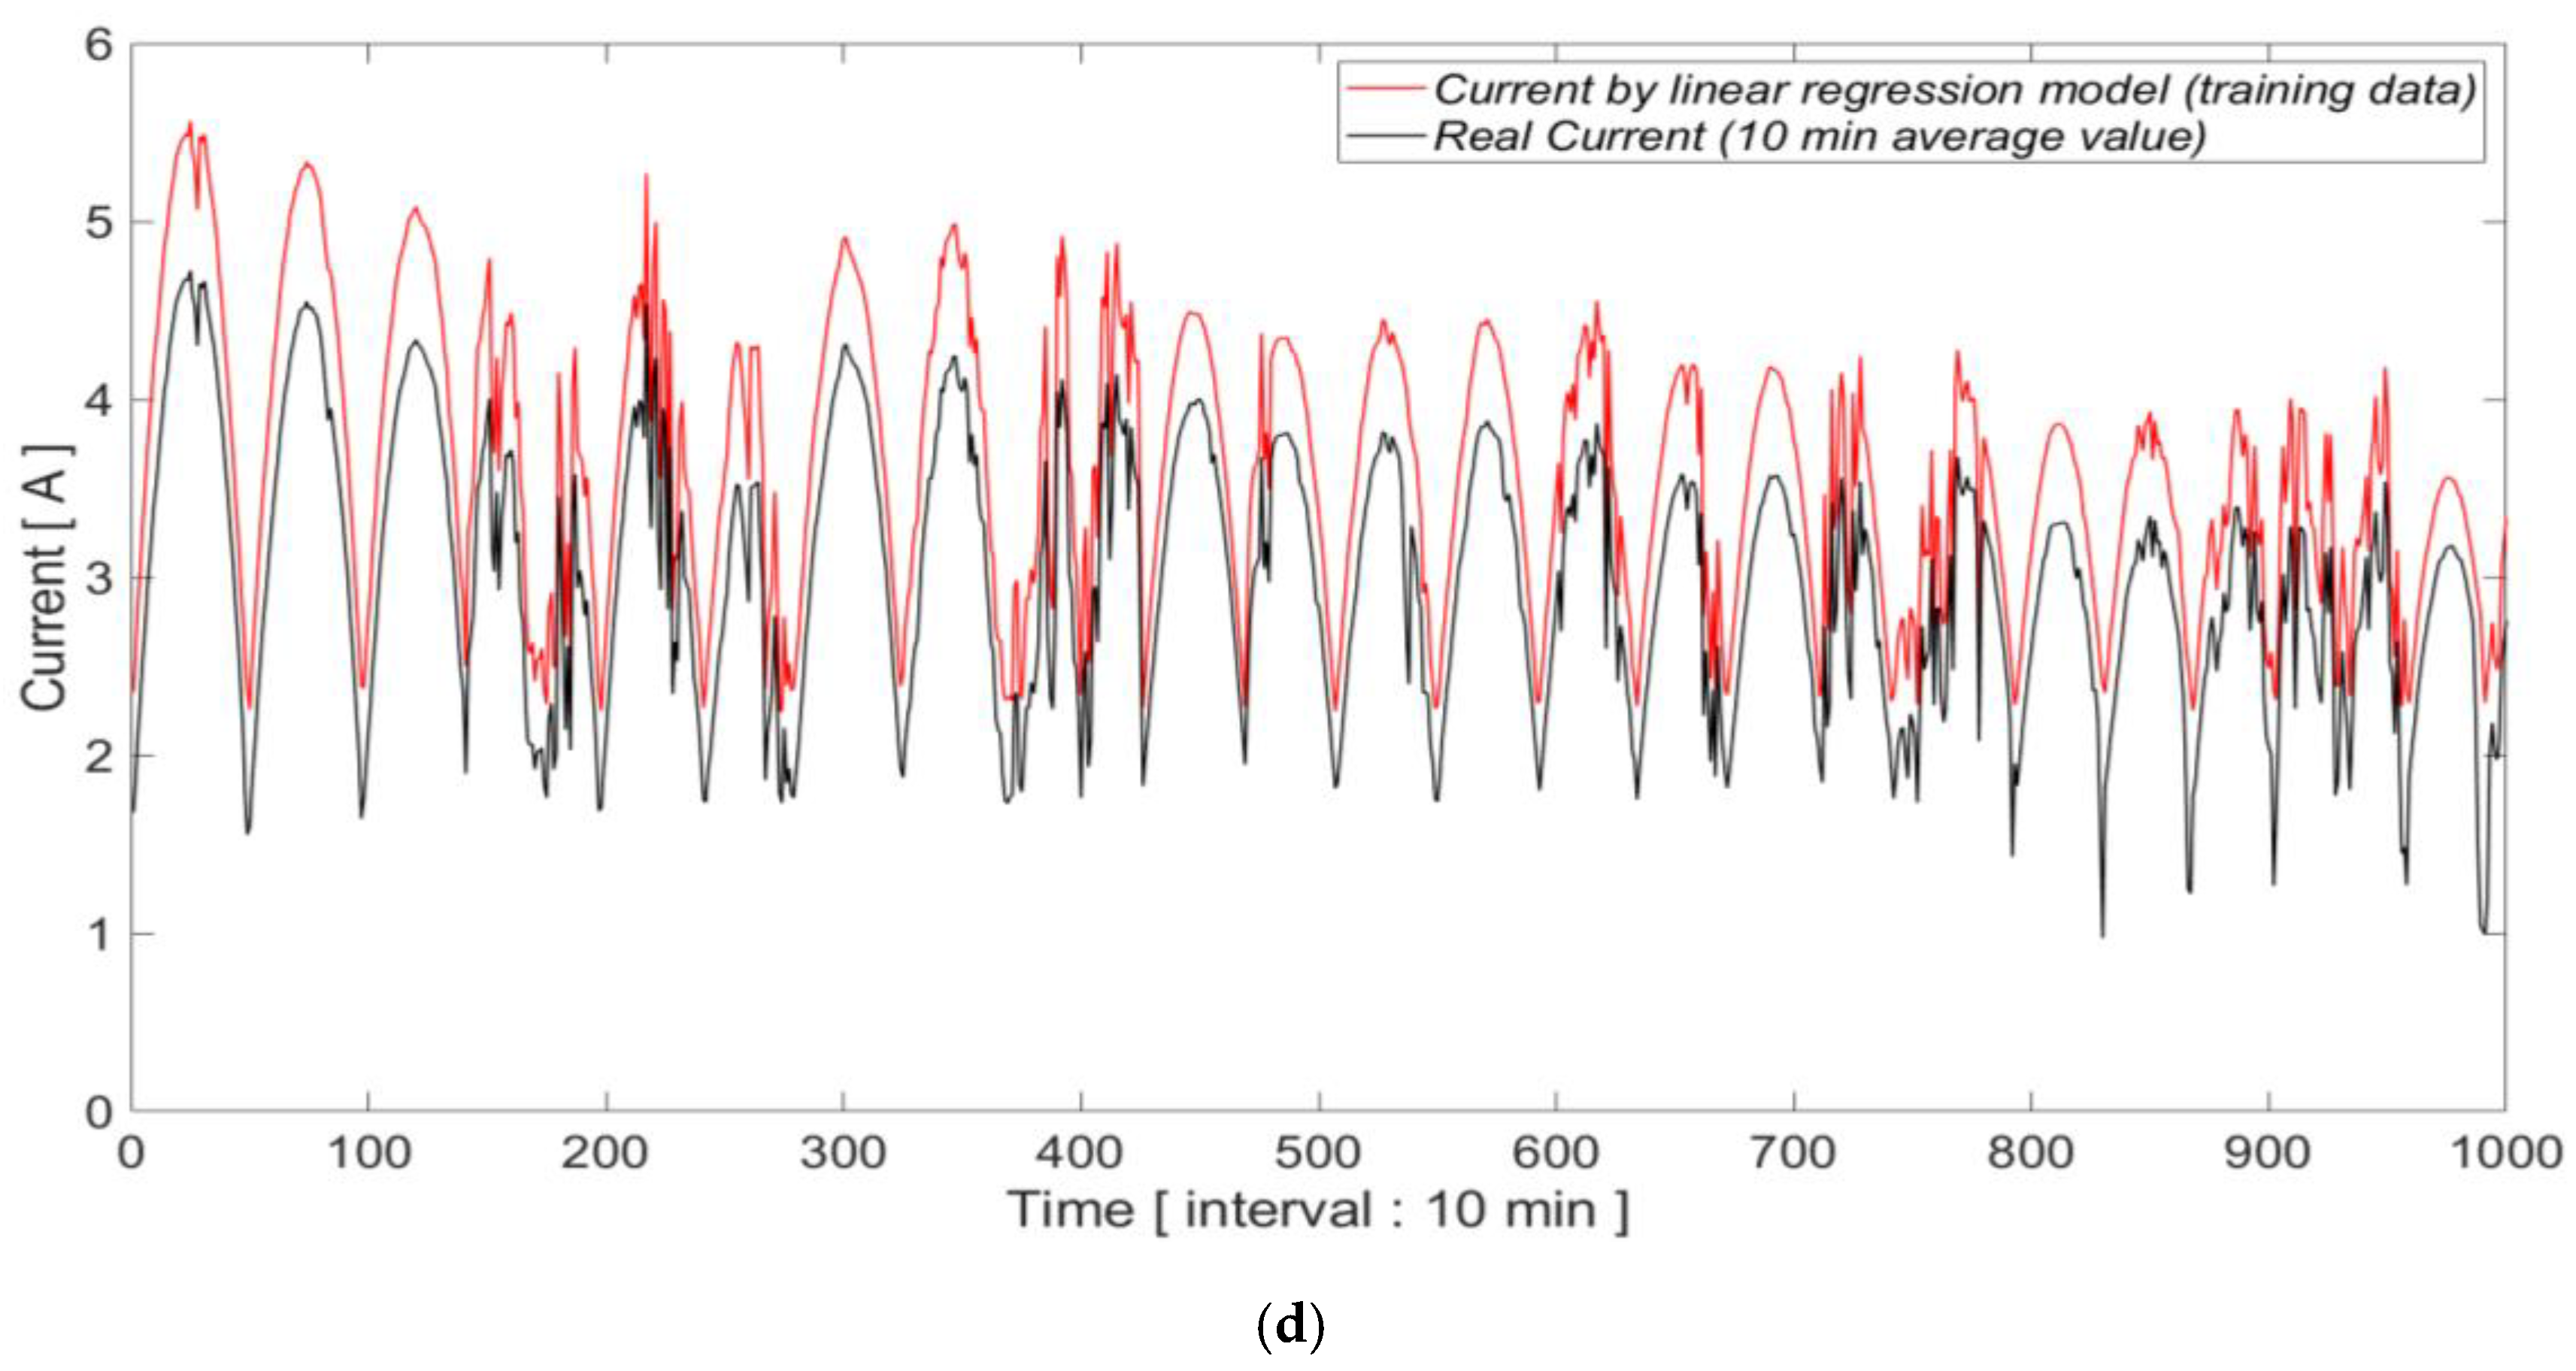
The surface dots of the colored BIPV module created shadows when the sun’s rays hit it, which lowered the real power. Therefore, the proposed linear regression model that predicts the power generation using the irradiance measured by a pyranometer showed a large error in the power generation predictions for the colored BIPV system. In addition, the data was acquired as a 10 min average, and the operation of the inverter was stop in the severe fluctuation of irradiance or low current section.
(2)
To minimize the influence of factors that lower the output prediction accuracy, neural network ML is used. An ML model was proposed to reflect the output characteristics of the colored module. The proposed ML model predicts voltage and current, and the irradiance, module temperature, and voltage, and current data were calculated by a linear regression model as training data.
(3)
As a result of comparing the prediction value of the linear regression model and the prediction value of the ML model for the testing data, it was confirmed that the ML model predicts values that are closer to the actual power, voltage, and current than the linear regression model. The R2 values for the voltage and current values of the proposed ML model were 5% higher for voltage and 2% higher for current. The RMSE of the ML model for power generation was 0.0754 kW, the RMSE of the simulation model was 0.1581 kW, and the error rate of the ML model was reduced by more than 50% compared to the simulation model.
(4)
The proposed ML model can predict the power generation of a vertically installed BIPV system with a colored module created with dots on glass with a high level of accuracy. For accurate power predictions, this method can easily determine the failure of a BIPV system and reduce energy losses via routine maintenance.

Author Contributions

W.-G.S. wrote the main part of the paper and analyzed the simulation results. J.-Y.S. established the research direction of the paper and suggested a method through which to conduct the experiment and simulation. H.-M.H. measured the current-voltage curve of colored module caused by the change irradiances using the PV simulator. C.-H.P. manufactured the colored BIPV modules and supported data obtained from the colored modules. S.-W.K. reviewed and revised the overall content of the paper. All authors have read and agreed to the published version of the manuscript.

Funding

This research received no external funding.

Institutional Review Board Statement

Not applicable.

Informed Consent Statement

Not applicable.

Acknowledgments

This work was conducted under the framework of the research and development program of the Korea Institute of Energy Research (C2-2422-03) and supported by a grant from the Renewable Energy of Korea Institute of Energy Technology Evaluation and Planning (KETEP) funded by the Korean Ministry of Trade, Industry and Energy (Project No. 20213030010340).

Conflicts of Interest

The authors declare no conflict of interest.

References

  1. Key World Energy Statistics. 2020. Available online: https://www.iea.org/reports/key-world-energy-statistics-2020 (accessed on 11 January 2022).
  2. Gholami, H.; Røstvik, H.N.; Steemers, K. The Contribution of Building-Integrated Photovoltaics (BIPV) to the Concept of Nearly Zero-Energy Cities in Europe: Potential and Challenges Ahead. Energies 2021, 14, 6015. [Google Scholar] [CrossRef]
  3. Amado, M.; Poggi, F.; Amado, A.R.; Breu, S. A Cellular Approach to Net-Zero Energy Cities. Energies 2017, 10, 1826. [Google Scholar] [CrossRef] [Green Version]
  4. Todorovic, B. Towards zero energy buildings: New and retrofitted existing buildings. In Proceedings of the 2011 IEEE 3rd International Symposium on Exploitation of Renewable Energy Sources (EXPRES), Subotica, Serbia, 11–12 March 2011; pp. 7–14. [Google Scholar]
  5. Debbarma, M.; Sudhakar, K.; Baredar, P. Comparison of BIPV and BIPVT: A review. Resour. Technol. 2017, 3, 263–271. [Google Scholar] [CrossRef]
  6. Liang, Z.; Chen, D.; Liang, X.; Yang, Z.; Shen, H.; Shi, J. Crystalline Si solar cells based on solar grade silicon materials. Renew. Energy 2010, 35, 2297–2300. [Google Scholar] [CrossRef]
  7. Liu, J.; Yao, Y.; Xiao, S.; Gu, X. Review of status developments of high-efficiency crystalline silicon solar cells. J. Phys. D Appl. Phys. 2018, 51, 123001. [Google Scholar] [CrossRef]
  8. Ansari, M.I.H.; Qurashi, A.; Nazeeruddin, M.K. Frontiers, opportunities, and challenges in perovskite solar cells: A critical review. J. Photochem. Photobiol. C Photochem. Rev. 2018, 35, 1–24. [Google Scholar] [CrossRef]
  9. Li, R.; Li, C.; Liu, M.; Vivo, P.; Zheng, M.; Dai, Z.; Zhan, J.; He, B.; Li, H.; Yang, W.; et al. Hydrogen-Bonded Dopant-Free Hole Transport Material Enables Efficient and Stable Inverted Perovskite Solar Cells. CCS Chem. 2021, 3, 3309–3319. [Google Scholar] [CrossRef]
  10. Biyik, E.; Araz, M.; Hepbasli, A.; Shahrestani, M.; Yao, R.; Shao, L.; Essah, E.; Oliveira, A.; del Caño, T.; Rico, E.; et al. A key review of building integrated photovoltaic (BIPV) systems. Eng. Sci. Technol. Int. J. 2017, 20, 833–858. [Google Scholar] [CrossRef]
  11. Fath, K.; Stengel, J.; Sprenger, W.; Wilson, H.R.; Schultmann, F.; Kuhn, T. A method for predicting the economic potential of (building-integrated) photovoltaics in urban areas based on hourly Radiance simulations. Sol. Energy 2015, 116, 357–370. [Google Scholar] [CrossRef]
  12. Kuhn, T.E.; Erban, C.; Heinrich, M.; Eisenlohr, J.; Ensslen, F.; Neuhaus, D.H. Review of technological design options for building integrated photovoltaics (BIPV). Energy Build. 2021, 231, 110381. [Google Scholar] [CrossRef]
  13. Pelle, M.; Lucchi, E.; Maturi, L.; Astigarraga, A.; Causone, F. Colored BIPV technologies: Methodological and exper-imental assessment for architecturally sensitive areas. Energies 2020, 13, 4506. [Google Scholar] [CrossRef]
  14. Forero, N.; Hernández, J.; Gordillo, G. Development of a monitoring system for a PV solar plant. Energy Convers. Manag. 2006, 47, 2329–2336. [Google Scholar] [CrossRef]
  15. Rezk, H.; Tyukhov, I.; Al-Dhaifallah, M.; Tikhonov, A. Performance of data acquisition system for monitoring PV system parameters. Measurement 2017, 104, 204–211. [Google Scholar] [CrossRef]
  16. Aste, N.; Del Pero, C.; Leonforte, F.; Manfren, M. A simplified model for the estimation of energy production of PV systems. Energy 2013, 59, 503–512. [Google Scholar] [CrossRef]
  17. Kim, G.G.; Choi, J.H.; Park, S.Y.; Bhang, B.G.; Nam, W.J.; Cha, H.L.; Ahn, H.K. Prediction model for PV performance with correlation analysis of environmental variables. IEEE J. Photovolt. 2019, 9, 832–841. [Google Scholar] [CrossRef]
  18. Lappalainen, K.; Wang, G.C.; Kleissl, J. Estimation of the largest expected photovoltaic power ramp rates. Appl. Energy 2020, 278, 115636. [Google Scholar] [CrossRef]
  19. Marcos, J.; Marroyo, L.; Lorenzo, E.; Alvira, D.; Izco, E. From irradiance to output power fluctuations: The PV plant as a low pass filter. Prog. Photovolt. Res. Appl. 2011, 19, 505–510. [Google Scholar] [CrossRef] [Green Version]
  20. Huang, C.; Chen, H.; Chan, C.; Chou, C.; Chiang, C. Thermal Model Based Power-Generated Prediction by Using Meteorological Data in BIPV System. Energy Procedia 2011, 12, 531–537. [Google Scholar] [CrossRef] [Green Version]
  21. Kurukuru, V.S.B.; Haque, A.; Khan, M.A.; Sahoo, S.; Malik, A.; Blaabjerg, F. A Review on Artificial Intelligence Applications for Grid-Connected Solar Photovoltaic Systems. Energies 2021, 14, 4690. [Google Scholar] [CrossRef]
  22. Lee, D.; Jeong, J.; Yoon, S.H.; Chae, Y.T. Improvement of short-term BIPV power predictions using feature engineering and a recurrent neural network. Energies 2019, 12, 3247. [Google Scholar] [CrossRef] [Green Version]
  23. Kabilan, R.; Chandran, V.; Yogapriya, J.; Karthick, A.; Gandhi, P.P.; Mohanavel, V.; Rahim, R.; Manoharan, S. Short-Term Power Prediction of Building Integrated Photovoltaic (BIPV) System Based on Machine Learning Algorithms. Int. J. Photoenergy 2021, 2021, 5582418. [Google Scholar] [CrossRef]
  24. Khandakar, A.; EH Chowdhury, M.; Khoda Kazi, M.; Benhmed, K.; Touati, F.; Al-Hitmi, M.; Gonzales, J.S. Machine learning based photovoltaics (PV) power prediction using different environmental parameters of Qatar. Energies 2019, 12, 2782. [Google Scholar] [CrossRef] [Green Version]
  25. Garoudja, E.; Chouder, A.; Kara, K.; Silvestre, S. An enhanced machine learning based approach for failures detection and diagnosis of PV systems. Energy Convers. Manag. 2017, 151, 496–513. [Google Scholar] [CrossRef] [Green Version]
Figure 1. BIPV modules of various colors applied in the experiment. (a) Red. (b) Sky Blue. (c) Gray.
Energies 15 02589 g001
Figure 2. Colored glass structure.
Energies 15 02589 g002
Figure 3. A magnified image of the colored glass. (a) 300 times. (b) 1000 times.
Energies 15 02589 g003
Figure 4. Colored BIPV system.
Energies 15 02589 g004
Figure 5. Colored BIPV module and PV simulator during I–V measurements. (a) Colored BIPV module, (b) PV simulator.
Energies 15 02589 g005
Figure 6. Irradiance filter. (a) 20%. (b) 40%. (c) 60%. (d) 80%.
Energies 15 02589 g006
Figure 7. Measured I–V curves according to variations in the irradiance.
Energies 15 02589 g007
Figure 8. I M P P   and   V M P P according to variations in the irradiance in the PV simulator. (a) I M P P . (b) V M P P .
Energies 15 02589 g008
Figure 9. Classification of machine learning (ML) techniques.
Energies 15 02589 g009
Figure 10. Proposed Machine learning process.
Energies 15 02589 g010
Figure 11. Training data plot. (a) 10-min average partial irradiance data used for training. (b) 10-min average partial real power and estimated power determined by the linear regression model. (c) 10-min average partial real voltage and estimated voltage determined by the linear regression model. (d) 10-min average partial real current and estimated current determined by the linear regression model.
Energies 15 02589 g011aEnergies 15 02589 g011b
Figure 12. Plot of the predicted vs. actual response for the voltage [V]: (a) training results, (b) testing results.
Energies 15 02589 g012
Figure 13. Plot of the predicted vs. actual response for the current [A]: (a) training results, (b) testing results.
Energies 15 02589 g013
Figure 14. Comparison of the predictions made by each model with the actual testing data. (a) Power. (b) Voltage. (c) Current.
Energies 15 02589 g014aEnergies 15 02589 g014b
Table 1. Electrical characteristics of each color of BIPV module.
Color p m a x
(W)
V o c  
(V)
I s c  
(A)
V m p  
(V)
I m p  
(A)
Fill Factor
(%)
Red99.1816.247.8413.317.4577.89
Dark Gray99.2516.257.8413.327.4577.86
Light Gray99.6216.167.9713.267.5277.32
Sky Blue99.3516.227.8613.337.4577.93
Table 2. The specifications of colored BIPV modules and systems.
Group 1Group 2Group 3
P m a x (W)999999
  I m p p (A)7.457.457.45
V m p p (V) 13.3113.3113.31
I s c (A)7.847.847.84
V o c (V)16.2416.2416.24
Temperature coefficient (%/°C)0.30.30.3
Cell number242424
Series module number262826
Parallel module number111
Capacity (kW)2.502.692.50
Table 3. Inverter specifications.
DCMPPT voltage range100 V~400 V
Maximum Voltage500 V
Maximum current18 A
ACRated power3.5 kW
Maximum efficiency97% ≤~
Table 4. Pyranometer specifications.
SpecificationValue
Spectral Range400 to 1100 nm
Sensitivity60 to 100 μV/W/m2
Response Time<500 ns
Non-linearity0 to 1000 W/m2
Maximum solar irradiance2000 W/m2
Operational Temperature range−40 °C to + 80 °C
Directional response<10 W/m2 (up to 80° with 1000 W/m2 beam)
Field of view180°
Non-stability<2% (change/year)
Table 5. Specifications of the K-type thermocouples.
SpecificationValue
Temperature Range−200 °C to 1250 °C (−328 °F to 2282 °F)
Std. Limits of ErrorGreater of 2.2 °C or 0.75%
Spec. Limits of ErrorGrater of 1.1 °C or 0.4%
Table 6. Maximum power point (MPP) values in PV simulator.
Irradiance (W/m2) p m a x  
(W)
V M P P  
(V)
I M P P  
(A)
Fill Factor
(%)
100099.213.317.45277.9
80079.613.355.96478.8
60059.713.334.47779.5
40039.513.232.98980.3
20019.312.941.48780.7
Table 7. Format of the data stored in the acquisition system.
TimePowerVoltageCurrentIrradianceTemperature
xxxxxxxxxxxxxxxxxx
Table 8. Target and input variables for machine learning model.
Machine Learning ModelTarget VariableInput Variable
Classic methodPowerIrradiance
Temperature
Proposed methodVoltageIrradiance
Temperature
Voltage for estimation
CurrentIrradiance
Temperature
Current for estimation
Table 9. Results of the linear regression voltage model.
Voltage ModelRMSEMAER2
Validation (training)13.906 (V)9.1902 (V)0.37
Test13.73 (V)9.4955 (V)0.33
Table 10. Results of the proposed voltage ML model.
Voltage ModelRMSEMAER2
Validation (training)13.451 (V)8.5375 (V)0.41
Test13.27 (V)8.5375 (V)0.38
Table 11. Results of the linear regression current model.
Current ModelRMSEMAER2
Validation (training)0.28619 (A)0.20708 (A)0.90
Test0.29343 (A)0.21655 (A)0.88
Table 12. Results of the proposed current ML model.
Current ModelRMSEMAER2
Validation (training)0.26119 (A)0.17455 (A)0.92
Test0.26437 (A)0.17761 (A)0.90
Table 13. The power prediction results for each model.
ModelRMSEMAE
Linear regression model0.1581 (kW)0.1372 (kW)
Proposed ML model0.0754 (kW)0.0372 (kW)
Publisher’s Note: MDPI stays neutral with regard to jurisdictional claims in published maps and institutional affiliations.

