1. Introduction
The development of prosumer power generation has caused significant changes in the structure and operation of low-voltage (LV) distribution networks. The number of energy sources, mainly photovoltaic sources (PV), is constantly growing. According to the Polish grid connection code [
1], the installation of energy sources for the local energy needs of consumers does not require the permission of the distributed network operator (DSO); therefore, it takes place independently of the actual hosting capacity of the networks. Usually, the dynamic increase in new PV installations is not accompanied by the reinforcement of the network infrastructure. Thus, in many cases, the presence of renewable energy sources (RES) in the LV network results in the deterioration of supply quality and threatens the safe operation of the network [
2].
The most serious problem is the voltage rise in the network nodes, which is most probable in long lines of rural networks. It may cause disruptions in the operation of devices, e.g., under high solar radiation conditions PV inverters may switch off. Other typical power quality disturbances are voltage variations due to intermittent power generation. Many PV prosumer installations are single-phase, so voltage asymmetry is also experienced. As regulation capabilities in typical LV networks are relatively low, these phenomena are serious problems for DSOs.
The technical challenges are expected to escalate due to increasing network loads resulting from the growing popularity of e-mobility and the need to charge electric vehicles from home installations. These issues are reviewed and discussed in [
3,
4].
To maintain correct network operation with the required quality of supply, DSOs are motivated to look for solutions that enable energy management in the network. Commonly applied voltage regulation methods are based on the change of active and reactive power flow in the network [
5], e.g., by a change in the power generation of PV inverters.
A voltage rise above the specified limits can be mitigated if the PV inverter starts to consume reactive power (cos φ inductive) in addition to the generation of active power [
6]. As increased consumption of reactive power can limit the amount of active energy transmitted to the grid, it may be reasonable to extend the control capabilities using energy storage systems (ESS) [
7]. Although battery energy storage systems (BESS) are not currently common due to their relatively high cost, this is expected to change due to the development of new battery materials, optimal battery size, battery location, and scheduling [
8,
9]. An example of the use of an ESS in a sensitivity-based voltage control strategy is presented in [
10].
The high number of controllable resources (PVs and BESSs) allocated within LV networks can give a significant and flexible regulation capacity [
11]. However, the variety and versatility of controllable devices as well as many applied communication solutions constitute a problem for their efficient and reliable integration into a manageable system. These problems, if addressed correctly, can be overcome through the proper selection of system components and system design, as well as preliminary tests in a controllable environment.
A control system enabling the DSO to manage the operation of an LV voltage network with high penetration of renewable energy sources was developed under the project “Management of low-voltage distribution network operation with prosumers’ active participation” (“Active Prosumer”) financed by the Polish National Centre for Research and Development. The system offers different functionalities, including voltage regulation and transformer load control. It uses controllable devices located in prosumer installations, such as PV inverters and BESSs, and is based on the concept of ancillary services. The regulation is provided in a coordinated manner and independently in each phase. The control algorithms were designed and developed at the Institute of Electrical Power Engineering at the Lodz University of Technology, and the controller prototypes were designed and manufactured by APATOR S.A.
The control scheme and the correctness of applied algorithms were verified by means of simulation in the PSCAD/EMTDC [
12] environment using the model of a real network in which the system will be implemented. The computer simulator can mimic the operation of the control system in a virtual network consisting of appropriate models of devices installed in the real network. Although computer simulation has been considered a basic verification method for many years [
13], simulation tests are not sufficient in advanced power electronics studies and hardware experiments are essential for the validation of a new system before its implementation. The challenges are the interoperability of different devices used in systems, the scalability of communication protocols, the capacity of existing communication measures, and cybersecurity.
The digital real-time simulators (DRTS) combined with using the HIL technique allow one to test the behavior of real systems before installing them in a power network. In the development of complex real-time embedded systems, the probability of positive field test results increases, and the associated costs are reduced [
14].
The basic topology of a HIL-based testbed combines real hardware components with software-based simulation. The testing platform consists of a DRTS, output and input cards (needed for feedback), and the device being tested (physical hardware). If the simulation involves power transfer to or from the device being tested, this is known as power-hardware-in-the-loop (PHIL). When controllers are tested, the versatile communication protocols can be applied to connect the simulator with the validated controller and this is known as a controller-hardware-in-the-loop (CHIL) [
15].
The literature shows several real-time simulations in advanced research and industry practices. A comparison between “non-real-time” and “real-time” simulation types is given in [
16]. An overview of the real-time simulation technologies for electrical power network design, testing, and validation is presented in [
17]. The paper outlines the main systems components, computing capabilities, and system characteristics.
The distribution network benchmark and HIL test platform for the evaluation of novel microgrid functionalities and device controllers are introduced in [
18]. A proposal of a benchmark system for HIL testing that incorporates distributed energy resources (DER) into the real-time simulation environment is given in [
19]. The authors offer guidelines that can help to set up HIL simulations in a structured and safe manner.
A state-of-the-art PHIL simulation is used to design, analyze, and test components of the electrical power system in [
20]. The focus of this paper is on the design of the PHIL system and its key components, as well as their influence on its behavior, simulation bandwidth, accuracy, and stability. The PHIL methodology is applied in [
21] for power system analysis using the designed model of electromechanical converters to apply loads to real components of the power system network. The authors highlight the advantages of real machine modeling in autonomous power systems where, in the case of a system fault, the machine load can become a power source.
Background knowledge of the CHIL simulation methodology and its design principles are presented in [
22,
23]. The authors discuss different CHIL setups used for generation units and network investigations. The papers include a discussion focused on the relevance of the CHIL test with respect to standardization frameworks.
The CHIL-based validation of a developed energy storage management solution is conducted in [
24]. A testbed was applied to evaluate the DERs’ use of an optimization algorithm based on the forecasting of generation, consumption, and real-time tariffs. In the presented solution, the Distributed Network Protocol 3 (DNP3) was applied to communicate the tested controllers with DRTS. A CHIL validation of the implemented design is presented in [
25]. This paper introduces the energy management system for integrating distributed renewable energy sources (RES) and battery energy storage systems (BESS) to meet the electric vehicle load demand.
The verification of the online self-adapting algorithm for the distributed generation controls designed to deal with local power quality issues is shown in [
26]. In this paper, the authors applied a CHIL set up to assess the implementation of artificial intelligence-based controllers and identify problems with the system’s response.
The literature proves that the use of digital simulators is beneficial in the development of drivers and control systems; however, there are limitations in the implementation of the HIL method due to the complexity of power electronic interfaces. This topic is further discussed in [
27].
In this paper, we present the HIL validation of an energy management system for LV distribution networks developed under the project “Active prosumer”. This paper focuses on the design and development of the testbed for the system to test the operation of controllers while taking communication issues into account. Details regarding the system control scheme and its simulation verification are omitted here, as they are the subject of another publication. It should be emphasized that the developed controllers will be implemented in a real distribution network and will be integrated into the existing Supervisory Control and Data Acquisition (SCADA) system of the distribution network operator (DSO). Hence, the presented study is not only a demonstration of the possible application of the RTDS simulator but a practical implementation of modern technology to solve the urgent problem specified by the DSO.
On the basis of our literature review, the following can be indicated as the original contributions of this paper:
discussion on the communication challenges related to DG controllers and the need for the experimental evaluation of real hardware,
conceptualization and implementation of a testbed for the experimental validation of controllers based on real-time digital simulators,
integration of different communication systems (in particular the cellular network) and advanced metering infrastructure into one testing environment,
use of a prosumer infrastructure model consisting of real photovoltaic and battery storage inverters and loads,
application of both CHIL and PHIL methodology into a single testbed.
The paper is arranged as follows.
Section 2 describes the main features of the developed control system.
Section 3 presents the system prototype designed for the selected LV network and the developed HIL testbed. The results of our experiments are included in
Section 4. Our conclusions are summarized in
Section 5.
2. Description of the Control System
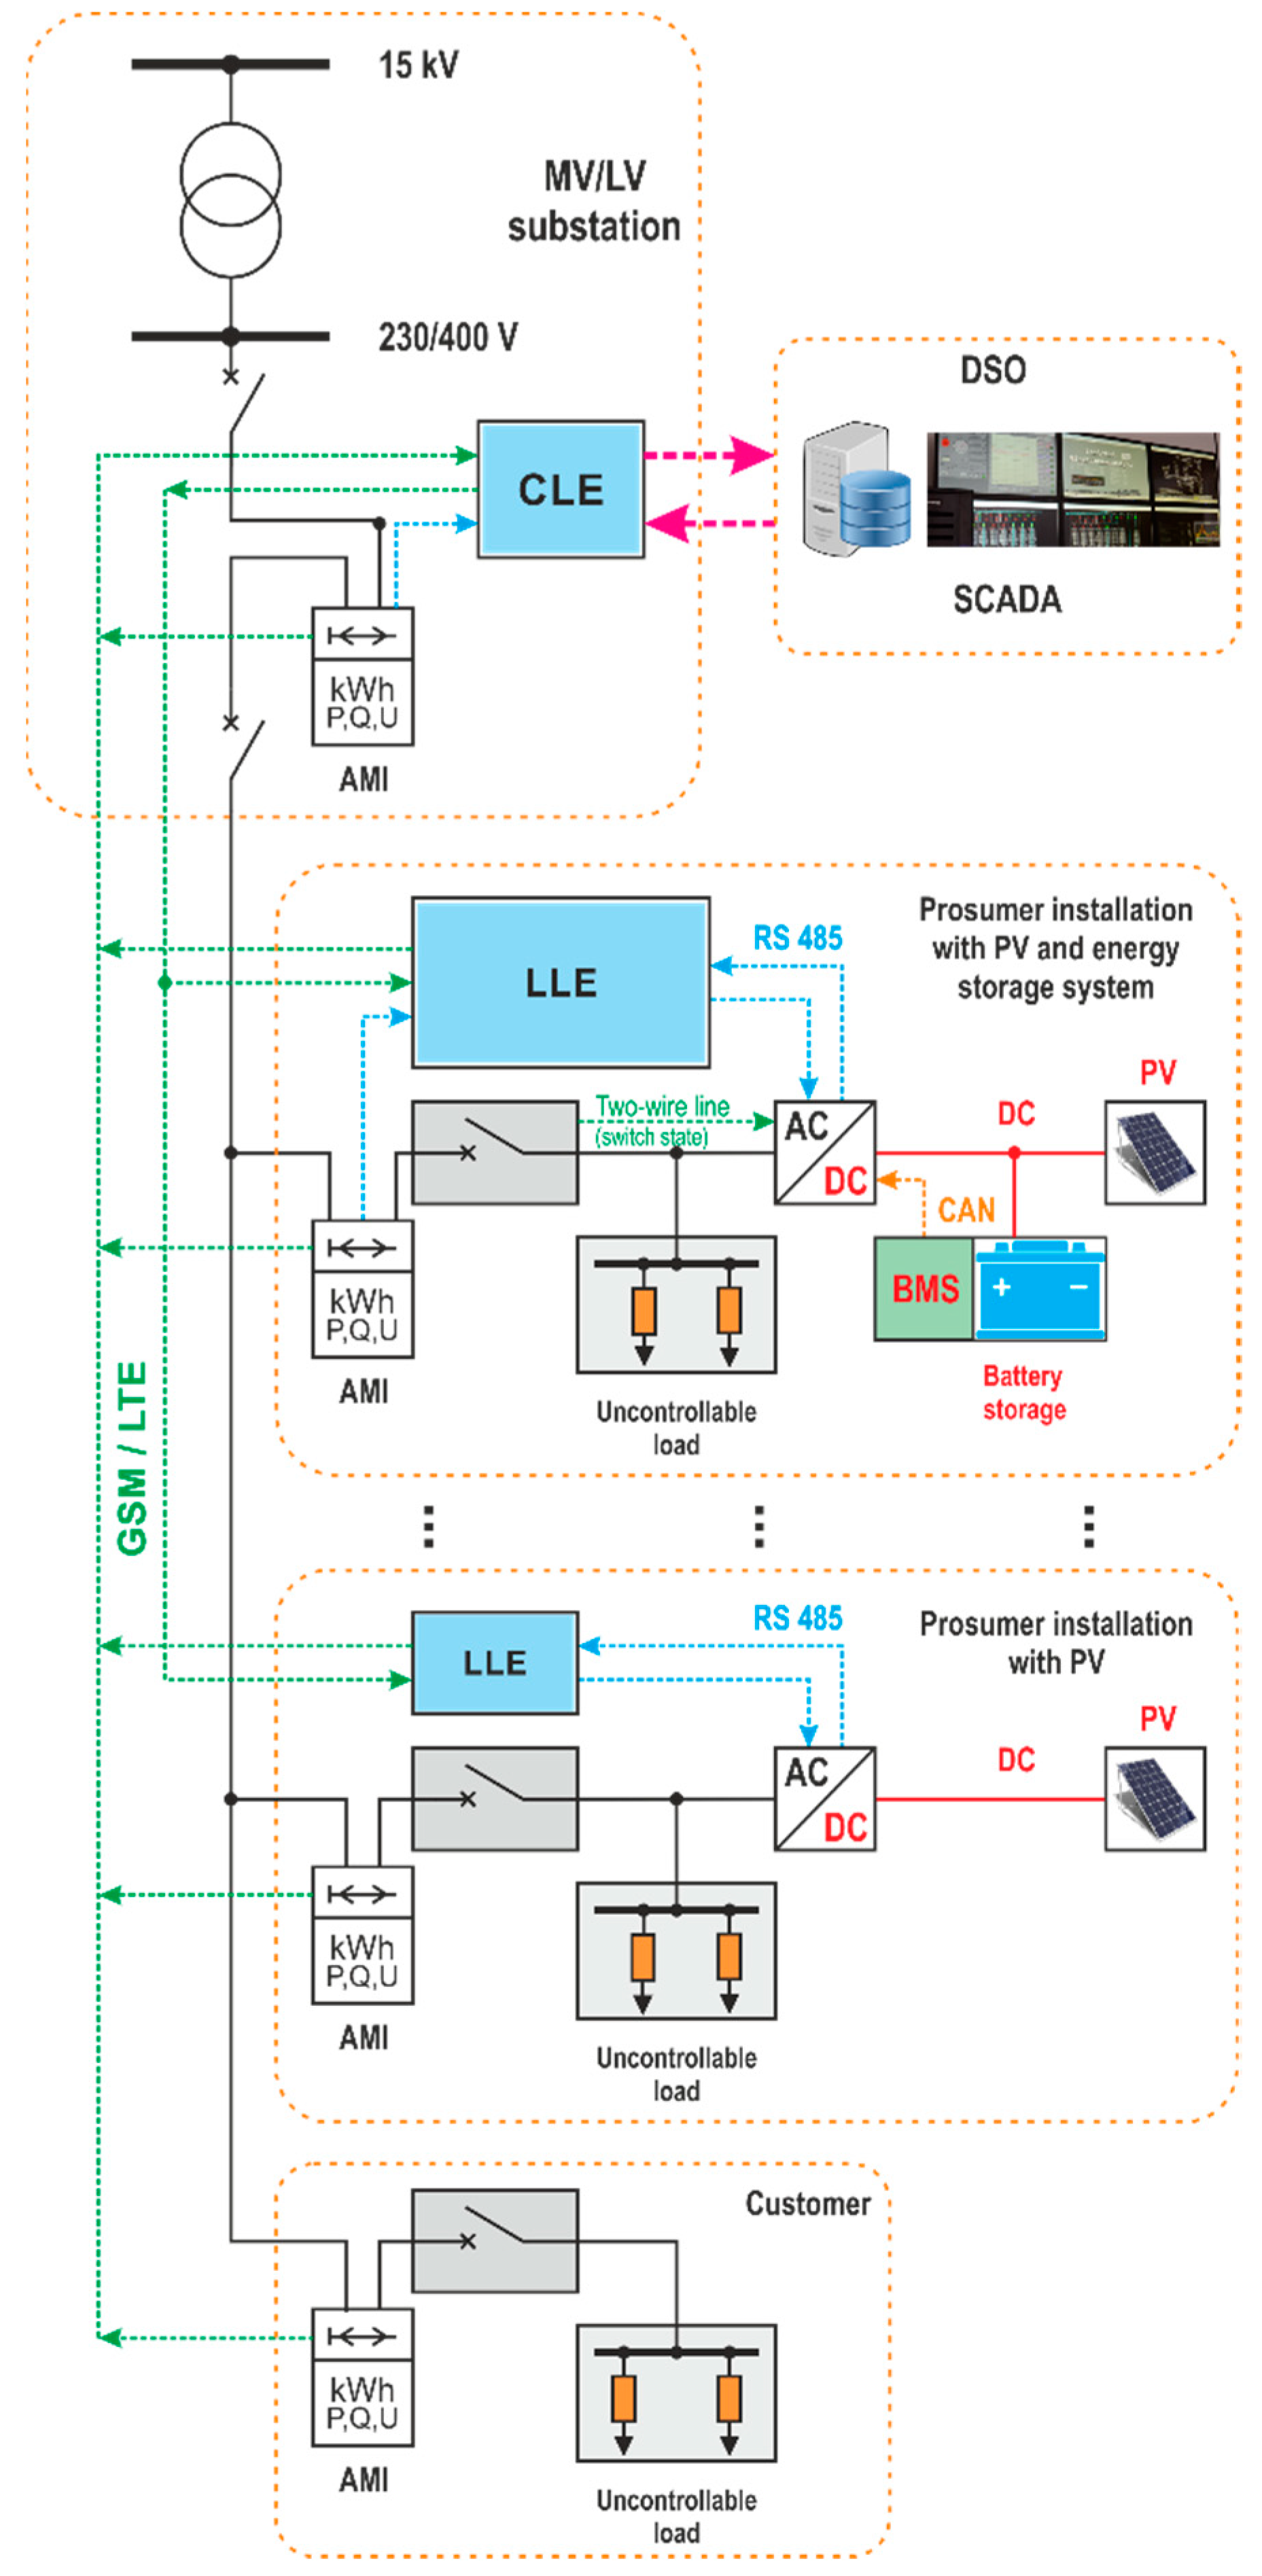
The control system was designed and developed for LV distribution networks with a high penetration of renewable sources, mainly rooftop PV installations (
Figure 1). The system is dedicated to networks with energy consumers and prosumers that belong to two categories: 1—prosumers only equipped with PV sources, and 2—prosumers equipped with both PV sources and BESSs. The principal functionalities of the system were designed according to the DSO requirements. The system must monitor whether the capacity of the MV/LV transformer is exceeded and whether the RMS voltage values in the network nodes are within the required range. It is possible to monitor and control each of the phases separately. The applied strategy assumes the use of controllable devices located in prosumer installations.
For the control of voltage variations, the indirect voltage regulation method was applied through the change of the power flow in the network. Voltage change
in the network node
k, induced by the change of active
and reactive
powers generated/consumed in node
i, results from the change of voltage drop on the network impedance and is calculated as:
where
Pi,
Qi–phase active, reactive power in node
i (power generated—“−“, power consumed—“+”),
,
–voltage sensitivity factors.
Regulatory abilities are obtained by the injection/absorption of the reactive and/or active power to/from the network nodes where the controlled devices (PV, BESS) are connected. Values of the powers are calculated according to Equation (1) based on the known sensitivity factors, determined by means of measurements in a separate process. Although both active and reactive power are involved in voltage regulation, the effectiveness of each depends on the X/R ratio of the network. In LV networks, where the resistance value is typically higher than the reactance, the regulation by means of active power is more effective.
Due to the differences in control capabilities of prosumers’ infrastructures, the control can be performed at three levels: (1) control of PV sources with on/off regulation only, (2) control as in level 1 and additionally through the limitation of active power generation and generation/consumption of reactive power, (3) control as in level 1 and additionally by regulation of active and reactive power of the BESS. Consumers and prosumers are connected to the network via advanced metering infrastructure, i.e., AMI meters.
The control strategy is centralized; thus, the control system is hierarchical in structure and consists of central and local layers,
Figure 2. The central controller (central logic element—CLE), located at the MV/LV distribution substation, is assigned to the upper layer. The local controllers (local logic element—LLE) together with controllable prosumer devices constitute the lower layer.
The CLE identifies the network disturbances based on the measurement values acquired in cycles from the AMIs. If intervention is necessary, CLE sends appropriate setpoints to the selected LLEs, which ensure the highest control efficiency. The selection of LLEs to be controlled is made based on sensitivity factors. Reactive power has always a priority, only when it is not sufficient to obtain the expected effect, the active power is also changed.
If the prosumer is only equipped with a PV installation, the LLE is used to provide the measurements and status data from the PV inverter to the CLE. In the case of network disturbances, the CLE may send a signal to turn off or to change the P/Q generation for the PV inverter. As there is no direct link between the CLE and PV inverter, the LLE is used to forward commands. In the case of prosumer installations equipped with BESS, under normal conditions (the voltage limits are not exceeded and the transformer is not overloaded), the LLE performs a local regulation that is oriented to the needs of the prosumer. For example, BESS can be used to minimize power exchange between the prosumer’s installation and the distribution network to reduce energy costs, other strategies are also possible. The operation of the prosumer program uses voltage and power measurements from the local AMI meter. In the case of network disturbances, the CLE override LLE operations by sending new P/Q power set-points for the BESS and/or PV inverter if necessary.
The regulation is performed in cycles. The duration of a single computational cycle is a period of time that must be sufficient for: sending the new set-point and executing the command by PV or BESS, confirming the operation between CLE and LLE, making new measurements by AMI meters and sending them to the CLE for further processing, and is in the range of tens of seconds. The process is continued until all controllable quantities are in the required range or until the control abilities of the system are exhausted. The system has the ability to withdraw the changes imposed by the CLE on prosumer inverters if no further violation is observed. The reduction is conducted in reverse order compared to the control initiation. The process is repeated until the control is completely reduced or further violations occur.
The correctness of the developed control strategy and applied algorithms were verified by means of simulations using the model of the network from
Figure 1 with the following data. The rated power of the distribution transformer is 63 kVA, impedance voltage is 4.5%, and the short-circuit power of the MV network is 500 MVA. The cable lengths and cross-sections, as well as other details of the networks, are shown in
Figure 1. Loads nominal apparent power is 7 kVA with cos φ = 0.93. Each of the prosumer and consumer installations is three-phase; however, some of the loads and all PV sources are one-phase. The power of PV sources is given in the
Figure 1. Additionally, prosumers no 4, 5, 6, and 7 are equipped with a three-phase, 12 kW BESS. Each installation is equipped with a measuring system.
The simulation model of the considered LV network was developed in a PSCAD/EMTDC environment. The network control algorithm was developed in Matlab, so it was necessary to add a communication interface between PSCAD and Matlab to allow for the required measurement data to be exported from the PSCAD simulator to the control system in Matlab [
28]. The performed tests confirmed the correctness of the control strategy and applied algorithms. Simulation studies will not be presented here because they are the subject of another publication.
3. HIL Validation
In order to be able to carry out profound tests of the controllers’ prototypes, it was necessary to recreate the operating conditions of the selected distribution network and use the actual components with which the controllers will cooperate. As the controllers communicate with each other and AMI meters using the GSM network and taking into account that the AMI meters may be provided by different manufacturers (with different software versions), it was not possible to model these elements. As a result, the test platform must combine the LV network simulator, real AME meters, and real GSM communication infrastructure.
3.1. Control System Implementation
3.1.1. Communication Architecture
The communication architecture of the control system is depicted in
Figure 2. It is composed of the following key components:
CLE controller and AMI meter located at the MV/LV substation,
LLE controller and AMI meter located at each of the prosumers’ installations,
AMI meter located at each of the consumer installations.
The DSO requirements regarding the system structure are that the CLE and LLE communicate with the AMI meters via a proprietary cellular network.
The CLE controller communicates with the SCADA system and the LLE devices using DNP 3.0 over IP protocol and with the electricity meters using Device Language Message Specification (DLMS) over IP protocol. It also sends measurement data and logs to the SCADA and provides (on demand) the recorded measurement data to the external AMI system via the File Transfer Protocol (FTP) or the Secure Shell 2.0 (SSHv2) file transfer service.
If the prosumer installation is equipped with BESS, which is used for performing local energy management in the prosumer installation, the LLE reads voltage and power measurements from the local AMI meter connected via the RS485 bus (the other light blue link) using the High-Level Data Link Control (HDLC) profile of the DLMS protocol.
If LLE communicates only with the PV inverter (there is no BESS), its functionality is reduced. The communication with the PV inverter is executed through an RS-485 local bus or Ethernet LAN (blue link), using one of the standard industrial communication protocols (such as MODBUS RTU and MODBUS TCP) or a proprietary communication protocol implemented in the inverter.
3.1.2. Controller Hardware
To provide sufficient hardware resources, both the CLE and LLE controllers,
Figure 3, were manufactured from high-performance components, including an ARM Cortex-A microprocessor, a Double Data Rate (DDR) system memory, and a Solid-State Disk (SSD). To enable communication with system components, they provide a wired Fast Ethernet interface, a built-in LTE/HSPA+/GSM dual-SIM modem, and RS 485 serial ports. To provide real-time responses to measurement changes, the firmware is based on a proprietary real-time operating system developed by APATOR S.A.
The firmware includes standard communication protocols including DNP 3.0, MODBUS RTU/TCP, and DLMS, as well as proprietary communication protocols for communication with legacy PV inverters. The devices are fully programmable and configurable. The hardware programmability was expanded by implementing a programmable arithmetic/logic, which was used to implement the local prosumer’s program in the LLE. This approach makes it much easier to modify the algorithm and adapt it to various types of PV and BESS inverters.
Despite the fact that the devices are to operate in well-protected, proprietary GSM subnetworks of the DSO, which at this time are not exposed to cyberattacks, they implement a whole variety of cybersecurity technologies, which provide safe operation even on public GSM networks. These include password-protected user accounts, network communication channels encrypted with Transport Layer Security (TLS) v1.2, a Virtual Private Network (VPN) based on Internet Protocol Security (IPSec) tunnels, an SSHv2 secure management console, and file transfer and support for AMI routers with Ethernet port authentication conforming to IEEE 802.1X standard. For the services mentioned, the device implements a secure and easy-to-manage credential database with online certificate enrollment using an online certificate authority that supports the Simple Certificate Enrollment Protocol (SCEP). It should be underlined that using any of the above services is optional and requires appropriate IT infrastructure provided by the DSO or another service provider.
3.2. CHIL Testbed for Controllers
In addition to the verification of the control algorithm, the complete prototypes were validated for interoperability with existing network infrastructure, in particular in the scope of communication solutions.
In the general scenario, the digital real-time simulator (DRTS) can be used to calculate the instantaneous voltages and currents of the reference power network. Then, the voltages and/or currents for selected nodes and branches are derived with the output card and amplified. Changes in the device under test (DUT) are measured and introduced back into the simulator through the input card, thus closing the loop (
Figure 4).
Because the DUT is not a single device in the analyzed solution but instead comprises CLE and LLE controllers and since there are specific DSO requirements regarding communication with the chosen AMI, the HIL structure from
Figure 4 had to be extended as per
Figure 5. The RTDS simulator (from RTDS Technologies Inc., Winnipeg, MB, Canada) was used. The HIL technique required the use of three output and two input cards and three power amplifiers.
To ensure the correct operation of the developed control system, it was necessary to use at least one CLE, one LLE, and three AMI meters. The CLE and the first AMI were installed in the transformer substation, the LLE and the second AMI in the prosumer installation, and finally, the third AMI was located at the end of the network.
Based on this structure, the LV distribution network model was created in the RSCAD,
Figure 6. All the main elements of the network were modeled using the RSCAD component library. Prosumers 1, 2, and 4 were simulated, while prosumer 3 was represented by real devices (a load and a BESS inverter). For the purposes of this study, the resistance and reactance that represent the lengths between individual nodes of the feeder were equal (R = 0.3 Ω, L = 0.54 mH), as were the lengths between the feeder and prosumer nodes (R = 0.15 Ω, L = 0.27 mH). The maximum active power of simulated prosumers 1, 2, and 4 was 5.5 kW (in each phase) and the power factor cos φ was 0.93. The prosumer power could be controlled separately in each phase. PV sources were simulated in the RSCAD using single-phase ideal current sources. The maximum active power of photovoltaic systems was equal to the rated power of the loads (5.5 kW). The load of prosumer No. 3 could be manually changed from 0 to 10 kW. The nominal apparent power of the three-phase BESS was 10 kVA.
The calculated voltage and current values were transmitted to the analog output cards (GTAO). As the RTDS analog outputs operate over a range of ±10 V peak, it was necessary to amplify the voltage and current values. This way, the AMI meters (the same as those installed in the real LV network) could measure real power flow and voltages. All AMI meters used in the testbed had the same rated voltage (3 × 230/400 V) and the same reference current (5 A).
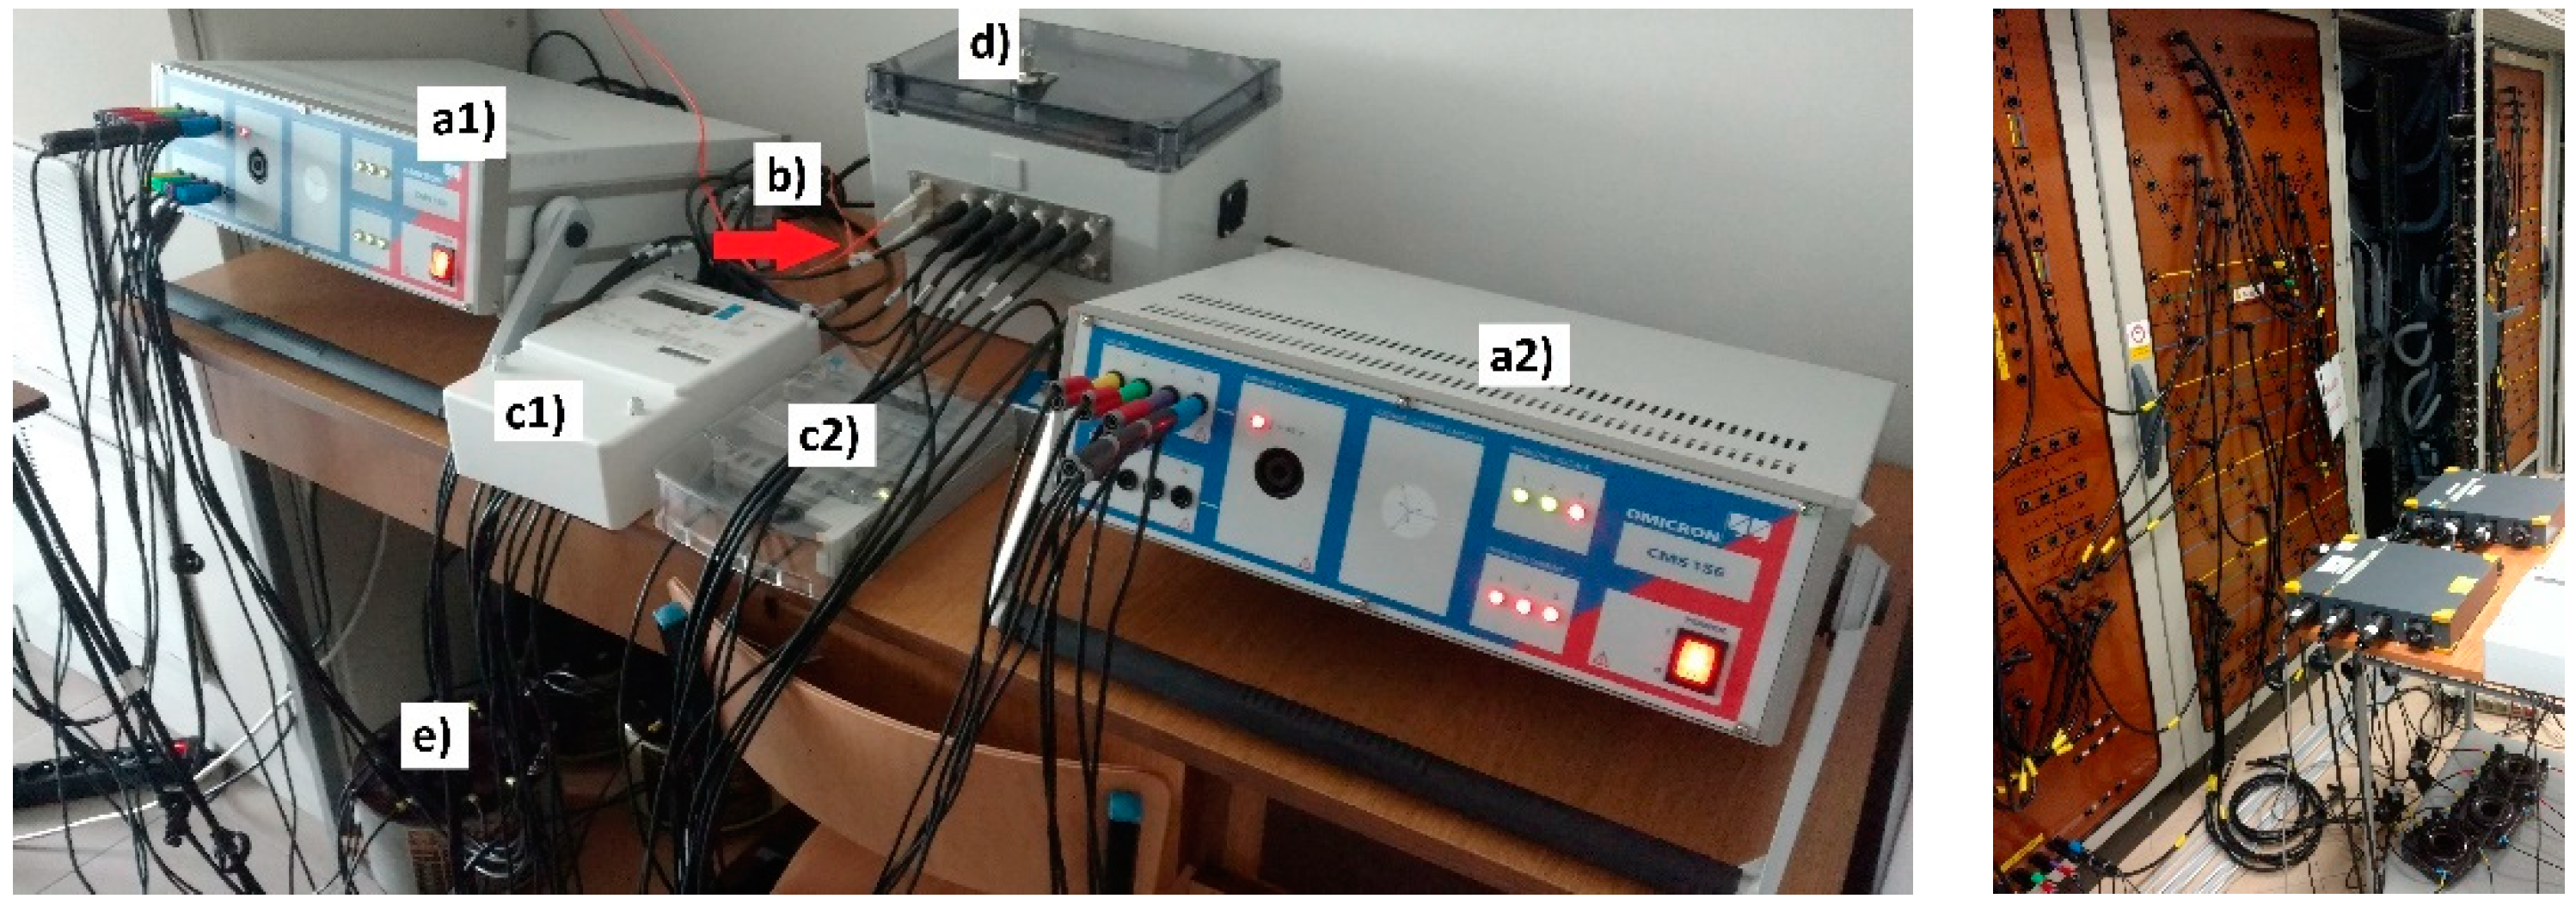
The AMI_1 was connected to the node located at the beginning of the network (“Node —Transformer” in
Figure 6). It was used to measure the power flow and voltages calculated in the transformer substation node. The required signals were transferred from the RTDS simulator to the analog output card via fiber optics. As the amplifier (Omicron CMS 156) is equipped with separated voltage and current outputs, it was necessary to use three current transformers (ratio: CT = 5/5) between the amplifier and the AMI meter (
Figure 7). Note that the initial scaling of the currents for this node was performed in RTDS.
The connection between the meter and the central controller is possible via RS-485 (default) or embedded in the AMI GSM router. The CLE communicates with LLE through a GSM network.
The AMI_2 was connected to the prosumer 3 installation with real R/L loads and a real battery storage system (“Node—Prosumer”) as shown in
Figure 7. In this node, the simulated voltage signals were amplified by the voltage amplifier (NetWave 60 kVA) with the power recovery module. Power recovery was necessary due to the bidirectional power flow from the BESS. As the AMI-rated input current is 5 A, the prosumer current was scaled down with the use of the current transformer (ratio: CT = 25/5). In parallel, the LEM voltage and current transducers were used to connect the feeder to the RTDS analog input card (GTAI). This setup closed the loop so that the real current values could be used as feedback to adjust the virtual voltage in the simulator.
The AMI_3 m, located at the end of the line (“Node line end”), had a similar setup to AMI_1.
All three AMI meters were preliminary configured, and their readings were evaluated to ensure that all scaling (in RTDS itself, output/input cards, amplifiers, transducers, and current transformers ratios) was correct.
Subsequent tests showed that the 60 s calculation cycle of CLE is sufficient and allows up to four sets of measurement data to be delivered to the controller.
3.3. PHIL Configuration
In the configuration presented in
Figure 5, the LLE directly controls the real (commercially available) energy storage. Since the BESS was not available in the initial phase of system testing, it was decided to emulate its operation with the use of RTDS and a laboratory current source of the rated apparent power of 10 kVA. Unfortunately, this inverter must be controlled with reference currents, so it could not be directly connected to the LLE. Therefore, the P/Q power setpoints from the LLE were introduced to the RTDS, converted into the corresponding currents (with A/D converter), and finally sent to the BESS emulator. As the current wave must be synchronized with instantaneous voltage, it was necessary to create an additional HIL with the use of analog output and input cards (cards: GTAO 4 and GTAI 2) (
Figure 8).
3.4. Communication Issues, Limitations, and Test Considerations
The control system implemented in a real distribution network will consist of tens of separate devices located over a wide area. Therefore, it can be vulnerable to communication issues, especially any failure or congestion of the GSM network. Additionally, variable propagation delays and limited network channel throughput must be considered. Dealing with all these potential problems requires appropriate system design, including:
dead peer detection and automatic maintenance-free connection reestablishment once data link (e.g., GPRS packet service) is restored,
taking into account the communication channel state and data status in the control algorithms, distinguishing between valid and invalid and up-to-date and out-of-date data,
ability to operate with limited functionality while the communication with some LLEs and/or electricity meters is lost and some data are invalid or out-of-date,
automatic data retransmission on datalink or application layer (recommend using TCP network channels where applicable),
progressive retransmission delay in order to prevent network congestion caused by data retransmission,
well-designed process sequences and timings that deal with data readout delays,
time-based data value filtration needed to deal with transient states caused by data readout delays,
well-adjusted request schedules, which are tradeoffs between the system time response and the GSM network limitations,
recording all communication issues in the event log for potential problem detection and investigation, transmission media evaluation, communication schedule optimization, etc.
It is worth mentioning that the abovementioned problems may occur in the testbed and thus can be identified and mitigated. For example, propagation delays and limited bandwidth of GPRS network connections depend on the actual utilization of the GSM network rather than the distance between devices. Thus, any mentioned communication issues and limitations, which normally exist, apply to the testbed as well.
The most important difference between the testbed and the real environments is the scale of implementation, i.e., the number of cooperating devices involved in the control system. While in the real environment there can be tens of cooperating LLE controllers, electricity meters, and inverters, the testbed consists of only a few devices. However, this limitation affects the algorithm efficiency more than the communication (the fewer devices to control, the smaller the effects can be achieved).
Obviously, it is not possible to simulate and test all cases and scenarios that can happen in a real network. For instance, in the testbed, it is not possible to evaluate whether or not the CLE and its communication subsystem are capable of handling ten or more prosumer sites (due to the limited number of AMI meters that can be connected to the simulator) or to test communication with all potential inverter models that may be applied in the real prosumer infrastructures.
Nevertheless, there are many aspects of the system operation that can be tested in the laboratory, including:
the interaction between the control system and the power distribution network,
the CLE algorithm’s implementation,
the local prosumer controller operation with real or simulated local energy storage,
consistency of implementation and configuration of communication protocols in all devices involved in the control system,
completeness, correctness, timeliness, and consistency of data in all system components,
correctness of control commands issued from the CLE to the LLEs and further to the inverters,
data propagation delays and real data throughput of most of the communication channels,
dead peer detection and automatic connection reestablishment,
processing of invalid and out-of-date data,
dealing with transient states caused by data readout delays,
the quality of the communication channels—by measuring various indicators such as the number of communication losses per day,
system activity recording (event log and regulation recordings).
4. Test Results
As the control algorithm was initially verified using the PSCAD simulator, the primary HIL testbed commissioning should focus on the elimination of connectivity problems. This way the incompatibility of the AMI firmware and some faulty implementation of communication protocols were identified. It should be emphasized that the full control over all elements of the testbed made it possible to quickly identify such problems.
The tests included the validation of:
the AMI meter readings,
the communication between AMI–CLE, CLE–LLE, LLE–BESS, and LLE–PV,
the ability to re-establish communication between the CLE and LLE controllers after a controller power failure,
the system response to the loss of AMI–CLE communication.
Another set of tests included the assessment of the system response to various network events, such as:
continuous load changes of prosumer 2 (individually for each phase),
continuous power generation and consumption changes in the prosumers (1, 2, and 4),
or pre-defined power generation and consumption step changes in the prosumers (1, 2, and 4).
The test results, presented in
Figure 9 illustrate the response of the control system to the voltage decrease caused by prosumer 2′s loads (one of the virtual prosumers simulated in RSCAD). It was expected that the load changes in prosumer 2 would result in clear voltage responses, as it is located close to the center of the network and close to prosumer 3 (with AMI meter). Although prosumer 2 is not connected to the AMI meter itself and cannot be “monitored” by CLE, it still affects the power flow in the network and the voltage level. This example can illustrate a scenario where some legacy meters (not integrated into the control system) are still used and how the system deals with them.
The duration of the test was 60 min. The lower voltage limit was set to 217 V (in the final controller configuration, it will be set to 10% of the declared voltage, as in the EN 50,160 standard). The AMI meters, located in neighboring nodes, transmitted to CLE the readings of voltages and active and reactive powers every 15 s (the highest frequency available for applied meters). However, to improve the clarity of the graph, the single computation cycle of CLE was extended from 45 s (default) to 120 s.
All measurements were carried out using RSCAD software and class “A” power quality meters (Fluke 1760).
The orange line (Pload [kW]) presents prosumer 2′s load profile. One can note that at the beginning and at the end of a simulation, for a load equal to zero, the voltage in the prosumer 3 node is nominal and equal to 230 V. A 2.6 kW load results in the voltage decreasing to 217 V (12 min of the simulation). A further increase in the load causes the voltage to drop below the acceptable threshold. The dashed and solid blue lines show the RMS phase voltage variations (in prosumer 3 node) with the central controller disabled (U [V]CLE disabled) and enabled (U [V]CLE enabled), respectively.
The network operation, without CLE control, resulted in a significant voltage drop and could not be accepted by the network operator.
Over the 14 min of the simulation, the CLE sends the reactive power request (QBESS [kvar]) to the BESS (reddish rectangle), which results in a voltage increase. In the following steps, the reactive power must be increased again as the load increases continuously. The yellowish rectangles highlight the moment when CLE decided to request active power (PBESS [kW]) too (because the reactive power could not be increased further due to the limitation of the nominal power of the real storage system).
In the next step (pinkish rectangle), the partially unsuccessful operation can be observed. In this case, the previous active power regulation resulted in a significant voltage increase. The CLE decided that the BESS active power could be reduced, calculated a new P set-point, and sent it to the LLE for execution. However, in the meantime, the loads were still increasing and the voltage dropped again below 217 V. In the following step, the system increased the active power generated by the BESS and the voltage reached the expected level.
The greenish rectangle shows the withdrawal of the P/Q power control commands. The reduction of the control begins with the release of active power, and when it is completed the reduction of the reactive power begins.
The different operating conditions of the LV network and the response of the management system are shown in
Figure 10. As in the previous case, the testbed was connected to real prosumer-controlled loads, BESS and AMI meters, and LLE and CLE controllers. The communication between LLE and CLE was carried out using the GSM network.
The yellowish color is used to mark the time when the LLE controller operated in the prosumer mode (the BESS compensated the active power in the prosumer’s installation). Set-points for the BESS were calculated based on current exchange power (Pex [kW]) transmitted from the AMI meter to the LLE (through wired communication). As a result, each of the changes in active power (Pload [W]) resulted in a change of active power generated by BESS (PBESS [kW]). It can be observed that the Pex changes briefly with each load variation. As the AMI meters operate in 15 s cycles, the LLE updates the BESS setpoints with delay.
The bluish color indicates the time in which the CLE controller recognized the voltage disturbance and overrode the LLE operation by sending the new setpoints for BESS.
The lower voltage limit was set at 215 V and the upper limit at 245 V. The voltage increase (U [V]) above the acceptable level at 15:26 p.m. was caused by the large generation of PV systems located in the virtual network. After detecting overvoltage, CLE sent new active (PBESS [kW]) and reactive (QBESS [kvar]) power set-points to the BESS and hence the voltage was decreased below 245 V. In this case, the response delay was larger (45 s) because CLE had to connect with numerous AMI meters over the GSM network. Reducing the generation of PV sources caused a voltage reduction at 15:29 p.m. However, as the BESS was still executing settings from CLE, the voltage reduction was greater (to 227 V instead of 230 V). The CLE withdrew the settings after the next calculation cycle and the voltage itself returned to the value of 230 V. At the same time, the LLE started to balance the active power in the prosumer’s installation (yellowish area). At 15:29 p.m., the voltage dropped below the lower limit (to 212 V) and the CLE was activated again. Later at 15:35 p.m., the voltage increased because the loads in the network were reduced. After another 45 s the BESS control was withdrawn and the LLE returned to performing the local regulation in the prosumer’s installation.
5. Conclusions
The development of new control systems for power networks and installation of prototype controllers that implement this control is a multi-stage process that includes the design and implementation of components and the validation of the whole system. In this process, HIL methods are of great importance, as they can prove the correct operation of the system and its real-world applicability or indicate the need for modifications.
In this paper, we presented the use of the HIL method for the validation of an LV network control system developed for a network operator. The system is dedicated to energy management and the mitigation of power quality disturbances caused by the operation of renewable energy sources. The testing platform was based on the RTDS system and the RSCAD software. The CLE and LLE controller prototypes were tested using the CHIL method, and the PHIL setup was used to emulate the BESS operation—both methods were included in a single testbed. As presented, the management system requires GSM and RS-485 communication, and each of them was also applied to the test platform too. All of the applied measures allowed for testing the operation of real devices as in real conditions.
It should be noted that the HIL tests can provide more observations regarding the operation of the control system than traditional simulations could offer. One of the issues is the real-time delay between the measurements provided to the CLE from AMI meters, which impacts the control accuracy. Such delays not only result from the technical properties of the equipment but also from real GSM network traffic.
The limitations of the presented testbed result from a number of available output cards and power amplifiers together with the input cards needed to create the hardware-in-the-loop structure. It should be mentioned that in the case of the prosumer nodes, a power amplifier with a power recovery module is needed, as this is a node where real loads and photovoltaic and battery storage inverters are connected. In order to meet the minimal requirements of the implemented management system, the developed test platform is equipped with three (three-phase) electrical nodes that are used to test the controller prototypes.
The main contributions of this paper include a discussion on the communication challenges related to DG controllers and the resulting need for experimental evaluations of real hardware; the presentation of an original test platform based on RTDS; the integration of different communication systems (in particular the cellular network) and advanced metering infrastructure into a single testing environment; and the use of a prosumer infrastructure model consisting of real photovoltaic and battery storage inverters and loads, applying both CHIL and PHIL methodologies to one testbed.
The results obtained proved the proper operation of the controllers and the BESS. The developed system will be implemented in selected real Polish LV networks, and the testbed will be used for further control algorithm development and component testing.


 ,
, 