Article

Current and Stray Flux Combined Analysis for the Automatic Detection of Rotor Faults in Soft-Started Induction Motors

by
Angela Navarro-Navarro
1,
Israel Zamudio-Ramirez
1,2,
Vicente Biot-Monterde
1,
Roque A. Osornio-Rios
2 and
Jose A. Antonino-Daviu
1,*
1
Instituto Tecnológico de la Energía, Universitat Politècnica de València (UPV), Camino de Vera s/n, 46022 Valencia, Spain
2
HSPdigital CA-Mecatronica Engineering Faculty, Autonomous University of Queretaro, San Juan del Rio 76806, Mexico
*
Author to whom correspondence should be addressed.
Energies 2022, 15(7), 2511; https://doi.org/10.3390/en15072511
Submission received: 24 February 2022 / Revised: 22 March 2022 / Accepted: 28 March 2022 / Published: 29 March 2022
(This article belongs to the Special Issue Advances in the Field of Electrical Machines and Drives)

Abstract

:
Induction motors (IMs) have been extensively used for driving a wide variety of processes in several industries. Their excellent performance, capabilities and robustness explain their extensive use in several industrial applications. However, despite their robustness, IMs are susceptible to failure, with broken rotor bars (BRB) being one of the potential faults. These types of faults usually occur due to the high current amplitude flowing in the bars during the starting transient. Currently, soft-starters have been used in order to reduce the negative effects and stresses developed during the starting. However, the addition of these devices makes the fault diagnosis a complex and sometimes erratic task, since the typical fault-related patterns evolutions are usually irregular, depending on particular aspects that may change according to the technology implemented by the soft-starter. This paper proposes a novel methodology for the automatic detection of BRB in IMs under the influence of soft-starters. The proposal relies on the combined analysis of current and stray flux signals by means of suitable indicators proposed here, and their fusion through a linear discriminant analysis (LDA). Finally, the LDA output is used to train a feed-forward neural network (FFNN) to automatically detect the severity of the failure, namely: a healthy motor, one broken rotor bar, and two broken rotor bars. The proposal is validated under a testbench consisting of a kinematic chain driven by a 1.1 kW IM and using four different models of soft-starters. The obtained results demonstrate the capabilities of the proposal, obtaining a correct classification rate (94.4% for the worst case).

1. Introduction

Squirrel cage induction motors (SQIM) are indispensable elements widely used as powertrain drives in an extensive variety of industrial applications, constituting approximately 89% of the power demanded in industrial plants [1]. Their high efficiency, low cost, easy maintenance, and robustness have allowed the proliferation of these types of machines as the main drives for many mechanisms and processes, namely, large capacity exhaust fans, driving lathe machines, crushers, oil extracting mills, blowers, pumps, compressors. When the application requires continuous starts and stops of the driving motor, break/damage may arise due to the thermo-mechanical stresses developed in the rotor bars, especially during the start-up transient of the machine [2]. Thus, squirrel cage induction motors are vulnerable to frequent starts/stops and/or excessive load torque variations, and eventually a failure can occur in the rotor bar or end ring of the rotor cage [2]. Although a motor with damage in the rotor cage can continue operating, their performance and lifetime are degraded, which eventually may lead to the shutdown of the involved processes, causing huge time and economical losses if pertinent maintenance actions are not taken. In this context, in order to prevent/reduce the negative effects raised by continuous starts/stops and transient states, different starting systems are used in the industry, such as the star-delta starting, starting via auto-transformer or starting via soft-starters [3]. These methods have allowed a reduction in the high-amplitude currents developed under the start-up transient by controlling some parameters, such as the voltage profile, current profile or torque profile. In this context, the inclusion of soft-starters has enabled control of the start-up current profile by means of power electronic circuits containing thyristors installed in the different power source phases of the motor supply line. Subsequently, by changing the thyristors conduction time, a variation on the RMS value can be achieved, which in turn modifies the starting current profile. Thus, many devices have the possibility to limit the current during the startup transient, but most of them only allow the setting of the voltage and the time. However, although these devices reduce the starting current, this does not prevent motor faults from occurring. In fact, the use of soft-starters amplifies certain harmonics and introduces other frequency components, which could certainly make the motor diagnostic more difficult, even leading to erratic final diagnosis [4,5]. In this regard, although systems and mechanisms have been developed to avoid/reduce rotor-related failures, they can still occur. Hence, several monitoring systems and fault diagnostic techniques have been developed in order to prevent the costs/side effects associated with unexpected failures. Thus, the aim is to detect the failure in its initial stages, before catastrophic or irreversible damage can occur. Most of these techniques and proposed methodologies have used relevant information extracted from different physical quantities, which can be measured by means of primary sensors. In this regard, some common physical magnitudes that have been reported in the available technical literature are, among others: vibration signals [5], partial discharges [6], current signals [7], and stray fluxes [8]. Each technique has provided satisfactory results for the diagnosis of certain types of faults. For example, some previous works have proposed different methodologies relying on a single magnitude for the automatic classification of broken rotor bars for motors started by direct online (DOL) methods. In [9], the authors analyzed the stray flux signals with a feedforward neural network (FFNN) for the automatic classification, reporting a 97% effectiveness. By its part, Rivera et al. [10] studied specific signatures and patterns associated with a fault condition from current signals by means of a time-frequency (t-f) map, achieving a 97.5% overall effectiveness. However, as pointed out in some papers [11], the analysis of a single magnitude may be suitable to detect certain faults, but not all, and even, when the technique has exhibited satisfactory results in certain cases, there are specific situations in which the appropriate technique can provide false indications. In this regard, Zamudio et al. [12] proposed the fusion of stray flux and current signals by means of a feedforward neural network (FFNN), achieving a 95% overall effectiveness. Other works have proposed the use of convolutional neural networks (CNN) for the same purposes, reporting an accuracy rate higher than 97% by analyzing the current demanded by the motor as a principal magnitude, however, the method is limited to motors started by direct online (DOL) methods [13,14]. Moreover, although soft starters are widely used in industry, the number of works in the literature about the automatic diagnosis of electric motor failures started with these types of devices is limited. In this regard, Pasqualotto et al. [15] proposed an automatic classification technique for diagnosing broken rotor bars by analyzing stray flux signals, and using a convolutional neural network (CNN) as a main classifier. They achieved 94.4% accuracy. However, the use of this kind of technique demands high computational resources, and an elevated number of samples in order to train the method, which, in most of the cases, is very difficult to achieve under practical terms. Hence, some authors have proposed electric machine models by collecting data under healthy and faulty conditions [16], by means of the hybrid finite element method (FEM)—an analytical model for reducing the simulation time.
Considering the above-mentioned statements, recent works have shown that the analysis of two different quantities at the same time can provide a more complete analysis and can avoid false indications [12]. The proposed systems combine stray-flux and current signal analysis. Thus, the analysis of the current at the start-up could avoid false indicators [17] and, in the case of the stray flux analysis, it has shown good results in motors started by soft-starters [18]. Unfortunately, to the authors’ best knowledge, there is no methodology capable of automatically diagnosing broken rotor bar failures in induction motors started by means of soft-starters, a challenging task since the frequency components and control technologies implemented by soft-starter manufacturers modifies the start-up transient profile, leading to unpredictable fault pattern evolutions.
The main contribution of this paper is a novel methodology for the automatic detection and severity quantification of rotor faults in soft-started induction motors by means of current-stray flux signal fusion. The proposed methodology relies on a couple of indicators that are introduced here, and are used to merge highly relevant information from current and stray flux signals, which are captured during the motor start-up transient. These indicators are based on the time-frequency maps obtained by applying the short-time Fourier transform to the captured signals. Additionally, a linear discriminant analysis (LDA) is performed in order to combine all the information, and finally a feed-forward neural network (FFNN) is trained to implement an automatic fault diagnosis and fault severity classification. The stray flux signals are captured by means of a handmade coil-based sensor, which can be installed on the frame of the machine. The effectiveness of the proposed method is verified under an experimental testbench with a 1.1 kW induction motor and using four different industrial soft-starters.

2. Materials and Methods

2.1. Current Monitoring for Broken Rotor Bars

The diagnostic of failures in electric motors based on the analysis of the current signals is a technique that has been extensively used, and has been greatly accepted at an industrial level, mainly due to its capability to perform a remote diagnosis, since the current signals of the motor can be accessed remotely (e.g., from the control center), and the large number of faults that can be diagnosed with this technique [7]. In this regard, the conventional motor current signature analysis (MCSA) is currently one of the most used online approaches in industry for detecting faults in electric motors. The technique is based on the fact that under normal conditions, the current in the rotor bars induces a clockwise field rotating at s f . When a rotor fault exists, an additional reverse rotating field is produced in accordance to Fortescue’s Theorem, giving rise to a frequency component at s f . This subsequently generates the amplification of the well-known lower sideband harmonic ( f L S H ) appearing in the line current, which is given by Equation (1).
f L S H = f ( 1 2 s )
Furthermore, as reported in some investigations [19], it is possible to associate with this anticlockwise field a negative-sequence current system which causes a pulsating torque and a speed oscillation which, in turn, generates an additional frequency component of the air-gap flux density component ( f U S H ) given by Equation (2) [20].
f U S H = f ( 1 + 2 s )
Hence, the MCSA mainly relies in the magnitude evaluation of these specific frequency components, which are amplified when the motor operates under a fault condition.

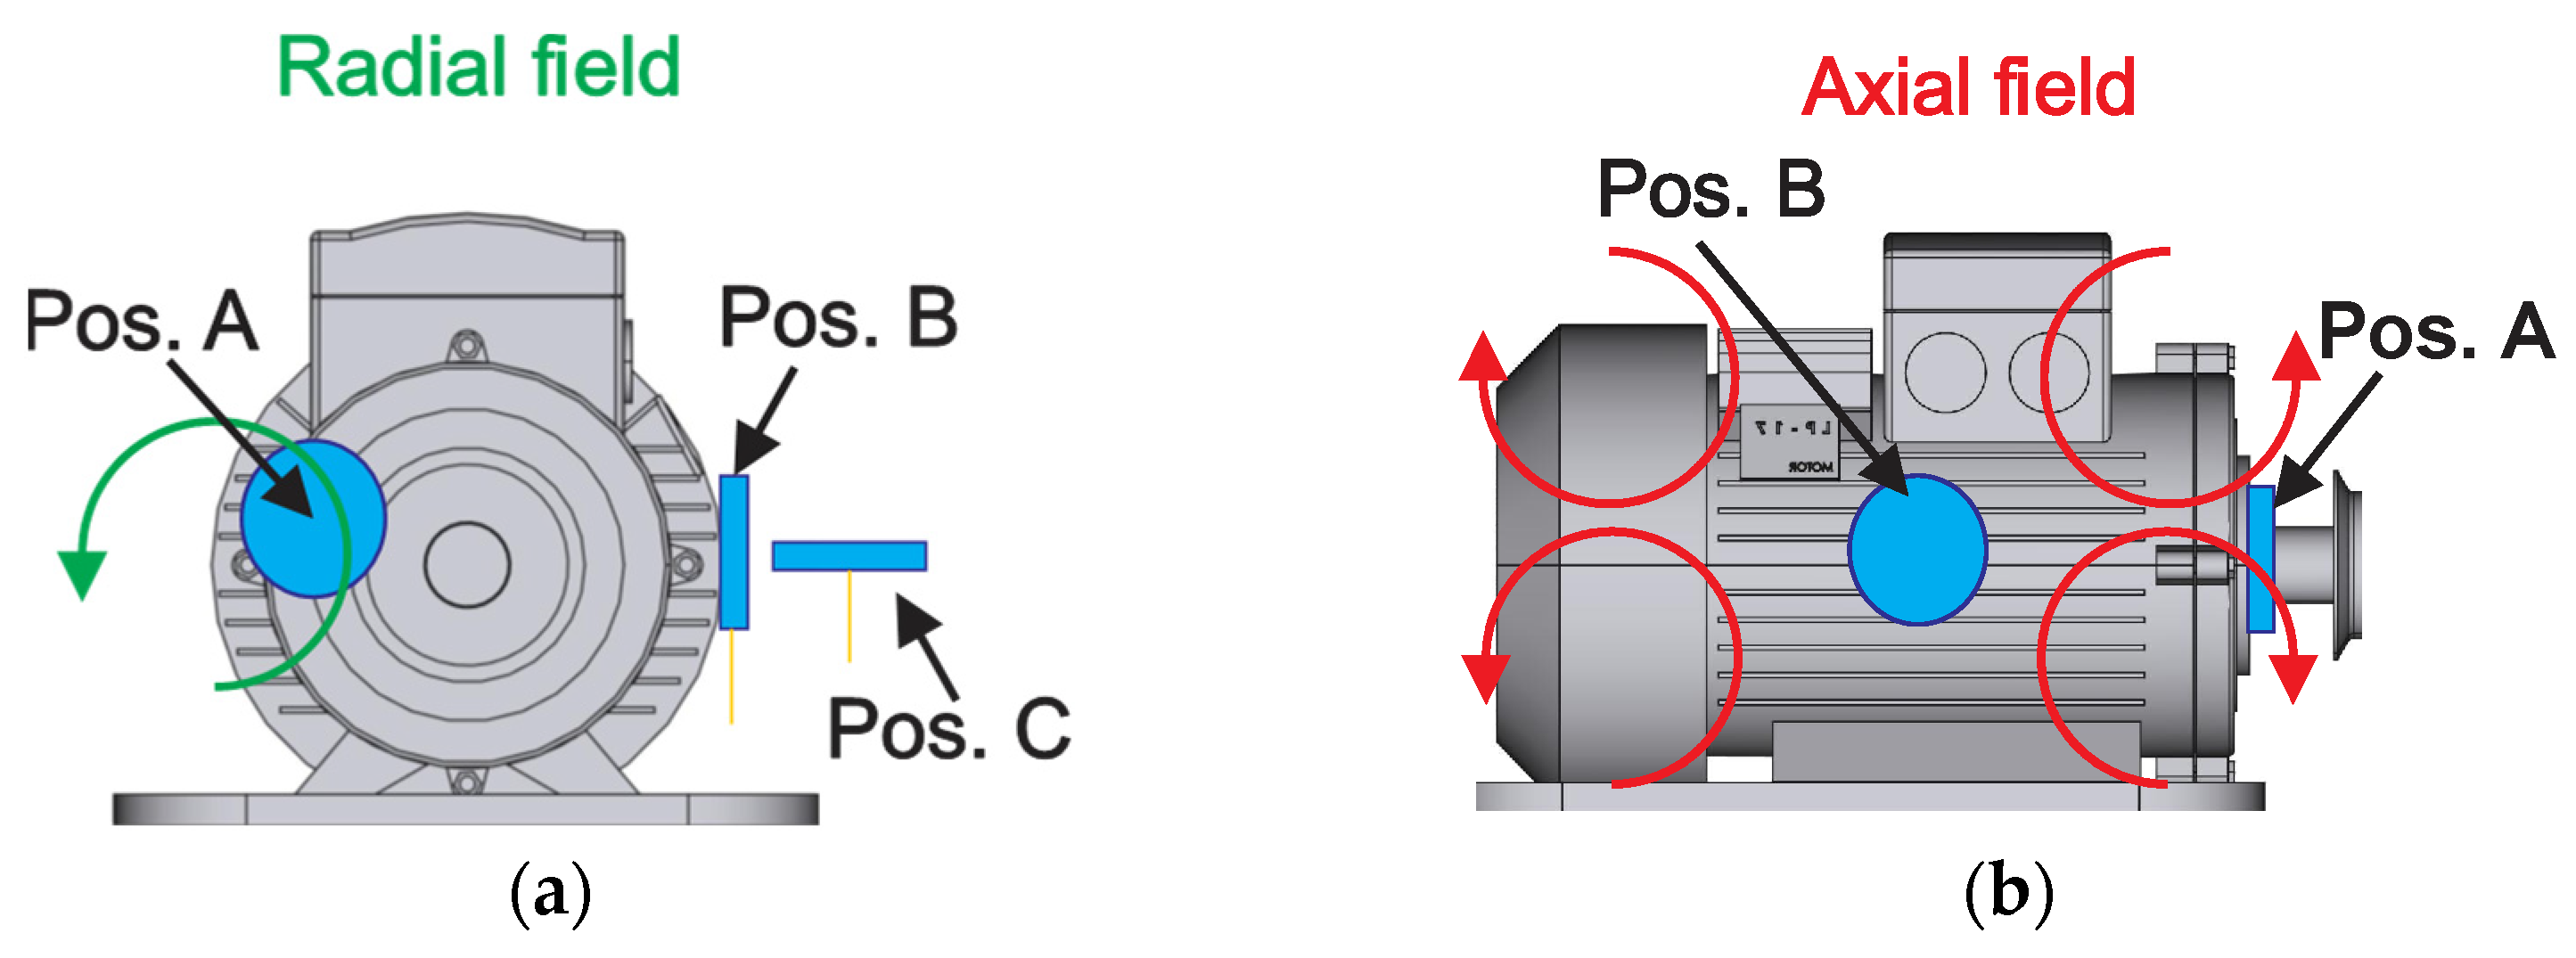
2.2. Stray Flux Signals Analysis

Magnetic flux analysis for the condition monitoring of electric machines has been found to be an excellent alternative to conventional techniques that have been widely used in the industry, such as MCSA. This fact can be mainly attributed to the various advantages that the analysis of magnetic flux signals provides over other approaches, among others: it has proven to be efficient and reliable in cases where conventional methods produce false indications (i.e., rotor axial air ducts, rotor magnetic anisotropy, low frequency load oscillations, etc.) [2,21], it is a non-invasive technique [19], very low cost sensors are required (e.g., handmade coil-based sensors) [22], flexibility and simplicity of installation of the available sensors [9]. In this regard, several previous pieces of research have been devoted to investigating and analyzing magnetic stray flux signals for the fault detection and diagnosis of electric motors under two main approaches: air-gap flux analysis, and stray flux analysis [23,24]. Since the stray flux-based methods are non-invasive (i.e., the sensors may be installed outside the frame of the machine), online methods without motor disassembly can be adopted, allowing for the development of online test methods.
In order to analyze the magnetic stray flux signals in an induction motor, two main components may be distinguished: axial stray flux, and radial stray flux [25]. These signals are known to be modified when the electric motor is working under a fault condition, hence introducing the amplification of some frequency components according to the fault [26]. Besides, as shown in some papers, as in [27], axial and radial stray flux can be captured by using a proper sensor installed in the vicinity of the motor frame. In order to illustrate this, Figure 1a,b show the presumed circulation of the radial and axial magnetic field lines, respectively. Additionally, depending on the location of the coil-sensor, different stray flux components are acquired, as shown in Figure 1. Thus, axial stray flux is measured at position A, radial stray flux at position C, and, at position B, both axial and radial stray flux are measured.

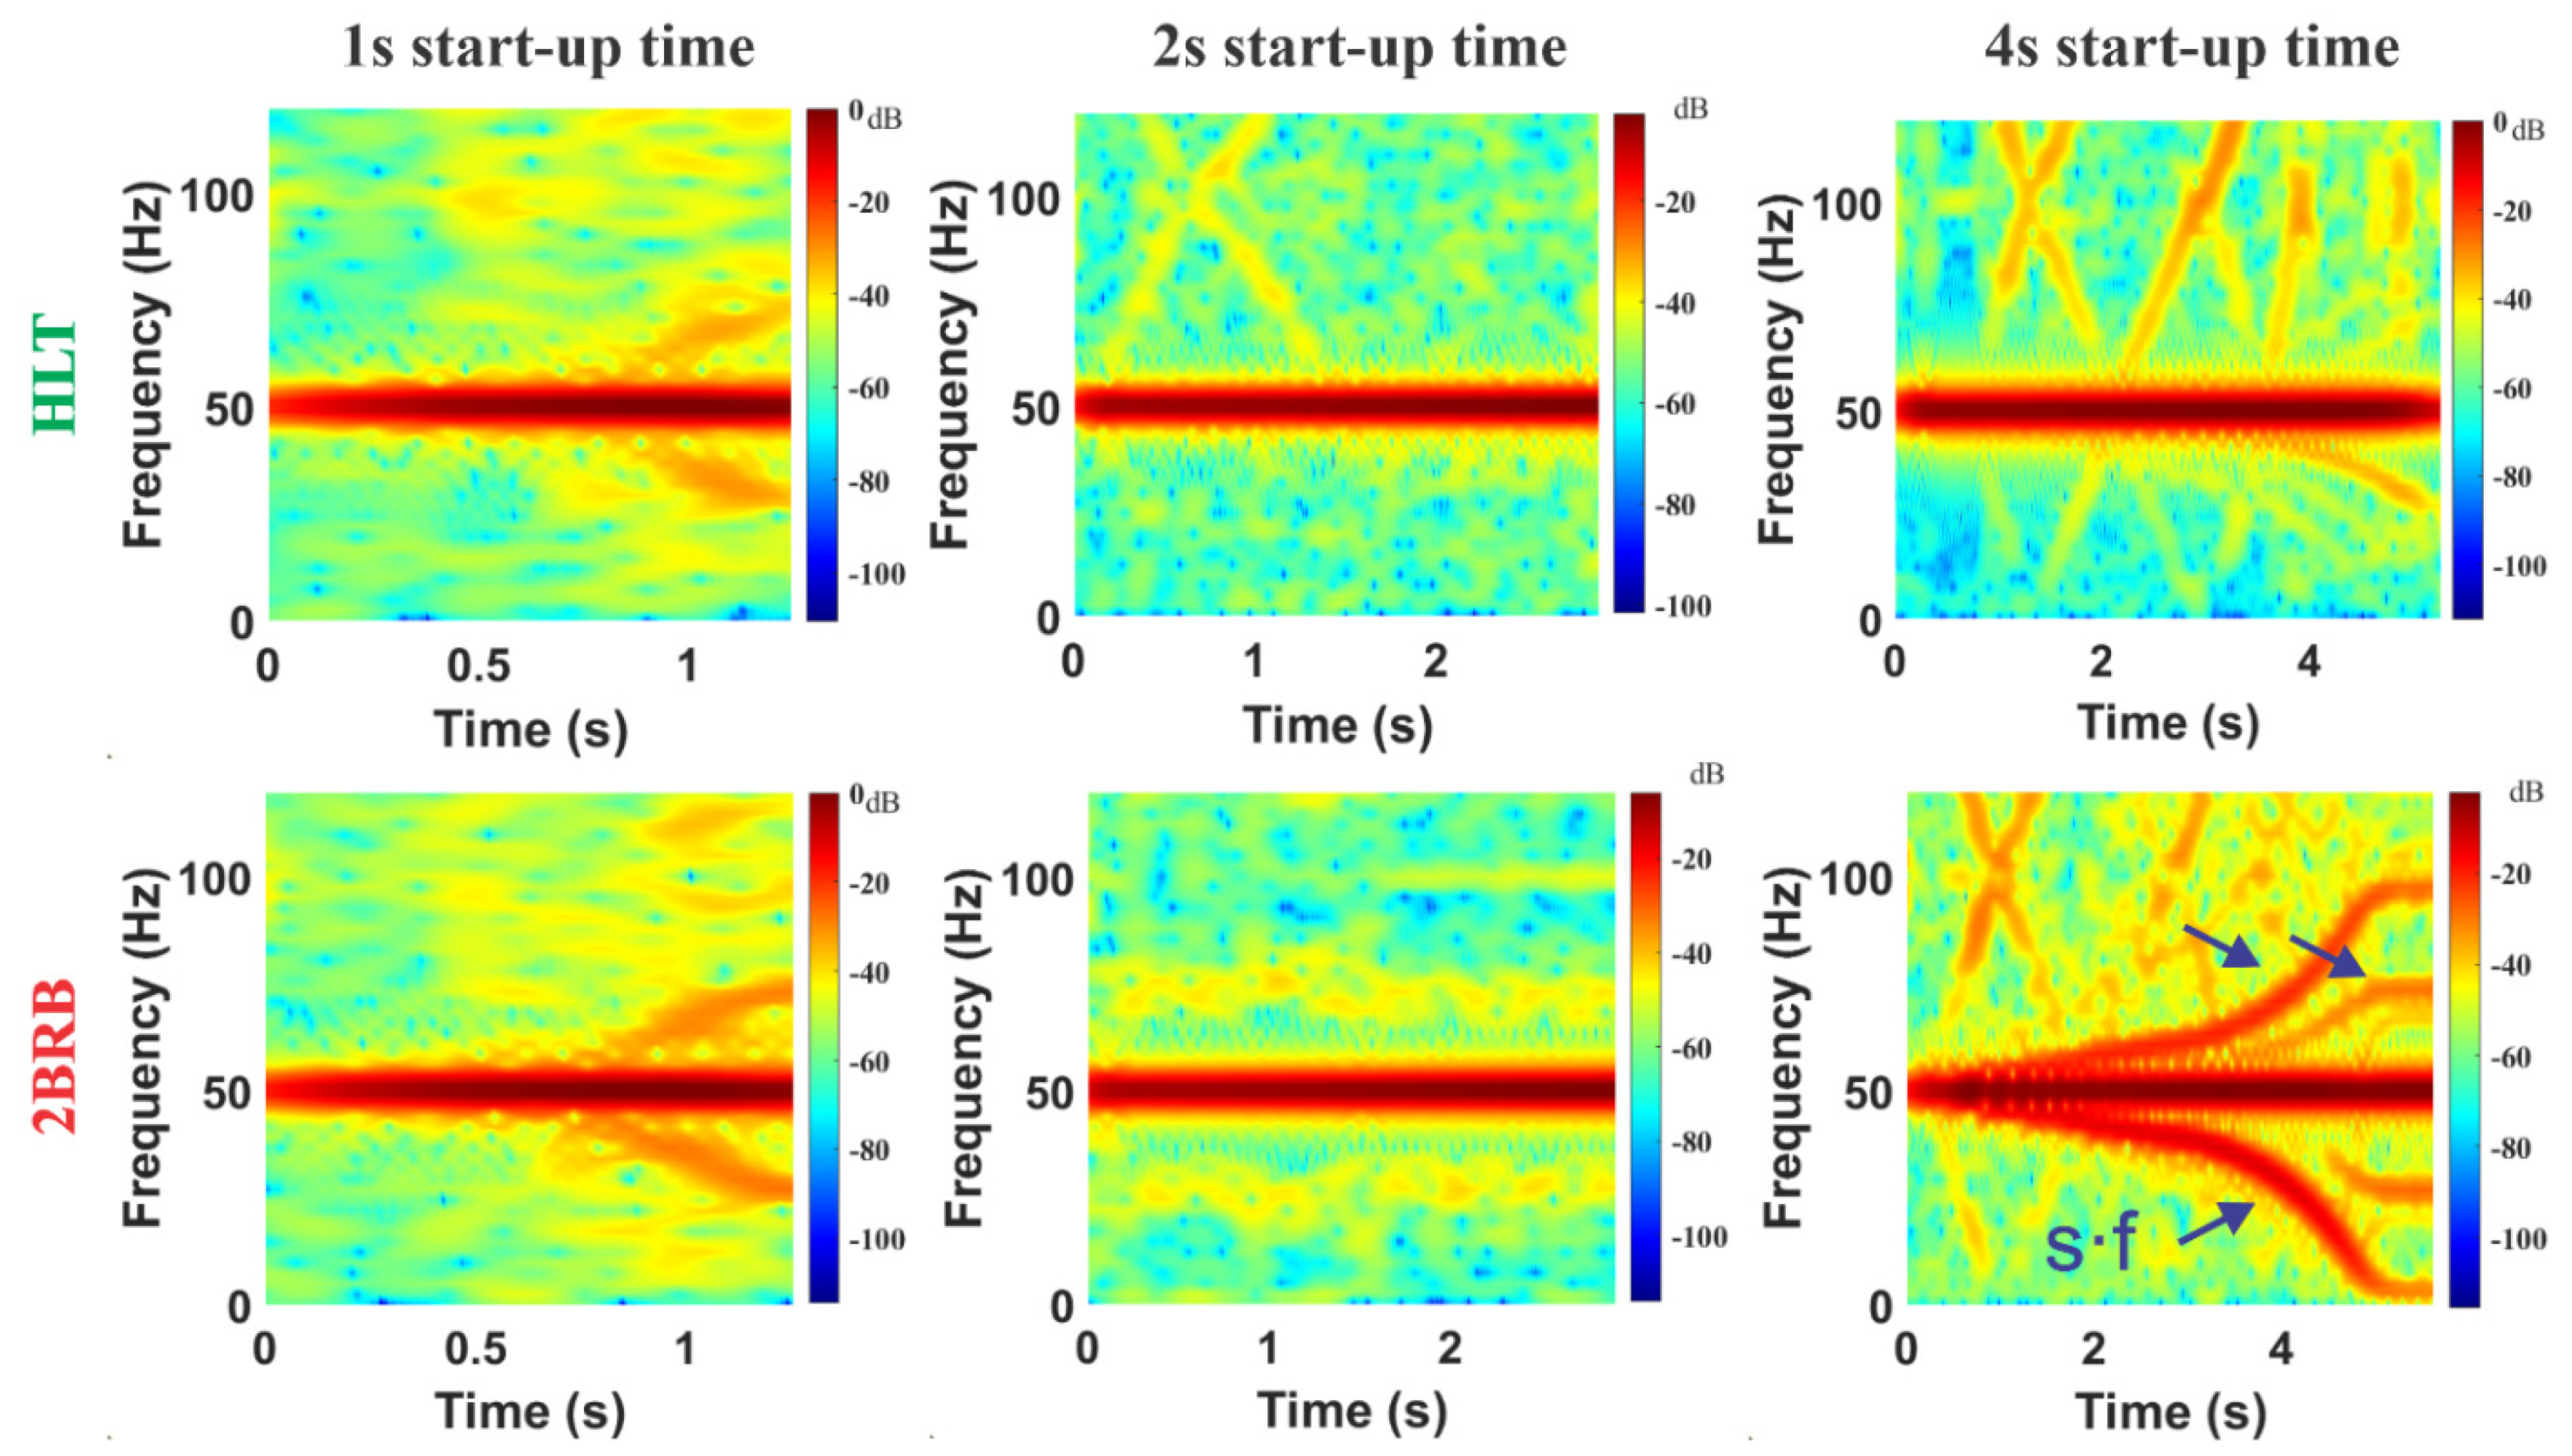
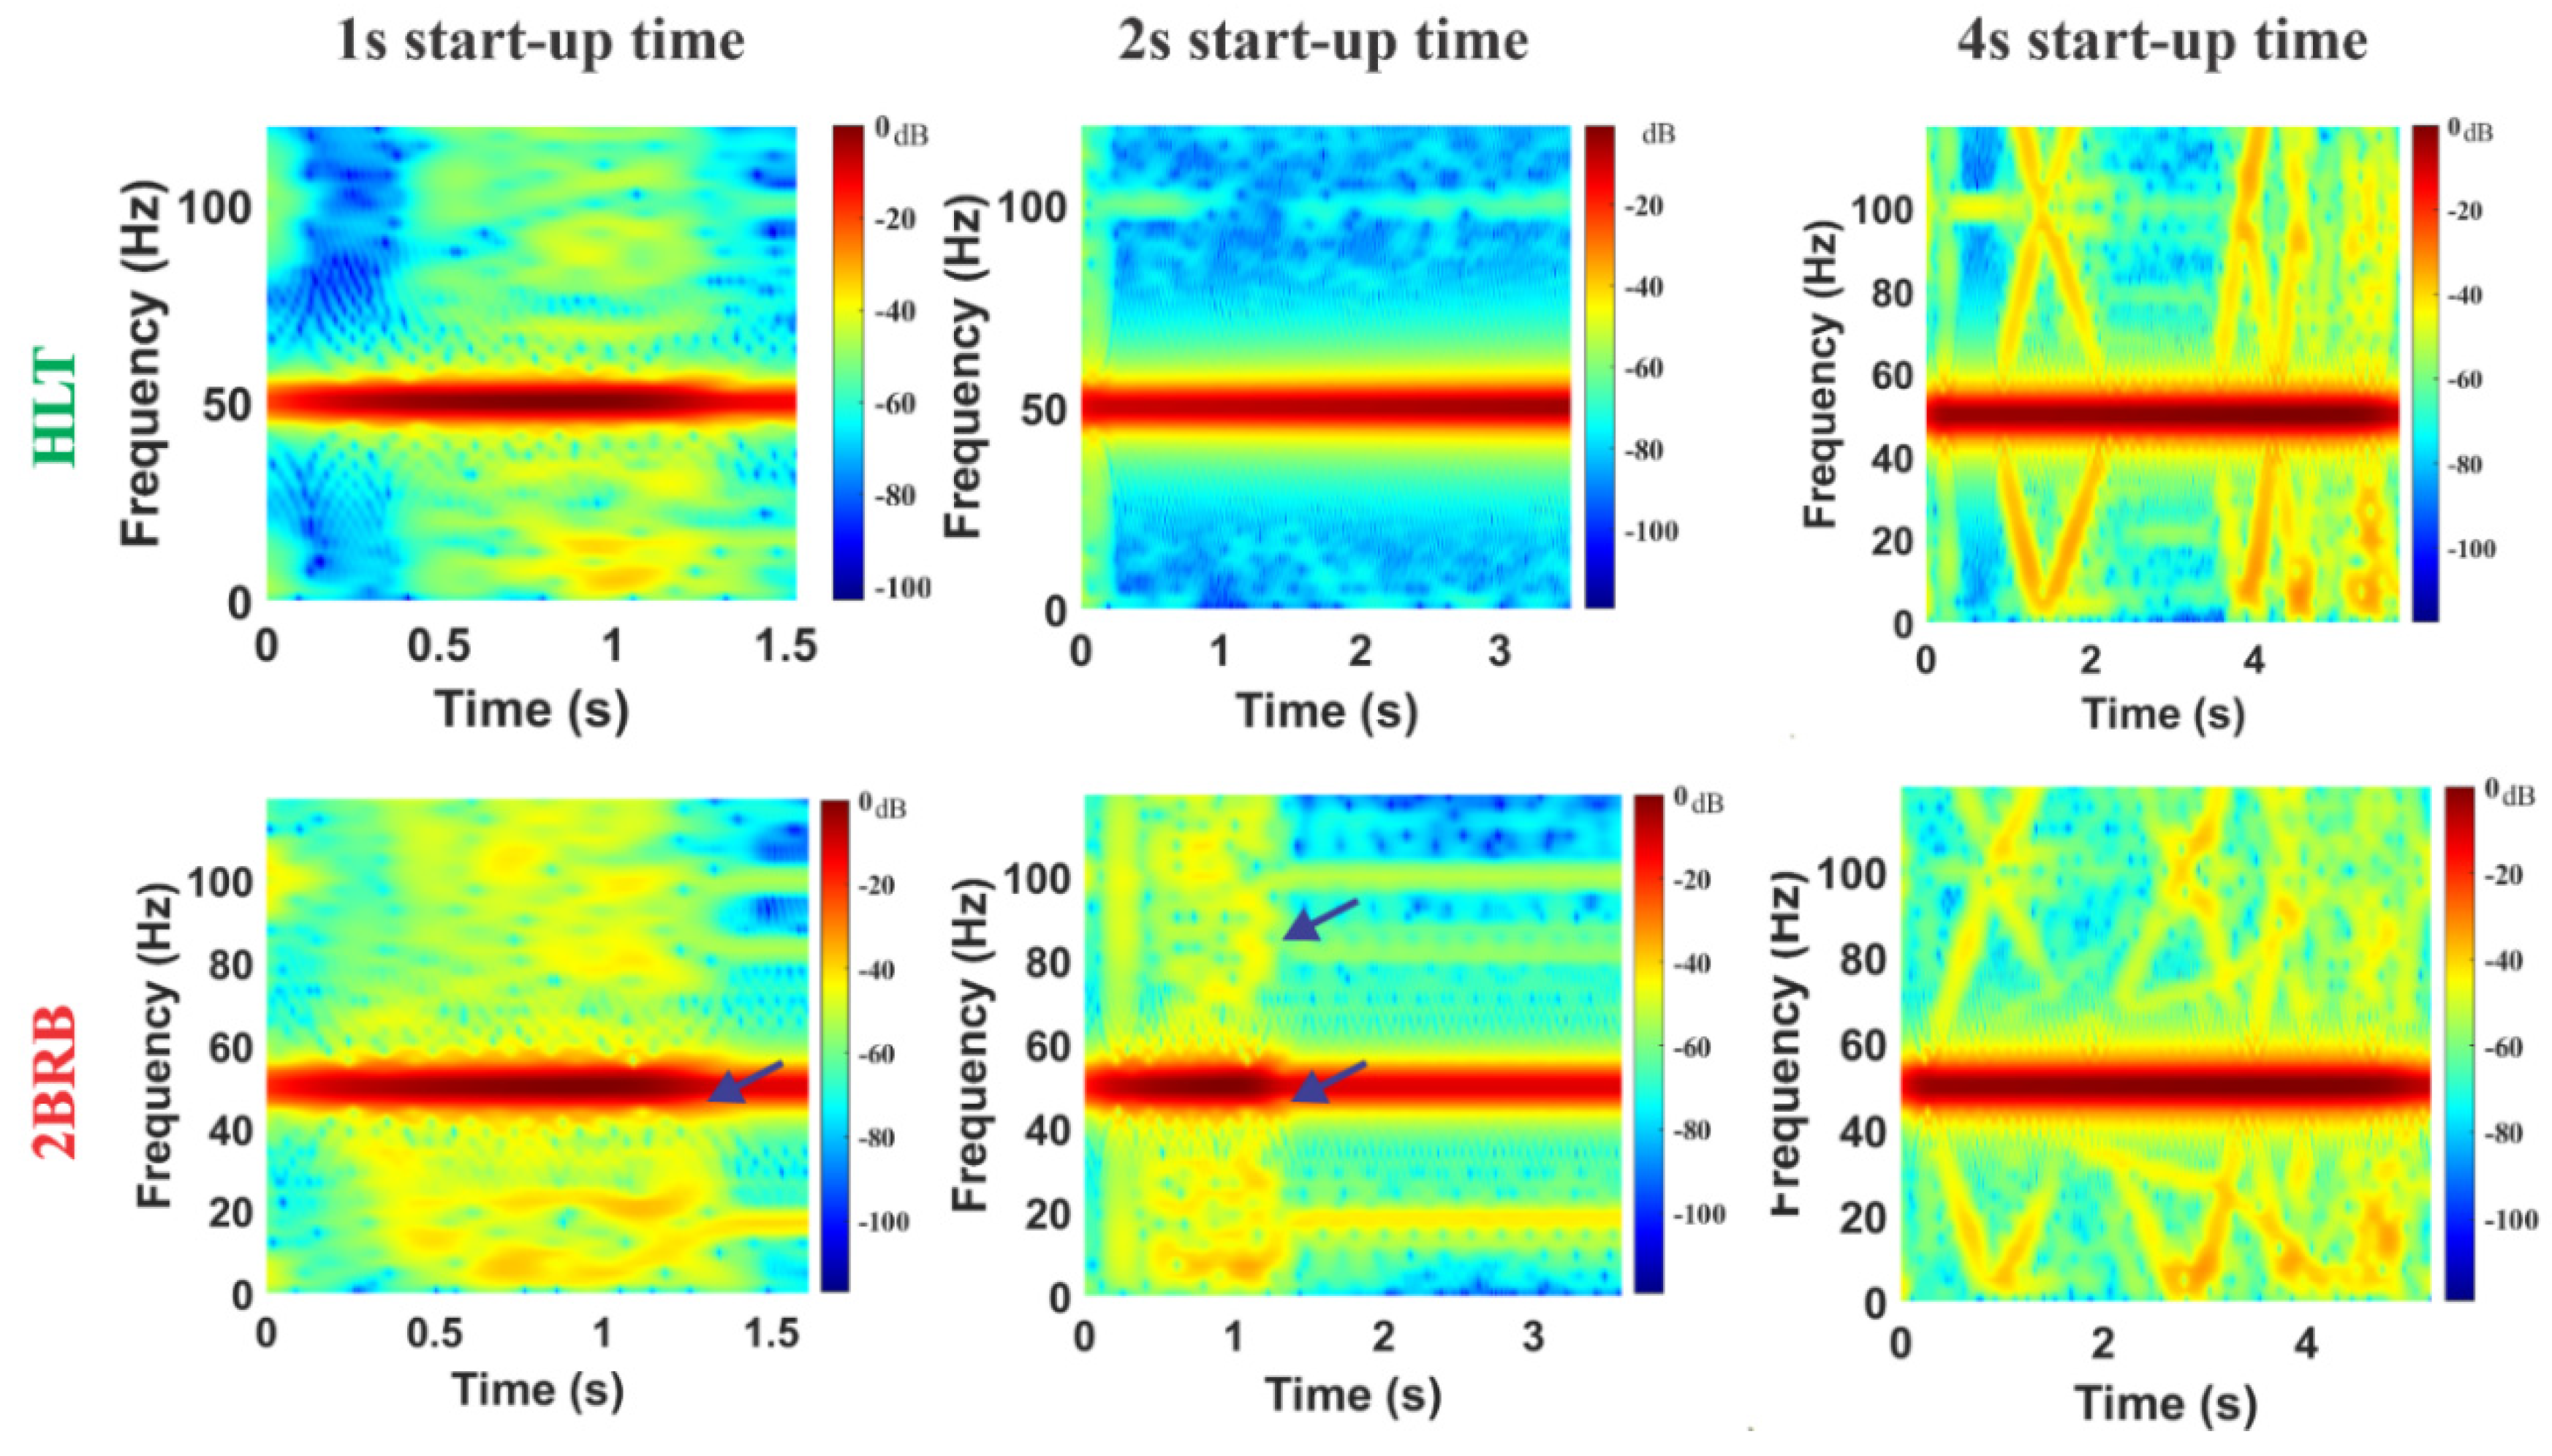
2.3. Theoretical Fault-Related Frequency Evolution during Start-Up

Several research papers have proven that some faults modify the magnetic flux in the vicinity of the motor frame (magnetic stray flux), which may yield the amplification of some fault-related harmonics at specific frequencies [28]. Hence, as it has been pointed out in some works, for the case when the motor operates under rotor bar damages, the following harmonics may be observed to be amplified in the Fourier spectrum of the stray flux and current signals:
  • Frequency components of axial nature ( f a x i a l ) [19]. These frequency components may be observed at one and three times the slip frequency, given by Equation (3) and Equation (4), respectively, and can be observed in the axial stray flux signals.
    f a x i a l = s f
    f a x i a l = 3 s f
    where s = slip and f = power supply frequency.
  • Sideband harmonics ( f S H ), mainly observed in the radial stray flux signals [26,29]. These frequency components can be estimated by Equation (5).
    f S H = f ( 1 ± 2 s )
In this regard, by analyzing Equations (1)–(4), it can be discerned that the harmonics related to rotor bar faults depend on the motor slip. Hence, it is expected to detect their evolution during the start-up transient, (when the motor speeds up) as the slip changes from a maximum value of 1 (i.e., at motor standstill), and approaches to 0 (when the motor reaches steady state). According to Equations (3)–(5), the theoretical evolution generated by the amplification of the fault-related frequency components produces very well-known patterns, which can be observed by means of a time-frequency map. Figure 2 shows the expected evolution of the different fault-related frequency components given by (3)–(5), according to the stray flux component (i.e., radial stray flux, axial stray flux) for a direct online (DOL) start.

2.4. Linear Discriminant Analysis

The linear discriminant analysis (LDA) is a technique that has been widely used as a dimensionality reduction pre-processing stage for classification purposes. The main idea is to collect a new set of features, in which the maximization of the data separability is achieved for a certain number of considered classes. Hence, projecting a dataset onto a lower d-dimensional space with appropriate class-separability avoids overfitting, and helps reduce the computational burden [30]. The mathematical procedure to perform LDA can be found in [31].

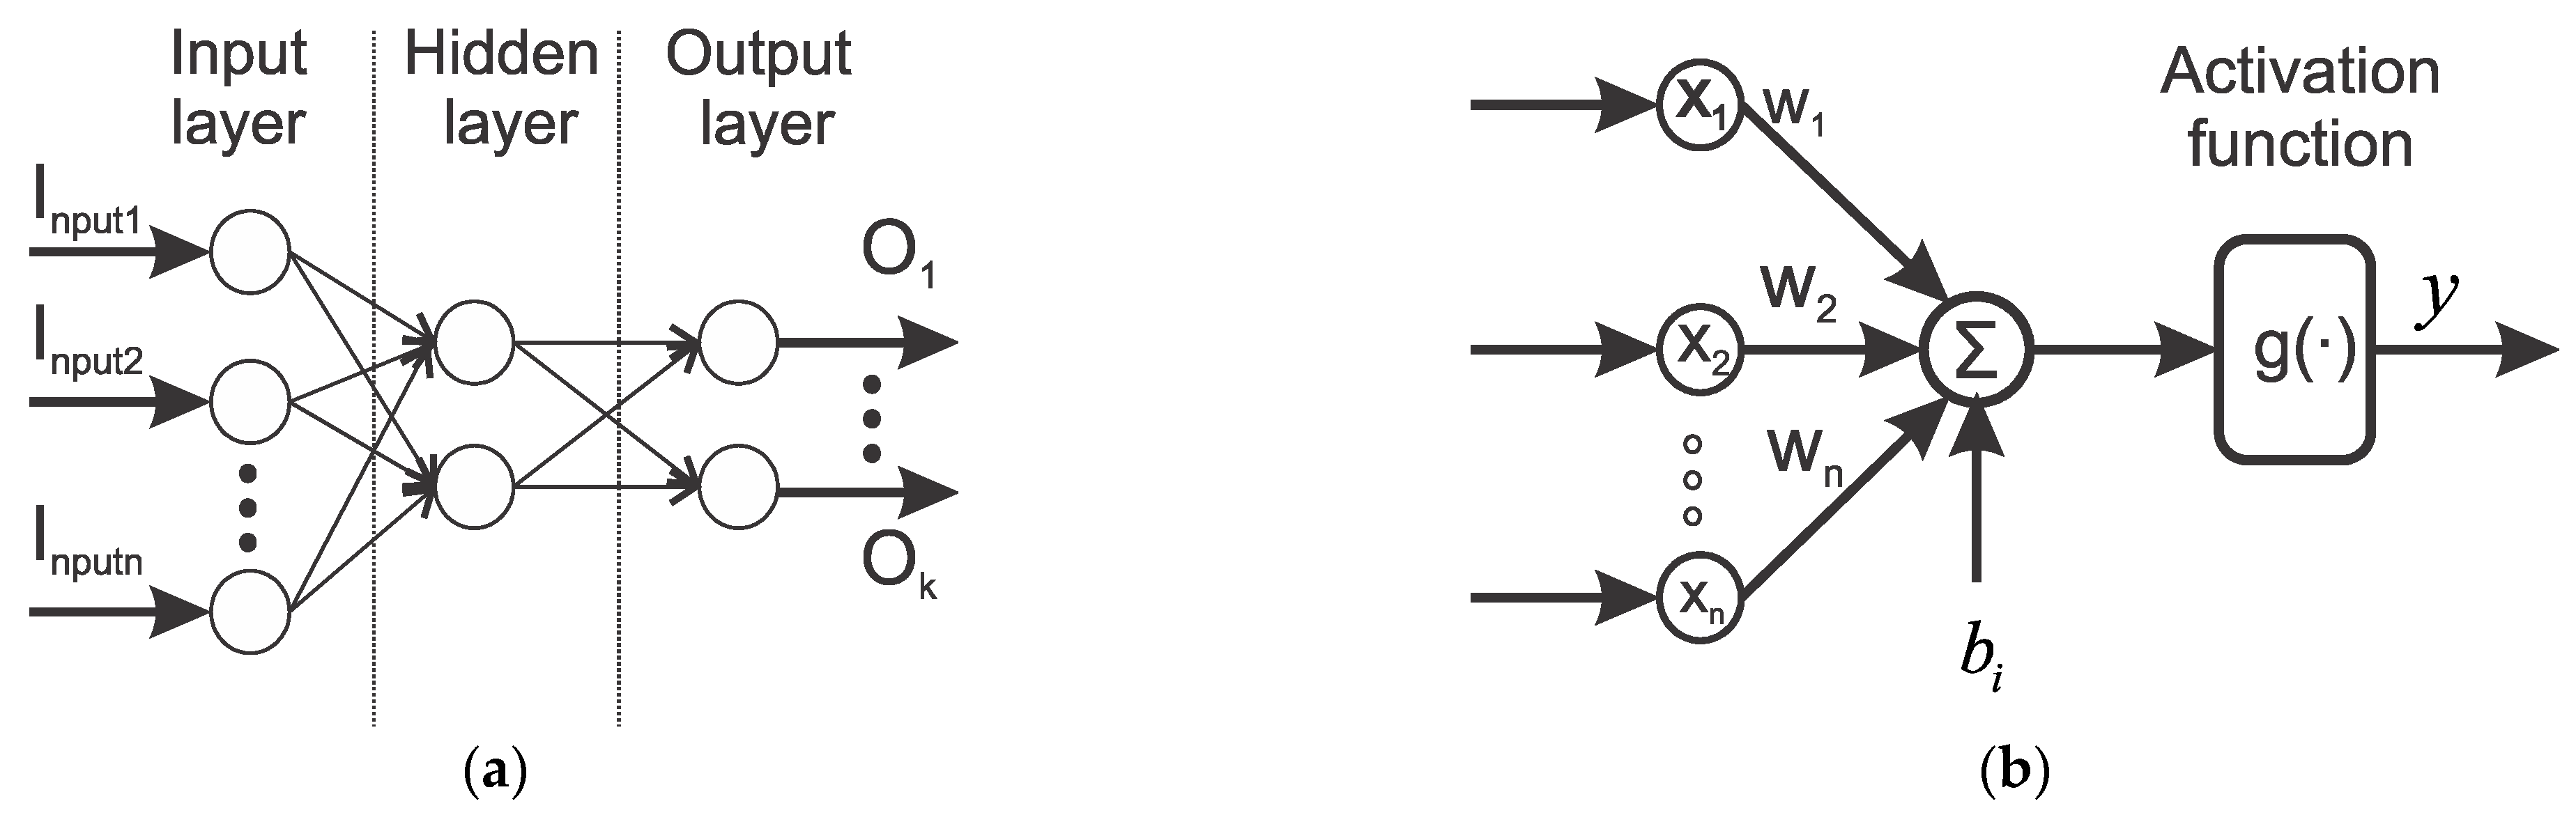
2.5. Artificial Neural Network

Artificial Neural Networks (ANNs) are models employed to solve classification and pattern recognition problems [32]. Over the great diversity of ANN architectures that can be found in the literature, the feed-forward neural network (FFNN) structure is an excellent alternative for its application in automated final diagnosis schemes, since this type of ANN requires basic operations with a very low computational burden, has a simple and practical design, and generalizes well over the data on which it is trained. Hence, it can be easily incorporated into automated final diagnosis schemes that demand its implementation in programmable logic devices.
The most general structure of an FFNN is composed of different interconnected layers: one input layer (having n input neurons, I i n p u t i ), one or more hidden layers, and one output layer (composed of k neurons, O k ), as shown in Figure 3a. The interconnection of the neurons in the different layers is performed by a series of weights ( w i ), and biases ( b i ) according to Equation (6). The mathematical model of each neuron (shown in the schematic of Figure 3b is given by Equation (6):
y = g ( i = 1 n w i x i + b i )
where y is the output of the neuron, w i the synaptic weights, x i the inputs of the neuron, b i the bias, and g ( · ) the activation function.

2.6. Short-Time Fourier Transform

The short-time Fourier transform (STFT) is a well-known time-frequency (t-f) decomposition tool that allows the transformation of a time-domain signal into its time-frequency domain. A simple method that allows the STFT of a discrete signal to be obtained, is to dissect it into sliding windows that can overlap with each other, and then obtain the frequency content of each window, applying the fast Fourier transform (FFT). After computing the FFT of each window, a t-f map is obtained, containing the frequency content of the signal on different time intervals.
Mathematically, the STFT of a discrete-time signal, X S T F T , of length N can be computed by Equation (7):
X S T F T [ k , l ] = n = 0 N 1 x [ n ] w [ k L n ] e j ( 2 π l n N )
where x [ n ] is the discrete-time signal, n is the time domain index, l = 0 , , N 1 , k = 0 , , [ ( N / L ) 1 ]   , w [ ] is the applied windowing function and L determines the time separation among adjacent sections. Figure 4 shows the simplest way to obtain the time-frequency map of a signal by means of the STFT.

3. Proposed Methodology

This section presents the proposed methodology for the automatic detection of broken rotor bars in soft-started induction motors under the start-up transient. When there is a failure in the motor, some harmonics are amplified in the stray flux and current spectrum. Hence, it is possible to observe their pattern evolution during the starting transient (since they are slip dependent) by means of a time-frequency map. These evolutions are identified by using a pair of indicators, which are the arithmetic mean and the maximum energy of specific t–f regions (depicted as shadowed areas in Figure 5) of the stray flux ( R f i j ), and current signals ( R C i j ). Such indicators can be computed by Equations (8)–(11), for the mean and maximum energy, respectively.
mean ( R F i j ) = 1 N d p ( k = t i n i t i a l t f i n a l l = f i n i t i a l f f i n a l ( E k , l ) R F i j )
mean ( R C i j ) = 1 N d p ( k = t i n i t i a l t f i n a l l = f i n i t i a l f f i n a l ( E k , l ) R C i j )
max ( R F i j ) = max ( k = t i n i t i a l t f i n a l l = f i n i t i a l f f i n a l ( E k , l ) R F i j )
max ( R C i j ) = max ( k = t i n i t i a l t f i n a l l = f i n i t i a l f f i n a l ( E k , l ) R C i j )
where E k , l is the normalized (over the fundamental frequency component) energy density at the ( k , l ) coordinate of the t–f map region under consideration (i.e., R F i , j or R C i , j ), f i n i t i a l and f f i n a l are, respectively, the initial and final frequency samples defining the considered t–f region, t i n i t i a l and t f i n a l are, respectively, the initial and final time samples defining the analyzed t–f region, and N d p is equal to the total number of data points enclosed by the processed region.
Following the abovementioned definitions, the proposed methodology (depicted in Figure 5) is as follows:
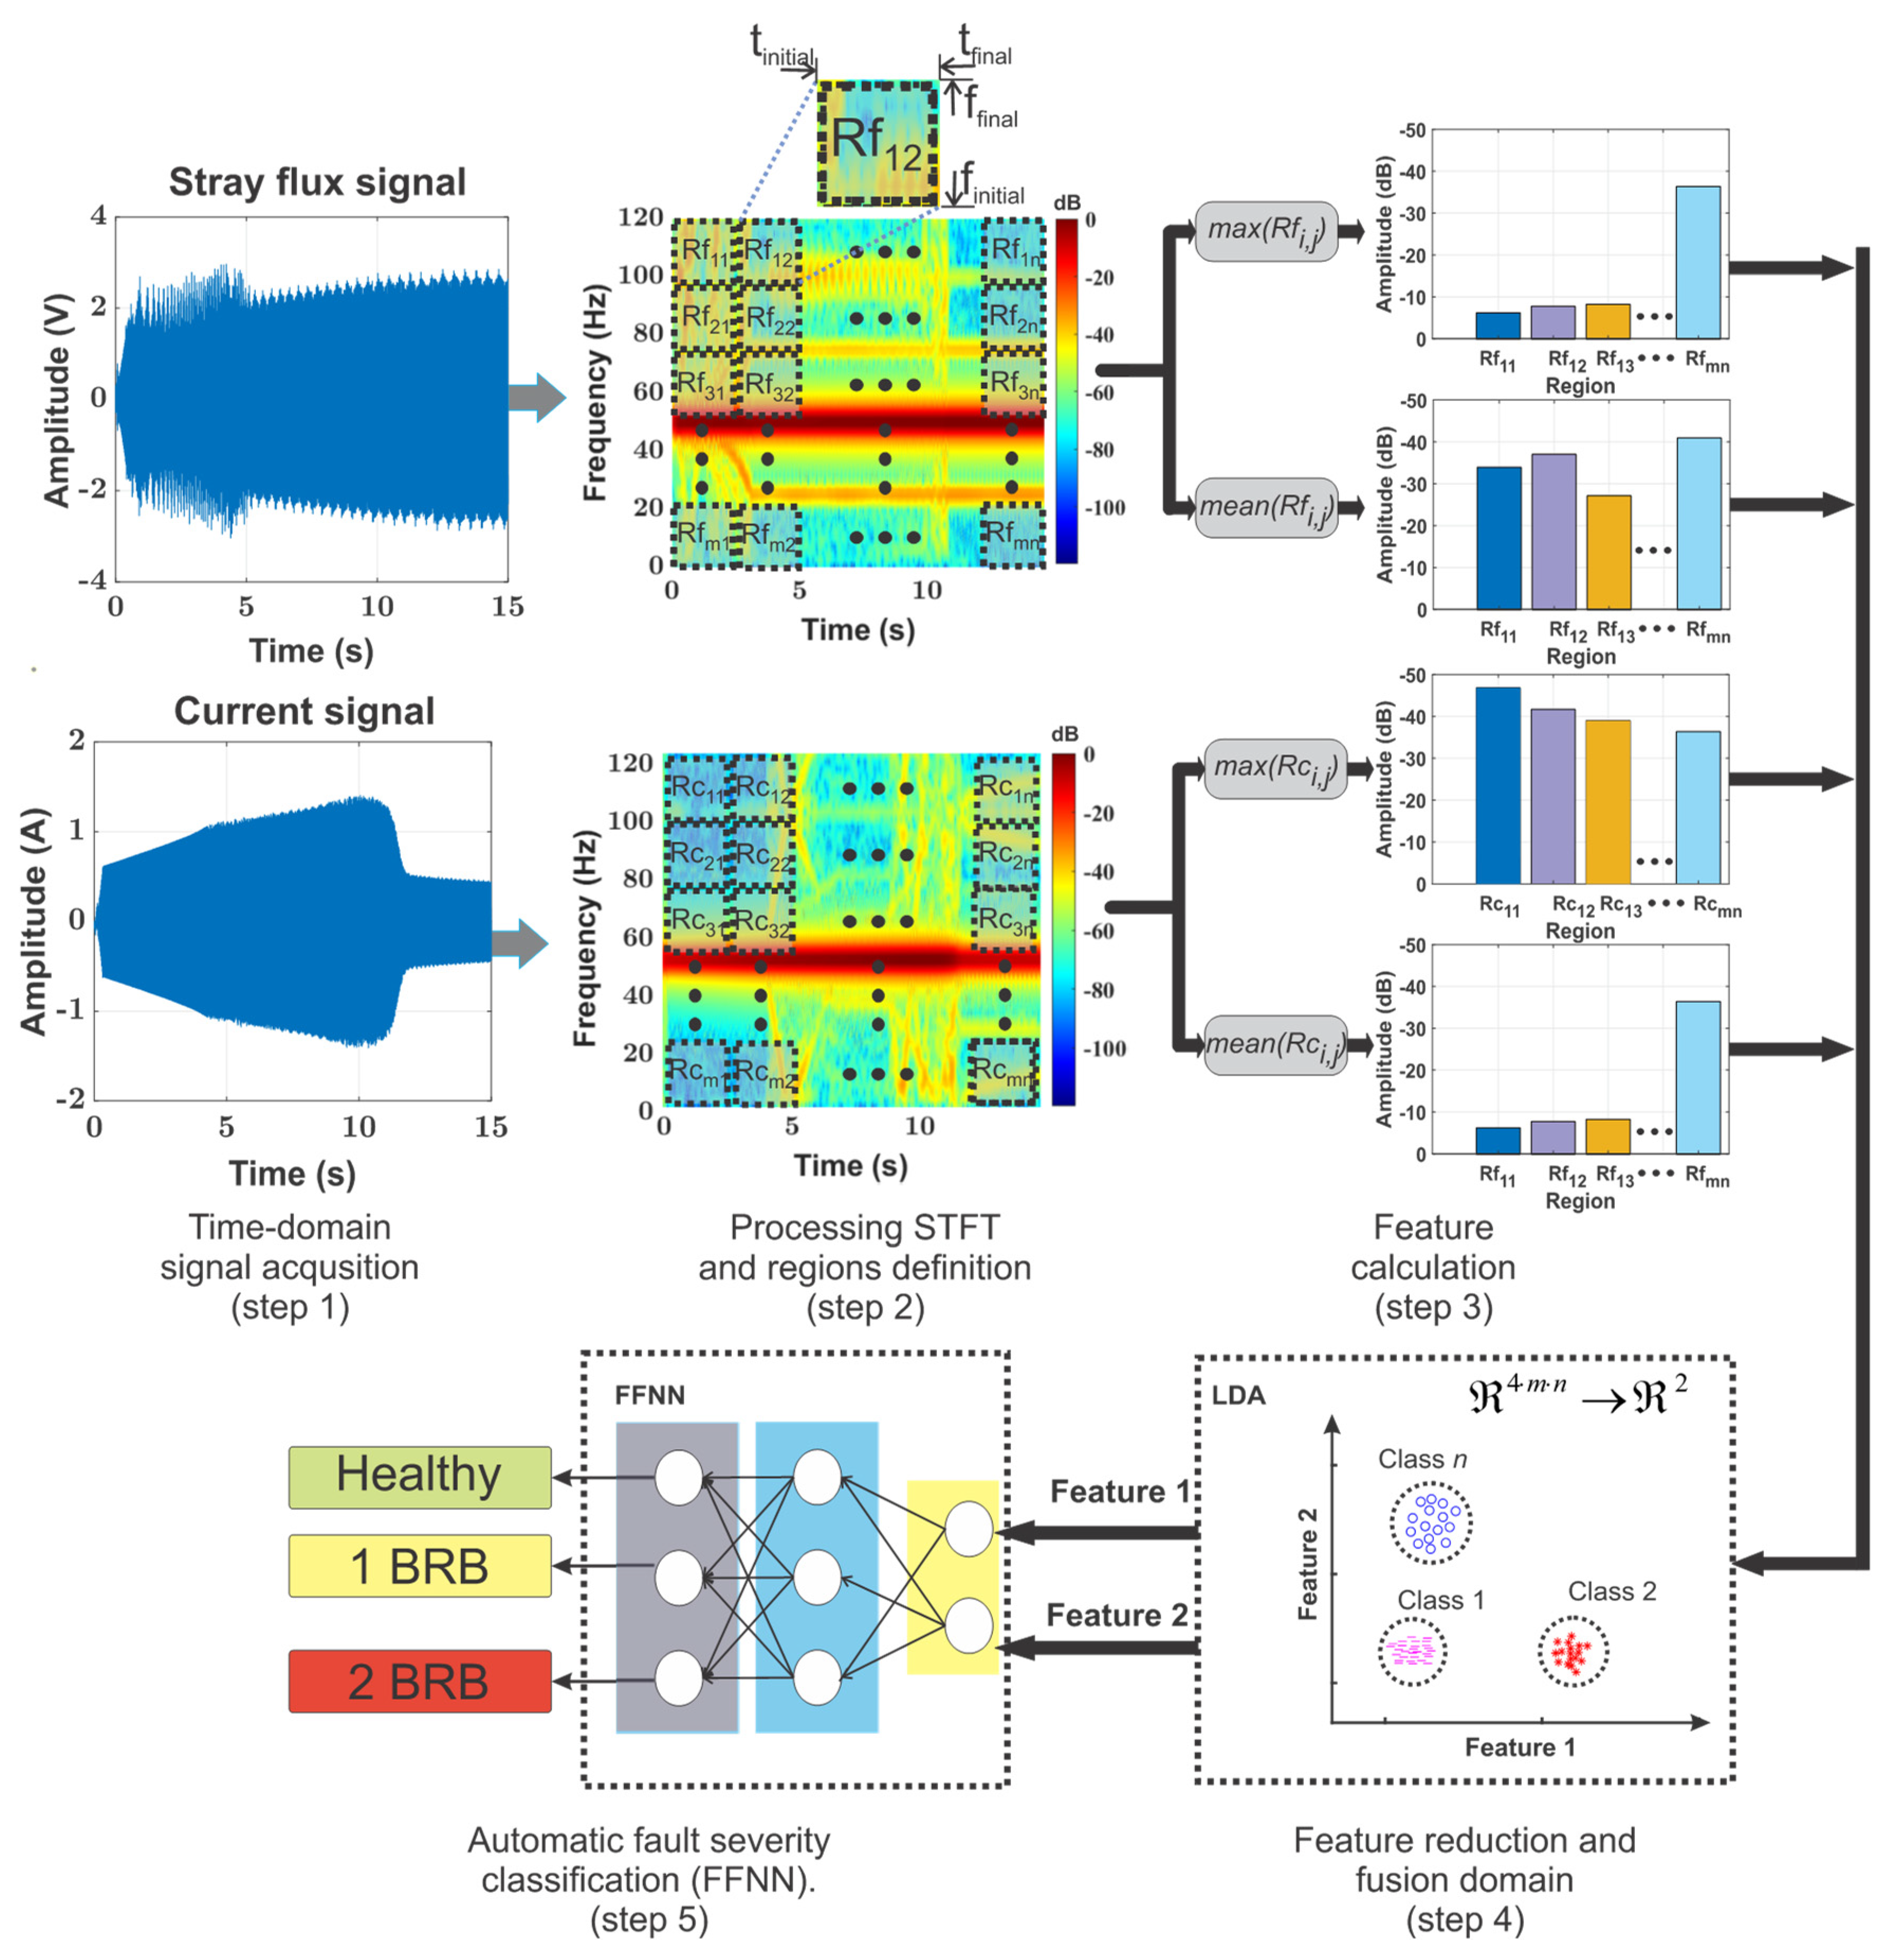
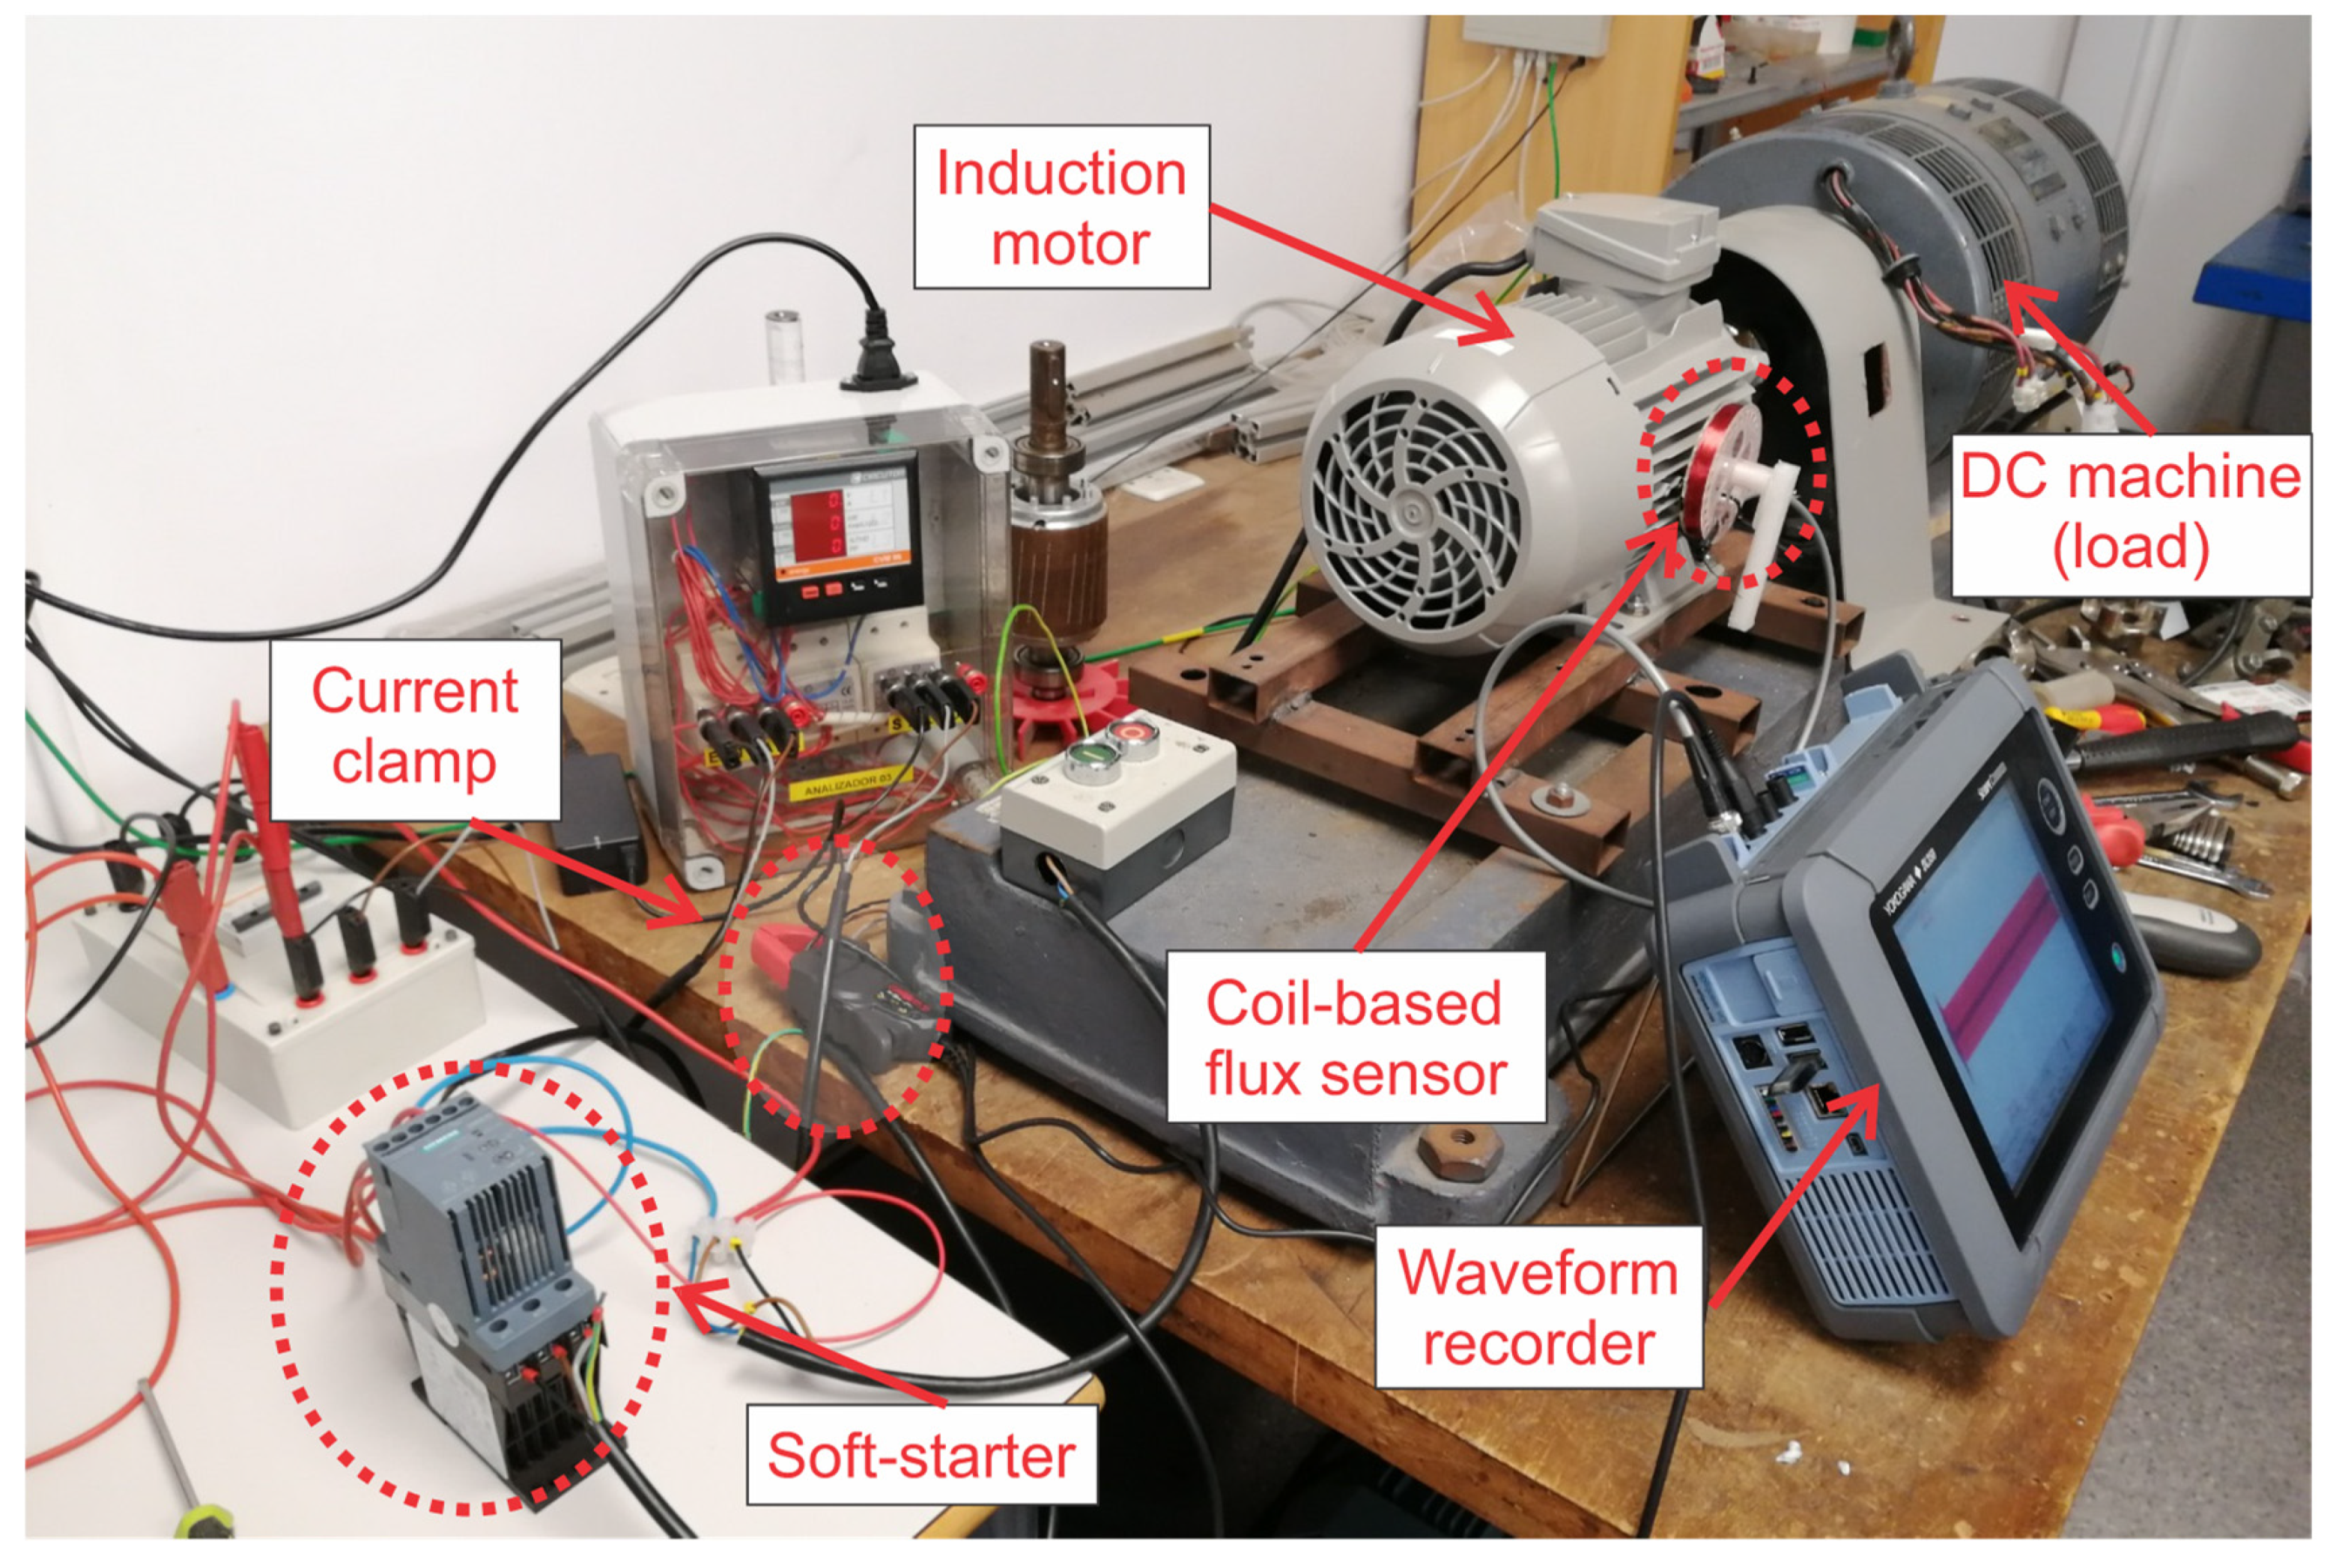
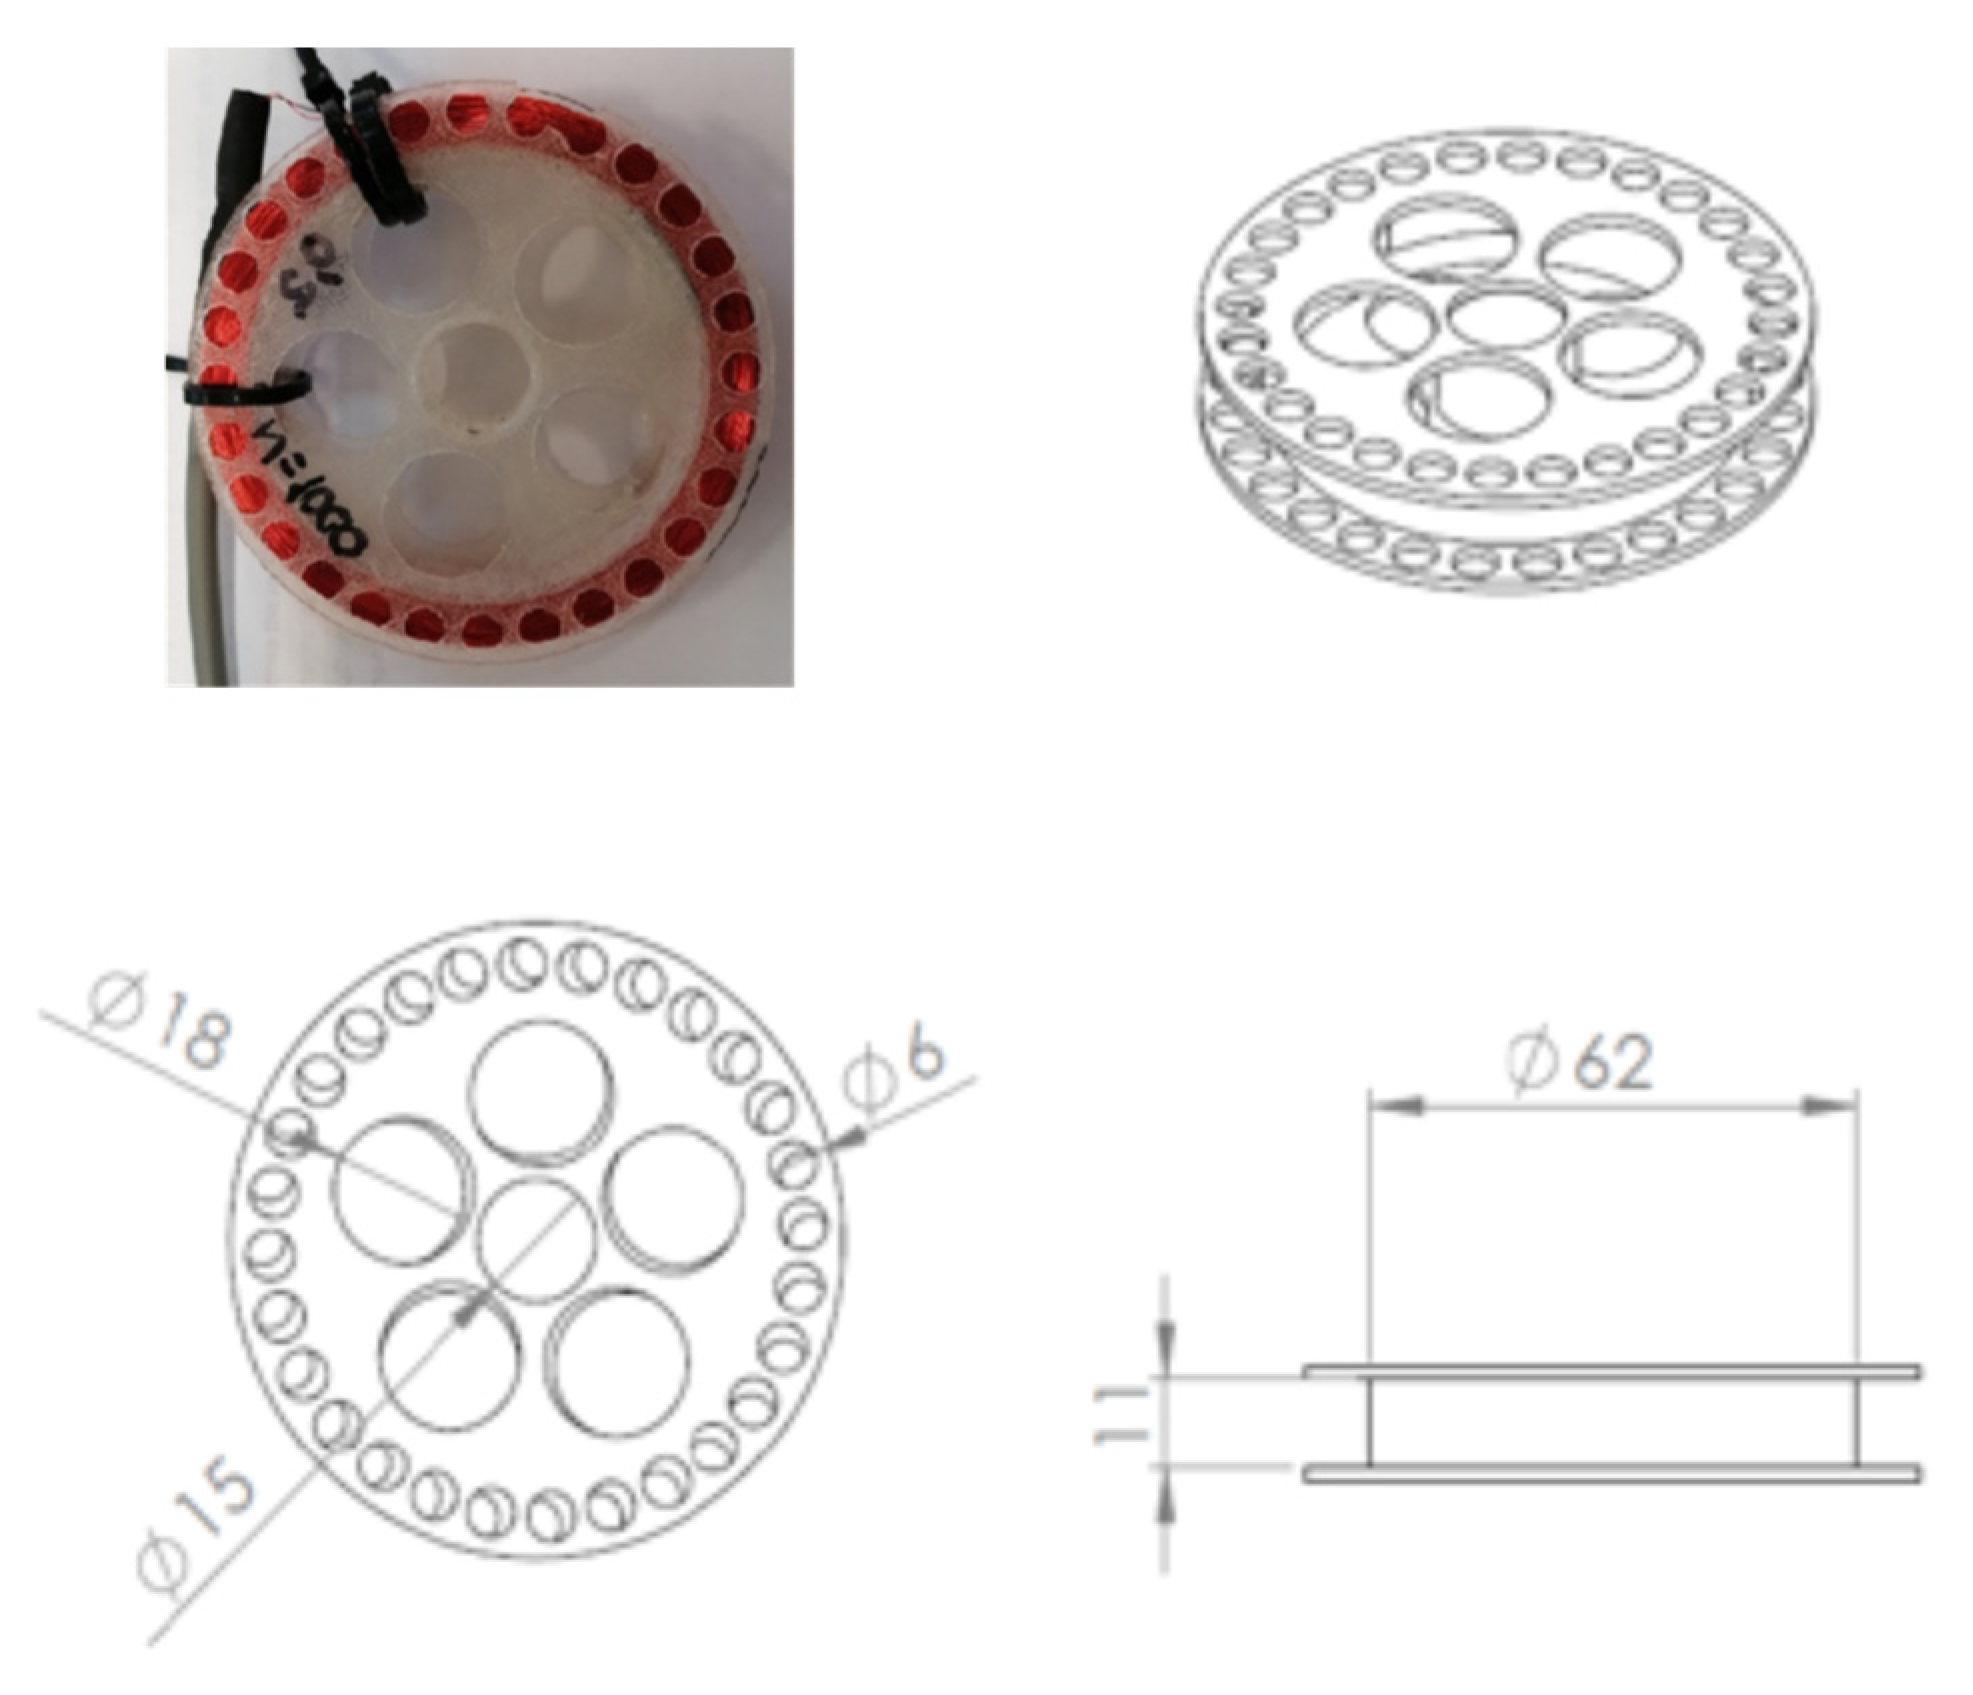
  • Step 1. Acquire current and magnetic flux signals (obtained in the vicinity of the motor frame, in axial + radial direction) simultaneously under the start-up transients by means of an oscilloscope, a magnetic flux sensor, and a current sensor. A coil-based sensor is the one used during the experimentation of this paper, which is described in detail in the next section.
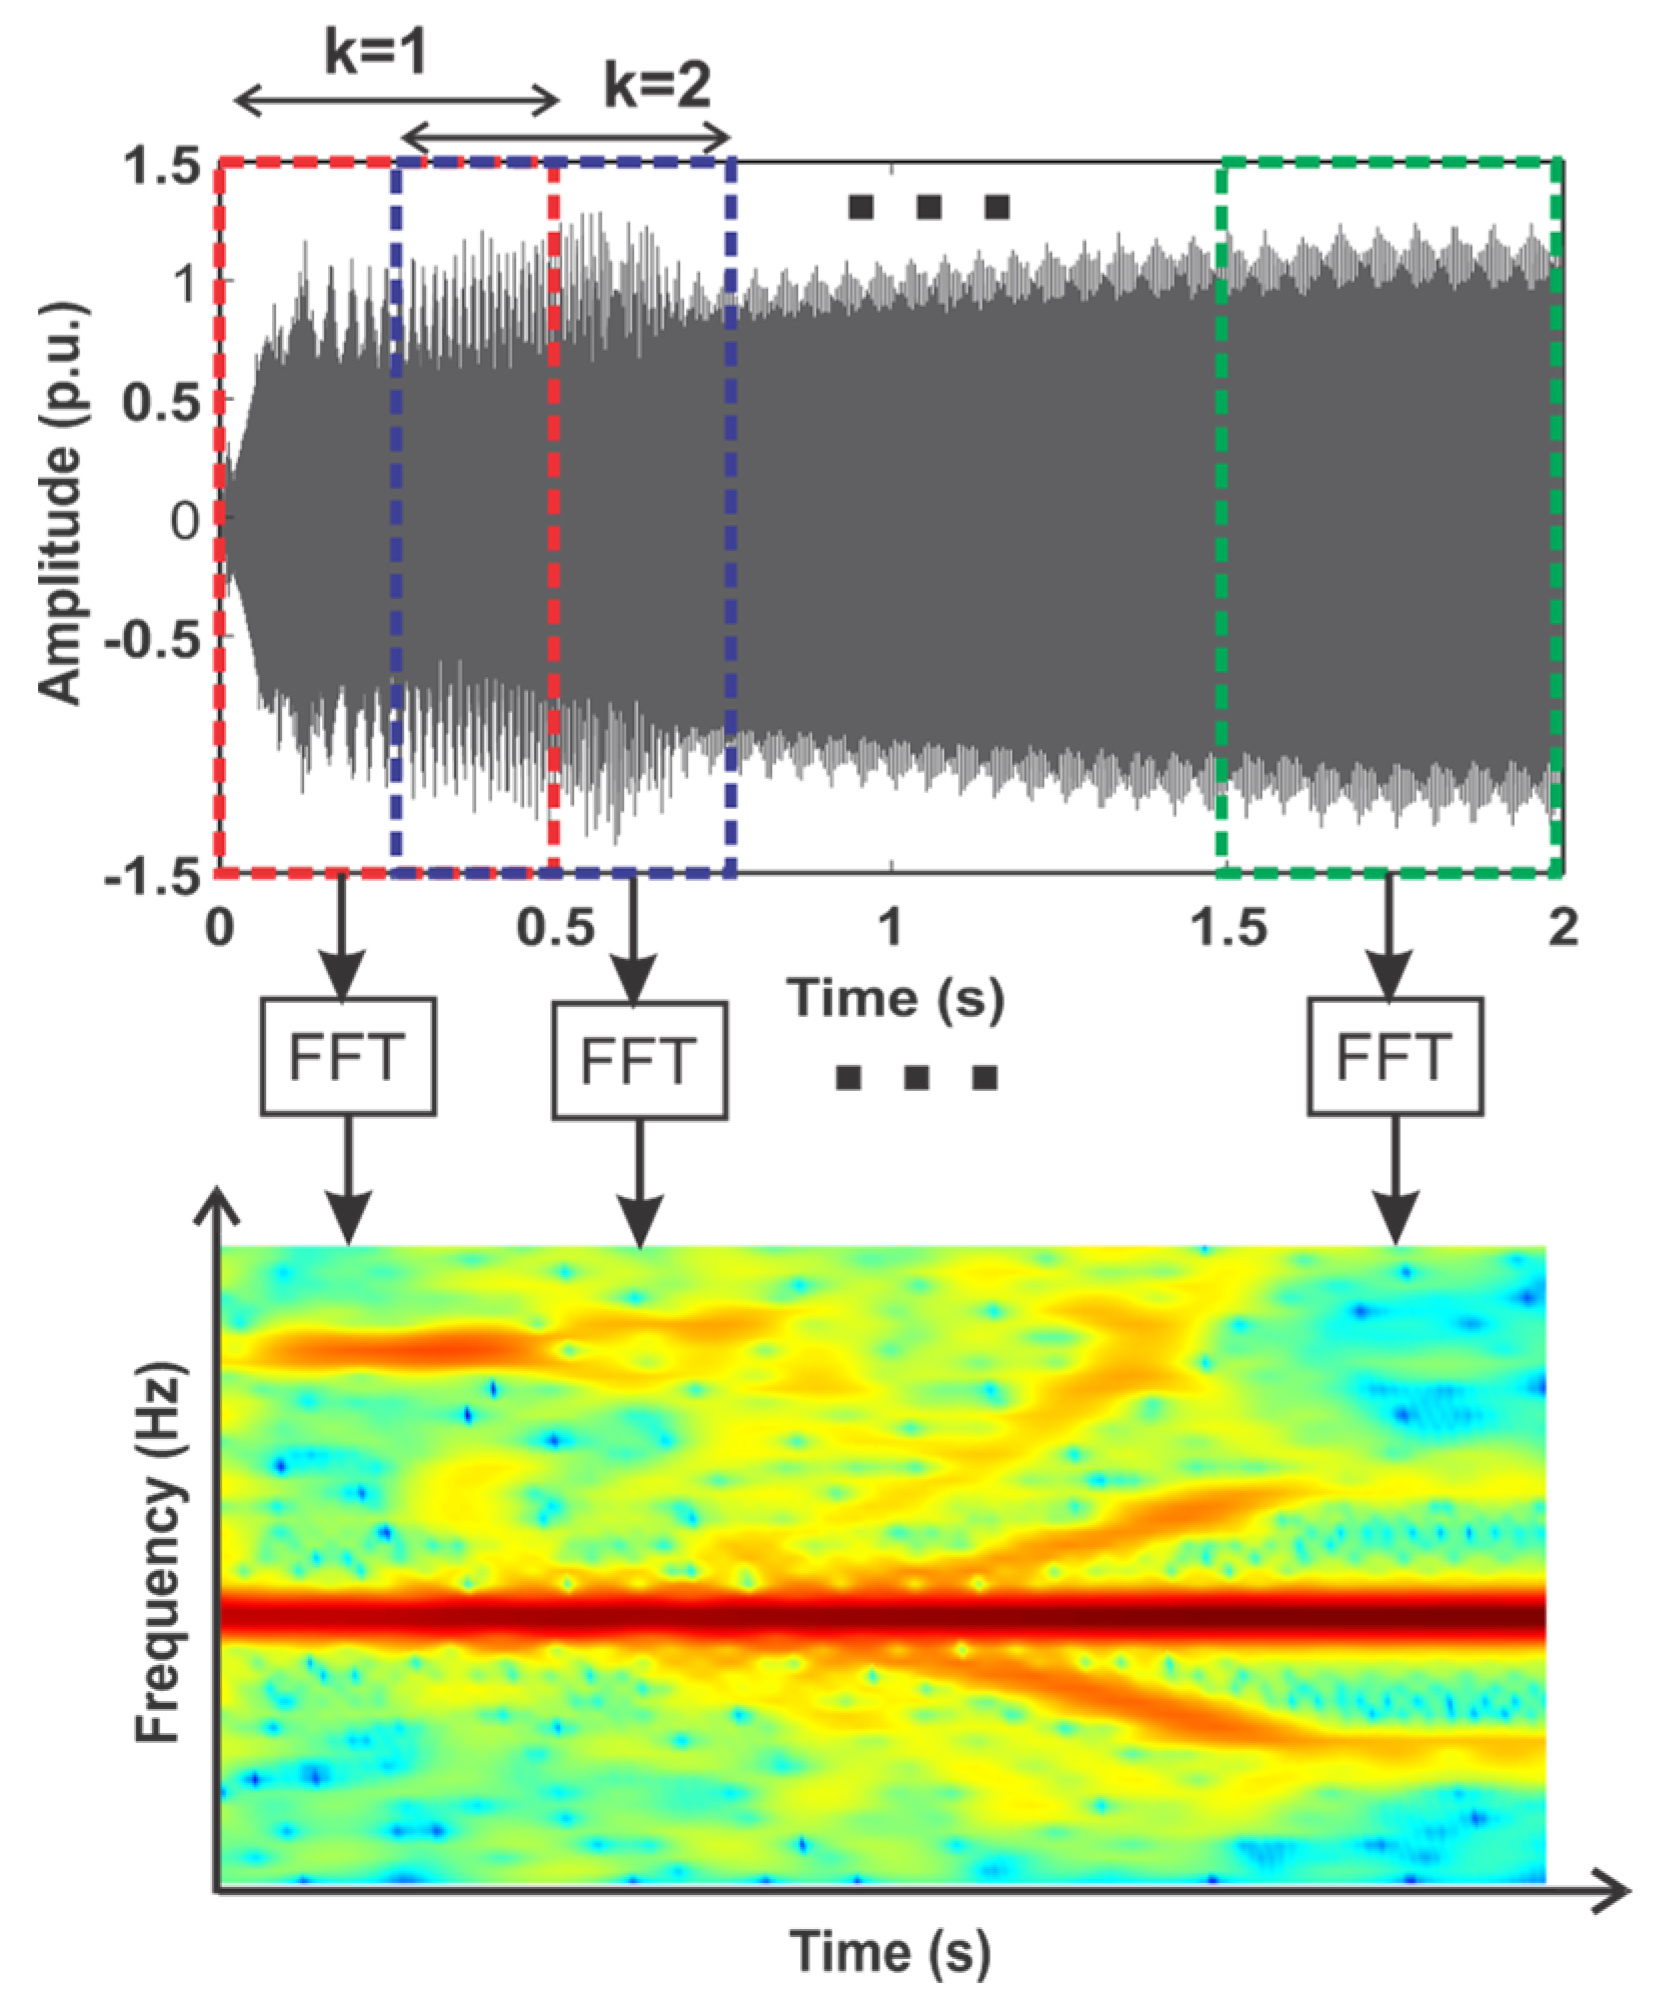
  • Step 2. Apply a time-frequency decomposition tool to obtain a time-frequency map of the captured stray flux and current signals; in this paper the STFT is computed by applying Equation (7). The STFT is selected since it can be easily implemented in programmable logic devices, and it allows a clear visualization of the fault components evolution.
  • Step 3. Using Equations (8)–(11), compute the proposed indicators: mean ( R F i j ) , mean ( R C i j ) , max ( R F i j ) , max ( R C i j ) in each region of interest, in order to characterize the fault-related pattern evolution for the stray flux and current signals. The regions of interest are obtained by dividing the t-f map into a grid of m rows by n columns. These regions of interest are in areas covered by the start-up transient. During the startup transient, the current reaches a high value in its amplitude, and it decreases until it arrives at steady state. Therefore, in using the envelope of the current signal, this part can be automatically isolated by setting a limit value (obtained through the last samples) equal to the maximum envelope amplitude at steady state. The intersection of this limit value with the time axis will be nearly at the end of the start-up transient.
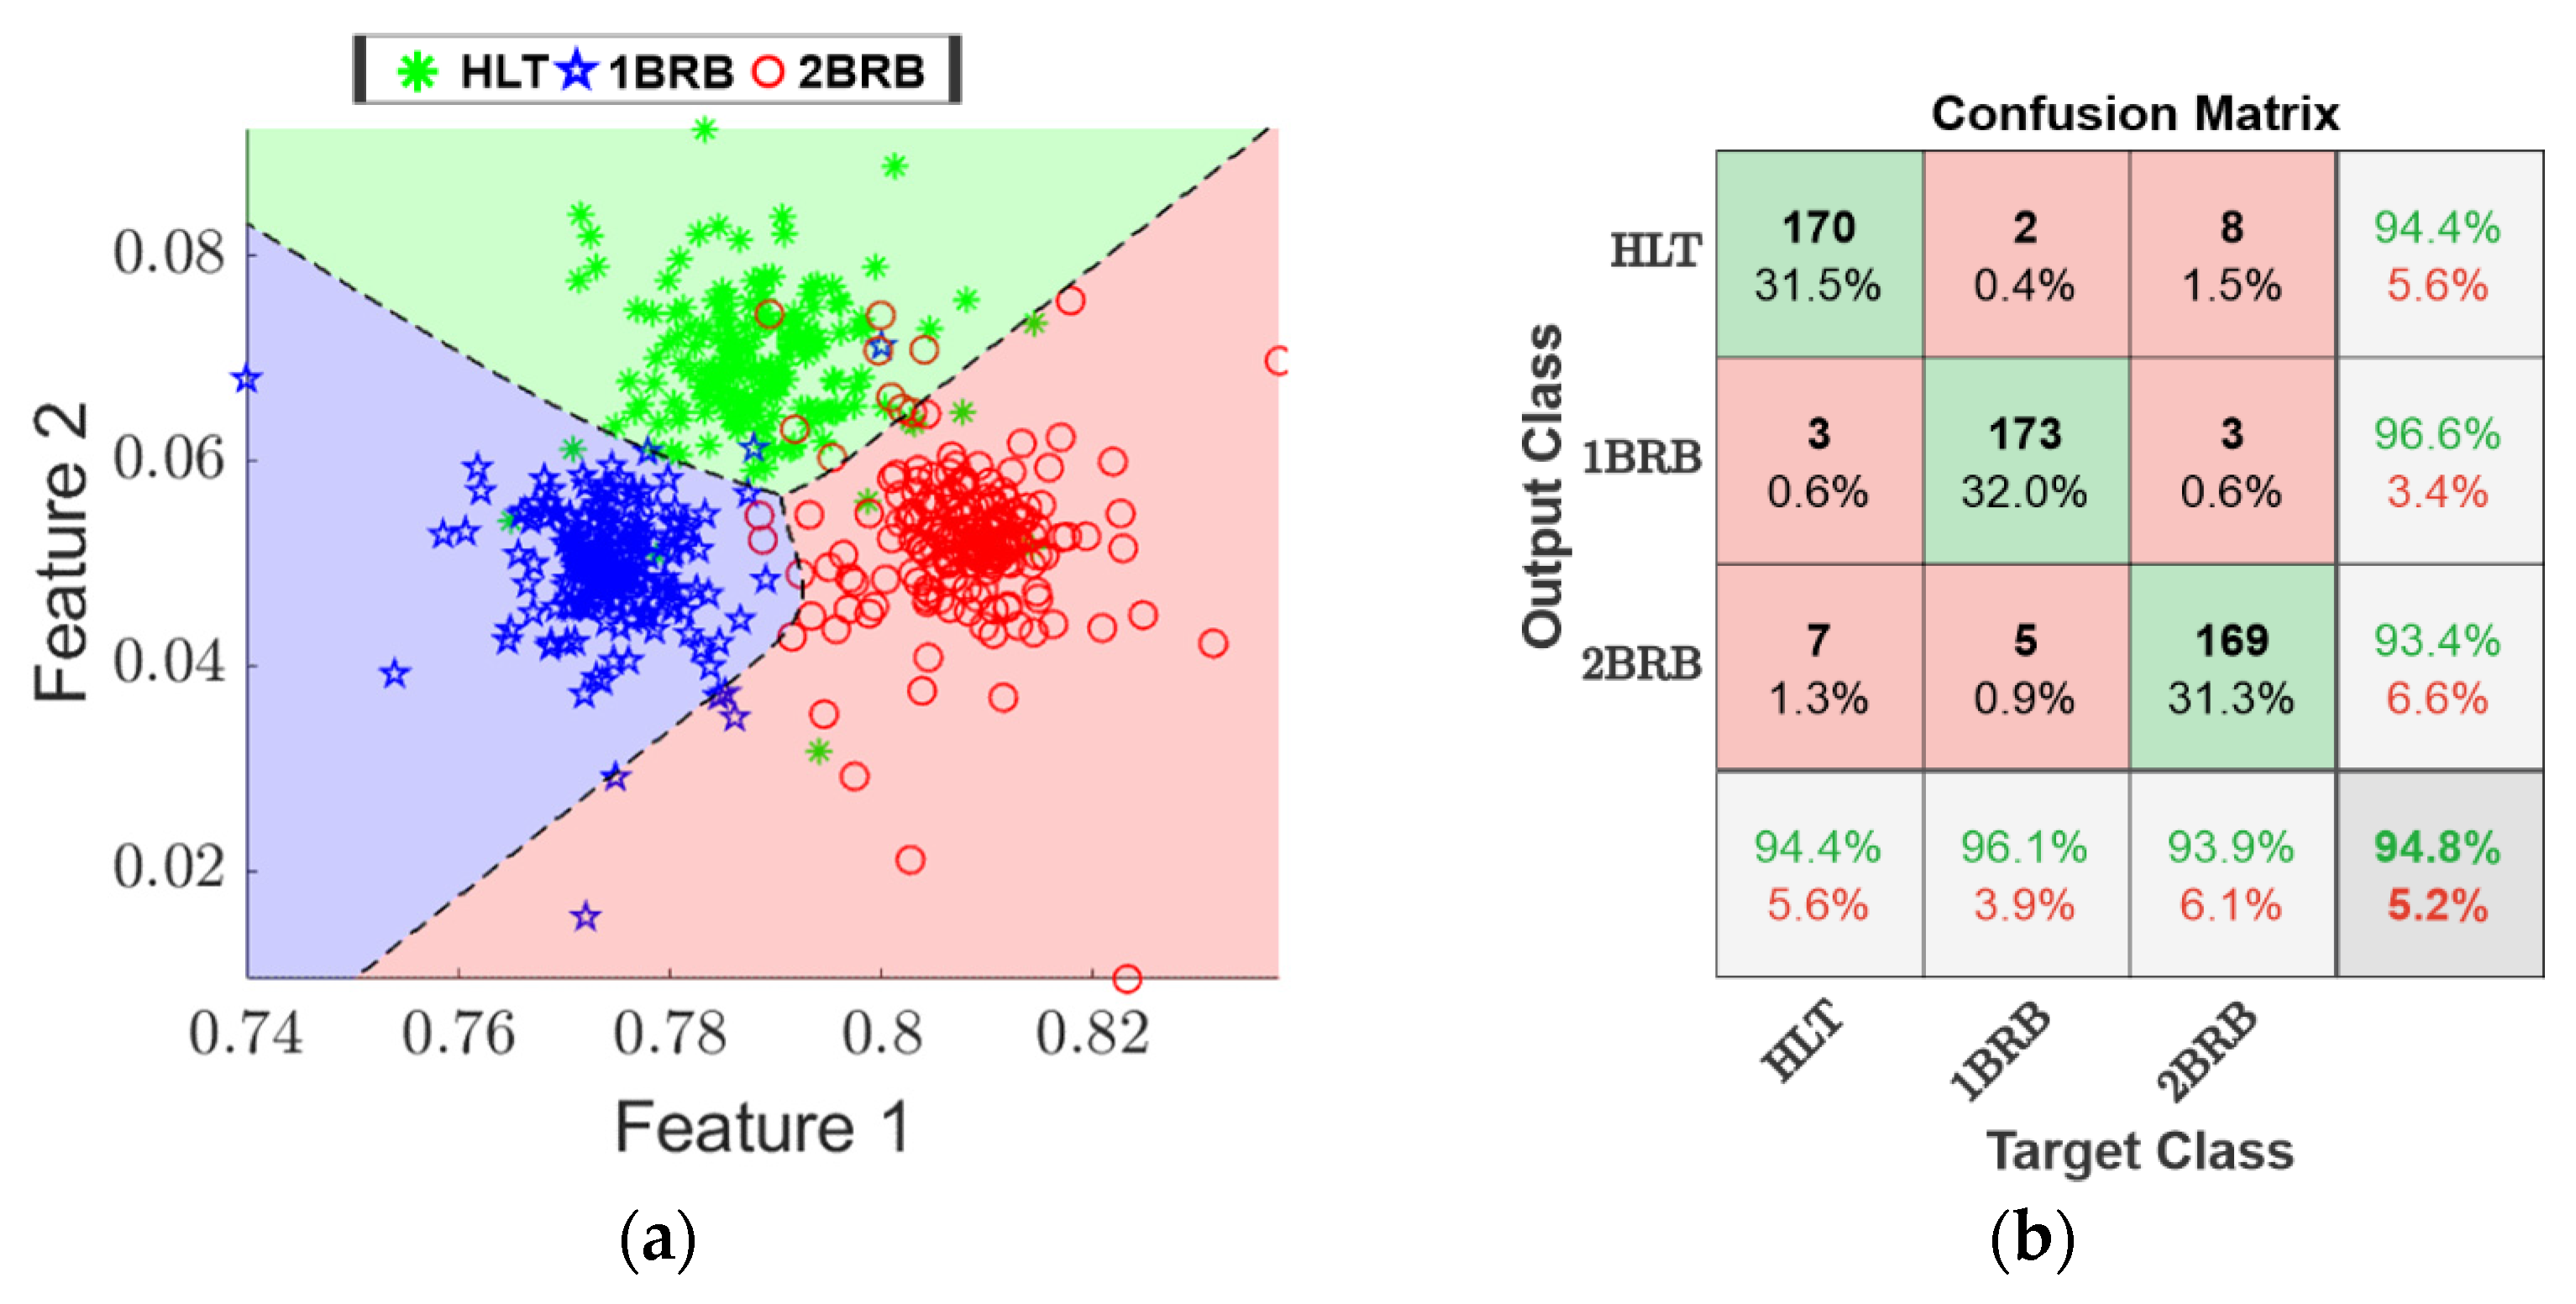
  • Step 4. Perform a feature reduction and fusion signals by applying an LDA, as described in Section 2.3. After that, a two-dimensional projection is obtained, in which the maximization of the data separability is achieved for the considered classes: healthy motor, one broken rotor bar, and two broken rotor bars. This projection allows the data clustering between the different fault severities to be observed, since the main projection axes are selected to be Feature 1 and Feature 2, respectively.
  • Step 5. Perform an automatic classification of the motor condition status: healthy, one broken rotor bar, and two broken rotor bars, by means of the proposed indicators. For the purposes of this paper, an FFNN with hyperbolic tangent sigmoid and SoftMax activation functions in the hidden and output layers are used, respectively. The FFNN architecture is selected due to its simplicity, the low computation resources demanded by its calculation, and the ease of its implementation in hardware devices.

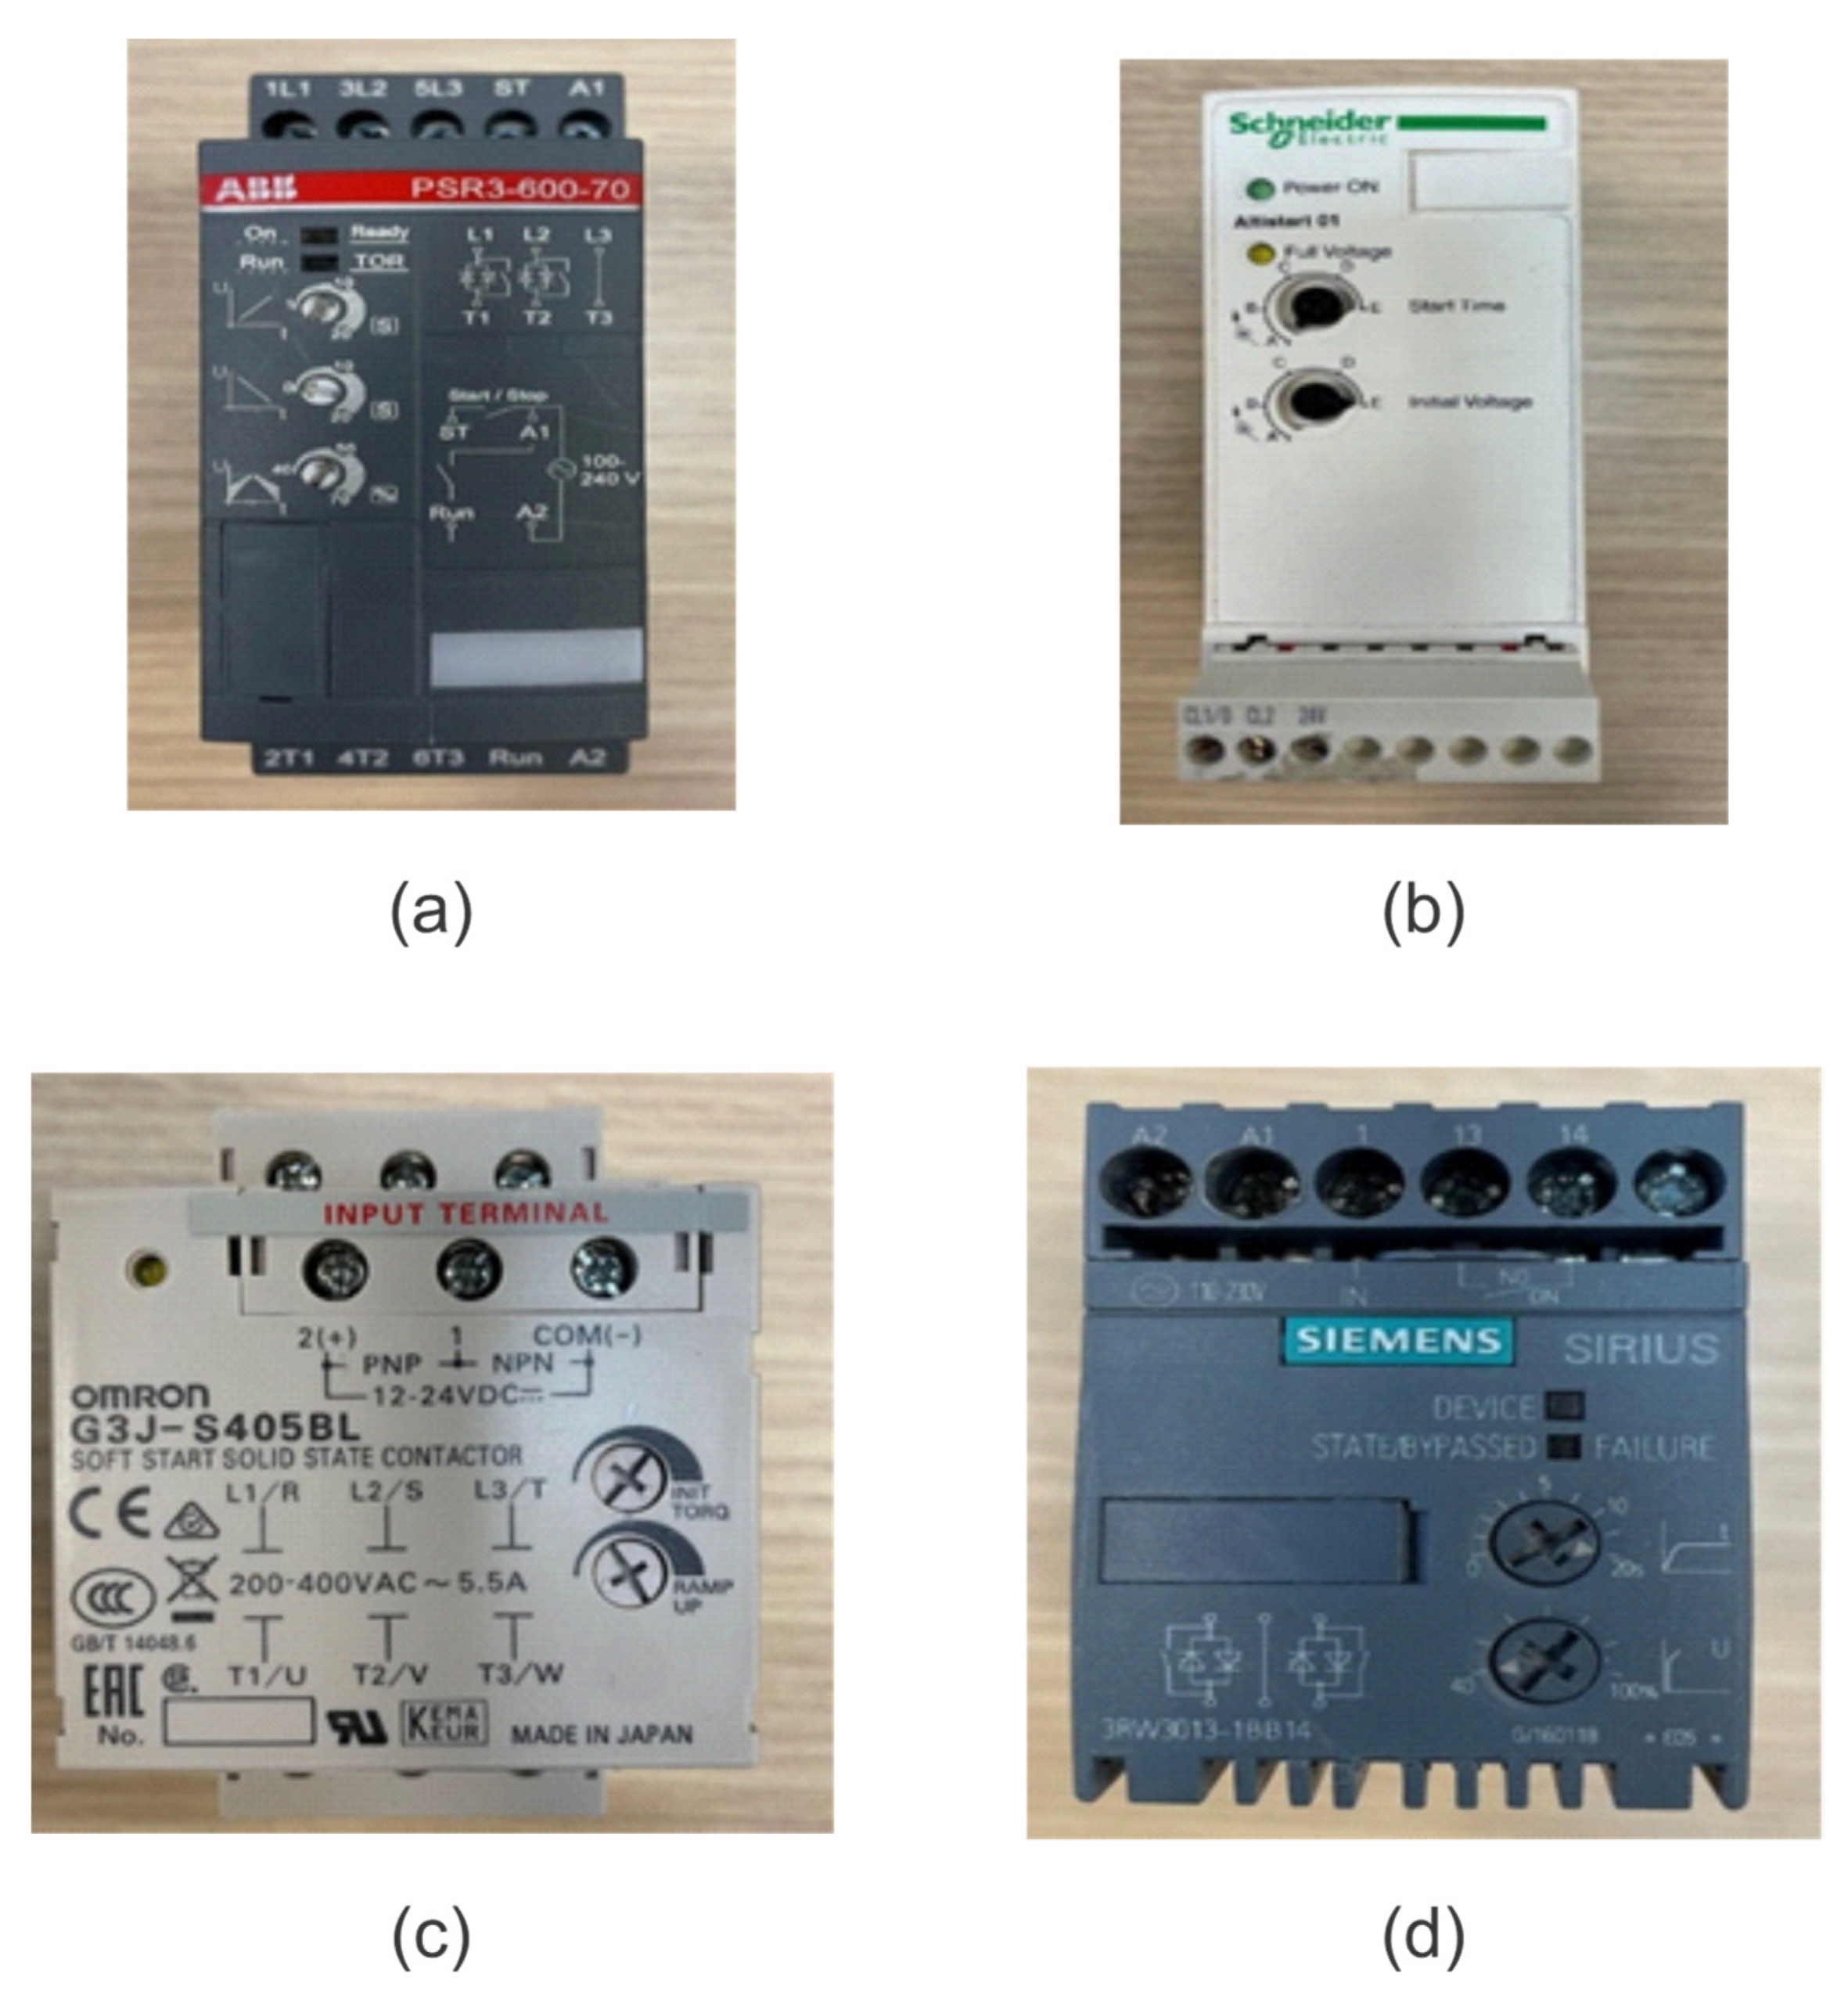
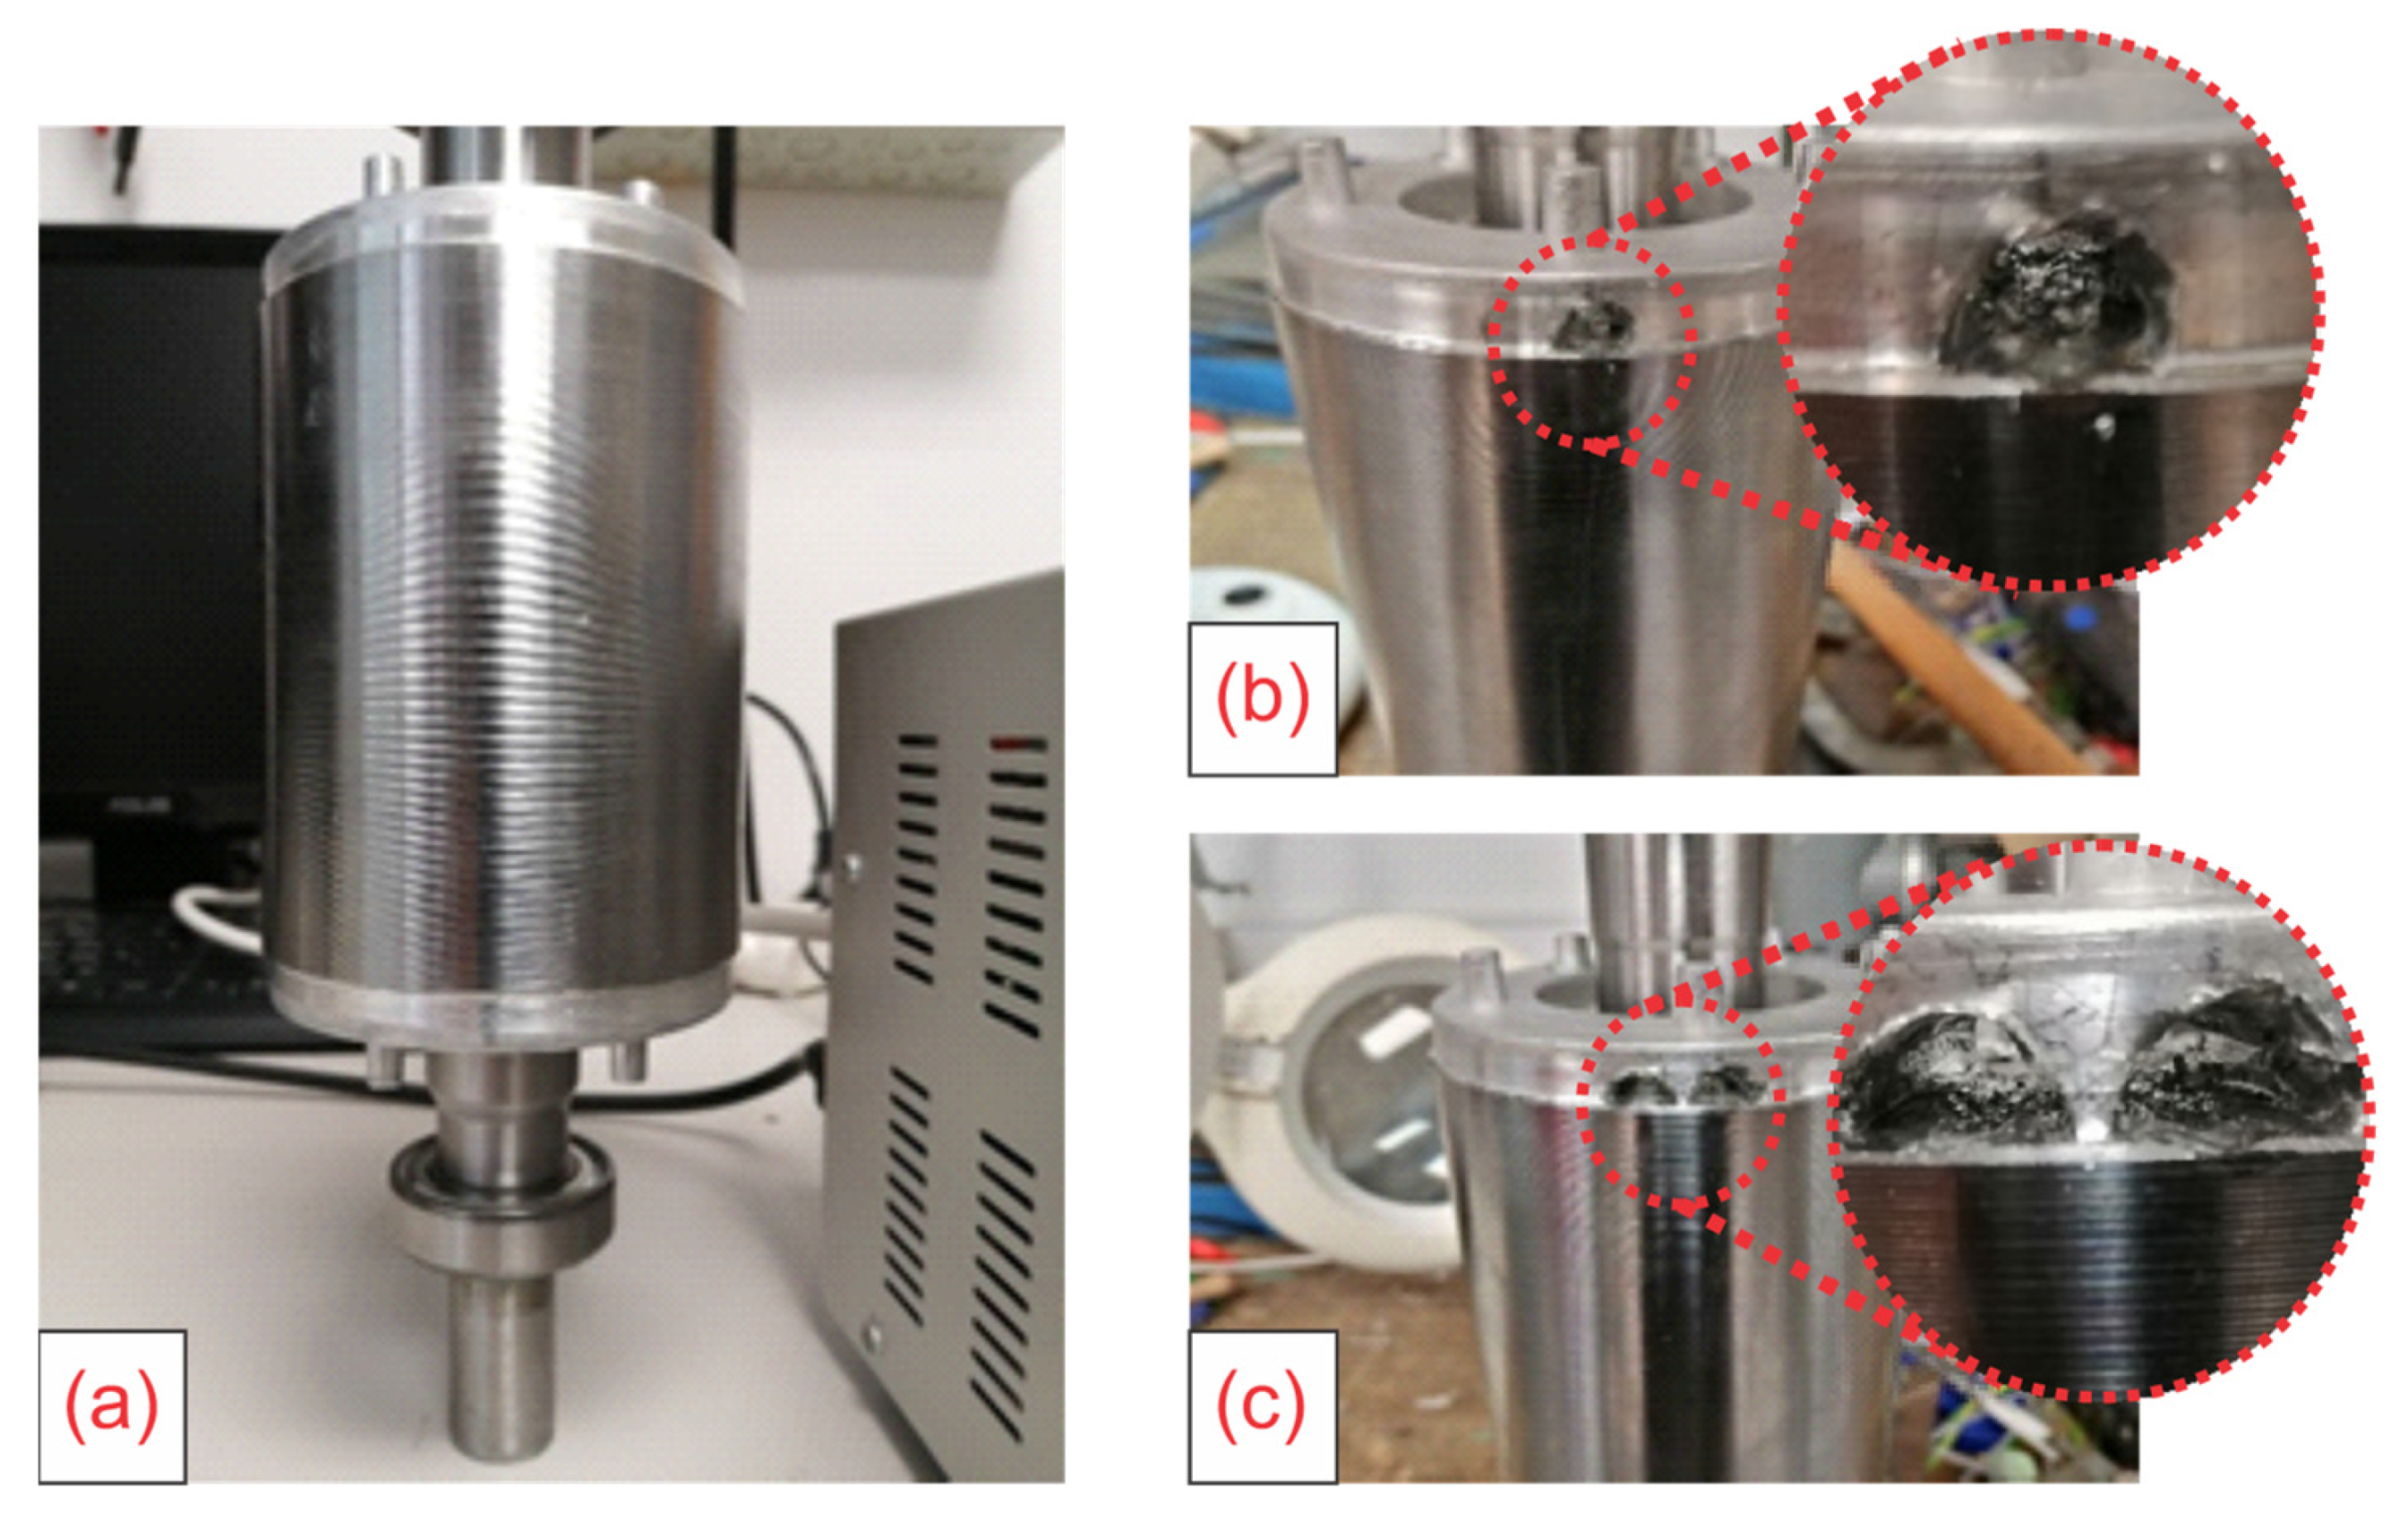
4. Experimental Setup

Multiple experiments were carried out using a laboratory squirrel cage induction motor with 28 rotor bars, in order to validate the proposal. The main characteristics of the motor are listed in Table 1. The IM was driving a DC machine, which operated as a load. Hence, the load level was controlled by varying the excitation current of the DC machine. The experimentation testbench is shown in Figure 6. During the tests, two main physical magnitudes were captured: the magnetic stray flux, and the current demanded by the stator winding. To obtain the stray flux signals, a coil sensor is attached to the motor frame. This sensor was made in the laboratory, and it consists of an air coil with an internal diameter of 39 mm and an external diameter of 80 mm with 1000 turns (Figure 7 shows the dimensions and outline of the used sensor). Furthermore, in order to capture the current signals, a current clamp was installed in one of the stator power supply lines. Finally, an oscilloscope waveform recorder was used in order to acquire the current and stray flux signals for 30 s, and a sampling frequency of 5 kHz.
Additionally, the machine was started by using four different soft-starters from different manufacturers (see Figure 8). The characteristics of the different soft-starters used are shown in Table 2. In this way, several tests were carried out using different levels of initial voltage/torque and different voltage ramp duration depending on the topology of the soft-starter, as described in Table 3. This allowed us to obtain several signals under different working conditions of the induction machine.
As a studied fault, broken rotor bars were induced in the induction motor by drilling a hole at the bar-end ring contact. Figure 9a shows the rotor in healthy conditions, before any hole was drilled. Besides, Figure 9b,c show the one and two induced broken rotor bars, respectively.

5. Results and Discussion

This section shows and describes the results obtained during the experimentation by following the proposed methodology. Additionally, the fault-related harmonics pattern evolution during the start-up transient of the machine are evidenced and examined by means of time-frequency maps. Thereafter, the resulting decision regions modelled by the proposed FFNN architecture are presented. Finally, the effectiveness of the proposed methodology is presented.
Figure 10 and Figure 11 show the results obtained when computing the STFT of the magnetic stray flux and current signals, respectively, for a healthy motor and a motor working under two broken rotor bars. These signals were captured during the experimentation, and they correspond to the Schneider starter when setting different starting times: 1 s, 2 s, 4 s. The STFT was obtained with a window size of 4096 samples, and a sliding size of 128 data points. When comparing the results shown there, it is relevant to note that due to the behavior established by each starter (defined by the technology used by the manufacturer), it is possible to appreciate a diversity of frequency components introduced by it, in such a way that different start-up times yield a different fault-related frequency evolution. Thus, for example, it is not possible to discern a clear difference (in terms of frequency content) between the healthy motor and the motor with two broken rotor bars in the stray flux signals when the starting time is set to 3 s, since similar t-f maps are obtained. However, if the start-up time is set to 4 s, it is possible to appreciate a very clear amplification of the rotor-related fault components (indicated with an arrow in Figure 10) in the t-f stray flux maps. In contrast, if this same analysis is carried out for current signals, it is more evident that there is a clear difference between a healthy motor and a motor with two broken rotor bars when the starting duration is 3 s. These results highlight the need and the relevance of merging the information provided by the magnetic stray flux and current signals simultaneously.
On the other hand, the effectiveness, per evaluated class (HLT, 1BRB, 2BRB), is obtained through the calculation of the fault detection rate index (FDR). This index can be computed by dividing the number of correct classifications over the total number of samples in each class. In this regard, Figure 12, Figure 13, Figure 14 and Figure 15 show the FDR obtained by evaluating the different soft-starters, and for the different machine healthiness states, i.e., a healthy motor (HLT), a motor with one broken rotor bar (1BRB), and a motor with two broken rotor bars. These results were obtained for an FFNN architecture with two neurons in the input layer, a hidden layer with two neurons, and three neurons in the output layer (corresponding to the three evaluated motor states). In addition, for the evaluation of the FFNN, 540 training samples were used for training, and another 180 different samples were used for validation, using each of the different models of soft-starters evaluated. As it can be observed in Figure 12, Figure 13, Figure 14 and Figure 15, it is possible to discriminate and separate the different evaluated motor states by means of the proposed methodology, even in cases where variations in the fault-related pattern evolutions are introduced by alterations/perturbations according to the control components and mechanisms implemented by different soft-starters. Figure 12 shows that a high FDR is achieved, since only a few samples have been misclassified, reaching a 94.8% overall classification success. Similarly, Figure 13 confirms the excellent performance of the proposed methodology for the diagnosis and automatic classification of rotor faults when the ABB soft-starter is employed, since a total of 539 out of 540 samples have been classified correctly. In a similar fashion, Figure 14 and Figure 15 show the classification results obtained when the proposed methodology is applied to the induction motor started by means of the Omron and Schneider soft-starter, respectively. In these Figures, it can be observed that the proposal is able to correctly classify among the different fault studied cases, since an overall FDR of 95% is achieved (only a few samples have been misclassified between healthy motor, and motor with one broken rotor bar). Additionally, the best results were obtained when evaluating the SIEMENS soft-starter, in which an FDR of 99.8% was achieved. On the other hand, the lowest performance was found when the motor was started using the ABB soft-starter, obtaining an FDR of 94.4%. This may be due to the diverse and erratic behavior of the slip changes experienced by the motor at start-up, introduced by the soft-starter, according to the manufacturer′s technology.
The performance for different t-f map grid sizes was evaluated using the overall efficiency reported by the FFNN, which is calculated dividing the samples that are correctly classified into the total number of samples. In this regard, Table 4 shows the results obtained for different time-frequency map sizes ranging from three rows by three columns, up to nine rows by nine columns. When comparing these results, it can be highlighted that the chosen grid size is highly relevant for the final diagnosis, and it has a significant impact on the efficiency achieved by the FFNN. Thus, the results show that the greater the size of the grid, the higher the efficiency achieved, however, a limit can be observed where the efficiency begins to decrease. This point is reached when the grid size is equal to nine rows by nine columns. Additionally, Table 4 shows that the best performance of the proposed methodology is achieved when the size of the t-f map grid is eight rows by eight columns.
Additionally, Table 5 summarizes the results obtained with the proposed methodology, and its comparison with the latest works reported in the literature for the automatic detection of broken bars in induction motors. The comparison includes the main techniques used in each proposed methodology, the technique applied to start the motor, the physical magnitude analyzed, and the accuracy rate achieved. As shown in Table 5, most of the works have been focused on the study of one unique magnitude to diagnose BRB faults, and many of them have reported the analysis under the transient regime of the current signals. For example, Martinez et al. [33] studied the current signals in order to provide an automated final diagnosis by means of an artificial neural network, reporting an overall effectiveness of 100%. However, they analysed only current signals, which may lead to a false diagnosis due to its intrinsic implications [21]. In contrast, Pasqualotto et al. [34] analysed stray flux signals, and proposed a methodology relying on a CNN in order to generate an automated final diagnosis. They achieved an accuracy rate of 66.7%, which in real terms is a very low efficiency that can potentially lead to a false indication. Furthermore, the use of a CNN as a main classifier may limit the viability of the method since a higher number of samples is required for training the CNN. In this regard, in order to avoid the high computational complexity for classification, in [35] the authors proposed a methodology based on the use of STFT with Gaussian and Kaiser windowing and an Otsu algorithm, achieving an accuracy rate of 100%. However, the proposed methodology is focused on DOL motor starters. In contrast, the proposed methodology is focused on the analysis of stray flux, and current signals, obtaining an overall effectiveness of 94.4%, being even higher in some of the soft starter models used in the experimentation as shown in Table 4.

6. Conclusions

This paper has introduced a novel methodology for the automatic diagnosis of broken rotor bars in soft-started induction motors by means of the information fusion of current and stray flux signals. The proposed methodology relies on a pair of indicators proposed here. Such indicators are based on the arithmetic mean and maximum value, respectively, of specific regions from a time-frequency map; which are obtained by analyzing the current and stray flux signals captured during the start-up transient of the machine. These indicators are based on the fact that rotor faults yield the amplification of specific frequency components, which are found to be slip-dependent; hence, their evolution and amplification can be tracked by the proposed indicators. Additionally, as it can be observed in the results, it is very relevant to combine the information provided by the current and the stray flux signals, since the control mechanisms applied by each soft-starter manufacturer tend to modify the fault pattern evolutions, depending on the parameters used, according to the specific motor application and particular necessities of the final user. In this regard, the proposed methodology shows an excellent performance in the automatic classification among the studied faults, invariably to the soft-starter used, since an overall performance higher than 94.4% is achieved in any case. Finally, the obtained results show that, by means of the proposed methodology, it is possible to automatically discriminate among a healthy motor, a motor working under one broken rotor bar, and a motor working under two broken rotor bars. The proposal may find a great applicability under a vast array of applications demanding automated final diagnosis, especially those where the motor is constantly operated under starts/stops by means of a soft-starter.

Author Contributions

Conceptualization J.A.A.-D. and R.A.O.-R.; methodology, I.Z.-R., J.A.A.-D. and R.A.O.-R.; software, A.N.-N. and I.Z.-R.; validation, A.N.-N., I.Z.-R. and V.B.-M.; formal analysis, I.Z.-R. and A.N.-N.; investigation, A.N.-N., I.Z.-R. and V.B.-M.; resources, J.A.A.-D. and R.A.O.-R.; data curation, A.N.-N. and V.B.-M.; writing—original draft preparation, A.N.-N. and I.Z.-R.; writing—review and editing, I.Z.-R., J.A.A.-D. and R.A.O.-R.; visualization, I.Z.-R., J.A.A.-D. and R.A.O.-R.; supervision, J.A.A.-D. and R.A.O.-R.; project administration, J.A.A.-D. and R.A.O.-R.; funding acquisition, J.A.A.-D. and R.A.O.-R. All authors have read and agreed to the published version of the manuscript.

Funding

This work was supported by the Spanish ‘Ministerio de Ciencia Innovación y Universidades’ and FEDER program in the framework of the ‘Proyectos de I+D de Generación de Conocimiento del Programa Estatal de Generación de Conocimiento y Fortalecimiento Científico y Tecnológico del Sistema de I+D+i, Subprograma Estatal de Generación de Conocimiento’ (ref: PGC2018-095747-B-I00).

Acknowledgments

The authors would like to thank Consejo Nacional de Ciencia y Tecnología (CONACyT) under scholarship 652815.

Conflicts of Interest

The authors declare no conflict of interest.

References

  1. Amezquita-Sanchez, J.P.; Valtierra-Rodriguez, M.; Perez-Ramirez, C.A.; Camarena-Martinez, D.; Garcia-Perez, A.; Romero-Troncoso, R.J. Fractal dimension and fuzzy logic systems for broken rotor bar detection in induction motors at start-up and steady-state regimes. Meas. Sci. Technol. 2017, 28, 75001. [Google Scholar] [CrossRef]
  2. Park, Y.; Yang, C.; Kim, J.; Kim, H.; Lee, S.B.; Gyftakis, K.N.; Panagiotou, P.A.; Kia, S.H.; Capolino, G.-A. Stray flux monitoring for reliable detection of rotor faults under the influence of rotor axial air ducts. IEEE Trans. Ind. Electron. 2019, 66, 7561–7570. [Google Scholar] [CrossRef]
  3. Larabee, B.; Pellegrino, B.; Flick, B. Induction motor starting methods and issues. In Proceedings of the Record of Conference Papers Industry Applications Society 52nd Annual Petroleum and Chemical Industry Conference, Denver, CO, USA, 12–14 September 2005; pp. 217–222. [Google Scholar] [CrossRef]
  4. Corral-Hernandez, J.A.; Antonino-Daviu, J.; Pons-Llinares, J.; Climente-Alarcon, V.; Francés-Galiana, V. Transient-Based Rotor Cage Assessment in Induction Motors Operating with Soft Starters. IEEE Trans. Ind. Appl. 2015, 51, 3734–3742. [Google Scholar] [CrossRef]
  5. Corral-Hernandez, J.A.; Antonino-Daviu, J. Startup-based rotor fault detection in soft-started induction motors for different soft-starter topologies. In Proceedings of the IECON 2016-42nd Annual Conference of the IEEE Industrial Electronics Society, Florence, Italy, 23–26 October 2016; pp. 6977–6982. [Google Scholar] [CrossRef]
  6. Stone, Y.G.C.; Stranges, M.K.W.; Dunn, D.G. Common Questions on Partial Discharge Testing. IEEE Ind. Appl. Mag. 2016, 22, 14–19. [Google Scholar] [CrossRef]
  7. Benbouzid, M.E.H. A review of induction motors signature analysis as a medium for faults detection. IEEE Trans. Ind. Electron. 2000, 47, 984–993. [Google Scholar] [CrossRef] [Green Version]
  8. Capolino, A.; Romary, R.; Hénao, H.; Pusca, R. State of the art on stray flux analysis in faulted electrical machines. In Proceedings of the 2019 IEEE Workshop on Electrical Machines Design, Control and Diagnosis (WEMDCD), Athens, Greece, 22–23 April 2019; pp. 181–187. [Google Scholar] [CrossRef]
  9. Zamudio-Ramírez, I.; Osornio-Ríos, R.A.; Antonino-Daviu, J.A.; Quijano-Lopez, A. Smart-sensor for the automatic detection of electromechanical faults in induction motors based on the transient stray flux analysis. Sensors 2020, 20, 1477. [Google Scholar] [CrossRef] [Green Version]
  10. Rivera-Guillen, J.R.; de Santiago-Perez, J.J.; Amezquita-Sanchez, J.P.; Valtierra-Rodriguez, M.; Romero-Troncoso, R.J. Enhanced FFT-based method for incipient broken rotor bar detection in induction motors during the startup transient. Measurement 2018, 124, 277–285. [Google Scholar] [CrossRef]
  11. Henao, H.; Capolino, G.-A.; Fernandez-Cabanas, M.; Filippetti, F.; Bruzzese, C.; Strangas, E.; Pusca, R.; Estima, J.; Riera-Guasp, M.; Hedayati-Kia, S. Trends in fault diagnosis for electrical machines: A review of diagnostic techniques. IEEE Ind. Electron. Mag. 2014, 8, 31–42. [Google Scholar] [CrossRef]
  12. Zamudio-Ramirez, R.A.; Osornio-Rios, J.A.; Antonino-Daviu, J.A. Smart Sensor for Fault Detection in Induction Motors Based on the Combined Analysis of Stray-Flux and Current Signals: A Flexible, Robust Approach. IEEE Ind. Appl. Mag. 2022, 28, 56–66. [Google Scholar] [CrossRef]
  13. Ince, T. Real-time broken rotor bar fault detection and classification by shallow 1D convolutional neural networks. Electr. Eng. 2019, 101, 599–608. [Google Scholar] [CrossRef]
  14. Valtierra-Rodriguez, M.; Rivera-Guillen, J.R.; Basurto-Hurtado, J.A.; De-Santiago-Perez, J.J.; Granados-Lieberman, D.; Amezquita-Sanchez, J.P. Convolutional neural network and motor current signature analysis during the transient state for detection of broken rotor bars in induction motors. Sensors 2020, 20, 3721. [Google Scholar] [CrossRef] [PubMed]
  15. Pasqualotto, D.; Navarro, A.N.; Zigliotto, M.; Antonino-Daviu, J.A.; Biot-Monterde, V. Fault Detection in Soft-started Induction Motors using Convolutional Neural Network Enhanced by Data Augmentation Techniques. In Proceedings of the IECON 2021—47th Annual Conference of the IEEE Industrial Electronics Society, Toronto, TO, Canada, 13–16 October 2021; Volume 2021. [Google Scholar] [CrossRef]
  16. Asad, T.; Vaimann, A.; Belahcen, A.; Kallaste, A.; Rassõlkin, M.; Iqbal, M.N. The cluster computation-based hybrid fem–analytical model of induction motor for fault diagnostics. Appl. Sci. 2020, 10, 7572. [Google Scholar] [CrossRef]
  17. Burnett, R.; Watson, J.F.; Elder, S. The detection and location of rotor faults within three phase induction motors. In Proceedings of the International Conference on Electrical Machines, Paris, France, 17–20 October 1994; pp. 288–293. [Google Scholar]
  18. Biot-Monterde, V.; Navarro-Navarro, Á.; Antonino-Daviu, J.A.; Razik, H. Stray flux analysis for the detection and severity categorization of rotor failures in induction machines driven by soft-starters. Energies 2021, 14, 5757. [Google Scholar] [CrossRef]
  19. Ceban, A.; Pusca, R.; Romary, R. Study of rotor faults in induction motors using external magnetic field analysis. IEEE Trans. Ind. Electron. 2012, 59, 2082–2093. [Google Scholar] [CrossRef]
  20. Bellini, A.; Filippetti, F.; Franceschini, G.; Tassoni, C.; Kliman, G.B. Quantitative evaluation of induction motor broken bars by means of electrical signature analysis. IEEE Trans. Ind. Appl. 2001, 37, 1248–1255. [Google Scholar] [CrossRef]
  21. Lee, S.B.; Shin, J.; Park, Y.; Kim, H.; Kim, J. Reliable Flux based Detection of Induction Motor Rotor Faults from the 5th Rotor Rotational Frequency Sideband. IEEE Trans. Ind. Electron. 2020, 68, 7874–7883. [Google Scholar] [CrossRef]
  22. Jiang, C.; Li, S.; Habetler, T.G. A review of condition monitoring of induction motors based on stray flux. In Proceedings of the 2017 IEEE Energy Conversion Congress and Exposition (ECCE), Cincinnati, OH, USA, 1–5 October 2017; Volume 2017, pp. 5424–5430. [Google Scholar] [CrossRef]
  23. Park, Y.; Lee, S.B.; Yun, J.; Sasic, M.; Stone, G.C. Air Gap Flux-Based Detection and Classification of Damper Bar and Field Winding Faults in Salient Pole Synchronous Motors. IEEE Trans. Ind. Appl. 2020, 56, 3506–3515. [Google Scholar] [CrossRef]
  24. Henao, H.; Demian, C.; Capolino, G.A. A frequency-domain detection of stator winding faults in induction machines using an external flux sensor. IEEE Trans. Ind. Appl. 2003, 39, 1272–1279. [Google Scholar] [CrossRef]
  25. Romary, R.; Roger, D.; Brudny, J.-F. Analytical computation of an AC machine external magnetic field. EPJ Appl. Phys. 2009, 47, 3. [Google Scholar] [CrossRef]
  26. Bellini, A.; Concari, C.; Franceschini, G.; Tassoni, C.; Toscani, A. Vibrations, currents and stray flux signals to asses induction motors rotor conditions. In Proceedings of the IECON 2006-32nd Annual Conference on IEEE Industrial Electronics, Paris, France, 6–10 November 2006; Volume 2, pp. 4963–4968. [Google Scholar] [CrossRef]
  27. Romary, R.; Pusca, R.; Lecointe, J.P.; Brudny, J.F. Electrical machines fault diagnosis by stray flux analysis. In Proceedings of the 2013 IEEE Workshop on Electrical Machines Design, Control and Diagnosis, WEMDCD 2013, Paris, France, 11–12 March 2013; pp. 247–256. [Google Scholar] [CrossRef]
  28. Zamudio-Ramirez, I.; Osornio-Rios, R.A.A.; Antonino-Daviu, J.A.; Razik, H.; de Jesus Romero-Troncoso, R. Magnetic Flux Analysis for the Condition Monitoring of Electric Machines: A Review. IEEE Trans. Ind. Inform. 2021, 3203, 2895–2908. [Google Scholar] [CrossRef]
  29. Goktas, T.; Arkan, M.; Mamis, M.S.; Akin, B. Separation of induction motor rotor faults and low frequency load oscillations through the radial leakage flux. In Proceedings of the 2017 IEEE Energy Conversion Congress and Exposition (ECCE), Cincinnati, OH, USA, 1–5 October 2017; Volume 2017, pp. 3165–3170. [Google Scholar] [CrossRef]
  30. Song, X.; Liu, Z.; Yang, X.; Yang, J.; Qi, Y. Extended semi-supervised fuzzy learning method for nonlinear outliers via pattern discovery. Appl. Soft Comput. J. 2015, 29, 245–255. [Google Scholar] [CrossRef]
  31. Jin, X.; Zhao, M.; Chow, T.W.S.; Pecht, M. Motor bearing fault diagnosis using trace ratio linear discriminant analysis. IEEE Trans. Ind. Electron. 2014, 61, 2441–2451. [Google Scholar] [CrossRef]
  32. Camarena-Martinez, D.; Valtierra-Rodriguez, M.; Garcia-Perez, A.; Osornio-Rios, R.A.; Romero-Troncoso, R.D.J. Empirical mode decomposition and neural networks on FPGA for fault diagnosis in induction motors. Sci. World J. 2014, 2014, 908140. [Google Scholar] [CrossRef] [PubMed]
  33. Martinez-Herrera, A.L.; Ferrucho-Alvarez, E.R.; Ledesma-Carrillo, L.M.; Mata-Chavez, R.I.; Lopez-Ramirez, M.; Cabal-Yepez, E. Multiple Fault Detection in Induction Motors through Homogeneity and Kurtosis Computation. Energies 2022, 15, 1541. [Google Scholar] [CrossRef]
  34. Pasqualotto, D.; Navarro, A.N.; Zigliotto, M.; Antonino-Daviu, J.A. Automatic Detection of Rotor Faults in Induction Motors by Convolutional Neural Networks applied to Stray Flux Signals. In Proceedings of the 2021 22nd IEEE International Conference on Industrial Technology (ICIT), Valencia, Spain, 10–12 March 2021; Volume 2021, pp. 148–153. [Google Scholar] [CrossRef]
  35. Lopez-Ramirez, M.; Ledesma-Carrillo, L.M.; Garcia-Guevara, F.M.; Munoz-Minjares, J.; Cabal-Yepez, E.; Villalobos-Pina, F.J. Automatic Early Broken-Rotor-Bar Detection and Classification Using Otsu Segmentation. IEEE Access 2020, 8, 112624–112632. [Google Scholar] [CrossRef]
  36. Camarena-Martinez, D.; Perez-Ramirez, C.A.; Valtierra-Rodriguez, M.; Amezquita-Sanchez, J.P.; Romero-Troncoso, R.D.J. Synchrosqueezing transform-based methodology for broken rotor bars detection in induction motors. Meas. J. Int. Meas. Confed. 2016, 90, 519–525. [Google Scholar] [CrossRef]
Figure 1. Stray flux components (a) Radial. (b) Axial.
Energies 15 02511 g001
Figure 2. Evolutions of fault components related with broken rotor bars in the magnetic stray flux and current signals during the startup transient.
Energies 15 02511 g002
Figure 3. FFNN architecture: (a) general structure; (b) structure of a neuron.
Energies 15 02511 g003
Figure 4. Short-time Fourier transform with overlap of a time domain signal.
Energies 15 02511 g004
Figure 5. Proposed methodology flow-up.
Energies 15 02511 g005
Figure 6. Experimental testbench.
Energies 15 02511 g006
Figure 7. Shape and dimensions of the coil sensor used during the experiments.
Energies 15 02511 g007
Figure 8. Tested soft-starters. (a) ABB PSR3-600-70. (b) Schneider. (c) Omron G3J-S405BL. (d) SIEMENS SIRIUS.
Energies 15 02511 g008
Figure 9. Rotor used during experimentation. (a) Healthy. (b) One broken bar. (c) Two broken bars.
Energies 15 02511 g009
Figure 10. STFT t-f maps obtained by analyzing the stray flux signal of the IM for different start-up time transients when using Schneider soft-starter for a healthy motor, and two broken rotor bars.
Energies 15 02511 g010
Figure 11. STFT t-f maps obtained by analyzing the current signal of the IM for different start-up time transients when using Schneider soft-starter for healthy motor, and one with two broken rotor bars.
Energies 15 02511 g011
Figure 12. Classification results of the proposed methodology obtained for the Siemens soft-starter. (a) Resulting decision regions modelled by the proposed NN-based classifier over the 2-dimensional space; (b) Confusion matrix.
Energies 15 02511 g012
Figure 13. Classification results of the proposed methodology obtained for the ABB soft-starter. (a) Resulting decision regions modelled by the proposed NN-based classifier over the 2-dimensional space; (b) Confusion matrix.
Energies 15 02511 g013
Figure 14. Classification results of the proposed methodology obtained for the Omron soft-starter. (a) Resulting decision regions modelled by the proposed NN-based classifier over the 2-dimensional space; (b) Confusion matrix.
Energies 15 02511 g014
Figure 15. Classification results of the proposed methodology obtained for the Schneider soft-starter. (a) Resulting decision regions modelled by the proposed NN-based classifier over the 2-dimensional space; (b) Confusion matrix.
Energies 15 02511 g015
Table 1. Rated values and characteristics of the driving induction motor.
Power (kW)1.1
Frequency (Hz)50
Voltage (V)400
Current (A)2.4
Speed (rpm)1440
ConnectionStar
Number of Pole Pairs 2
Table 2. Main characteristics of the industrial soft-starters used during experimentation.
Soft-Starter ModelStart-Up Transient
Duration (s)
Initial Applied
Voltage
Schneider530%
Schneider440, 50%
Schneider355%
Schneider267, 50%
Schneider180%
ABB2040%
ABB1055%
ABB170%
Omron172%
Omron12, 558%
Omron2544%
SIEMENS0100%
SIEMENS570%
SIEMENS1050%
SIEMENS2040%
Table 3. Characteristics and rated values of the industrial soft-starters used during tests.
ManufacturerSiemensABBOmronSchneider
Model type3RW3013-1BB14PSR3-600-70G3J-S405BLATS01N109FT
Country of productionGermanyChinaJapanGermany
Number of controlled phases 2231
Frequency (Hz)50505050
Power (kW)1.51.52.24
Voltage (V)380–400380–400380–400400
Maximum current (A)3.63.95.59
Voltage ramp duration (s)0–201–201–251–5
Table 4. Overall classification efficiency of the proposed method for different mesh sizes, and for the different soft-starters studied.
T-F Map Grid SizeOverall Classification Efficiency (%)
Rows   ( m ) Columns   ( n ) ABBOmronSchneiderSiemens
3 3 83.672.874.679.2
4496.374.184.879.4
5596.483.686.987.3
6697.583.690.493.8
7799.185.291.194.1
8899.894.495.094.8
9998.191.492.094.8
Table 5. Comparison of different methodologies used in literature to detect broken bars in induction motors.
ReferenceMethodologyAccuracy RateStart-Up MethodSignal Analyzed
Martinez et al. [33]Homogeneity, kurtosis, ANN100%DOLCurrent
Zamudio et al. [12]STFT, FFNN95%DOLCurrent and Stray Flux
Pasqualotto et al. [34]CNN, STFT, data augmentation techniques66.7%DOLStray Flux
Pasqualotto et al. [15] CNN, STFT, data augmentation techniques 94.4%Soft-StartersStray Flux
Zamudio et al. [9]STFT, FFNN97%DOLStray Flux
Lopez et al. [35]Multi-STFT, Otsu Segmentation, Normal-distribution100%DOLCurrent
Valtierra et al. [14]STFT, CNN100%DOLCurrent
Camarena et al. [36]Wavelet Transform, Correlation Pearson99%DOLCurrent
Ince et al. [13]CNN, back-propagation (BP) algorithm97.87%DOLCurrent
Rivera et al. [10]Tooth-FFT, Pearson correlation97.5%DOLCurrent
Proposed ApproachSTFT, FFNN, arithmetic mean and maximum value94.4%Soft-starterCurrent and Stray Flux
Publisher’s Note: MDPI stays neutral with regard to jurisdictional claims in published maps and institutional affiliations.

