Article

Design Optimization of a Cross-Flow Air Turbine for an Oscillating Water Column Wave Energy Converter

1
Department of Mechanical Engineering, Graduate School, Korea Maritime and Ocean University, Busan 49122, Korea
2
Research and Development Center, Foresys Co., Ltd., Seoul 04048, Korea
3
Division of Mechanical Engineering, College of Engineering, Korea Maritime and Ocean University, Busan 49122, Korea
*
Author to whom correspondence should be addressed.
Energies 2022, 15(7), 2444; https://doi.org/10.3390/en15072444
Submission received: 9 February 2022 / Revised: 4 March 2022 / Accepted: 23 March 2022 / Published: 26 March 2022
(This article belongs to the Topic Wave and Tidal Energy)

Abstract

:
A cross-flow air turbine, which is a self-rectifying, air-driven turbine, was designed and proposed for the power take-off (PTO) system of an oscillating water column (OWC) wave energy converter (WEC). To predict the complicated non-linear behavior of the air turbine in the OWC, numerical and experimental investigations were accomplished. The geometries of the nozzle and the rotor of the turbine were optimized under steady-flow conditions, and the performance analysis of the model in bi-directional flows was conducted by commercial computational fluid dynamics (CFD) code ANSYS CFX. Experimentation on the full-scale turbine was then undertaken in a cylindrical-type wave simulator that generated reciprocating air flows, to validate the numerical model. The optimized model had a peak cycle-averaged efficiency of 0.611, which is 1.7% larger than that of the reference model, and a significantly improved band width with an increase in flow coefficients. Under reciprocating-flow conditions, the optimized model had a more improved operating range with high efficiency compared to the performance derived from the steady-flow analysis, but the peak cycle-averaged efficiency was decreased by 4.3%. The numerical model was well matched to the experimental results with an averaged difference of 3.5%. The proposed optimal design having structural simplicity with high performance can be a good option to efficiently generate electricity.

1. Introduction

Wave energy is one of the most prospectively sustainable solutions, having notable advantages in availability and energy density over other energy sources such as solar and wind energy. Whilst power generation devices based on solar and wind energy can only be operated 20–30% of the time, wave energy converters (WECs) can be utilized up to 90% of the time [1]. In addition, it is reported that the wave energy flux is 15–20 times greater than that of solar and wind energy [2].
Numerous concepts of WECs have been suggested, and they can be classified into three main types by energy capturing mechanisms: (a) oscillating water columns (OWCs), oscillating body systems, and overtopping systems [3]. Among these, the oscillating water column (OWC), which reciprocates the flow of sea waves, is possibly the most extensively investigated type of wave energy converter (WEC) due to the simplicity of its structure and energy conversion system [4]. The OWC device has a semi-submerged air chamber open to the ocean, which keeps the air pocket above the free surface. Due to wave-driven water column fluctuation, the trapped air is compressed and decompressed, forcing a reciprocating airflow. This wave-to-pneumatic energy is then transformed into electricity by employing a power take-off (PTO) system with a generator.
Self-rectifying air turbines are most commonly used as the power take-off systems. It is worth mentioning that unidirectional-flow turbines can possibly be used with the aid of a rectifying system with non-return valves attached to the WECs. However, the practical use of such systems is limited to small-sized WECs only due to constraints in flow rate and response time [5,6].
Two widely known self-rectifying air turbines are the Wells and the impulse turbine. Although these two types have long been common choices for OWCs, there are several characteristics of these turbines should be improved. The Wells turbine faces difficulty in reaching its operational speed with a poor starting characteristic; hence, it must be driven by an electrical motor [7]. Added to that, the efficiency of the Wells turbine drops abruptly as the flow rates increase due to the stalling phenomenon of the rotor blades, constraining the operating flow range to be narrow [5,8,9,10]. The impulse turbine has a wider operating range, but the peak maximum efficiency is found to be lower than that of the Wells because of significant aerodynamic losses due to the large incident flow angle at the guide vane on the downstream side. The impulse turbines for WECs are normally equipped with two guide vanes on both sides of the rotor to achieve unidirectional rotation in the reciprocating air flows [5,11,12]. In addition, the complex geometry of the guide vanes and blades of the impulse turbines induce high manufacturing and maintenance costs, which increase the levelized cost of energy (LCOE) dramatically.
A cross-flow turbine is typically used to handle water flows in a hydropower system [13]. The cross-flow turbine is able to handle large quantities of flows and also acquire flat efficiency characteristics [4]. In addition, the flow passing twice over the blades of the turbine induces a higher momentum transfer. The primary studies on the cross-flow turbine to improve its performance were conducted mainly by varying the design parameters of the rotor [14,15,16,17,18,19,20]. Although the geometrical parameters of the runner are well known, the effect of combining the parameters for maximum performance has not been illustrated yet. The majority of these studies reported a peak efficiency of less than 82%. Fukutomi et al. [21] studied the effect of nozzle entry arc, throat width, and upper wall shape to maximize the turbine performance by numerical and experimental tests. Recently, a new methodology of nozzle design was suggested by Adhikari and Wood [22]; 87–88% highest efficiency was acquired using numerical simulations.
Some researchers used the cross-flow turbine for wave energy applications. The use of direct-drive turbines (DDT) for the fixed-type WECs was proposed [4,23,24,25]. The DDT converts the wave energy directly to mechanical energy without a pneumatic energy conversion process. They varied wave conditions and nozzle shapes to maximize the turbine performance, and peak efficiencies of 44.73–55% were reported. Akabane et al. [26] suggested the self-rectifying cross-flow air turbine for a WEC. An air turbine having 30 blades, 200 mm diameter and 100 mm width, was investigated under steady-airflow conditions, but there were no extra attachments such as guide vanes or nozzles to boost the incoming airflow; 29% peak efficiency was reported.
The main characteristic of a cross-flow air turbine is structural simplicity, which provides lower manufacturing and maintenance costs than for typical air turbines having complicated blade shapes. Moreover, it has relatively high performance with low noise in a wider operating range [13]. With these features, the cross-flow air turbine can be a good alternative to convert wave energy efficiently. In recent studies, numerical and experimental approaches to evaluate OWC air turbines in periodic flows have been reported, it provides valuable contributions to the understanding of the dynamic performance of the turbines [27,28,29,30,31]. However, there are few research studies to investigate the cross-flow air turbine for OWC WEC, and thus, it is meaningful to study the unsteady performance of the cross-flow air turbine in reciprocating flows. In this study, three-dimensional (3D) numerical and experimental investigations on the transient behaviors of the cross-flow air turbine were accomplished. Numerical work was carried out using commercial CFD code ANSYS-CFX 18.2. The optimized design of the cross-flow air turbine was first determined by varying the rotor and nozzle shapes in steady flows, and the model was tested under sinusoidal-flow conditions. The experiment was then performed in a cylindrical-type wave simulator that generated reciprocating airflows, to validate the numerical result.

2. CFD Setup

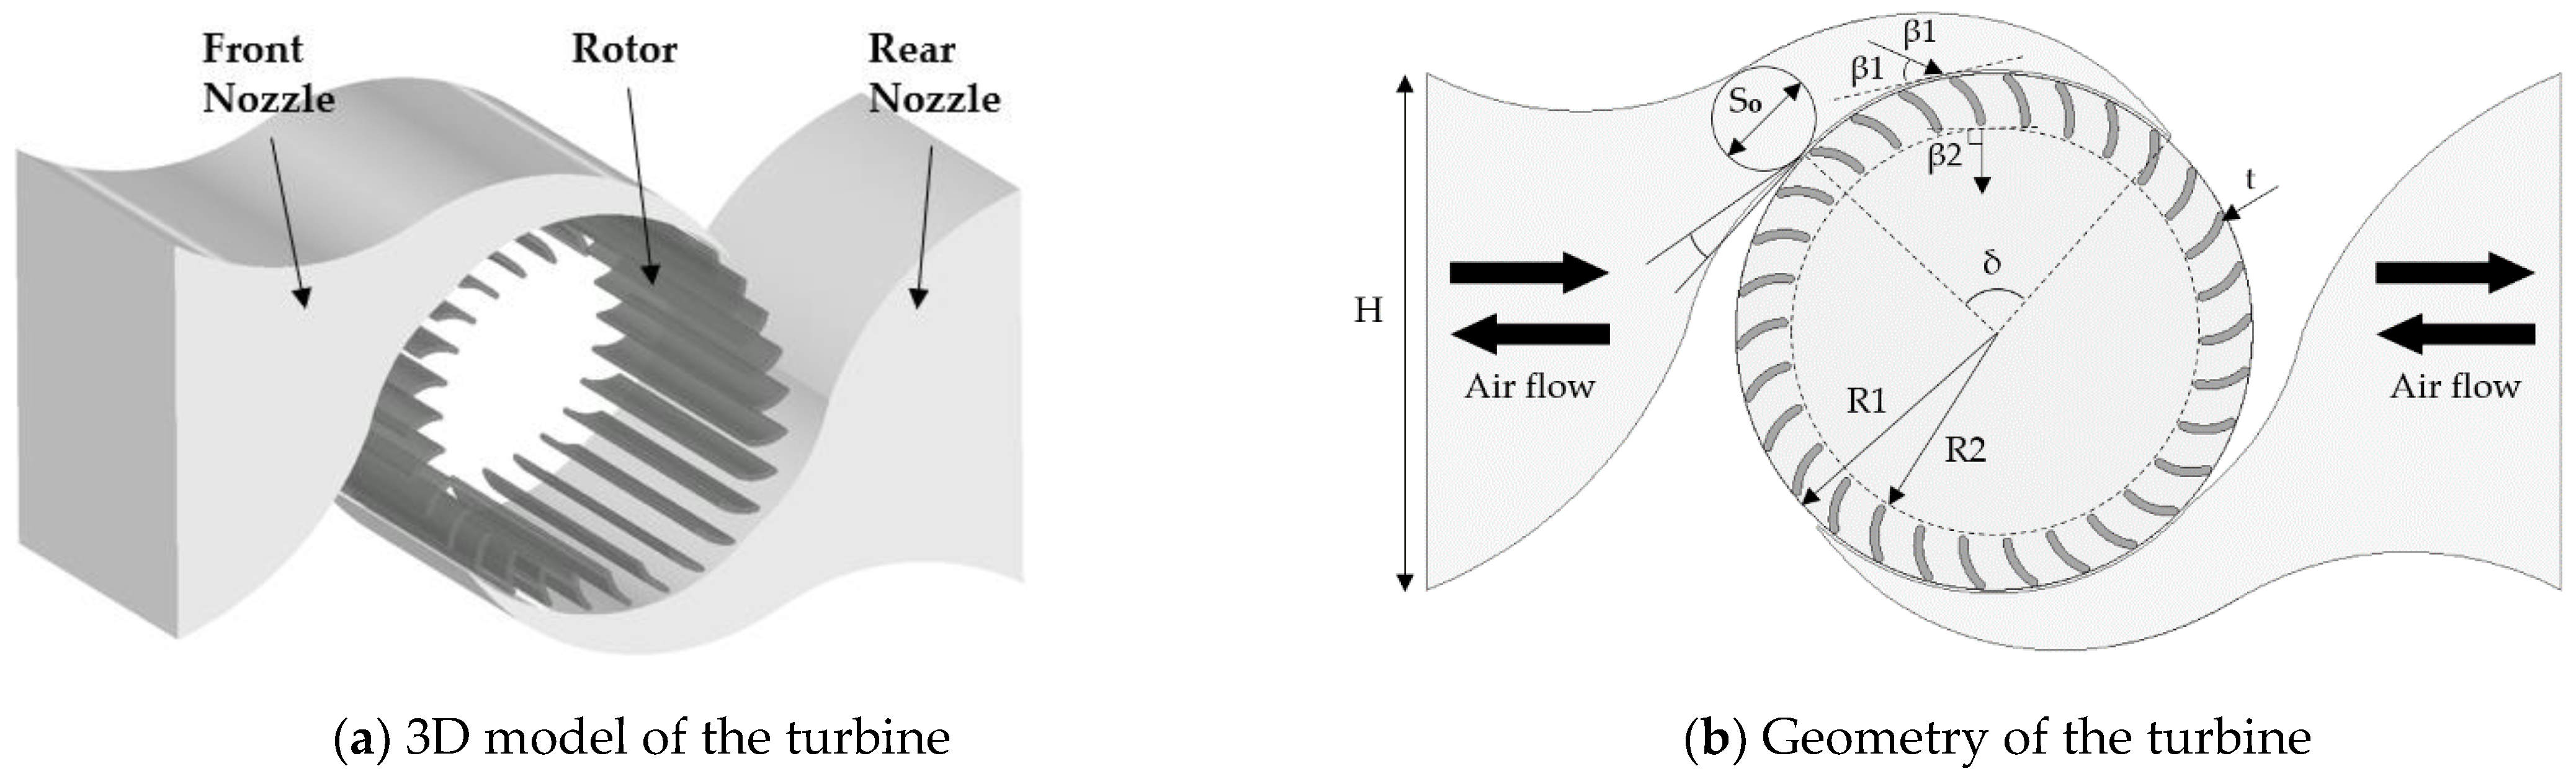
2.1. Numerical Model
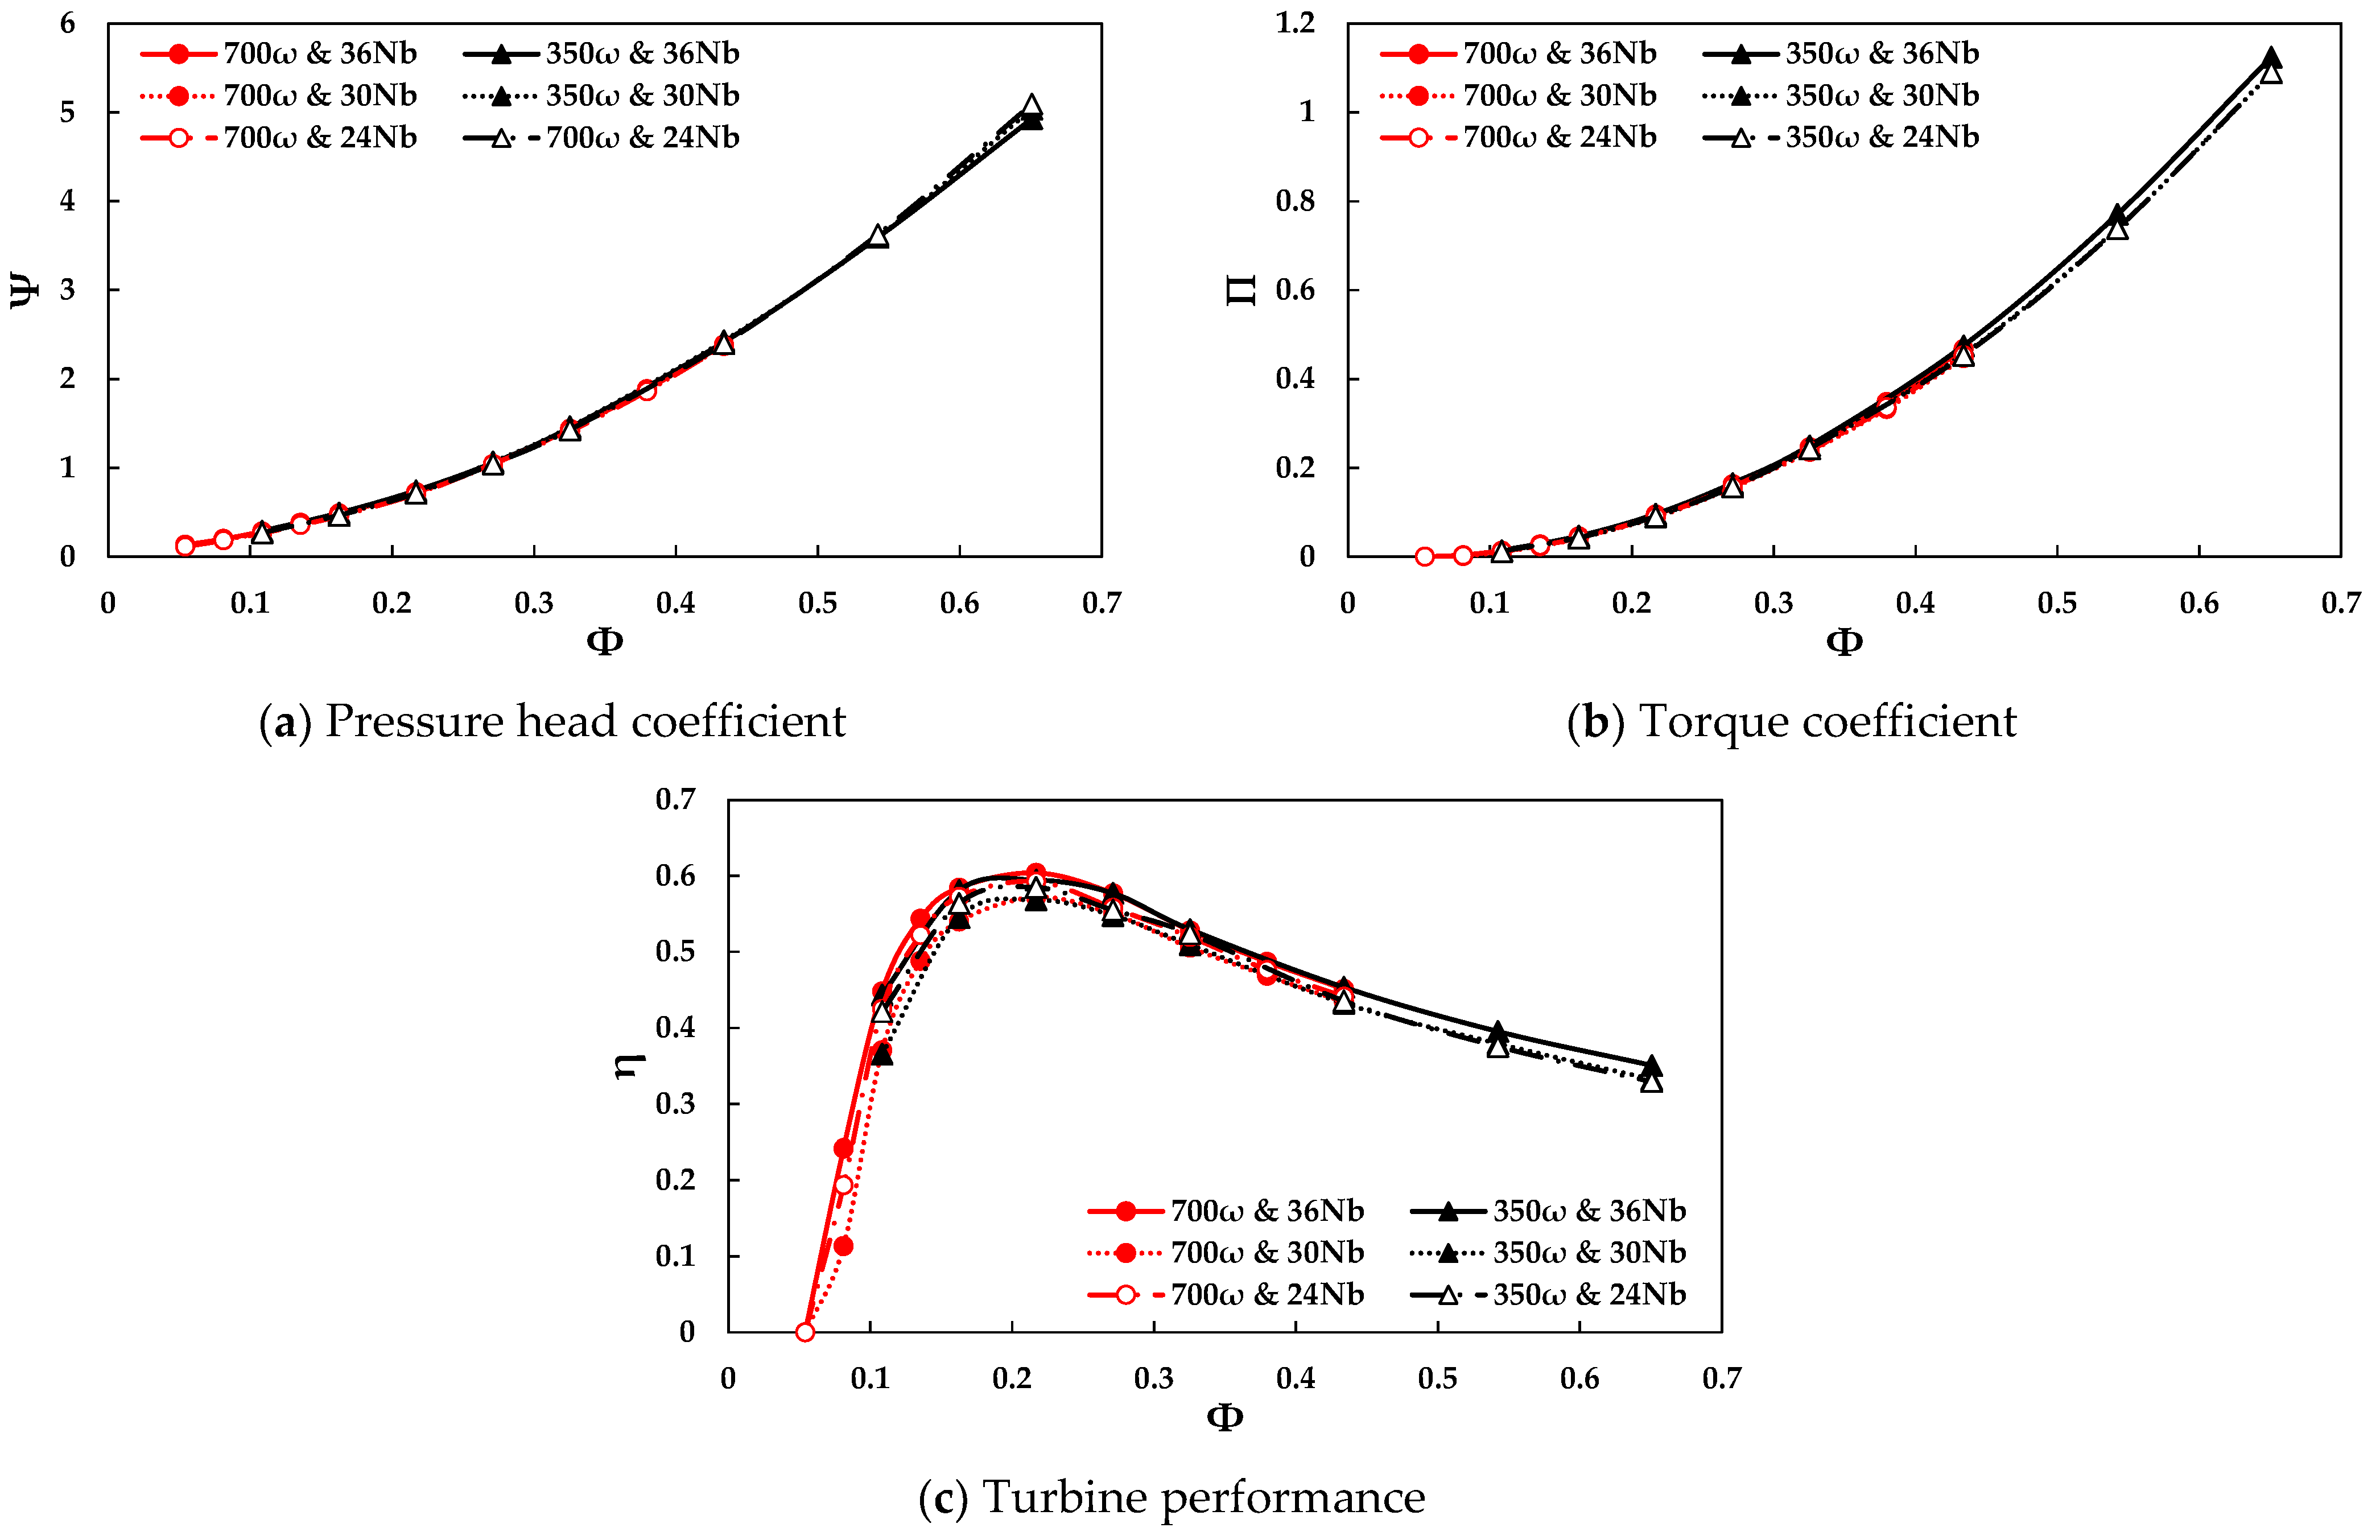
The cross-flow air turbine was designed, taking into account the reference model by Kang et al. [13]. The turbine mainly consisted of two parts: a rotor and symmetrically distributed fixed front and rear nozzle on both sides of the rotor, as shown in Figure 1. The reciprocating airflow enters the nozzle, and the concentrated flow rotates the rotor. The diameter of the turbine was 0.3 m, and the ratio of outer and inner diameter was 0.8. Nozzle entry angle, δ, was 90°, and the blade angle of attack and inlet and exit angles were α = 18°, β1 = 30°, and β2 = 90°, respectively, as shown in Table 1. To optimize turbine design, there are four design parameters: the number of blades, the thickness of blades, rotor rotational speed, and nozzle throat width. These parameters were varied under the constant-flow condition, and the performance of the turbine with optimal design parameters was investigated in bi-directional airflow.
A numerical model for the cross-flow air turbine was established based on the finite volume method in the computational fluid dynamic code ANSYS CFX 18.2 to describe the integral formulation of the RANS (Reynolds-averaged Navier–Stokes) equations. The two-equation shear stress transport (SST) k–ω turbulence model was adopted to obtain satisfactory results of the turbine performance. It is worth noting that previous studies have reported that the turbulence model provides superior results to k–ε and k–ω models [32,33,34,35].
The grid and the boundary condition of the turbine are illustrated in Figure 2. The grid model had approximately 6.6 million nodes with hexahedral elements. The obtained y+ of the model was kept as y+ < 1 for the rotor domain and y+ < 10 for the nozzle domain since the k–ω SST turbulence model requires y+ < 5 for accuracy [36]. The CFD model in this study assumed that the fluid was incompressible, due to its small scale. The numerical domain was classified into two sub-domains: stationary (nozzles) and rotating (rotor). The two sub-domains were connected by a frozen rotor interface model in GGI (general grid interface), which not only allows non-matching grid points to interact with each other via interpolation but also allows the updating of the interface position at each time step between the stationary and rotating domains.
The sinusoidal airflow velocity profile was employed for the transient simulation. The area-averaged velocity profile can be expressed as follows:
v i n = V i n sin   ω o t
where V i n is the area-averaged velocity amplitude of wave elevation inside the OWC chamber, and it can be converted from the piston velocity in the experiment. ω o is the circular frequency as ω = 2 π / T i n , where T i n is period of the incident wave or the piston.

2.2. Data Analysis

With a periodic bi-directional flow, non-steady performance of the turbine must be evaluated for each cycle as follows:
η = P T P A
where P T and P A are the cycle-averaged turbine power output and circulating pneumatic input power, respectively. These cycle-averaged power output and input values are derived from
P A = 1 n T i T ( i + n ) T Δ p ( t ) · Q ( t ) d t
P T = 1 n T i T ( i + n ) T T ( t ) · ω ( t ) d t
where T is the period of reciprocating airflow, which is equal to the oscillating period of the piston movement. Δ p ( t ) , Q ( t ) , T ( t ) , and ω ( t ) are instantaneous values of the pressure drop through the turbine, flow rate over the turbine, torque of the turbine, and turbine angular velocity, respectively.
The dynamic performance of the turbine was demonstrated as non-dimensional variables as follows:
Ψ = p ρ ω 2 D 2
Φ = Q ρ ω D 3
Π = T ρ ω 2 D 5
where Ψ is the dimensionless pressure head coefficient, Φ is the dimensionless flow coefficient, and Π is the dimensionless turbine torque coefficient. ρ is air density, ω is turbine rotational speed, and D is turbine rotor diameter. It is worth noting that the turbine performance is not affected by Reynolds number significantly since Reynolds number is assumed large enough herein.

3. Experimental Setup

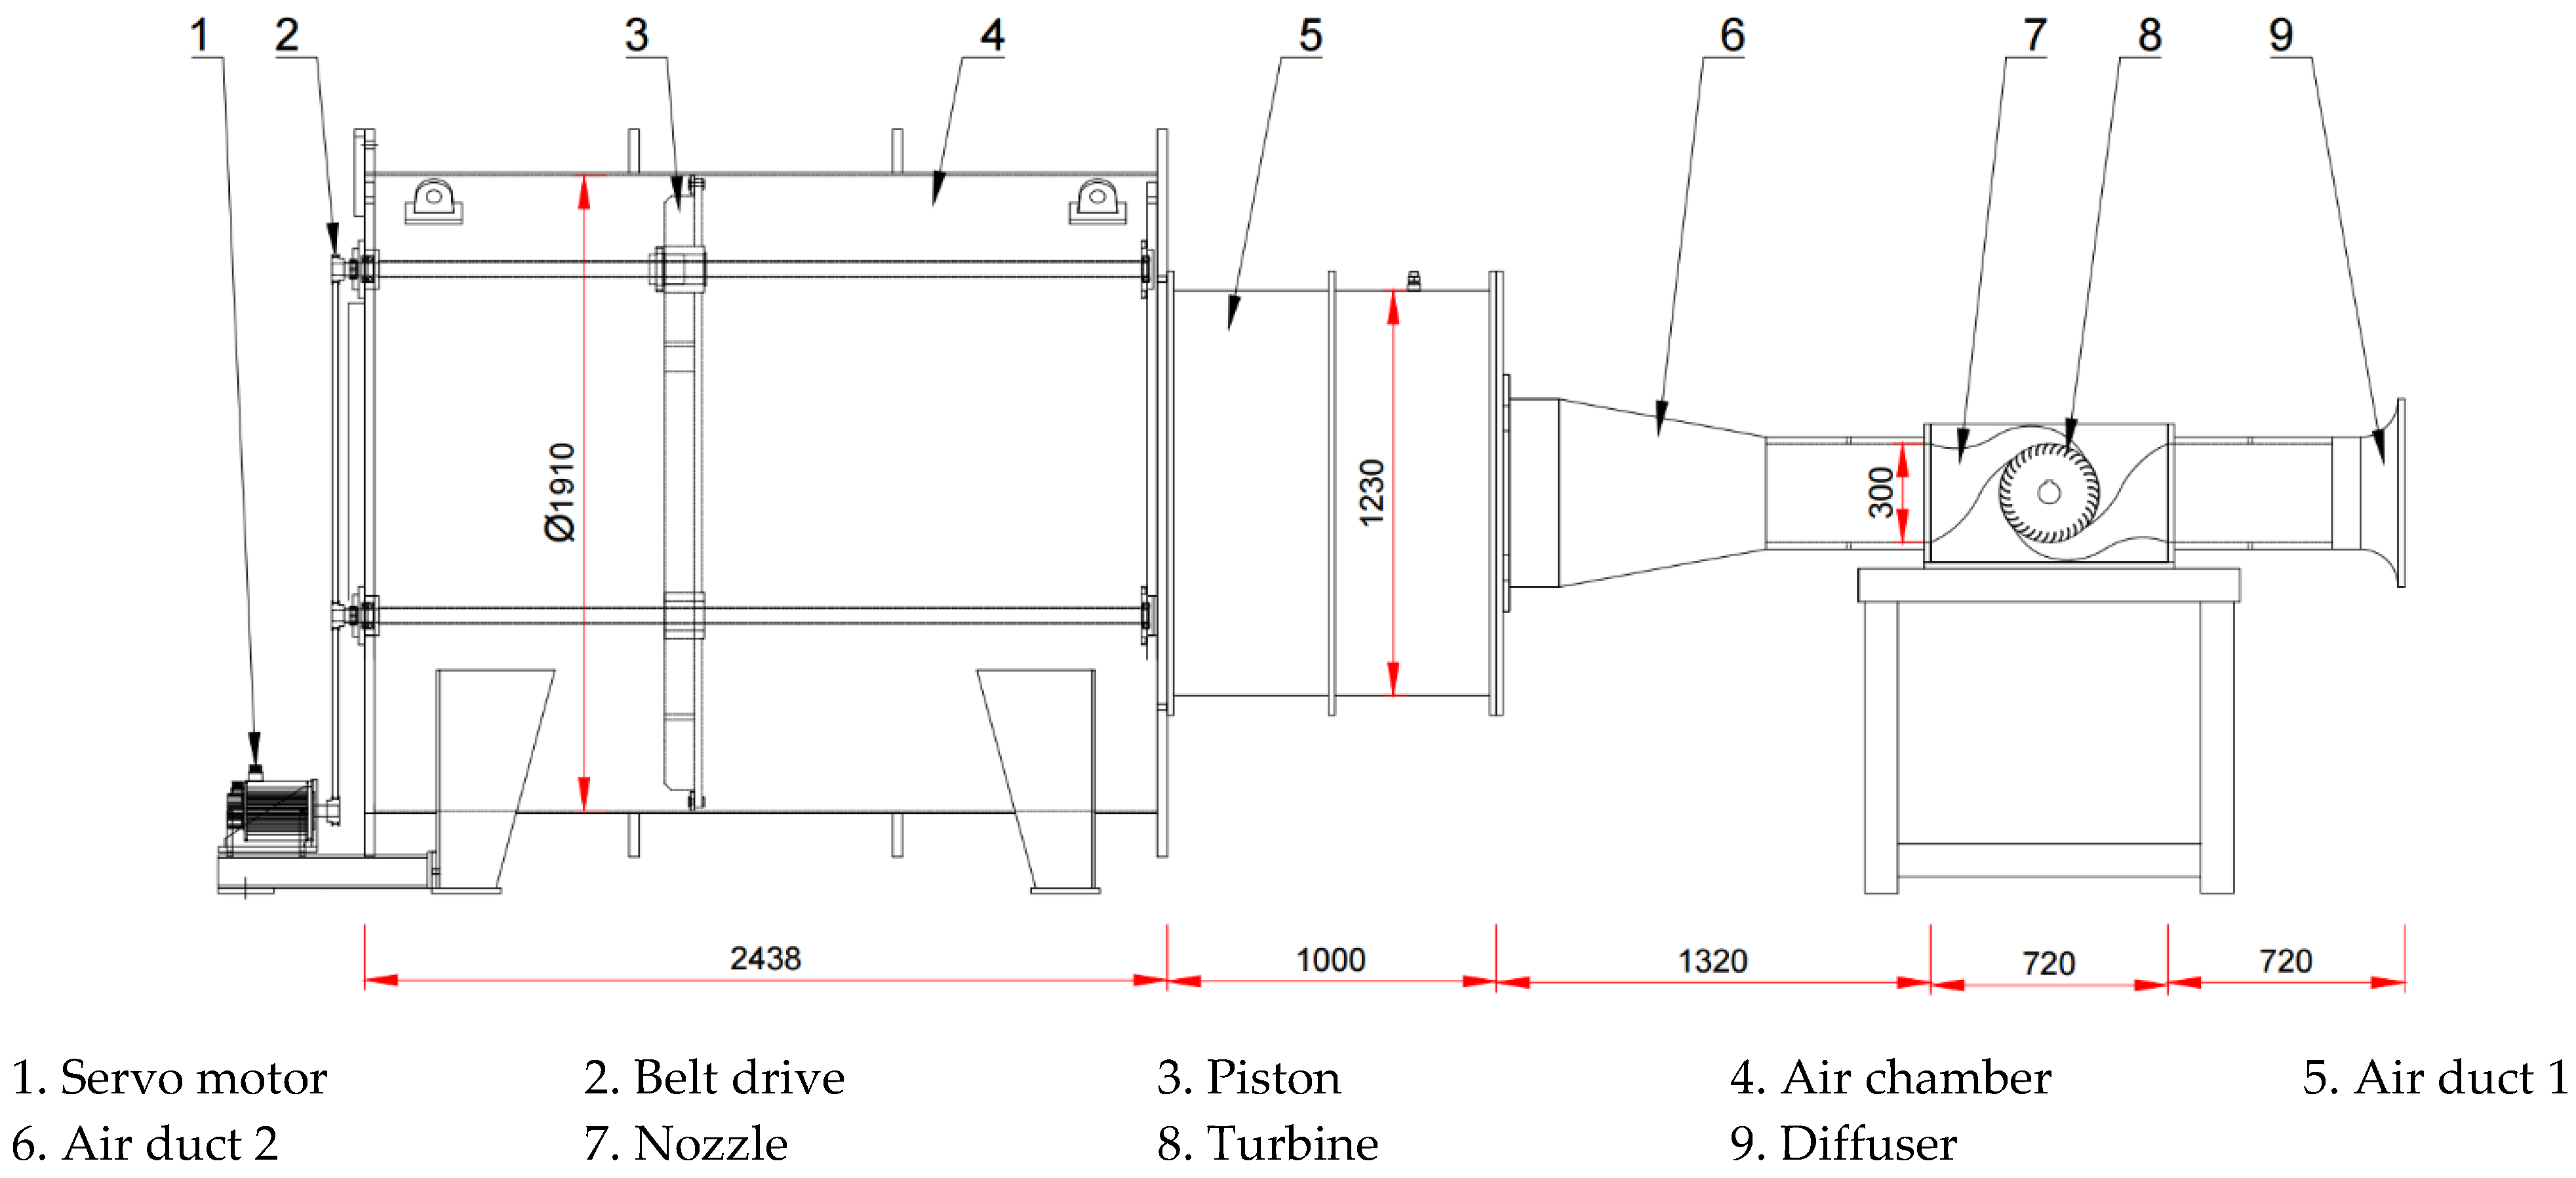
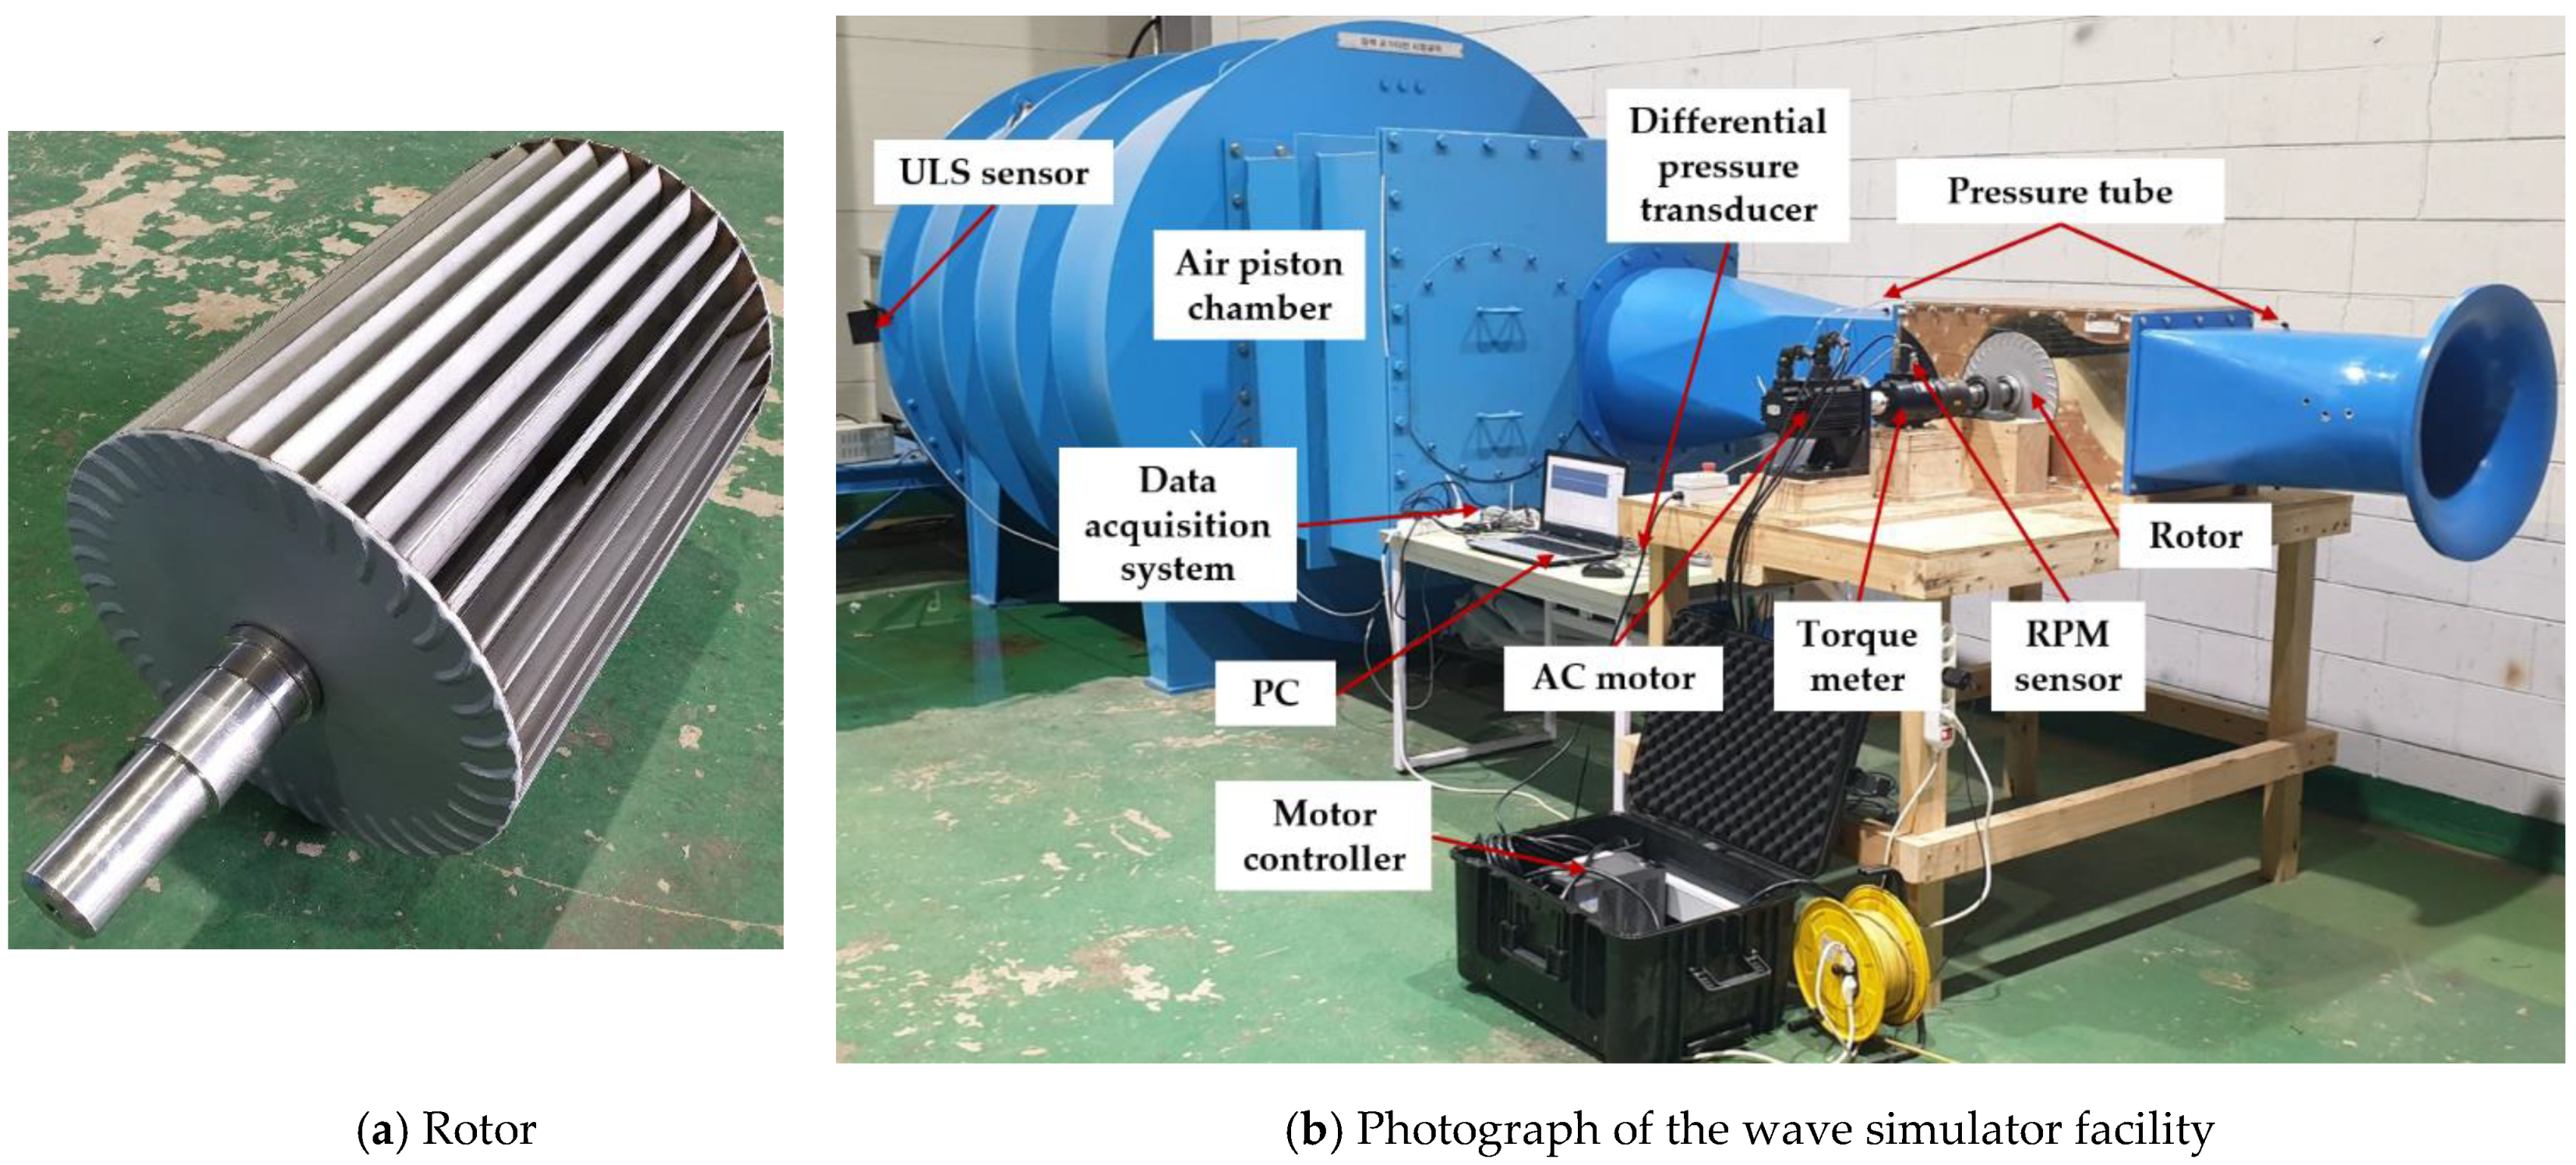
3.1. Experimental Apparatus

The cross-flow air turbine was investigated in the cylindric-type wave simulator facility at Korea Maritime and Ocean University (KMOU), Busan, South Korea. The detailed parameters of the turbine model are listed in Table 2, and the layout and configuration of the experimental facility are illustrated in Figure 3 and Figure 4. The wave simulator generates the sinusoidal airflow, which allows the turbine to be tested in reciprocating airflow profile. The cylindrical piston plate is driven by the servo motor through the belt drive transmission, and the stroke displacements and periods for this experiment were 0.2–1.0 m and 2.3–7.9 s, respectively. The air being pushed by the plate was delivered to the turbine through the air duct 1 and 2 and the nozzle. The AC servo motor maintained the constant rotational speed of the driving train by changing the input current. The torque transducer, located between the turbine and the AC motor, was responsible for the rotational speed and the torque measurement of the turbine.

3.2. Measurement Instruments and Experiment Procedures

The torque transducer (model: YDR-5K; full-scale capacity (FSC): 49.03 Nm; accuracy and repeatability: 0.09 of FSC) was employed, and the rotational speed of the turbine was measured by an internally inserted ONO SOKKI MP-981 magnetic-type detector (FSC: 1–20,000 rpm; accuracy: 0.01% of FSC; resolution: ±1 rpm). The AC servo motor (model: HG-KR23; rated active power: 200 W; maximum rotational speed: 6000 rpm) manufactured by Mitsubishi Electric corporation was used to keep the constant rotational speed of the turbine. A General Acoustics, Kiel, Germany, UltraLab® ULS sensor (model: USS 20130; FSC: 200–1300 mm; resolution: 0.18 mm) was employed to measure the piston displacement precisely, although the piston motion was governed by the servo motor within the preset period and stroke. With the measured piston displacement, the flow rate through the turbine was calculated. The pressure transducer (model: DWSD0020R1AA; FSC: 0–20 kPa; accuracy: 0.075% of FSC) was used to measure differential pressure between the inlet and outlet of the turbine. Digital signals from all sensors were transmitted to data logger (model: PT-1624 Powertron) and stored simultaneously.
The experimental procedure was as follows: (1) turning on and initializing all sensors to be warm and stable for 30 min; (2) initializing the wave simulator within the preset period and displacement; (3) adjusting the rotational speed of the turbine; (4) recording all data for 60 s after the rotation of the driving train is stable.

4. Results and Discussion

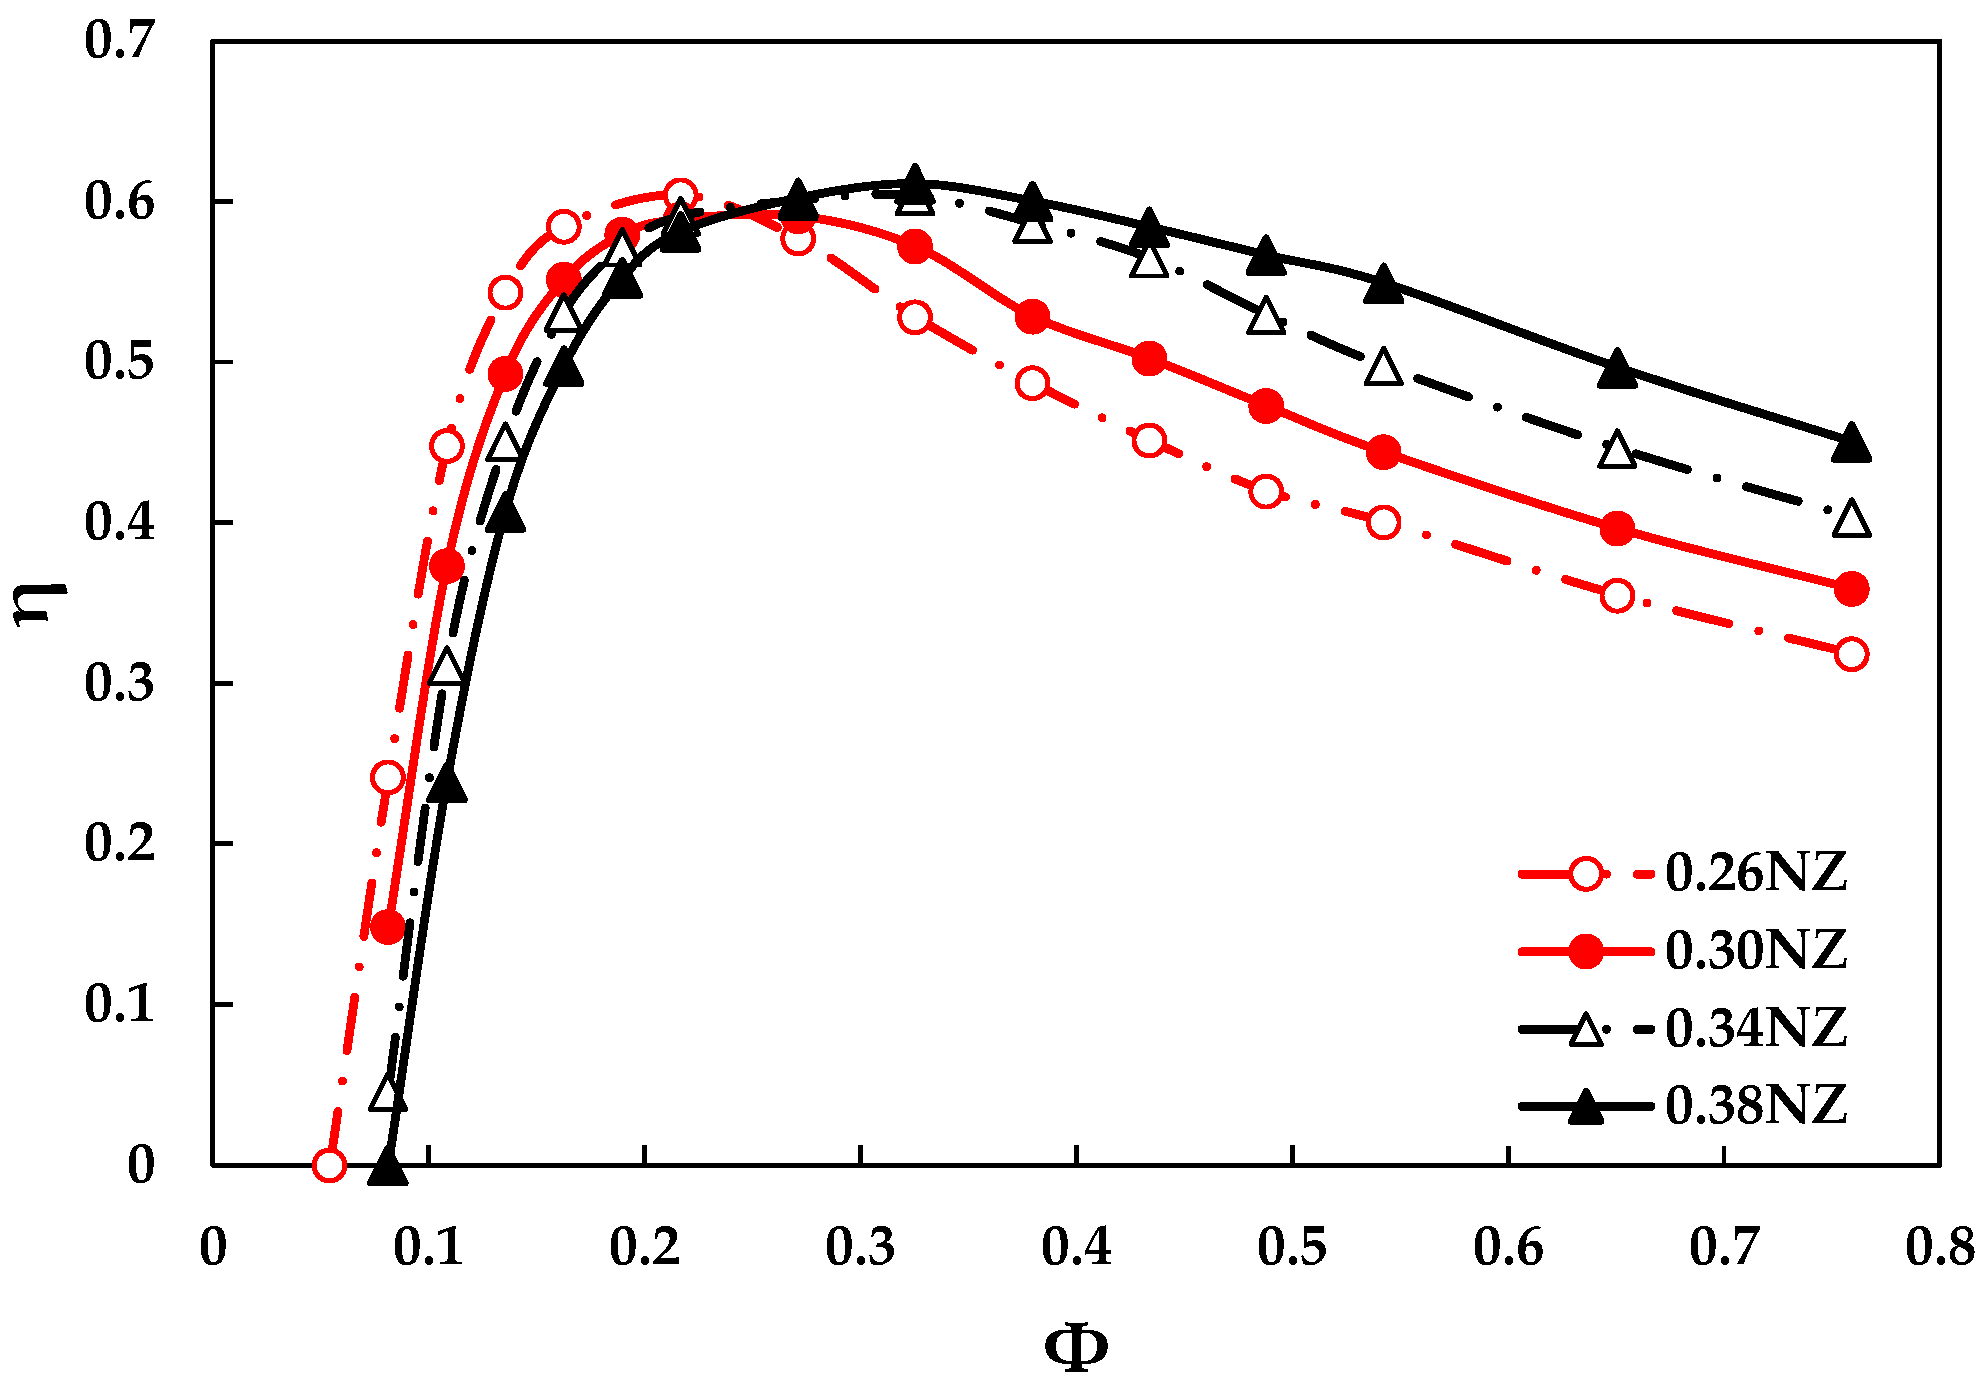
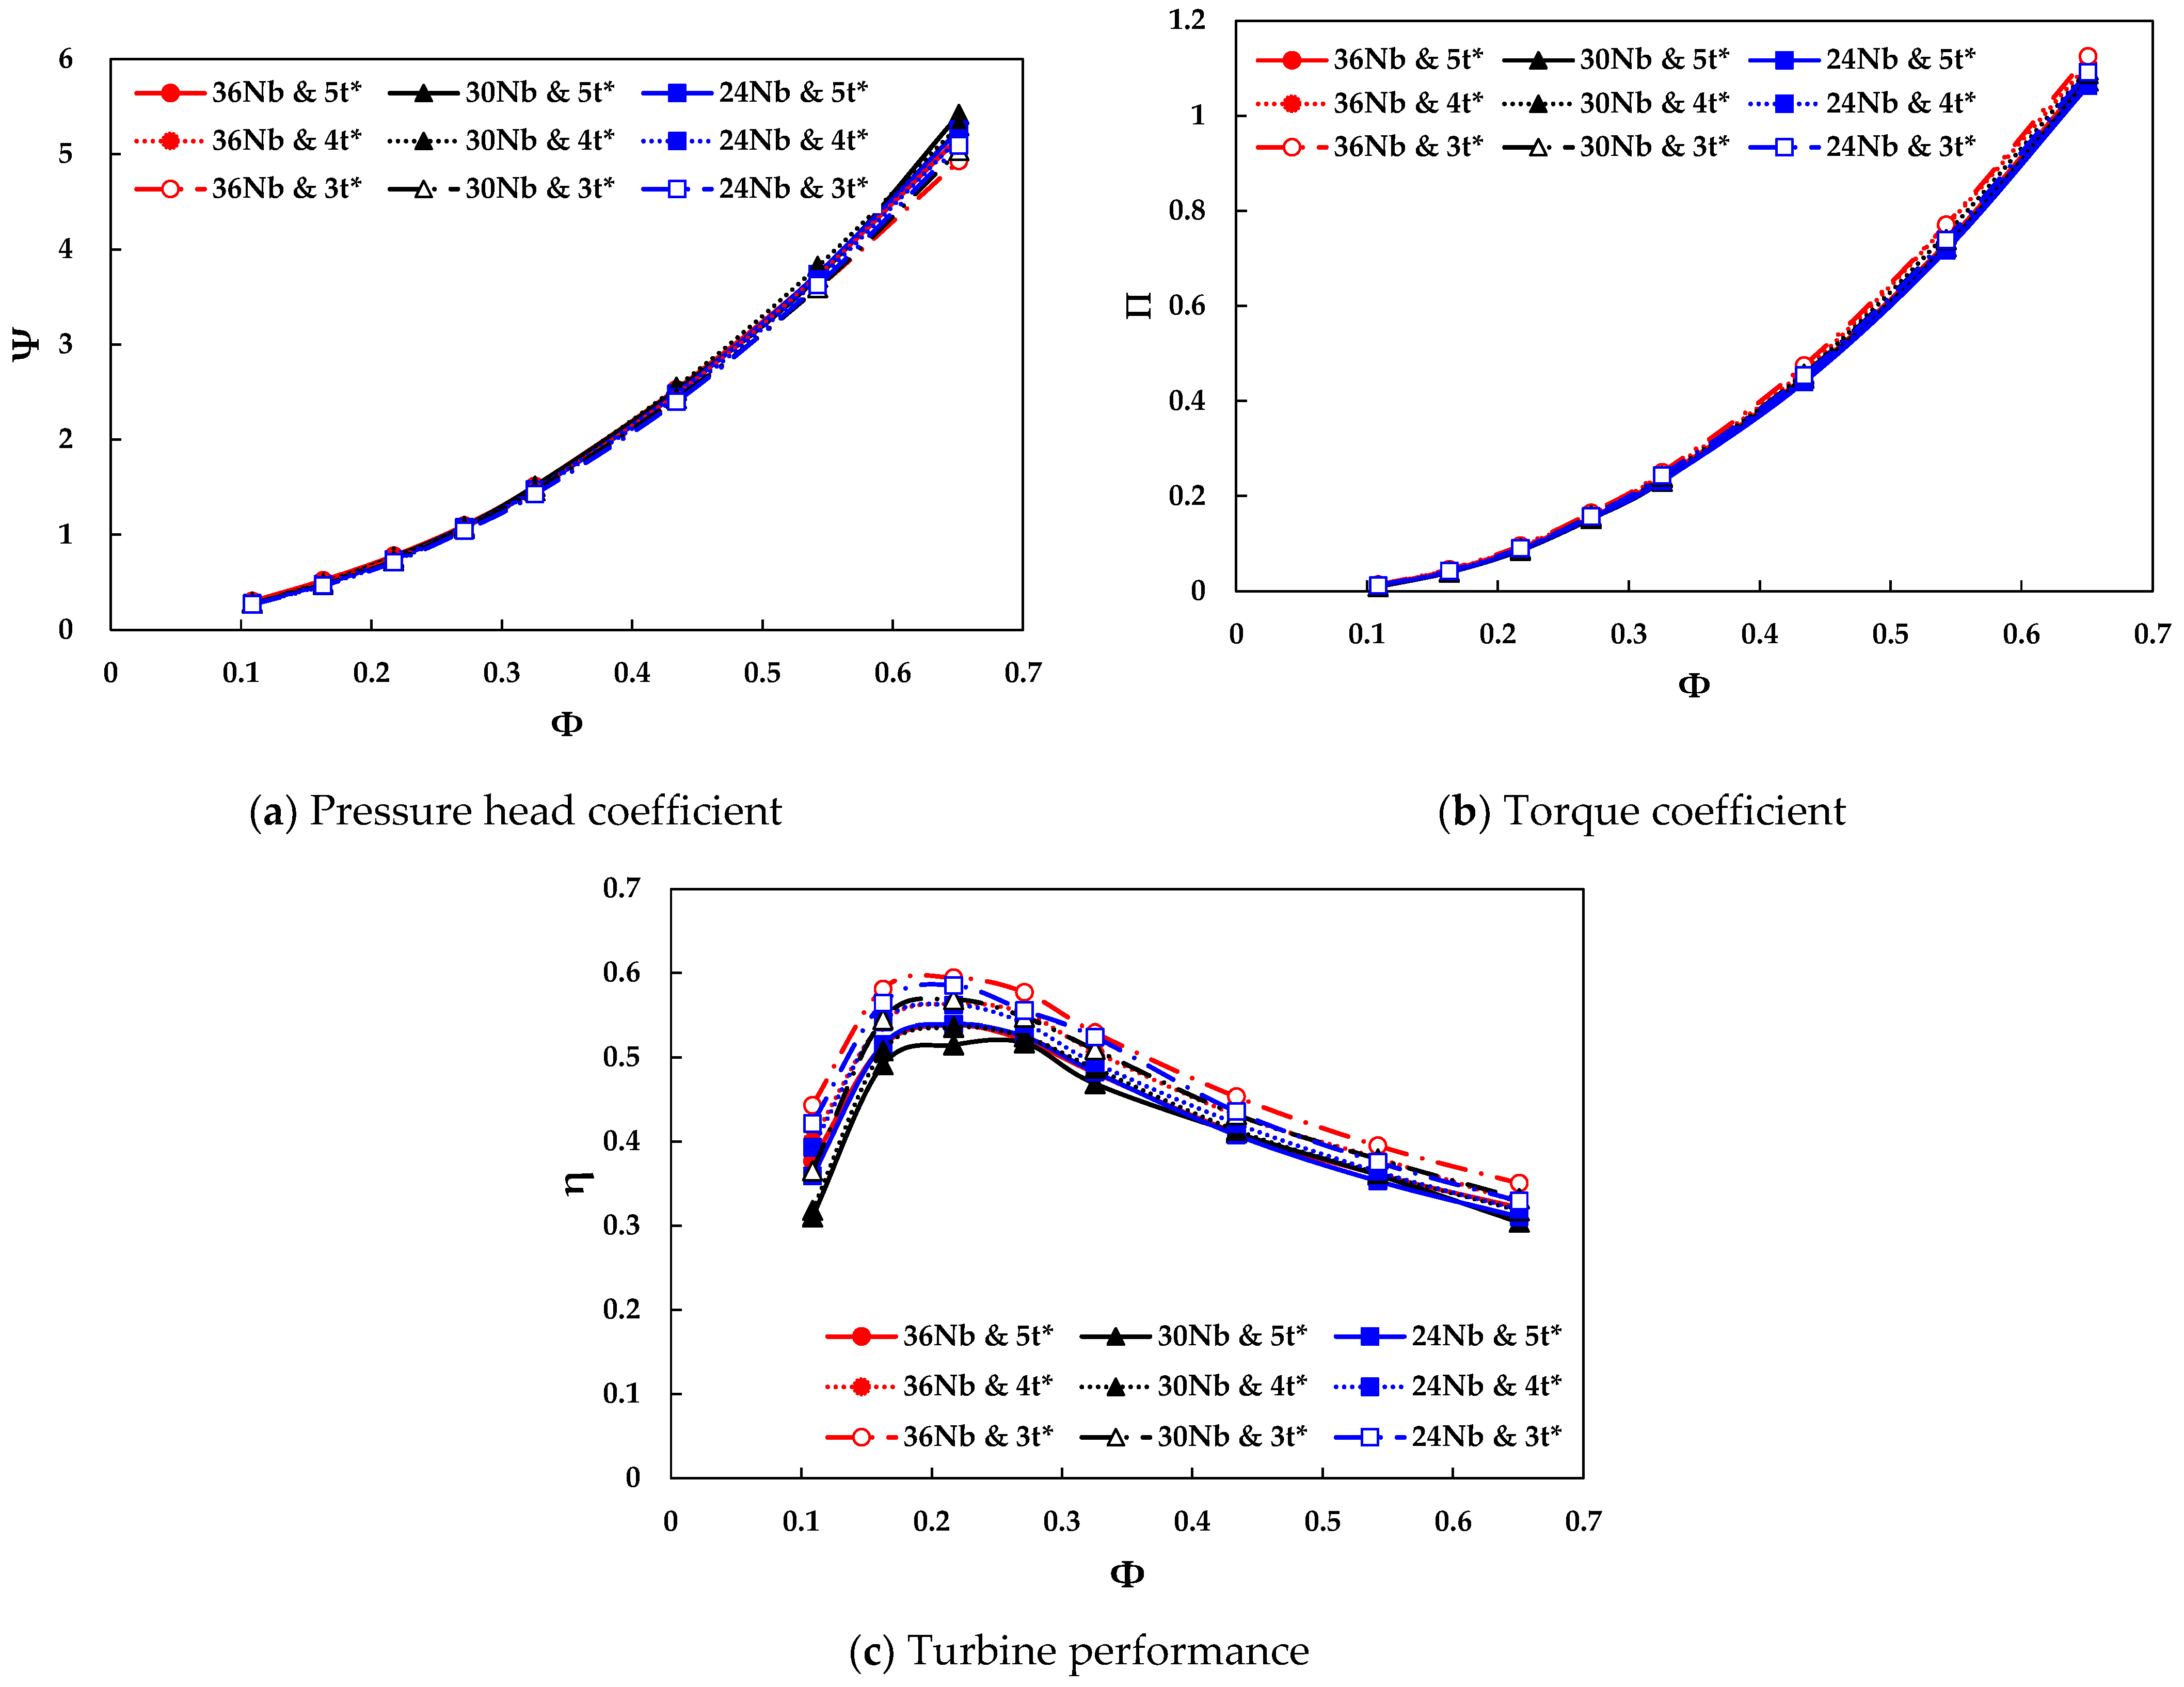
4.1. Geometric Optimization

Geometric optimization was conducted by the numerical simulations under constant-flow conditions to acquire higher turbine performance. The steady-flow analysis provided efficient simulation time in a wider range of operating conditions. The thickness of the rotor blades, t*, was optimized first from 3 to 5 mm at 350 rpm constant rotational speed with varying the number of blades as shown in Figure 5. The pressure difference across the turbine and torque of the turbine were represented as non-dimensional coefficients with respect to flow coefficient as shown in Figure 5a,b. As seen in Figure 5, both pressure and torque coefficients have a similar upward trend with an increase of the flow coefficient, and the gap was gradually increased in larger flow coefficients. Although there was less pneumatic power input for thinner thickness in larger flow rate, a higher power output of the turbine was acquired. Consequently, the highest performance was observed for 3 mm thickness and 36 blades in the entire operating range as shown in Figure 5c. For all blade numbers, thinner blades provided higher turbine performance. With this result, a 3 mm blade thickness was adopted for further optimization.
The effect of rotational speed and number of blades were analyzed with 3 mm thickness as illustrated in Figure 6. The variation of the rotational speed did not significantly influence the pneumatic power input and the turbine performance. However, their results show that the higher number of the blades, the greater the turbine performance. The peak performance was obtained at 700 rpm rotational speed with 36 blades, and these design variables were applied.
Four different nozzle throat configurations were simulated to analyze their effect on performance of the optimized rotor model (Nb = 36, t* = 3 mm, and ω = 700 rpm). As illustrated in Figure 7, the nozzle with the throat width of 0.38 reached the maximum performance of 0.611 after approximately 0.3 flow coefficient, and the curve was more flattened than the others with an increase in flow coefficient. The performance of nozzles having the narrow throat drastically decreased after their peak point. The flows in the turbine for NZ = 0.26 and 0.38 were represented with velocity vectors as illustrated in Figure 8. In the beginning, the incoming air flows from the left side passed stage 1 of the rotor as shown in Figure 8a. The air flowing out of stage 1 still possessed pneumatic energy, and the flows being decelerated were then accelerated again due to its converged passage, which is called cross-flow. The cross-flow significantly struck some blades in stage 2, and the flow velocity passing through the blades was higher than at stage 1. At Φ = 0.217, the turbine of NZ = 0.26 had higher efficiency since the higher velocities of the incoming flows at stage 1 and 2 were observed at NZ = 0.26. However, the cross-flow in the turbine of NZ = 0.26 at Φ = 0.488 had irregular velocity in region A as shown in Figure 8c, and then, it was dispersed as observed in region B. This flow behavior induced pneumatic energy loss, and thus the turbine efficiency was dramatically decreased for a wider flow coefficient. On the other hand, the cross-flow of NZ = 0.38 at Φ = 0.488 was more regular from stage 1 to stage 2 as shown in region A’, and there was less energy loss due to the spread of flows in region B’. The 0.38 throat width provided higher and wider turbine performance compared to that of other nozzle designs, and this nozzle design was selected for the final optimization model.

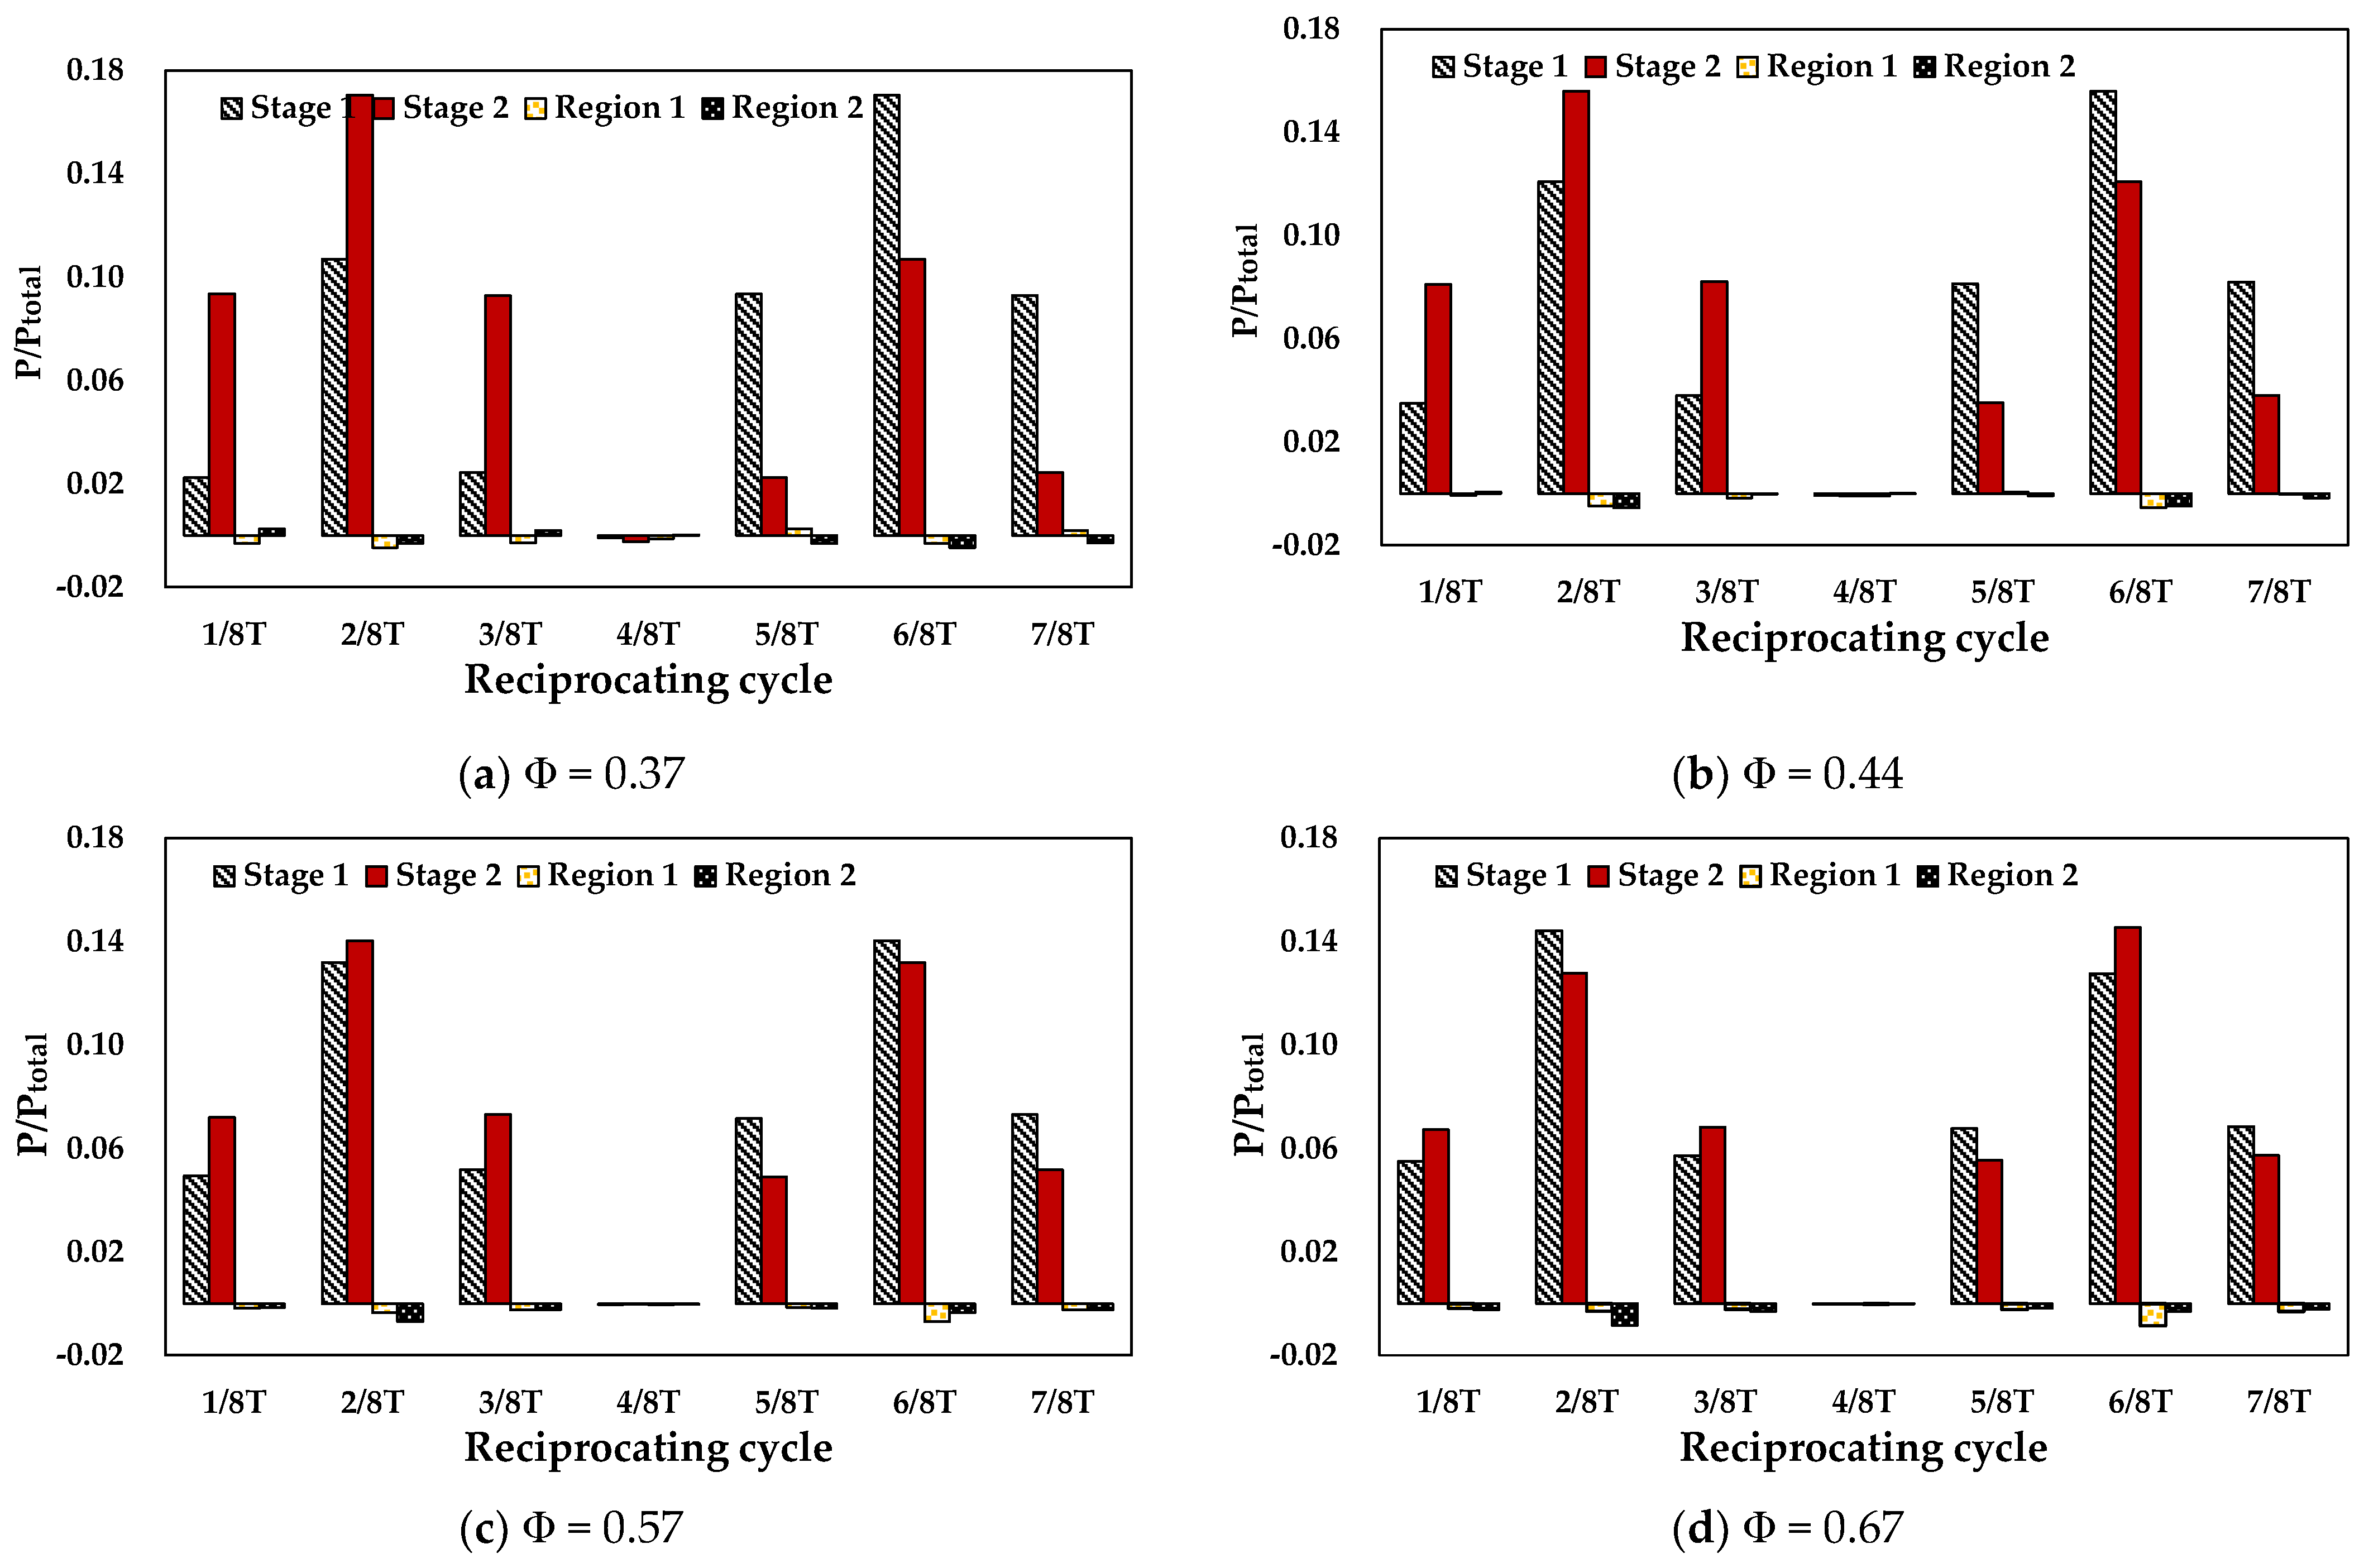
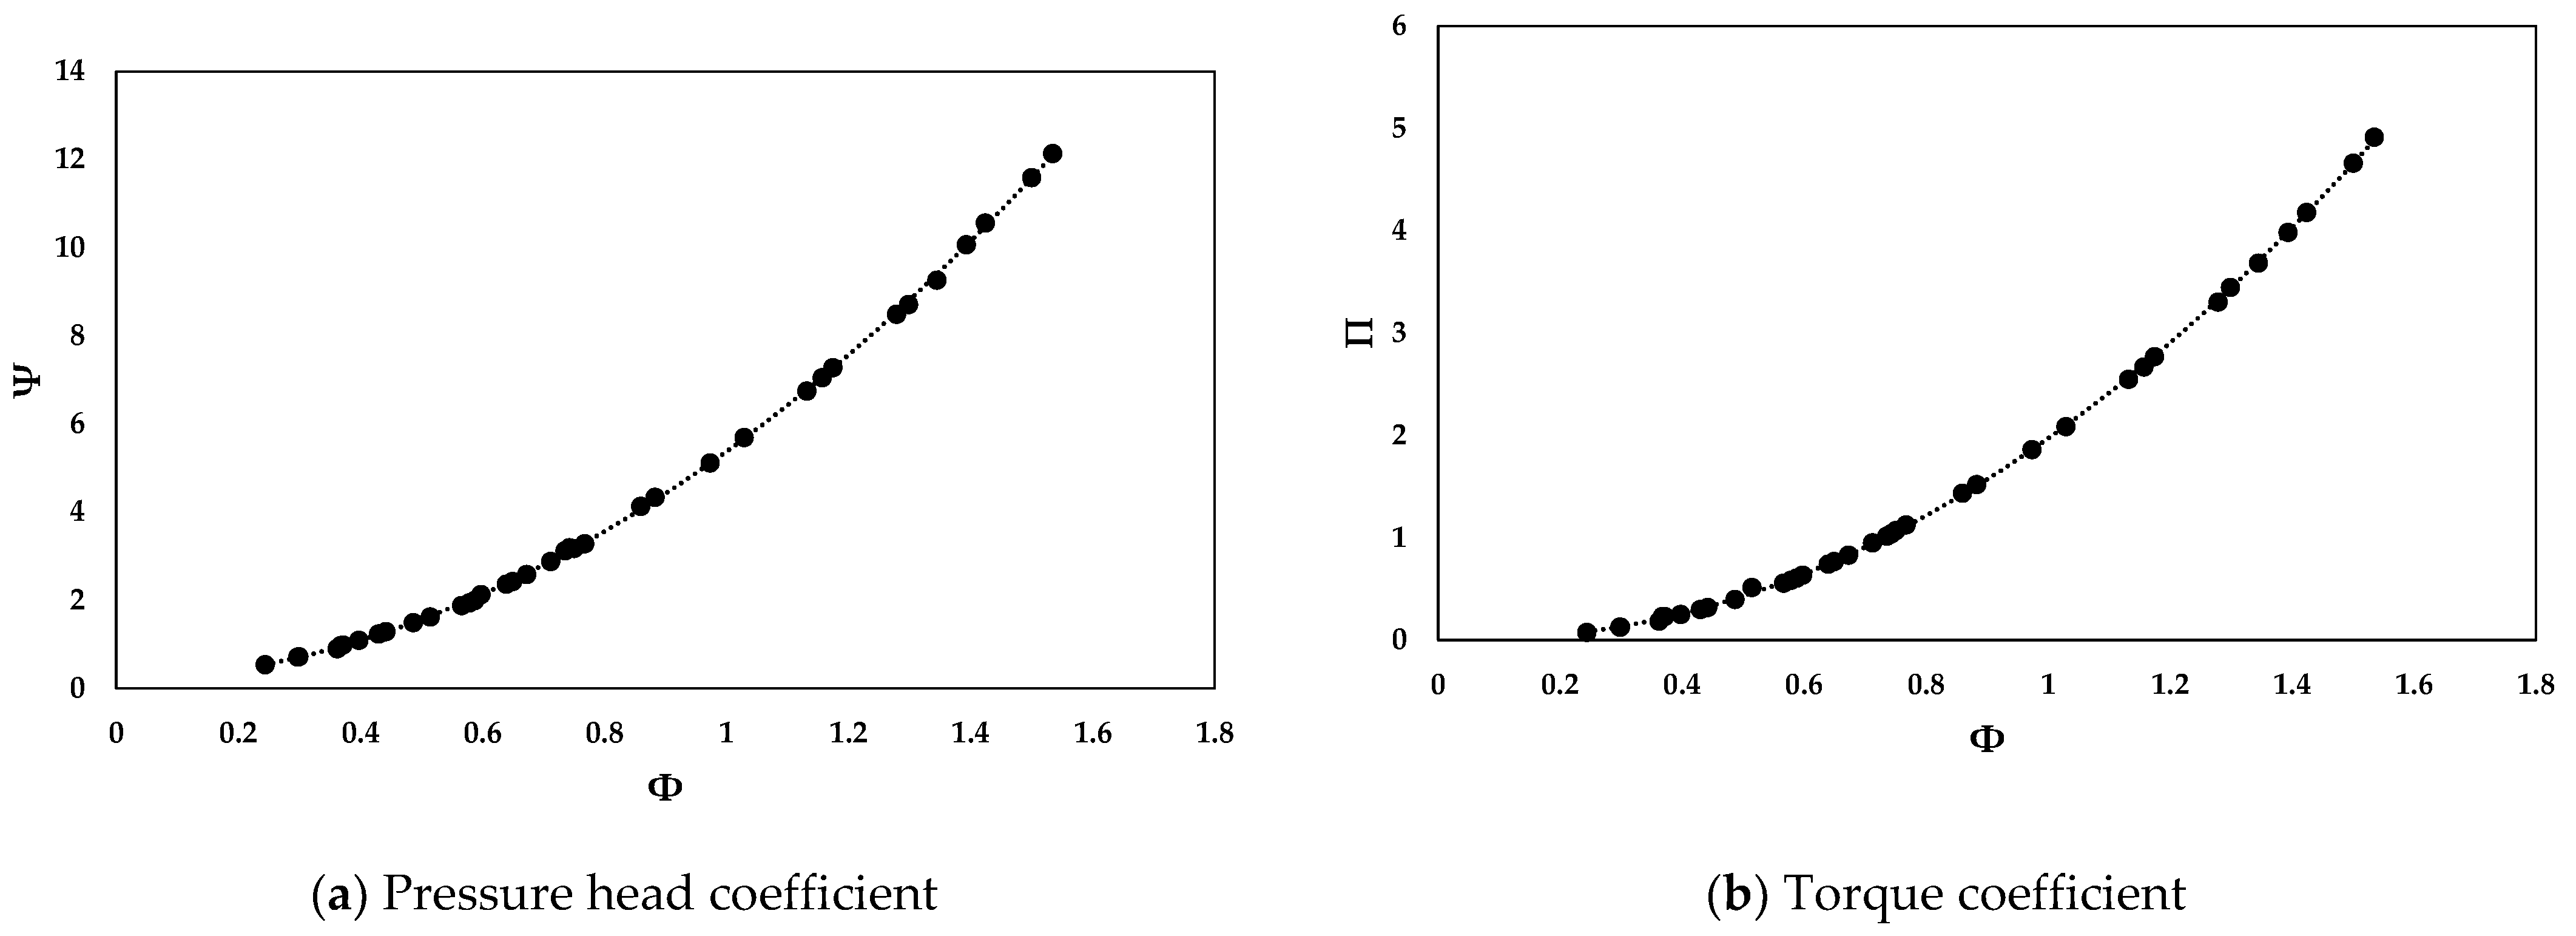
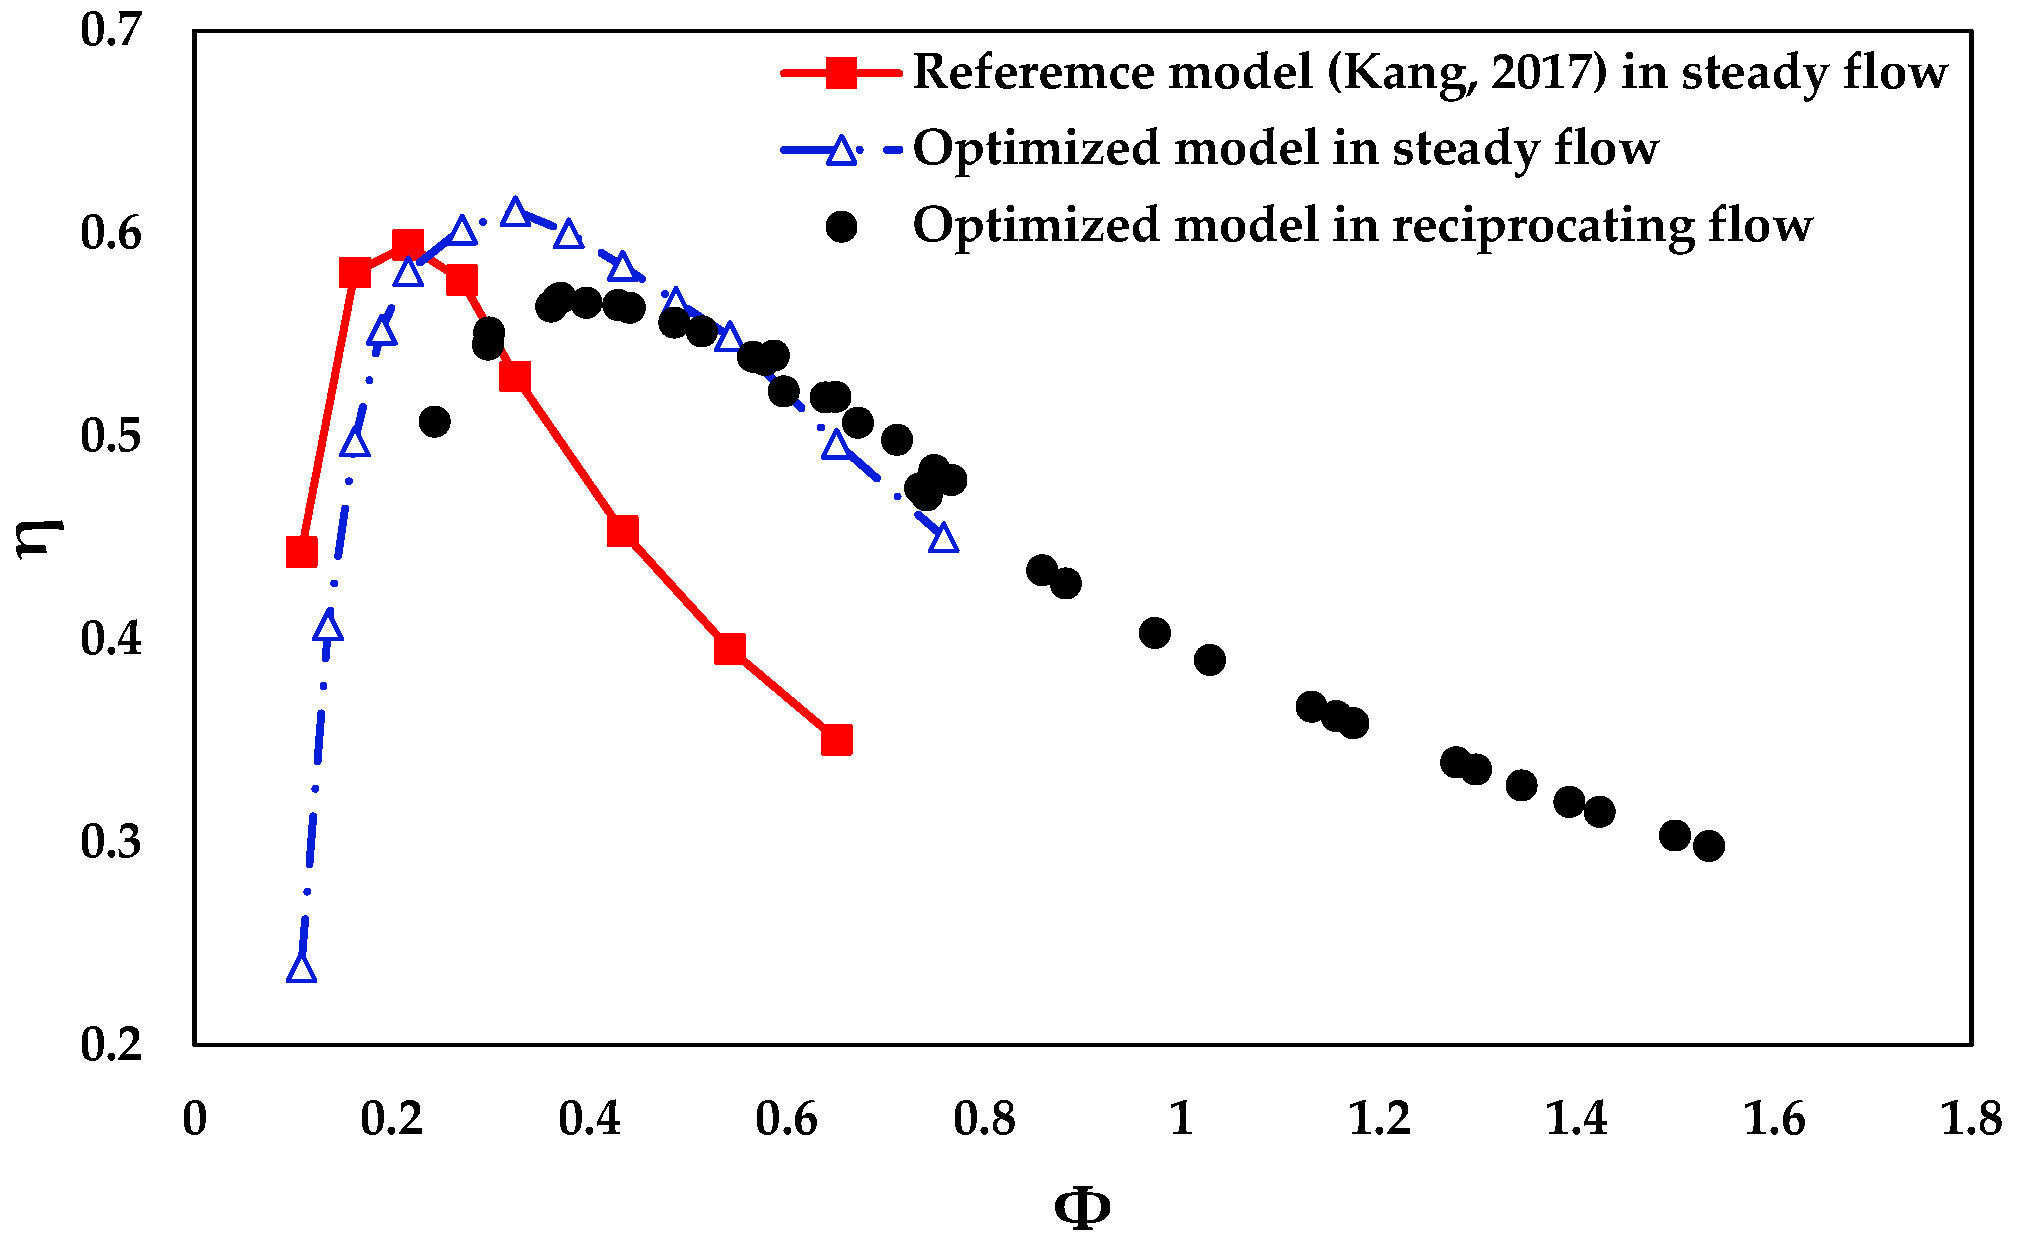
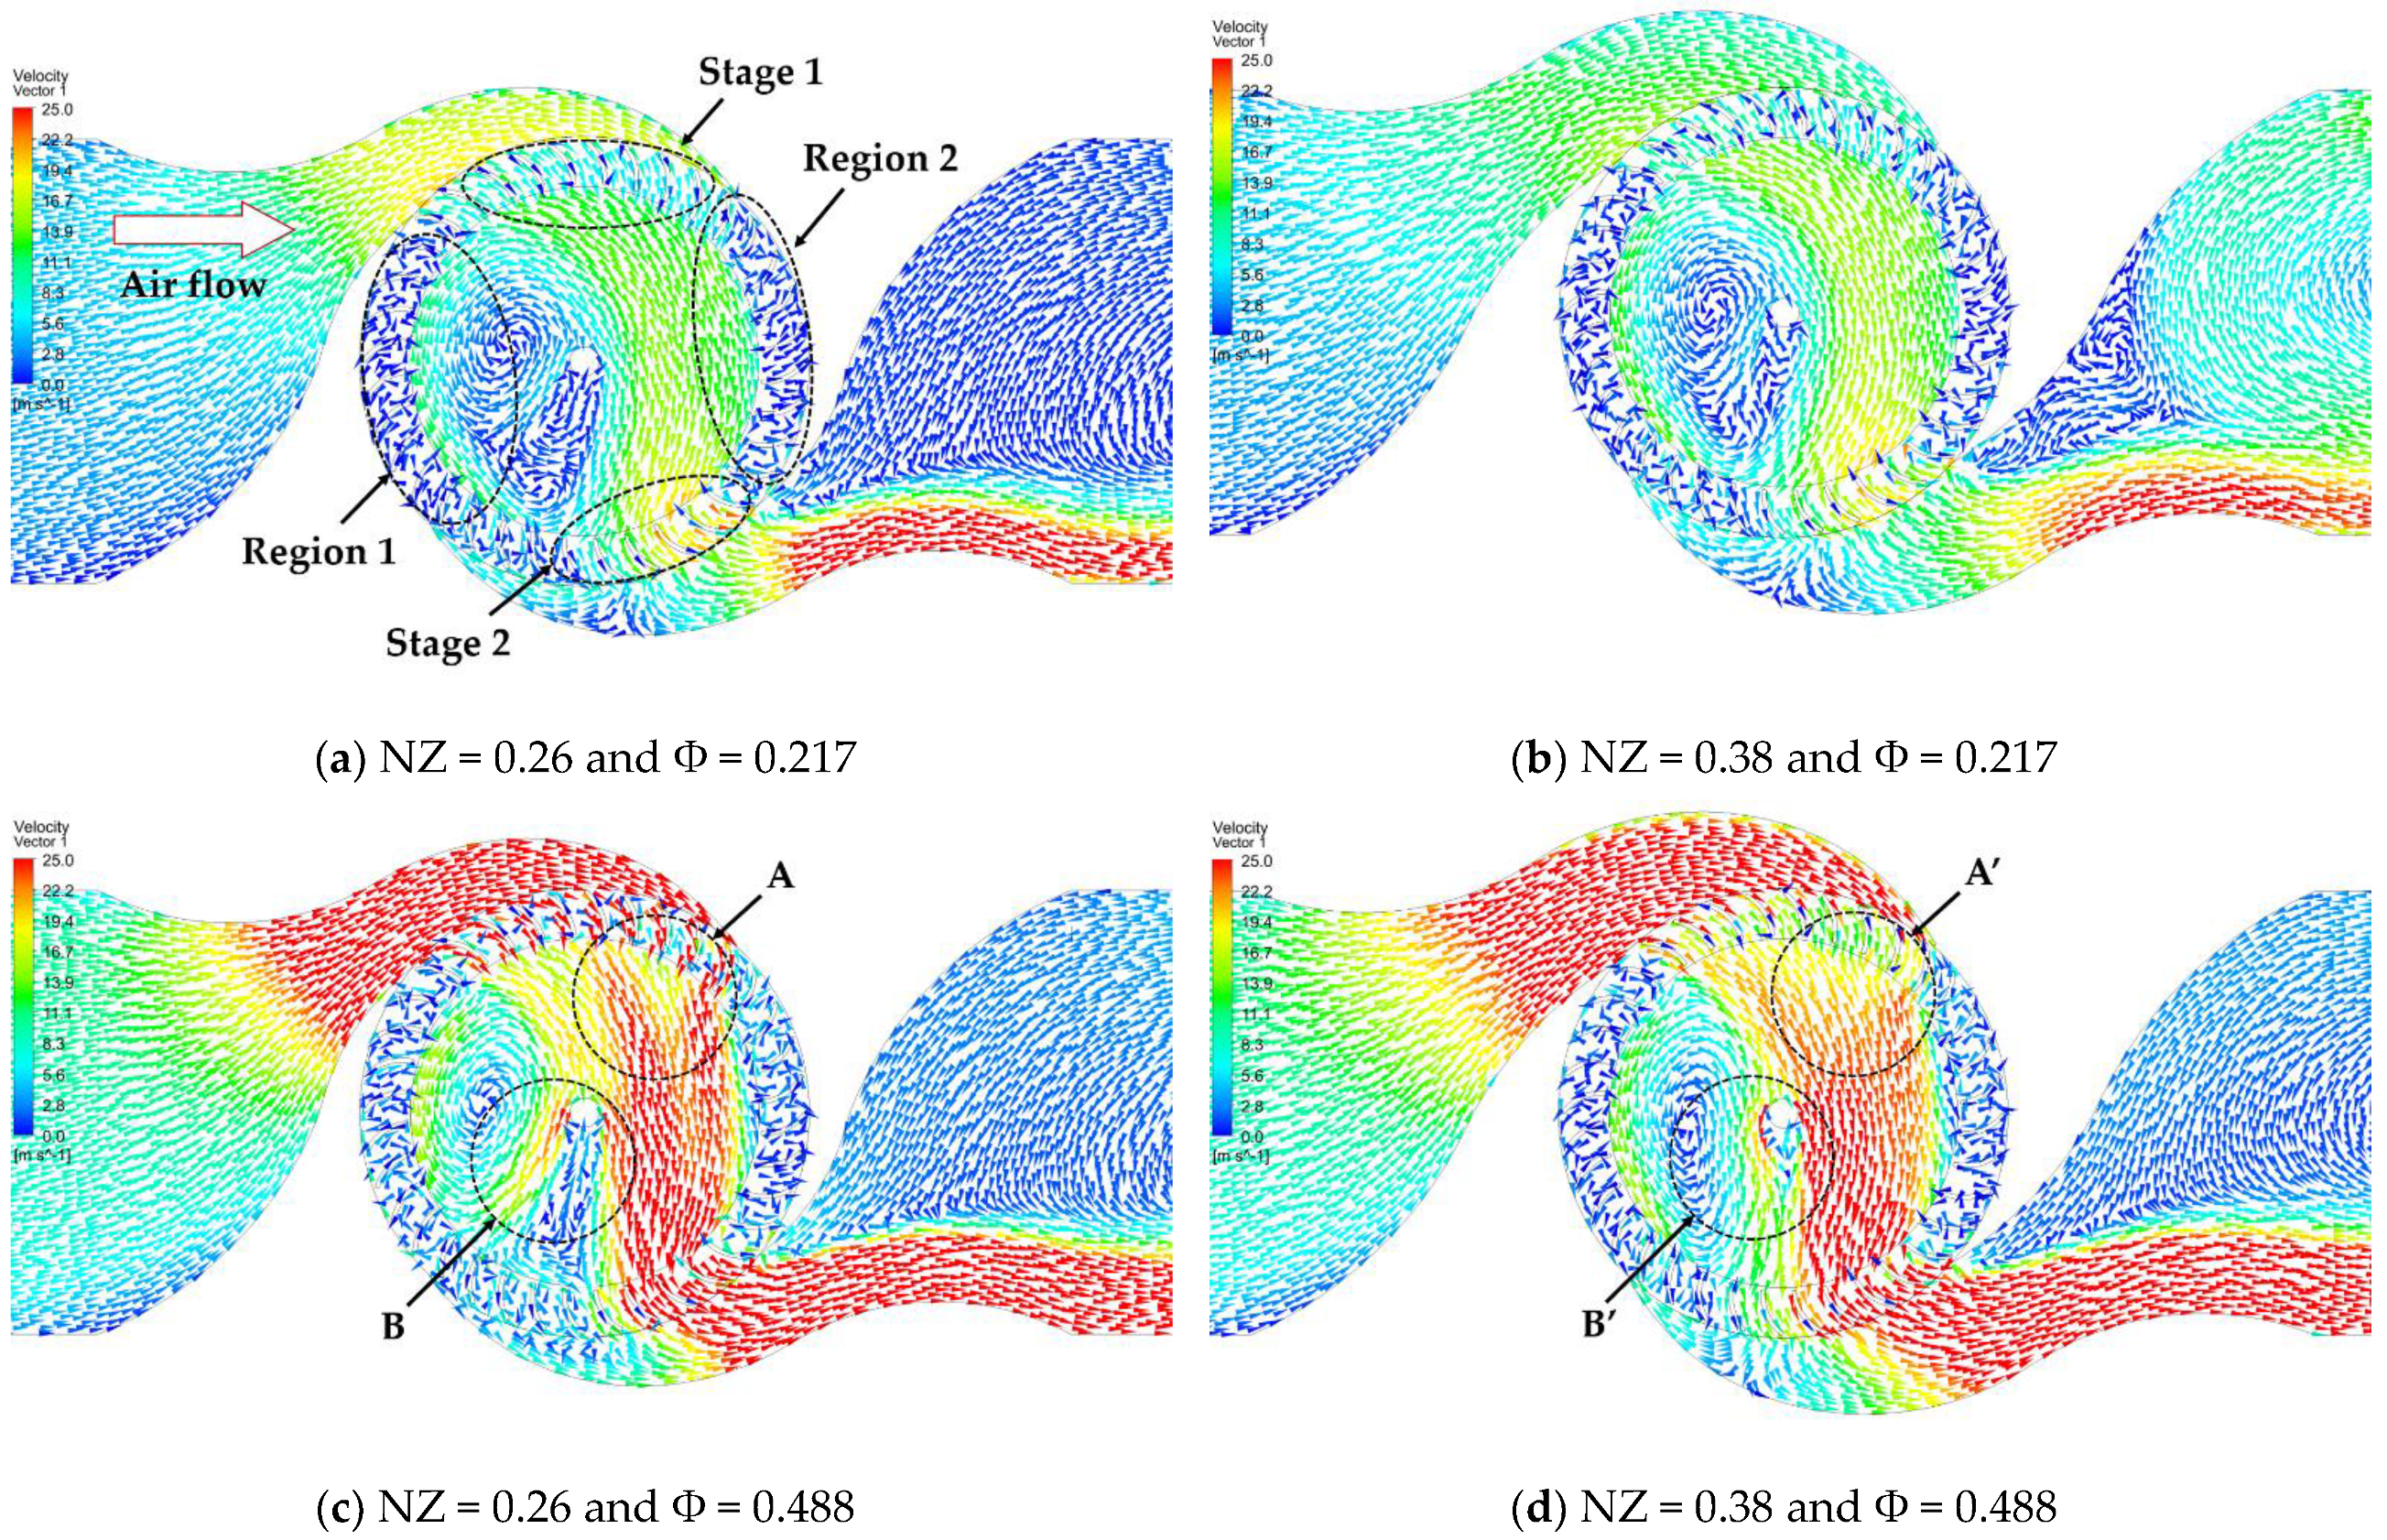
4.2. Overall Performance in Reciprocating Flows

The optimized turbine model derived from the steady-flow analysis was then investigated in reciprocating-flow conditions. The sinusoidal airflow velocity profile, v i n , for transient analysis was derived from the piston strokes of 0.2–1.0 m and periods of 2.3–7.9 s in experiment. Various cycles of torque, pressure, and flow rate in reciprocating flows were averaged in one cycle to compare the turbine performance under two airflow conditions (steady and transient) in dimensionless forms. The peak amplitude of the cycle-averaged torque, pressure, and flow rate were expressed in dimensionless coefficients.
The turbine power generation on the rotor during one period (Φ = 0.67) is illustrated in Figure 9b. The large amount of power generation was captured in 2/8T and 7/8T periods that the fastest airflow comes from the nozzle. At the beginning of the period, the large energy conversion occurred first at the entire blades in stage 1, and the rest of energy transfer was observed partial at the blades in stage 2. The peak power was mainly acquired at the second stages. Most of energy loss during the period was obtained at regions 1 and 2 as presented in Figure 9b. The retreating flow from main cross-flow entered anti-directional to the rotating blades of regions 1 and 2, which caused minor negative power.
For different flow rates with the same piston displacement, the non-dimensional variation of turbine power output is represented in Figure 10. The majority of energy generation was obtained at second stage of the rotor. The accelerated cross-flow after the first stage with higher kinematic energy was converted at the second stage. However, more energy conversion was acquired at 2/8T of Φ = 0.67 when the incoming flow was significantly high enough to impart its high kinematic energy to the first stage of the rotor. Although the energy loss at regions 1 and 2 tended to increase as the flow coefficient increased, the amount was too minor to affect the turbine performance.
The cycle-averaged turbine performance in reciprocating air flows is represented in Figure 11. The upward trend of both pressure and torque coefficients is illustrated with a trendline as shown in Figure 11a,b. The coefficients of pressure and torque were well fitted to the trendlines with 0.99 of R 2 , which is the coefficient of determination. The maximum efficiency of the turbine in reciprocating flows was 0.568 at Φ = 0.37. High efficiencies were mainly observed at low flow coefficients, which is due to the low displacement of piston movement inside the air chamber.
The comparison of overall performance between the reference turbine and the optimized turbine is illustrated in Figure 12. The reference model was simulated under steady-airflow conditions, and the optimized model was tested in both steady and reciprocating flows. It can be seen that the optimized turbine model in steady flows had more enhanced performance than the reference model. Although the peak performance of the optimized turbine was only slightly larger than the original model, the band width significantly widened with an increase in the flow coefficient. This means that the optimized turbine can be operated in wider operating range with higher efficiency. Under reciprocating flow conditions, the optimized turbine also has an improved performance range as in steady flow, and the high-performance values were observed between the flow coefficient of Φ = 0.2–0.4. However, the highest performance of the turbine in reciprocating flow was 0.043 lower than in steady flow. In the sinusoidal airflow cycles, low kinematic energy of the airflow was found when the flow direction through the turbine changed, and it was not large enough to transfer its energy to the rotor.

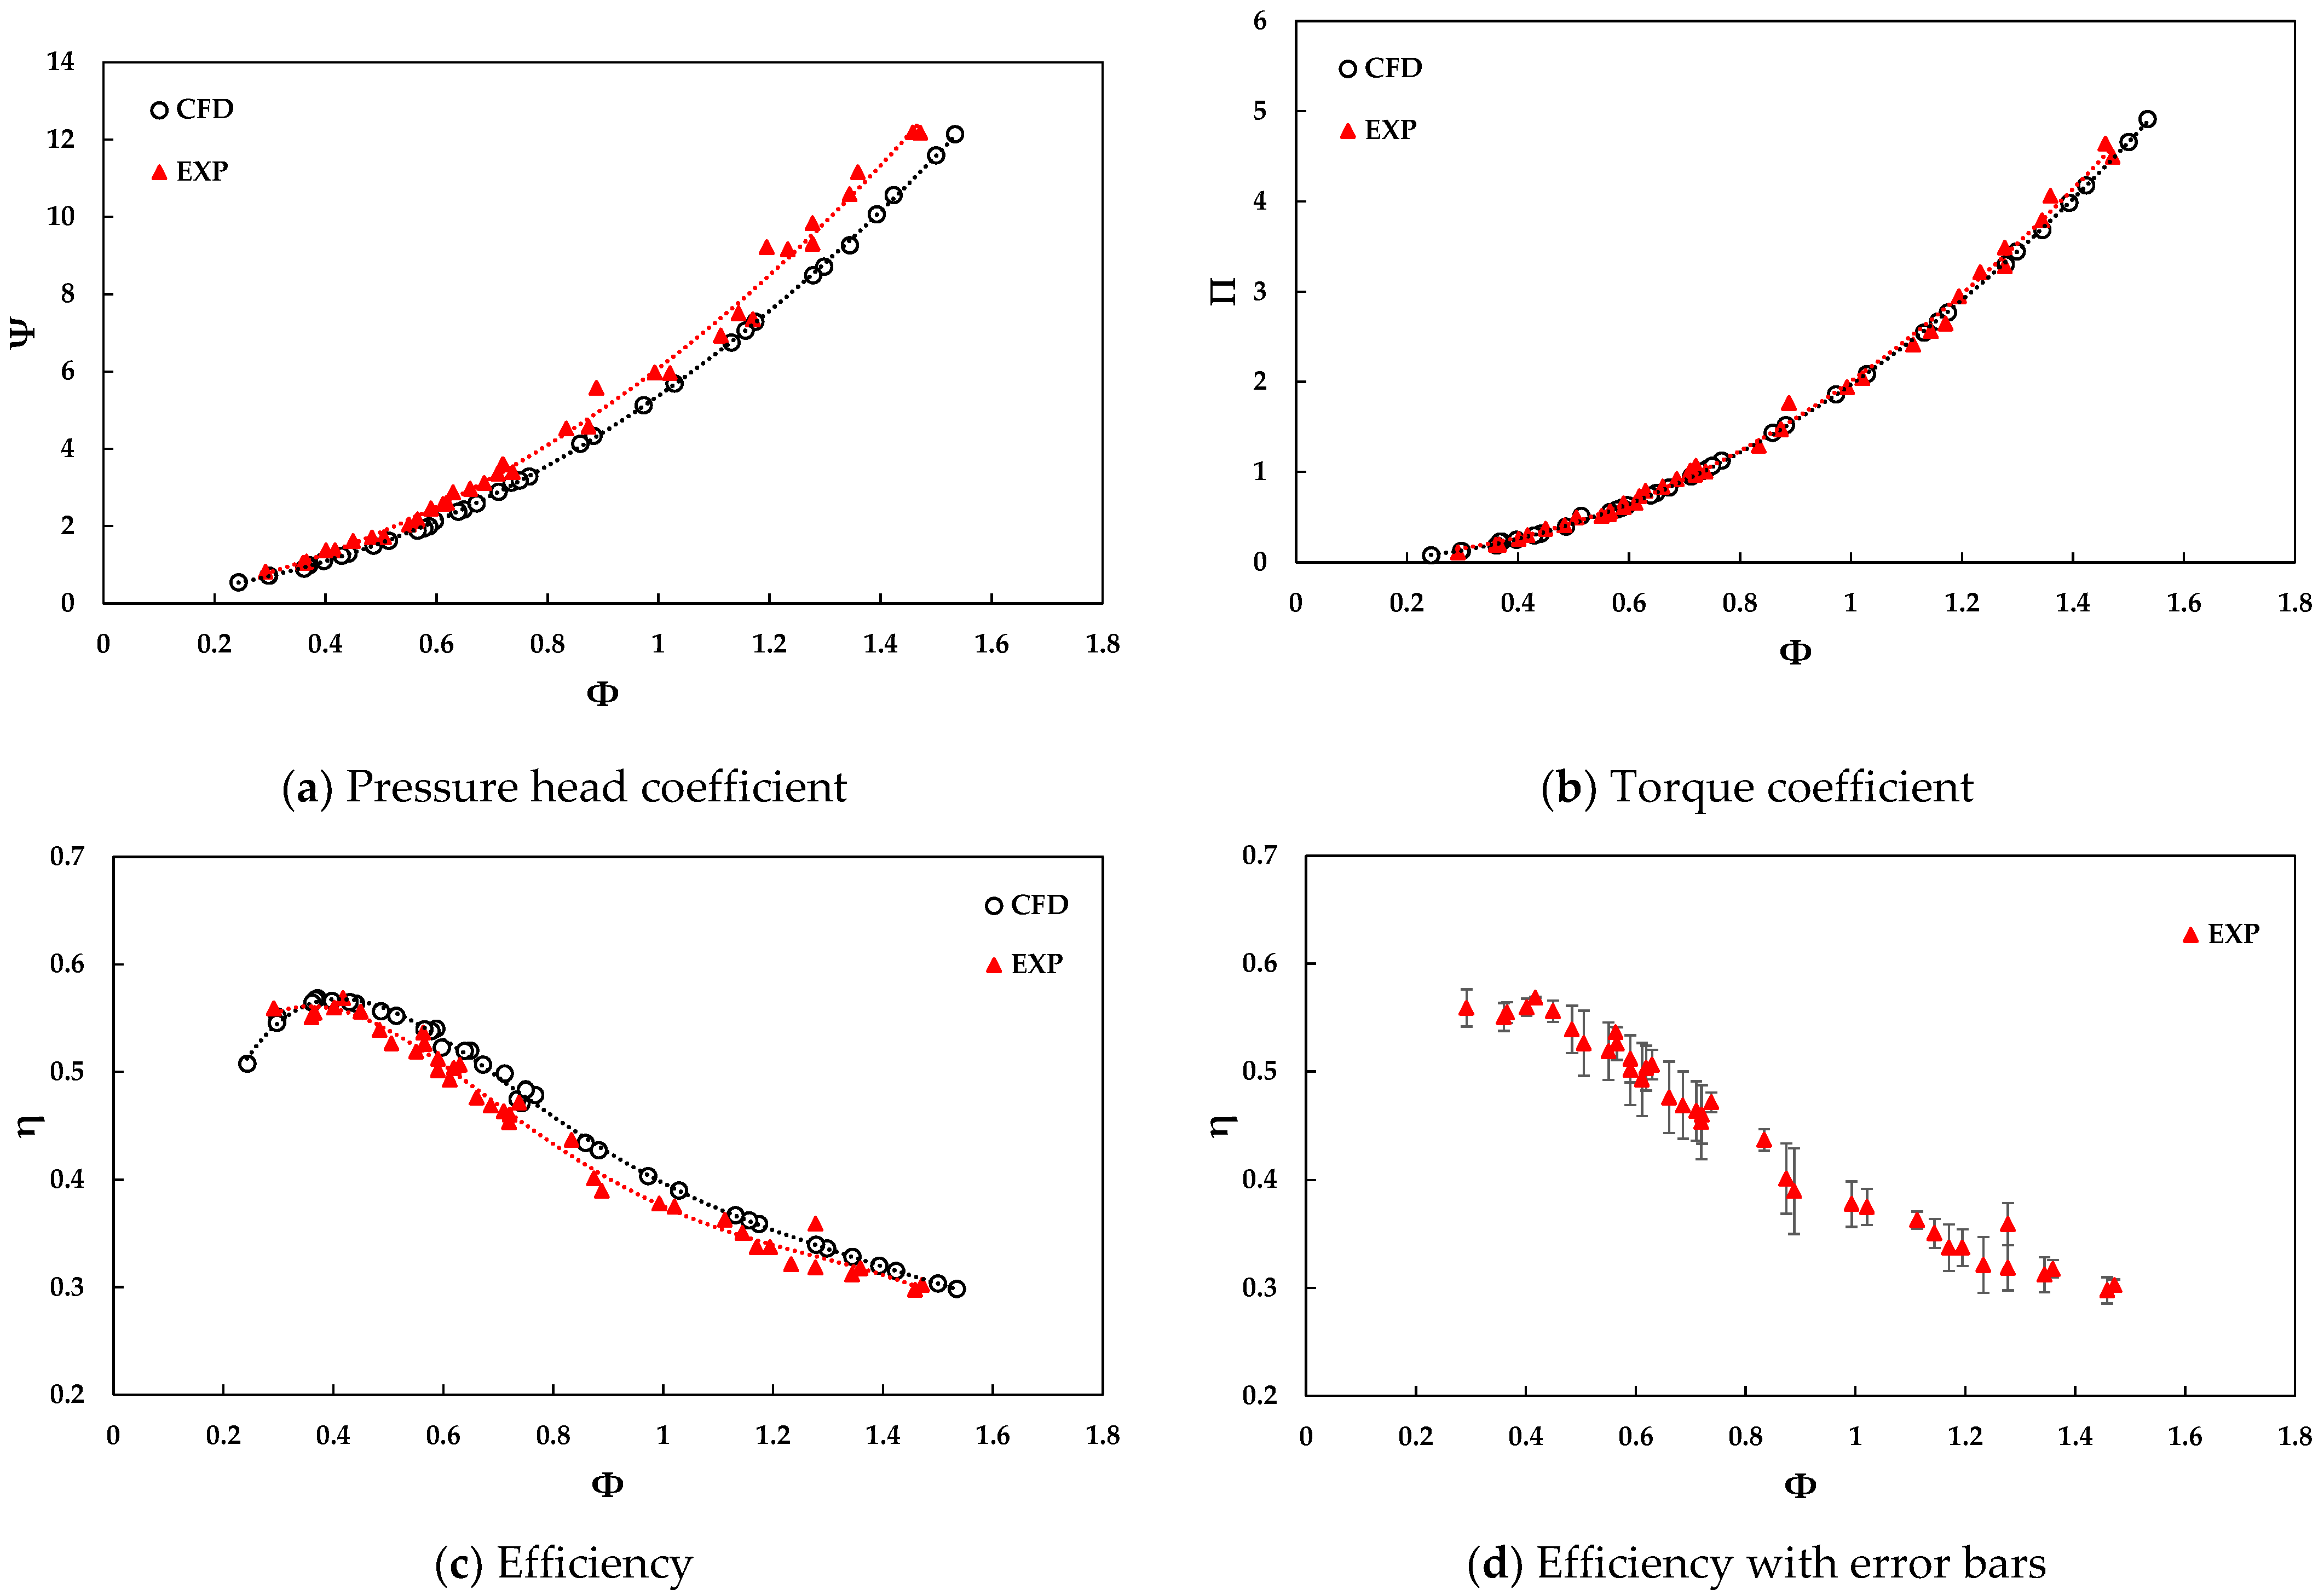
4.3. Validation of Numerical Model with Experiment Result

For validation of the numerical model, the experiment was conducted under the same reciprocating-airflow conditions. To operate the turbine in same range of flow coefficient as the numerical model, 0.2–1.0 m of the piston displacements, 350 and 700 rpm of the turbine rotational speeds, and 2.3–7.9 s reciprocating periods were varied. Experimental results were also represented as non-dimensional coefficients of torque   Π , pressure   Ψ , and flow Φ to compare with numerical results.
The comparison between numerical and experimental results is illustrated in Figure 13. The numerical dimensionless pressure coefficient had great agreement with the experimental result at a low flow coefficient, but then the gap between those two became significantly larger with an increase in the flow coefficient. However, the numerical curve of the torque coefficient matched well with the experimental result as shown in Figure 13b. The averaged and peak differences in cycle-averaged turbine performance were 3.5% and 8.8%, respectively. Generally, the numerical model agreed well with the experimental results, and this demonstrates that the numerical model has excellent capability to predict the unsteady performance of the cross-flow air turbine in various further conditions.

5. Conclusions

This paper describes an approach for the design optimization of the cross-flow air turbine for OWC WECs. The base model of the turbine was numerically optimized to enhance its performance using commercial CFD code ANSYS CFX. The steady-flow analysis was first conducted for the geometric optimization of the model by changing several design variables. Then, the performance of the model under reciprocating-flow conditions was accomplished by transient analysis. For validation of the numerical model, the experiment of the full-scale turbine was undertaken in the cylindrical-type wave simulator, that generated reciprocating air flows. The details of the conclusions can be drawn as follows:
  • The optimized model had 36 blades of the rotor with 3 mm thickness and 0.38 throat width of the nozzle.
  • The geometric optimization of the nozzle was the most sensitive among the selected design variables. This indicates greater possibility for enhancing its performance in future work.
  • The maximum efficiency of the optimized model was 0.611, which was 1.7% larger than that of the reference model.
  • The band width of the model significantly widened as the flow coefficient increased.
  • The optimized model in reciprocating flows had more improved operating range with higher efficiency than the steady-state performance, but the peak performance decreased by 4.3%.
  • The averaged difference between the numerical result and the experimental result was 3.5%, which indicates that the numerical model was able to predict the turbine performance with high accuracy.
With these findings, the proposed turbine having remarkable merits in structural simplicity and high performance can be a good choice for efficient wave energy converters.
In the future, the unsteady behaviors of the cross-flow air turbine will be investigated in actual OWC operating conditions. The air turbine will be adopted into the floating-moored OWC WEC, and it will be tested in the wave tank facility. In addition, further investigation on the nozzle design to improve the turbine performance in reciprocating flows will be conducted.

Author Contributions

Conceptualization, H.-G.K. and Y.-H.L.; methodology, H.-G.K.; software, H.-G.K.; validation, H.-G.K.; formal analysis, H.-G.K.; investigation, H.-G.K.; writing—original draft preparation, H.-G.K.; writing—review and editing, H.-G.K., C.-J.K. and Y.-H.L.; supervision, H.-G.K., H.-D.K. and Y.-H.L.; project administration, H.-G.K., C.-J.K. and H.-D.K.; funding acquisition, H.-G.K., C.-J.K. and H.-D.K. All authors have read and agreed to the published version of the manuscript.

Funding

This research was funded by the ministry of SMEs and Startups, South Korea (grant number: S2832473).

Institutional Review Board Statement

Not applicable.

Informed Consent Statement

Not applicable.

Data Availability Statement

Not applicable.

Conflicts of Interest

The authors declare no conflict of interest.

References

  1. PDrew, B.; Plummer, A.R.; Sahinkaya, M.N. A review of wave energy converter technology. Proc. Inst. Mech. Eng. Part A J. Power Energy 2009, 223, 887–902. [Google Scholar]
  2. Vining, J.G.; Muetze, A. Economic factors and incentives for ocean wave energy conversion. IEEE Trans. Ind. Appl. 2009, 45, 547–554. [Google Scholar] [CrossRef]
  3. Aderinto, T.; Li, H. Review on power performance and efficiency of wave energy converters. Energies 2019, 12, 4329. [Google Scholar] [CrossRef] [Green Version]
  4. Weerakoon, A.S.; Kim, B.H.; Cho, Y.J.; Prasad, D.D.; Ahmed, M.R.; Lee, Y.H. Design optimization of a novel vertical augmentation channel housing a cross-flow turbine and performance evaluation as a wave energy converter. Renew. Energy 2021, 180, 1300–1314. [Google Scholar] [CrossRef]
  5. Falcão, A.F.; Henriques, J.C. Oscillating-water-column wave energy converters and air turbines: A review. Renew. Energy 2016, 85, 1391–1424. [Google Scholar] [CrossRef]
  6. Masuda, Y.; McCormick, M.E. Experiences in pneumatic wave energy conversion in Japan. In Utilization of Ocean Waves—Wave to Energy Conversion; ASCE: Reston, VA, USA, 1986; pp. 1–33. [Google Scholar]
  7. Torresi, M.; Stefanizzi, M.; Fornarelli, F.; Gurnari, L.; Filianoti, P.G.F.; Camporeale, S.M. Performance characterization of a wells turbine under unsteady flow conditions. In the AIP Conference Proceedings; AIP Publishing: Melville, NY, USA, 2019; p. 020149. [Google Scholar]
  8. Setoguchi, T.; Takao, M. Current status of self rectifying air turbines for wave energy conversion. Energy Convers. Manag. 2006, 47, 2382–2396. [Google Scholar] [CrossRef]
  9. Curran, R.; Folley, M. Air turbine design for OWCs. In Ocean Wave Energy-Current Status and Future Prospects; Springer: Manhattan, NY, USA, 2008; pp. 189–219. [Google Scholar]
  10. Falcão, A.F.O.; Gato, L.M.C. 8.05—Air Turbines. In Comprehensive Renewable Energy, 2nd ed.; Elsevier: Amsterdam, The Netherlands, 2012; pp. 111–149. [Google Scholar]
  11. Das, T.K.; Halder, P.; Samad, A. Optimal design of air turbines for oscillating water column wave energy systems: A review. Int. J. Ocean Clim. Syst. 2017, 8, 37–49. [Google Scholar] [CrossRef]
  12. Thakker, A.; Dhanasekaran, T.S. Computed effect of guide vane shape on performance of impulse turbine for wave energy conversion. Int. J. Energy Res. 2005, 29, 1245–1260. [Google Scholar] [CrossRef]
  13. Kang, H.G.; Kim, B.H.; Lee, Y.H. A Performance Study of a Cross-flow Air Turbine Utilizing an Orifice for OWC WEC. J. Korean Soc. Fluid Mach. 2017, 20, 54–62. [Google Scholar] [CrossRef]
  14. Mockmore, C.A.; Merryfield, F. The Banki water turbine. Or. Eng. Exp. Stn. Bull. Ser. 1949, 25, 1–27. [Google Scholar]
  15. Durali, M. Design of Small Water Turbines for Farms and Small Communities. Ph.D. Thesis, Massachusetts Institute of Technology, Cambridge, MA, USA, 1976. [Google Scholar]
  16. Nakase, Y. A study of cross-flow turbine (effects of nozzle shape on its performance). In ASME 103rd Winter Annual Meeting; ASME 103rd Winter Annual Meeting: Scottsdale, AZ, USA, 1982; Volume 13. [Google Scholar]
  17. Khosrowpanah, S.; Fiuzat, A.A.; Albertson, M.L. Experimental study of cross-flow turbine. J. Hydraul. Eng. 1988, 114, 299–314. [Google Scholar] [CrossRef]
  18. Fiuzat, A.A.; Akerkar, B. The use of interior guide tube in cross flow turbines. In Waterpower’89; ASCE: Reston, VA, USA, 1989; pp. 1111–1119. [Google Scholar]
  19. Desai, V.R. A Parametric Study of the Cross-Flow Turbine Performance. Ph.D. Thesis, Clemson University, Clemson, SC, USA, 1993. [Google Scholar]
  20. Totapally, H.G.; Aziz, N.M. Refinement of cross-flow turbine design parameters. J. Energy Eng. 1994, 120, 133–147. [Google Scholar] [CrossRef]
  21. Fukutomi, J.; Nakase, Y.; Watanabe, T. A numerical method of free jet from a cross-flow turbine nozzle. Bull. JSME 1985, 28, 1436–1440. [Google Scholar] [CrossRef]
  22. Adhikari, R.C.; Wood, D.H. A new nozzle design methodology for high efficiency crossflow hydro turbines. Energy Sustain. Dev. 2017, 41, 139–148. [Google Scholar] [CrossRef]
  23. Prasad, D.D.; Ahmed, M.R.; Lee, Y.H. Performance studies on a direct drive turbine for wave power generation in a numerical wave tank. In Proceedings of the Asian Wave and Tidal Energy Conference, Jeju, Korea, 27–30 November 2012; pp. 185–192. [Google Scholar]
  24. Choi, Y.D.; Kim, C.G.; Kim, Y.T.; Song, J.I.; Lee, Y.H. A performance study on a direct drive hydro turbine for wave energy converter. J. Mech. Sci. Technol. 2010, 24, 2197–2206. [Google Scholar] [CrossRef]
  25. Prasad, D.D.; Kim, C.G.; Kang, H.G.; Ahmed, M.R.; Lee, Y.H. Performance and flow characteristics of single and a novel double oscillating water column devices. J. Mech. Sci. Technol. 2017, 31, 5879–5886. [Google Scholar] [CrossRef]
  26. Akabane, M.; Suzuki, H.; Yamauchi, K. On the Cross Flow Turbine for Wave Power Plant. In Proceedings of the 1st Symposium on Wave Energy Utilization in Japan, Tokyo, Japan, 27–28 November 1984. [Google Scholar]
  27. Paderi, M.; Puddu, P. Experimental investigation in a Wells turbine under bi-directional flow. Renew. Energy 2013, 57, 570–576. [Google Scholar] [CrossRef]
  28. Puddu, P.; Paderi, M.; Manca, C. Aerodynamic characterization of a Wells turbine under bi-directional airflow. Energy Procedia 2014, 45, 278–287. [Google Scholar] [CrossRef]
  29. Ghisu, T.; Puddu, P.; Cambuli, F. Physical explanation of the hysteresis in Wells turbines: A critical reconsideration. J. Fluids Eng. 2016, 138, 11. [Google Scholar] [CrossRef]
  30. Ghisu, T.; Puddu, P.; Cambuli, F. Numerical analysis of a wells turbine at different non-dimensional piston frequencies. J. Therm. Sci. 2015, 24, 535–543. [Google Scholar] [CrossRef]
  31. Liu, Z.; Cui, Y.; Xu, C.; Sun, L.; Li, M.; Jin, J. Experimental and numerical studies on an OWC axial-flow impulse turbine in reciprocating air flows. Renew. Sustain. Energy Rev. 2019, 113, 109272. [Google Scholar] [CrossRef]
  32. Elhanafi, A.; Fleming, A.; Macfarlane, G.; Leong, Z. Numerical energy balance analysis for an onshore oscillating water column–wave energy converter. Energy 2016, 116, 539–557. [Google Scholar] [CrossRef]
  33. Choi, Y.D.; Lim, J.I.; Kim, Y.T.; Lee, Y.H. Performance and internal flow characteristics of a cross-flow hydro turbine by the shapes of nozzle and runner blade. J. Fluid Sci. Technol. 2008, 3, 398–409. [Google Scholar] [CrossRef] [Green Version]
  34. De Andrade, J.; Curiel, C.; Kenyery, F.; Aguillón, O.; Vásquez, A.; Asuaje, M. Numerical investigation of the internal flow in a Banki turbine. Int. J. Rotating Mach. 2011, 2011, 1–12. [Google Scholar] [CrossRef] [Green Version]
  35. Sammartano, V.; Aricò, C.; Carravetta, A.; Fecarotta, O.; Tucciarelli, T. Banki-Michell optimal design by computational fluid dynamics testing and hydrodynamic analysis. Energies 2013, 6, 2362–2385. [Google Scholar] [CrossRef]
  36. ANSYS, Inc. ANSYS CFX-Solver Theory Guide, ANSYS, Inc.: Canonsburg, PA, USA, 2016.
Figure 1. Schematic of the cross-flow air turbine.
Energies 15 02444 g001
Figure 2. The grid and boundary condition of the numerical turbine model.
Energies 15 02444 g002
Figure 3. Layout of the wave simulator facility.
Energies 15 02444 g003
Figure 4. Experimental setup.
Energies 15 02444 g004
Figure 5. Effect of thickness and number of rotor blades on the turbine performance at 350 rpm constant rotational speed.
Energies 15 02444 g005
Figure 6. Effect of rotational speed and number of rotor blades on the turbine performance with 3 mm blade thickness.
Energies 15 02444 g006
Figure 7. Effect of nozzle throat width on the turbine performance with 700 rpm and 3 mm blade thickness.
Energies 15 02444 g007
Figure 8. Comparison of velocity vectors between NZ = 0.26 and 0.38 at ω = 700 rpm, Nb = 36, and t* = 3 mm.
Energies 15 02444 g008
Figure 9. Turbine power generation on the rotor for Φ = 0.67 and ω = 700 rpm.
Energies 15 02444 g009
Figure 10. Variation of turbine power output for different flow coefficient.
Energies 15 02444 g010
Figure 11. Cycle-averaged performance of the numerical model in reciprocating air flows.
Energies 15 02444 g011aEnergies 15 02444 g011b
Figure 12. Comparison of the reference and optimized model performance in steady and reciprocating air flows by CFD.
Energies 15 02444 g012
Figure 13. Comparison of the cycle-averaged performance of numerical and experimental turbines in reciprocating air flows.
Energies 15 02444 g013
Table 1. Detailed design parameters of the cross-flow air turbine numerical model.
Design ParameterValue
Outer diameter, D1, (m)0.3
Inner diameter, D2, (m)0.24
No. of blades, Nb24, 30, 36
Thickness of blades, t*, (mm)3, 4, 5
Nozzle entry angle, δ, (°)90
Angle of attack, α, (°)18
Blade inlet angle, β1, (°)30
Blade exit angle, β2, (°)90
Rotor and nozzle width, W, (m)0.4
Rotational speed, ω, (rpm)350 and 700
Nozzle   throat   width ,   NZ ,   S 0 / R 1 δ 0.26 (original), 0.3, 0.34, 0.38
Table 2. Detailed parameters of the cross-flow air turbine model for experiment.
Design ParameterValue
Outer diameter, D1, (m)0.3
Inner diameter, D2, (m)0.24
Width of turbine, W, (m)0.4
Tip clearance, (mm)1
No. of blades, Nb36
Thickness of blades, t*, (mm)3
Nozzle entry angle, δ, (°)90
Angle of attack, α, (°)18
Blade inlet angle, β1, (°)30
Blade exit angle, β2, (°)90
Rotor and nozzle width, W, (m)0.4
Rotational speed, ω, (rpm)350 and 700
Nozzle   throat   width ,   NZ ,   ( S 0 / R 1 δ ) 0.38
Publisher’s Note: MDPI stays neutral with regard to jurisdictional claims in published maps and institutional affiliations.

