
Influence of Well Pattern Type on Remaining Oil Saturation and Distribution after Development

Abstract
:1. Introduction
2. Experimental Procedures
2.1. Materials
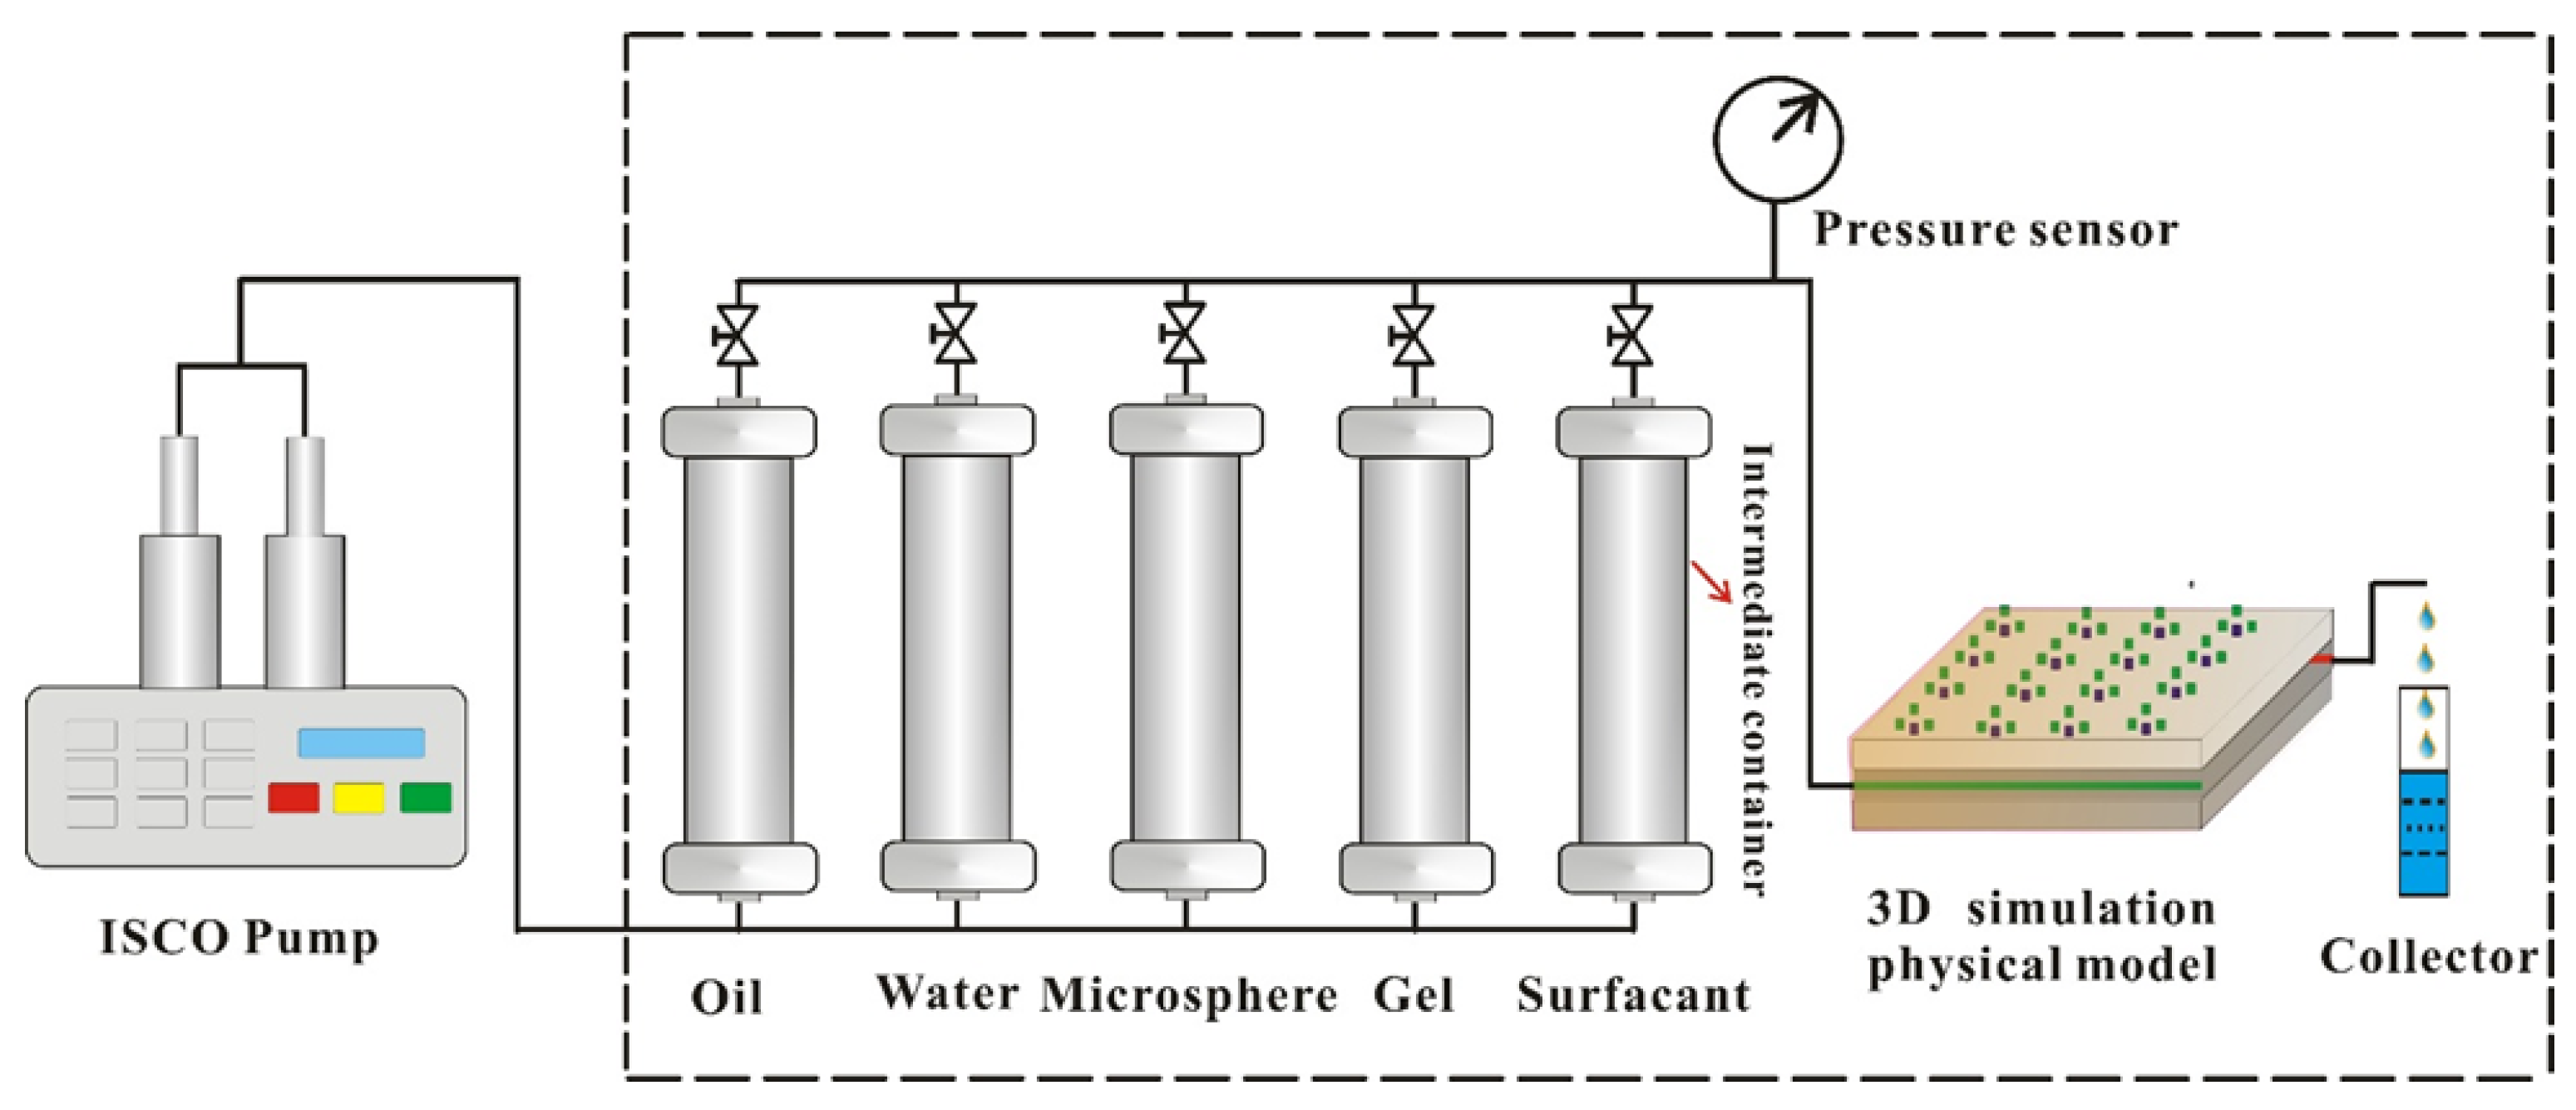
2.2. Apparatus
2.3. Procedures
2.3.1. Polymer Gel Properties
2.3.2. Polymer Microsphere Properties
2.3.3. Surfactant Properties
2.3.4. Remaining Oil Saturation and Distribution Experiment
- (1)
- The dried 3D physical simulation model was weighed before and after saturation with water at room temperature, and the pore volume (PV) and porosity were calculated according to the weight difference.
- (2)
- Each 3D physical simulation model was saturated with crude oil and aged at 60 °C for 24 h to prepare it for use. The oil saturation of each sample was then calculated.
- (3)
- Water was injected into the physical model, the produced liquid was collected until the water content reached 80%, and the resistivity values of the electrodes at various parts of the core were measured to calculate the oil saturation.
- (4)
- The polymer gel, polymer microspheres, and surfactant were injected into the physical model. The resistivity values of the electrodes at various parts of the core were measured, and the oil saturation was calculated.
- (5)
- Water was injected into the physical model, and the produced liquid was collected until the water content reached 98%. The resistivity values of the electrodes at various parts of the core were measured, and the oil saturation was calculated.
3. Experimental Results Analysis
3.1. Polymer Gel Properties
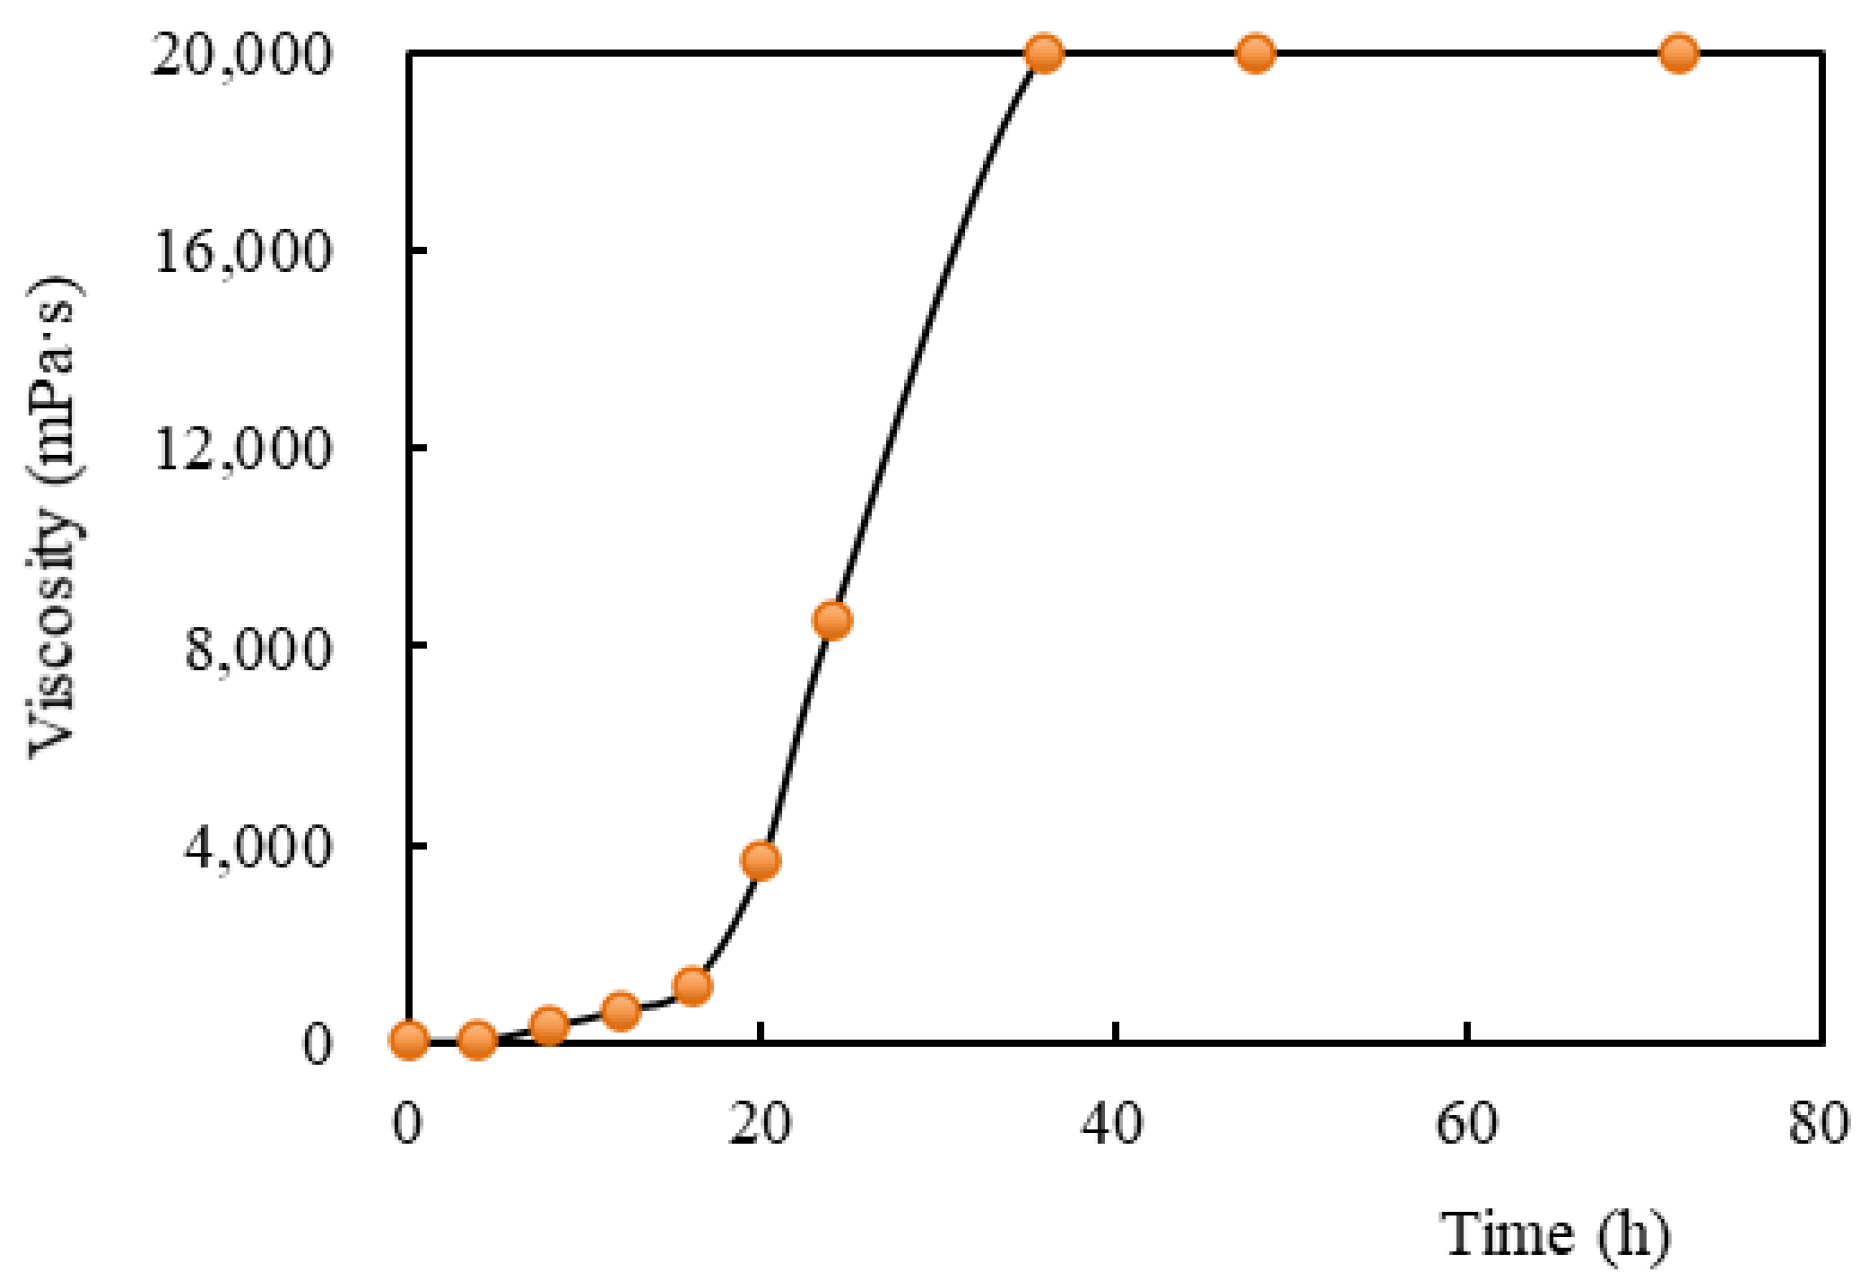
3.1.1. Viscosity and Gel Strength
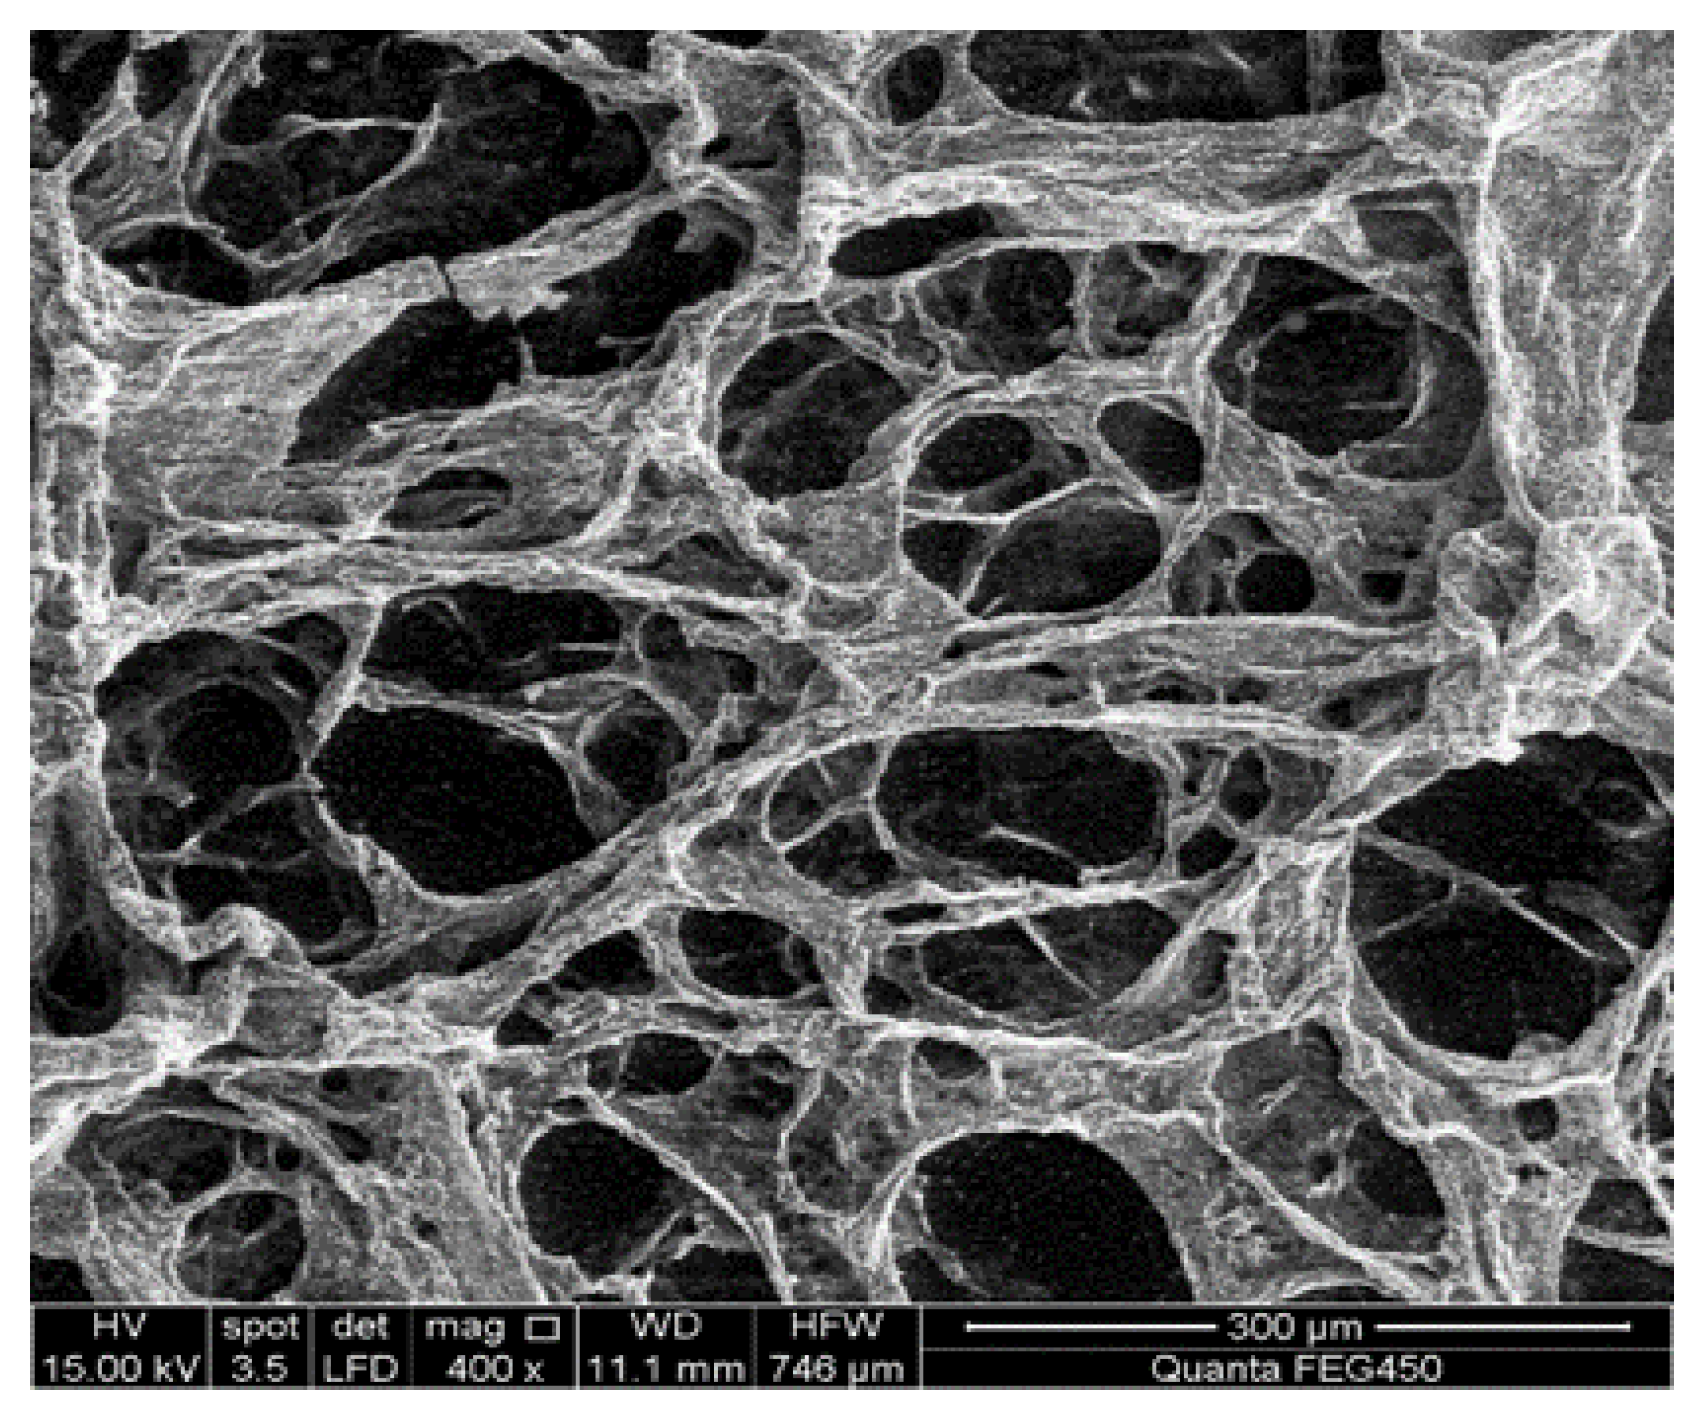
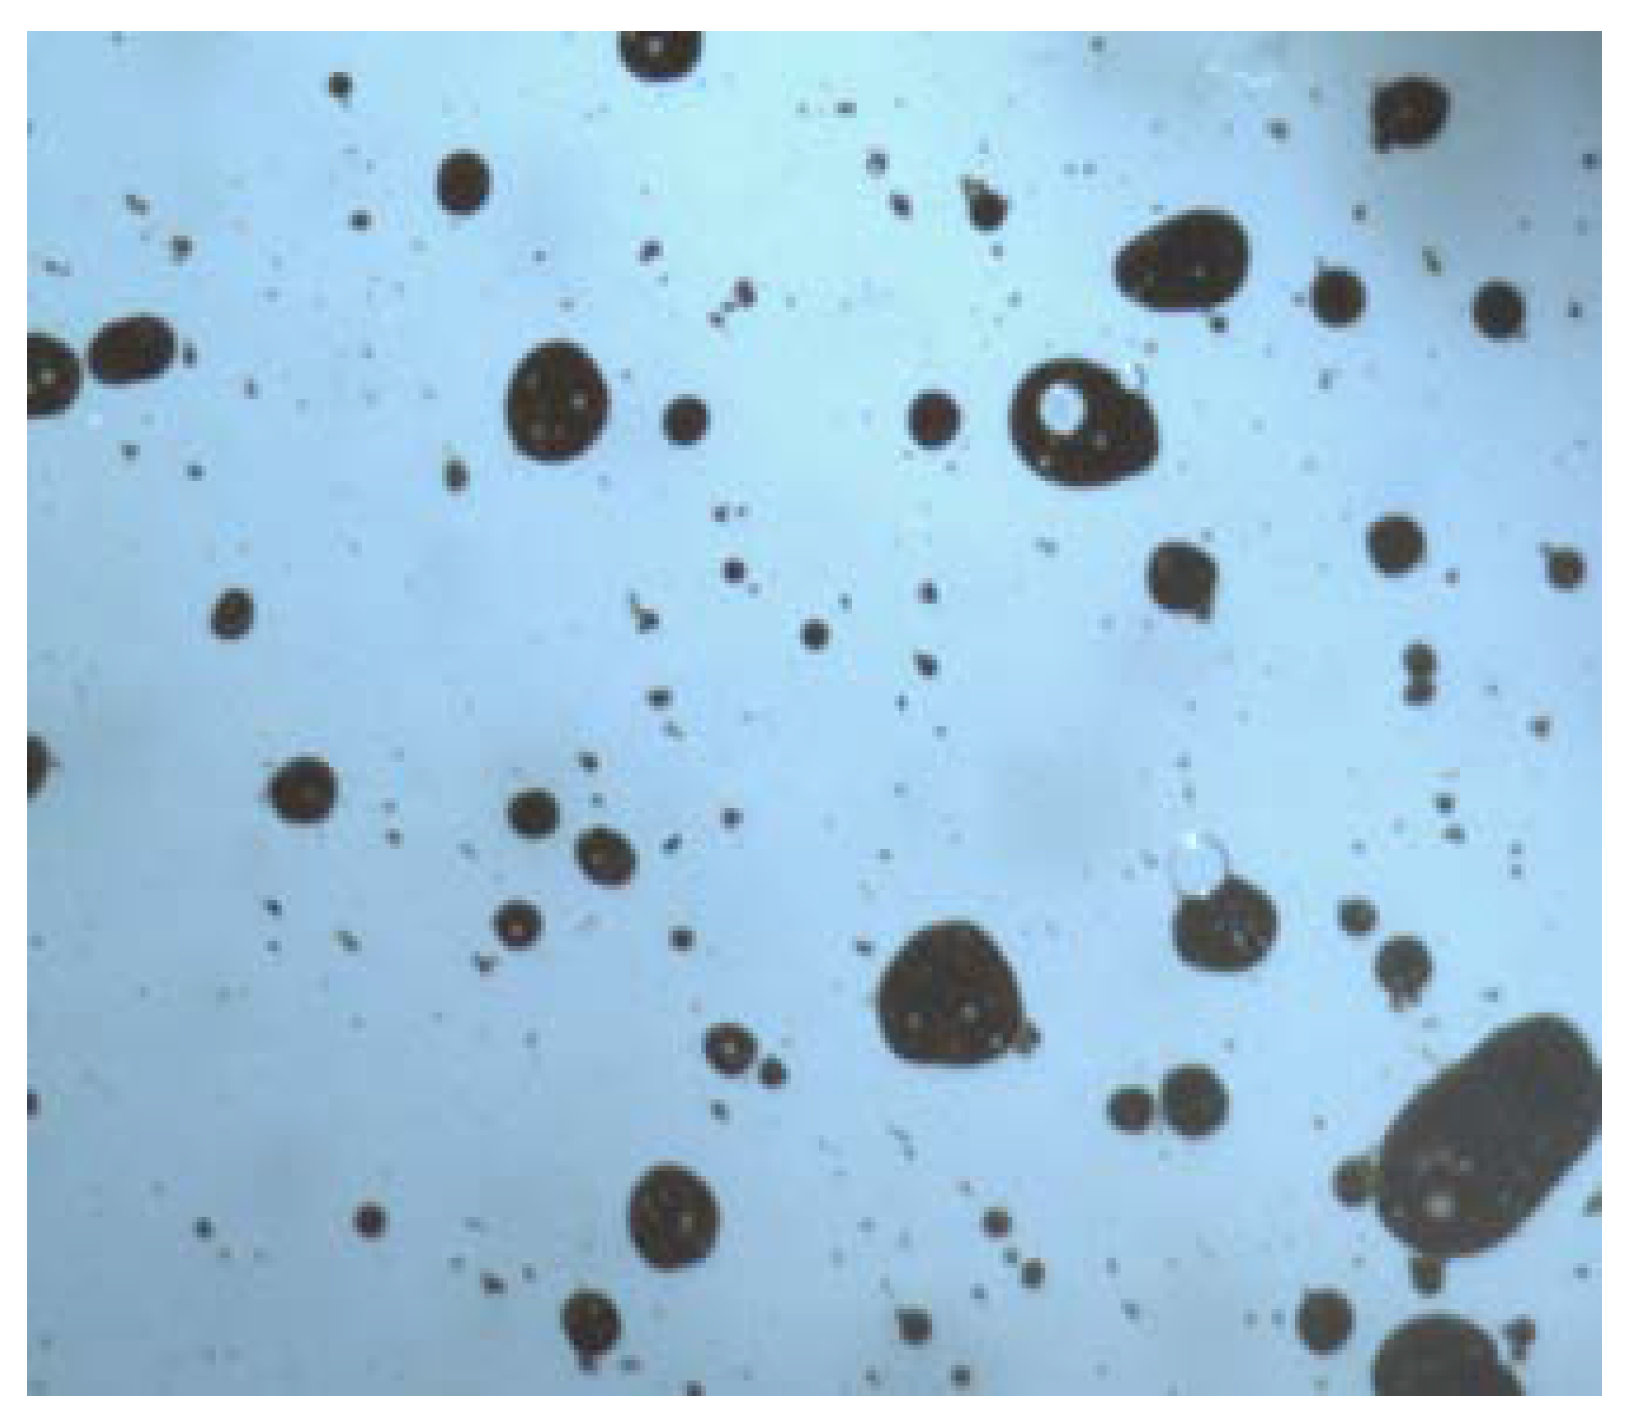
3.1.2. SEM
3.2. Polymer Microsphere Properties
3.3. Surfactant Properties
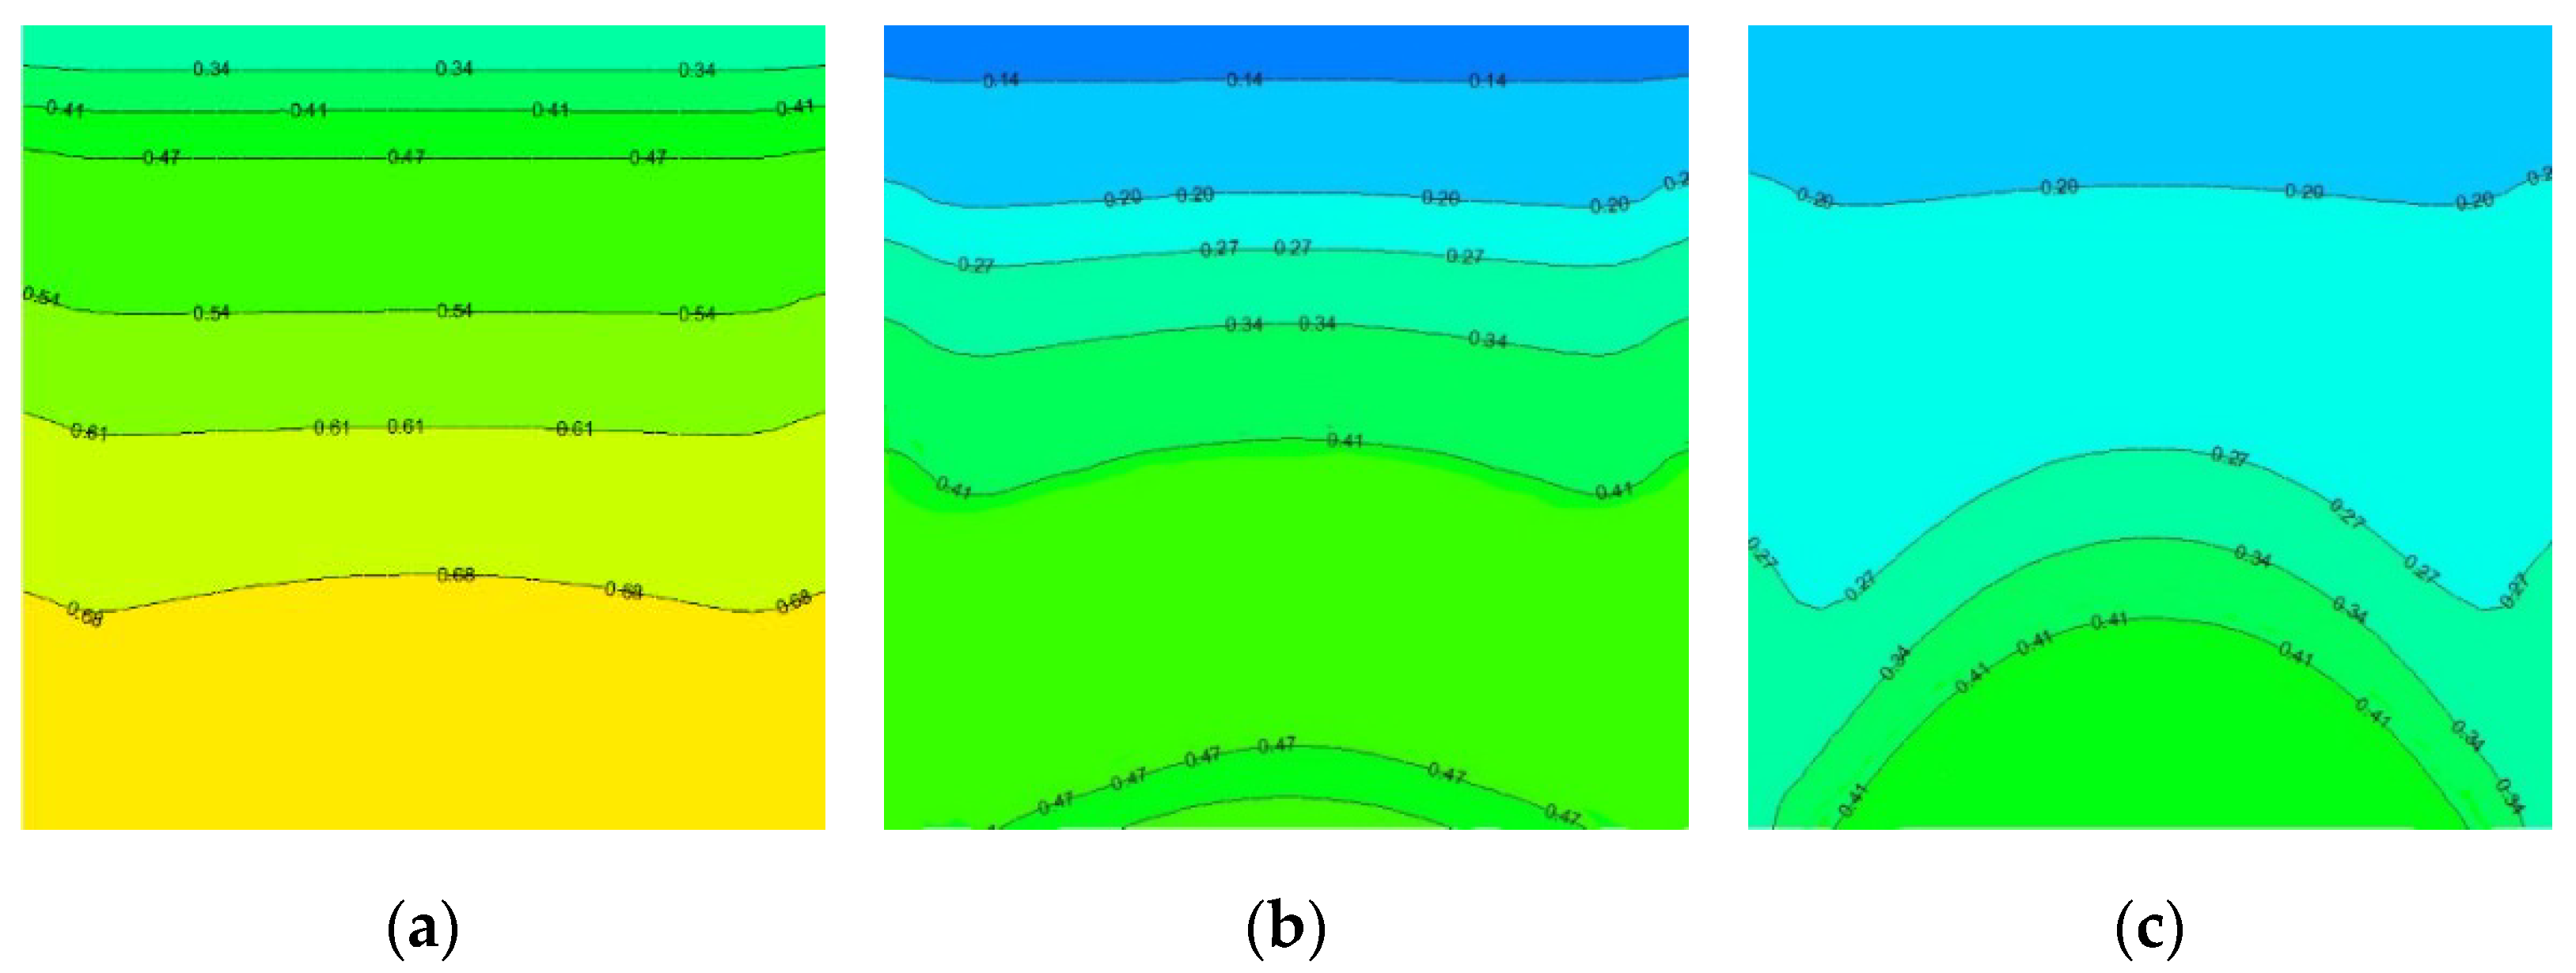
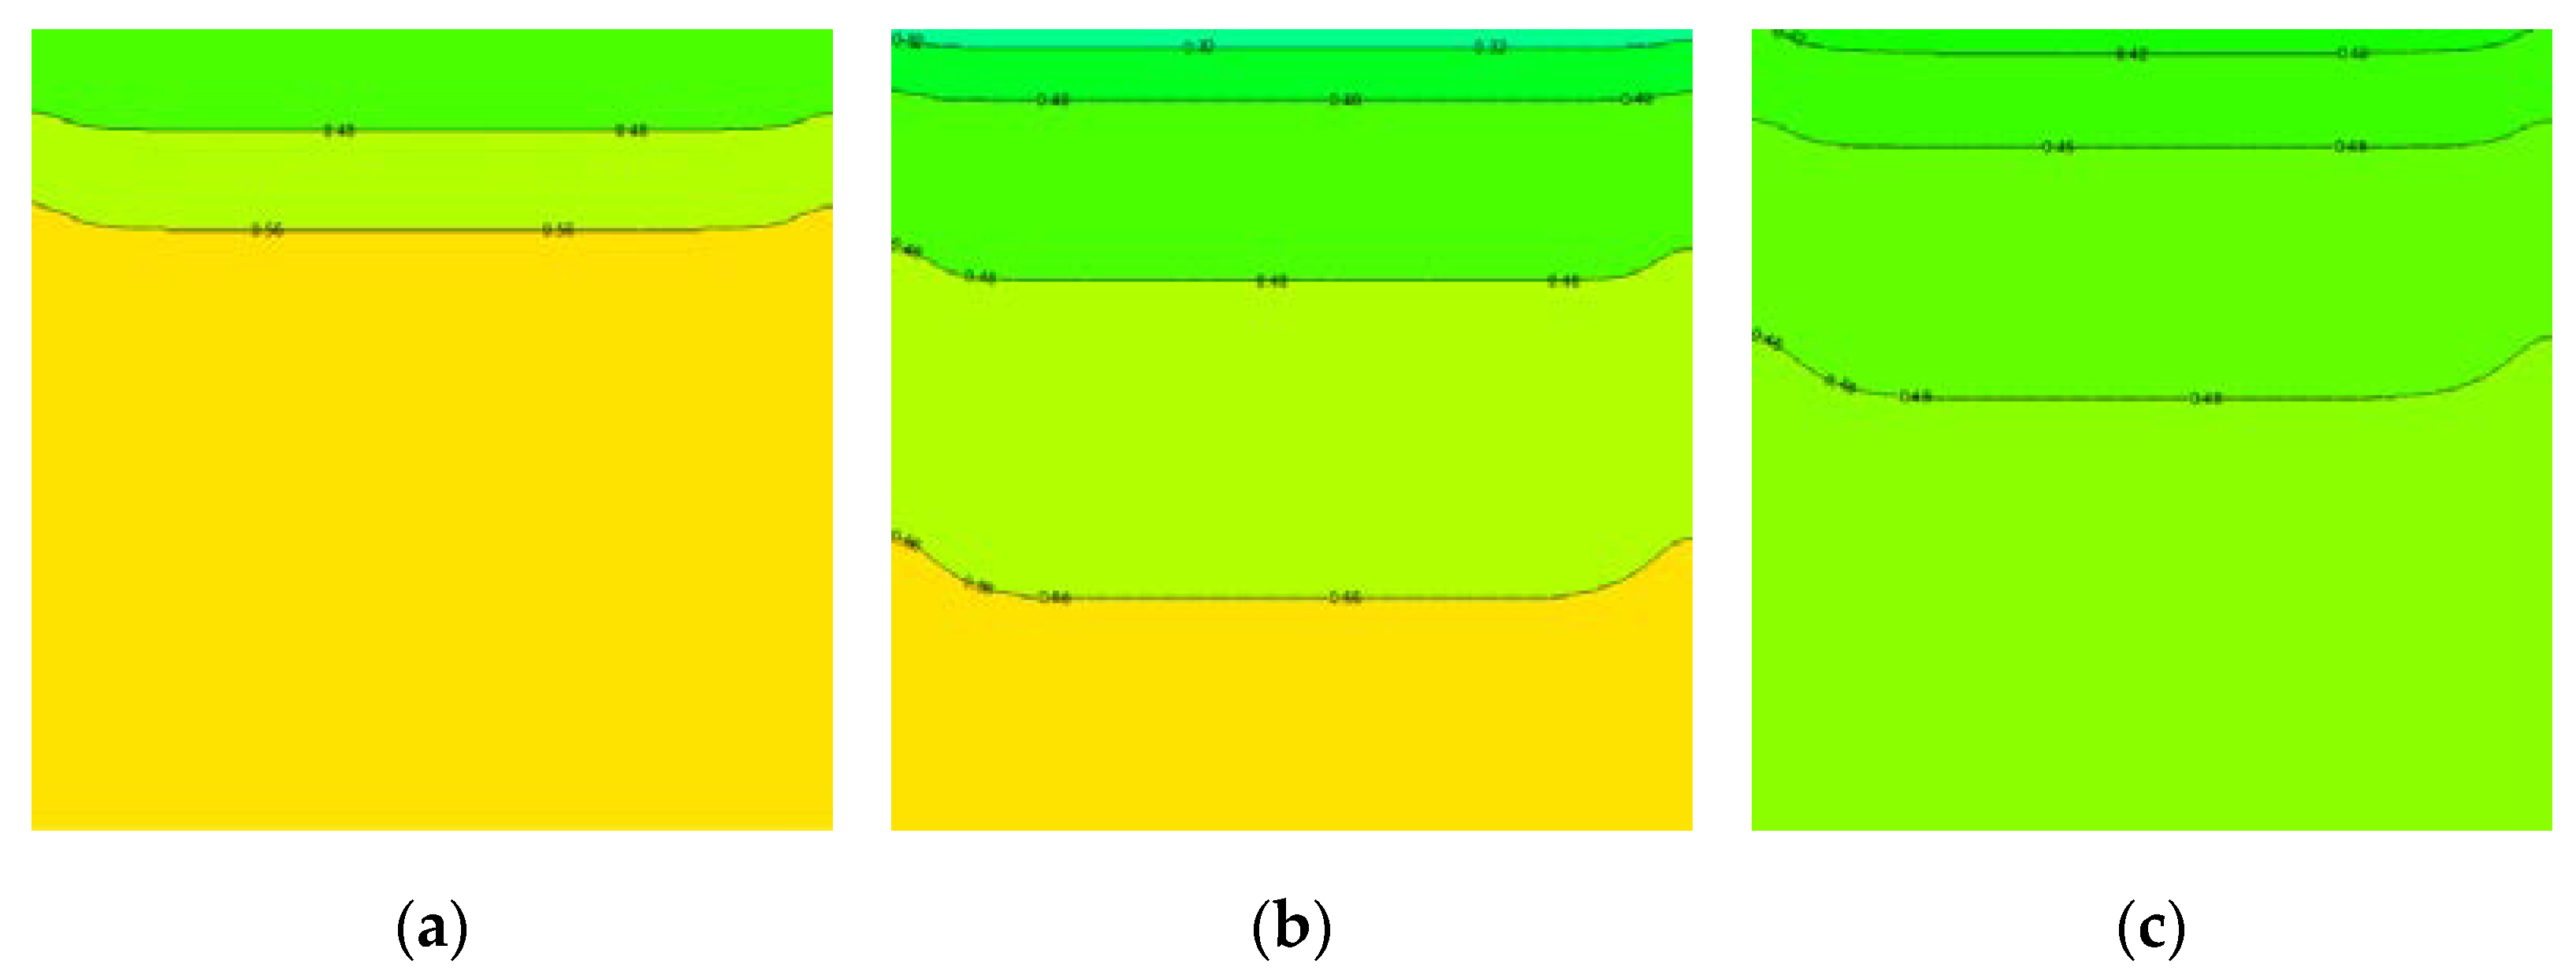
3.4. Remaining Oil Saturation and Distribution
4. Conclusions
- (1)
- When the polymer concentration was 3000 mg/L, the polymer gel was formed by a reaction with the Cr3+ crosslinking agent, the final gelling viscosity was greater than 20,000 mPa·s, and the gel strength grade reached grade G.
- (2)
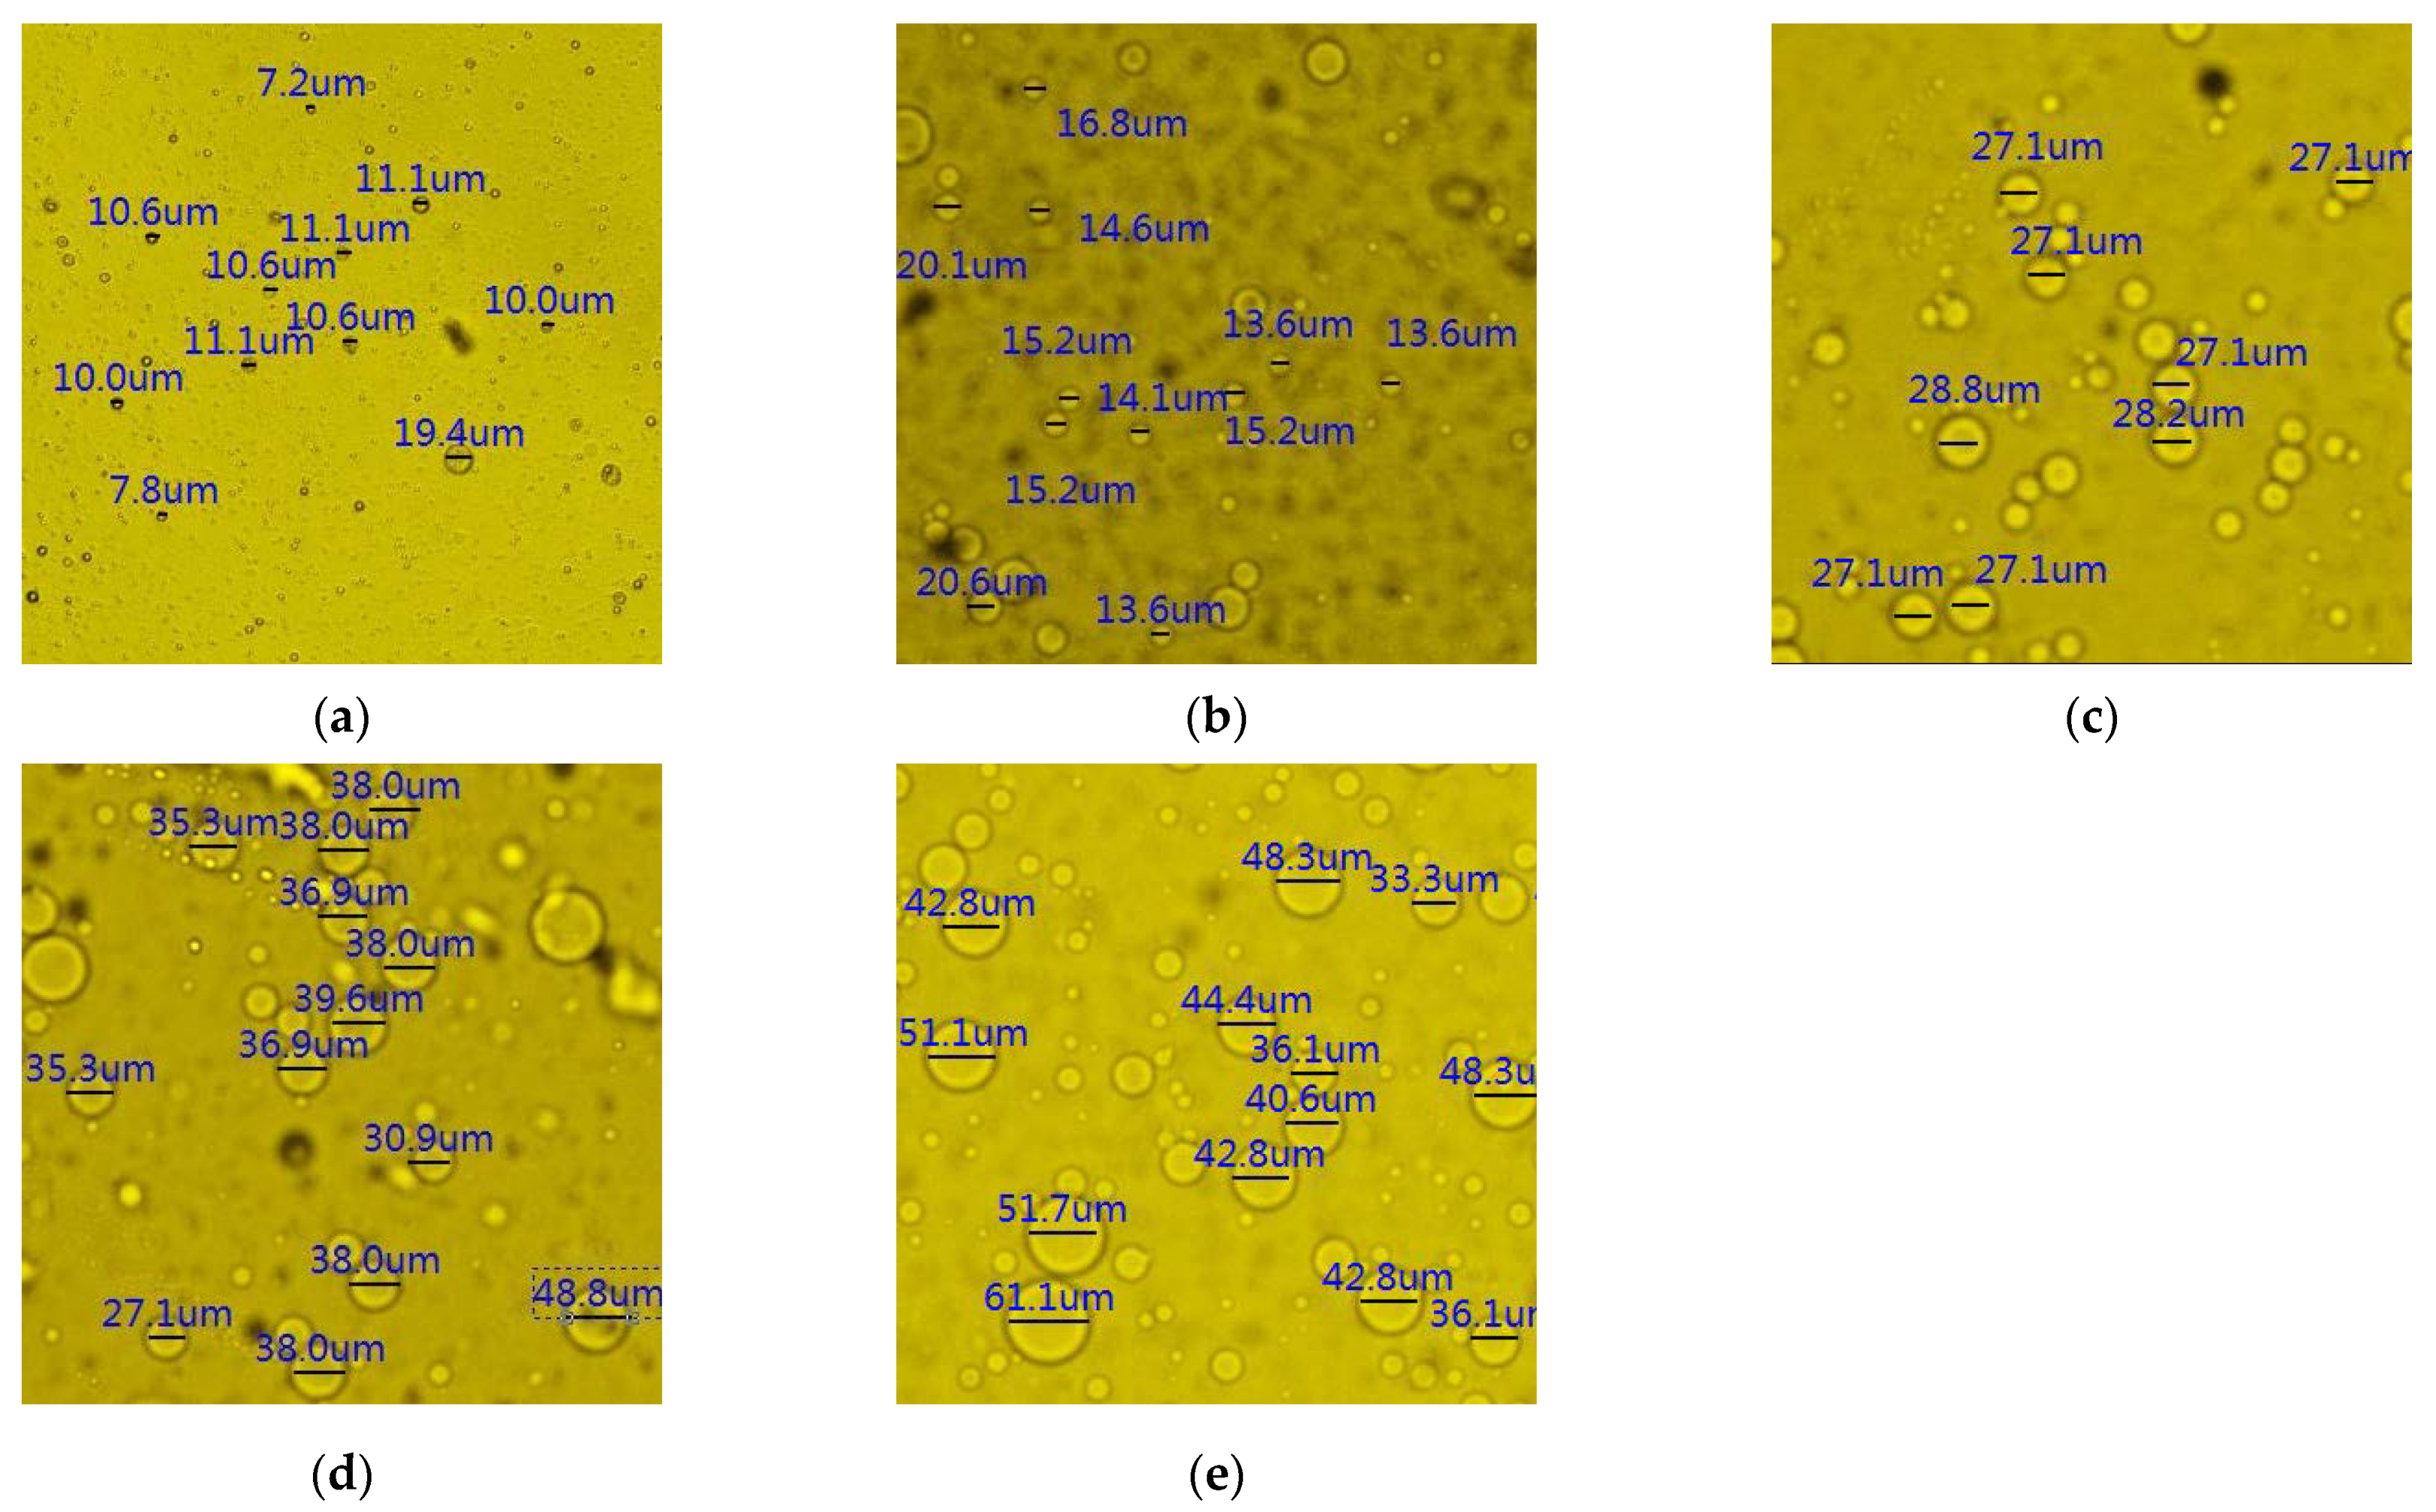
- The polymer microspheres had an initial particle size distribution in the range of 7.2–11.1 μm, the hydration expansion particle sizes were in the range of 40.6–48.3 μm after 7 days, and the expansion multiple was 4.35–5.64.
- (3)
- The interfacial tension between the surfactant and crude oil was approximately 5.08 –5.11 × 10⁻¹ mN/m, and emulsification occurred after the surfactant solution was mixed with crude oil, forming an O/W emulsion.
- (4)
- Polymer gel had a good plugging effect on the highly permeable layer; the polymer gel can drive the polymer microspheres and surfactant after plugging into the medium- and low-permeability layers.
- (5)
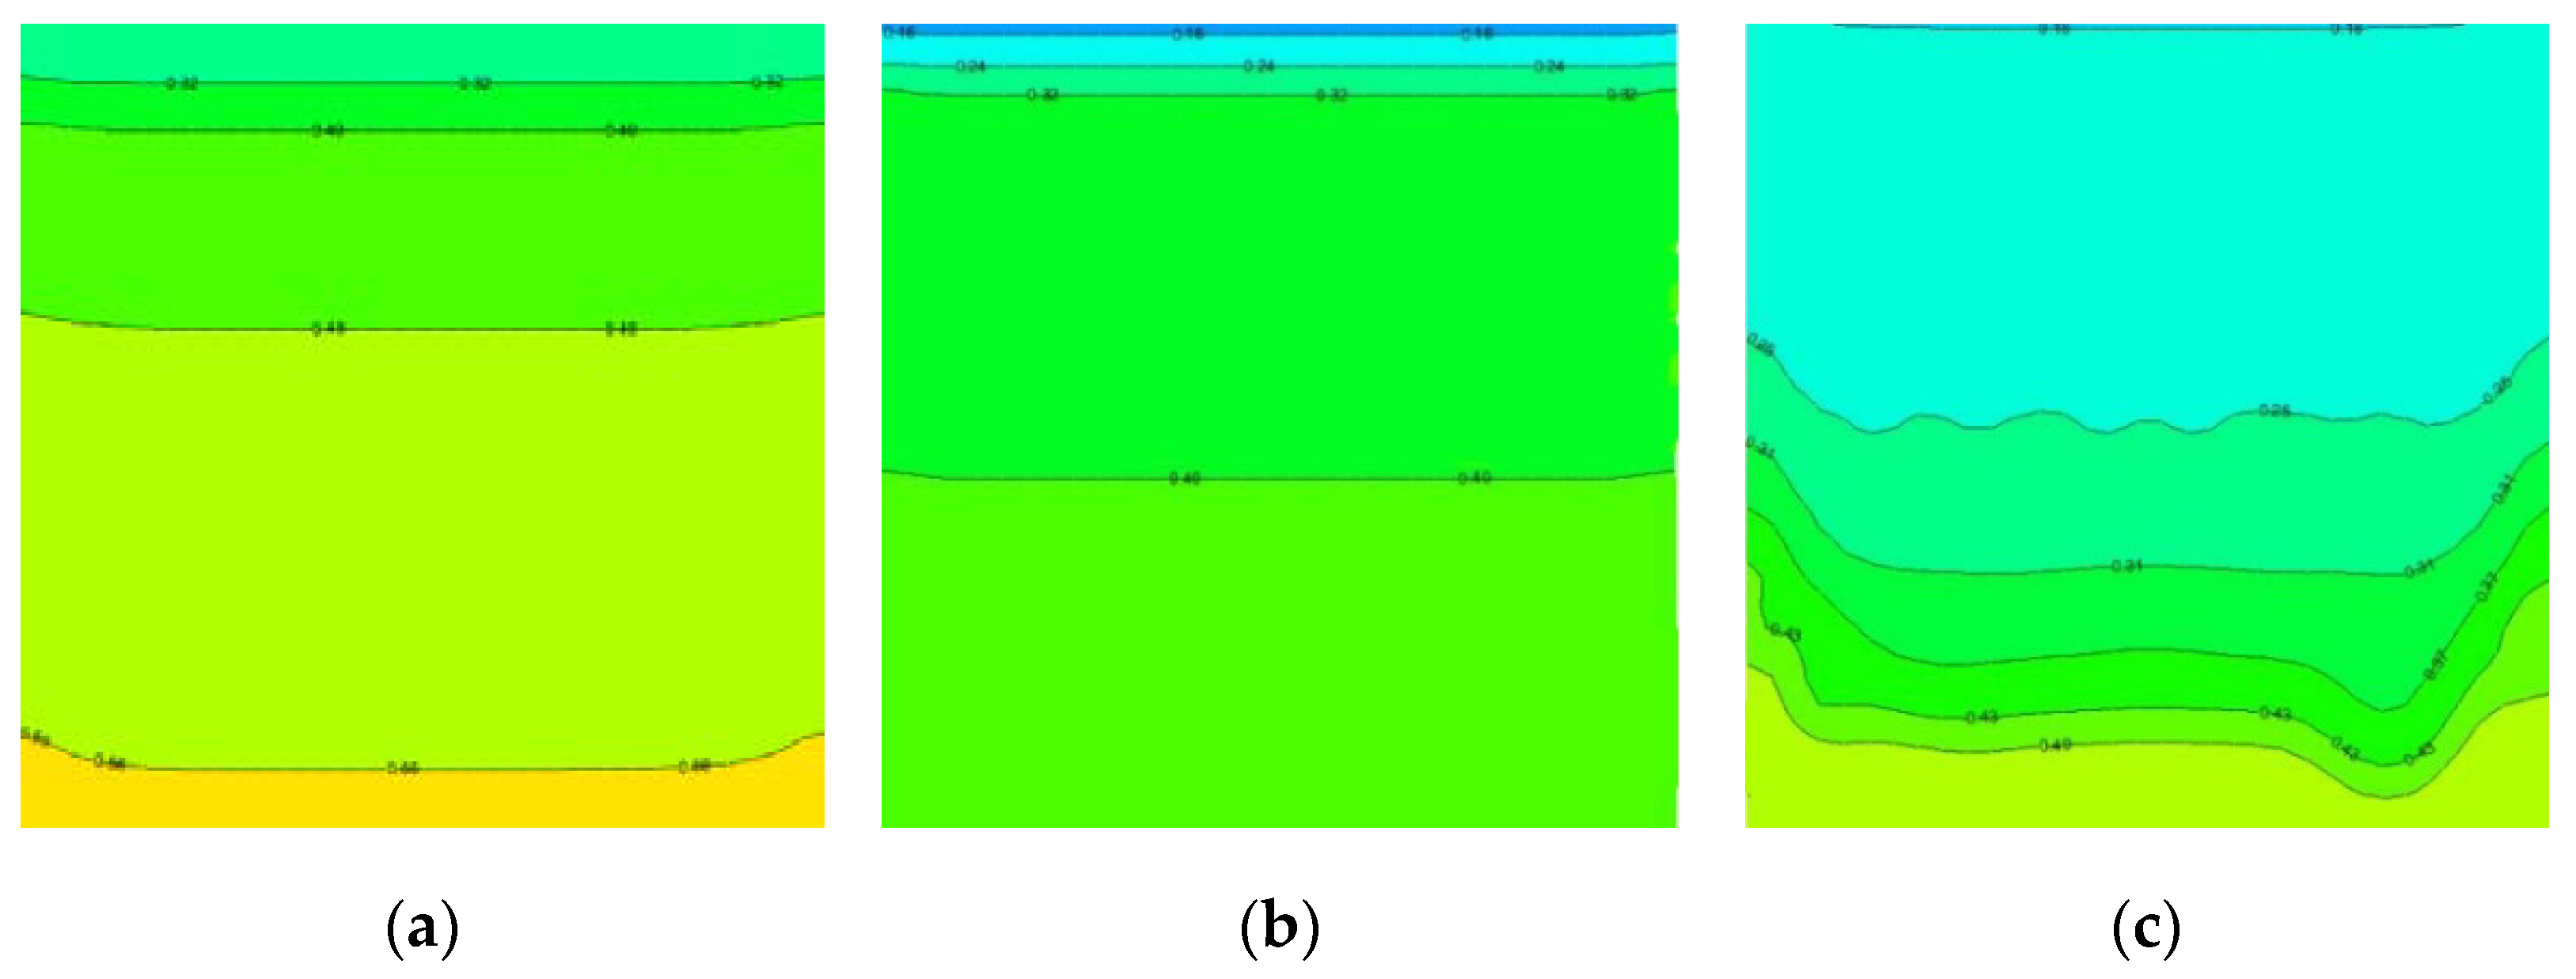
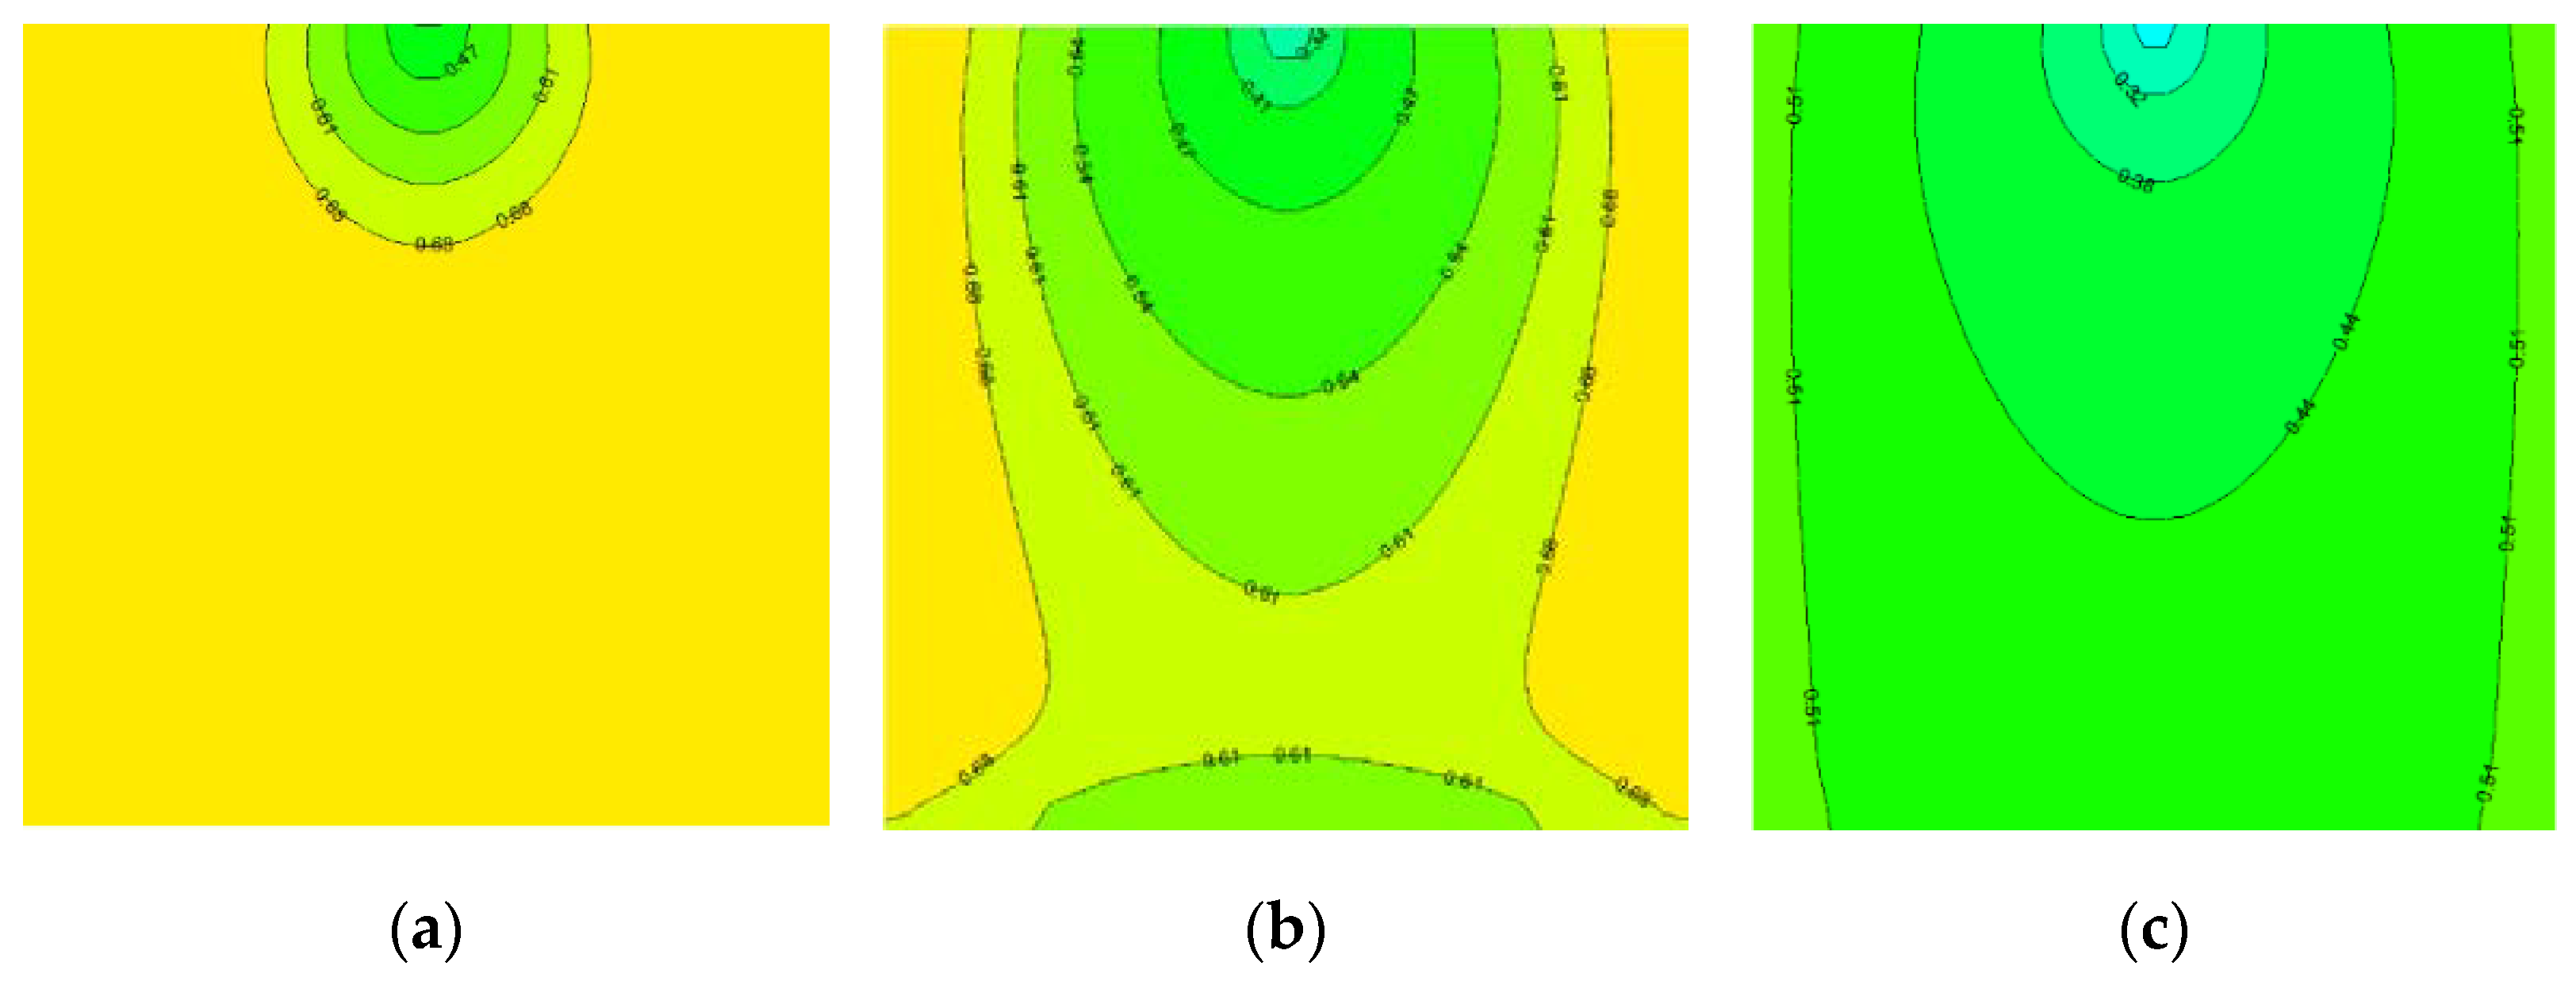
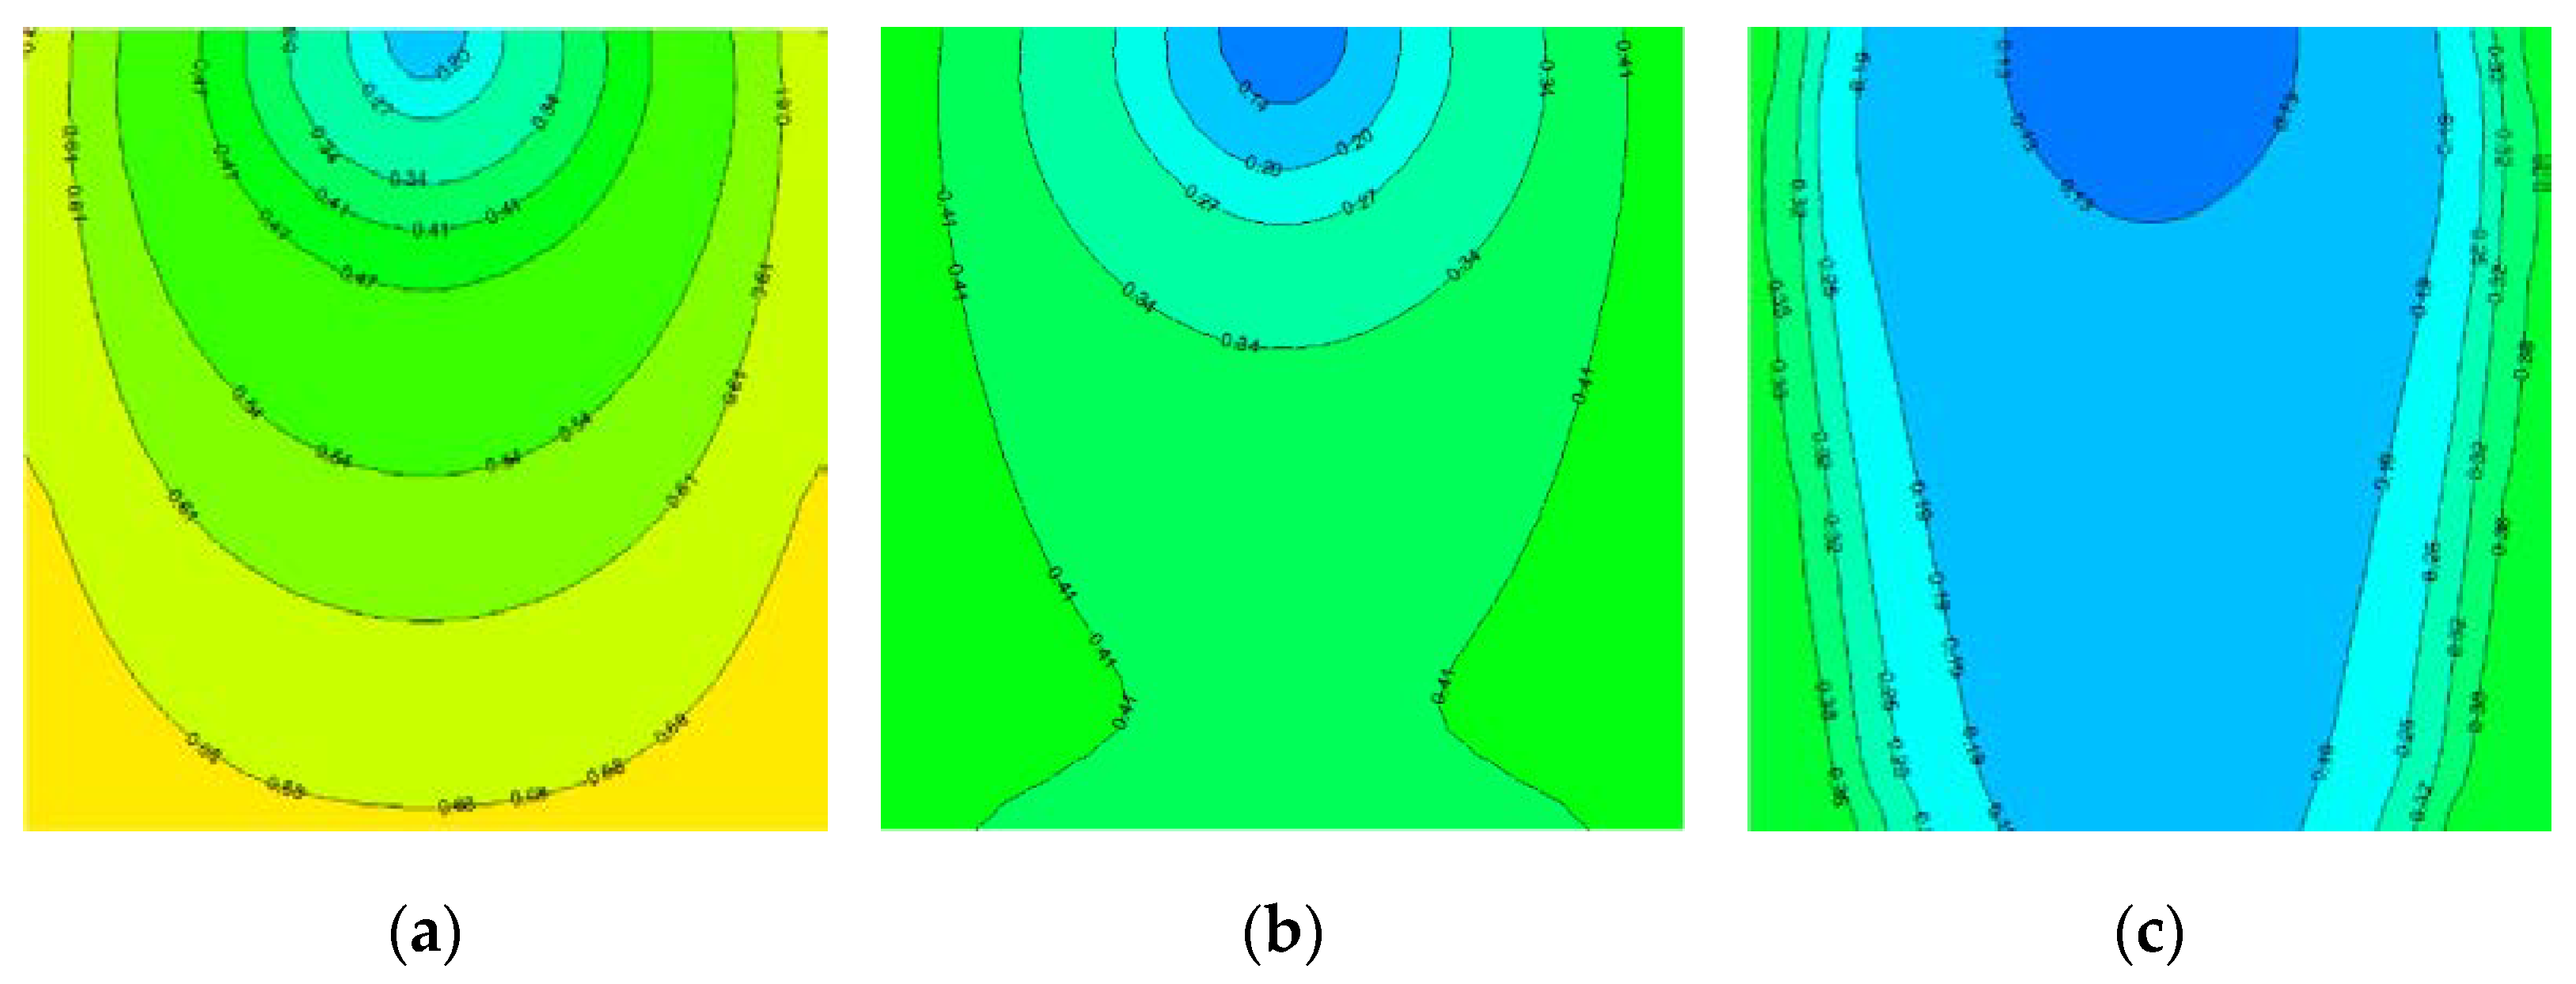
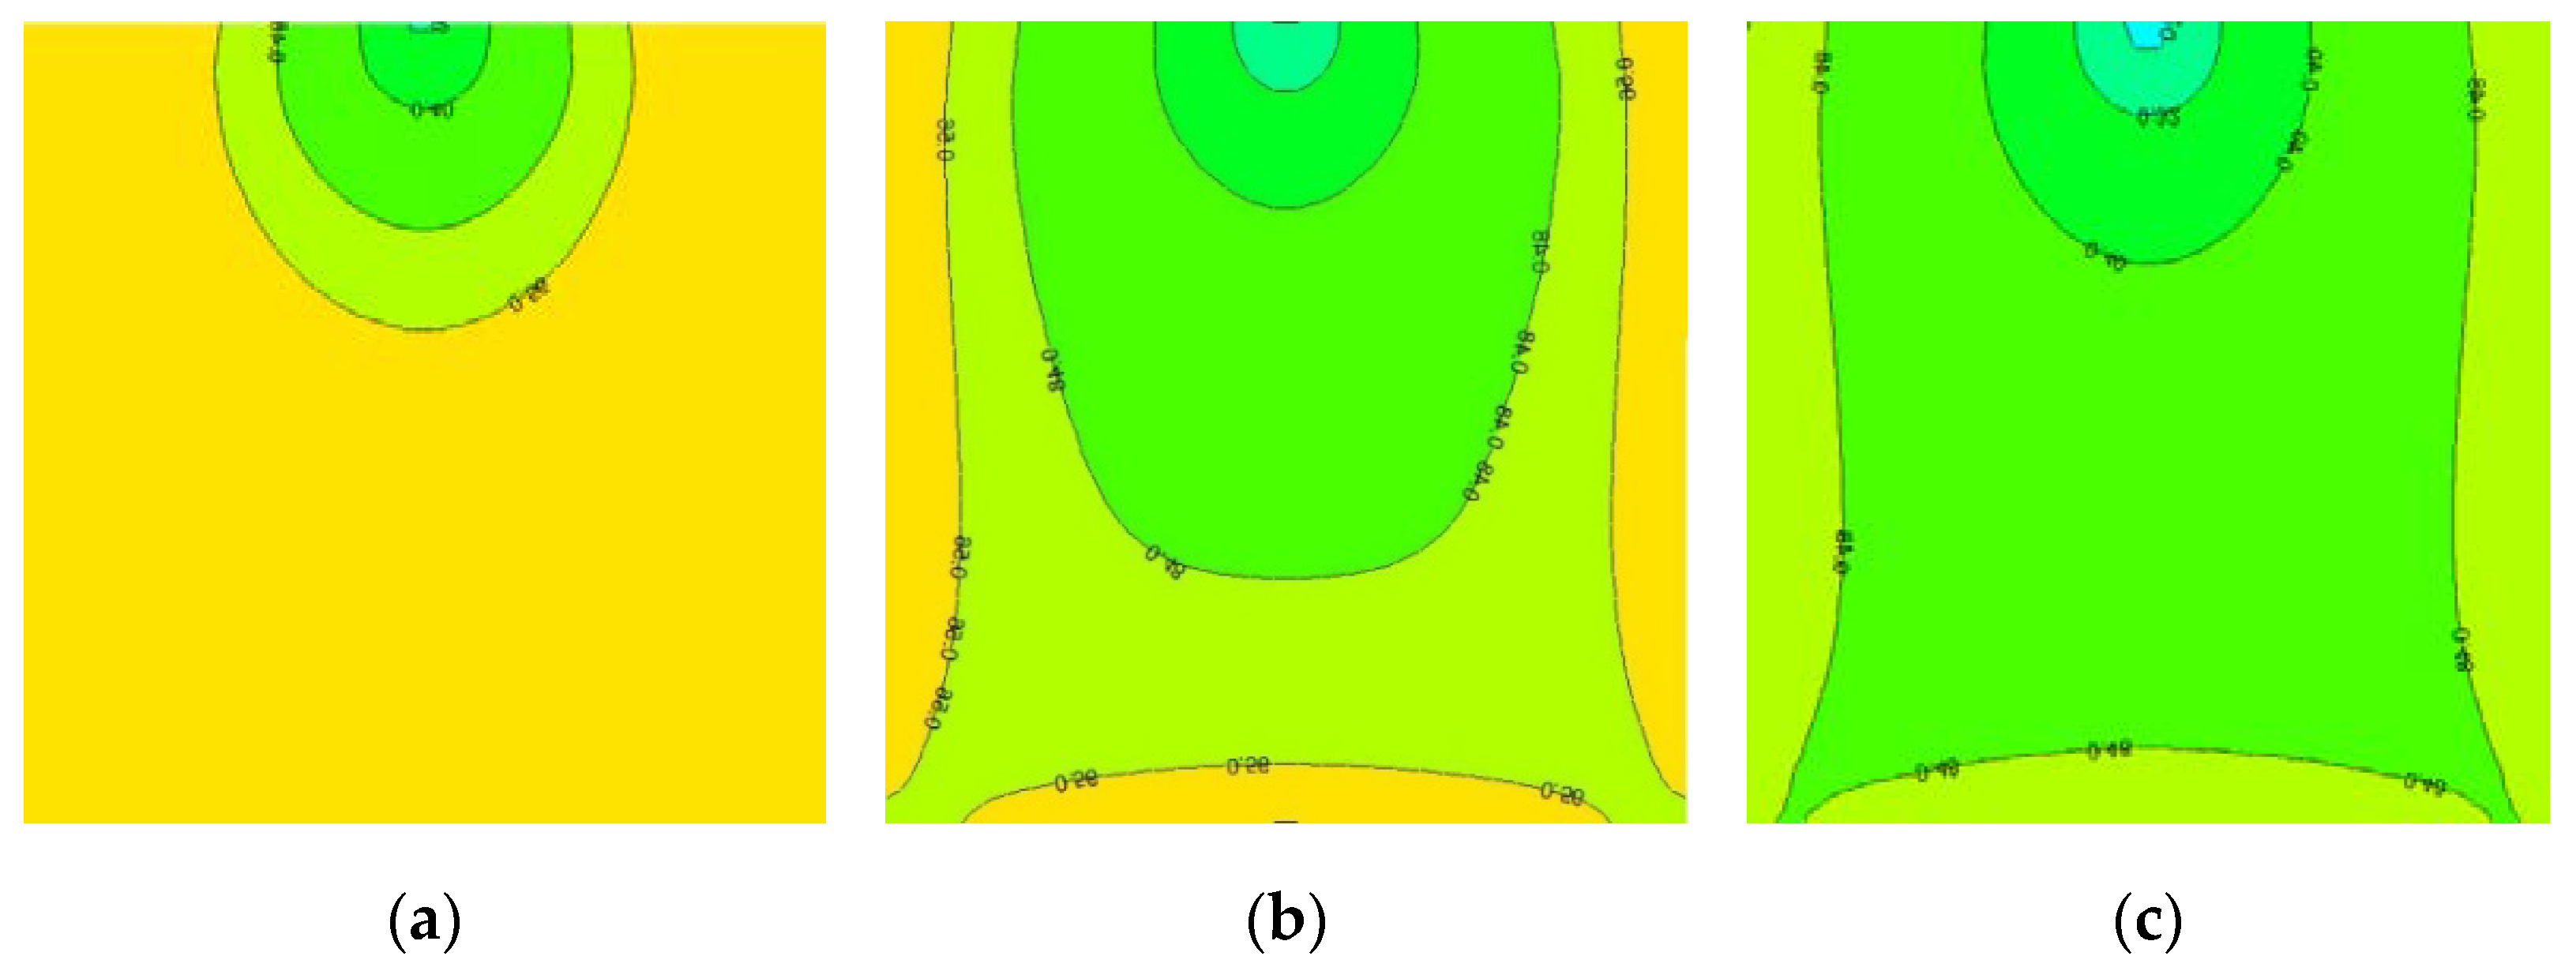
- In the 3D physical simulation models, compared with the vertical and horizontal–vertical combined well patterns, the reduction in the remaining oil saturation after water flooding and different technologies was the largest when using the horizontal well pattern.
- (6)
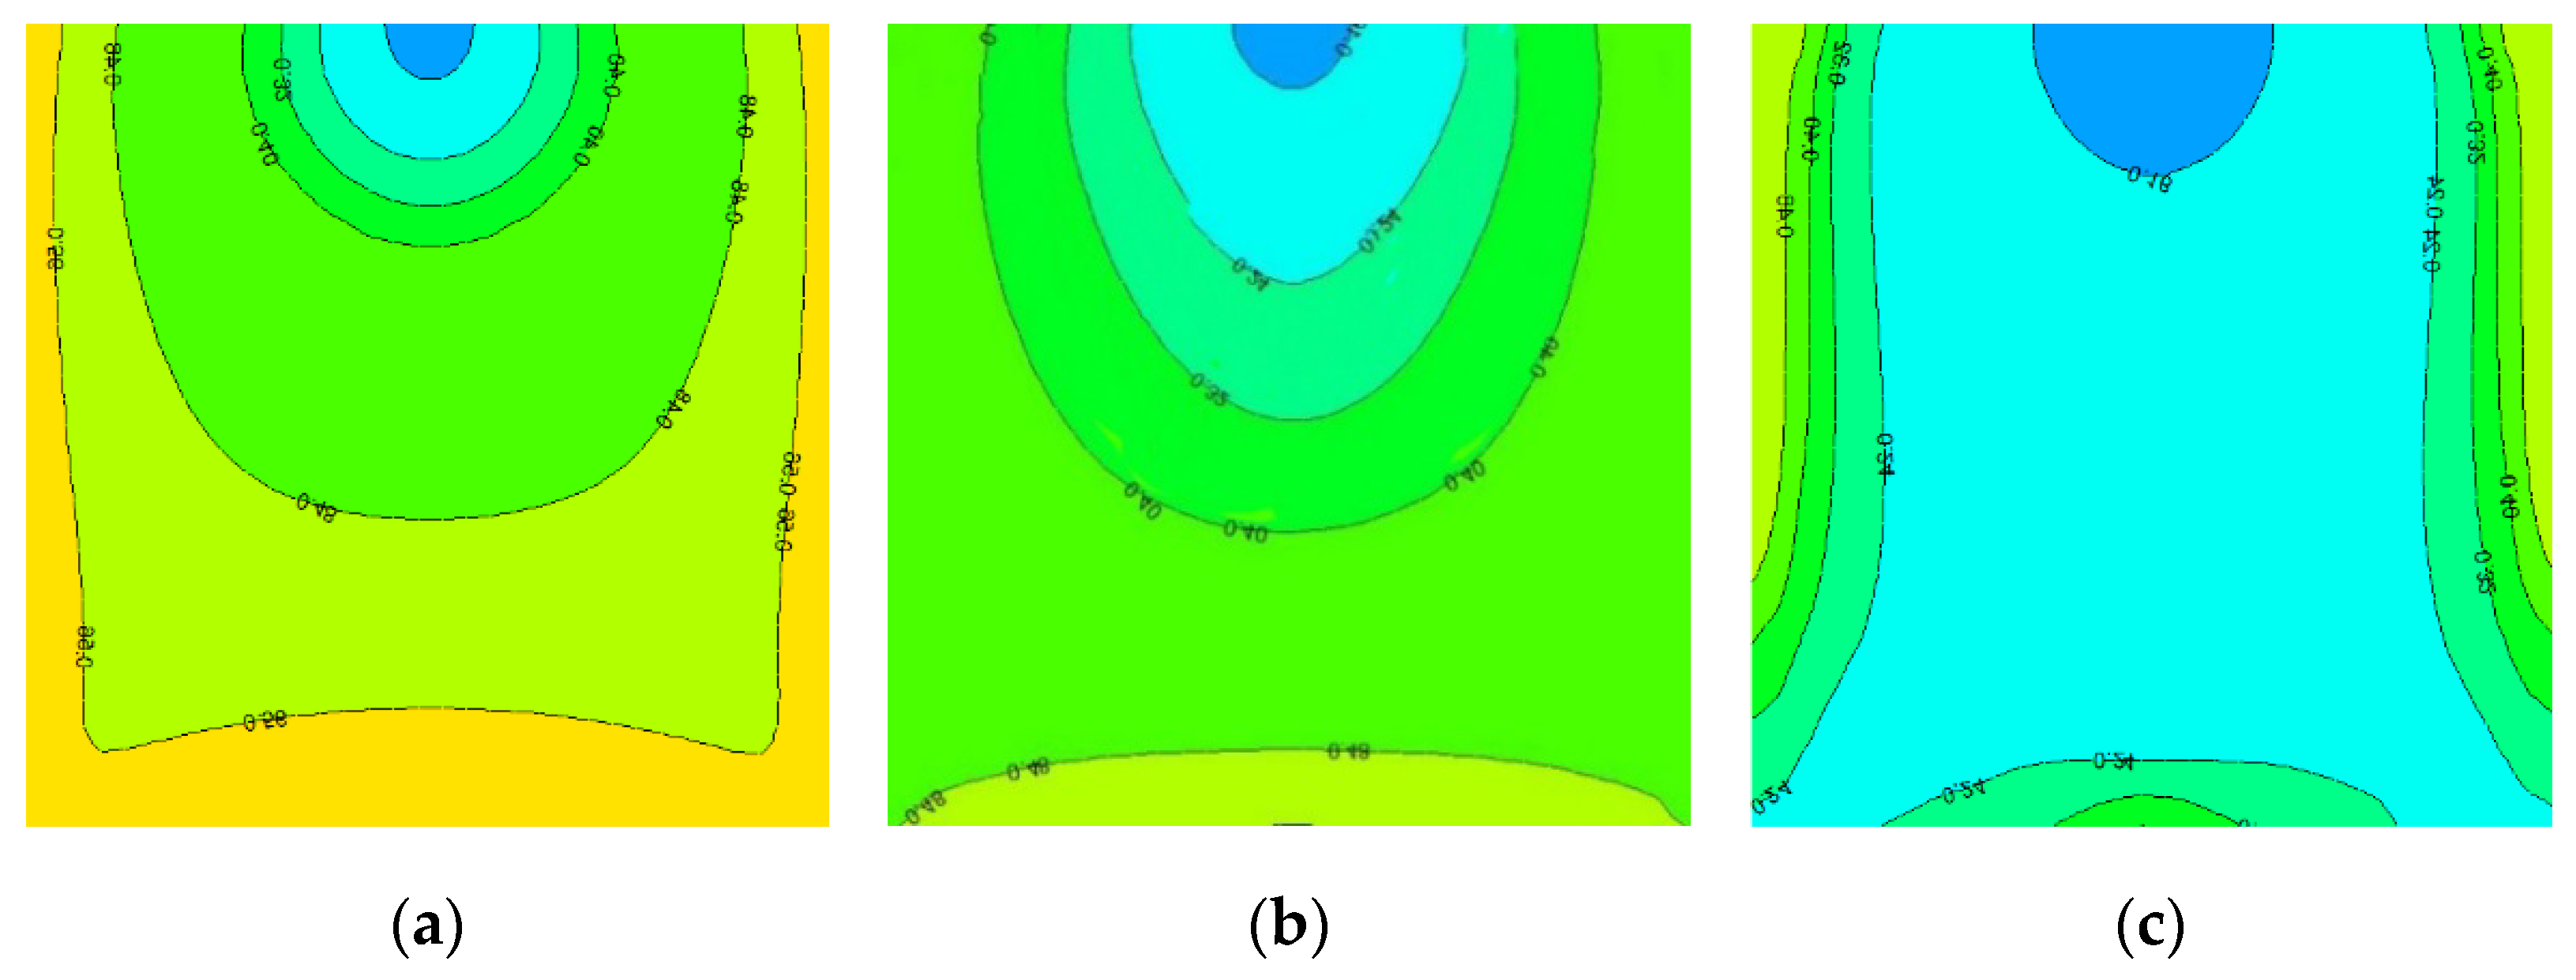
- The monitoring results for the remaining oil distribution showed that the remaining oil after water flooding was mainly distributed in the medium- and low-permeability layers longitudinally and two wings away from the mainstream line on the plane.
Author Contributions
Funding
Conflicts of Interest
References
- Gan, L.; Su, J.; Xie, Y.; Li, C.; He, K.; Lai, Y. Interlayers of meandering river reservoir: A case from Qinhuangdao 32-6 oilfield. Lithol. Reserv. 2017, 29, 128–134. [Google Scholar] [CrossRef]
- Hu, G.; Wang, H.; Fan, T.; Gao, Y.; Chen, F.; Xiao, D.; Zhang, X. Analysis of fluvial compound sand-body architecturehierarchy in offshore oil field. J. Palaeoge 2021, 23, 810–823. [Google Scholar] [CrossRef]
- Hu, G.; Xiao, D.; Fan, T.; Song, L.; Chen, F.; Jing, Y.; Gao, Y. New theory and method of fluvial reservoir architecture study: Concepts, contents and characterization of offshore oilfieldfluvial compound sand-body architecture. J. Palaeoge 2019, 21, 143–159. [Google Scholar] [CrossRef]
- Rovere, M.; Pellegrini, C.; Chiggiato, J.; Campiani, E.; Trincardi, F. Impact of dense bottom water on a continental shelf: An example from the sw adriatic margin. Mar. Geol. 2018, 408, 123–143. [Google Scholar] [CrossRef]
- Wang, T.; Li, H.X.; Li, L.; Chi, H.M.; Zhang, W.Q. Visualization study on the bottom-water coning in large-scale cavity of fracture-cavernous reservoirs. J. Eng. Thermophys. 2012, 33, 989–992. [Google Scholar]
- Hu, G.; Fan, T.; Chen, F.; Jing, Y.; Song, L.; Liang, X.; Xiao, D. Theory of composite sand body architecture and its applicationto oilfield development. Oil Gas Geol. 2018, 39, 1–10. [Google Scholar] [CrossRef]
- Shi, L.; Yu, G.; Yuan, F.; Xue, Y. Experimental method and its application on threshold pressure gradient foroffshore sandstone in heavy oil reservoir: A case study of QHD32-6 oilfield. Pet. Geo Rec. Effi. 2014, 21, 82–85. [Google Scholar] [CrossRef]
- Zhang, G.; Shi, L.; Yu, G.; Lu, C.; Wang, Q.; Zhang, W. Analysis and evaluation on recovery ratio sensibility of the offishoresandstone of heavy oil reservoir-case of QHD32-6 oilfield. Pet. Geo Rec. Effi. 2012, 19, 90–93. [Google Scholar] [CrossRef]
- Zhang, J.; An, G.; Geng, Z.; Zhang, W.; Pan, C. Discussion on high efficient water flooding development mode of the typical continental sedimentary oil-fields in China offshore. China Offshore Oil Gas 2017, 29, 70–77. [Google Scholar] [CrossRef]
- Babu, N.; Lin, P.; Abutaqiya, M.; Sisco, C.; Wang, J.; Vargas, F. Systematic investigation of asphaltene deposition in wellbore and near-wellbore region of a deepwater oil reservoir under gas injection. part 2: Computational fluid dynamics modeling of asphaltene deposition. Energy Fuels 2018, 33, 3645–3661. [Google Scholar] [CrossRef]
- Kumar, M.; Hoang, V.; Satik, C.; Rojas, D. High mobility ratio water flood performance prediction: Challenges and new insights. SPE Reserv. Eval. Eng. 2008, 11, 186–196. [Google Scholar] [CrossRef]
- Haghshenas, M.; Sepehrnoori, K.; Bryant, S.; Farhadinia, M. Modeling and Simulation of Nitrate Injection for Reservoir-Souring Remediation. SPE J. 2012, 17, 817–827. [Google Scholar] [CrossRef]
- Ali, M.; Ali, M.; Riyaz, K.; Mohammad, H. Pore-Scale Monitoring of Wettability Alteration by Silica Nanoparticles During Polymer Flooding to Heavy Oil in a Five-Spot Glass Micromode. Transp. Porous Med. 2011, 87, 653–664. [Google Scholar] [CrossRef]
- Son, H.; Kim, H.; Lee, G.; Kim, J.; Sung, W. Enhanced oil recovery using nanoparticle-stabilized oil/water emulsions. Korean J. Chem. Eng. 2014, 31, 338–342. [Google Scholar] [CrossRef]
- Forsythe, J.; Kenyon-Roberts, S.; O’Donnell, M.; Betancourt, S.; Masurek, N.; Gisolf, A.; Bennett, B.; Nelson, R.; Canas, J.; Reddy, C.; et al. Biodegradation and water washing in a spill-fill sequence of oilfields. Fuel 2019, 23, 707–719. [Google Scholar] [CrossRef]
- Cao, W.; Xie, K.; Lu, X.; Liu, Y.; Zhang, Y. Effect of Profile-Control Oil-Displacement Agent on Increasing Oil Recovery and Its Mechanism. Fuel 2019, 237, 1151–1160. [Google Scholar] [CrossRef]
- Xie, K.; Cao, B.; Lu, X.; Zhang, Y.; Li, Q.; Song, K.; Liu, J.; Wang, W.; Lv, J.; Na, R. Matching Between the Diameter of the Aggregates of Hydrophobically Associating Polymers and Reservoir Pore-Throat Size during Polymer Flooding in an Offshore Oilfield. J. Pet. Sci. Eng. 2019, 177, 558–569. [Google Scholar] [CrossRef]
- Xie, K.; Lu, X.; Li, Q.; Jiang, W.; Yu, Q. Analysis of Reservoir Applicability of Hydrophobically Associating Polymer. SPE J. 2016, 21, 1–9. [Google Scholar] [CrossRef]
- Cao, B.; Lu, X.; Xie, K.; Ding, H.; Xiao, Z.; Cao, W.; Zhou, Y.; He, X.; Li, Y.; Li, H. The pore-scale mechanisms of surfactant-assisted spontaneous and forced imbibition in water-wet tight oil reservoirs. J. Pet. Sci. Eng. 2022, 213, 110371. [Google Scholar] [CrossRef]
- Zhu, D.; Hou, J.; Chen, Y.; Zhao, S.; Bai, B. In Situ Surface Decorated Polymer Microsphere Technology for Enhanced Oil Recovery in High-Temperature Petroleum Reservoirs. Energy Fuels 2018, 32, 3312–3321. [Google Scholar] [CrossRef]


| API gravity (60 °C) | 14.3~17.3 |
| Viscosity at surface (50 °C)/mPa·s | 286~1113 |
| Paraffin content/W% | 2.88 |
| Gum content/W% | 24~25 |
| Sulfur content/W% | 3.62 |
| Ionic Composition | Na+ | Ca2+ | Mg2+ | Cl− | SO42− | CO32− | HCO3− | Total |
|---|---|---|---|---|---|---|---|---|
| Mineralization (mg/L) | 921.72 | 75.1 | 7.5 | 737.5 | 12.6 | 61.6 | 1077.7 | 2893.7 |
| Strength Grade | Characteristic |
|---|---|
| A | No continuous gel formation. The viscosity of the solution is the same as that of the polymer solution without crosslinking agent, but there may be some unadhesive, large gel blocks in the solution. |
| B | Highly flowing gel. The viscosity of the gel is slightly increased compared to that of the polymer solution without crosslinking agent. |
| C | Flowing gel. When the bottle is inverted, most of the gel flows to the bottle cap. |
| D | Moderately flowing gel. When the bottle is vertically inverted, only a small part (15–10%) of the gel does not flow easily to the bottle cap. |
| E | Difficult-to-flow gel. When the bottle is vertically inverted, the gel flows slowly to the bottle cap or a large part (>15%) and does not flow to the bottle cap. |
| F | High deformation and non-flowing gel. When the bottle is vertically inverted, the gel cannot flow to the bottle cap. |
| G | Moderate deformation and non-flowing gel. When the bottle is vertically inverted, the gel is deformed to approximately half of it. |
| H | Slightly deformation and non-flowing gel. When the bottle is vertically inverted, only the surface of the gel is slightly distorted. |
| I | Rigid gel. When the bottle is vertically inverted, the surface of the gel does not deform. |
| Time/Day | Particle Size/μm | Expansion Multiple |
|---|---|---|
| 0 | 7.2~11.1 | - |
| 1 | 13.6~16.8 | 1.51~1.89 |
| 3 | 27.1~28.8 | 2.59~3.76 |
| 5 | 35.3~38.0 | 3.42~4.90 |
| 7 | 40.6~48.3 | 4.35~5.64 |
| Time (min) | 15 | 30 | 45 | 60 | 80 | 100 | 120 |
|---|---|---|---|---|---|---|---|
| Interfacial tension (mN/m) | 4.12 × 10⁻¹ | 2.25 × 10⁻¹ | 1.15 × 10⁻¹ | 8.54 × 10⁻² | 5.24 × 10⁻² | 5.11 × 10⁻² | 5.08 × 10⁻² |
| Well Pattern Types | Injection with Horizontal and Production with Vertical Well (Figure 1) | |||
|---|---|---|---|---|
| Injection Stage | Low-Permeability Layer | Medium-Permeability Layer | High-Permeability Layer | |
| End of water flooding stage | 60.8 | 51.7 | 44.9 | |
| End of Cr3+ polymer gel injection stage | 60.4 | 51.3 | 42.7 | |
| End of polymer microsphere injection stage | 58.9 | 42.8 | 37.7 | |
| End of surfactant injection stage | 53.9 | 41.1 | 34.9 | |
| End of subsequent water flooding stage | 48.9 | 34.4 | 25.1 | |
| Changed value compared with water flooding stage | 11.9 | 17.3 | 19.8 | |
| Well Pattern Types | Horizontal Well Pattern (Figure 2) | |||
|---|---|---|---|---|
| Injection Stage | Low-Permeability Layer | Low-Permeability Layer | Low-Permeability Layer | |
| End of water flooding stage | 58.3 | 50.3 | 44.0 | |
| End of Cr3+ polymer gel injection stage | 58.0 | 49.9 | 41.8 | |
| End of polymer microsphere injection stage | 56.6 | 41.5 | 36.5 | |
| End of surfactant injection stage | 51.4 | 39.5 | 33.9 | |
| End of subsequent water flooding stage | 46.2 | 32.1 | 24.0 | |
| Changed value compared with water flooding stage | 12.1 | 18.2 | 20.0 | |
| Well Pattern Types | Injection with Vertical Well and Production with Horizontal Well (Figure 3) | |||
|---|---|---|---|---|
| Injection Stage | Low-Permeability Layer | Low-Permeability Layer | Low-Permeability Layer | |
| End of water flooding stage | 62.1 | 52.0 | 45.2 | |
| End of Cr3+ polymer gel injection stage | 61.7 | 51.7 | 43.2 | |
| End of polymer microsphere injection stage | 60.6 | 44.0 | 38.1 | |
| End of surfactant injection stage | 55.6 | 41.8 | 35.8 | |
| End of subsequent water flooding stage | 50.4 | 34.8 | 26.1 | |
| Changed value compared with water flooding stage | 11.7 | 17.2 | 19.1 | |
| Well Pattern Types | Vertical Well Pattern (Figure 4) | |||
|---|---|---|---|---|
| Injection Stage | Low-Permeability Layer | Low-Permeability Layer | Low-Permeability Layer | |
| End of water flooding stage | 62.4 | 53.4 | 45.5 | |
| End of Cr3+ polymer gel injection stage | 62.1 | 53.1 | 43.3 | |
| End of polymer microsphere injection stage | 61.0 | 45.5 | 39.1 | |
| End of surfactant injection stage | 55.9 | 43.1 | 36.3 | |
| End of subsequent water flooding stage | 51.8 | 36.6 | 27.3 | |
| Changed value compared with water flooding stage | 10.6 | 16.8 | 18.2 | |
Publisher’s Note: MDPI stays neutral with regard to jurisdictional claims in published maps and institutional affiliations. |
© 2022 by the authors. Licensee MDPI, Basel, Switzerland. This article is an open access article distributed under the terms and conditions of the Creative Commons Attribution (CC BY) license (https://creativecommons.org/licenses/by/4.0/).
Share and Cite
Fan, H.; Wang, X.; Cao, W.; Yan, K.; Xie, K.; Lu, X.; He, M. Influence of Well Pattern Type on Remaining Oil Saturation and Distribution after Development. Energies 2022, 15, 2438. https://doi.org/10.3390/en15072438
Fan H, Wang X, Cao W, Yan K, Xie K, Lu X, He M. Influence of Well Pattern Type on Remaining Oil Saturation and Distribution after Development. Energies. 2022; 15(7):2438. https://doi.org/10.3390/en15072438
Chicago/Turabian StyleFan, Hongjun, Xiabin Wang, Weijia Cao, Kun Yan, Kun Xie, Xiangguo Lu, and Mingwei He. 2022. "Influence of Well Pattern Type on Remaining Oil Saturation and Distribution after Development" Energies 15, no. 7: 2438. https://doi.org/10.3390/en15072438
APA StyleFan, H., Wang, X., Cao, W., Yan, K., Xie, K., Lu, X., & He, M. (2022). Influence of Well Pattern Type on Remaining Oil Saturation and Distribution after Development. Energies, 15(7), 2438. https://doi.org/10.3390/en15072438