Article

Odour Load of Selected Elements of the Technological Line at a Municipal Waste Biogas Plant

Faculty of Building Services, Hydro and Environmental Engineering, Warsaw University of Technology, 20 Nowowiejska Street, 00-653 Warsaw, Poland
*
Author to whom correspondence should be addressed.
Energies 2022, 15(7), 2427; https://doi.org/10.3390/en15072427
Submission received: 31 January 2022 / Revised: 17 March 2022 / Accepted: 22 March 2022 / Published: 25 March 2022
(This article belongs to the Special Issue Sustainable Waste Management and Potential for Waste-to-Energy)

Abstract

:
Technological processes associated with municipal solid waste (MSW) processing are a potential source of odorant emissions, i.e., substances that cause negative olfactory impressions. When released into the atmosphere, these substances can cause odour nuisance complaints from residents. Many scientists have noted the strong relationship between odorant emission sources and odour concentrations and their significant impact on the living comfort of residents near these sources, as well as their social and economic relations. This paper attempts to estimate the odour load of selected elements of the technological sequence of a biogas plant processing municipal waste. Odour load was characterised by four constituents: odorant emissions, odour emissions, the variability of these emissions, and the emission levels per 1 Mg (1000 kg) of waste. The highest odour emissions accompany the storage of mixed MSW, which is associated with a large amount of waste. Limiting the storage time of waste should be an indispensable part of the technological regime. The dominant odorant associated with mixed MSW storage is NH3 emissions. The greatest variability of odorant and odour emissions concerns gases captured from selectively collected waste plastics and metals, due to the varied forms of selective waste collection in the service area, and their unstable efficiency. High variability of NH3 and odour emissions also accompanies digestate dewatering.

1. Introduction

Issues related to sustainable waste management are significant in terms of environmental responsibility [1,2,3]. These issues can be divided into economic, environmental, and social aspects. As far as the economic aspects are concerned, the primary considerations are the profits and losses. Environmental aspects are analysed in terms of the amount of pollution emitted or released into the environment, while social aspects are mainly concerned with the health and wellbeing of the inhabitants [4]. One of the directions of management and simultaneous utilisation of municipal solid waste (MSW) is biological treatment under anaerobic digestion (AD) conditions, combined with capture and cogeneration of biogas produced during the digestion process [5,6]. Sourcing energy from non-conventional sources is vital given the growing demand for energy and the need to reduce fossil fuel consumption and greenhouse gas (GHG) emissions [7,8,9].
Technological processes associated with MSW processing are potential sources of odorant emissions, i.e., substances that cause negative olfactory impressions [10,11,12]. When released into the atmosphere, these substances can cause odour nuisance complaints from residents [13,14]. According to Turin and Yoshii [15], odorants are characterised by properties such as volatility, hydrophobicity, and a molecular weight of less than about 300 g/mol. The odour impact of waste treatment plants is mainly influenced by such factors as the technology used, type of waste, technological regime, the occurrence of failure of technological lines or their elements, temperature, and relative humidity of the air, as well as compliance of plant employees with the technological regime [16,17,18].
A literature review indicates that researchers are very interested in the topic of odour emissions. In their study, Schauberger et al. [19] used the reverse dispersion technique to determine the odour emission rate from pollution sources. On the other hand, Giungato et al. [20] studied the odour emitted from waste treatment plants using an electronic nose, gas chromatography–mass spectrometry, and dynamic olfactometry. In their work, Henault-Ethier et al. [21] proposed a dynamic system model considering odour emission rates and social, economic, and environmental aspects. Toledo et al. [22] presented a novel approach for determining odour concentrations for different sources using dynamic olfactometry to develop odour management, identifying critical odour points in an urban agglomeration. This assessment can identify the most odorous areas and develop effective strategies to minimise malodorous emissions in the urban environment. Many scientists note the strong correlation between odorant emission sources and odour concentrations and their significant impact on the quality of life of residents living in areas near these sources, as well as their social and economic relations [23,24,25,26,27,28,29,30,31].
Several papers can be found in the literature on odour load [32,33,34,35,36,37]. The odour load presented therein is understood in various ways, including characterisation of the dispersion of odour substances described by simulation models [32]; odour emission and immission characterised by field inspections, olfactometric tests, and diffusion calculations [33]; odour concentration [34]; the combination of field inspections, olfactometric measurements, and dispersion calculations [35]; correlation of odour index and odour stimulation level, allowing the development of an odour load map of the analysed area [36]; or the impact of odorants on odour concentration (through multiple regression analysis) [38]. The common denominator of these works is the understanding of odour load as an essential issue in planning new housing development near industrial plants, aiding in the reduction in the risk of odour nuisance among residents in the future.
This study attempts to estimate the odour load on selected elements of the technological line of a biogas plant processing municipal waste (MWBP). Odour load was characterised by four constituents: odorant emissions, odour emissions, these emissions’ variability, and emission levels per 1 Mg (1000 kg) of waste. The emission level per 1 Mg of waste was determined based on the emission values obtained from individual emitters at the biogas plant under study and the quantities of waste treated at individual stages of the process line.

2. Materials and Methods

2.1. Object Characteristics

The research was carried out at an MWBP located in the southern part of Poland. The facility is an installation of mechanical and biological processing run by the Ministry of the Interior. In the biological part, anaerobic treatment is applied to biodegradable waste mechanically separated from the mixed waste stream (undersize fraction < 80 mm). Raw waste delivered to the plant is stored in a dedicated hall that, apart from mixed waste, also houses waste collected selectively (dry fraction). In the storage hall, a unit operation is also carried out in the form of tearing bags and transporting waste to the mechanical processing hall equipped with a system of separators, conveyors, and screens. Two elements of the process line were analysed in the tested facility: the waste unloading and storage hall, and the digestate-dewatering hall, equipped with ventilation systems, with the launchers located on the plant’s roof. Figure 1 shows a simplified diagram of the waste unloading and storage hall.
As a result of unit operations in the mechanical processing hall, the biodegradable fraction is separated from the mixed waste stream and directed to two independent storage tanks, before the fermentation process is carried out in two parallel fermentation chambers. The input material is subjected to anaerobic stabilisation in fermentation chambers for 21 days, followed by two-stage dewatering using a press and a centrifuge in the digestate dewatering hall. Press and centrifuge effluents are directed to separate tanks, and the “dry” digestate is subjected to aerobic stabilisation. Figure 2 shows a simplified diagram of the digestate dewatering hall.

2.2. Waste Streams

The service area of the analysed biogas plant is primarily the city of Kielce and rural areas in the Świętokrzyskie Voivodeship. The research was conducted in the biogas plant facilities, where mixed municipal waste, as well as plastics and metals (dry fractions), are stored and processed.
The amounts of mixed MSW, selectively collected MSW (metals and plastics), and undersize fraction < 80 mm (fraction directed to each fermentation chamber) are kept at a constant level of 200 Mg, 30 Mg and 12 Mg, respectively.
The share of individual fractions of waste collected and selectively delivered to the analysed treatment plant (based on the monthly balances prepared there) is shown in Table 1—the codes (a six-digit number) describe the different types of waste and their source, in line with the European waste classification (Commission notice on technical guidance on the classification of waste [39]).
Mixed municipal waste delivered to the analysed plant is not tested there. Its morphological composition can be determined based on the Voivodship Waste Management Plan for the Świętokrzyskie Voivodship [40], which is presented in Table 2.

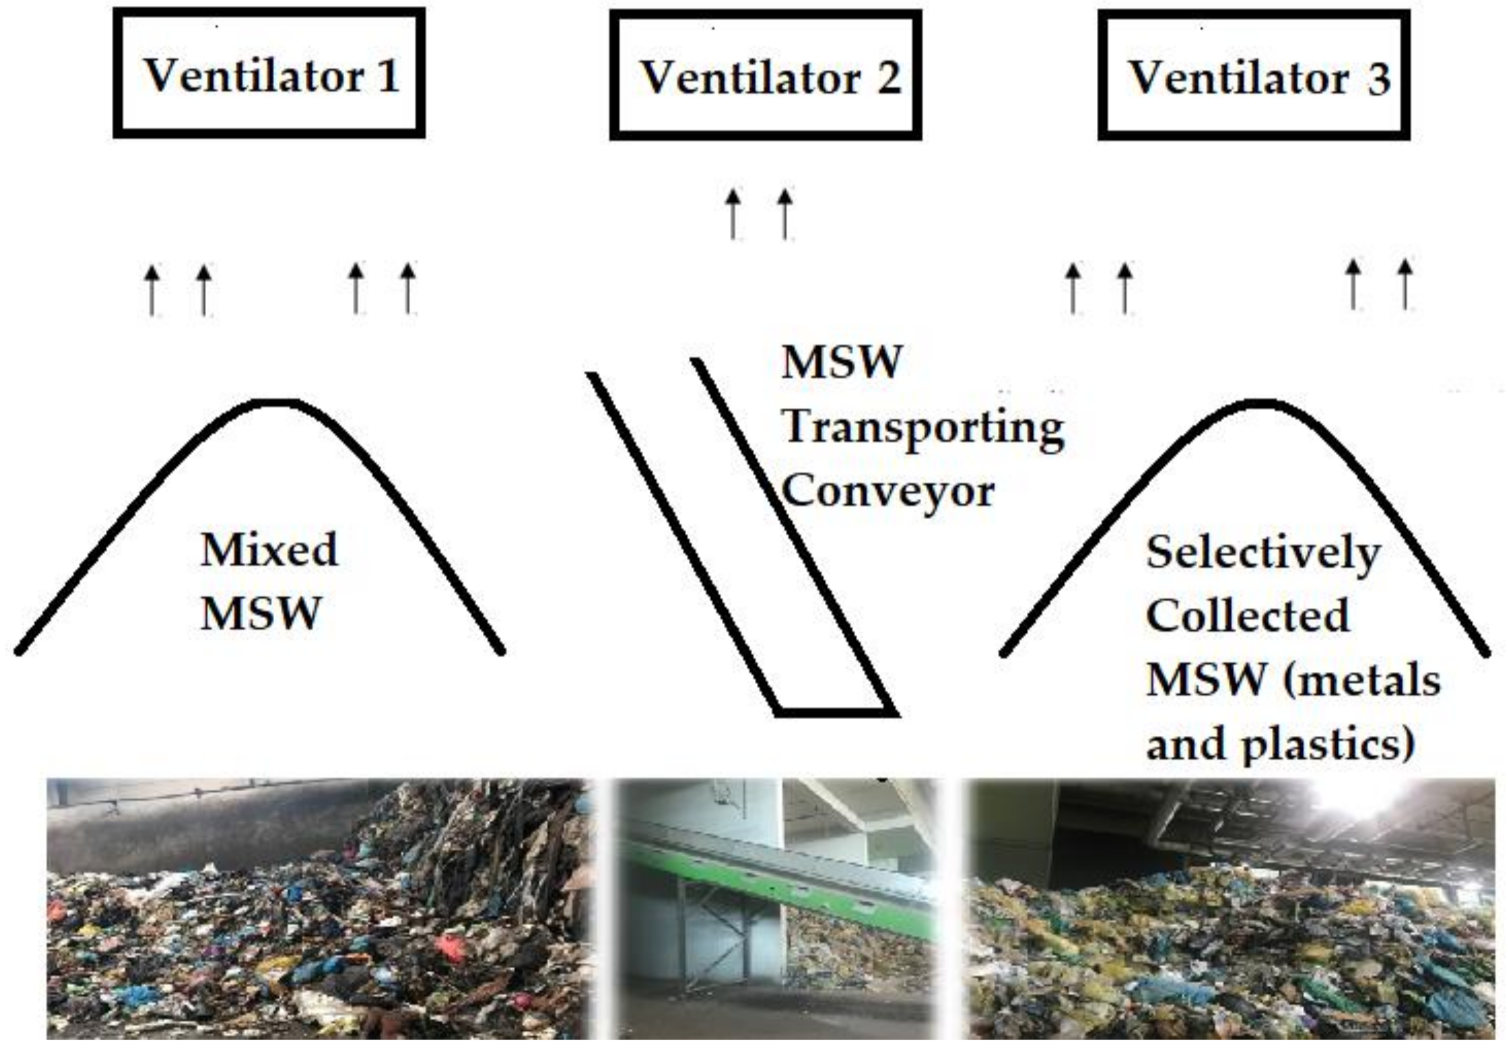
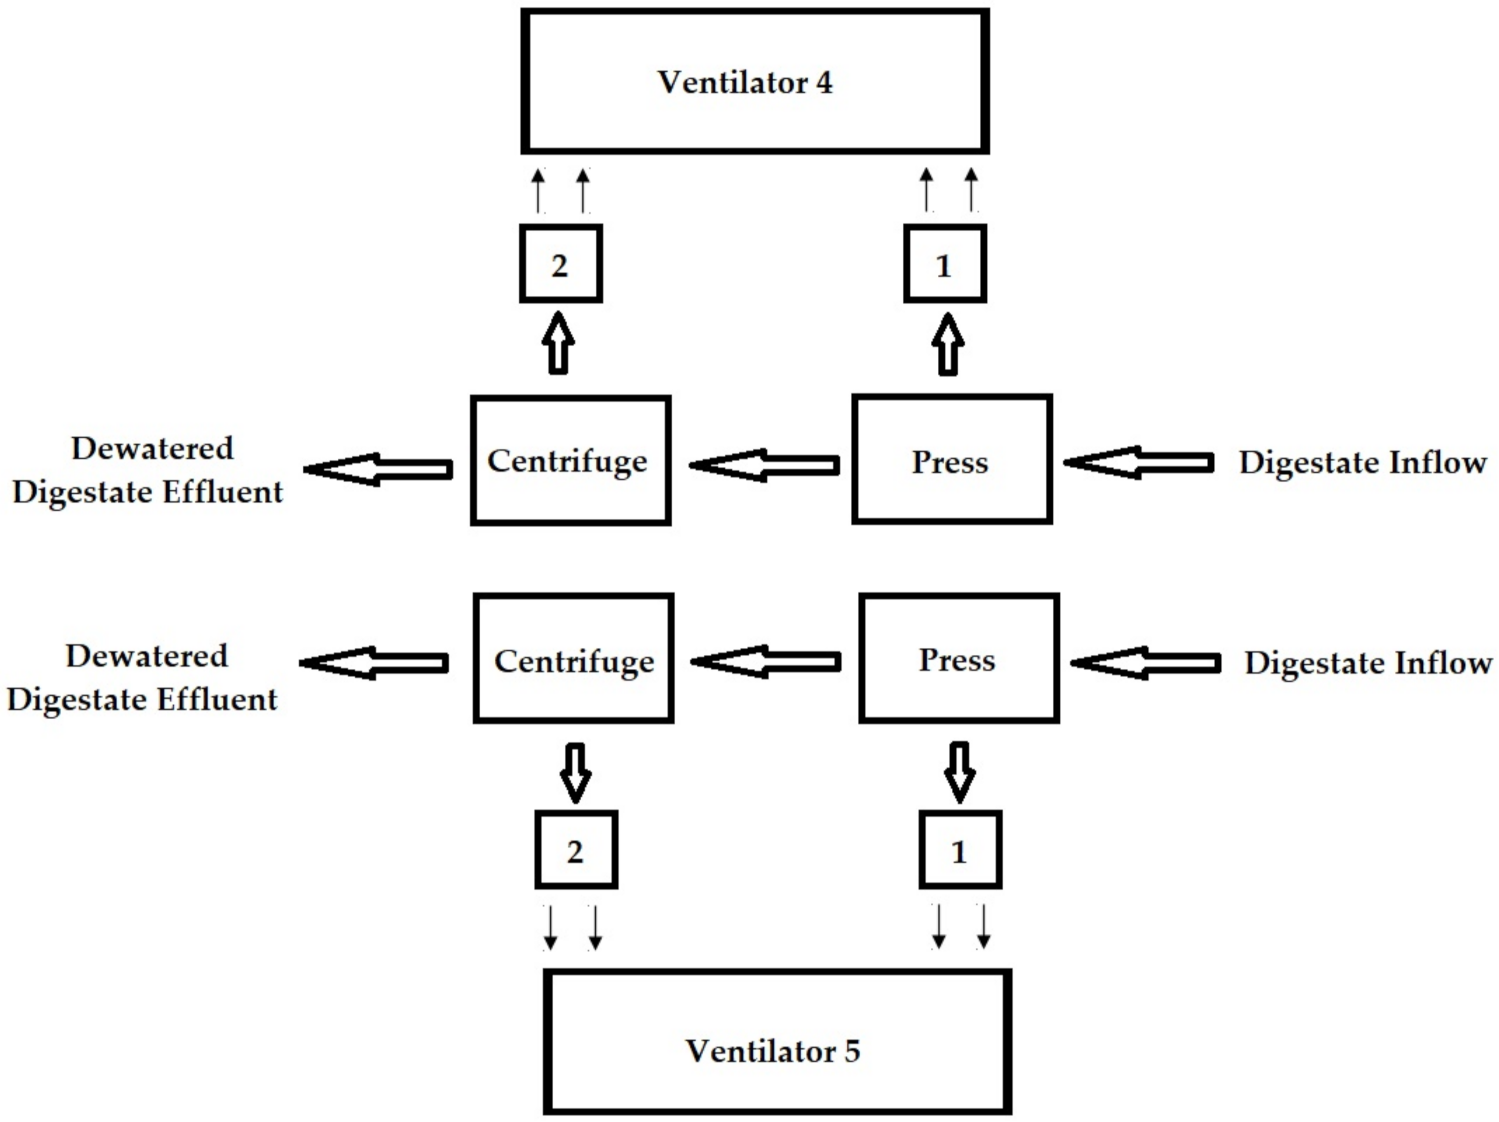
2.3. Measurement Points

Five measuring points were selected at the analysed plant, located on exhaust ventilation systems, with ventilator exhaust launchers mounted on the plant’s roof. Three of these remove air from the unloading and storage hall for waste delivered to the plant, and two remove air from the digestate dewatering hall. Table 3 shows the characteristics of individual ventilator-measuring points.
The tests were carried out in 15 measurement series in 2019–2020. Table 4 presents the research schedule and average temperatures and relative humidity in the halls, from which the process gases are directed to roof ventilators (V1–V5). These microclimatic parameters were measured at a height of 1.5 m by means of a Kestrel 4500 NV Weather Meter.

2.4. Determination Methodology

2.4.1. Chemical Determinations

Tests of pollutant concentration include chemical and olfactometric determinations. A portable MultiRAE Pro multi-gas detector (RAE Systems, Inc., San Jose, CA, USA) was used to conduct chemical determinations of ammonia (NH3), hydrogen sulphide (H2S), and methanethiol (CH3SH). The determinations were performed in five replications. Detailed characteristics of the sensors are presented in Table 5.

2.4.2. Olfactometric Determinations

Olfactometric determinations were made using a Nasal Ranger® field olfactometer (St. Croix Sensory Inc. of Lake Elmo, Minnesota), which is equipped with a sort of gas mask with two activated carbon filters, in which a known portion of the inhaled air can bypass the filters, and there is a control valve that allows the selection of one of six dilution multiples of the clean air stream with contaminated air (dilution to the threshold (D/T)). The olfactometer has two interchangeable control valves with the following D/T values:
(1)
2, 4, 7, 15, 30, 60 (accuracy and reproducibility of ±10%);
(2)
60, 100, 200, 300, 400, 500 (accuracy and reproducibility of ±5%).
In addition to the indicated dilution times, each valve is equipped with a blank position (during its use, the entire inhaled air stream is cleaned by the activated carbon filter). The device is also equipped with a sensor of the flow velocity of inhaled air, with an indicator informing that the recommended level of 16–20 dm3/min has been reached. The assessor gradually increases the proportion of the stream bypassing the filters until the odour is perceptible (according to EN 13725: 2003 [38], it is the dilution of ZYES). After calculation, the determined D/T values correspond to the ZITE value defined in [38] (individual estimate of the dilution ratio up to the detection threshold):
Z ITE = Z YES · Z NO 0.5  
The value of the odour concentration c od (ou/m3) is the geometric mean of the set of individual estimates (ZITE; ITE (individual threshold estimation)). At each measuring point, olfactometric measurements were performed in duplicate.

2.4.3. Emission Calculations

Based on the results obtained during chemical and olfactometric tests and data on air flows from individual exhaust ventilators, the emission levels in each measurement series were calculated according to the following Formulas (2)–(7). The gas volume at a temperature of 25 °C was used for the calculation, which is the average value of all measurement series. Considering the range of air temperatures at which the measurements were carried out (22.5–29.6 °C), the differences in the results were minor, and were in the range of 1–5%.
The emission levels per 1 Mg of waste were determined by dividing the average emissions of individual chemical compounds or odours by hourly streams of waste fractions (this is also the amount of waste that is constantly present in the treatment plant).
(1)
Ammonia emissions:
E NH 3 = C NH 3 · M NH 3 · VR 24.45 · 1000
where:
  • C NH 3 —ammonia concentration (ppm)
  • M NH 3 —molecular weight of ammonia in g/mol ( M NH 3 ≈ 17.03 g/mol)
  • 24.45 —the volume (in dm3) of a mole (gram molecular weight) of a gas at 1 atmospheric pressure and 25 °C
  • VR —ventilation rate (m3/h)
  • E NH 3 —ammonia emissions (g/h)
  • 1000—conversion from mg to g
(2)
Hydrogen sulphide emissions:
E H 2 S = C H 2 S · M H 2 S · VR 24.45 · 1000
where:
  • C H 2 S —hydrogen sulphide concentration (ppm)
  • M H 2 S —molecular weight of hydrogen sulphide (g/mol) ( M H 2 S ≈ 34.08 g/mol)
  • 24.45 —the volume (in dm3) of a mole (gram molecular weight) of a gas at 1 atmospheric pressure and 25 °C
  • VR —ventilation rate (m3/h)
  • E H 2 S —hydrogen sulphide emissions (g/h)
  • 1000—conversion from mg to g
(3)
Methanethiol emissions:
E CH 3 SH = C CH 3 SH · M CH 3 SH · VR 24.45 · 1000
where:
  • C CH 3 SH —methanethiol concentration (ppm)
  • M CH 3 SH —molecular weight of methanethiol (g/mol) ( M CH 3 SH ≈ 48.11 g/mol)
  • 24.45 —the volume (in dm3) of a mole (gram molecular weight) of a gas at 1 atmospheric pressure and 25 °C
  • VR —ventilation rate (m3/h)
  • E CH 3 SH —methanethiol emissions (g/h)
  • 1000—conversion from mg to g
(4)
Volatile organic compound emissions:
According to Jia et al. [41], the concentration of VOCs determined with the PID detector is converted from the concentration resulting from the chromatographic determination. As the calibration PID is 10 ppm of isobutylene, the concentration readings are also based on isobutylene. Coy et al. [42] used two gas sampling methods in their research: standard tubes with a carbon sorbent, analysed via gas chromatography (GC-FID), and a direct reading photoionization detector. Linear regression analysis between the log concentrations for the two sampling methods showed a high correlation at r = 0.95, so:
0.95 l n C VOCs   GC = l n C VOCs   PID 0.04
where:
  • C VOCs   PID —the isobutylene-based VOC concentration measured by PID (ppb)
  • C VOCs   GC —the VOC concentration determined by GC (ppb)
  • C GC in μg/m3 can be converted to C GC in ppb using the ideal gas law. Assuming C GC is a toluene-equivalent VOC concentration, VOC emission can be presented as:
    E VOCs = M C 7 H 8 · e l n C VOCs   PID 0.05 0.95 · VR 24.45 · 1,000,000
where:
  • C VOCs   PID —the VOC concentration measured by PID (ppb)
  • M C 7 H 8 —molecular weight of toluene (g/mol) ( M H 2 S ≈ 92.14 g/mol)
  • 24.45 —the volume (in dm3) of a mole (gram molecular weight) of a gas at 1 atmospheric pressure and 25 °C
  • VR —ventilation rate (m3/h)
  • E VOCs —volatile organic compound emissions (g/h)
  • 1,000,000 —conversion from μg to g
(5)
Odour emissions:
E c od = c od · VR
where:
  • VR —ventilation rate (m3/h)
  • E c od —odour emission (ou/h)
  • c od —odour concentration (ou/m3)

2.4.4. Statistical Analysis

The statistical analysis was conducted using Statistica 13 software. These analyses included the mean, median, non-outlier range, outlier values, extremes, lower and upper quartiles, standard deviation (SD), and relative standard deviation (RSD). RSD is the coefficient of variation, which is defined as the ratio of the standard deviation to the mean; the greater the value of the coefficient, the stronger the differentiation. The statistics, including measures of both location and dispersion, are presented in graphical and tabular form.

3. Results and Discussion

Figure 3, Figure 4, Figure 5, Figure 6, Figure 7 and Figure 8 present the emission levels in 15 measurement series at individual points with the abovementioned statistics.
At the first measuring point (Figure 3), the highest emissions were related to NH3 and VOCs. The SD of the mean values of individual emissions is on a similar level.
At the second measuring point (Figure 4), as with the first one, the emissions of VOCs and NH3 dominated. The average H2S and CH3SH emissions were 4.33 g/h and 8.94 g/h, respectively and these results were characterised by the highest SD.
At the third measurement point (Figure 5), as with the two previous ones, the emissions of VOCs and NH3 were dominant. The average H2S and CH3SH emissions were 1.04 g/h and 2.18 g/h, respectively, and these results were characterised by the highest SD.
At the fourth measuring point (Figure 6), only NH3 and VOC emissions were recorded. The SD of the mean value was greater in the case of NH3 emissions.
At the fifth measuring point (Figure 7), as with the fourth one, only NH3 and VOC emissions were recorded. The SD of the mean values for both of these emission results was similar.
The highest odour emissions are related to the first measuring point (storage of mixed MSW). At the same time, these emissions are characterised by the lowest variability. The results of odour emissions at the third and fourth measuring points show the highest SD.
Table 6 shows the odour load characteristics at individual measuring points, indicating for which odorants the average emissions are the highest and the lowest, and for which odorants the variability of emissions is the highest. The lowest and highest odorant emission values were indicated among the average values from 15 measurement series at each given measurement point (shown in Figure 3, Figure 4, Figure 5, Figure 6 and Figure 7).
The dominant odorant accompanying mixed MSW storage was NH3 emissions. VOC emissions dominated at the remaining measuring points. Among all analysed odorants, the lowest emissions from all measurement points were emissions of H2S. There were no H2S and CH3SH emissions from the digestate dewatering hall.
Comparing odorant emissions from all measuring points, the highest value of VOC emissions was associated with the storage of mixed municipal waste. These emissions were lower by 58–67% at the remaining measurement points. On the other hand, the most significant variability of VOC emissions (RSD 104%) concerned gases taken from selectively collected waste, constituting the dry fraction of municipal waste. The cause of this variability was most likely related to the different “purity” of separately collected packaging waste and the changing separate collection systems of these fractions in the service area. This is confirmed by the data from the analysed treatment plant, presenting the composition of plastic waste and metals delivered to the installation (Table 1). The share of plastic packaging in the selectively collected fractions of plastics and metals transferred to the analysed plant in the months when the research was conducted shows a very wide range of 0.2–24%, and the share of mixed packaging is at the level of 75.6–99.4%. Selective collection of composite packaging began in the service area only in June 2020. At the biogas plant analysed in [16], VOC emissions from the waste storage hall were reported at a similar level, in the range of 150–415 g/h (average 298 g/h, RSD 245%). At other biogas plants processing mixed MSW, the VOC emission values from above mixed MSW in the unloading and storage hall were set at a slightly lower level; they were 25–106 g/h (average 54 g/h, RSD 44%) in the case of one biogas plant, and 11–264 g/h (average 102 g/h, RSD 81%) in the case of the second tested biogas installation [17].
The highest value of NH3 emissions was also associated with mixed MSW storage. These emissions were lower by 81–90% at the remaining measurement points. The most significant variability of NH3 emissions applied to gases collected from the digestate dewatering hall (RSD 182%), but only in the case of V4, which was related to the failure of one of the technological fermentation lines. Periodic failures largely influenced the variability of the composition of the captured process gases. A properly working fermentation line (V5) did not cause significant differences. Comparing NH3 emissions from mixed municipal waste in the unloading and storage halls at two biogas plants tested in [17], one of them reported emissions at a similar level—0–415 g/h (average 134 g/h, RSD 105%)—while in the second they were in a much lower range of 0.023–65 g/h (mean 22 g/h, RSD 86%) [17]. The authors of [18] present the scope of NH3 emissions from the municipal waste storage hall of a biogas plant at the level of 230–440 g/h.
The highest value of H2S emissions was associated with the storage of mixed municipal waste. These emissions were lower by 81% to over 99% at the remaining measurement points. The most significant variability of H2S emissions applied to gases collected from the waste collected separately, constituting the dry fraction of municipal waste (RSD 267%), for the same reasons as indicated earlier. No H2S was found in the digestate dewatering hall.
The highest value of CH3SH emissions was also associated with mixed municipal waste storage. These emissions were lower by 97% to over 99% at the other measurement points. No CH3SH was found in the digestate dewatering hall. The tremendous variability of CH3SH emissions (RSD 279%) relates to gases collected from separately collected waste, constituting the dry fraction of municipal waste. No CH3SH was found in the digestate dewatering hall.
The highest odour emissions were also associated with the storage of mixed MSW (17 times higher than the odour emissions from selectively collected waste storage, and about 20 times higher than the odour emissions from the digestate dewatering). These highest odour emissions (for mixed MSW) were accompanied by the lowest variability. This is due to a slight variation in the composition of mixed municipal waste generated in the Świętokrzyskie Voivodeship (presented in Table 2), which is the service area for the analysed biogas plant, and receives municipal waste mainly from the city of Kielce, which is the capital of the voivodeship.
On the other hand, the greatest variability in odour emissions concerned gases from the digestate dewatering plant (RSD 100–189%) and storage places for packaging waste collected selectively (RSD 128%) which, like the variability of odorant emissions, was related to the diversity of these fractions (Table 1). The odorant emissions from various stages of the technological line of the MWBP were also examined in [16,17,18], which concerned the unloading and storage of waste and the mechanical treatment and purification of process gases, and found emission values in the following ranges: for VOCs—25–264 g/h, 12–253 g/h, and 0–153 g/h, respectively; for NH3—0.023–65 g/h, 0.023–271 g/h, and 0–335 g/h, respectively.
An attempt was made to estimate the unit value of odorant emissions per 1 Mg of processed waste. The waste streams, as reported in Section 2.2, were instantaneous streams (streams that are continuously present in the treatment plant) assumed for the calculations. The unit value of NH3 emissions per 1 Mg of MSW was estimated in the range of 1.3–1.6 g/Mg, while for digestate it was determined to be 2.3 g/Mg. The specific VOC emissions per 1 Mg of MSW and 1 Mg of digestate were estimated to be 1.1–3.2 g/Mg and 6.8 g/Mg, respectively. The unit value of odour emission per 1 Mg of mixed MSW was estimated at the level of about 20,000 ou/Mg, while per 1 Mg of dry fraction it was about 8000 ou/Mg. Such differentiation results from a much smaller share of biodegradable fractions in the packages as compared to mixed MSW. The unit value of odour emission per 1 Mg of digestate was determined to be at the level of about 16,500 ou/Mg for V5 (working properly), while it was twice as high for V4 (characterised by failure rate). However, these results are highly dependent on accurately determining the amount of waste present at each stage of the process line.
In [17], the authors focused on the analysis of temperature and relative humidity for odorant concentrations and emissions. The studies were carried out at two municipal waste biogas plants in Poland. The analysis results show a statistically significant relationship between the investigated parameters for the selected elements of the technology series and for the roof exhaust ventilators, which absorb the process gases from the individual halls. A significant correlation between air temperature and VOC concentration/emissions was observed (positive correlation—with increasing temperature the VOC concentration/emission increased). Furthermore, a significant impact of relative humidity on ammonia concentration and emissions was demonstrated (negative correlation—with increasing relative humidity, ammonia concentration/emissions decreased). These relationships point to additional difficulties in the odour load characterisation.

4. Research Limitations and Future Research Work

The main limitation of this analysis was that it was not possible to estimate precise quantities of particular types of waste, which are related to the varied volumetric weight of fractions and to the specifics of plant operation (waste delivery, diversion to treatment, etc.). Moreover, other experiences in this field show that possible microclimatic conditions impact on odour and odorant emissions. Another limitation was the threshold and the range of detection of compounds analysed by the detector, along with the range of determination of odour concentration by the olfactometer. Further research should focus on increasing their frequency for multiple regression analysis, building on the experience of other researchers [33,34,35,36,37,38]. The relatively small dataset obtained in this pilot study makes it impossible to conduct a reliable statistical analysis at this stage.

5. Conclusions

The odour load of various technological line elements at the MWBP is characterised by four constituents: (1) odorant emissions, (2) odour emissions, (3) the variability of these emissions, and (4) emission levels per 1 Mg of waste. This study identified the odour load of the waste storage hall (for mixed MSW and waste plastics and metals) and digestate dewatering hall.
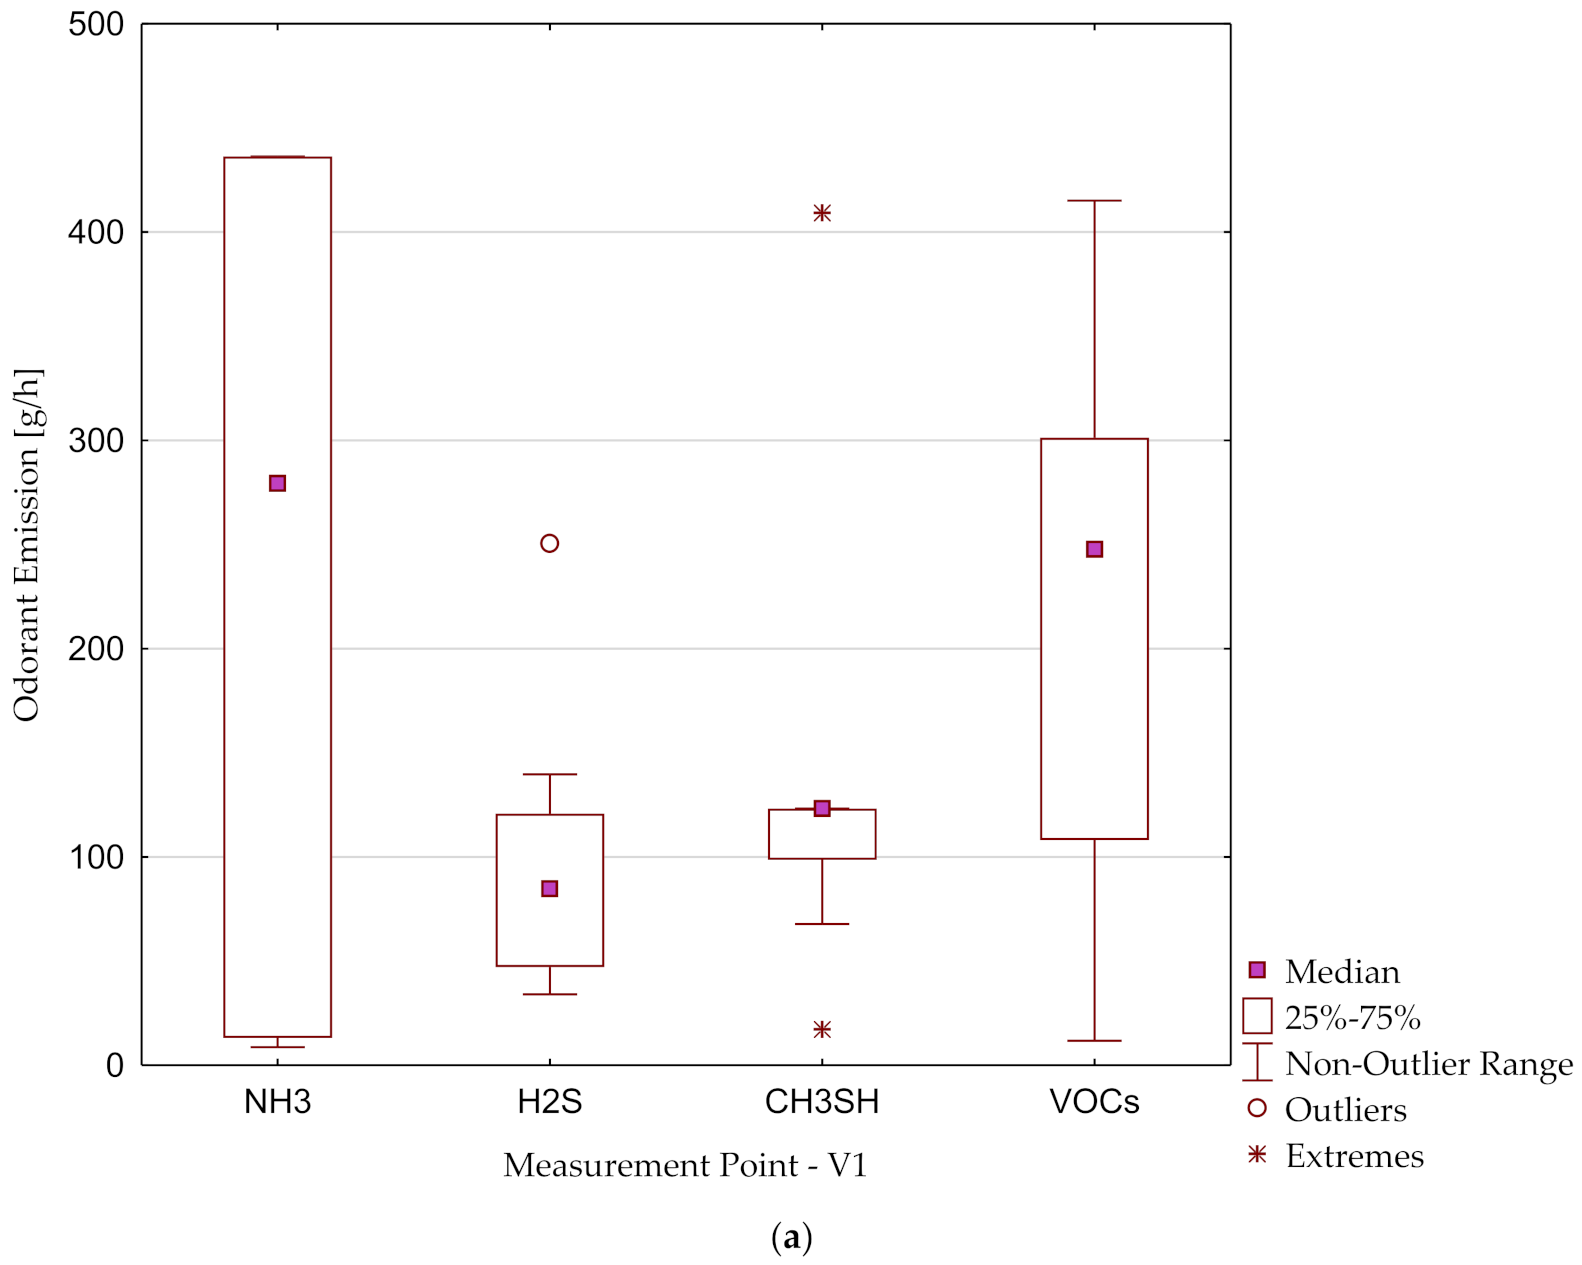
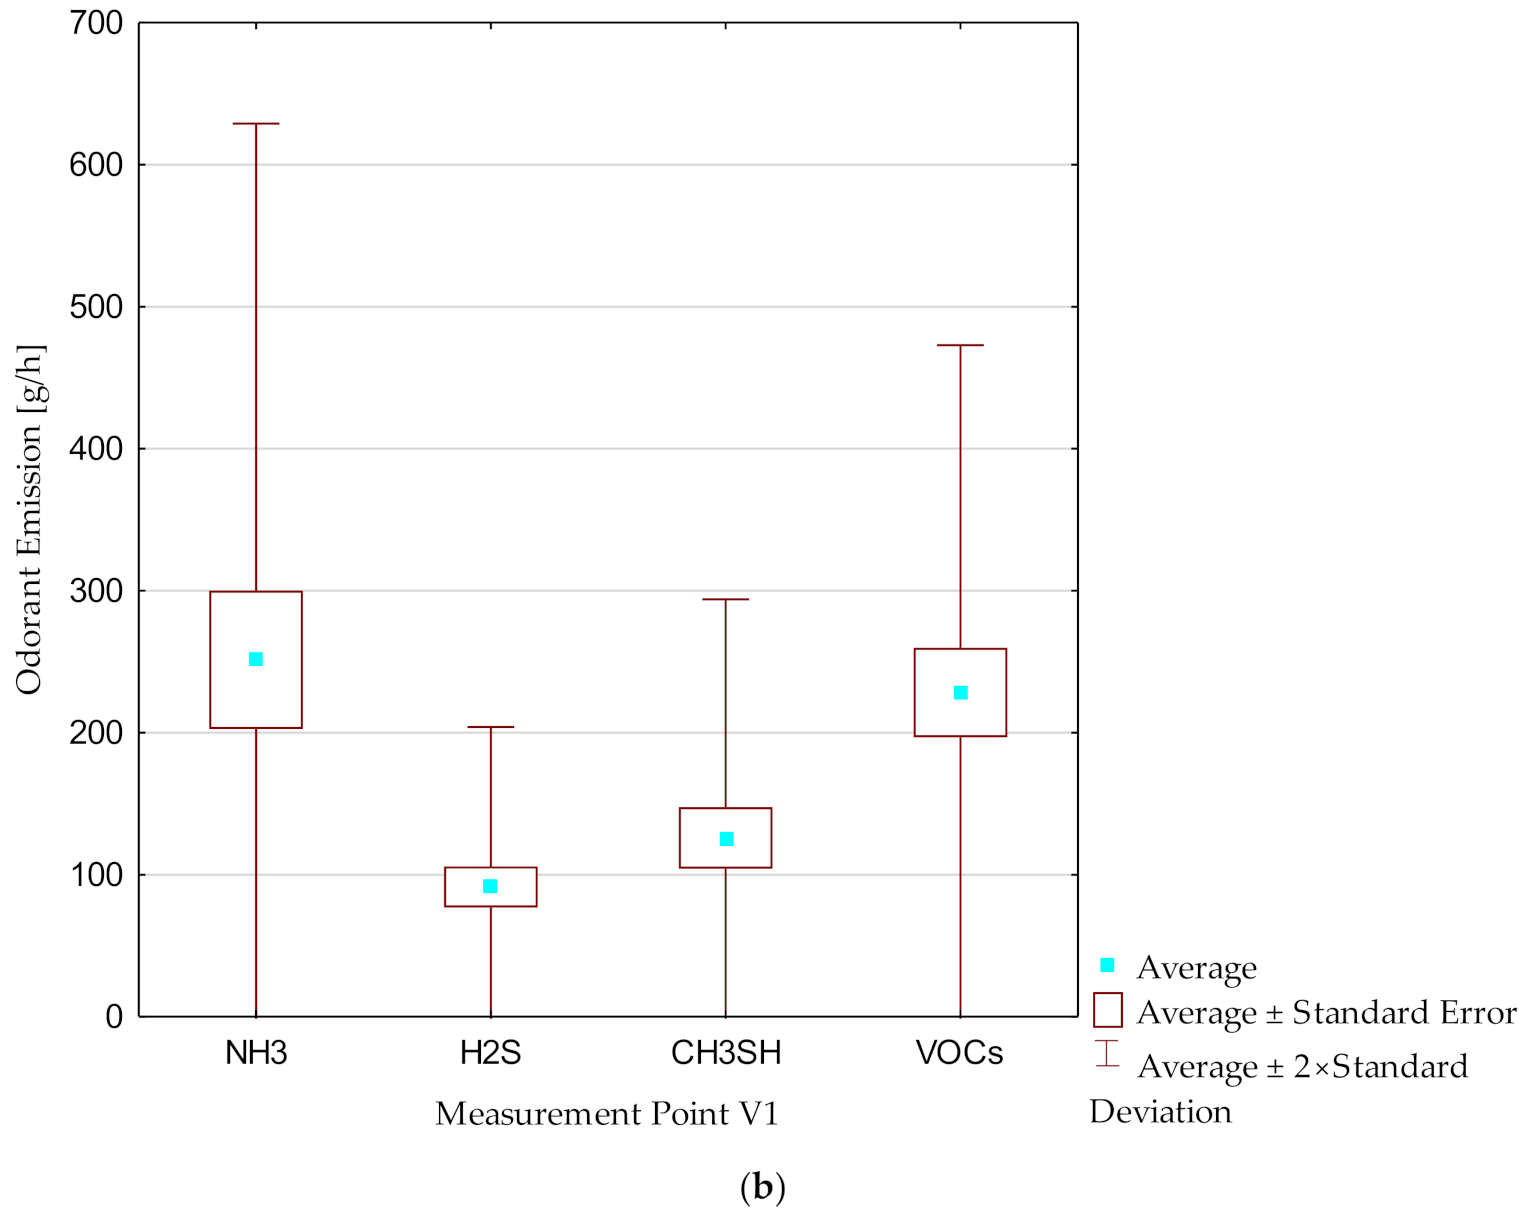
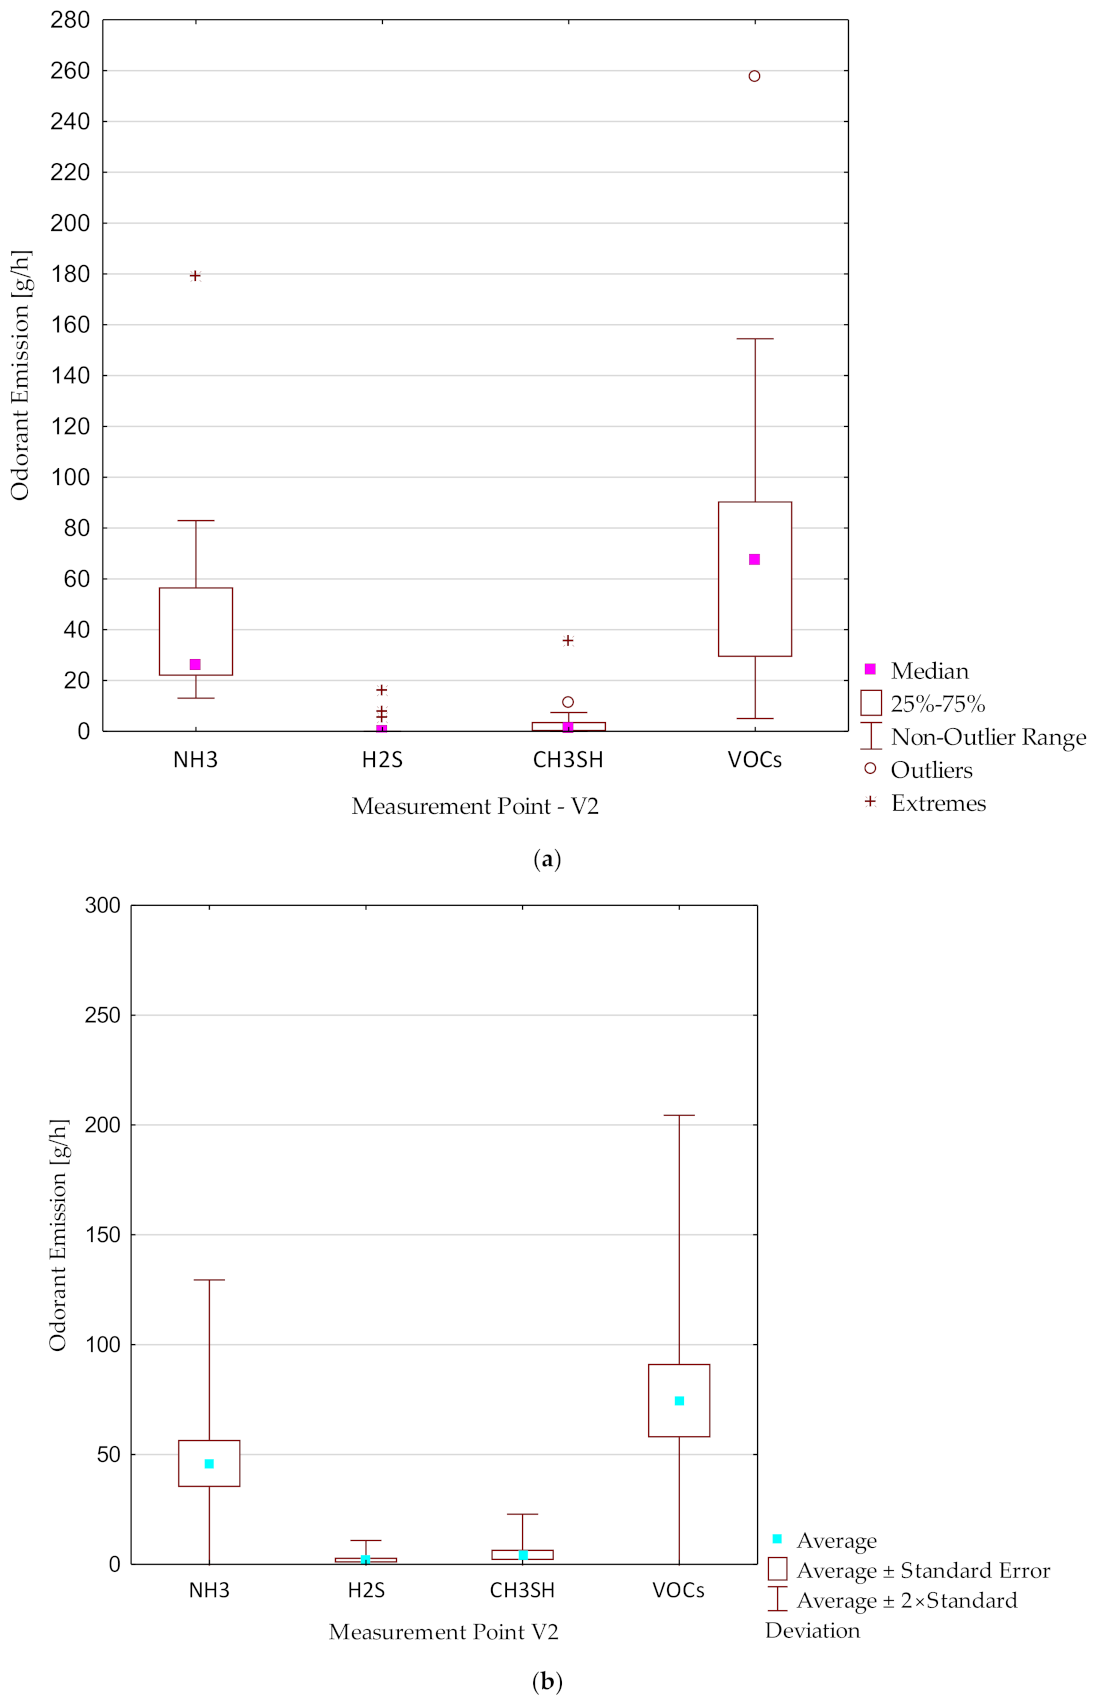
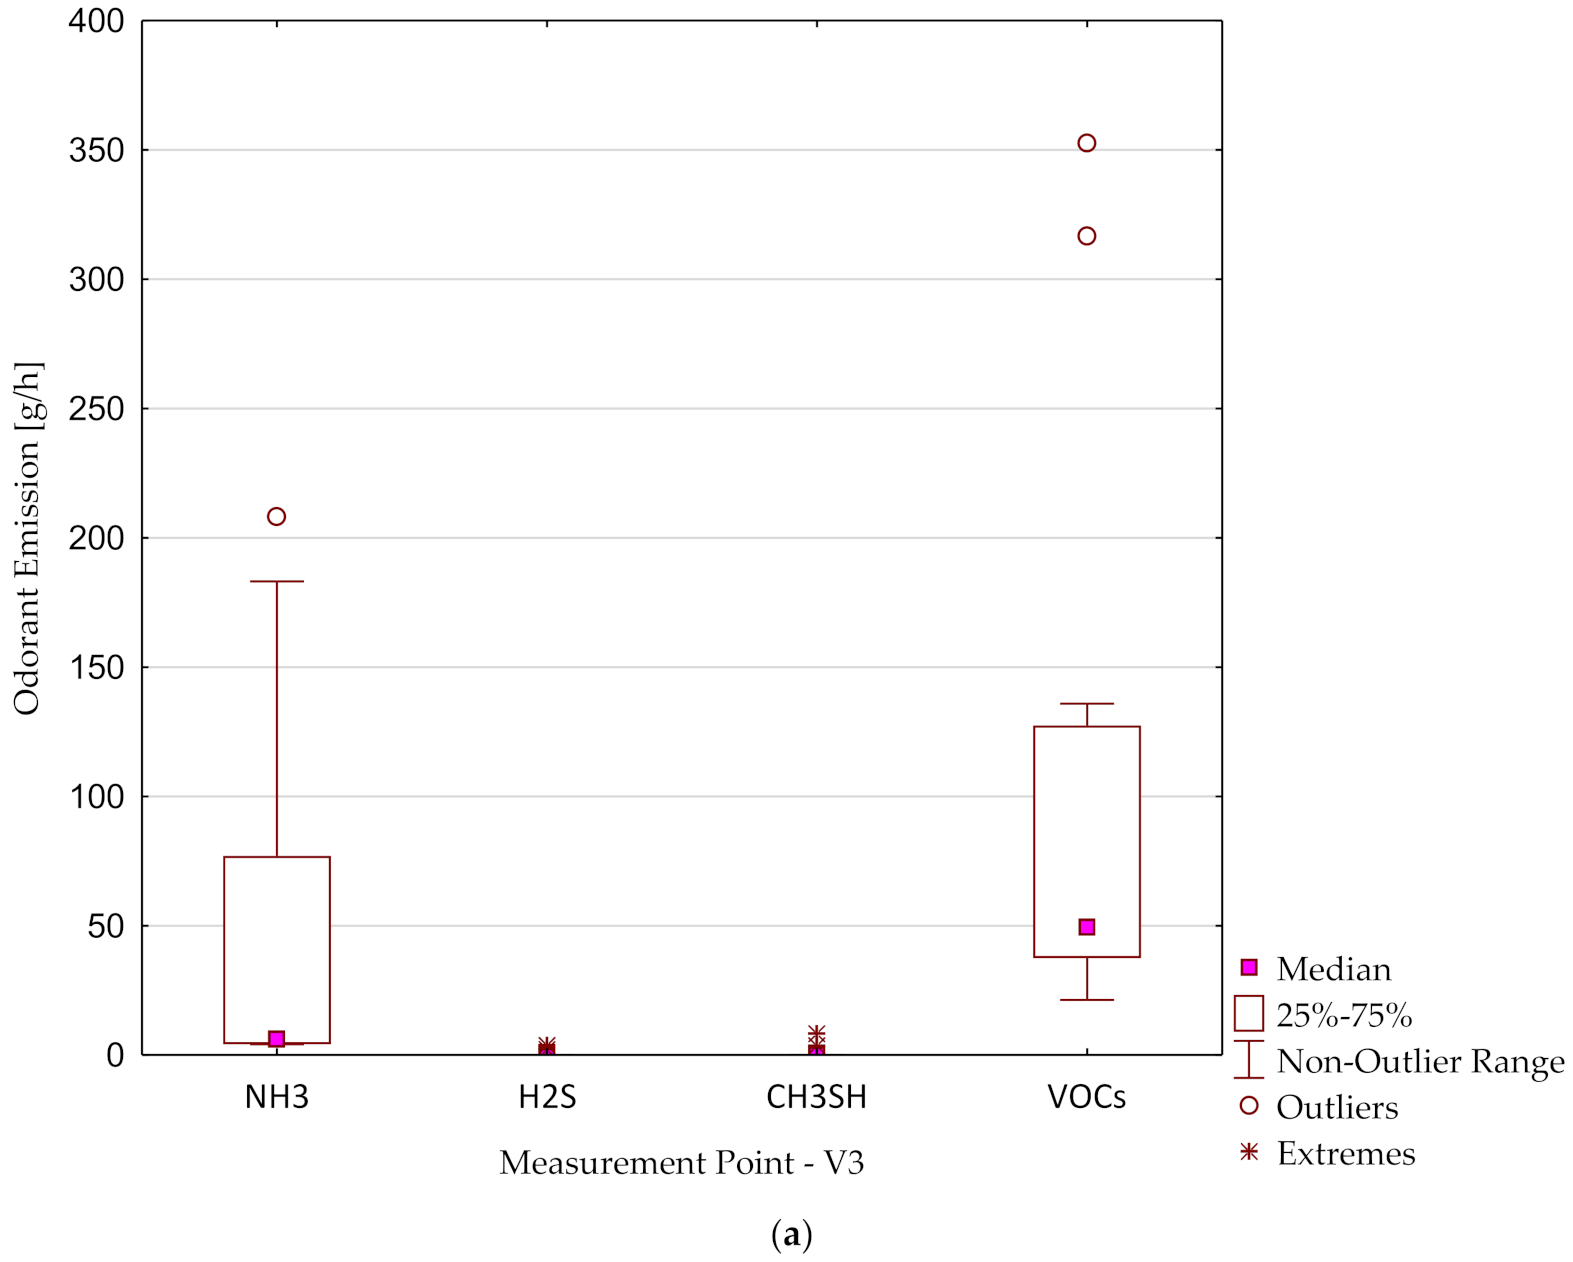
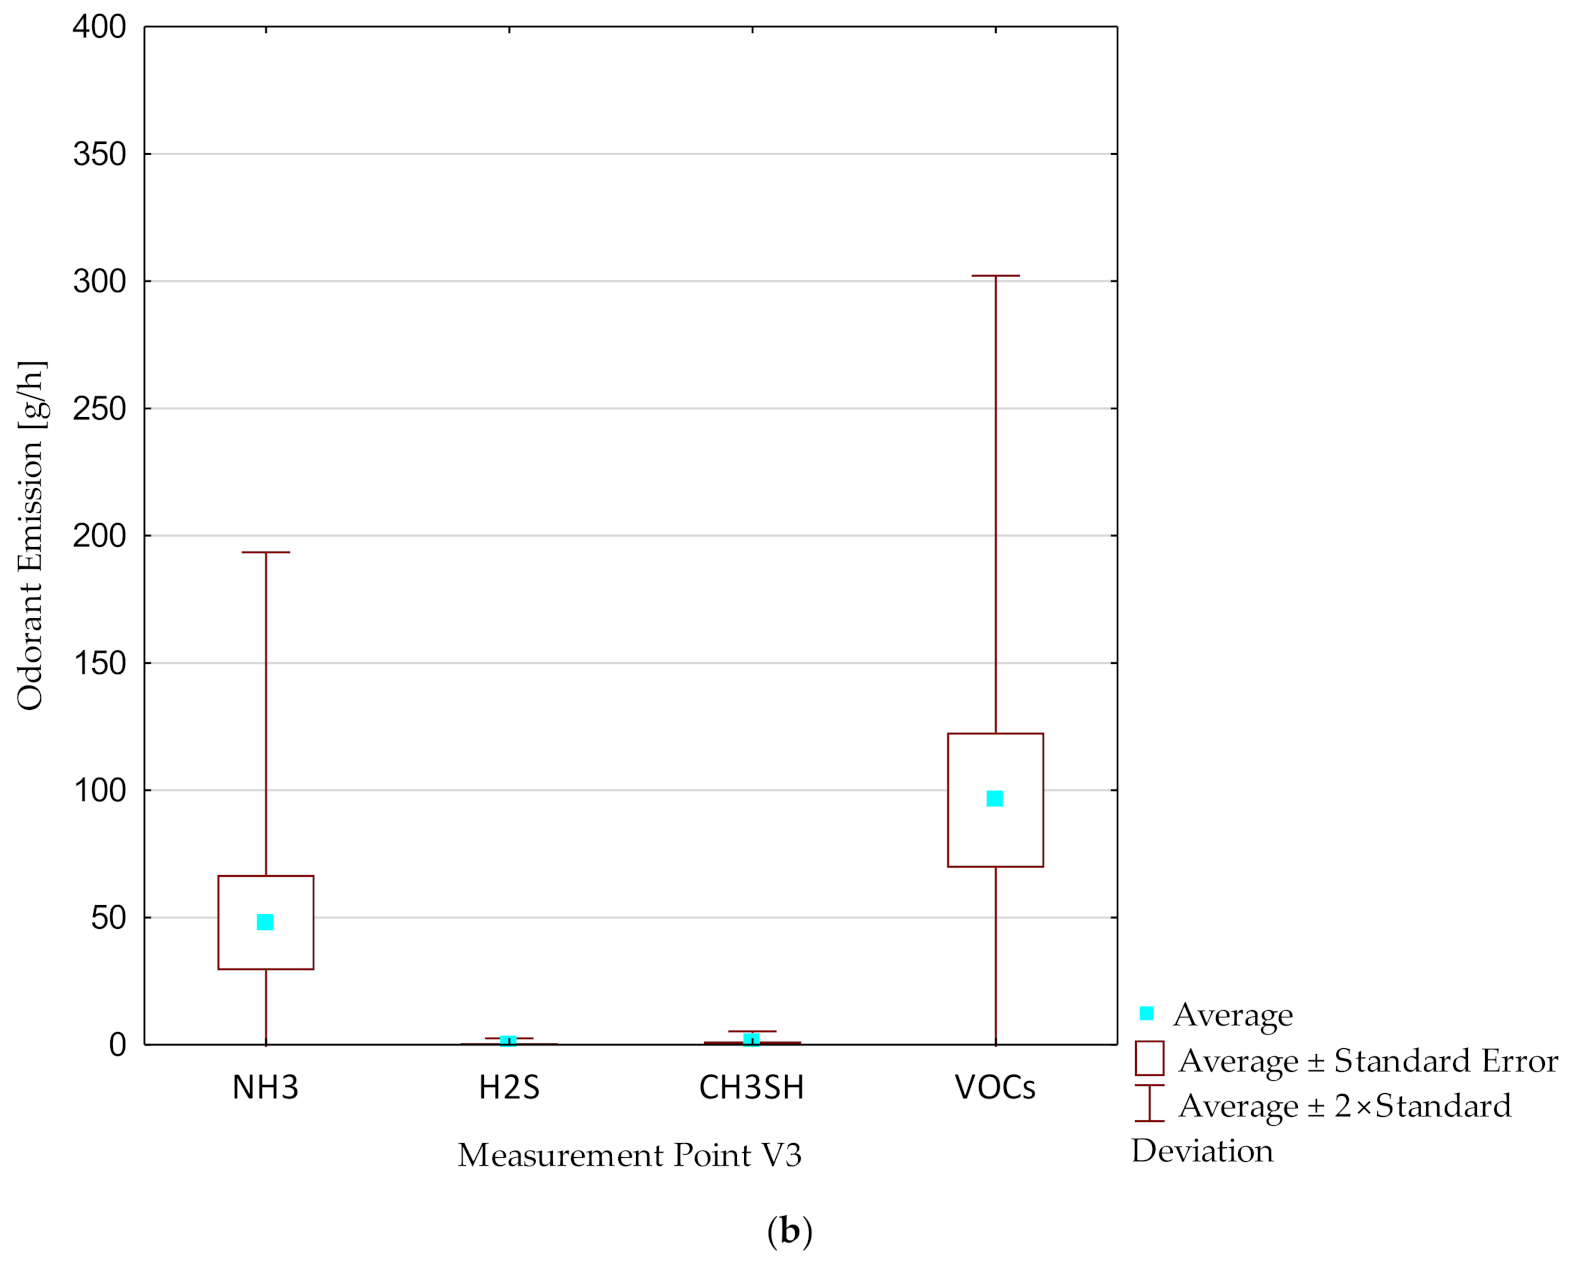
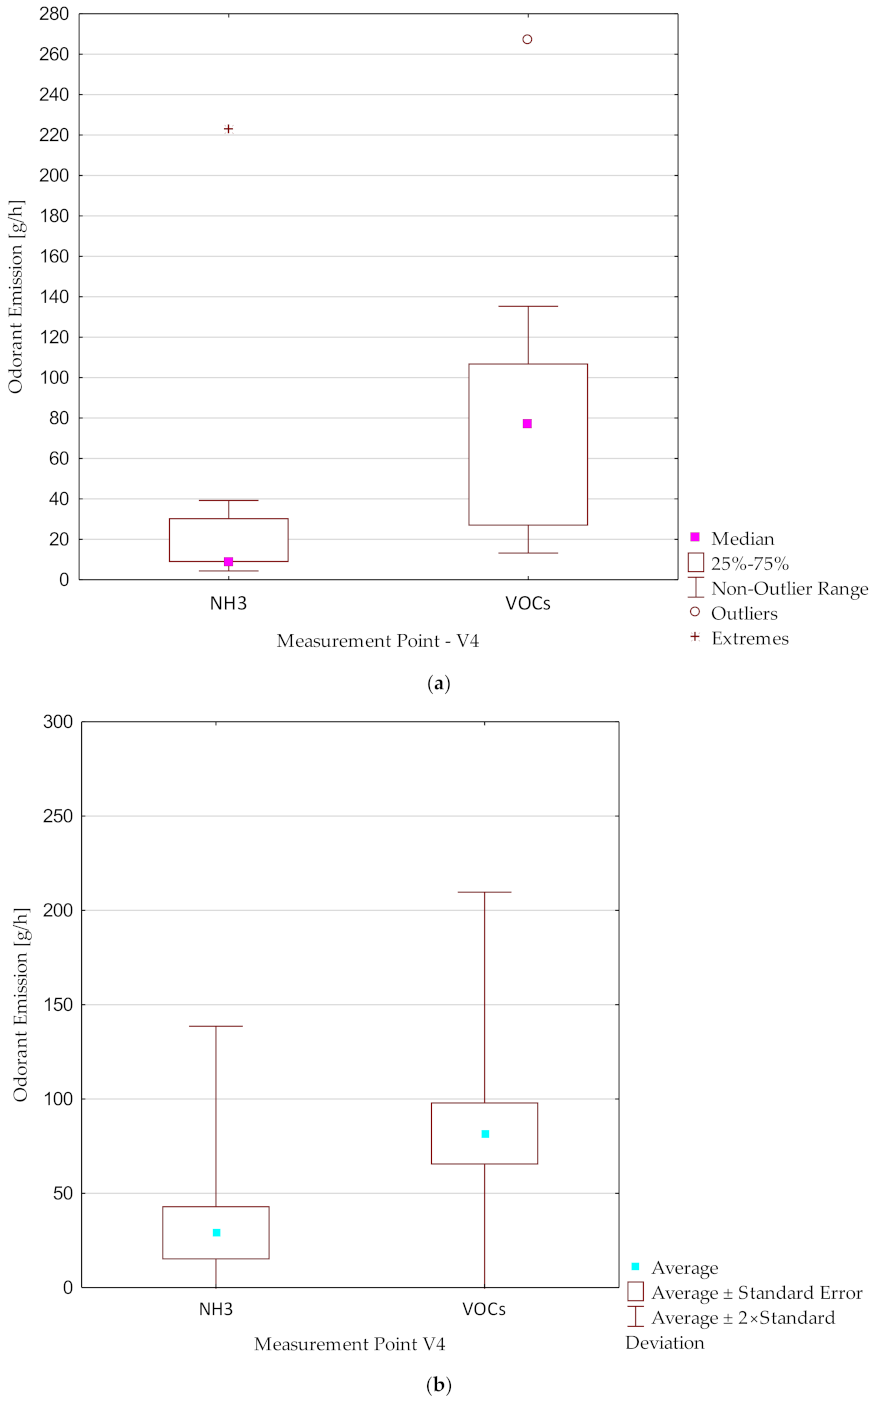
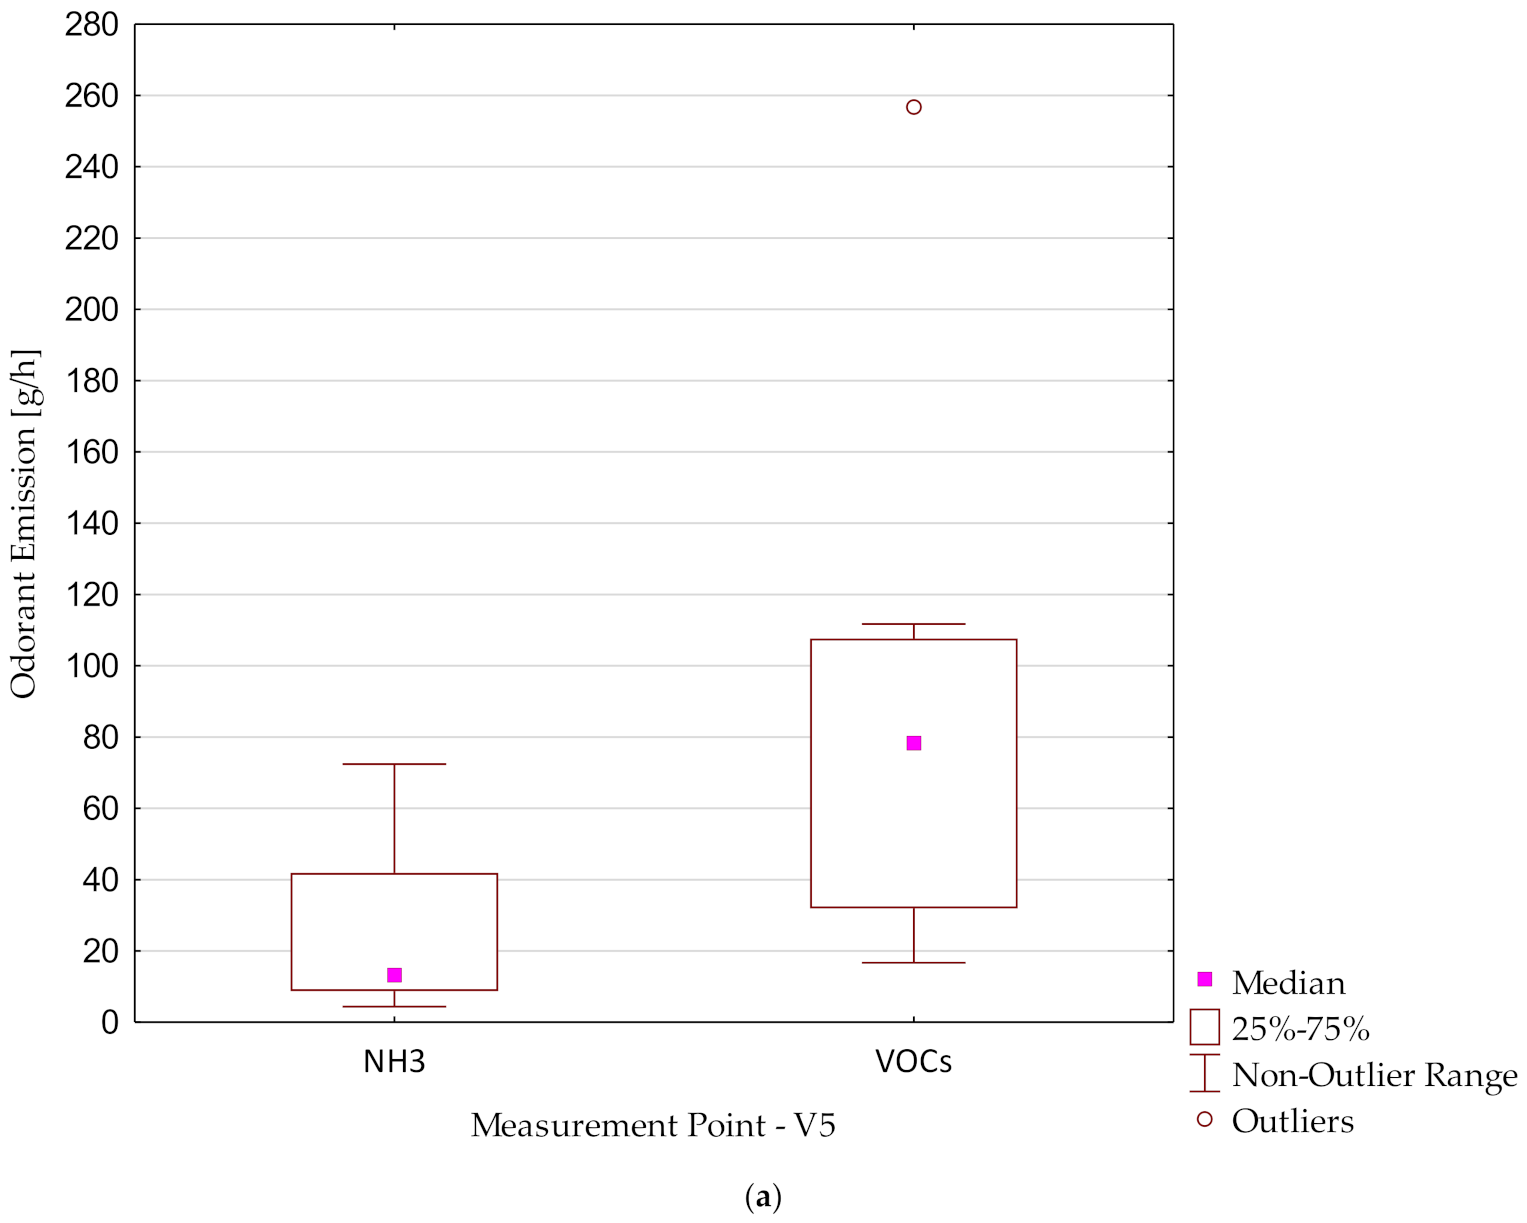
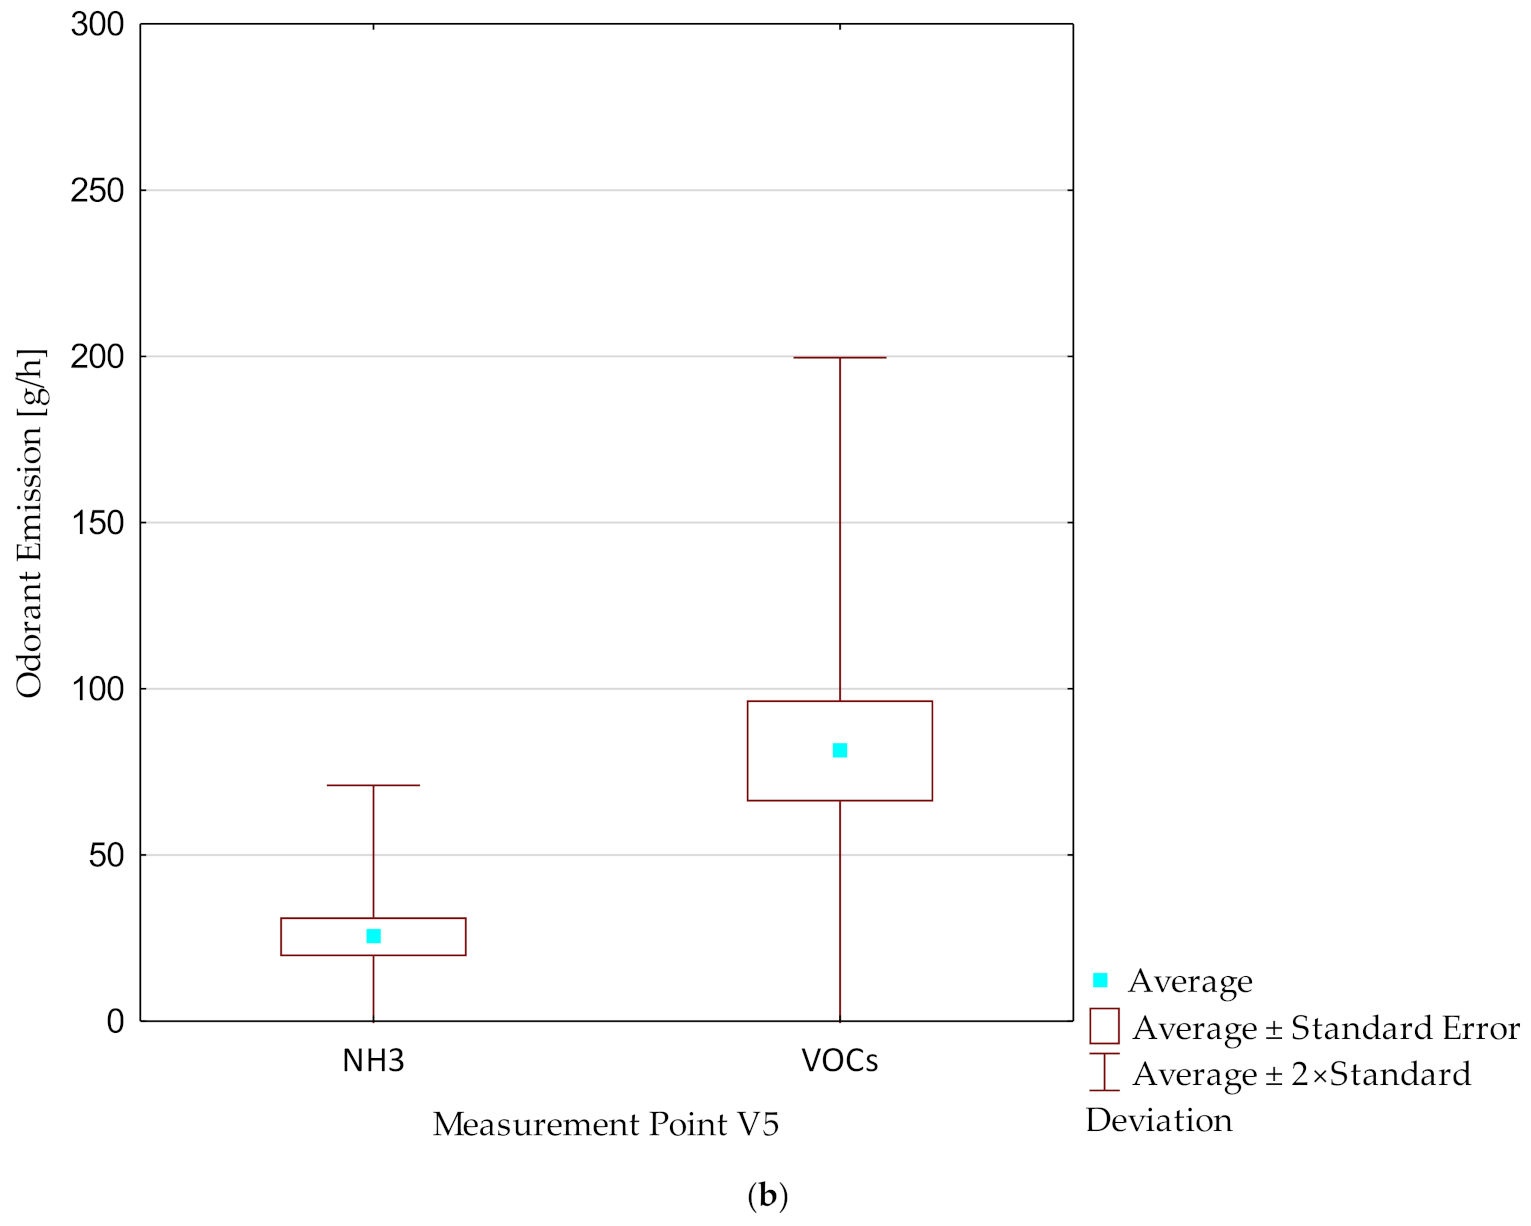
  • The dominant odorant associated with mixed MSW storage was NH3 emissions. VOC emissions dominated at the remaining measurement points. The highest emission values of all studied odorants accompanied the storage of mixed MSW. At the remaining measurement points, the emissions were lower by 58–67% (for VOCs), 81–90% (for NH3), 81–99% (for H2S), and 97–99% (for CH3SH). The VOC and NH3 emissions accompanying the storage of MSW at various biogas plants were 11–415 g/h (with average values in the range of 54–228 g/h) and 0–440 g/h (with average values in the range of 22–251 g/h), respectively [16,17];
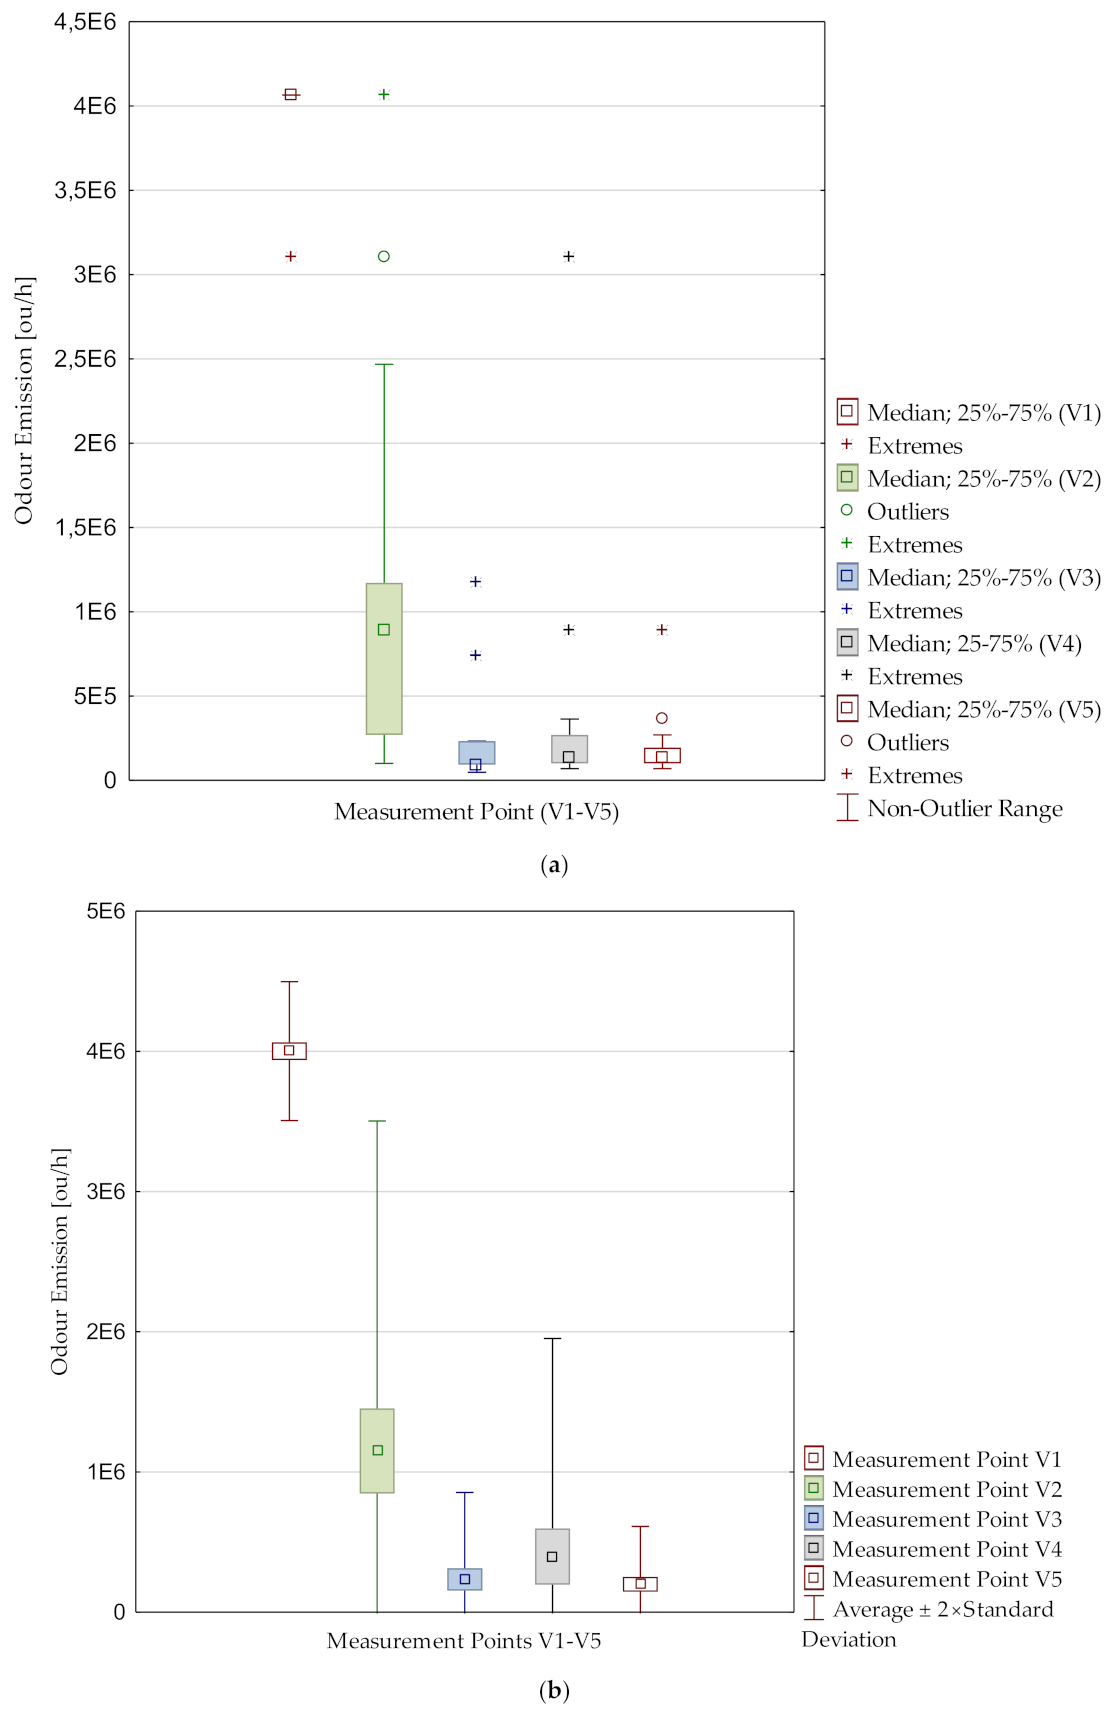
  • The highest odour emissions also accompanied the storage of mixed MSW, which was associated with a large amount of this waste in the treatment plant. The quantities of each waste fraction stored and treated in the plant are therefore essential, and limiting the storage time of waste should be an indispensable part of the technological regime;
  • The greatest variability of VOC, H2S, CH3SH, and odour emissions concerned gases captured from selectively collected waste plastics and metals, due to the varied forms of selective waste collection in the service area, and their unstable efficiency. Effective separate collection in the future will contribute not only to increasing recycling of this waste, but also to reducing odour and odorant emissions from storage areas. High variability of NH3 and odour emissions also accompanies digestate dewatering;
  • Difficulties in determining the unit emission value of odorants per 1 Mg of waste result from the problems in estimating the quantities of particular types of waste present at particular stages of the process line due to uneven delivery, lack of precise waste records, downtime in the plant operation, and varied bulk density of particular fractions.

Author Contributions

Conceptualisation, M.W., A.K. and K.L.-S.; methodology, M.W., A.K. and K.L.-S.; investigation, M.W., A.K. and K.L.-S.; data curation M.W.; writing—original draft preparation, M.W.; writing—review and editing, A.K. and K.L.-S.; visualisation, M.W.; supervision, A.K.; project administration, M.W.; funding acquisition, M.W. All authors have read and agreed to the published version of the manuscript.

Funding

This research was funded by the Warsaw University of Technology-2022.

Institutional Review Board Statement

Not applicable.

Informed Consent Statement

Not applicable.

Data Availability Statement

Not applicable.

Conflicts of Interest

The authors declare no conflict of interest.

Abbreviations

ADAnaerobic digestion
c od Odour concentration
GHGsGreenhouse gases
ITEIndividual threshold estimation
MSWMunicipal solid waste
MWBPMunicipal waste biogas plant
RSDRelative standard deviation
SDStandard deviation
VOCsVolatile organic compounds
VRVentilation rate

References

  1. Melissen, F.; Mzembe, A.N.; Idemudia, U.; Novakovic, Y. Institutional Antecedents of the Corporate Social Responsibility Narrative in the Developing World Context: Implications for Sustainable Development. Bus. Strategy Environ. 2018, 27, 657–676. [Google Scholar] [CrossRef]
  2. Ghadimi, P.; Wang, C.; Lim, M.K. Sustainable supply chain modeling and analysis: Past debate, present problems and future challenges. Resour. Conserv. Recycl. 2019, 140, 72–84. [Google Scholar] [CrossRef]
  3. Bowan, P.A.; Kayaga, S.M.; Cotton, A.P.; Fisher, J. Municipal Solid Waste Management Performance. J. Studies Soc. Sci. 2020, 19, 5. [Google Scholar]
  4. Olapiriyakul, S. Designing a sustainable municipal solid waste management system in Pathum Thani, Thailand. Int. J. Environ. Technol. Manag. 2017, 20, 37–59. [Google Scholar] [CrossRef]
  5. Ryckebosch, E.; Drouillon, M.; Vervaeren, H. Techniques for transformation of biogas to biomethane. Biomass Bioenergy 2011, 35, 1633–1645. [Google Scholar] [CrossRef]
  6. Bharathiraja, B.; Sudharsana, T.; Bharghavi, A.; Jayamuthunagai, J.; Praveenkumar, R. Biohydrogen and biogas—An overview on feedstocks and enhancement process. Fuel 2016, 185, 810–828. [Google Scholar] [CrossRef]
  7. United Nations Environment Programme. The Emissions Gap Report. A UNEP Synthesis Report; UNEP: Nairobi, Kenya, 2014. [Google Scholar]
  8. International Energy Agency. Energy and Climate Change: World Energy Outlook Special Report; OECD/IEA: Paris, France, 2015. [Google Scholar]
  9. Bharathiraja, B.; Sudharsana, T.; Jayamuthunagai, J.; Praveenkumar, R.; Chozhavendhan, S.; Iyyappan, J. Biogas production—A review on composition, fuel properties, feed stock and principles of anaerobic digestion. Renew. Sustain. Energy Rev. 2018, 90, 570–582. [Google Scholar] [CrossRef]
  10. Moreno, A.I.; Arnáiz, N.; Font, R.; Carratalá, A. Chemical characterisation of emissions from a municipal solid waste treatment plant. Waste Manag. 2014, 34, 2393–2399. [Google Scholar] [CrossRef] [Green Version]
  11. Pawnuk, M.; Grzelka, A.; Miller, U.; Sówka, I. Prevention and Reduction of Odour Nuisance in Waste Management in the Context of the Current Legal and Technological Solutions. J. Ecol. Eng. 2020, 21, 34–41. [Google Scholar] [CrossRef]
  12. Wiśniewska, M.; Kulig, A.; Lelicińska-Serafin, K. Odour Emissions of Municipal Waste Biogas Plants—Impact of Technological Factors, Air Temperature and Humidity. Appl. Sci. 2020, 10, 1093. [Google Scholar] [CrossRef] [Green Version]
  13. Wiśniewska, M. Environmental impact assessment of municipal biogas plants. Case study. SHS Web Conf. 2018, 57, 02015. [Google Scholar] [CrossRef]
  14. Salva, J.; Poništ, J.; Lobotková, M.; Vanek, M.; Schwarz, M.; Veverková, D. Current state of odour nuisance from biogas plants in Slovakia. Environ. Prot. Eng. 2021, 47, 67–81. [Google Scholar] [CrossRef]
  15. Turin, L.; Yoshii, F. Structure-Odor Relations. A Modern Perspective. Handbook of Olfaction and Gustation, 2nd ed.; Doty, R.L., Ed.; Marcel Dekker, Inc.: New York, NY, USA, 2003; p. 36. [Google Scholar]
  16. Wiśniewska, M.; Kulig, A.; Lelicińska-Serafin, K. The Impact of Technological Processes on Odorant Emissions at Municipal Waste Biogas Plants. Sustainability 2020, 12, 5457. [Google Scholar] [CrossRef]
  17. Wiśniewska, M.; Kulig, A.; Lelicińska-Serafin, K. The importance of the microclimatic conditions inside and outside of plant buildings in odorants emission at municipal waste biogas installations. Energies 2020, 13, 6463. [Google Scholar] [CrossRef]
  18. Wiśniewska, M.; Kulig, A.; Lelicińska-Serafin, K. Odour Nuisance at Municipal Waste Biogas Plants and the Effect of Feedstock Modification on the Circular Economy—A Review. Energies 2021, 14, 6470. [Google Scholar] [CrossRef]
  19. Schauberger, G.; Piringer, M.; Knauder, W.; Petz, E. Odour emissions from a waste treatment plant using an inverse dispersion technique. Atmos. Environ. 2011, 45, 1639–1647. [Google Scholar] [CrossRef]
  20. Giungato, P.; de Gennaro, G.; Barbieri, P.; Briguglio, S.; Amodio, M.; de Gennaro, L.; Lasigna, F. Improving recognition of odors in a waste management plant by using electronic noses with different technologies, gas chromatography mass spectrometry/olfactometry and dynamic olfactometry. J. Clean. Prod. 2016, 133, 1395–1402. [Google Scholar] [CrossRef]
  21. Henault-Ethier, L.; Martin, J.P.; Housset, J. A dynamic model for organic waste management in Quebec (D-MOWIQ) as a tool to review environmental, societal and economic perspectives of a waste management policy. Waste Manag. 2017, 66, 196–209. [Google Scholar] [CrossRef]
  22. Toledo, M.; Gutiérrez, M.C.; Siles, J.A.; García-Olmo, J.; Martín, M.A. Chemometric analysis and NIR spectroscopy to evaluate odorous impact during the composting of different raw materials. J. Clean. Prod. 2018, 167, 154–162. [Google Scholar] [CrossRef]
  23. Eusebio, L.; Derudi, M.; Capelli, L.; Nano, G.; Sironi, S. Assessment of the indoor odour impact in a naturally ventilated room. Sensors 2017, 17, 778. [Google Scholar] [CrossRef] [Green Version]
  24. Heisterberg, M.V.; Menné, T.; Johansen, J.D. Fragrance allergy and quality of life—A case-control study. Contact Dermat. 2014, 70, 81–89. [Google Scholar] [CrossRef] [PubMed]
  25. Oiamo, T.H.; Luginaah, I.N.; Baxter, J. Cumulative effects of noise and odour nuisances on environmental and health related quality of life. Soc. Sci. Med. 2015, 146, 191–203. [Google Scholar] [CrossRef] [PubMed]
  26. Ternesten-Hasséus, E.; Löwhagen, O.; Millqvist, E. Quality of life and capsaicin sensitivity in patients with airway symptoms induced by chemicals and scents: A longitudinal study. Environ. Health Perspect. 2006, 115, 425–429. [Google Scholar] [CrossRef] [Green Version]
  27. Wolkoff, P. Indoor air humidity, air quality, and health—An overview. Int. J. Hyg. Environ. Health 2018, 221, 376–390. [Google Scholar] [CrossRef]
  28. Brown, R.E. Mammalian social odors: A critical review. Adv. Study Behav. 1979, 10, 103–162. [Google Scholar] [CrossRef]
  29. Touhara, K. Odor and pheromone molecules, receptors, and behavioral responses. In The Olfactory System; Springer: Tokyo, Japan, 2014; pp. 19–38. [Google Scholar] [CrossRef]
  30. Weiss, T.; Secundo, L.; Sobel, N. Human olfaction: A typical yet special mammalian olfactory system. In The Olfactory System; Springer: Tokyo, Japan, 2014; pp. 177–202. [Google Scholar] [CrossRef]
  31. Li, R.Y.M.; Li, H.C.Y. Have housing prices gone with the smelly wind? Big data analysis on landfill in Hong Kong. Sustainability 2018, 10, 341. [Google Scholar] [CrossRef] [Green Version]
  32. Krause, K.H.; Lung, T. Imission prognosis of odor loads for plant licensing. Staub Reinhalt. Luft 1993, 53, 419–423. [Google Scholar]
  33. Uppenkamp, K.H. Odor emission in pulp drying. Zuckerindustrie 1994, 119, 912–914. [Google Scholar]
  34. Searcy, E.M.L.; Zhang, Q.; Cicek, N. The Use of a Biofilter for Reducing Off-Gas Odour from an Industrial Fermentation Process. Environ. Technol. 2005, 26, 103–109. [Google Scholar] [CrossRef]
  35. Lovén, K.; Pietarila, H.; Kuusisto, S.; Kajolinna, T.; Sipilä, J. Odour Load from Passenger Ships. Chem. Eng. Trans. 2008, 15, 1–8. [Google Scholar]
  36. Chang, W.-S.; Chen, S.S.; Chang, J.-H.; Tang, C.-H.; Chang, T.-C. Odor Load Investigation for a Pharmaceutical Plant by Open Path Fourier Transform Infrared (OP-FTIR)/Environmental Protection Agency Regulatory Dispersion Model (AERMOD). Environ. Forensics 2009, 10, 82–91. [Google Scholar] [CrossRef]
  37. Colón, J.; Alvarez, C.; Vinot, M.; Lafuente, F.J.; Ponsá, S.; Sánchez, A.; Gabriel, D. Characterization of odorous compounds and odor load in indoor air of modern complex MBT facilities. Chem. Eng. J. 2017, 313, 1311–1319. [Google Scholar] [CrossRef] [Green Version]
  38. Standard EN 13725: 2003; Air Quality-Determination of Odour Concentration by Dynamic Olfactometry. CEN: Brussels, Belgium, 2003.
  39. Commission Notice on Technical Guidance on the Classification of Waste C/2018/1447. Available online: https://eur-lex.europa.eu/legal-content/EN/ALL/?uri=uriserv:OJ.C_.2018.124.01.0001.01.ENG (accessed on 27 December 2021).
  40. Available online: http://bip.sejmik.kielce.pl/237-departament-rozwoju-obszarow-wiejskich-i-srodowiska/4460-plan-gospodarki-odpadami-dla-wojewodztwa-swietokrzyskiego-2016-2022/23124.html (accessed on 30 January 2022).
  41. Jia, C.; Cao, K.; Valaulikar, R.; Fu, X.; Sorin, A.B. Variability of Total Volatile Organic Compounds (TVOC) in the Indoor Air of Retail Stores. Int. J. Environ. Res. Public Health 2019, 16, 4622. [Google Scholar] [CrossRef] [PubMed] [Green Version]
  42. Coy, J.D.; Bigelow, P.L.; Buchan, R.M.; Tessari, J.D.; Parnell, J.O. Field evaluation of a portable photoionisation detector for assessing exposure to solvent mixtures. AIHAJ 2000, 61, 268–274. [Google Scholar] [CrossRef]
Figure 1. Scheme of the hall for waste unloading and storage at the MWBP.
Energies 15 02427 g001
Figure 2. Scheme of the digestate dewatering hall at the MWBP (1—press effluent tank, 2—centrifuge effluent tank).
Energies 15 02427 g002
Figure 3. Odorant emission levels with median (a) and average (b) values at the first point (above the mixed waste) in every measurement series.
Energies 15 02427 g003aEnergies 15 02427 g003b
Figure 4. Odorant emission levels with median (a) and average (b) values at the second point (above the overhead conveyor transporting MSW) in every measurement series.
Energies 15 02427 g004
Figure 5. Odorant emission levels with median (a) and average (b) values at the third point in every measurement series.
Energies 15 02427 g005aEnergies 15 02427 g005b
Figure 6. Odorant emission levels with median (a) and average (b) values at the fourth point (from the digestate dewatering hall) in every measurement series.
Energies 15 02427 g006
Figure 7. Odorant emission levels with median (a) and average (b) values at the fifth point in every measurement series.
Energies 15 02427 g007aEnergies 15 02427 g007b
Figure 8. Odour emission levels with median (a) and average (b) values at all measurement points and in every measurement series.
Energies 15 02427 g008
Table 1. The share of individual fractions of waste collected and selectively delivered to the analysed treatment plant (based on data from the plant).
Months in Which the Research Was ConductedThe Share of Individual Fractions of Waste Collected Selectively (%)
Plastic Packaging
15 01 02
Composite Packaging
15 01 05
Mixed Packaging
15 01 06
Plastics
20 01 39
July 201924.0-75.60.4
August 201920.3-79.20.5
September 20190.3-99.40.3
October 20191.5-97.80.7
November 20191.0-98.70.3
December 20191.8-98.10.1
January 20201.2-98.50.3
February 20200.4-99.30.3
May 20201.3-98.70.0
June 20200.50.499.10.0
December 20200.20.899.00.0
“-”—Not collected selectively.
Table 2. The morphology of MSW generated in Świętokrzyskie Voivodship [40].
Morphological Composition of Mixed MSWThe Share (%)
20192020
In TotalTownVillageIn TotalTownVillage
Paper and cardboard8.010.45.48.010.45.4
Glass10.010.19.910.010.19.9
Metals1.81.42.21.71.42.1
Plastics11.211.510.711.211.610.8
Multi-material waste4.24.14.34.24.24.3
Food and garden waste32.734.330.932.534.230.7
Mineral waste4.53.06.25.22.97.7
Fractions < 10 mm12.17.217.711.16.416.4
Textiles3.34.22.23.24.22.1
Wood0.50.30.70.50.30.7
Hazardous waste0.80.70.90.90.71.0
Bulky waste2.02.61.32.02.61.3
Green waste4.15.32.64.15.32.6
Others4.94.85.15.45.75.1
Table 3. Measurement points characteristics.
No.MarkingDescriptionVentilator Flow Rate (m3/h)
1V1Roof ventilator from waste storage hall; process gases captured from overmixed MSW6264
2V2Roof ventilator from waste storage hall; process gases captured from the overhead conveyor transporting MSW to the sorting hall6264
3V3Roof ventilator from waste storage hall; process gases captured from over selectively collected dry fraction of MSW2988
4V4Roof ventilator from the digestate dewatering hall6264
5V5Roof ventilator from the digestate dewatering hall6264
Table 4. Schedule of measurement tests.
Measurement SeriesDateTemperature (°C)Relative Humidity (%)
1.11.07.201924.963.1
2.25.07.201927.862.2
3.08.08.201925.559.2
4.22.08.201925.262.2
5.05.09.201924.567.5
6.03.10.201922.565.6
7.17.10.201923.967.8
8.07.11.201924.658.8
9.21.11.201924.977.6
10.30.12.201922.580.7
11.30.01.202024.765.3
12.12.02.202024.968.6
13.27.05.202024.863.1
14.17.06.202029.664.8
15.17.12.202024.584.0
Table 5. Characteristics of the MultiRAE Pro gas detector sensors.
SubstanceSummary FormulaSensor TypeRange (ppm)ResolutionIonization Energy (IE) (eV)Response Time (s)Calibration Gas
Volatile organic compounds-Photoionisation (PID)0–10000.0110.615C4H8
(10.02 ppm; 100 ppm)
AmmoniaNH3Electrochemical (EC)0–1001.0-60NH3
(46.44 ppm)
Hydrogen sulphideH2SElectrochemical (EC)0–1000.1-35H2S
(25.8 ppm)
MethanethiolCH3SHElectrochemical (EC)0–100.1-< 35CH3SH
(5 ppm)
- Not applicable.
Table 6. Odour load characteristics from individual measuring points.
Measurement Point12345
The highest odorant emissionsNH3VOCsVOCsVOCsVOCs
The lowest odorant emissionsH2SH2SH2SH2S and CH3SH—below detection levelH2S and CH3SH—below detection level
Range of RSD for all individual odorants52–73%84–226%104–279%76–182%71–87%
RSD of odour emissions6%99%128%189%100%
Publisher’s Note: MDPI stays neutral with regard to jurisdictional claims in published maps and institutional affiliations.

