
Enhancement of the System Stability of DB-Controlled VSC Links Parallel Operated with a Weak Multi-Machine AC Power System


Abstract
:1. Introduction
- A single infinite bus is typically employed but is not sufficiently accurate.
- A simplified VSC-HVDC model is commonly adopted (also as in [36]).
- The proposed PSS/PODs are not validated over a range of operating points.
- (1)
- Studying the damping performance of the proposed PSS/POD over the full range of modal frequencies in the future Australian network;
- (2)
- Application of the VSC-HVDCs utilizing the detailed model of damping controller;
- (3)
- Modal analysis of the AC/DC hybrid grid to characterize different modes using participation factors; and
- (4)
- Validation of the modal damping by the PSS/POD over a wide range of operating conditions.
2. Modeling of the Extended Australian Power System
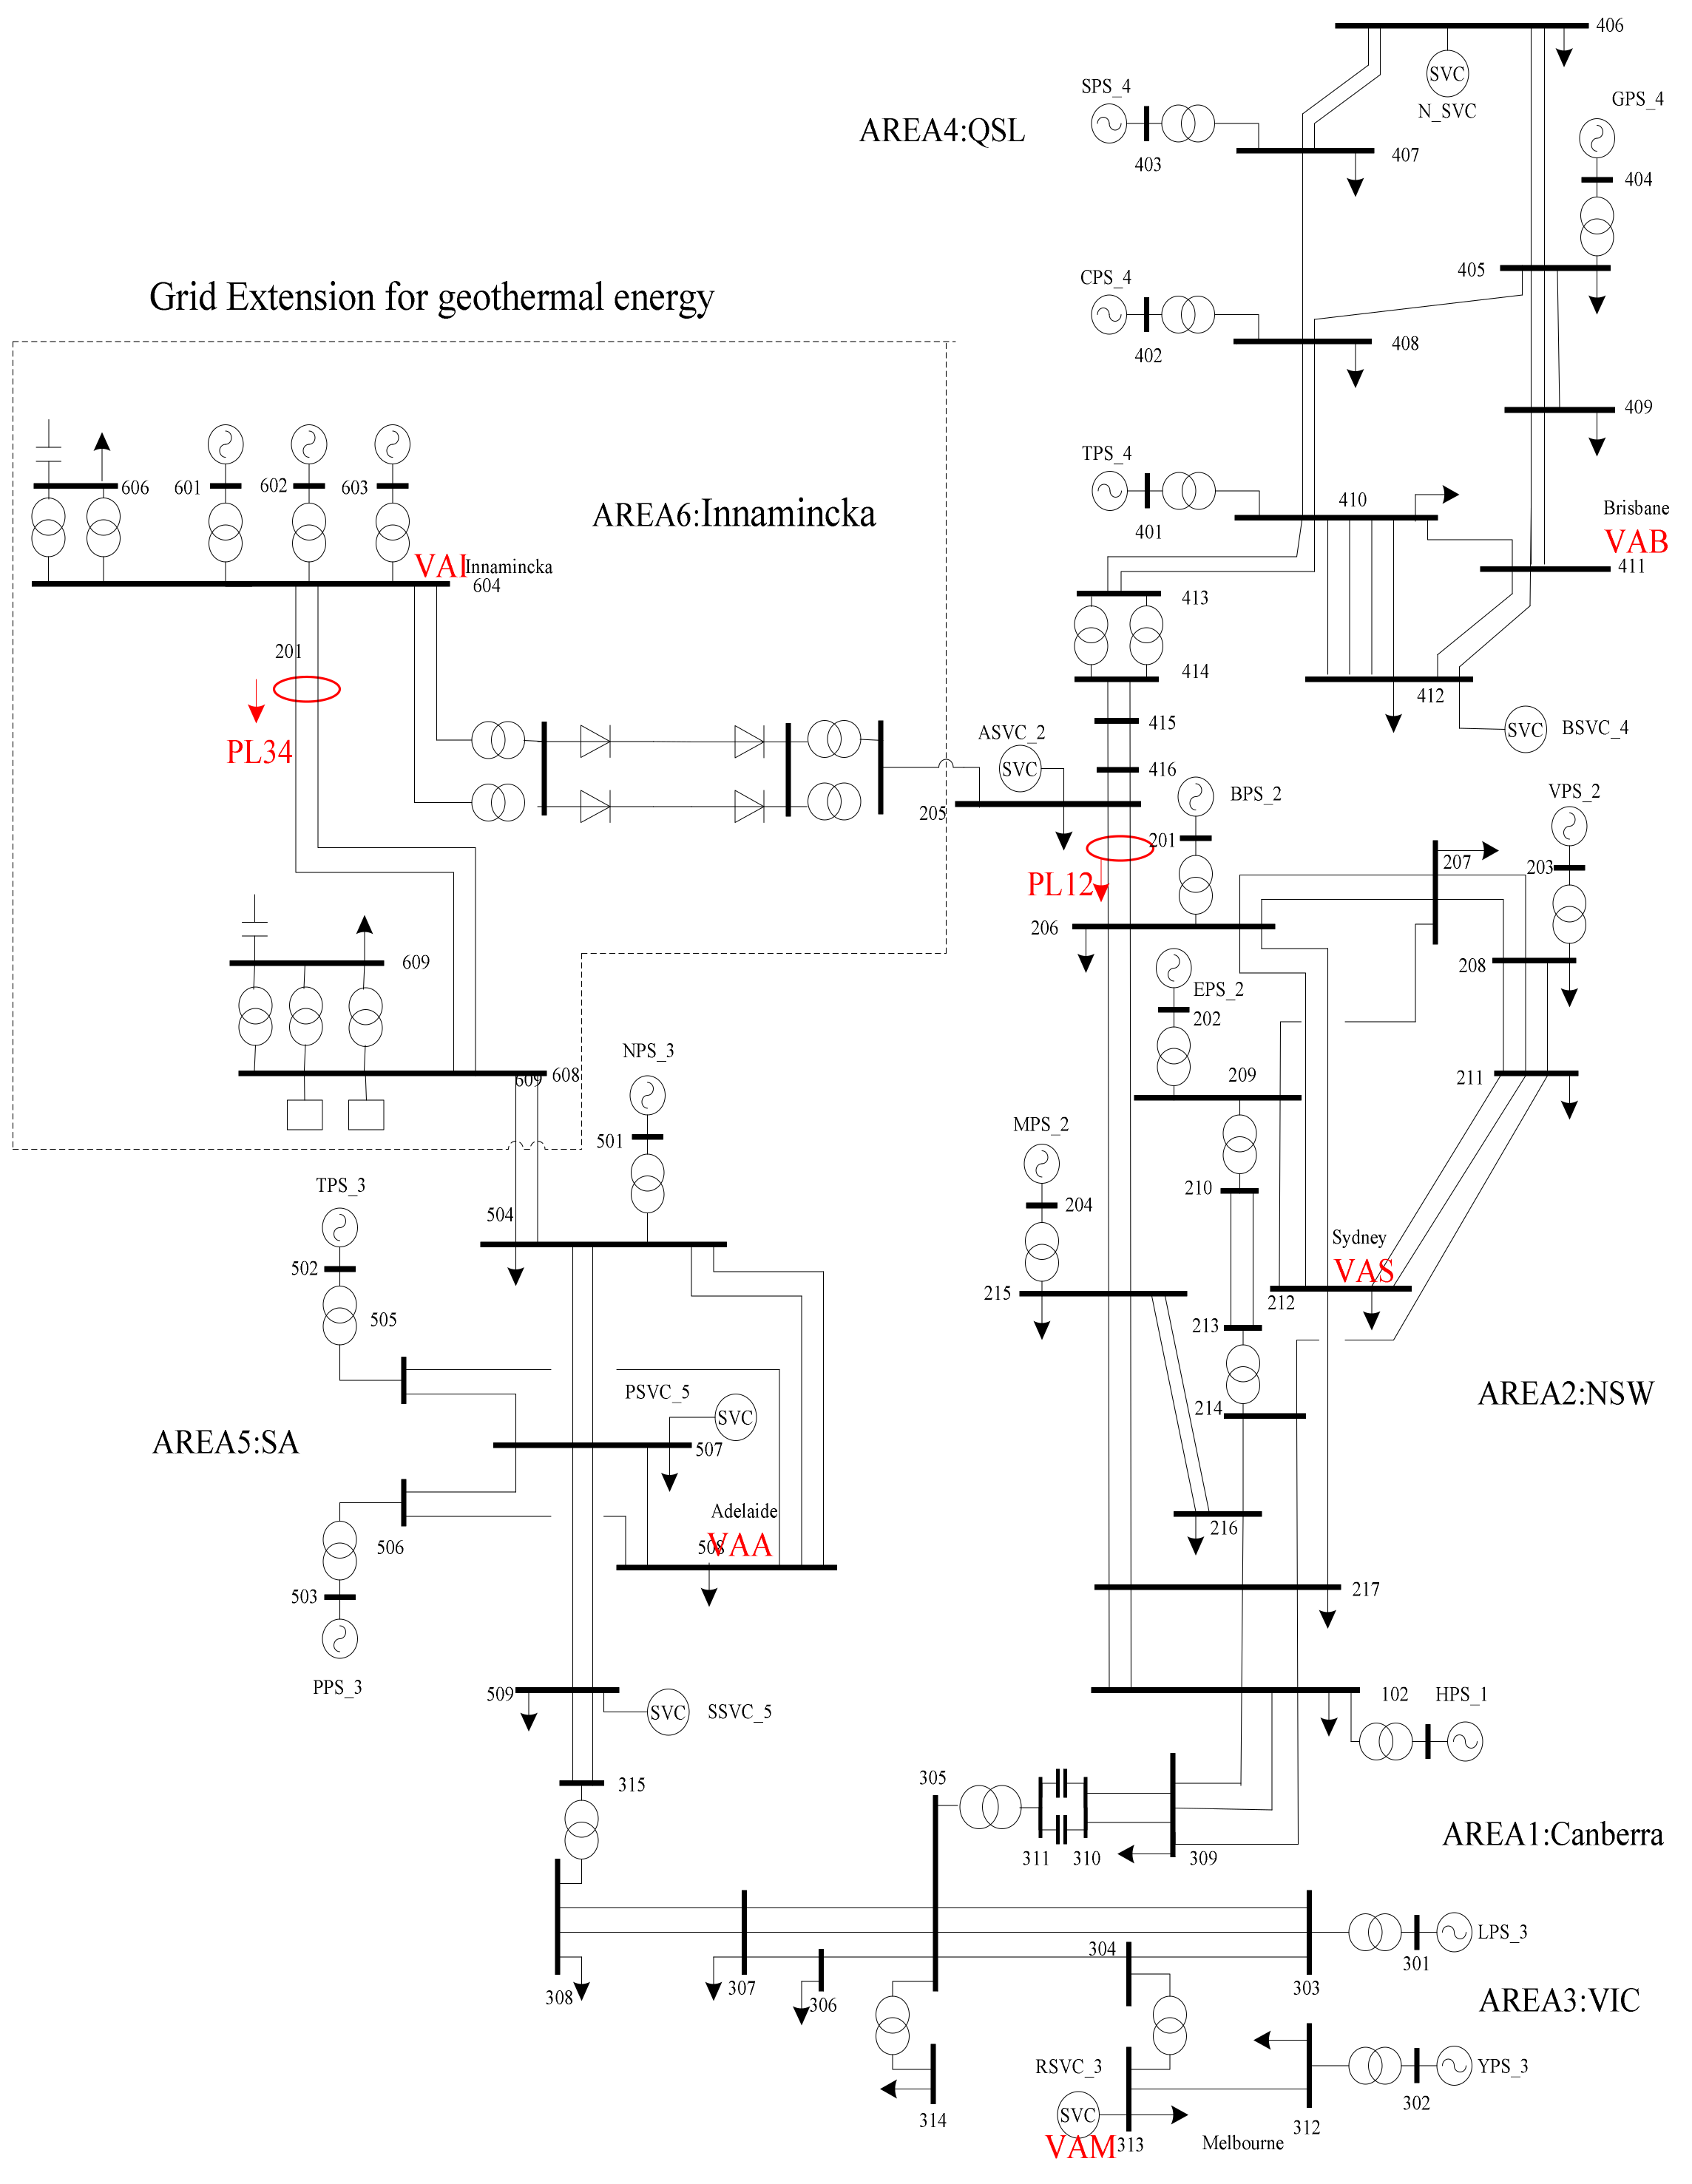
2.1. Propose Transmission Scheme and Its Configuration
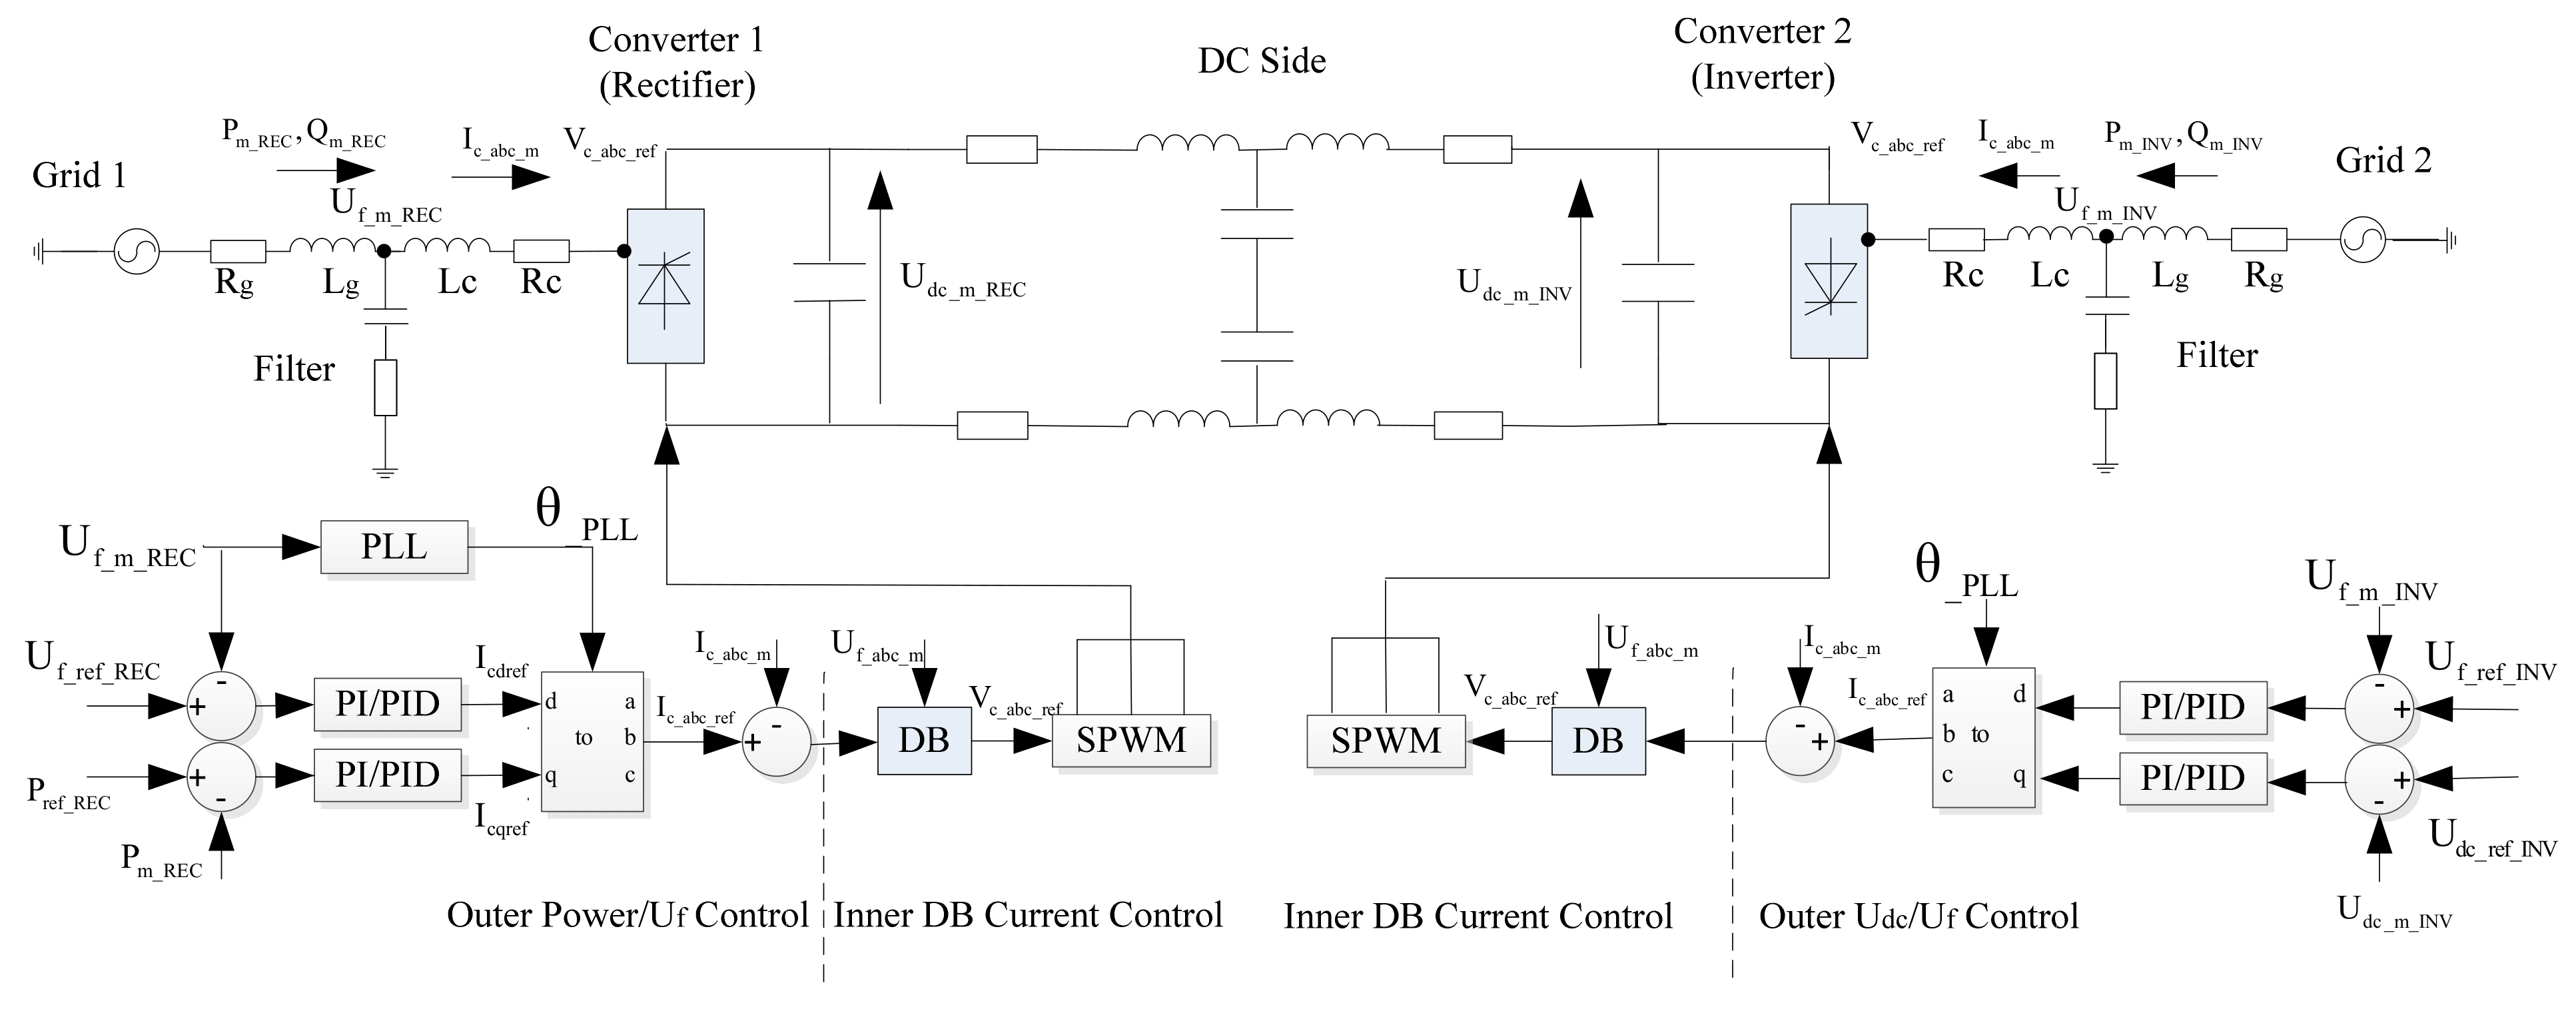
2.2. VSC-HVDC Model
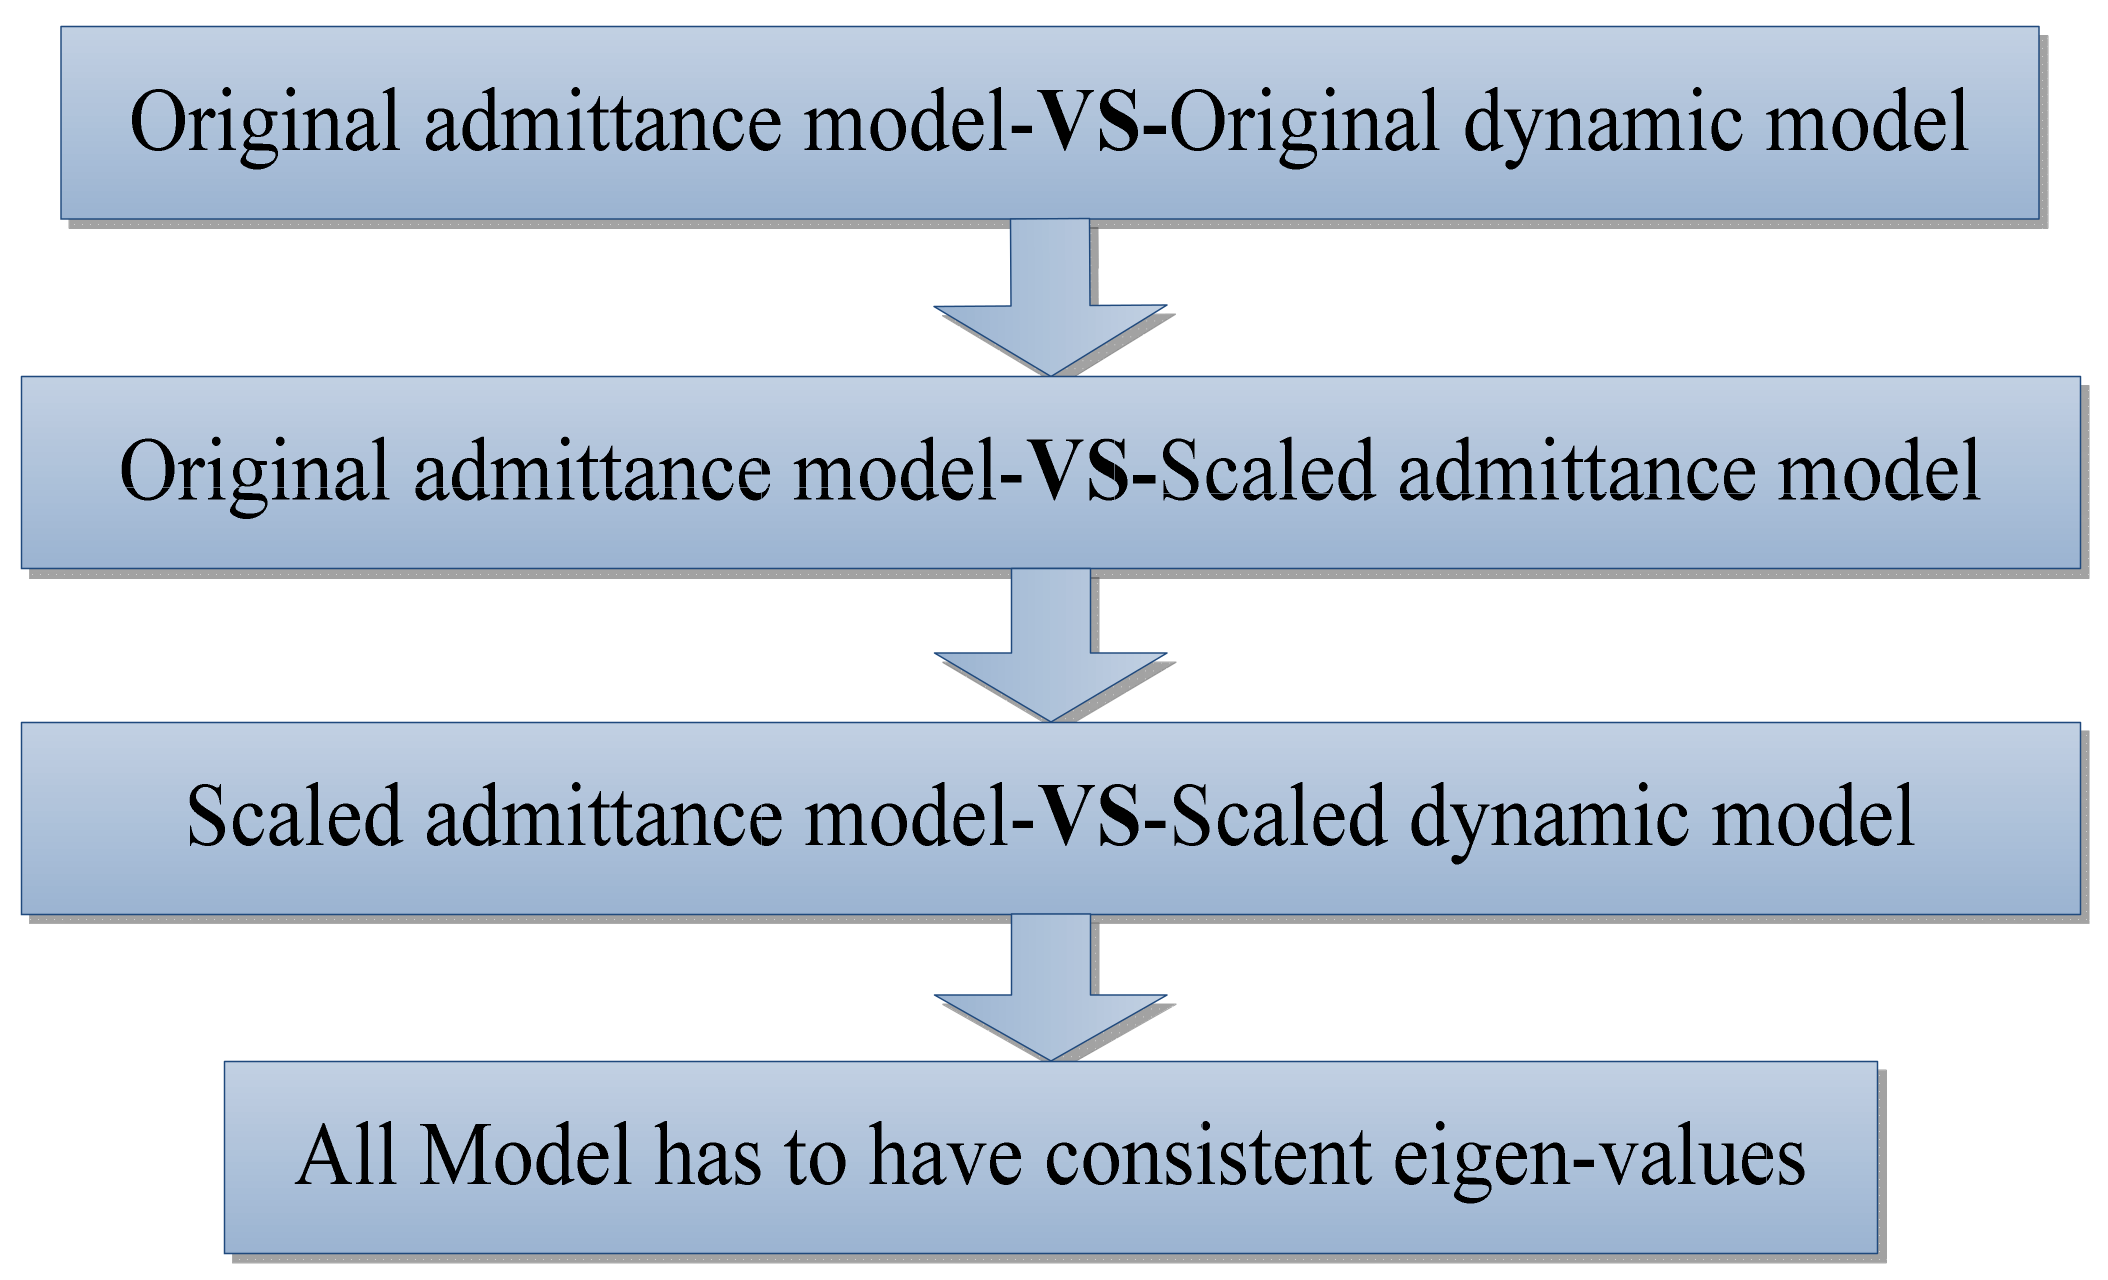
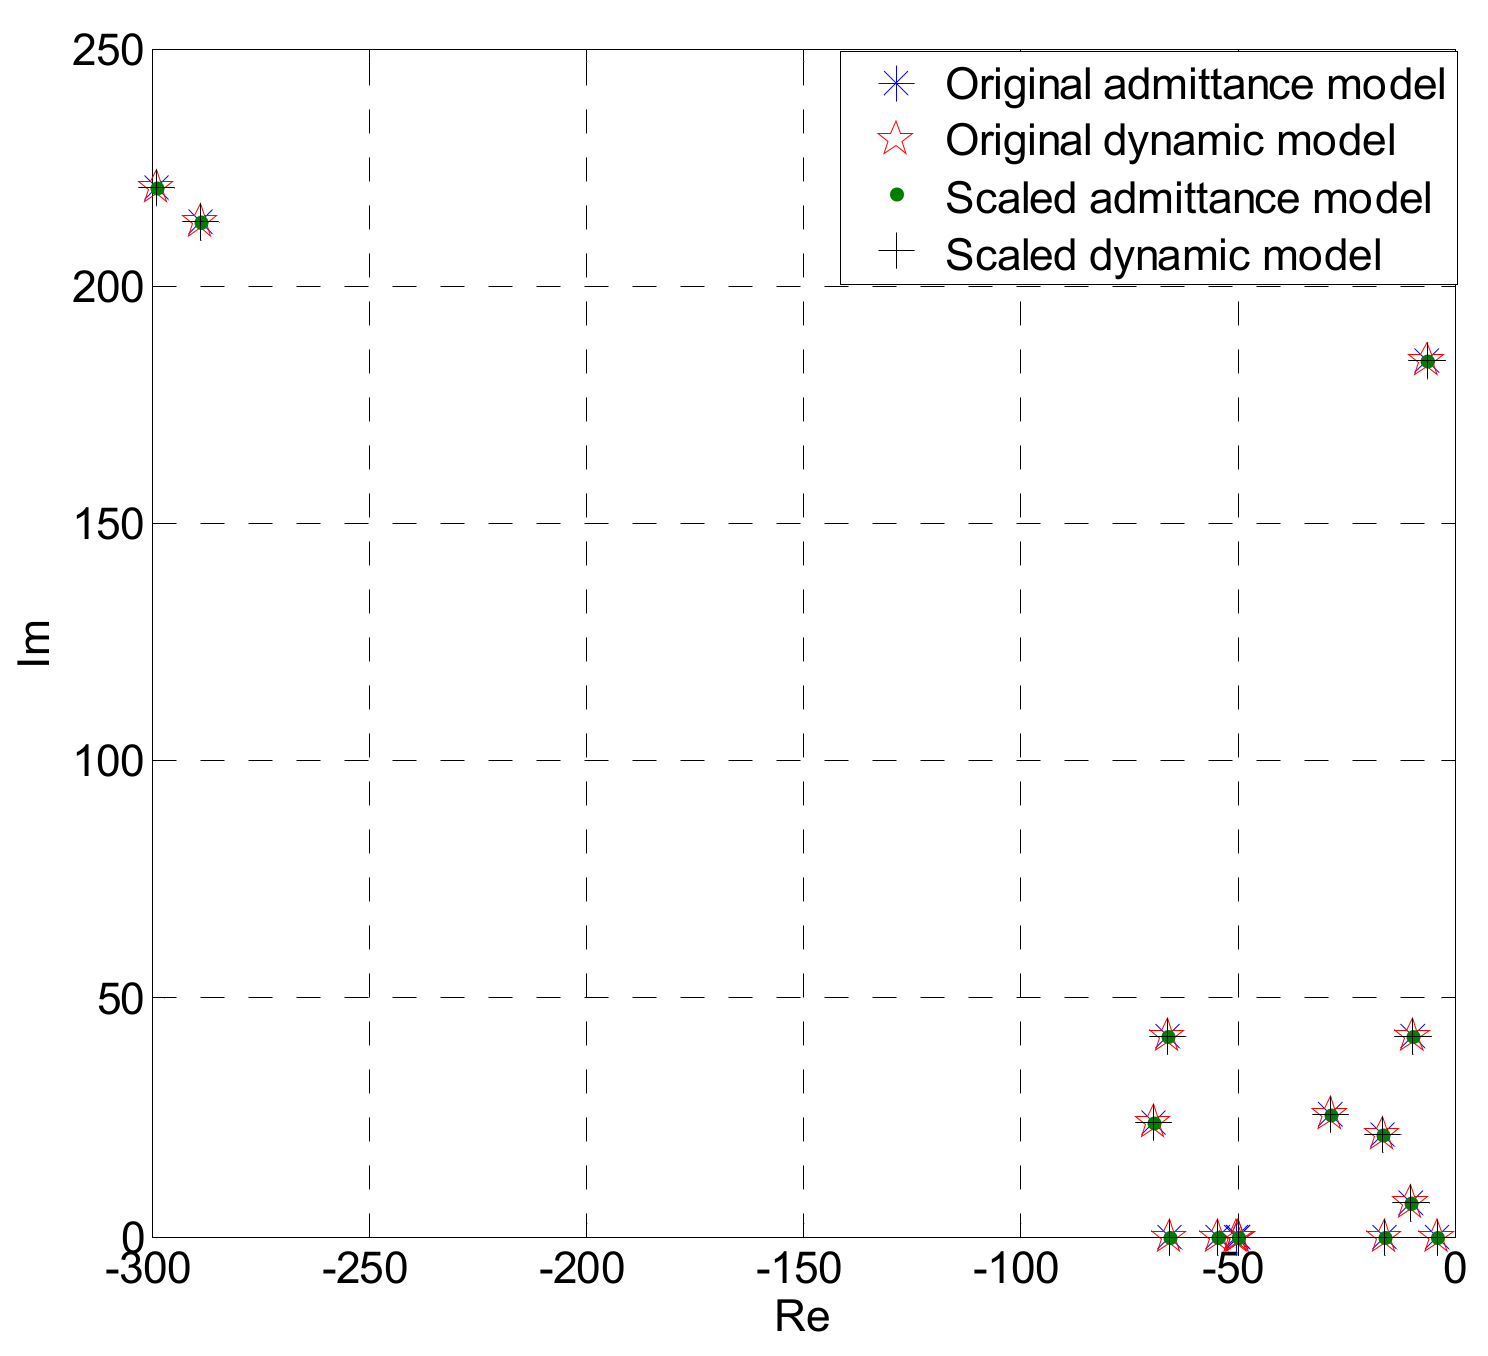
2.2.1. Scaling Technique
2.2.2. DC Link Parameter Sensitivity
2.2.3. Admittance Matrix Representation of the Integrated Grid and Filter
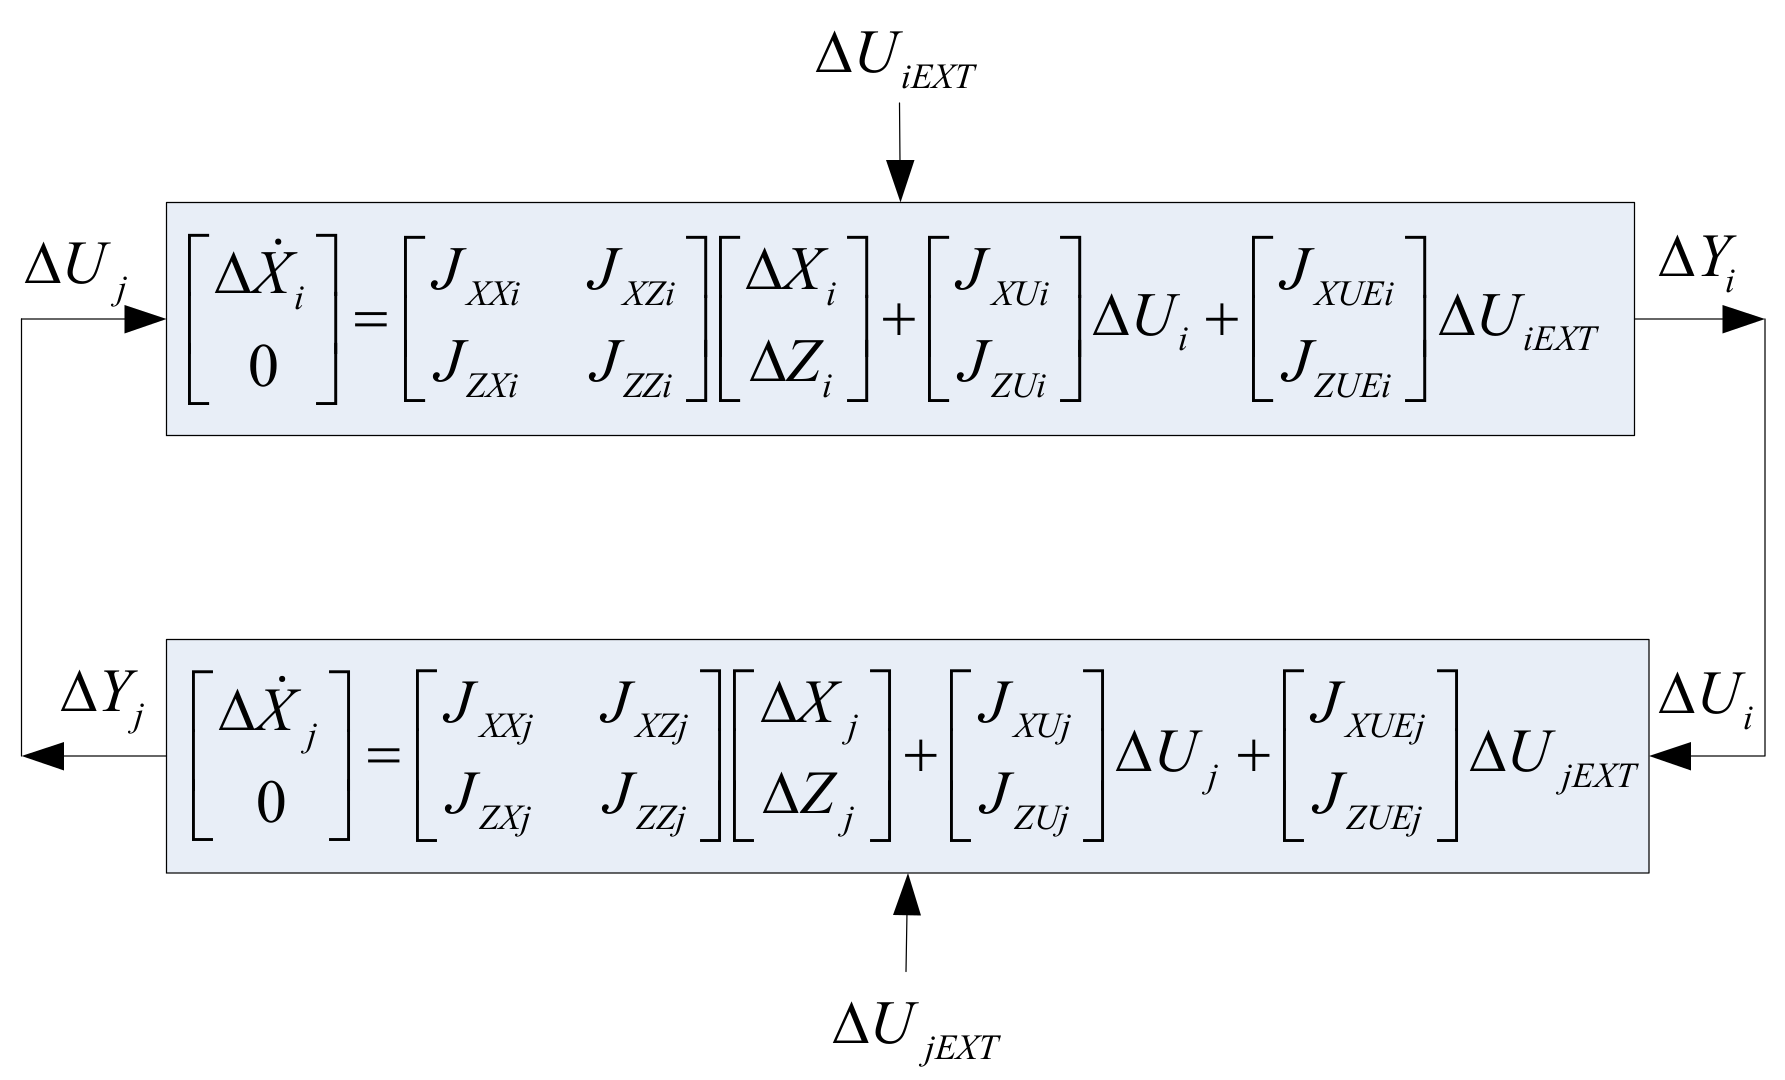
2.2.4. The Algorithm for Interconnection of the Sub-Systems
3. The Identification of Electromechanical Damping Modes of the System
4. Supplementary Controllers Design
4.1. Local PSS Design and Assessment
4.1.1. PSS Design
4.1.2. PSS Assessment
4.2. POD Design and Assessment
4.2.1. Residue Analysis
4.2.2. Local POD Design
4.2.3. Wide-Area POD Design
5. Conclusions
Author Contributions
Funding
Institutional Review Board Statement
Informed Consent Statement
Acknowledgments
Conflicts of Interest
Appendix A
Appendix A.1. Algorithm for Interconnection of Sub-Systems

Appendix A.2. Residue analysis of the System

| Mode | Rectifier Side Power Reference Input | |||||||||||||||||||
| Local Signal | Wide Area Signal | |||||||||||||||||||
| ΔPL12 | ΔPL34 | ΔωBS | ΔδBS | ΔωBM | ΔδBM | ΔωBA | ΔδBA | ΔωBI | ΔδBI | |||||||||||
| Mag | Ang | Mag | Ang | Mag | Ang | Mag | Ang | Mag | Ang | Mag | Ang | Mag | Ang | Mag | Ang | Mag | Ang | Mag | Ang | |
| I40 | 1.8 × 10⁻⁸ | 7.977 | 1.92 × 10⁻⁷ | 40.21 | 2.67 × 10⁻¹¹ | −85.879 | 2.14 × 10⁻⁹ | 4.4266 | 1.26 × 10⁻¹⁰ | −18.249 | 1.01 × 10⁻⁸ | 72.057 | 2.14 × 10⁻¹⁰ | −30.191 | 1.71 × 10⁻⁸ | 60.114 | 3.39 × 10⁻¹⁰ | −54.016 | 2.68 × 10⁻⁸ | 30.107 |
| I35 | 5.56 × 10⁻⁸ | 18.854 | 2.04 × 10⁻⁷ | −54.671 | 7.46 × 10⁻¹¹ | −70.941 | 6.81 × 10⁻⁹ | 18.144 | 2.24 × 10⁻¹⁰ | 4.7301 | 2.04 × 10⁻⁸ | −86.186 | 1.45 × 10⁻¹⁰ | 78.327 | 1.32 × 10⁻⁸ | −12.588 | 4.03 × 10⁻¹⁰ | 28.82 | 3.68 × 10⁻⁸ | −67.306 |
| I25 | 9.15 × 10⁻⁸ | 25.881 | 4.01 × 10⁻⁸ | 52.865 | 8.67 × 10⁻¹¹ | −60.239 | 1.19 × 10⁻⁸ | 26.285 | 8.86 × 10⁻¹¹ | −53.842 | 1.21 × 10⁻⁸ | 32.683 | 9.05 × 10⁻¹² | 5.6807 | 1.24 × 10⁻⁹ | −87.795 | 7.60 × 10⁻¹¹ | −24.096 | 1.02 × 10⁻⁸ | 57.854 |
| I15 | 0.0045244 | −3.4094 | 0.0066914 | 89.684 | 3.31 × 10⁻⁶ | −89.091 | 0.0006068 | −2.3052 | 7.99 × 10⁻⁶ | −55.874 | 0.0014634 | 30.911 | 2.01 × 10⁻⁵ | −24.17 | 0.0036817 | 62.615 | 2.76 × 10⁻⁵ | −14.135 | 0.005093 | 70.661 |
References
- AEMO. AEMO Australian Energy Market Operator. Available online: www.aemo.com.au (accessed on 1 March 2022).
- Nguyen, M.H.; Eghbal, M.; Saha, T.K.; Modi, N. Investigation of Oscillation Damping for connecting remote generators to a large power system. In Proceedings of the Innovative Smart Grid Technologies Asia (ISGT), Perth, WA, Australia, 13–16 November 2011; pp. 1–8. [Google Scholar]
- Huong, M.N.; Saha, T.K.; Eghbal, M. Investigation on the impact of hybrid multi-terminal HVDC system combining LCC and VSC technologies using system identification. In Proceedings of the Universities Power Engineering Conference (AUPEC), 2012 22nd Australasian, Bali, Indonesia, 26–29 September 2012; pp. 1–6. [Google Scholar]
- Nguyen, M.H.; Saha, T.K.; Eghbal, M. Hybrid multi-terminal LCC HVDC with a VSC Converter: A case study of Simplified South East Australian system. In Proceedings of the Power and Energy Society General Meeting, San Diego, CA, USA, 22–26 July 2012; pp. 1–8. [Google Scholar]
- de Silva, R.; Robbie, A. Network Extensions to Remote Areas: Part 2–Innamincka Case Study; Power Systems Consultants Australia Pty Ltd.: Melbourne, Australia, 2009. [Google Scholar]
- Povh, D.; Retzmann, D.; Teltsch, E.; Kerin, U.; Mihalic, R. Advantages of large ac/dc system interconnections. Rep. B4-304 CIGRE Sess. 2006, 1–10. [Google Scholar]
- Pan, J.; Nuqui, R.; Srivastava, K.; Jonsson, T.; Holmberg, P.; Hafner, Y.-J. AC grid with embedded VSC-HVDC for secure and efficient power delivery. In Proceedings of the 2008 IEEE Energy 2030 Conference, Atlanta, GA, USA, 17–18 November 2008; pp. 1–6. [Google Scholar]
- Latorre, H.F.; Ghandhari, M.; Soder, L. Use of local and remote information in POD control of a VSC-HVdc. In Proceedings of the PowerTech, Bucharest, Romania, 28 June–2 July 2009; pp. 1–6. [Google Scholar]
- Weixing, L.; Ooi, B.T. Simultaneous inter-area decoupling and local area damping by voltage source HVDC. In Proceedings of the 2001 IEEE Power Engineering Society Winter Meeting, Columbus, OH, USA, 28 January–1 February 2001; Volume 3, pp. 1079–1084. [Google Scholar]
- Piwko, R.J.; Larsen, E.V. HVDC System Control for Damping of Subsynchronous Oscillations. IEEE Trans. Power Appar. Syst. 1982, PAS-101, 2203–2211. [Google Scholar] [CrossRef]
- Kundur, P. Power System Stability And Control; McGraw-Hill: New York, NY, USA, 1994. [Google Scholar]
- Vowles, D.J.; Samarasinghe, C.; Gibbard, M.J.; Ancell, G. Effect of wind generation on small-signal stability—A New Zealand Example. In Proceedings of the Power and Energy Society General Meeting—Conversion and Delivery of Electrical Energy in the 21st Century, Pittsburgh, PA, USA, 20–24 July 2008; pp. 1–8. [Google Scholar]
- Gibbard, M.J.; Vowles, D.J.; Pourbeik, P. Interactions between, and effectiveness of power system stabilizers and FACTS device stabilizers in multimachine systems. IEEE Trans. Power Syst. 2000, 2, 1532. [Google Scholar]
- Chang, Y. Design of HVDC and SVC Coordinate Damping Controller Based on Wide Area Signal. Int. J. Emerg. Electr. Power Syst. 2006, 7, 6. [Google Scholar] [CrossRef]
- Yong, C.; Zheng, X.; Gaihong, C.; Jiani, X. A novel SVC supplementary controller based on wide area signals. In Proceedings of the Power Engineering Society General Meeting, Montreal, QC, Canada, 18–22 June 2006; p. 7. [Google Scholar]
- Uhlen, K.; Vanfretti, L.; de Oliveira, M.; Leirbukt, A.; Aarstrand, V.H.; Gjerde, J.O. Wide-Area Power Oscillation Damper implementation and testing in the Norwegian transmission network. In Proceedings of the Power and Energy Society General Meeting, San Diego, CA, USA, 22–26 July 2012; pp. 1–7. [Google Scholar]
- Ying, J.-H.; Duchen, H.; Linden, K.; Hyttinen, M.; de Toledo, P.F.; Tulkiewicz, T.; Skytt, A.K.; Bjorklund, H. Improvement of subsynchronous torsional damping using VSC HVDC. In Proceedings of the International Conference on Power System Technology, Kunming, China, 13–17 October 2002; Volume 2, pp. 998–1003. [Google Scholar]
- Chao, Z.; Zhou, X.; Ruomei, L. Dynamic Modeling and Transient Simulation for VSC based HVDC in Multi-Machine System. In Proceedings of the 2006 International Conference on Power System Technology, Chongqing, China, 22–26 October 2006; pp. 1–7. [Google Scholar]
- Latorre, H.F.; Ghandhari, M.; Soder, L. Control of a VSC-HVDC Operating in Parallel with AC Transmission Lines. In Proceedings of the Transmission & Distribution Conference and Exposition: Latin America, 2006. TDC ’06. IEEE/PES, Caracas, Venezuela, 15–18 August 2006; pp. 1–5. [Google Scholar]
- Latorre, H.F.; Ghandhari, M. Improvement of voltage stability by using VSC-HVdc. In Proceedings of the Transmission & Distribution Conference & Exposition: Asia and Pacific, Seoul, Korea, 26–30 October 2009; pp. 1–4. [Google Scholar]
- Preece, R.; Milanovic, J.V.; Almutairi, A.M.; Marjanovic, O. Damping of Inter-Area Oscillations in Mixed AC/DC Networks Using WAMS Based Supplementary Controller. IEEE Trans. Power Syst. 2013, 28, 1160–1169. [Google Scholar] [CrossRef]
- Domínguez-García, J.L.; Gomis-Bellmunt, O.; Bianchi, F.D.; Sumper, A. Power oscillation damping supported by wind power: A review. Renew. Sustain. Energy Rev. 2012, 16, 4994–5006. [Google Scholar] [CrossRef]
- Heniche, A.; Kamwa, I. Assessment of Two Methods to Select Wide-Area Signals for Power System Damping Control. IEEE Trans. Power Syst. 2008, 23, 572–581. [Google Scholar] [CrossRef]
- Modi, N.; Lloyd, M.; Saha, T.K. Wide-area signal selection for power system damping controller. In Proceedings of the Universities Power Engineering Conference (AUPEC), 2011 21st Australasian, Brisbane, QLD, Australia, 25–28 September 2011; pp. 1–6. [Google Scholar]
- Pourbeik, P.; Gibbard, M.J. Tuning of SVC stabilisers for the damping of inter-area modes of rotor oscillation. In Proceedings of the Australasian Universities Power Engineering Conference, Nedlands, WA, Australia, 27–29 September 1995. [Google Scholar]
- Gibbard, M. Tuning of Power System Stabilizaers(PSS); School of Electrical and Electronic Engineering Notes, The University of Adelaide: Adelaide, Australia, 1998. [Google Scholar]
- Vowles, D.J. Tuning of Stabilizers for FACTS Devices; School of Electrical and Electronic Engineering Notes, The University of Adelaide: Adelaide, Australia, 1998. [Google Scholar]
- Gibbard, M. Co-ordinated design of multimachine power system stabilisers based on damping torque concepts. IEE Proc. C (Gener. Transm. Distrib.) 1988, 135, 276–284. [Google Scholar] [CrossRef]
- Gibbard, M.J. Robust design of fixed-parameter power system stabilisers over a wide range of operating conditions. IEEE Trans. Power Syst. 1991, 6, 794–800. [Google Scholar] [CrossRef]
- Gibbard, M.J.; Martins, N.; Sanchez-Gasca, J.J.; Uchida, N.; Vittal, V.; Wang, L. Recent applications of linear analysis techniques. IEEE Trans. Power Syst. 2001, 16, 154–162. [Google Scholar] [CrossRef]
- Spallarossa, C.; Pipelzadeh, Y.; Chaudhuri, B.; Green, T. Assessment of disturbance propagation between AC grids through VSC HVDC links using reduced Great Britain model. In Proceedings of the 10th IET International Conference on AC and DC Power Transmission (ACDC 2012), Birmingham, UK, 4–5 December 2012. [Google Scholar]
- Wang, J.; Fu, C.; Zhang, Y. Design of WAMS-Based Multiple HVDC Damping Control System. IEEE Trans. Smart Grid 2011, 2, 363–374. [Google Scholar] [CrossRef]
- Zhang, J.; Chung, C.Y.; Zhang, S.; Han, Y. Practical Wide Area Damping Controller Design Based on Ambient Signal Analysis. IEEE Trans. Power Syst. 2013, 28, 1687–1696. [Google Scholar] [CrossRef]
- Grainger, W.; Parker, C.; Wright, P. Commissioning a new interconnection between two regions in Australia. Cigre Electra Magazine, April 2001; 10–17. [Google Scholar]
- Hiley, S. Redesign of the Blackwall Static Var Compensator Power Oscillation Damper Controller. School of Information Technology and Electrical Engineering; the University of Queensland: Brisbane, Australia, 2007. [Google Scholar]
- Latorre, H.F.; Ghandhari, M.; Söder, L. Active and reactive power control of a VSC-HVdc. Electr. Power Syst. Res. 2008, 78, 1756–1763. [Google Scholar] [CrossRef]
- Vowles, D.J.; Gibbard, M. Simplified 14-Generator Model of the SE Australian Power System. Univ. Adel. South Aust. 2014, 18, 1–38. [Google Scholar]
- Liying, W. Modeling, Control and Stability Analysis of VSC-HVDC links Embedded in a Weak Multi-Machine AC System. Ph.D. Thesis, School of Electrical and Electrinic Engineering, the University of Adelaide, Adelaide, Australia, 2013. [Google Scholar]
- China HVDC Transmission, Special Report, ABB PEI Power Engineering International. Available online: https://library.e.abb.com/public/d55e6e1fc25ef3d8c1256f4000370e0e/PT_HVDC_TransmChina.pdf (accessed on 1 March 2022).
- Yang, F. Study on Parameter Optimization of HDVC PI Controllers. Power Syst. Technol. 2006, 30, 15–20. [Google Scholar]
- Jacobson, B.W.B.; Bahrman, M.P. 500 kV VSC Transmission System for lines and cables. In Proceedings of the 2012 San Francisco Colloquium, San Francisco, CA, USA; 2012. [Google Scholar]
- Karawita, C.; Annakkage, U.D. A Hybrid Network Model for Small Signal Stability Analysis of Power Systems. IEEE Trans. Power Syst. 2010, 25, 443–451. [Google Scholar] [CrossRef]
- Gibbard, M.J.; Vowles, D.J. Reconciliation of methods of compensation for PSSs in multimachine systems. IEEE Trans. Power Syst. 2004, 19, 463–472. [Google Scholar] [CrossRef]
- Sadikovic, R.; Andersson, G.; Korba, P. Damping controller design for power system oscillations. Intell. Autom. Soft Comput. 2006, 12, 51–62. [Google Scholar] [CrossRef]
- Podrucky, S. Small Signal Modeling of Resonant Controlled VSC Systems; University of Toronto: Toronto, QC, Canada, 2009. [Google Scholar]
- Rault, P.; Colas, F.; Guillaud, X.; Nguefeu, S. Method for small signal stability analysis of VSC-MTDC grids. In Proceedings of the Power and Energy Society General Meeting, San Diego, CA, USA, 22–26 July 2012; pp. 1–7. [Google Scholar]


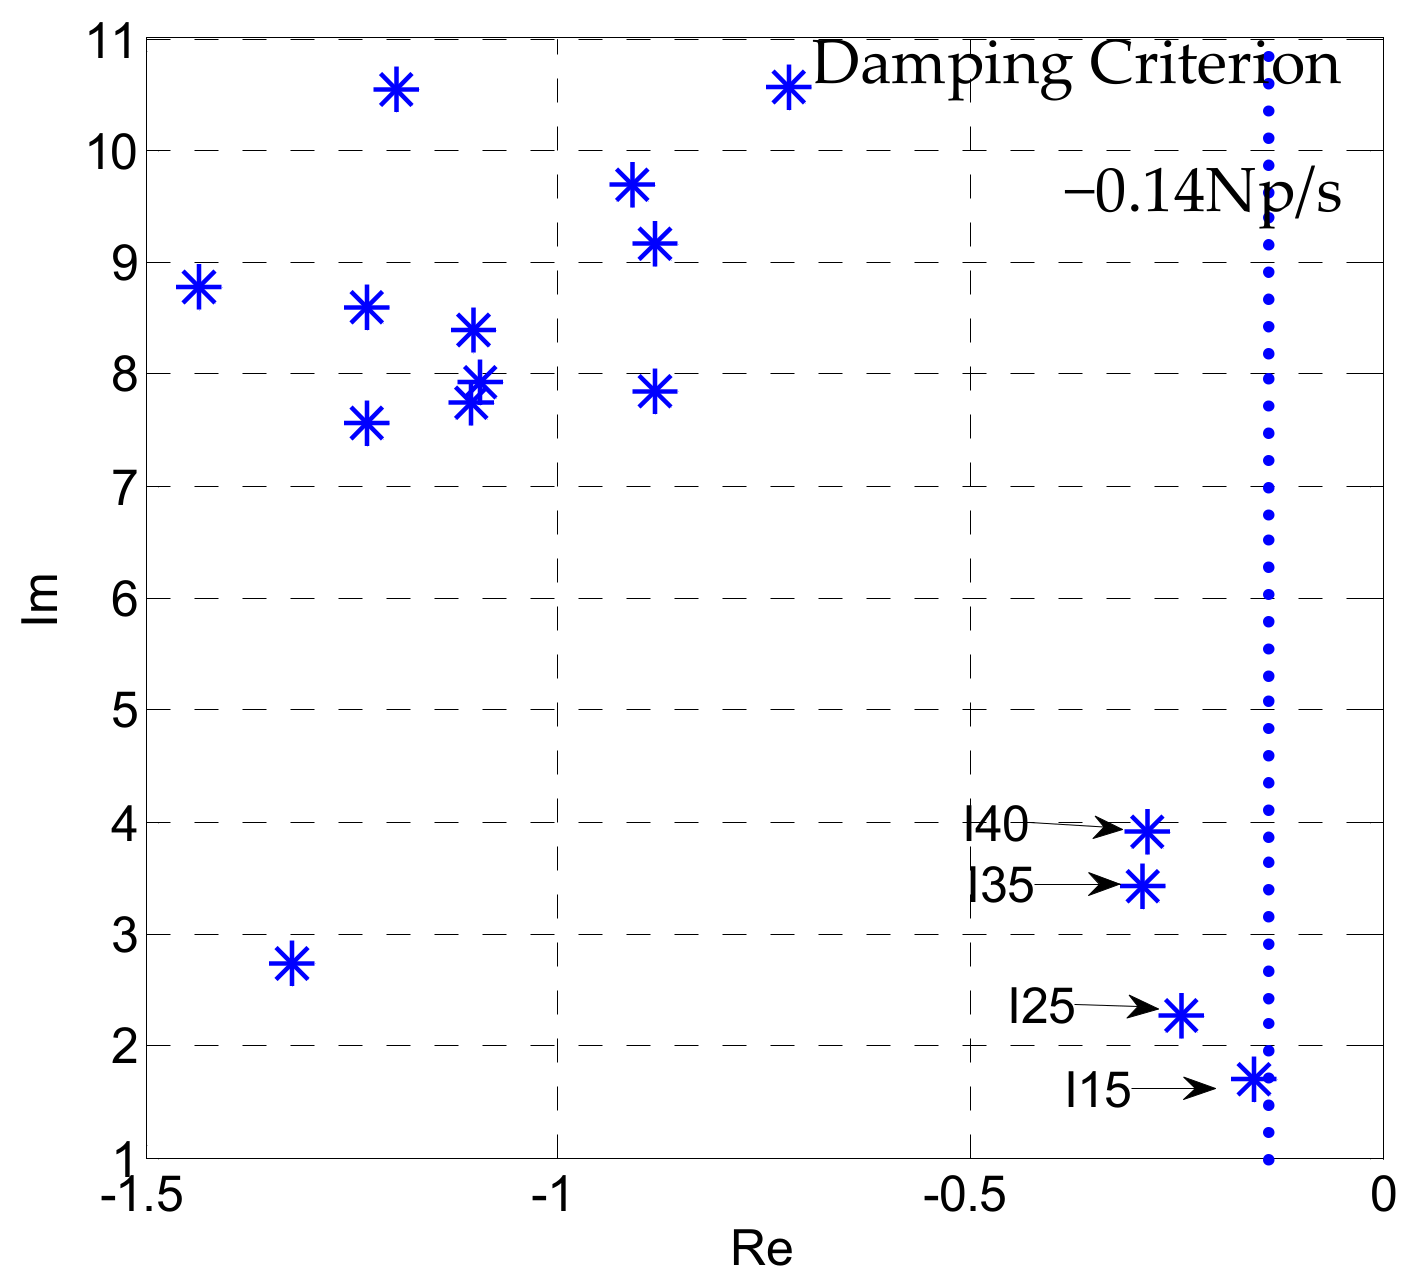


| Mode | Case: Three Generators (Innamincka) with PSSs Out of Service | |||
|---|---|---|---|---|
| Real | Imag. | Damping Ratio | Mode Description | |
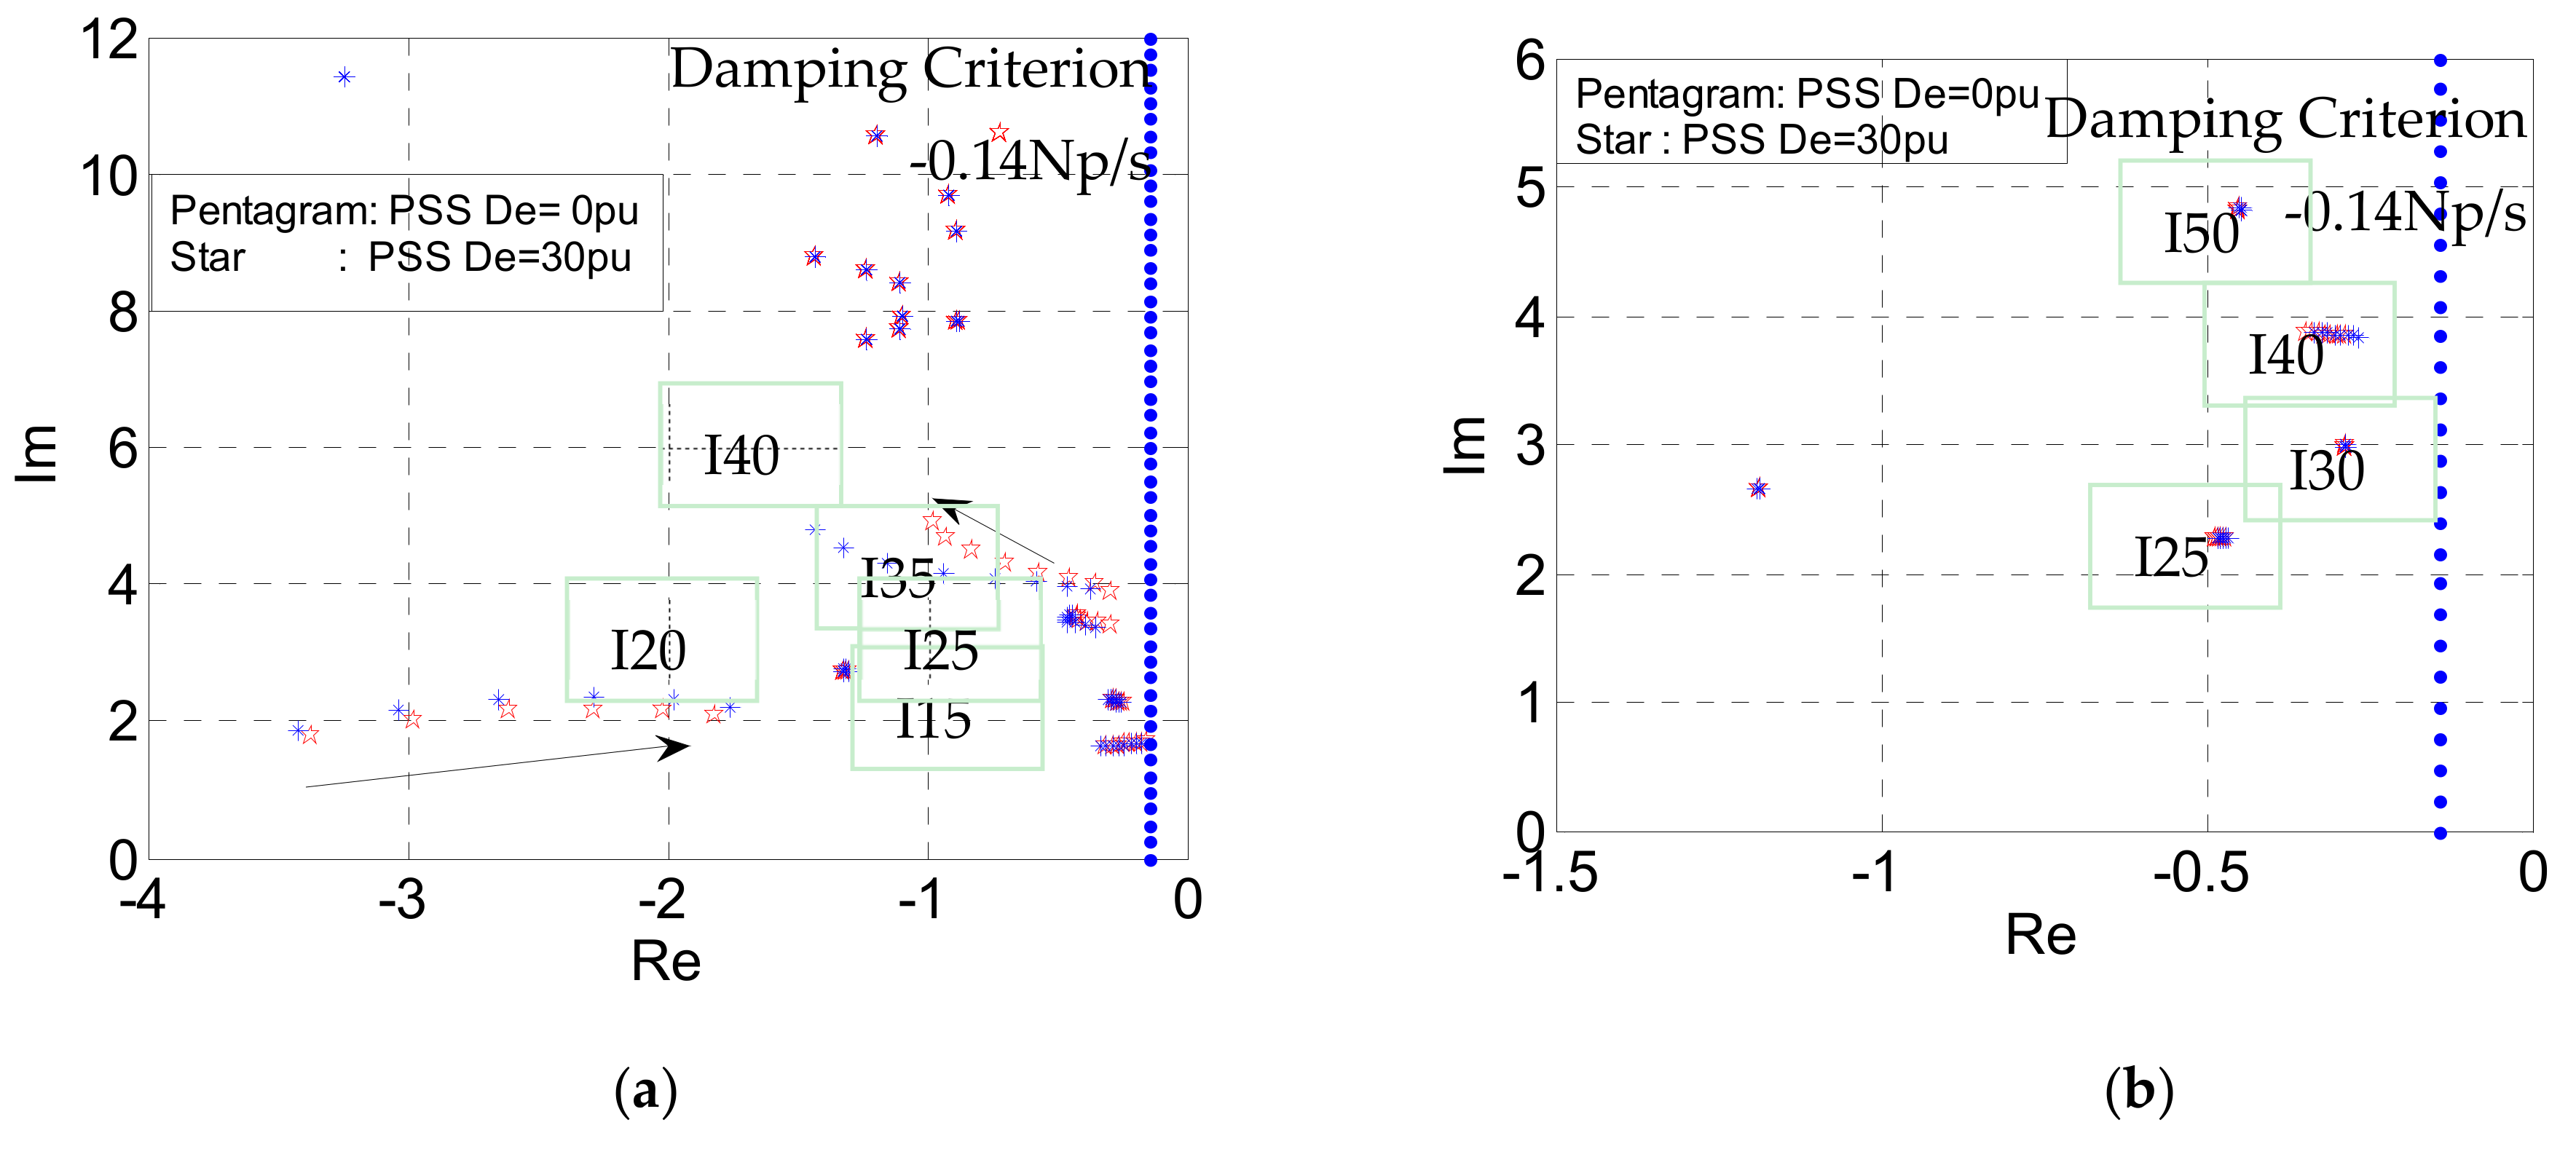
| I 40 | −0.286 | 3.907 | 0.073 | Innamincka and VIC, and Canberra VS SA |
| I 35 | −0.290 | 3.417 | 0.085 | Innamincka VS VIC and SA |
| I 25 | −0.242 | 2.273 | 0.106 | Innamincka and SA and QLD VS VIC, NSW, and Canberra |
| I 15 | −0.154 | 1.703 | 0.090 | QLD VS Innamincka and SA, and VIC |
Publisher’s Note: MDPI stays neutral with regard to jurisdictional claims in published maps and institutional affiliations. |
© 2022 by the authors. Licensee MDPI, Basel, Switzerland. This article is an open access article distributed under the terms and conditions of the Creative Commons Attribution (CC BY) license (https://creativecommons.org/licenses/by/4.0/).
Share and Cite
Wang, L.; Ertugrul, N.; Negnevitsky, M. Enhancement of the System Stability of DB-Controlled VSC Links Parallel Operated with a Weak Multi-Machine AC Power System. Energies 2022, 15, 2424. https://doi.org/10.3390/en15072424
Wang L, Ertugrul N, Negnevitsky M. Enhancement of the System Stability of DB-Controlled VSC Links Parallel Operated with a Weak Multi-Machine AC Power System. Energies. 2022; 15(7):2424. https://doi.org/10.3390/en15072424
Chicago/Turabian StyleWang, Liying, Nesimi Ertugrul, and Michael Negnevitsky. 2022. "Enhancement of the System Stability of DB-Controlled VSC Links Parallel Operated with a Weak Multi-Machine AC Power System" Energies 15, no. 7: 2424. https://doi.org/10.3390/en15072424
APA StyleWang, L., Ertugrul, N., & Negnevitsky, M. (2022). Enhancement of the System Stability of DB-Controlled VSC Links Parallel Operated with a Weak Multi-Machine AC Power System. Energies, 15(7), 2424. https://doi.org/10.3390/en15072424