Article

A Comparison of Multi-Criteria Decision Analysis Methods for Sustainability Assessment of District Heating Systems

1
Institute of Microbiology and Biotechnology, University of Latvia, Jelgavas iela 1, LV-1004 Riga, Latvia
2
Department of Political Science, Riga Stradins University, Dzirciema iela 16, LV-1007 Riga, Latvia
*
Author to whom correspondence should be addressed.
Energies 2022, 15(7), 2411; https://doi.org/10.3390/en15072411
Submission received: 8 March 2022 / Revised: 22 March 2022 / Accepted: 23 March 2022 / Published: 25 March 2022

Abstract

:
The sustainability of energy systems is increasingly assessed for development of more resilient, greener district heating (DH) systems. That requires compiling technological, environmental, and economic indicators in a social, political, and institutional context. This work investigates DH system sustainability analysis by five frequently applied multi-criteria decision analysis (MCDA) methods—WSM, TOPSIS, PROMETHEE, ELECTRE and DEA. To compare the sustainability assessment results, a selection of 8 criteria describing 12 DH companies (DHC) was examined. Sensitivity analysis was performed to determine the most credible MCDA method. Criteria weights were changed: (1) individually for evaluation of the range of stability for alternatives (score of DHC performance); (2) individually by a fixed value to compare how each criterion weight change affected the average score of a result; and (3) to compare the AHP weighting method to an equal weight scenario. The results of sensitivity analysis along with literature investigation shows that all methods are suitable for sustainability analyses of DH systems while also having differences in the calculation process and in the interpretation of results. The generalized algorithm for sustainability analysis in the energy sector outlined in this study along with the documented features of the main MCDA methods can be used as a guide for future assessment of energy systems by researchers and industry professionals.

1. Introduction

Transition toward sustainable energy systems necessitate the increased proportional use of renewable resources, as well as the modernization and the development of new and existing district heating (DH) networks that are more efficient, to combat climate change. This is supported by the United Nations Sustainable Development Goals (SDGs), in particular Goal 7 on affordable and clean energy and its sub-targets, to increase the share of renewable energy, improve energy efficiency, and facilitate cooperation for research on clean energy and technologies [1]. A sustainability assessment of existing energy systems therefore provides an insight into the current state of DH in a region or sector, and it facilitates decision-making in development and in investment. To impartially perform these evaluations, multi-criteria decision analysis (MCDA) is often employed.
A family of mathematical methods, MCDA can provide decision support for complex cases with opposing objectives, different data types, and high variability [2]. The use of these tools becomes necessary in the selection of heating systems that are hard to compare based on a diverse set of sustainability indicators [3].
Most literature highlight MCDA methods without any justification for their selection. Since the goal of using MCDA is minimization of subjectivity in decision analysis and different MCDA methods can by design lead to different outcomes [4], the method choice should also be justified. No consensus on the best-performing MCDA method exists, so decision-makers often make their selection based on previous experience or recommendations.
In the field of DH, MCDA and other decision-making methods can be used to identify the best technological solution [5], the most sustainable scenario for development of a DH system [6] or DH companies (DHC) [7], the best technological solution [8], and the environmental sustainability of countries [9]. As a result, MCDA is used for decision-making at different levels of DH systems (separate area, DH company, DH system of a city or municipality, national DH policy) (Figure 1). The sustainability assessment of an energy system should refer to the interplay between energy security, energy equity, and environmental sustainability. These three pillars are the energy trilemma, and they are to some extent in competition with each other. This leads to the need for precisely stated questions and a clearly defined purpose for the application of the MCDA. Sustainable and efficient district heating is one of the components of the EU smart city concept [10]. For instance, industrial waste/excess heat integration in district heating can lead to a reduction in CO2 emissions (decarbonization) and in production costs [11,12]. In one of the projects related to the smart cities concept, cities were also compared using criteria from disciplines such as the smart economy, mobility, the environment, people, living, and governance [13].
The transition towards fourth generation DH (4GDH) is closely related to the introduction of renewable energy sources (RES) into a DH system and considerable reduction of CO2 emissions [14]. Similarly, fifth generation DH (5GDH) is proposed to lower network temperatures and to develop joint centralized heating and cooling while simultaneously contributing to decarbonization efforts [15]. Each development alternative requires funding and/or application of policy instruments (taxes, subsidies). Thus, MCDA is executed by comprising several criteria: technological, energy, economic, environmental, social, institutional and/or political, and governance [2]. More often, quantitative criteria are selected for the analysis, while qualitative criteria can also be used.
The structure of a DH system includes three main components: heat sources, transmission and distribution pipelines, and heat consumers. The parameters of each DH system component may be included in the initial matrix for the sustainability assessment. For example, increasing the impact of an intelligent grid control system could increase the efficiency of the DH system and reduce emissions, improving the sustainability of the DH system [16]. Therefore, the transmission system parameters can be included in the assessment. An MCDA can be applied to assess the sustainability of the whole system or depending on the selected system’s boundary (Figure 1). For instance, multi-objective optimization of a novel air-source absorption heat pump system as the heat source for a residential DH area has been conducted based on MCDA decision-making [17].
Several systematic literature reviews comprehensively explain the application of different MCDA methods for the integration of RES into the energy supply, considering technological, economic, environmental, social, and institutional criteria (see e.g., [8,11]). However, studies exploring the practical application of different MCDA methods that also perform sensitivity analysis to assess the robustness of results are rare. Implementation of different MCDA methods can often produce different results [3] and the use of multiple methods can therefore be used to gain confidence in results. Meanwhile, after studying 343 MCDA articles that address decision-making in the field of sustainable development. Kandakoglu et al. (2019) found that only 21% of articles used sensitivity analysis to assess weight value uncertainty or overall MCDA model imprecisions [18].
In this study, we aim to look at the most widespread decision-making methods for every step of general sustainability analysis and to identify the main strengths and weaknesses within each one of the methods in the DH sector.

2. Materials and Methods

An algorithm applied in this study for comparing MCDA methods is presented in Figure 2. The first part of our methodology consists of a literature review, selection of MCDA methods, and characterization of the selected case study. In the second part, criteria weighting, data normalization, and alternative ranking via MCDA methods is conducted. The third part is sensitivity analysis for determination of the best-performing and the most credible MCDA method(s) for DH-related studies.
The methods selected for comparison are the analytic hierarchy process (AHP), weighted sum method (WSM), technique for order of preference by similarity to ideal solution (TOPSIS), elimination and choice expressing reality (ELECTRE), preference ranking organization method for enrichment evaluation (PROMETHEE), and data envelopment analysis (DEA), as they are among the most widely used MCDA methods in studies related to DH and in the closely related field of renewable energy [19]. As AHP is more frequently used in criteria weighting than in alternative ranking, we look at it separately from other ranking methods. Meanwhile, TOPSIS along with DEA seem to be the most widely used MCDA methods in the published scientific articles about DH, with PROMETHEE or ELECTRE being less often applied [7,17,20,21,22,23,24,25,26,27,28,29,30,31,32,33,34,35,36,37,38,39,40,41,42,43,44,45,46,47,48,49,50,51,52,53,54,55,56] (see Supplementary Material).
Each of the selected methods was applied to a case study of 12 Latvian district heating companies (DHC). Accordingly, a set of criteria was selected, and the corresponding weights were assigned based on the AHP method, while ranking of the DHCs was performed with WSM, TOPSIS, ELECTRE, PROMETHEE, and DEA. Sensitivity analysis was conducted to test the robustness of the results and to provide extra insight into each method’s constructed behavior. Finally, the results of an MCDA methods assessment and comparison were interpreted, and their flaws and strengths were summarized to conclude on the use of MCDA for sustainability assessments of DH systems.

2.1. Criteria Selection

Accurate criteria selection is a vital part of sustainability analysis. Criteria must be relevant to the field and encompass technical, economic, and environmental indicators to accurately portray the efficiency, cost, and sustainability of each DH system. Criteria should also be independent of each other to minimize redundancy and to simplify of the model.
The targets set by the European Union for the decarbonization of the energy system are closely linked to the DH system transition toward 4GDH and 5GDH. Society is increasingly involved in the transition process. Consumers engage in heat and power generation to become prosumers [57]. Sometimes the public is not sufficiently informed about the potential of low-emission technology; and, as a result, these non-technical factors become important drivers and constraints on the path to decarbonization [58]. For this reason, social, political, and institutional criteria should be included in DH development models alongside standard technical, economic, and environmental indicators.
The number of selected criteria is an important constituent of the MCDA. Logically, the more criteria there are, the less significant each becomes in the MCDA model. Conversely, having only a couple of criteria cannot fully encompass the characteristics of the various alternatives.
The most widespread method of criteria selection in renewable energy research is a review of the literature, where previous relevant research is assessed to collect a list of the most appropriate criteria for the occasion [19]. That can be done by authors based on their experience and research, or by a set protocol to be more methodical. No widespread methodology for criteria selection based on literature review exists and an intuitive selection of criteria can bring additional subjectivity in the process.
In the field of renewable energy, the Delphi method has been used to determine criteria for MCDA [59,60]. The Delphi method is a method for collection and interpretation of expert judgments through multiple rounds of sequential and evolving questionnaires. The traditional Delphi method consists of multiple iterations of data collection that build upon previously amassed information to achieve consensus among the interviewees [61]. The first round is equivalent to an anonymous brainstorming session. The second questionnaire asks experts to consider and rate every response that has been compiled by researchers from the first round. The third and the following rounds are usually performed until a consensus on rating/ranking is reached. This method requires substantial planning and curating from the researcher’s/consultant’s side. The lengthy multi-step consulting process may also be excessive for some applications for each DHC to quantitatively represent each criterion.
For this study, 8 criteria were selected for comparison of the selected 12 DHCs. The criteria selection was based on a literature review and consultations with a panel of experts. Some criteria were considered as minimizable and some as maximizable (see Table 1). The type of a criterion (min or max) depended on the assessment’s target [62].
The goal of applying MCDA was to determine the sustainability rating of the 12 Latvian DHC based on the concept of the 4GDH by considering technological, economic, environmental, and institutional criteria. The study includes two environmental criteria (CO2 emissions and the share of RES), one economic criterion (heat tariff that characterizes the economic efficiency of DHS operation), four technological criteria (installed capacity utilization rate, heat losses in DH transmission system, average supply water temperature, produced heat in cogeneration), and one institutional criterion (heat consumption of buildings). The technological criteria partially overlap with or relate to economic and environmental performance of a DH company. Low-temperature DH is one of the 4GDH components as lower heat carrier supply temperature reduces heat losses in networks, which in turn impacts fuel consumption and, as a result, the CO2 emissions of the DH system. The installed capacity utilization rate demonstrates how efficiently the installed capacity is used and it ultimately determines the cost-effectiveness of the DH system. The heat tariff expresses, how efficient and affordable the DH system is for heat consumers. Meanwhile, the institutional criterion—heat consumption of buildings—is one of the most important indicators, defined in Directive 2012/27/EU on energy efficiency [63]. Lower heat consumption should ensure decarbonization of the building stock by 2050. The social and political aspects of the model overlap with the economic and the institutional criteria, and they are therefore not partitioned.

2.2. Criteria Weighting

Criteria weighting is an integral part of any MCDA method. During the weighting procedure, values are assigned to the selected criteria to represent their relative importance. The simplest weighting method requires no additional input from the decision-makers as every criterion is assigned the same weight. That can be done in cases where all criteria are assumed to have very similar importance or when there is no input from decision-makers and not enough information available [2].
In case of differing relative importance of each criterion, rank-order weighting methods are used. The entropy weight method is an objective rank-order weighting technique that draws from information theory to calculate each criterions’ entropy—the uncertainty of it with respect to input data. That has the advantage of incorporating extra information in the model, as the stochasticity of the input data is a source of uncertainty in MCDA models [64].
An objective rank-order weighting can also be done by assigning weights based on statistical data in a way that adds information to the model without the subjectivity of experts [62].
The AHP method uses pair-wise comparisons to determine the importance of each criterion, i.e., its relative weight. The comparisons are quantified and formed into a matrix from which the criteria weights are calculated. Traditionally, a numerical scale ranging from 1 to 9 is used to appraise the comparison [65]. Experts’ comparisons are collected via questionnaires and then aggregated to come to a set of criteria weights. A consistency ratio is also calculated to assess the credibility of the results.
Additionally, the AHP procedure was applied to the selected case study of 12 DHCs. The weights were based on a survey of DH system’s stakeholders, and they reflect the stakeholders’ opinion about the importance of the criteria toward sustainability of the DH system. The obtained weights are presented in Table 1.
Pairwise comparisons of the 8 selected criteria were quantified via the 1–9 Saaty scale. The procedure along with the resulting criteria ranking and weighting was performed on a free-access software (AHP OS) [66].
The criterion weights must be normalized before application by Equation (1):
j = 1 n ω j = 1 ,
where wj—weight of criterion j; j = 1, 2, …, n. Thus, the sum of all weights must be equal to 1 or to 100%.

2.3. Data Normalization

Data can come in many forms. Normalization of data is a prerequisite for some MCDA since it allows for comparison outside the bounds of each criterion. Moreover, data normalization allows for comparison of criteria with various units, as well as for using both qualitative and quantitative criteria [67].
Several normalization techniques exist, including linear (‘Max’, ‘Max-Min’, and ‘Sum’) normalization, vector normalization, logarithmic normalization, and fuzzification normalization [68]. The choice of normalization method can impact the final ranking of alternatives; therefore, it needs to be selected carefully in parallel to the choice of weighting method and ranking MCDA method [69].
Several studies have proven that vector normalization is the most suitable technique for the TOPSIS [68,70] and the WSM [71] methods. Meanwhile, the linear ‘Max’ method is shown to be effective (second-best option) in the TOPSIS method when the number of criteria is below 5, while the linear ‘Max-Min’ normalization technique is shown to be more effective when the number of criteria is larger (Equations (3) and (4)) [72].
In this study, we have used the linear ‘Max’ normalization technique for all compared MCDA methods. In the linear ‘Max’ technique, the normalized minimizable and the normalized maximizable values of criteria are obtained by Equations (2) and (3), respectively.
r i j = m a x x i j x i j m a x x i j m i n x i j ,
r i j = x i j m i n x i j m a x x i j m i n x i j ,
where rij—the normalized value of criterion xij; maxxij—maximal criterion value; minxij—minimal criterion value; xij—criterion value; i—number of alternatives; j—number of criteria.

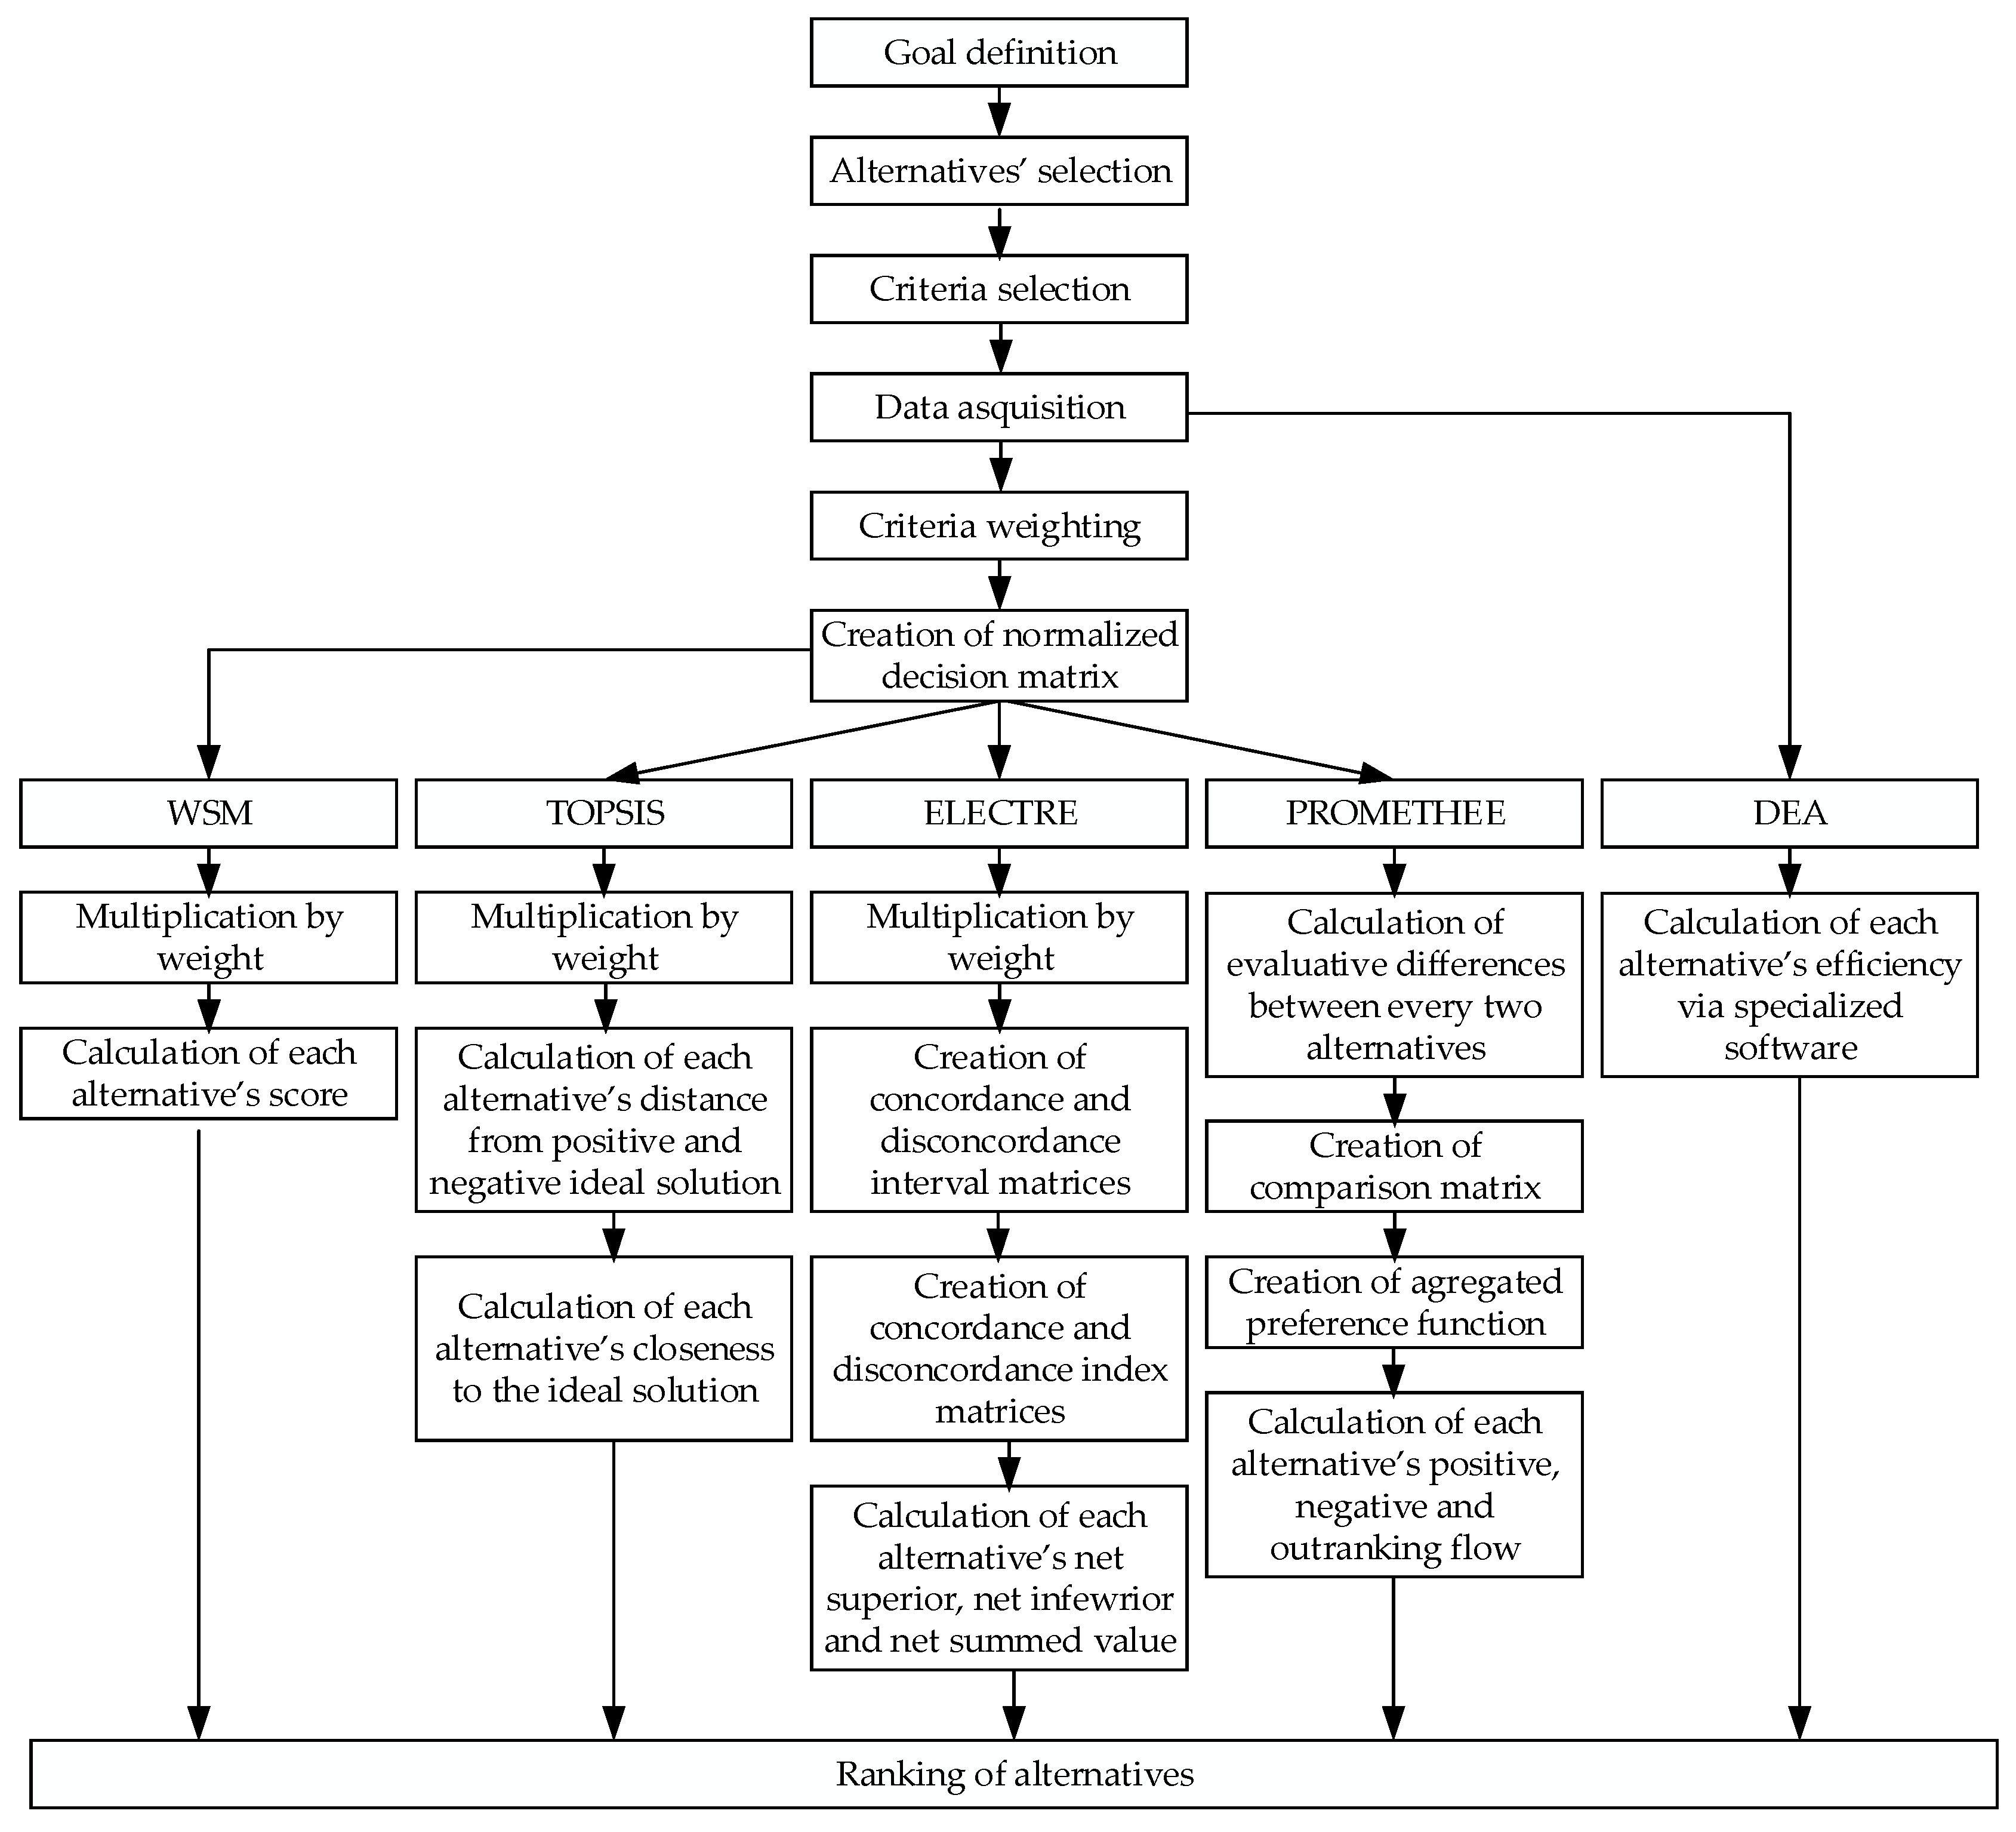
2.4. Ranking of Alternatives

Ranking of alternatives is a critical stage of the MCDA approach. The selected criteria, their weights, and data corresponding to the alternatives are used as inputs to the MCDA algorithm. The ranking from best to worst performing alternative is the desired output of these algorithms, as it facilitates comparison of alternatives with respect to the selected goal.
A simplified course of action for each MCDA method applied in this study is presented in Figure 3. The first step of any MCDA method is to define the goal of assessment, i.e., with what aim is the MCDA applied. Examples of goal definition include finding the most efficient pathway for reaching a sustainable DH system [30], identifying the most efficient catalyst for a chemical conversion process [73], comparing RES for electricity production [74], and identifying the ecological vulnerability of regions [75]. After the goal is defined, a set of alternatives is selected for comparison. The first two steps can also be done in a reverse order, e.g., a set of alternatives is given and only then is the goal of the assessment defined. The third step is criteria selection (described in Section 2.1), followed by data collection representing each alternative according to the selected criteria. Further, the criteria are weighted (see Section 2.2) and criterion values—normalized (Section 2.3) by building the normalized decision matrix. Finally, all alternatives are assessed by applying specific calculation steps according to the selected MCDA methodology and they are ranked with respect to the defined goal of the assessment. The following sub-sections shortly describe each of the MCDA methods selected for this study.

2.4.1. WSM

Also known as Simple Additive Weighting (SAW), WSM is a simple MCDA method that can evaluate alternatives with a minimal number of calculation steps. The normalized matrix values are weighted and summed to get a score ( S i ) for each alternative (Equation (4)).
S i = j = 1 n w j r i j ,
where rij—the normalized value of criterion xij; wj—weight of criterion j; i—number of alternatives; j—number of criteria.
When decision-makers need an easy-to-understand MCDA method, WSM is often used. Since WSM can give similar results to more complex MCDA methods [4], the simplicity of it does not compromise the results of the model. It has been applied for sustainability assessment [76].
One of WSM’s requirements is that all selected criteria values are maximizable and positive [77]. This requirement can be addressed by carefully selecting and defining the criteria or by transforming the minimizing criteria to maximizing, which can be done in the normalization step before MCDA.

2.4.2. TOPSIS

The TOPSIS technique sets out to find the alternative closest to the positive ideal solution and furthest from the negative ideal solution [62]. The alternative that has the highest closeness value (that incorporates distances from ideal positive and negative solutions) is ranked the highest of all alternatives. The criteria values are assumed to be rising and falling monotonically, therefore a normalization must be done that adjusts minimizable criteria values by reciprocalization or another method.
The multiplication of each normalized decision matrix’s element rij with the assigned weight coefficient wj results in weighted normalized decision matrix, where vij represents the weighted normalized value calculated as:
v i j = w j r i j ,
Next, the positive ideal and the negative ideal solutions for each alternative are determined by finding the alternative’s distance from the matching positive ( S i + ) and negative ( S i ) ideal solution:
S i + = [ j = 1 n ( v ij v j + ) ] 1 / 2 ,
S i = [ j = 1 n ( v ij v j ) ] 1 / 2 ,
where v i j —weighted normalized value of alternative i with respect to criterion j; v j + —maximal normalized value with respect to criterion j; v j —minimal normalized value with respect to criterion j.
Each alternative’s closeness to the ideal solution ( C i * ) is then determined (Equation (8)) serving as the value for the ranking of alternatives.
C i * = S i + S i + + S i ,

2.4.3. ELECTRE

The ELECTRE family of outranking MCDA methods use pairwise criteria comparison. Every alternative is set against all others by comparing criterion values. An outranking relation is then determined by these comparisons. Most criteria must be in favor of the outranking in an ELECTRE model. Similarly, the rest of the criteria cannot strongly oppose the ranking. These validations by concordance and non-discordance allow for calculation of the net superior and the net inferior values for alternatives, respectively.
A normalized decision matrix is weighted as in the TOPSIS method. The next steps follow a modified ELECTRE-I methodology (see Appendix A) by a paper performing an illustrative case study [78]. This method provides a net superior and a net inferior value for each alternative. That can be used to create two rankings, but to get one final ranking the two values are averaged (Equation (9)) as described in a paper by Chatterjee et al. [79].
x j = ( c j + d j ) / 2 ,
where x j —final net value of alternative j; c j —net superior value of alternative j; d j —net inferior value of alternative j.
The final ranking value is called the Net value in ELECTRE.

2.4.4. PROMETHEE

PROMETHEE is a MCDA technique that also uses pairwise comparisons to rank the provided alternatives. Yet, unlike ELECTRE, PROMETHEE includes preference functions to measure exact differences between two alternatives regarding the criterion. Multiple preference functions can be used depending on the criteria properties. The result is one last outranking flow for each alternative based on which they are ranked.
A procedure of PROMETHEE-II described by Behzadian et al. [80] is followed to obtain the final outranking flows for every alternative to be used to construct the ranking (see Appendix B). In PROMETHEE, the final ranking value is called the phi value.

2.4.5. DEA

Data Envelopment Analysis (DEA) is an MCDA method that benchmarks alternatives to calculate their efficiency. It does so by constructing an efficiency frontier on top of the alternatives’ criterion value data set. The method does not require data normalization since function inputs (minimizable criteria values) are evaluated differently from function outputs (maximizable criteria values) within the model. Also, weights are calculated by the model and directly included therefore alleviating decision-makers from weight determination as a separate step. In this study, a free software EMS (Efficient Measurement System) for solving DEA problems was used [81]. In DEA, alternatives are ranked according to their efficiency score.

2.5. Sensitivity Analysis

Sensitivity analysis was conducted to interpret the importance of each criterion and its respective weight to the MCDA model rankings in WSM, TOPSIS, ELECTRE and PROMETHEE. DEA uses internalized weight calculations hence it was left out of this analysis. In the models, the range of stability of each criterion was calculated by applying three different weight change methods—individual weight change, fixed weight change and equal weight method. The total amount of step-by-step weight change calculations for the three models was 702. Without some automation these calculations would be way too impractical as the calculations described in the following sub-sections would have to be repeated hundreds of times in a row.

2.5.1. Individual Weight Change

To determine the range of weight inputs that keep the MCDA model unchanged, an approach presented by Li et al. was used in this study [82].
Each individual weight disturbance is defined as follows:
w j * = w j γ j ,
where w j is the initial weight, w j * is the new weight, and γ j is the initial variation ratio. The rest of the weight values therefore must be changed so their sum stays equal to 1. The resulting weights after the change are calculated:
w j = w j β j ,
w n = w n w 1 + w 2 + w j * + w n ,
where w j is the target weight and w n describes all other weights, β j is the ratio that marks the final relation between our target weight before and after disturbance, and n denotes the number of criteria.
The following relationship between the initial variation ratio γ j and the final ratio β j is considered:
γ j = β j w j β j 1 w j β j ,
To check the stability of the MCDA models, each weight was increased and lowered by 1% at a time ( β j = …, 0.98, 0.99, 1, 1.01, 1.02, …) until the ranking of an alternative changed (see Figure 4). The range of β j values that produced a stable ranking was noted for every weight, and it was expressed as one value—the range of stability ( β j m a x β j m i n ).

2.5.2. Fixed Weight Change

The analysis of method-specific scores instead of ranking changes can explain the correlation between weight changes and the behavior of models more precisely. A weight change is expected to alter the alternative’s scores uniformly, since the registered changes can be incremental. A ranking change, on the other hand, is not quantifiable in such a particular way.
Based on the method described in Section 2.5.1, a fixed weight change was performed on the MCDA models. Weights were increased or lowered by 10, 20 and 30% ( β j = 0.9, 1.1; 0.8, 1.2; 0.7, 1.3) and alternatives’ scores were registered (see Figure 5). These scores were the WSM score, closeness to the ideal solution value in the TOPSIS, net value in the ELECTRE, and phi value in the PROMETHEE model. The range of score change was registered for every alternative. The average range of score was calculated next for every weight respectively:
A V R c j * = ( n = 1 k C d j n * ) / 8 ,
where A V R c 1 * is the average criteria change for criteria 1 in the TOPSIS model, j is the respective criteria, and n denotes the alternatives.
These average values should positively correlate with the weight size—the bigger the weight, the more MCDA model changes.

2.5.3. Equal Weight Method

To justify weight determination via AHP (or another complex method), equal weight models were constructed. The differences between AHP and equal weight alternative rankings were assessed to derive which MCDA method made greater use of extra input information and employed it in the ranking process.

3. Results and Discussion

3.1. The Ranking Results

The results of the calculated final rankings of the selected alternatives—12 DHCs—are presented in Table 2. According to the results of the WSM, TOPSIS, PROMETHEE and ELECTRE models, the two most sustainably operated companies are DHC 10 and DHC 9. Although DHC 10 does not have the highest value by any of the criteria (see Table 1), it has the second highest value with respect to four criteria (CO2 emissions, share of RES, heat tariff, and heat consumption of buildings), the total weight of which is 55.79%, and it is presented as most sustainable by the WSM, TOPSIS, and PROMETHEE methods. The results of the ELECTRE method show DHC 9 as a leader, for which one criterion (heat consumption of buildings) has the best value, while the others are average. The DEA model highlights DHC 12 and DHC 11 as the two most sustainably operated alternatives. In WSM and PROMETHEE, the alternatives are listed in the same preference order, while other models provide slightly different orders.
In an outranking model (ELECTRE, PROMETHEE), a good value in one criterion can compensate for a bad value in another criteria. Any alternative with one or multiple values that are the worst in the group will most certainly not obtain the highest ranking in these models. Although DHC 11 and DHC 12 have at least one criterion with the lowest value among all alternatives, they are not at the bottom of the ranking because they simultaneously have three maximum values in other criteria. In the DEA model, the efficiency frontier of DHC 11 and DHC 12 is perhaps pushed further than by any other alternatives, and one minimum score does not diminish it enough.
One thing that is common for all the methods is that a clear division exists between the top six alternatives (DHC 7 to DHC 12) and the bottom six alternatives (DHC 1 to DHC 6). In the DEA model, the efficiency values of these top six alternatives exceed 100% and therefore those alternatives can be branded as efficient. The bottom six score below 100%, thus they are not considered efficient. Table 3 shows the ranking values of all alternatives obtained in the MCDA models. To distinguish among the rankings obtained in each method, the specific final ranking scores are calculated showing the distance to the score of the best alternative by percentage.
Models that display a higher distance between the specific final scores of top alternatives provide a more stable ranking. The two leaders determined by DEA have a stark difference in their final specific scores (100% and 38%). The leaders of ELECTRE have a specific final score difference of 12%. The leading alternative scores of other methods are much more similar. A small change in input data or criteria weights is likely to change the currant ranking of these methods, while ELECTRE and DEA scores are less likely to be disturbed.
The specific final ranking values of alternatives are the same for the WSM and the PROMETHEE methods (see Table 3), explained by the aggregated preference function selected for the PROMETHEE method. It mirrors the weighting and the summation steps in the WSM method. The other transformations in the PROMETHEE method contribute to the calculation of the phi values of each alternative that differ from the WSM scores yet they are still the same after normalization.

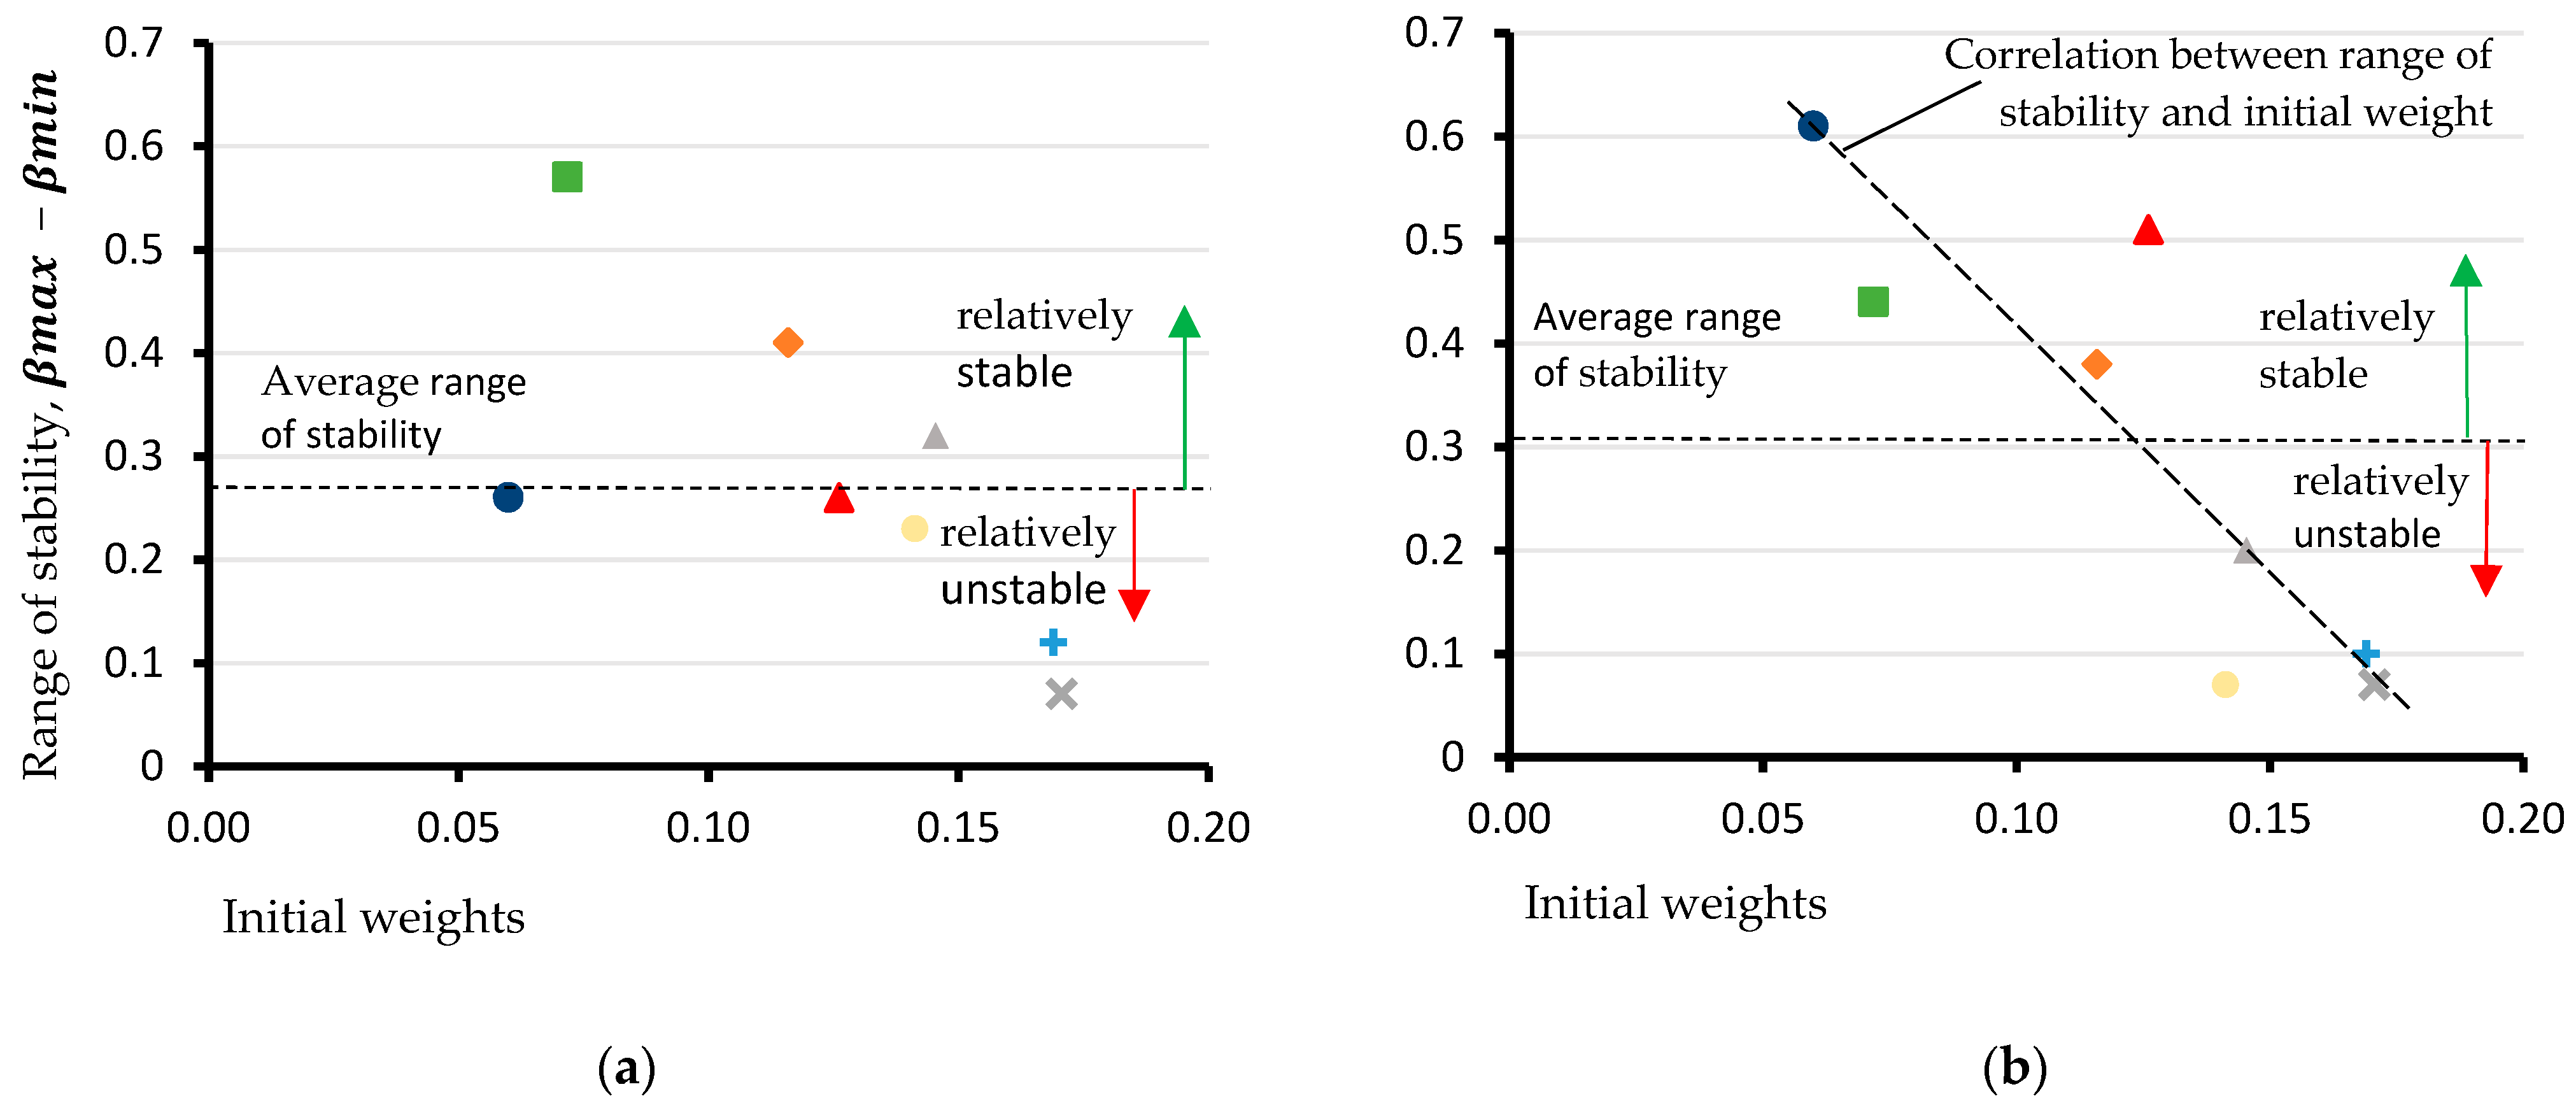
3.2. Results of Sensitivity Analysis

3.2.1. Individual Weight Change

The individual weight change sensitivity analysis was performed by changing the weight of a single criterion until a change in the ranking of alternatives was observed. The weight range at which the ranking remained unchanged produced the range of stability for each criterion. The higher the range of stability, the more the weight of a criterion must be changed to alter the ranking of alternatives. The results of the sensitivity analysis are presented in Figure 6a–d.
Dividing the range of stability between the highest and the lowest values into two equal parts, the relatively stable and unstable areas can be identified. The criteria with higher weights are in the unstable area. It can be seen in Figure 6a,c,d, that in the WSM, ELECTRE and PROMETHEE methods respectively, six out of eight criteria are relatively unstable, including the criterion with the smallest initial weight. When using these methods for sustainability assessment, it should be considered that even a criterion with the lowest initial weight may affect the ranking results. Still, in our case study, the criterion with the smallest initial weight did not change the leading alternative of the ranking (DHC 10 in WSM, TOPSIS, PROMETHEE, and DHC 9 in ELECTRE). In addition, the obtained results show that in the TOPSIS model, the range of stability has a clear negative correlation to the weight value—the criteria with larger weights have to be disturbed the least to change the ranking as they have the most importance or the highest impact in the model (Figure 6b). Similarly, it is expected that smaller weights have less impact on a model’s stability. Yet, the results show that the outranking models are much less stable than expected with respect to criterion with the smallest weight (produced heat energy in cogeneration).
A more detailed analysis of the impact of changes in each criterion on the sustainability performance of DHC should be performed. The results of such an analysis could be included in the development strategy for each DHC; MCDA is an appropriate tool for such a task, but it is not the objective of this article.

3.2.2. Fixed Weight Change

The results of the fixed weight change (+/−10, 20, 30%) with respect to the initial weight of criteria are presented in Figure 7. The values on the y axis are averaged from the 12 alternatives responding to the weight change of one criterion.
All models exhibit similar correlation between the weight values and the ranking score values. The correlation between the fixed weight change in the range between +/−10% and +/−30% and the initial weight in the applied MCDA models is nonlinear. The change in the three criteria with the smallest initial weight show a relatively flat line of correlation indicating their flexibility against such weight changes. In contrast, the alternatives’ values increase sharply when changes are made to the criteria with the initial criterion weight above 0.125. When the initial weights are increased, the alternatives’ value changes more significantly in the TOPSIS method than in other methods. For example, a weight change of +/−30% of the most significant criterion, results in an alternatives’ value that is 6.1 times higher than the alternatives’ value when the least significant criterion is changed by +/−30%. Meanwhile, for the ELECTRE method this ratio is 3.7, and for the WSM and the PROMETHEE methods the ratio is 2.4. Therefore, it is concluded that the TOPSIS method is the most sensitive to changes in weight, while other methods are more flexible to weight change.

3.2.3. Equal Weight Method

Each of the eight criteria was assigned a weight of 12.5% (100% divided by 8 criteria). The obtained ranking lists were compared to the ranking lists obtained by using the AHP weights. The results of the comparison are presented in Table 4.
The results show that in the WSM, ELECTRE, and PROMETHEE methods, assigning equal weight to all assessment criteria does not change the ranking of the top six alternatives. Meanwhile, the TOPSIS results are more affected and only the ranking of the top three and the sixth alternative remain unchanged.

3.3. Results of MCDA Methods’ Comparative Assessment

All methods used in this study were assessed and compared for their simplicity of use, result interpretation, result robustness and other properties. The results of the comparative assessment are summarized in Table 5.
Of the MCDA methods assessed, all but DEA require a weighted normalized decision matrix for the ranking of alternatives. Those methods therefore necessitate an additional step—weighting of criteria. Even though mistakes in criteria weighting are unavoidable, the determination of the relative importance of the criteria is a worthwhile step [2] that is well documented in the MCDA literature. The normalization technique should be considered alongside the MCDA method and other parameters as the number of criteria [69]. Both add to the number of steps a decision-maker must take while performing MCDA, so the appeal of methods like DEA that forgo these steps is logical.
The main flaws of any MCDA method lay in the normalization procedure and in the use of additive formulas that disrupt the initial associations between the alternatives (and alter the rankings) [87]. Both WSM and TOPSIS have the simplest calculations and the fewest steps, while PROMETHEE and ELECTRE are conversely tougher to perform. That is because of the differing number of steps involved and the unique challenges in the automation process for sensitivity analysis without a dedicated software. Altogether WSM seems to be the simplest MCDA method to work with as per its least number of calculation steps. Although it does not need prior weighting and normalization, DEA is the most difficult to calculate (DEA calculations were not manually performed in this study). It also requires input data values to be precise, as ordinal types of data are not sufficient for traditional DEA.
Even though WSM and TOPSIS are the simplest MCDA methods, the results can be difficult to interpret. The ELECTRE and the PROMETHEE methods result in positive and negative net sum and phi values that automatically divide the alternatives into best and worst. The WSM scores and the TOPSIS C* values are all positive. Also, efficiencies calculated by DEA have no negative values, but they are divided into two groups—efficient (above 100%) and non-efficient (bellow 100%).
The robustness of an MCDA method can be affected when new alternatives are added or existing—omitted from the model. By design, the outranking methods (ELECTRE and PROMETHEE) can provide different rankings if an alternative is taken out, since their values are calculated with respect to other alternatives [88]. Alternatives in DEA are evaluated based on their closeness to the efficiency frontier which is comprised of input data. An added alternative could therefore change the efficiency scores of others. This property of ELECTRE, PROMETHEE, and DEA methods should be considered by decision-makers. The WSM scores and the TOPSIS C* values are calculated individually and therefore cannot change in this way.
All MCDA methods compensate low criterion values with high values in some way. Yet, the outranking methods do not tolerate extremely low values by design. In ELECTRE and PROMETHEE models, an alternative with the lowest criterion value cannot be the leader—the non-discordance principle.
The most popular MCDA methods have free software available (all but WSM assessed in this study). In the context of DH, TOPSIS and DEA seem to be the most popular with 12 and 7 papers accordingly in the Scopus database [7,17,20,21,22,23,24,25,26,27,28,29,30,31,32,33,34,35,36,37,38,39,40,41,42,43,44,45,46,47,48,49,50,51,52,53,54,55,56] (see Supplementary Material). It has been recorded that the TOPSIS method experiences fewer rank reversals when the number of criteria is lower. The opposite was found to be true for ELECTRE [86].
The outranking methods have arbitrary definitions for key concepts like the c or the d critical values in the PROMETHEE model. Furthermore, the aggregated preference functions should be chosen accordingly, when dealing with a decision-making problem.

4. Conclusions

In this study, five MCDA methods were selected and assessed for their application in a sustainability assessment of DHC. The robustness of results obtained in four of the methods was assessed by applying sensitivity analysis of criteria weights. Three different approaches were used for the sensitivity analysis. The results of all three approaches distinguish TOPSIS from the other MCDA methods used. It is concluded that the TOPSIS method is the most sensitive to changes in criteria weights, i.e., the more a criterion is changed the higher the alteration of the ranking results. Moreover, TOPSIS displays a clear negative correlation between the criteria weights and the weight range at which the alternatives’ ranking remains unchanged. Thus, a criterion with larger weight has higher impact to the ranking change compered to criteria with smaller weight. It is also concluded that a careful weight assessment, e.g., by applying the AHP method, is needed when using TOPSIS.
Meanwhile, other MCDA methods, namely WSM, ELECTRE, and PROMETHEE are more flexible to criteria weight change. The results of the equal weight method show that the ranking of the top six alternatives is not affected when equal (12.5%) or differentiated (AHP) weights are used. Hence, at least at the initial phase of a WSM, ELECTRE, or PROMETHEE study, the same (equal) weight can be assigned to all criteria, leaving the robustness tests of results for the end phase of the study.
A comparative assessment of the MCDA methods indicates that in many cases, TOPSIS could be preferred due to its simplicity and clear interpretation of the results. Yet, in balancing the simplicity of a method with the accuracy of the results, the proper weighing method should be selected. The AHP method is a relatively simple and sufficiently accurate method to consolidate various views of involved experts.
Criteria weights directly influence the obtained results of DHC performance evaluation. The AHP method for weighing is preferable because of its comprehensibility and its simplicity in application. Additionally, attention should be paid to both the choice and the number of criteria, depending on the aim of the application of an MCDA method.
The ELECTRE and the PROMETHEE methods allow for a very detailed assessment, however the computation process by these methods is quite complex, therefore the methods are more suitable for MCDA experts. A case-specific choice of an aggregated preference function in a PROMETHEE procedure could refine the results by tailoring the procedure to the input data and the properties of the criteria. The c and the d critical values of the ELECTRE method should also be looked at critically; simpler methods without threshold values from the ELECTRE family exist, and they should be assessed. Moreover, since the method technically produces two distinct rankings for alternatives, a further study of the accuracy of these results should be done.
Overall, depending on the aim and the level of detail of the assessment, any of the methods tested in this study can be used for a sustainability assessment of DHC, DH systems, or energy systems at large. Equally, the MCDA approach can be used for a sustainability assessment of DHC’s transition toward 4GDH and implementation of a smart thermal grid concept or the 5GDH considering the point of view of different stakeholders.

Supplementary Materials

The following supporting information can be downloaded at: https://www.mdpi.com/article/10.3390/en15072411/s1, Table S1: MCDA articles in the field of DH.

Author Contributions

Conceptualization, J.Z.; methodology, J.Z. and J.E.D.; software, J.Z. and J.E.D.; validation, J.E.D.; formal analysis, J.Z., R.S. and J.E.D.; investigation, J.Z. and J.E.D.; resources, J.Z., J.E.D., R.S. and E.D.; data curation, J.Z.; writing—original draft preparation, J.Z. and J.E.D.; writing—review and editing, J.Z., J.E.D., R.S. and E.D.; visualization, J.Z. and J.E.D.; supervision, J.Z. and E.D.; project administration, J.Z.; funding acquisition, J.Z. All authors have read and agreed to the published version of the manuscript.

Funding

This research was funded by the European Regional Development Fund within the project No. 1.1.1.2/VIAA/4/20/604 “Decision Support Tool for Decarbonisation Assessment of District Heating Systems (START)”. The contribution of E. Dace and R. Soloha to this study was supported by the University of Latvia within the project “Climate Change and its Impacts on Sustainability of Natural Resources” (No. Y5-AZ20-ZF-N-270).

Data Availability Statement

Not applicable.

Conflicts of Interest

The authors declare no conflict of interest.

Appendix A

ELECTRE-I
Concordance interval set ( C a b ) must be determined that describes the dominance query (1 for dominance, 0 otherwise):
C a b = { j | v a j v b j }
where v a j and v b j are the normalized weighted values of alternatives a and b with respect to the criterion j.
Discordance interval ( D a b ) set is constructed as:
D a b = { j | v a j v b j }
where v a j and v b j are the normalized weighted values of alternatives a and b with respect to the criterion j.
A concordance interval matrix ( c ( a , b ) ) is created (concordance interval set value according to weight):
c ( a , b ) = j c ( a , b ) w j
Discordance interval matrix is determined by
d ( a , b ) = m a x j D a b | v a j v b j | m a x j J , m , m ϵ I | v m j v n j |
Concordance index matrix ( c ¯ ) is created by comparing the interval matrix values to the calculated c critical value:
c ¯ = a = 1 m b m c ( a , b ) i ( i 1 ) { e ( a , b ) = 1   i f   c ( a , b ) c ¯ e ( a , b ) = 0   i f   c ( a , b ) < c ¯
where i denotes the number of alternatives.
Discordance index matrix ( d ¯ ) is created similarly by comparing the interval matrix values to the calculated d critical value:
d ¯ = a = 1 m b m d ( a , b ) i ( i 1 ) { f ( a , b ) = 1   i f   d ( a , b ) d ¯ f ( a , b ) = 0   i f   d ( a , b ) > d ¯
where i denotes the number of alternatives.
Net superior values ( c a ) are calculated from the concordance interval set:
c a = b = 1 n c ( a , b ) b = 1 n c ( b , a )
Net inferior values ( d a ) are calculated from the discordance interval set:
d a = b = 1 n d ( a , b ) b = 1 n d ( b , a )

Appendix B

PROMETHEE-II
A comparison matrix ( P j ( a , b ) ) is created
P j ( a , b ) = { j | r a j r b j }
where r a j and r b j are the values of alternatives a and b with respect to the criterion j.
The negative values are changed to 0
P j ( a , b ) = 0 ,   i f   r a j r b j P j ( a , b ) = ( r a j r b j ) ,   i f   r a j > r b j
Each comparison’s values are aggregated by the chosen aggregated preference function ( π ( a , b ) )
π ( a , b ) = j = 1 n w j P j ( a , b )
where w j is the weight of criterion j.
The negative and the positive flows of each alternative are determined
φ + = 1 1 i b = 1 i π ( a , b )   φ = 1 1 i b = 1 i π ( b , a )
where i denotes the number of alternatives.
The outranking flow of each alternative ( φ ( a ) ) is determined
φ ( a ) = φ + ( a ) φ ( a )

References

  1. United Nation. Transforming Our World: The 2030 Agenda for Sustainable Development. Available online: https://sdgs.un.org/publications/transforming-our-world-2030-agenda-sustainable-development-17981 (accessed on 18 March 2022).
  2. Wang, J.J.; Jing, Y.Y.; Zhang, C.F.; Zhao, J.H. Review on multi-criteria decision analysis aid in sustainable energy decision-making. Renew. Sustain. Energy Rev. 2009, 13, 2263–2278. [Google Scholar] [CrossRef]
  3. Mart, M.; Dias, L.C.; Quinteiro, P.; Freire, F.; Cl, A. Multi-Criteria and Life Cycle Assessment of Wood-Based Bioenergy Alternatives for Residential Heating: A Sustainability Analysis. Energies 2019, 12, 4391. [Google Scholar] [CrossRef] [Green Version]
  4. Kolios, A.; Mytilinou, V.; Lozano-Minguez, E. A Comparative Study of Multiple-Criteria Decision-Making Methods under Stochastic Inputs. Energies 2016, 9, 566. [Google Scholar] [CrossRef] [Green Version]
  5. Marguerite, C.; Andresen, G.B.; Dahl, M. Multi-criteria analysis of storages integration and operation solutions into the district heating network of Aarhus—A simulation case study. Energy 2018, 158, 81–88. [Google Scholar] [CrossRef]
  6. Ziemele, J.; Talcis, N.; Osis, U.; Dace, E. A methodology for selecting a sustainable development strategy for connecting low heat density consumers to a district heating system by cascading of heat carriers. Energy 2021, 230, 120776. [Google Scholar] [CrossRef]
  7. Ziemele, J.; Pakere, I.; Talcis, N.; Blumberga, D. Multi-criteria Analysis of District Heating Systems in Baltic States. Energy Procedia 2014, 61, 2172–2175. [Google Scholar] [CrossRef] [Green Version]
  8. Vasić, G. Application of multi criteria analysis in the design of energy policy: Space and water heating in households—City Novi Sad, Serbia. Energy Policy 2018, 113, 410–419. [Google Scholar] [CrossRef]
  9. Siksnelyte-Butkiene, I.; Streimikiene, D.; Balezentis, T. Multi-criteria analysis of heating sector sustainability in selected North European countries. Sustain. Cities Soc. 2021, 69, 102826. [Google Scholar] [CrossRef]
  10. EC Smart Cities. Available online: https://ec.europa.eu/info/eu-regional-and-urban-development/topics/cities-and-urban-development/city-initiatives/smart-cities_en (accessed on 18 March 2022).
  11. Hiltunen, P.; Syri, S. Low-temperature waste heat enabling abandoning coal in Espoo district heating system. Energy 2021, 231, 120916. [Google Scholar] [CrossRef]
  12. Andrés, M.; Regidor, M.; Macía, A.; Vasallo, A.; Lygnerud, K. Assessment methodology for urban excess heat recovery solutions in energy-efficient District Heating Networks. Energy Procedia 2018, 149, 39–48. [Google Scholar] [CrossRef]
  13. European Smart Cities. Available online: http://www.smart-cities.eu/ (accessed on 15 March 2022).
  14. Lund, H.; Werner, S.; Wiltshire, R.; Svendsen, S.; Thorsen, J.E.; Hvelplund, F.; Mathiesen, B.V. 4th Generation District Heating (4GDH): Integrating smart thermal grids into future sustainable energy systems. Energy 2014, 68, 1–11. [Google Scholar] [CrossRef]
  15. Buffa, S.; Cozzini, M.; D’Antoni, M.; Baratieri, M.; Fedrizzi, R. 5th generation district heating and cooling systems: A review of existing cases in Europe. Renew. Sustain. Energy Rev. 2019, 104, 504–522. [Google Scholar] [CrossRef]
  16. Kinelski, G.; Stęchły, J.; Sienicki, A.; Czornik, K.; Borkowski, P. Application of Smart Technologies in Metropolis GZM to Reduce Harmful Emissions in District Heating Systems. Energies 2021, 14, 7665. [Google Scholar] [CrossRef]
  17. Wu, Z.; You, S.; Zhang, H.; Wang, Y.; Jiang, Y.; Liu, Z.; Sha, L.; Wei, S. Experimental investigations and multi-objective optimization of an air-source absorption heat pump for residential district heating. Energy Convers. Manag. 2021, 240, 114267. [Google Scholar] [CrossRef]
  18. Kandakoglu, A.; Frini, A.; Ben Amor, S. Multicriteria decision making for sustainable development: A systematic review. J. Multi-Criteria Decis. Anal. 2019, 26, 202–251. [Google Scholar] [CrossRef]
  19. Rigo, P.D.; Rediske, G.; Rosa, C.B.; Gastaldo, N.G.; Michels, L.; Júnior, A.L.N.; Siluk, J.C.M. Renewable energy problems: Ex-ploring the methods to support the decision-making process. Sustainability 2020, 12, 195. [Google Scholar] [CrossRef]
  20. DorotiĆ, H.; Pukšec, T.; Duić, N. Economical, environmental and exergetic multi-objective optimization of district heating systems on hourly level for a whole year. Appl. Energy 2019, 251, 113394. [Google Scholar] [CrossRef]
  21. Di Somma, M.; Graditi, G.; Mongibello, L.; Bertini, I.; Puglisi, G. Trade-Off Solutions between Economy and CO2 Emissions for the Daily Operation of a Distributed Energy System: A Real Case Study in Italy. In Proceedings of the 2018 IEEE International Conference on Environment and Electrical Engineering and 2018 IEEE Industrial and Commercial Power Systems Europe (EEEIC/I&CPS Europe), Palermo, Italy, 12–15 June 2018. [Google Scholar] [CrossRef]
  22. Arslan, A.E.; Arslan, O.; Kandemir, S.Y. AHP–TOPSIS hybrid decision-making analysis: Simav integrated system case study. J. Therm. Anal. Calorim. 2021, 145, 1191–1202. [Google Scholar] [CrossRef]
  23. Zhao, J.; Li, Y.; Li, J.; Li, Z. Operation Characteristic Analysis and Parameter Optimization of District Heating Network with Double Heat Sources. In IOP Conference Series: Earth and Environmental Science; IOP Publishing: Bristol, UK, 2021; Volume 772, p. 012077. [Google Scholar] [CrossRef]
  24. Laktuka, K.; Pakere, I.; Lauka, D.; Blumberga, D.; Volkova, A. Long-term policy recommendations for improving the efficiency of heating and cooling. Environ. Clim. Technol. 2021, 25, 392–404. [Google Scholar] [CrossRef]
  25. Stennikov, V.; Postnikov, I.; Edeleva, O. Methodology of indicative analysis to determine the municipal units for implementation of the energy-saving strategy. Environ. Clim. Technol. 2020, 24, 115–123. [Google Scholar] [CrossRef]
  26. Pakere, I.; Blumberga, D. Solar power or solar heat: What will upraise the efficiency of district heating? Multi-criteria analyses approach. Energy 2020, 198, 117291. [Google Scholar] [CrossRef]
  27. Wu, Z.; Wang, Y.; You, S.; Zhang, H.; Zheng, X.; Guo, J.; Wei, S. Thermo-economic analysis of composite district heating substation with absorption heat pump. Appl. Therm. Eng. 2020, 166, 114659. [Google Scholar] [CrossRef]
  28. Polikarpova, I.; Lauka, D.; Blumberga, D.; Vigants, E. Multi-Criteria Analysis to Select Renewable Energy Solution for District Heating System. Environ. Clim. Technol. 2019, 23, 101–109. [Google Scholar] [CrossRef] [Green Version]
  29. Prodanuks, T.; Blumberga, D. Methodology of municipal energy plans. Priorities for sustainability. Energy Procedia 2018, 147, 594–599. [Google Scholar] [CrossRef]
  30. Ziemele, J.; Pakere, I.; Blumberga, D. The future competitiveness of the non-Emissions Trading Scheme district heating systems in the Baltic States q. Appl. Energy 2016, 162, 1579–1585. [Google Scholar] [CrossRef]
  31. Ziemele, J.; Vigants, G.; Vitolins, V.; Blumberga, D.; Veidenbergs, I. District heating systems performance analyses. Heat energy tariff. Environ. Clim. Technol. 2014, 13, 32–43. [Google Scholar] [CrossRef]
  32. Boran, F.E. A Multidimensional Analysis to Evaluate District Heating Systems. Energy Sources Part B Econ. Plan. Policy 2013, 8, 122–129. [Google Scholar] [CrossRef]
  33. Grujić, M.; Ivezić, D.; Živković, M. Application of multi-criteria decision-making model for choice of the optimal solution for meeting heat demand in the centralized supply system in Belgrade. Energy 2014, 67, 341–350. [Google Scholar] [CrossRef]
  34. Fang, F.; Wang, N. Optimal hierarchical decision-making for heat source selection of district heating systems. Math. Probl. Eng. 2014, 2014, 594862. [Google Scholar] [CrossRef] [Green Version]
  35. Ghafghazi, S.; Sowlati, T.; Sokhansanj, S.; Melin, S. A multicriteria approach to evaluate district heating system options. Appl. Energy 2010, 87, 1134–1140. [Google Scholar] [CrossRef]
  36. Ziemele, J.; Gravelsins, A.; Blumberga, A.; Blumberga, D. Sustainability of heat energy tariff in district heating system: Statistic and dynamic methodologies. Energy 2017, 137, 834–845. [Google Scholar] [CrossRef]
  37. Agrell, P.J.; Bogetoft, P. Endogenous Common Weights as a Collusive Instrument in Frontier-Based Regulation. Int. Ser. Oper. Res. Manag. Sci. 2016, 249, 181–194. [Google Scholar] [CrossRef]
  38. Hatami-Marbini, A.; Rostamy-Malkhalifeh, M.; Agrell, P.J.; Tavana, M.; Mohammadi, F. Extended symmetric and asymmetric weight assignment methods in data envelopment analysis. Comput. Ind. Eng. 2015, 87, 621–631. [Google Scholar] [CrossRef]
  39. Saati, S.; Hatami-Marbini, A.; Agrell, P.J.; Tavana, M. A common set of weight approach using an ideal decision making unit in data envelopment analysis. J. Ind. Manag. Optim. 2012, 8, 623–637. [Google Scholar] [CrossRef]
  40. Lygnerud, K.; Peltola-Ojala, P. Factors impacting district heating companies’ decision to provide small house customers with heat. Appl. Energy 2010, 87, 185–190. [Google Scholar] [CrossRef]
  41. Munksgaard, J.; Pade, L.L.; Fristrup, P. Efficiency gains in Danish district heating. Is there anything to learn from benchmarking? Energy Policy 2005, 33, 1986–1997. [Google Scholar] [CrossRef]
  42. Wen, Q.; Liu, G.; Wu, W.; Liao, S. Multicriteria comprehensive evaluation framework for industrial park-level distributed energy system considering weights uncertainties. J. Clean. Prod. 2021, 282, 124530. [Google Scholar] [CrossRef]
  43. Wen, Q.; Yan, Q.; Qu, J.; Liu, Y. Fuzzy Ensemble of Multi-Criteria Decision Making Methods for Heating Energy Transition in Danish Households. Mathematics 2021, 9, 2420. [Google Scholar] [CrossRef]
  44. Abokersh, M.H.; Gangwar, S.; Spiekman, M.; Vallès, M.; Jiménez, L.; Boer, D. Sustainability insights on emerging solar district heating technologies to boost the nearly zero energy building concept. Renew. Energy 2021, 180, 893–913. [Google Scholar] [CrossRef]
  45. Dénarié, A.; Muscherà, M.; Calderoni, M.; Motta, M. Industrial excess heat recovery in district heating: Data assessment methodology and application to a real case study in Milano, Italy. Energy 2019, 166, 170–182. [Google Scholar] [CrossRef]
  46. Fitó, J.; Ramousse, J.; Hodencq, S.; Wurtz, F. Energy, exergy, economic and exergoeconomic (4E) multicriteria analysis of an industrial waste heat valorization system through district heating. Sustain. Energy Technol. Assess. 2020, 42, 100894. [Google Scholar] [CrossRef]
  47. Hirsch, P.; Grochowski, M.; Duzinkiewicz, K. Decision support system for design of long distance heat transportation system. Energy Build. 2018, 173, 378–388. [Google Scholar] [CrossRef]
  48. Kirppu, H.; Lahdelma, R.; Salminen, P. Multicriteria evaluation of carbon-neutral heat-only production technologies for district heating. Appl. Therm. Eng. 2018, 130, 466–476. [Google Scholar] [CrossRef] [Green Version]
  49. Lipošćak, M.; Afgan, N.H.; Duić, N.; da Graça Carvalho, M. Sustainability assessment of cogeneration sector development in Croatia. Energy 2006, 31, 2276–2284. [Google Scholar] [CrossRef]
  50. Loikkanen, O.; Lahdelma, R.; Salminen, P. Multicriteria evaluation of sustainable energy solutions for Colosseum. Sustain. Cities Soc. 2017, 35, 289–297. [Google Scholar] [CrossRef]
  51. Mabrouk, M.T.; Haurant, P.; Dessarthe, V.; Meyer, P.; Lacarrière, B. Combining a dynamic simulation tool and a multi-criteria decision aiding algorithm for improving existing District Heating. Energy Procedia 2018, 149, 266–275. [Google Scholar] [CrossRef]
  52. Marinakis, V.; Doukas, H.; Xidonas, P.; Zopounidis, C. Multicriteria decision support in local energy planning: An evaluation of alternative scenarios for the Sustainable Energy Action Plan. Omega 2017, 69, 1–16. [Google Scholar] [CrossRef]
  53. Özdemir, E.D.; Härdtlein, M.; Jenssen, T.; Zech, D.; Eltrop, L. A confusion of tongues or the art of aggregating indicators—Reflections on four projective methodologies on sustainability measurement. Renew. Sustain. Energy Rev. 2011, 15, 2385–2396. [Google Scholar] [CrossRef]
  54. Pinto, G.; Abdollahi, E.; Capozzoli, A.; Savoldi, L.; Lahdelma, R. Optimization and Multicriteria Evaluation of Carbon-neutral Technologies for District Heating. Energies 2019, 12, 1653. [Google Scholar] [CrossRef] [Green Version]
  55. Wang, H.; Duanmu, L.; Lahdelma, R.; Li, X. A fuzzy-grey multicriteria decision making model for district heating system. Appl. Therm. Eng. 2018, 128, 1051–1061. [Google Scholar] [CrossRef]
  56. Wang, H.; Duanmu, L.; Lahdelma, R.; Li, X. Developing a multicriteria decision support framework for CHP based combined district heating systems. Appl. Energy 2017, 205, 345–368. [Google Scholar] [CrossRef]
  57. Selvakkumaran, S.; Axelsson, L.; Svensson, I.-L. Drivers and barriers for prosumer integration in the Swedish district heating sector. Energy Rep. 2021, 7, 193–202. [Google Scholar] [CrossRef]
  58. Krumm, A.; Süsser, D.; Blechinger, P. Modelling social aspects of the energy transition: What is the current representation of social factors in energy models? Energy 2022, 239, 121706. [Google Scholar] [CrossRef]
  59. Socorro García-Cascales, M.; Teresa Lamata, M.; Miguel Sánchez-Lozano, J. Evaluation of photovoltaic cells in a multi-criteria decision making process. Ann. Oper. Res. 2012, 199, 373–391. [Google Scholar] [CrossRef]
  60. Xu, B.; Nayak, A.; Gray, D.; Ouenniche, J. Assessing energy business cases implemented in the North Sea Region and strategy recommendations. Appl. Energy 2016, 172, 360–371. [Google Scholar] [CrossRef]
  61. Murry, J.W.; Hammons, J.O. Delphi: A Versatile Methodology for Conducting Qualitative Research. Rev. High. Educ. 1995, 18, 423–436. [Google Scholar] [CrossRef]
  62. Dace, E.; Blumberga, D. How do 28 European Union Member States perform in agricultural greenhouse gas emissions? It depends on what we look at: Application of the multi-criteria analysis. Ecol. Indic. 2016, 71, 352–358. [Google Scholar] [CrossRef]
  63. European Parliament, Council of the European Union. EC Directive 2012/27/EU of the European Parliament and of the Council of 25 October 2012 on energy efficiency, amending Directives 2009/125/EC and 2010/30/EU and repealing Directives 2004/8/EC and 2006/32/EC. Off. J. Eur. Union 2012, L315, 1–56. [Google Scholar]
  64. Rita, M.; Assumpc, P. Techniques to model uncertain input data of multi-criteria decision-making problems: A literature review Techniques to model uncertain input data of multi-criteria decision-making problems: A literature review. Int. Trans. Oper. Res. 2018, 28, 523–559. [Google Scholar] [CrossRef]
  65. Saaty, T.L. Analytic Hierarchy Process. In Encyclopedia of Biostatistics; John Wiley & Sons, Ltd.: Hoboken, NJ, USA, 2005. [Google Scholar] [CrossRef]
  66. Goepel, K.D. Implementation of an Online Software Tool for the Analytic Hierarchy Process-Challenges and Practical Experiences. Int. J. Anal. Hierarchy Process 2017, 10, 469–487. [Google Scholar]
  67. Behzadian, M.; Khanmohammadi Otaghsara, S.; Yazdani, M.; Ignatius, J. A state-of the-art survey of TOPSIS applications. Expert Syst. Appl. 2012, 39, 13051–13069. [Google Scholar] [CrossRef]
  68. Vafaei, N.; Ribeiro, R.A.; Camarinha-Matos, L.M. Data normalisation techniques in decision making: Case study with TOPSIS method. Int. J. Inf. Decis. Sci. 2018, 10, 19–38. [Google Scholar] [CrossRef]
  69. Sałabun, W.; Watróbski, J.; Shekhovtsov, A. Are MCDA methods benchmarkable? A comparative study of TOPSIS, VIKOR, COPRAS, and PROMETHEE II methods. Symmetry 2020, 12, 1549. [Google Scholar] [CrossRef]
  70. Chakraborty, S.; Yeh, C.H. A simulation comparison of normalization procedures for TOPSIS. In Proceedings of the 2009 International Conference on Computers & Industrial Engineering, Troyes, France, 6–9 July 2009; pp. 1815–1820. [Google Scholar] [CrossRef]
  71. Chakraborty, S. A Simulation Based Comparative Study of Normalization Procedures in Multiattribute Decision Making. In Proceedings of the 6th WSEAS International Conference on Artificial Intelligence, Knowledge Engineering and Data Bases, Corfu Island, Greece, 16–19 February 2007; pp. 102–109. [Google Scholar]
  72. Sałabun, W. The mean error estimation of TOPSIS method using a fuzzy reference models. J. Theor. Appl. Comput. Sci. 2013, 7, 40–50. [Google Scholar]
  73. Dace, E.; Blumberga, D. Selecting a Catalyst for Methanation Process: Technical and Economic Performance Based TOPSIS Analysis. In Proceedings of the 27th International Conference on Efficiency, Cost, Optimization, Simulation and Environmental Impact of Energy Systems, Turku, Finland, 15–19 June 2014. [Google Scholar]
  74. Lee, H.C.; Chang, C. Ter Comparative analysis of MCDM methods for ranking renewable energy sources in Taiwan. Renew. Sustain. Energy Rev. 2018, 92, 883–896. [Google Scholar] [CrossRef]
  75. He, L.; Shen, J.; Zhang, Y. Ecological vulnerability assessment for ecological conservation and environmental management. J. Environ. Manag. 2018, 206, 1115–1125. [Google Scholar] [CrossRef]
  76. Omran, I.I.; Al-Saati, N.H.; Al-Saati, H.H.; Hashim, K.S.; Al-Saati, Z.N. Sustainability assessment of wastewater treatment techniques in urban areas of iraq using multi-criteria decision analysis (Mcda). Water Pract. Technol. 2021, 16, 648–660. [Google Scholar] [CrossRef]
  77. Velasquez, M.; Hester, P. An analysis of multi-criteria decision making methods. Int. J. Oper. Res. 2013, 10, 56–66. [Google Scholar]
  78. Pang, J.; Zhang, G.; Chen, G. ELECTRE I decision model of reliability design scheme for computer numerical control machine. J. Softw. 2011, 6, 894–900. [Google Scholar] [CrossRef]
  79. Chatterjee, P.; Athawale, V.M.; Chakraborty, S. Selection of industrial robots using compromise ranking and outranking methods. Robot. Comput. Integr. Manuf. 2010, 26, 483–489. [Google Scholar] [CrossRef]
  80. Behzadian, M.; Kazemzadeh, R.B.; Albadvi, A.; Aghdasi, M. PROMETHEE: A comprehensive literature review on methodologies and applications. Eur. J. Oper. Res. 2010, 200, 198–215. [Google Scholar] [CrossRef]
  81. Scheel, H. Efficiency Measurement System Users Manual; Version 1.3; Universität D. EMS: Dortmund, Germany, 2000. [Google Scholar]
  82. Li, P.; Qian, H.; Wu, J.; Chen, J. Sensitivity analysis of TOPSIS method in water quality assessment: I. Sensitivity to the parameter weights. Environ. Monit. Assess. 2013, 185, 2453–2461. [Google Scholar] [CrossRef] [PubMed]
  83. Yatsalo, B.; Didenko, V.; Gritsyuk, S.; Sullivan, T. Decerns: A Framework for Multi-Criteria Decision Analysis. Int. J. Comput. Intell. Syst. 2015, 8, 467–489. [Google Scholar] [CrossRef] [Green Version]
  84. Ros, C.J.; Mateu, A.V.; Isern, L.M. Introduction to Decision Deck-Diviz: Examples and User Guide. Available online: https://www.diviz.org/_static/ReportDecisionDeck-DEIM-URV.pdf (accessed on 18 March 2022).
  85. Brans, J.P.; De Smet, Y. PROMETHEE methods. Int. Ser. Oper. Res. Manag. Sci. 2016, 233, 187–219. [Google Scholar] [CrossRef]
  86. Zanakis, S.H.; Solomon, A.; Wishart, N.; Dublish, S. Multi-attribute decision making: A simulation comparison of select methods. Eur. J. Oper. Res. 1998, 107, 507–529. [Google Scholar] [CrossRef]
  87. Triantaphyllou, E.; Baig, K. The impact of aggregating benefit and cost criteria in four MCDA methods. IEEE Trans. Eng. Manag. 2005, 52, 213–226. [Google Scholar] [CrossRef]
  88. Cinelli, M.; Coles, S.R.; Kirwan, K. Analysis of the potentials of multi criteria decision analysis methods to conduct sustainability assessment. Ecol. Indic. 2014, 46, 138–148. [Google Scholar] [CrossRef] [Green Version]
Figure 1. Schematic representation of multi-level DH system analysis by using MCDA.
Energies 15 02411 g001
Figure 2. Algorithm for the comparison of MCDA methods.
Energies 15 02411 g002
Figure 3. Execution steps in various MCDA methods for ranking of alternatives.
Energies 15 02411 g003
Figure 4. Algorithm for individual weight change sensitivity analysis.
Energies 15 02411 g004
Figure 5. Algorithm for fixed weight change sensitivity analysis.
Energies 15 02411 g005
Figure 6. The results of the individual weight change sensitivity analysis in: (a) WSM, (b) TOPSIS, (c) ELECTRE, and (d) PROMETHEE models, expressed as the range of stability.
Energies 15 02411 g006aEnergies 15 02411 g006b
Figure 7. The results of the fixed weight change (+/−10, 20, 30%) sensitivity analysis in the applied MCDA models (A1, B1, C1, D1—average change in the alternatives’ value caused by changing the initial weight of the most important criterion (heat tariff) by 30%; A2, B2, C2, D2—average change in the alternatives’ value caused by changing the initial weight of the least important criterion (produced heat in cogeneration) by 30%).
Energies 15 02411 g007
Table 1. Decision matrix for 12 Latvian DHC *.
CriterionEnvironmentalEconomicTechnologicalInstitutional
CO2 Emissions, kgCO2/MWhShare of RES, %Heat Tariff, €/MWhInstalled Capacity Utilization Rate, %Heat Losses, %Average Supply Water Temperature, °CProduced Heat in Cogene-Ration, %Heat Consumption of Buildings, kWh/m2
Criterion Typeminmaxminmaxminminmaxmin
DHC 1223.710.0452.1421.7417.14120.0022.39189.02
DHC 2209.321.4450.5310.2316.46120.0027.84176.28
DHC 3181.820.1358.9415.5810.0090.0021.41168.97
DHC 4144.3330.8344.3916.669.55120.0018.65162.34
DHC 584.8861.9754.9515.1815.9290.0046.62136.00
DHC 644.4179.3860.704.8514.40100.001.36151.40
DHC 755.0880.0055.2423.738.7663.680.00156.85
DHC 845.8680.0451.7328.2716.8375.9597.37143.79
DHC 949.2587.1054.9019.919.2090.005.70120.18
DHC 103.1399.0049.8030.4818.54100.0049.09129.03
DHC 110.00100.0061.5593.8813.0990.000.00162.47
DHC 120.00100.0053.4992.5924.7890.00100.00168.87
Criterion weight, %14.5411.5917.0614.1216.907.186.0012.60
* Green value—alternative with the highest value for the given criterion; red value—alternative with the lowest value for the given criterion.
Table 2. The list of rankings obtained from each MCDA method.
WSMDHC 10 > DHC 9 > DHC 8 > DHC 12 > DHC 11 > DHC 7>DHC 5 > DHC 4 > DHC 6 > DHC 3 > DHC 2 > DHC 1
TOPSISDHC 10 > DHC 9 > DHC 8 > DHC 7 > DHC 11 > DHC 12>DHC 4 > DHC 5 > DHC 6 > DHC 3 > DHC 2 > DHC 1
ELECTREDHC 9 > DHC 10 > DHC 8 > DHC 11 > DHC 7 > DHC 12>DHC 4 > DHC 5 > DHC 6 > DHC 3 > DHC 2 > DHC 1
PROMETHEEDHC 10 > DHC 9 > DHC 8 > DHC 12 > DHC 11 > DHC 7>DHC 5 > DHC 4 > DHC 6 > DHC 3 > DHC 2 > DHC 1
DEADHC 12 > DHC 11 > DHC 8 > DHC 10 > DHC 9 > DHC 7>DHC 6 > DHC 5 > DHC 4 > DHC 3 > DHC 1 > DHC 2
Green background—top six performing DHCs, red background—bottom six performing DHCs.
Table 3. The ranking values in each MCDA model *.
MCDA MethodWSMTOPSISELECTREPROMETHEEDEA
MCDA ResultScore%Closeness Value%Net Value%Phi Value%Efficiency%
DHC 10.2100.300−11.780−0.310331
DHC 20.26100.3412−8.7315−0.2610310
DHC 30.31230.3826−8.0219−0.2023484
DHC 40.50660.54782.22700.0066535
DHC 50.50660.4962−2.65460.0166719
DHC 60.42480.4547−7.1123−0.08487711
DHC 70.59880.58884.97840.118811620
DHC 80.62950.58915.75880.149514326
DHC 90.64980.61998.101000.159812422
DHC 100.651000.611005.92890.1710012622
DHC 110.61920.57865.48870.139219238
DHC 120.62930.55792.66730.1393460100
* Green—highest value among all alternatives; red—the lowest value among all alternatives; blue—the lowest value among the six best alternatives; green background—top six performing DHCs, red background—bottom six performing DHCs.
Table 4. The results of the alternatives’ ranking lists when using equal weight method and AHP method *.
WSMTOPSISELECTREPROMETHEE
Equal WeightsAHP WeightsEqual WeightsAHP WeightsEqual WeightsAHP WeightsEqual WeightsAHP Weights
DHC 12DHC 12DHC 12DHC 12DHC 12DHC 12DHC 12DHC 12
DHC 11DHC 11DHC 11DHC 11DHC 11DHC 11DHC 11DHC 11
DHC 10DHC 10DHC 10DHC 10DHC 10DHC 10DHC 10DHC 10
DHC 8DHC 8DHC 8DHC 7DHC 7DHC 7DHC 8DHC 8
DHC 7DHC 7DHC 7DHC 8DHC 8DHC 8DHC 7DHC 7
DHC 9DHC 9DHC 9DHC 9DHC 9DHC 9DHC 9DHC 9
DHC 6DHC 6DHC 5DHC 4DHC 6DHC 5DHC 6DHC 6
DHC 1DHC 3DHC 1DHC 3DHC 1DHC 3DHC 1DHC 3
DHC 4DHC 2DHC 4DHC 2DHC 4DHC 1DHC 4DHC 2
DHC 3DHC 1DHC 3DHC 1DHC 2DHC 2DHC 3DHC 1
DHC 5DHC 5DHC 6DHC 5DHC 5DHC 4DHC 5DHC 5
DHC 2DHC 4DHC 2DHC 6DHC 3DHC 6DHC 2DHC 4
* Red—the differences in ranking.
Table 5. Summary of each methods’ properties.
WSMTOPSISELECTREPROMETHEEDEA
Simplicity of calculations
WeightingRequiredRequiredRequiredRequiredNot required
NormalizationRequiredRequiredRequiredRequiredNot required
Number of steps34118Not assessed
Ease of automation for sensitivity analysisEasyEasyHigh difficultyMedium difficultyHigh difficulty
Overall simplicityVery easyEasyHigh difficultyMedium difficultyHigh difficulty
Results
Result interpretation difficultyHigh difficultyHigh difficultyEasy (negative and positive values)Easy (negative and positive values)High difficulty
Robustness
Can ranks reverse if an alternative is deleted?No, by designNo, by designYes, by designYes, by designYes, by design
Relationship between low and high criteria values
Does a low criteria value get compensated by a high criteria value?Yes, by increasing the alternatives’ final valueYes, by increasing the alternatives’ final valueYes, by outranking principlesYes, by outranking principlesYes, by increasing the alternatives’ final value
Can an alternative with one lowest criterion value be the leader?YesYesNoNoYes
Availability of free and documented softwareNot neededYes (e.g., DecernsMCDA [83])Yes (e.g., Decision Deck [84])Yes (e.g., Visual PROMETHEE [85])Yes (e.g., EMS [81])
Popularity
In the field of DH (number of papers)Not widely used (2)Most popular (12)Least popular (1)Not widely used (3)Fairly popular (7)
Additional properties Rank reversals when the number of criteria is low [86]Rank reversals when the number of criteria is high [86]; arbitrary definition of threshold valuesDifferent preference functions can lead to different outcomes; arbitrary definition of threshold valuesDoes not fare well with imprecise data
Publisher’s Note: MDPI stays neutral with regard to jurisdictional claims in published maps and institutional affiliations.

