Article

Short Text Classification for Faults Information of Secondary Equipment Based on Convolutional Neural Networks

College of Energy and Electrical Engineering, Hohai University, Nanjing 210098, China
*
Author to whom correspondence should be addressed.
Energies 2022, 15(7), 2400; https://doi.org/10.3390/en15072400
Submission received: 11 February 2022 / Revised: 15 March 2022 / Accepted: 22 March 2022 / Published: 24 March 2022
(This article belongs to the Special Issue Situation Awareness for Smart Distribution Systems)

Abstract

:
As the construction of smart grids is in full swing, the number of secondary equipment is also increasing, resulting in an explosive growth of power big data, which is related to the safe and stable operation of power systems. During the operation of the secondary equipment, a large amount of short text data of faults and defects are accumulated, and they are often manually recorded by transportation inspection personnel to complete the classification of defects. Therefore, an automatic text classification based on convolutional neural networks (CNN) is proposed in this paper. Firstly, the topic model is used to mine the global features. At the same time, the word2vec word vector model is used to mine the contextual semantic features of words. Then, the improved LDA topic word vector and word2vec word vector are combined to absorb their respective advantages and utilizations. Finally, the validity and accuracy of the model is verified using actual operational data from the northwest power grid as case study.

1. Introduction

With the accelerated development of the power system, the number of secondary equipment is also increasing. Therefore, there is an explosive emergence of power big data, which hides massive information. This is related to the safe and stable operation of the power system [1,2,3,4]. However, a small proportion of these data can be used to mine important information, and research on these data has become a current hot topic. Among these data, the first category is the time-series structured data represented by output power, temperature and humidity of the equipment and its environment, and the light intensity of the optical module. This type of data mining work is relatively mature; the other is based on semi-structured and unstructured data represented by text, images, audio, etc., which are difficult to express using relational databases. The low value density of these data restricts the mining of unstructured data [5].
During the operation of the secondary equipment, a lot of short text data of faults and defects have been accumulated. These data are often manually recorded by the transportation inspection personnel and rely on the experience of professionals to complete the classification of defects. However, due to the subjective and empirical constraints of transport inspection personnel, the fault data are difficult to classify accurately. At the same time, the high volume of fault data requires a great deal of human participant involvement, and efficiency is difficult to be guaranteed. Moreover, the text information of secondary equipment faults has a short length and sparse semantic features. The improvement of the classification model for short text data is also the focus and hotspot [6].
The earliest text classification can be traced back to an article published by Maron in 1961 on the method of text classification using the Bayesian formula. In the next 20-odd years, a series of classification rules were manually built on the basis of expert knowledge to construct a classifier. This method often requires the experience and knowledge of a large number of expert engineers in related fields, which is difficult to effectively promote [7]. In addition to the development of disciplines such as artificial intelligence, machine learning, pattern recognition, and statistical theory, text classification technology has entered a more intelligent automatic classification era, and text classification methods based on expert knowledge and experience have gradually withdrawn from the historical stage. Using Bayes’ [8,9] neural network [10] and support vector machine [11] and other methods to liberate people from heavy tasks, and with high classification efficiency and accuracy, the machine learning methods have developed rapidly in the field of Chinese text classification. Benefits from the development of the machine learning, neural network method are the most prominent [12]. According to some papers, it can be concluded that the long and short-time neural network models used to mine context features has a significant effect on the classification of long document text data [13,14], and the convolutional neural network model has a significant effect on the classification of short text data [15]. In [16], the CNN model was proposed for brain tumor classification. In [17], a feature fusion method based on an ensemble convolutional neural network and deep neural network was used for bearing fault diagnosis. In [18], an enhanced convolutional neural network was designed and analyzed.
The text classification technology is also widely used in professional fields, such as social science information, biomedicine, and so on [19]. There are also endless categories of patents [20], academic papers, academic news, and even the content of WeChat public accounts. In social media, the classification of user emotion recognition is an important part [21]. In e-commerce, user evaluation of products can help companies understand user satisfaction with products [22]. In biomedicine, intelligent triage can save a lot of medical resources and improve the quality and efficiency of services [23].
Text data mining in the power industry is still in the emerging field, and foreign countries have studied the relationship between the historical fault data and the weather to further predict the fault of the substation. However, these text mining methods are mostly based on traditional machine learning methods, seldom adopt deep learning methods, and lack research on the classification of a specific device type or the fault text data itself. Generally speaking, the text mining technology is still in its infancy in the field of electric power, especially the research on text information of secondary equipment faults; most of the research is only based on traditional machine learning methods, and the classification model lacks pertinence [24]. Moreover, due to the short text length and lack of sufficient context for semantic feature analysis, when mining this type of text data, it is easy to cause high-dimensional information features to be sparse, resulting in a serious lack of semantic relations, and ultimately resulting in poor classification results [25]. Considering that some faulty text data are short and the traditional convolutional neural network is insufficient for feature extraction, in this paper, convolution kernels of various sizes are used to extract features from short text data.
Based on the above discussions, this paper focuses on a mass of short text data produced in the secondary equipment operation production management system and conducts related research on automatic text classification based on convolutional neural networks. In order to solve the problem of poor topic focus and sparse text density in short text data, an improved LDA topic model was proposed based on the Relevance formula for the problem of insignificant characteristics caused by excessive repetition of feature text information [26]. By setting different weighting coefficients to adjust the sampling of words, the problem of repeated vocabulary of different types of defective data was solved. Afterwards, the RLDA model and the word2vec [27] model were combined together, and the document-topic vector was constructed using the RLDA subject word model to obtain the global features. At the same time, the local features attained by using the word2vec word vector technology to mine the latent semantic features were combined. Construct the input matrix of convolutional neural network. Considering the superiority of convolutional neural for feature extraction at the level of short text information word vectors, convolutional neural networks were employed for extracting feature text vectors and classifying text vectors. The traditional convolutional neural network uses a single size convolution kernel to extract features. When faced with different document lengths, the classification results are not ideal. On the basis of the original convolution model, this paper proposes to use deep convolution kernels of multiple sizes to mine text features in depth to enhance their ability to extract locally sensitive information. Finally, the actual operation data of a northwestern power system company were used to conduct a comparative experiment to test the validity of the presented model and the accuracy of the classification algorithm in this paper.

2. Lower-Level Modeling and Optimization

2.1. Data Analysis

This paper randomly selects 1000 defect text data from a power company in a northwestern province from 2015 to 2019, according to the length of the string statistics as shown in Figure 1.
The fault data selected were caused by the manufacturing of the same auxiliary device from two different devices recorded by the same person in charge of a northwest power system in January 2017. The two devices belong to the 220 kV plant, and the same batch was delivered by the same company. The secondary equipment protection device of the model PSIU601GC-B-E1 omitted the same data and the content that has less influence on the classification result. The content is shown in Table 1.
Compared with the general Chinese short text, the text of the secondary equipment fault defect of the power system not only contains the unique attributes of the Chinese language family and the Asian-European language family, but also has the following characteristics:
(1)
Fault and defect data are deeply involved in the professional field of power systems, including many low-frequency words such as electrical professional vocabulary, equipment names, and equipment models. Because the same vocabulary is in different fields, it brings different common names or abbreviations, such as GIS, which represents the geographic location information system at the large level of the power system, and gas insulated combined electrical appliances at the device level.
(2)
Due to the classification of the secondary equipment based on the fault category, the same fault location, such as the problem of the display screen, has different defect level definition results according to the display screen, blue screen, and display failure.
(3)
Most of the fault data are based on the data manually recorded by the transport inspection personnel. The details of the text records are slightly different. The text length of each piece of defect data varies greatly. The shortest data are less than ten characters, and the longest data can be up to more than 100 morphemes.
(4)
The defect data of different fault categories have high similarity and lack sufficient semantic co-occurrence. Traditional text mining methods have limitations for short text data mining and classification with high similarity.
Through the above feature analysis of short text, it is not ideal to directly apply the topic model to text classification.

2.2. Text Classification Process for Chinese Characters

For text classification for Chinese characters, the machine learning method is always utilized to find the correspondence between text features and its categories, and relevant technology is used for automatic classification of new text because of its laws.
The steps of the aforementioned text classification model for Chinese characters can be summarized as follows. Firstly, the preprocessing of the text is completed, where the unnecessary information is removed, such as clauses, word segmentation, and stop words. This step is implemented according to the text length and text. The specific content is related. Then, the text can be expressed, namely, the text is transmitted into a computer-recognizable and processed form, which is usually expressed by a matrix or a vector. The text representation affects the effect of later text classification because it is related to the extraction of text features. Then, a suitable classifier is selected to classify the text and output the predicted classification result. Finally, the aforementioned two results of the classifier are compared (practical and predicted results). If the prediction results meet a prior standard, the training is completed, where this standard could be the prediction accuracy rate and iterations. Otherwise, the corresponding parameters need to be adjusted by means of the comparison result, and the classification is re-classified until the classification prediction result reaches the standard.

3. Short Text Data Model of Secondary Equipment Faults in Power Systems Based on LDA Topic Model and Convolutional Neural Network

3.1. Improved Text Classification Process

The quality of text representation directly affects the effect of final classification. Transforming Chinese language into a structured language that can be recognized by the computer is the process of feature extraction and semantic abstraction of Chinese text. The traditional LDA model uses the external corpus or the method of merging short texts to improve the semantic information between words, but the word vector captured by the topic model is the word bag model, that is, the two phrases “a before B” and “B before a” are characterized as the same word vector after extracting the features from the topic model. However, most of the original data in this paper were based on the manual records of operation and maintenance personnel, and it is difficult for different people to form a standardized recording method. In the face of short text feature mining with poor context dependence such as fault data, the classification result obtained by directly using LDA model is poor.
In this paper, the RLDA model was used to extract global features to construct the subject word vector, and the word2vec model was used to mine the potential feature vector extracted by local features. The two features were combined to absorb their respective advantages as the input of the convolutional neural network.

3.1.1. Text Preprocessing

Consulting the published work [28], the collected short text data can be labeled as serious, critical, and general defects for the secondary equipment. In a ratio of 7:2:1, the obtained text short messages could be defined as training set, verification set, and test set. The top 30 terms in terms of frequency without text pre-processing are shown in Figure 2.
Analyzing and summarizing the natural language characteristics of the defective text data, the secondary equipment defect text data cleaning was based on the following steps:
(1)
Remove useless characters. Defective text generally involves a great deal of spaces. Some useless characters should be filtered, such as punctuation and so on, because they are not related to the text content. In Chinese, the words “I” and “do” are used a lot. By utilizing excessive words, the accuracy of the segmentation is increased and the efficiency is decreased. Meanwhile, the words “no” and “yes” are also used a lot in prepositions, conjunctions, and adverbs. These words are usually meaningless.
(2)
English characters are uniformly given in the form of lowercase. In the secondary equipment, the recording format of the defect text is not standardized due to the fact that it includes a lot of English characters, such as “10 KV”, “10 kv”, and “10 Kv” for the description of transformer grades. They all represent the same voltage level, but the recording format is different.
(3)
The repeated records and fragmentary text are detected and removed. When the defect records are uploaded, some problems, including data loss and repeated data entry, are produced easily for operation and maintenance personnel due to improper operations. The text classification and information mining are not easy to implement by using such data, where these data should be processed in advance to guarantee the quality of the text.
(4)
A professional dictionary should be constructed for secondary equipment. The establishment of a special dictionary corresponding to the professional field is the basic work of text mining in various professional fields. The quality and quantity of words included in its professional dictionary determine the accuracy of word segmentation and the part of speech tagging in text preprocessing. Due to the large number and miscellaneous types of electrical secondary equipment, the number of words related to the construction of this field is very huge, and there are thousands of words describing the equipment itself, such as the transformer station names, equipment protection proper terms, and so on.

3.1.2. Text Classification Model by Using LDA

The LDA topic model features based on short text data from secondary equipment are explained as follows:
(1)
Initializing model parameters α , β and K , where α , β and K are the denoted prior parameters file-theme distribution parameter, theme-word distribution parameter, and the number of themes K , respectively [26].
(2)
Traverse and classify short text data, and for each word w i in terms of the list L i , build θ i = D i r i c h l e t ( α ) where θ i and L i , stand for the document-topic distribution and the adjacent word of w i respectively.
(3)
Suppose that Z satisfies the Dirichlet prior distribution, where Z is the potential word set. Moreover, the computational formula ϕ Z = D i r i c h l e t ( β ) is utilized in this step, in which ϕ Z stands for the topic-word distribution.
(4)
In view of each word in L i , choose words Z j θ i and w j ϕ Z j with Z j θ i and w j ϕ Z j being potential and neighboring words, respectively; attain short texts with the help of the documents. Then, the subject matter is inferred from the secondary device short text data on the basis of the following expression:
P ( w i | d ) = f d ( w i ) L e n ( d )
where f d ( w i ) represents the frequency of the words in the document, and L e n ( d ) stands for the length of the short text d .
Inspired by [26], the expectation of the topic distribution for document-generating words can be regarded as the distribution of document-generating topics:
P ( z | d ) = w i W d P ( z | w i ) P ( w i | d )
where P ( z | d ) , W d , and P ( z | w i ) are the probability of the text generating words, the short text set, and the probability of the word generating topics, respectively.
The LDA topic generation model was established. Then, we needed to implement the Gibbs sampling estimation based on the corresponding model parameters and give the number of iterations. Finally, the topic distribution matrix of any text in the corpus could be obtained after completing the model training.

3.1.3. Improved LDA Topic Analysis Model Based on Relevance Formula

In this paper, the LDA topic model was improved by introducing a weighting coefficient λ in the topic correction layer to realize the model’s potential topic extraction and topic correction function for secondary equipment fault text information. The proposed model is shown in Figure 3. The Relevance formula is as follows:
r ( w , k | λ ) = λ · log ( ϕ k , w ) + ( 1 λ ) · ϕ k , w p w
where r ( w , k | λ ) represents the degree of relevance of word w and topic k under the set weight coefficient λ . The value range of λ is ( 0 λ 1 ) . ϕ k , w is the probability distribution matrix of the words w under the topic k , and the marginal probability of the words under the topic-term matrix ϕ .
From Equation (3), we can dynamically adjust the relationship between words and subjects by establishing weight coefficients. When the weight coefficient λ is close to 1, the more frequent the words appear in the word frequency, the higher contribution to the document theme, that is, the more frequent words in the default document are more relevant to the topic; when the weight coefficient λ is close to 0, the improved model indicates that the word appears more frequently in the selected topic, but less frequently in other topics; that is, the words and topics generally appear concomitantly.

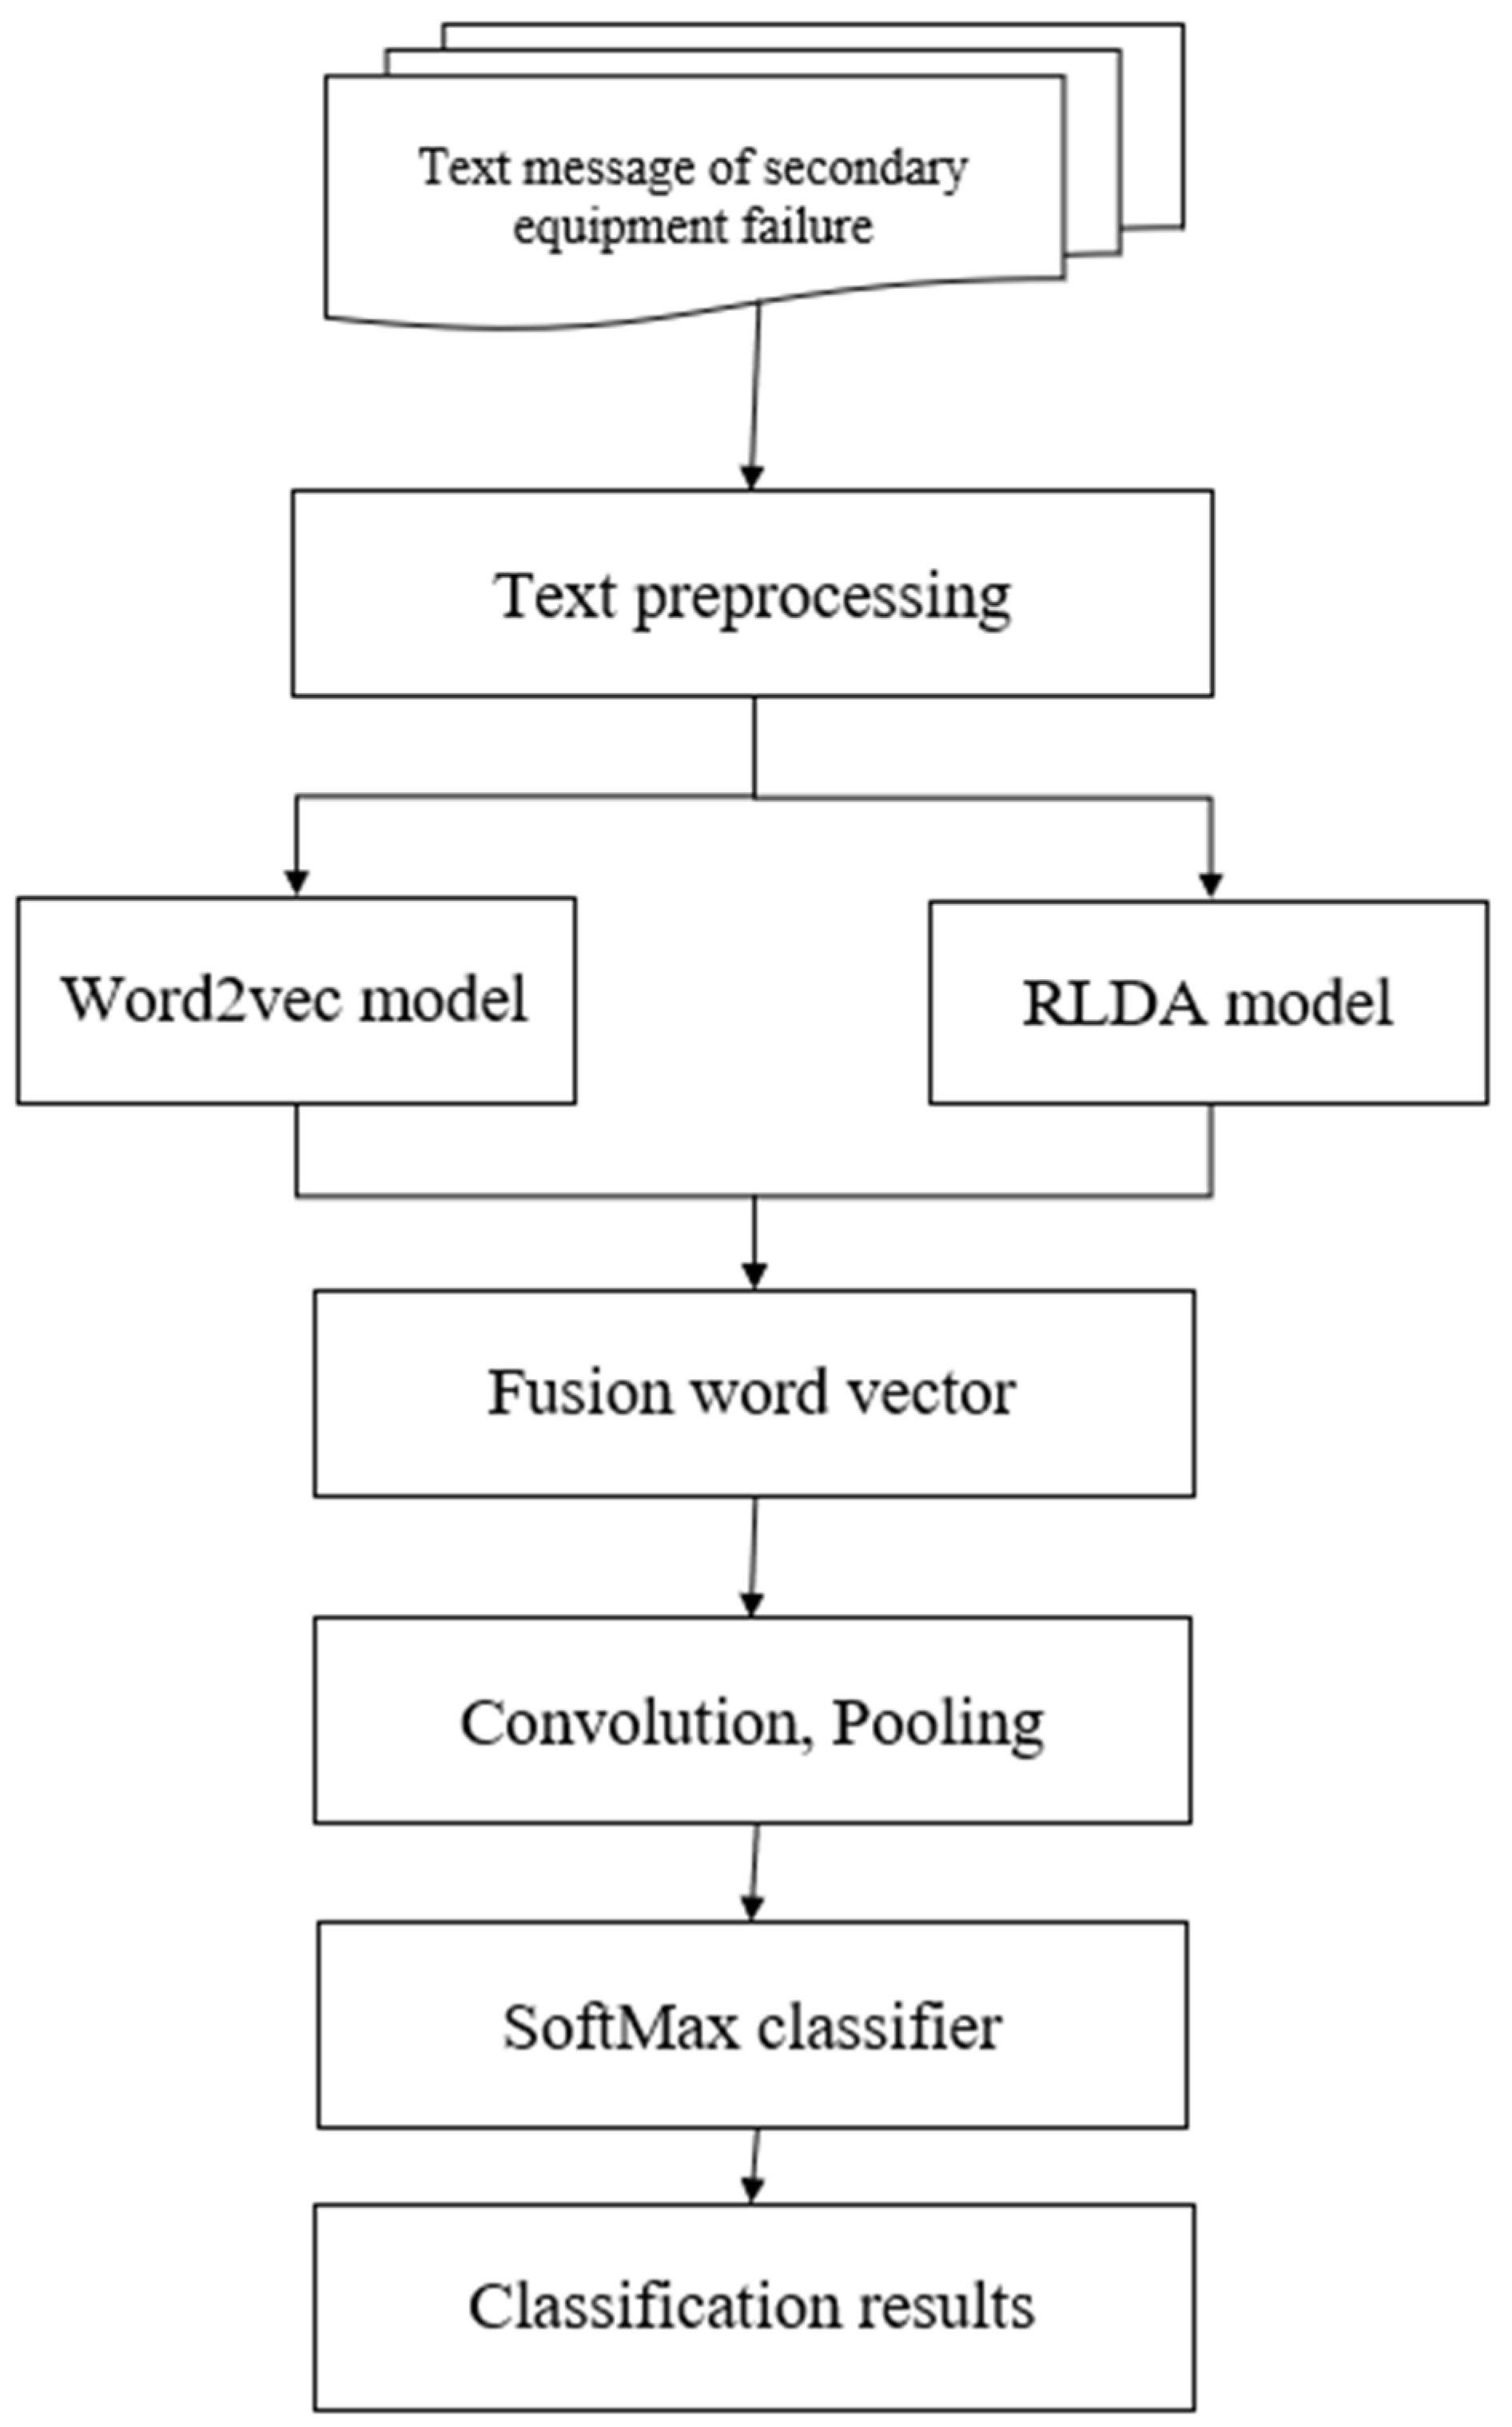
3.2. Fusion of Word2vec Model and RLDA Model

In order to increase the interpretability of the text feature vector to the text representation, the improved LDA subject word model was proposed based on the Relevance formula to extract the global features to construct the subject word vector, and the latent feature vector extracted using the word2vec algorithm. By combining two features, the following new text feature representation is given by
v m = [ z m T , θ m T ] T
where z m is the latent semantic vector representation of the document, θ m is the latent text-topic vector of the text extracted based on the improved topic model of the Relevance formula, v m is the combined semantic feature representation vector, and T is the transpose operation on the matrix.
The topic vector and the latent semantic vector are different in the dimension representation of the word vector. In order to eliminate the influence of the difference in magnitude generated by the fusion of the two vectors on the final classification result, this paper summarizes the two vectors z m and θ m . In a one-way combination, the processing method is as follows:
v m = [ z m T z m , θ m T θ m ] T
The vectors combined by normalization not only regularize the length and eliminate the gap in magnitude between the two vectors, but also the new vectors generated by the fusion have both topical and potentially topical features.
In the following, the text classification model is constructed based on convolutional neural network. By means of the convolutional neural network, a four-layer model was developed, which is shown in Figure 4.
The detailed design are presented as following four parts:
(1)
The first layer
The first layer could be defined as the input layer. In this layer, a length of text data was selected, and the vectorization of the text data was implemented with the help of step C. Employing the matrix I m × n as the input and defining the number of words as m , m represents the number of rows in the input layer. Similarly, we defined the dimension of the text vector as n , which can represent the columns of the input layer. Then, all word data could be divided into word vectors of equal dimensions, namely, the number of columns is the same in the input layer. Accordingly, matrix I m × n was constructed. During the training process, we employed the stochastic gradient descent method to adjust the word vector.
(2)
The second layer
The second layer was named as the convolution layer. Each scale includes two convolution kernels that have the scales of 3 × n , 4 × n , 5 × n Then, for the input matrix I m × n of the input layer, we needed to implement the convolution operation and acquire the matrix features of the input layer. The corresponding result vector could be attained ( c i ( i = 1 , 2 , 3 , 4 , 5 , 6 ) ), which was input to the pooling layer for data compression. Meanwhile, the activation function ReLU was used to activate the convolution result. After each convolution operation, one convolution result will be obtained:
r i = W I i : i + h 1
where the size of i = 1 , 2 , , s h + 1 and I i : i + h 1 are the size of convolution kernel, which represents the number i of h × n matrix block from top to bottom when the matrix I is operated in sequence; “∙” means that the elements at the corresponding positions of two matrix blocks are multiplied first and then added. Meanwhile, the activation function ReLU was used to activate the convolution result. Nonlinear processing was carried out for each convolution result r i , and the result c i was obtained after each operation. The formula is as follows:
c i = ReLU ( r i + b )
where b is the offset coefficient. Each such operation will produce a nonlinear result c i . Because i = 1 , 2 , , s h + 1 , after s h + 1 convolution operations on the input matrix from top to bottom, we should arrange the results in order, and obtain the vector of the convolution layer c R s h + 1 , which is shown as:
c = [ c 1 , c 2 , , c s h + 1 ]
(3)
The third layer
We defined the third layer as the poling layer and employed the maximum pooling method for pooling. For the convolution result vector c i , the largest element was chosen as the feature value, which is defined as p j ( j = 1 , 2 , 3 , 4 , 5 , 6 ) . Then, the value p j was injected in succession into the vector p 6 × 1 , which was input to the output layer of the next layer. Vector p stands for the global features of the text data, and it can reduce the dimensionality of the features and enhance the efficiency of classification.
(4)
The fourth layer
Here, the output layer was utilized to name the fourth layer. We plugged the pooling layer completely into the output layer. In the pooling layer, we selected the vector p as an input, which was classified with the help of a SoftMax classifier. Then, the final classification result was output. The probability was computed using SoftMax classification, which is as follows:
L ( p j ) = e p j j = 1 6 e p j
where the formula (9) refers to the probability that belongs to the secondary device category.
The fault level was output for the secondary equipment. The traditional convolutional neural network used a single size convolution kernel to extract features. When faced with different document lengths, the classification results were not ideal. On the basis of the original convolution model, the deep convolution kernels of multiple sizes were utilized to mine text features in depth to enhance their ability to extract locally sensitive information, so that they can represent more feature information. To make a clear statement, the overall flow chart of the proposed model in this paper is shown in Figure 5.

4. Case Study

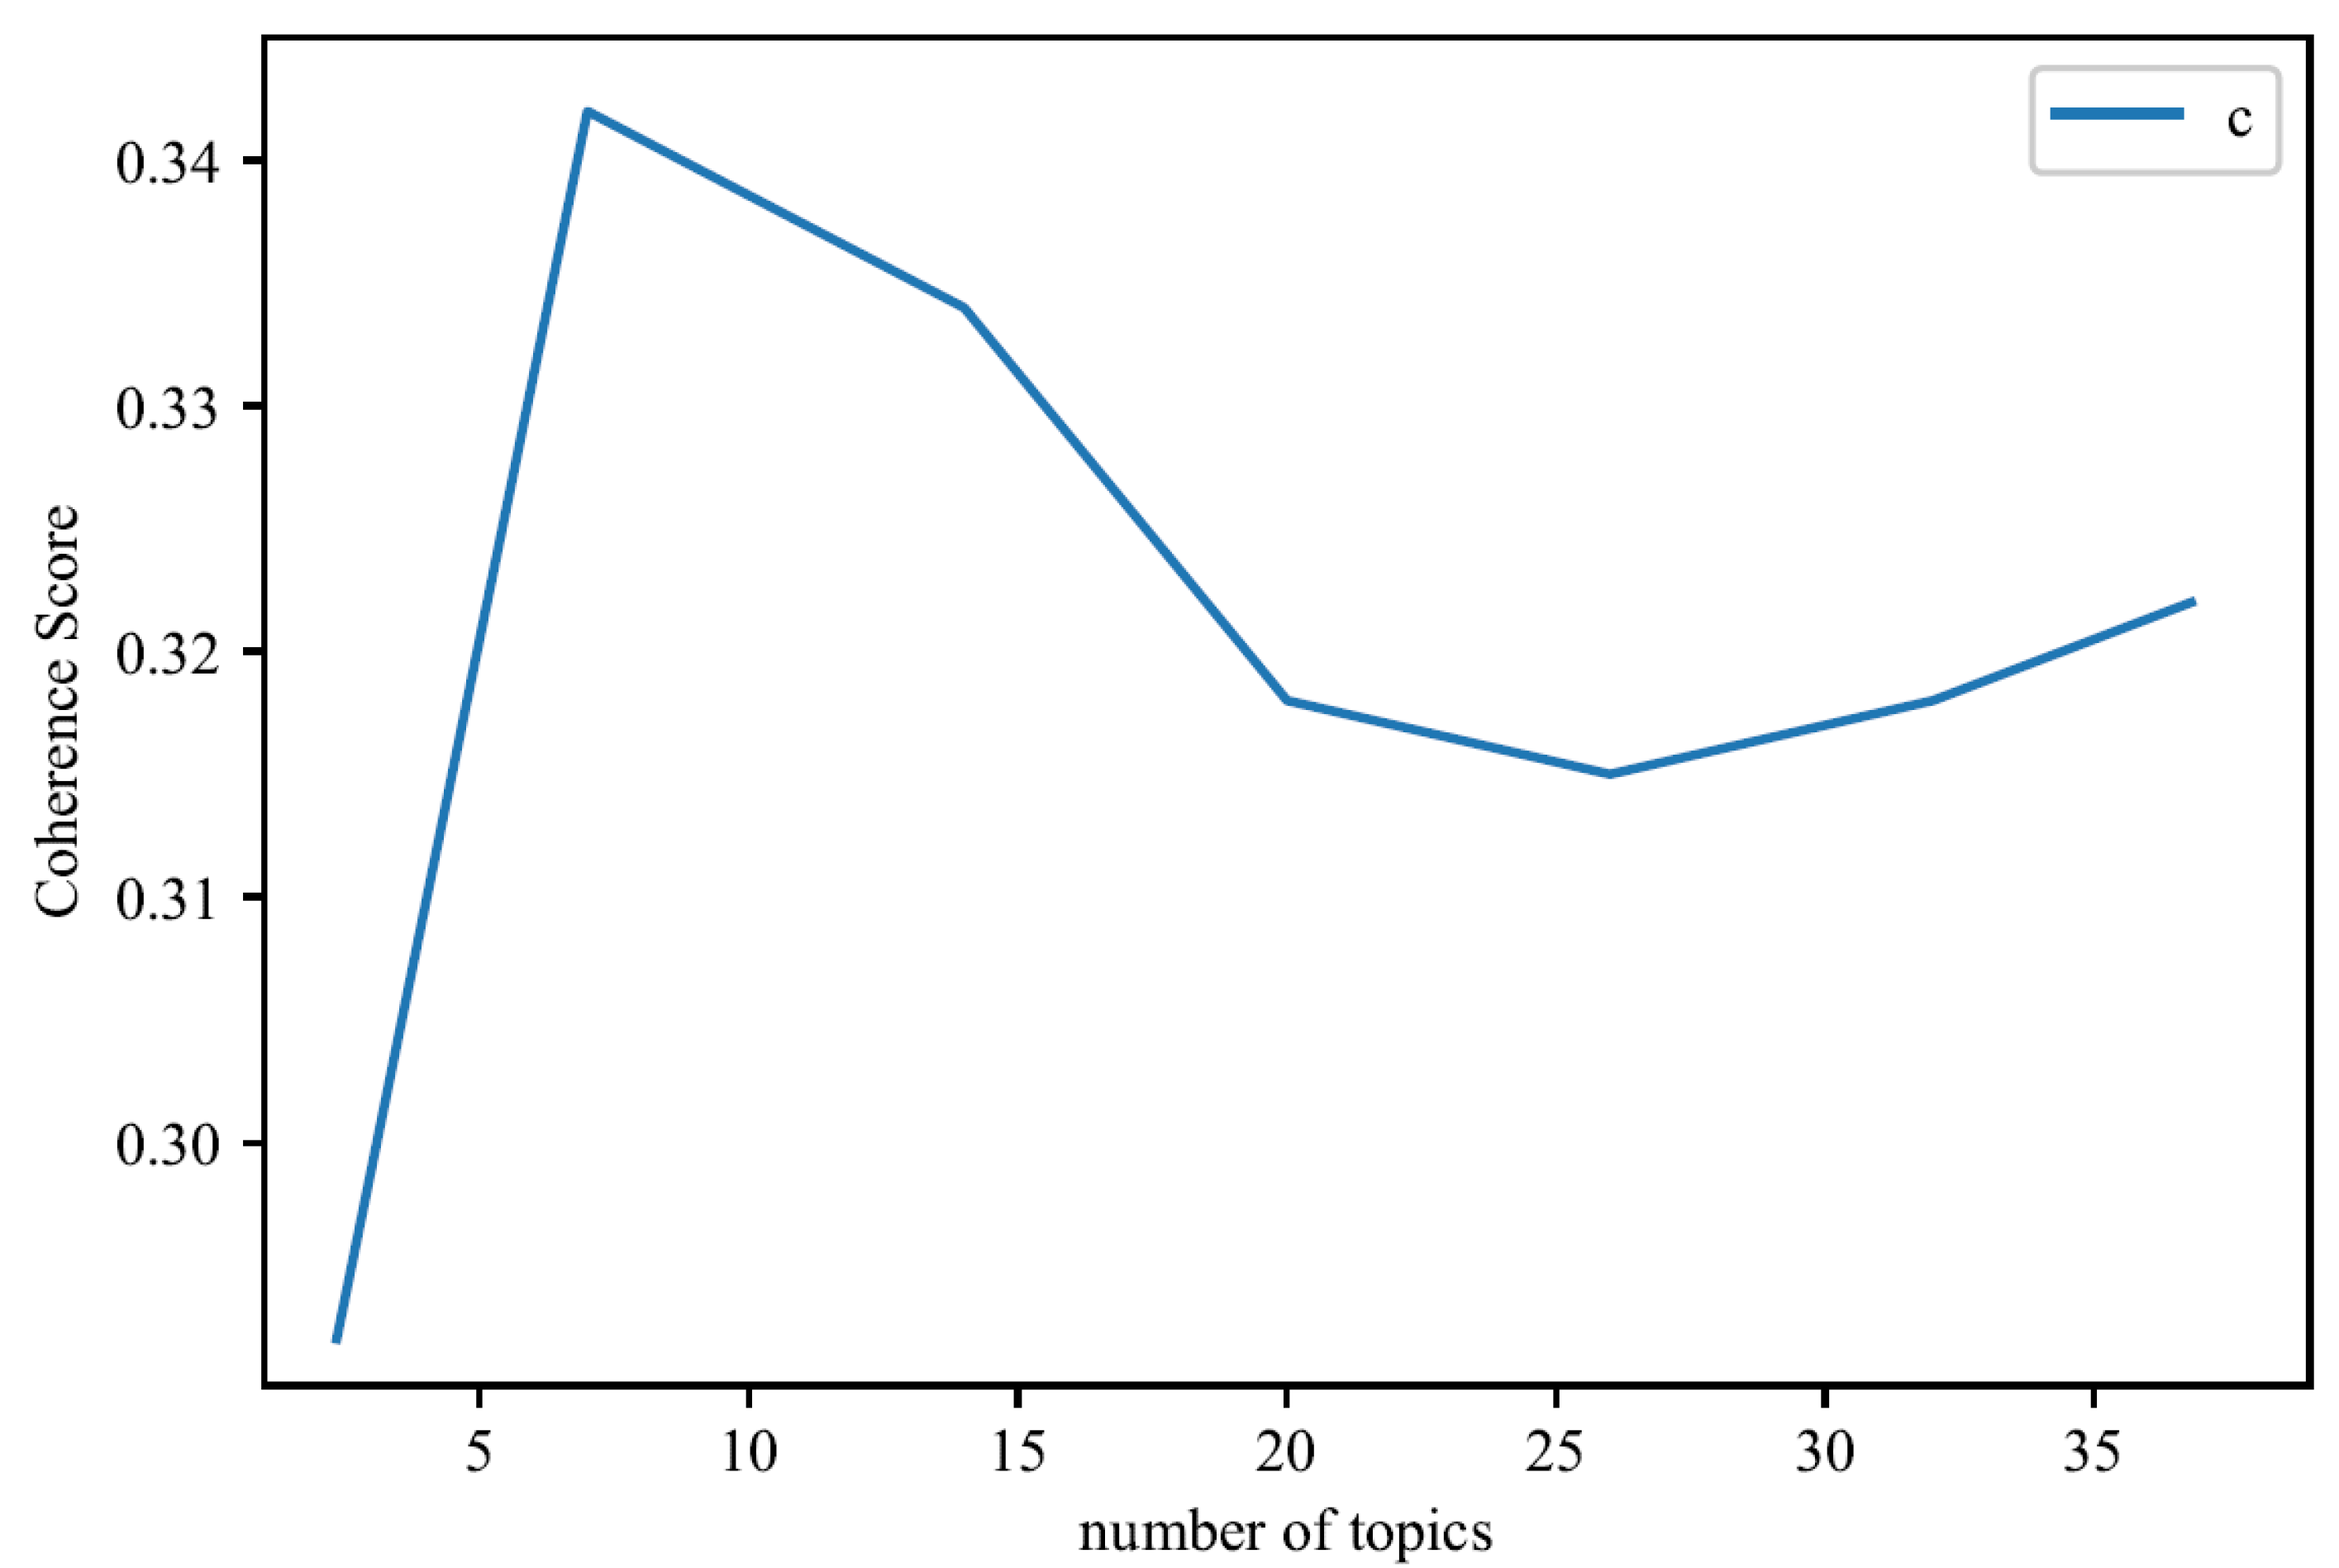
4.1. RLDA Model Experiment

In order to compare the advantages and disadvantages of the LDA model and the improvement of the LDA model based on the Relevance formula in terms of prediction ability and generalization ability, this experiment used the theme consistency (coherence score) indicator. Generally, the larger the value, the stronger the predictive ability and generalization ability of the model, indicating that the model was more practical. According to the characteristics of the experimental data set, the main parameter values set by the text are shown in Table 2, and K represents the number of topics contained.
In this paper, the comparison experiment was carried out by changing the value of the number of topics K. Under different values of the number of topics, the corresponding coherence score value of the improved LDA model based on the Relevance formula was calculated according to the theme consistency calculation formula. The experimental comparison results are shown in Figure 6, Figure 7, Figure 8 and Figure 9. As shown in Figure 6, as the number of topics continued to increase, the coherence score had a process of increasing first, then decreasing, and then slowly smoothing out. The score is the highest when the number of topics is about seven to eight.
With the help of the LDAvis toolkit, the model topics with topic number seven and topic number eight were reduced to a two-dimensional plane for visual display. The results are shown in Figure 7. The left half is the topic model with the number of topics eight, and the right half is the theme model with theme seven. The greater the degree of topic intersection, the greater the difficulty of distinguishing the topic. The degree of intersection between the topics of the model with eight topics was much greater than that of the model with seven topics. Therefore, this article was in the pursuit of model generalization ability.
When the weighting factor λ was close to 1, it indicated a high frequency of occurrence in the word frequency and a high contribution from its document topic. We can conclude that the relevance to the topic was higher in the default document. When the weight coefficient λ was close to 0, the improved model indicated that the word appeared more frequently in the selected topic, but less frequently in other topics; that is, the generality between words and topics appeared. Considering the influence of relevance and concomitates, the consistency score of the model was repeatedly calculated, and the result was found to be the best when λ was 0.52. The relationship between the weight coefficient and the consistency score is shown in Figure 8. When λ was 0.52, the relationship between the theme of topic 1 and the words is shown in Figure 9.

4.2. Results and Analysis of Evaluation Index of Classification Effect

Text classification effect evaluation is an important module of text classification. It usually uses the mixed matrix as the basis, also known as the error matrix. It is usually expressed in two-dimensional tables. The classification results can be visually analyzed through the confusion matrix [29,30]. The confusion matrix is shown in Table 3.
For classification results, internationally recognized evaluation indicators were used: accuracy rate P, recall rate R, and F1 values. The calculation formula is as follows:
P = T P T P + F P
R = T P T P + F N
F 1 = 2 × P × R P + R
where TP indicates the number of samples that a certain type of text is correctly identified as a class, FP indicates the number of samples that a certain type of text has to be identified as other classes, and FN indicates that the text of other types is confirmed as the number of samples of the class. In order to verify the effectiveness of the improved input feature matrix, the CNN text classification method based on word2vec was compared with the experiments in this paper. It compared precision P, recall R, and F1 values.
In the next study, we will test the superiority of the presented method of this paper, which was compared with traditional machine learning methods such as SVM, LR, KNN, and other models to find the accuracy of each algorithm model on the same data set. The experimental results are shown in Table 4.
Compared with the traditional machine learning methods LR, SVM, and KNN, due to the large corpus short text in this experiment, the F1 values of the results were basically around 50%, and the accuracy of the highest SVM model classification results was only 54.53%. The accuracy of the typical CNN model classification results is only 55.36%. The effect of machine learning classification was not ideal. The traditional LDA topic model extracts features and lacks contextual semantic information, which makes it difficult to achieve ideal results in short text classification. The F1 value of the experiment was only 63.00%. Compared with the traditional CNN, the model of WORD2VEC + TEXTCNN was 14.91% higher than WORD2VEC + CNN. The text was improved on the traditional LDA theme model. The weight coefficient λ was used to adjust the relationship between words and subjects. Finally, the F1 of the WORD2VEC + RLDA + TEXTCNN model was the highest, up to 81.69%, whether it was with traditional machines. Compared with the traditional convolutional neural network learning algorithm, the F1 results were significantly improved. Therefore, the generalization ability and practicability of the model constructed in this paper have satisfied the possibility of practical application.

5. Discussion

Aiming at the problem of multi-type and complex secondary equipment in power systems and the low accuracy of word segmentation results, in this paper, a stop words dictionary and a professional dictionary in the field of secondary equipment in power system were constructed. An improved LDA topic analysis model based on the Relevance formula was proposed. By setting different weight coefficients, the feature similar words in texts with different defect categories were separated to solve the problem of feature sparseness. An improved algorithm was proposed by integrating the improved LDA topic model with word2vec, where the global features were mined by using the topic model, and the context semantic features were mined by using the latent semantic word vector model, which can better extract the short text features. The multi-scale convolution kernel was used to extract features to enhance its ability to extract local sensitive information, and further to conduct in-depth mining of text semantic information.
There are also some problems, such as a large number of professional dictionaries in the field of secondary equipment are constructed in the preprocessing process, which improves the professionalism of this model to some extent. However, the direct application of this model to other fields is likely to lead to poor generalization ability. All these topics are left for the future and ongoing research topics.

6. Conclusions

In this paper, for the problem of short text information of secondary equipment faults in the power system and the high repetition of words between different defect categories, an LDA topic model based on the Relevance formula was built to dynamically adjust the correlation between topics and words. In addition, considering that the topic model itself has insufficient ability to extract short text features, the word2vec latent semantic feature vectors were fused to compensate for contextual semantic information. Considering that some fault text data were short, the traditional convolutional neural network had insufficient feature extraction, and multiple sizes of convolution kernels were used to extract features from short text data. Finally, using the fault text data generated by the actual operation of a power system company in a northwestern province to verify the method in this paper, the results showed that the algorithm has a certain practicality.

Author Contributions

J.L. created models, developed methodology, wrote the initial draft, and designed computer programs; H.M. supervised and leaded responsibility for the research activity planning and presented the critical review; X.X. and J.C. conducted the research and investigation process and edited the initial draft; J.L. and H.M. reviewed the manuscript and synthesized the study data. All authors have read and agreed to the published version of the manuscript.

Funding

This work was supported by the National Natural Science Foundation of China (51577050).

Conflicts of Interest

The authors declare no conflict of interest.

References

  1. Jin, H.; Liu, X.; Liu, W.; Xu, J.; Li, W.; Zhang, H.; Zhou, J.; Zhou, Y. Analysis on Ubiquitous Power Internet of Things Based on Environmental Protection. IOP Conf. Ser. Earth Environ. Sci. 2019, 300, 42077–42083. [Google Scholar] [CrossRef]
  2. Chen, K.; Mahfoud, R.J.; Sun, Y.; Nan, D.; Wang, K.; Haes Alhelou, H.; Siano, P. Defect Texts Mining of Secondary Device in Smart Substation with GloVe and Attention-Based Bidirectional LSTM. Energies 2020, 13, 4522. [Google Scholar] [CrossRef]
  3. Bakr, H.M.; Shaaban, M.F.; Osman, A.H.; Sindi, H.F. Optimal Allocation of Distributed Generation Considering Protection. Energies 2020, 13, 2402. [Google Scholar] [CrossRef]
  4. Liu, G.; Zhao, P.; Qin, Y.; Zhao, M.; Yang, Z.; Chen, H. Electromagnetic Immunity Performance of Intelligent Electronic Equipment in Smart Substation’s Electromagnetic Environment. Energies 2020, 13, 1130. [Google Scholar] [CrossRef] [Green Version]
  5. Yuan, Q. Research on New Technology of Power System Automation Based on Ubiquitous Internet of Things Technology. IOP Conf. Ser. Earth Environ. Sci. 2020, 440, 32101–32110. [Google Scholar] [CrossRef]
  6. Yu, X.; Xue, Y. Smart Grids: A Cyber-Physical Systems Perspective. Proc. IEEE 2016, 104, 1058–1070. [Google Scholar] [CrossRef]
  7. Collobert, R.; Weston, J. A Unified Architecture for Natural Language Processing: Deep Neural Networks with Multitask Learning. In Proceedings of the 25th International Conference on Machine Learning, Helsinki, Finland, 5 July 2008; pp. 160–167. [Google Scholar]
  8. El Hindi, K.; Alsalman, H.; Qasem, S. Building an Ensemble of Fine-Tuned Naive Bayesian Classifiers for Text Classification. Entropy 2018, 20, 857. [Google Scholar] [CrossRef] [Green Version]
  9. Xu, S. Bayesian Naïve Bayes Classifiers to Text Classification. J. Inform. Sci. 2018, 44, 48–59. [Google Scholar] [CrossRef]
  10. Collobert, R.; Weston, J.; Bottou, L. Natural Language Processing (Almost) from Scratch. J. Mach. Learn. Res. 2011, 12, 2493–2537. [Google Scholar]
  11. Goudjil, M.; Koudil, M.; Bedda, M.; Ghoggali, N. A Novel Active Learning Method Using SVM for Text Classification. Int. J. Automat. Comput. 2018, 15, 290–298. [Google Scholar] [CrossRef]
  12. Wu, K.; Gao, Z.; Peng, C.; Wen, X. Text Window Denoising Autoencoder: Building Deep Architecture for Chinese Word Segmentation. In Proceedings of the CCF International Conference on Natural Language Processing and Chinese Computing, Chongqing, China, 15–19 November 2013; Springer: Berlin/Heidelberg, Germany, 2013; pp. 1–12. [Google Scholar]
  13. Zhang, Y.; Zheng, J.; Jiang, Y.; Huang, G.; Chen, R. A Text Sentiment Classification Modeling Method Based on Coordinated CNN-LSTM-Attention Model. Chin. J. Electron. 2019, 28, 120–126. [Google Scholar] [CrossRef]
  14. Jing, R. A Self-attention Based LSTM Network for Text Classification. J. Phys. Conf. Ser. 2019, 1207, 12008–12012. [Google Scholar] [CrossRef]
  15. Zhang, M.; Xiang, Y. A Key Sentences Based Convolution Neural Network for Text Sentiment Classification. J. Phys. Conf. Ser. 2019, 1229, 12062–12068. [Google Scholar]
  16. Roy, S.S.; Rodrigues, N.; Taguchi, Y. Incremental Dilations using CNN for Brain Tumor Classification. Appl. Sci. 2020, 10, 4915. [Google Scholar] [CrossRef]
  17. Zahid, M.; Ahmed, F.; Javaid, N.; Abbasi, R.A.; Zainab Kazmi, H.S.; Javaid, A.; Bilal, M.; Akbar, M.; Ilahi, M. Electricity Price and Load Forecasting using Enhanced Convolutional Neural Network and Enhanced Support Vector Regression in Smart Grids. Electronics 2019, 8, 122. [Google Scholar] [CrossRef] [Green Version]
  18. Li, H.; Huang, J.; Ji, S. Bearing Fault Diagnosis with a Feature Fusion Method based on an Ensemble Convolutional Neural Network and Deep Neural Network. Sensors 2019, 19, 2034. [Google Scholar] [CrossRef] [Green Version]
  19. Yang, Z.; Fan, K.; Lai, Y.; Gao, K.; Wang, Y. Short Texts Classification Through Reference Document Expansion. Chin. J. Electron. 2014, 23, 315–321. [Google Scholar]
  20. Gao, Y.; Zhu, Z.; Riccaboni, M. Consistency and Trends of Technological Innovations: A Network Approach to the International Patent Classification Data. In Proceedings of the International Conference on Complex Networks and their Applications VI, Lyon, France, 29 November–1 December 2017; Springer: Cham, Switzerland, 2017; pp. 744–756. [Google Scholar]
  21. Li, J.; Fong, S.; Zhuang, Y.; Khoury, R. Hierarchical Classification in Text Mining for Sentiment Analysis of Online News. Soft Comput. 2016, 20, 3411–3420. [Google Scholar] [CrossRef]
  22. Wang, L.; Guo, X.; Wang, R. Automated Crowdturfing Attack in Chinese User Reviews. J. Commun. 2019, 40, 1–13. [Google Scholar]
  23. Hughes, M.; Li, I.; Kotoulas, S.; Suzumura, T. Medical Text Classification Using Convolutional Neural Networks. Stud. Health Technol. Inform. 2017, 235, 246–250. [Google Scholar]
  24. Tommasel, A.; Godoy, D. Short-Text Learning in Social Media: A Review. Knowl. Eng. Rev. 2019, 38–49. [Google Scholar] [CrossRef]
  25. Wang, H.; He, J.; Zhang, X.; Liu, S. A Short Text Classification Method based on N-gram and CNN. Chin. J. Electron. 2020, 29, 248–254. [Google Scholar] [CrossRef]
  26. Mikolov, T.; Chen, K.; Corrado, G.; Dean, J. Efficient Estimation of Word Representations in Vector Space. arXiv 2013, arXiv:1301.3781. [Google Scholar]
  27. Blei, D.M.; Ng, A.Y.; Jordan, M.I. Latent Dirichlet Allocation. J. Mach. Learn. Res. 2003, 993–1022. [Google Scholar]
  28. Wei, W.; Nan, D.; Zhang, L.; Zhou, J.; Wang, L.; Tang, X. Short Text Data Model of Secondary Equipment Faults in Power Grids based on LDA Topic Model and Convolutional Neural Network. In Proceedings of the 2020 35th Youth Academic Annual Conference of Chinese Association of Automation (YAC), Zhanjiang, China, 16–18 October 2020; pp. 156–160. [Google Scholar]
  29. Lu, X.; Zhou, M.; Wu, K. A Novel Fuzzy Logic-Based Text Classification Method for Tracking Rare Events on Twitter. IEEE Trans. Syst. Man Cybern. Syst. 2021, 51, 4324–4333. [Google Scholar] [CrossRef]
  30. Fawcett, T. An Introduction to ROC Analysis. Pattern Recognit. Lett. 2006, 27, 861–874. [Google Scholar] [CrossRef]
Figure 1. Interval diagram of text information length distribution of secondary equipment faults in a northwestern power system.
Energies 15 02400 g001
Figure 2. The top 30 words without text pre-processing.
Energies 15 02400 g002
Figure 3. RLDA model structure diagram.
Energies 15 02400 g003
Figure 4. Text convolutional neural network model.
Energies 15 02400 g004
Figure 5. The flow chart of the proposed text classification algorithm.
Energies 15 02400 g005
Figure 6. The relationship between the coherence score and number of topics.
Energies 15 02400 g006
Figure 7. Theme map of the theme model with eight topics (left) and seven topics (right).
Energies 15 02400 g007
Figure 8. Diagram of the relationship between λ and the consistency score.
Energies 15 02400 g008
Figure 9. Top 30 words of topic distribution and relativity of topic 1 when λ was 0.52.
Energies 15 02400 g009
Table 1. Example of the text information record of a second equipment failure in a northwestern company in January.
NumberDefects and Treatment MethodsDefect Classification
1The main set B intelligent terminal sends a GOOSE link interruption general alarm, which does not affect the normal operation of the B set protection and needs to be exited for inspection.Serious defect
2General alarm of GOOSE in A set of intelligent terminals of Yanhua Temple Line, data of GOOSE network is interrupted.Critical defect
Table 2. Parameter setting of the RLDA model.
ParameterValue
Hyperparameter α50/K
Hyperparameter β0.01
Gibbs sampling iterations1000
Input word vectorWord2vec
Filter size(3,4,5)
Number of filters per size100
Activation functionReLU
Pooling strategy1-max pooling
Dropout rate0.5
Table 3. Mixed matrix of classification results.
Classification CategoryManually Marked as Belonging toManually Marked as Not Belonging to
Classifiers marked as belonging toTPTN
Classifier marked as not belonging toFPFN
Table 4. Comparison of the experimental results with machine learning methods.
Classifier NameF1 Value (%)
LR51.20
SVM54.53
KNN51.20
CNN55.36
WORD2VEC + CNN63.63
LDA + CNN63.00
WORD2VEC + TEXTCNN78.54
WORD2VEC + RLDA + TEXTCNN81.69
Publisher’s Note: MDPI stays neutral with regard to jurisdictional claims in published maps and institutional affiliations.

