Article

Effects of Polyoxymethylene Dimethyl Ethers Addition in Diesel on Real Driving Emission and Fuel Consumption Characteristics of a CHINA VI Heavy-Duty Vehicle

1
School of Energy and Power Engineering, Xi’an Jiaotong University, Xi’an 710049, China
2
Shaanxi Heavy-Duty Automobile Co., Ltd., Xi’an 710200, China
*
Author to whom correspondence should be addressed.
Energies 2022, 15(7), 2379; https://doi.org/10.3390/en15072379
Submission received: 8 March 2022 / Revised: 22 March 2022 / Accepted: 23 March 2022 / Published: 24 March 2022

Abstract

:
Polyoxymethylene dimethyl ethers (PODE), as the most potential oxygenated alternative fuel for diesel engines, is widely investigated. Considering the importance of research on real driving emissions (RDE) and the few studies focus on the emission characteristics of the PODE/diesel blended fuels under real driving conditions, a portable emission measurement system (PEMS) was applied to measure the RDE of a heavy-duty tractor fueled with diesel or PODE/diesel blends. The tests were carried out in accordance with the relevant regulations of the CHINA VI emission standards. The second-by-second data from PEMS and the OBD system were utilized to construct engine transient operating maps. The results indicated that the addition of PODE can still decrease CO and PN emissions significantly under real driving conditions, although the low load conditions are still the areas of high brake specific CO and brake specific PN emissions. The NOx emissions, however, were not reduced as the results of the steady-state experiment of the same model of the engine. Fuel mass consumption raised when PODE was added, while the overall brake thermal efficiency improved, especially for the blending ratio of 30%, up to 40.3%, which is higher than 38.4% of pure diesel operation.

1. Introduction

For nearly fifty years, concerns about petroleum depletion have greatly affected the development of internal combustion engines, but nowadays, the anxiety about climate change and environmental degradation caused by vehicles or engines has even exceeded the threat of resource depletion [1]. As a matter of fact, the exhaust emissions of vehicles do have extremely harmful effects on the atmospheric environment and human health [2]. Diesel engine exhaust was classified as carcinogenic to humans (Group 1) by the International Agency for Research on Cancer (IARC) [3]. It has also been reported that nitrogen oxides (NOx) and particulate matter (PM) with a diameter of smaller than 2.5 μm (PM2.5), abounding in the exhaust of diesel engines, may cause pathological changes in many important organs of the human body [4,5]. Nevertheless, the status of diesel engines in commercial vehicles, especially in the field of heavy-duty vehicles (HDV), still cannot be shaken at the wave of electrification. Because compared with the limited range and payload of electric vehicles [6], diesel vehicles have a longer range, stronger load capacity with much more complete supporting facilities. Considering the huge market share of HDV, diesel engines will be one of the principal contributors to air pollution for a long time in the foreseeable future, particularly NOx and PM. Therefore, increasingly strict emission regulations have been made around the world [7].
In fact, people gradually realize that fossil fuel is the core of the problem, not the engines themselves [8]. Consequently, research on alternative fuel for engines has attracted wide attention. Blending oxygenated fuels with diesel is one of the potential methods to reduce the emission level of engines [9,10]. Alcohols, esters, and ethers were studied as fuel or diesel fuel additives and proved that these sorts of oxygenated fuels all have certain effects on reducing PM and gaseous emissions, while ethers are better than others in terms of combustion owing to the high cetane number (CN) and oxygen content [11]. Among them, polyoxymethylene dimethyl ethers (PODE) have the most potential [11]. With the success of carbon dioxide (CO2) hydrogenation to methanol over catalysts [12], the conversion of methanol into PODE as a diesel fuel additive becomes an effective way to reduce CO2 emissions and even achieve carbon neutralization in the fuel life cycle.
Therefore, massive amounts of research have been carried out on PODE/diesel blends, including the measurement of fuel properties, studies of engine combustion and emission characteristics, etc. It has been proved that PODE blended fuels are beneficial to the whole engine combustion processes, such as spray atomization [13], shorter ignition delay, more constant volume degree of combustion [14]. The accelerated combustion rate has also been reported due to the high oxygen content and high volatility of PODE [15]. It has also been proved in most research that the increased oxygen content of blended fuels makes engine carbon monoxide (CO), total hydrocarbon (THC), and soot decrease significantly with the punishment of a little increase in NOx emission [16,17,18]. However, more feasible exhaust gas recirculation (EGR) strategies can be applied to reduce NOx emission without deterioration of the engine combustion and soot emissions [15]. It has previously been observed that the reduction in PM and particle number (PN) emissions, because of the blending of PODE [19]. The effect of PODE blending on brake thermal efficiency (BTE) has been reported that BTE increased with the rise of blending ratio [14,17]. Of course, the brake specific fuel consumption (BSFC) [17] and the engine brake power could worsen due to the decline of the lower heating value (LHV) and the fuel injection strategy.
However, almost all of the research on PODE/diesel blends was based on laboratory conditions. Steady-state data obtained from the engine dynamometer experiments unable to capture transitory operation caused by start/stop events, transformations of traffic conditions, or turbocharger lag [20]. In fact, there are significant differences between real driving emissions (RDE) and steady-state engine dynamometer experimental results [21,22,23]. Therefore, portable emission measurement systems (PEMS) have been adopted to test the RDE of vehicles, which has also become a mandatory portion of the latest regulations in CHINA VI and Euro VI [7,24]. PEMS investigations can not only assess emission levels of a specific pollutant under real driving conditions but also exhibit RDE related vehicle features [25], driving style [26] or external environments [27], and so on. To the best of our knowledge, there is currently no data on performances of PODE/diesel blended fuels under real driving conditions, which is crucial for the application of the PODE as a diesel additive. To fill this knowledge gap, this study investigated the emission characteristics and fuel economy performances of a CHINA VI heavy-duty engine fueled with PODE/diesel blends of different blending ratios under real driving conditions.
In this paper, on the basis of the CHINA VI emission regulation about the RDE test, a test road was selected, which consisted of urban, rural, and motorway segments connected together. A CHINA VI certificated semi-trailing tractor was used, and it ran on the fuels of pure CHINA VI 0# diesel and PODE/diesel blends in mass proportions of 20% and 30%, respectively. The exhaust pipelines were modified to sample the original exhaust without any aftertreatment. Consequently, the pollutant emission characteristics of CO, CO2, NOx, and PN were detected by PEMS. Furthermore, transient engine maps have been created directly from the RDE test data of the on-board diagnostic (OBD) system and PEMS [20,28,29]. In addition to carrying out RDE tests under the conditions of using PODE/diesel blended fuels, the novelty of this paper mainly focuses on the following three aspects. Firstly, the identification of operating ranges with high brake specific emissions under real driving conditions when using the PODE/diesel blends. Secondly, the impact of the addition of PODE on emission characteristics and fuel economy performances under different road conditions (urban, rural, and motorway). Thirdly, the difference between the measured RDE and the result of the steady-state experiment of the engine of the same model. The results of this study offer support for the impact of PODE addition on engine transient emission performance and also provide important references for the application of PODE/diesel blends in diesel engines.

2. Experimental Setup and Data Processing

2.1. Test Fuels

PODE used for tests was detected mainly to be composed of PODE3, PODE4, PODE5, and PODE6, with the mass fraction of 43.14%, 34.80%, 12.44%, and 3.80%, respectively. The CHINA VI standard 0# diesel that met the requirements of the standard GB 19147-2016 was denoted as D100. PODE/diesel blended fuels were prepared with PODE mass proportions of 20% and 30%, which were named DP20 and DP30, respectively. The blended fuels were stable without any solubility issues. Some of the physical and chemical properties of the test fuels are illustrated in Table 1.

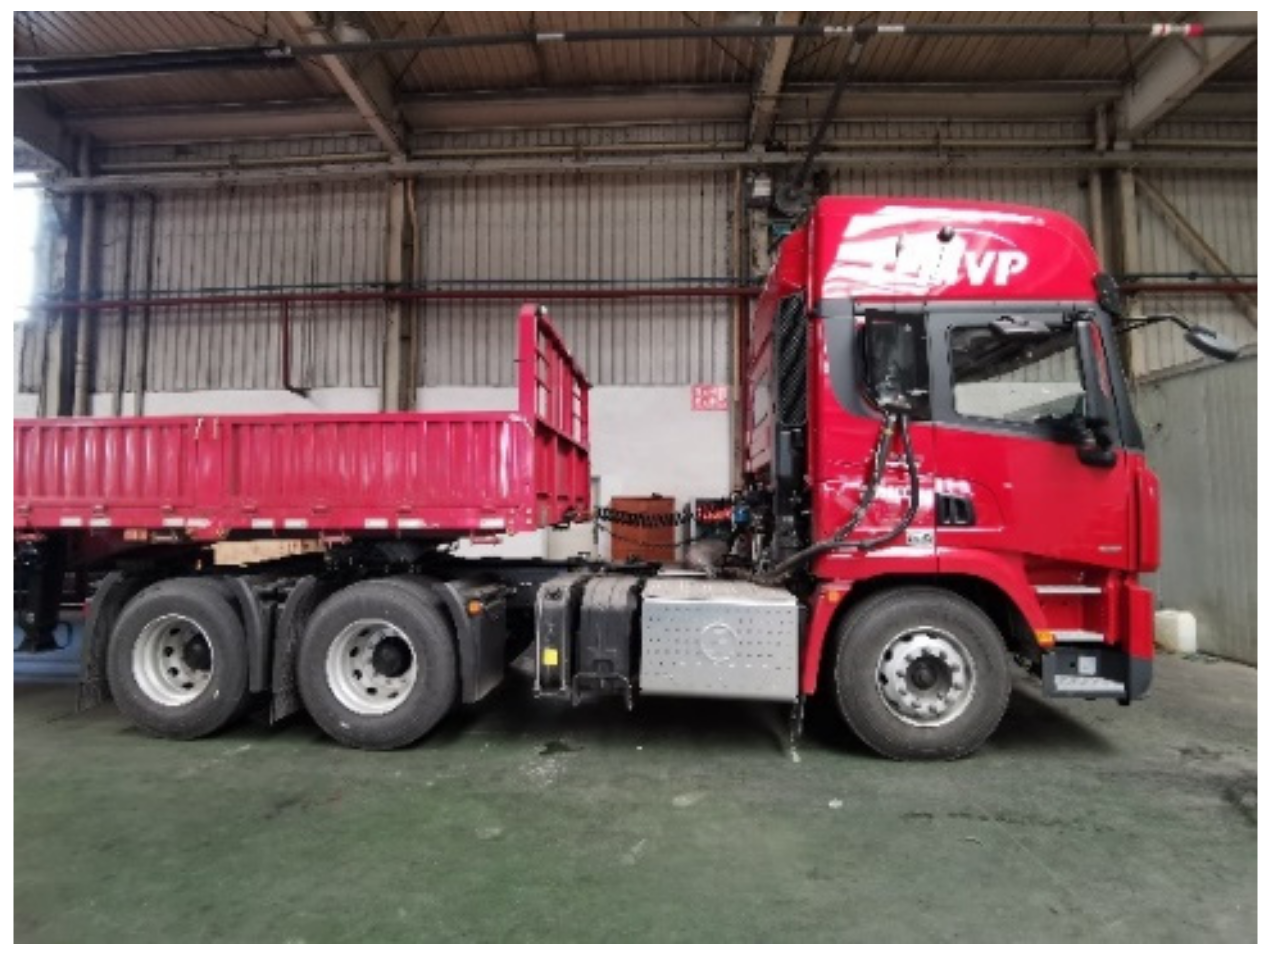
2.2. Test Engine and Vehicle
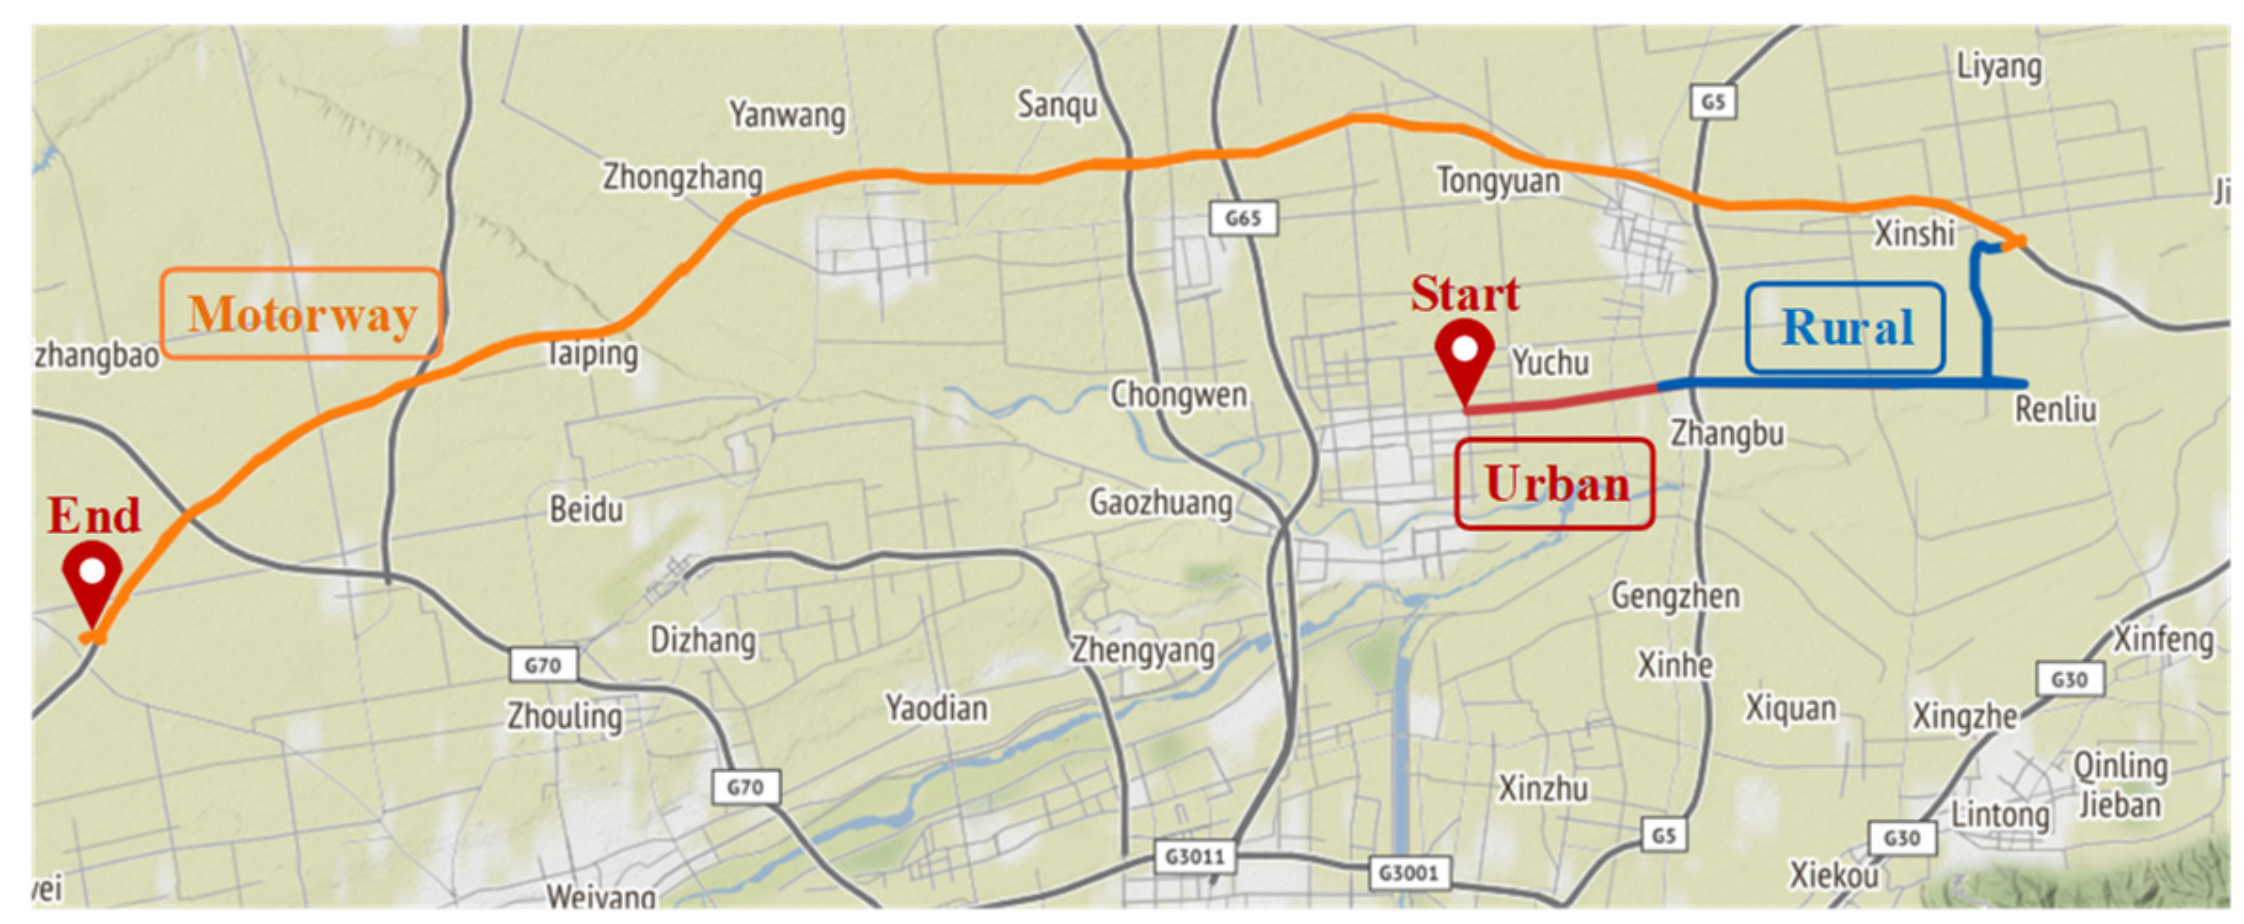
Figure 1 shows the brand-new semi-trailing tractor used in this study, which was produced by Shaanxi Heavy-Duty Automobile Co., Ltd. (Xi’an, China). The tractor was equipped with a WEICHAI Power WP12.460 CHINA VI diesel engine, and its aftertreatment systems included a diesel oxidation catalyst (DOC), a diesel particle filter (DPF) and a high-efficiency selective catalytic reduction (Hi-SCR). A six-ton trailer was attached to the tractor, providing a load equivalent to about 15% of the maximum authorized towed mass of the tractor. The main technical specifications of the engine and the tractor are listed in Table 2 and Table 3. Before the test, the vehicle manufacturer assessed the technical condition of the vehicle used in the study. Driving tests have also been carried out on the vehicle used in the study by the vehicle manufacturer before the formal measurement to ensure that the vehicle conditions met the RDE test requirements of the standard and the PEMS can work normally. The on-board distance was 182.2 km before the formal experiments.

2.3. Test Process

The test route was designed according to the requirements of the CHINA VI regulation [24] in the order of urban, rural, and motorway sections. The GPS trajectory of the test route is exhibited in Figure 2. In each test, the driving time and average speed were tried to keep the same with the requirement of the regulation. Figure 3 shows the actual recorded vehicle speed and the altitude of the three tests. The red line, the blue line, and the yellow line represent the second-by-second speed record of the vehicle under the urban section, rural section, and motorway section, respectively. The grey line represents the second-by-second altitude record of the vehicle. The statistical distance and time of each test are listed in Table 4. Time proportions of the urban section, the rural section, and the motorway section in tests were approximately 20%, 25%, and 55%, respectively. The above information indicates that the selected test road met the requirement of the regulation.

2.4. Introduction to PEMS

PEMS made by AVL (M.O.V.E) included a gas PEMS 493, a PN PEMS 496, an exhaust flow measurement unit (EFM) 495, a system control module, an E-Box power distribution unit, and a global position system (GPS), as well as ambient detectors. The non-dispersive infrared (NDIR) and the non-dispersive ultraviolet (NDUV) methods were utilized for measuring CO/CO2 and NOx, respectively, in the AVL gas analyzer. PN PEMS 496 measured PN with diffusion charger technology [30]. Figure 4 shows the schematic diagram of the PEMS. All the measuring instruments communicated with the system control module. It also read the OBD data through the controller area network (CAN) bus system. The system control module recorded all the real-time data and sent them to the PC at a frequency of 1 Hz. The data acquisition methods in the experiment are listed in Table 5. The accuracy of the sensors is listed in Table 6. According to previous studies on the uncertainty of PEMS [31,32], the measurement uncertainty of CO and CO2 emissions was about 5.7%, and considering the presence of both NO and NO2 analyzers, the measurement uncertainty of the NOx emission was about 6.8%. As for the PN emission [33], the maximum measurement uncertainty could be significantly reduced compared to the typical value since the PEMS was re-calibrated before each measurement. So, the uncertainty of the PN measurement was about 36%. The measurement uncertainty of fuel consumption is about 6.7%.
Since the engine used in the experiment meets the emission standard of CHINA VI, which means the aftertreatment system could reduce the original pollutant emissions to a fairly low level with the help of a complex closed-loop control system [34]. In other words, the actual purification capacity of the aftertreatment system may change with the adjustment of the control system. As a result, the original pollutant emissions were measured in this study so that the difference of emission characteristics caused by the addition of PODE can be reflected more significantly.

2.5. Data Processing

As is known, the engine control units (ECU) control the engine to give out the required torque and speed according to the driver’s command, and the information could be recorded by the OBD. The transient torque is expressed as a percentage value (τtotal,i). The τtotal,i and the percentage value of torque used to overcome the engine friction τfraction,i was calibrated by the manufacturer to ensure that the torque (Tactual,i) calculated by Equation (1) is approximately equal to the actual torque output of the engine when fueled with diesel:
T a c t u a l , i = ( τ t o t a l , i     τ f r a c t i o n , i ) · T r e f D 100
where the reference torque T r e f D 100 can be obtained from the OBD, which was 2330 N·m for the engine used in this study, however, since the reference torque was fixed, the calculated torque should be corrected for the addition of PODE, which caused the reduction in the engine torque at the same paddle position compared with pure diesel fuel operation. Considering that the fuel injection strategy was not changed, the torque correction factor ( c T f ), calculated by Equation (2), was introduced in this study:
c T f   =   T m a x f T m a x D 100
where T m a x f is the maximum torque that the engine can output when it is fueled with the fuel f in the test. In order to obtain accurate torque correction factors, the engine tests were conducted with a dynamometer. While the maximum torque of using D100, DP20, and DP30 were 2157 N·m, 1910 N·m and 1887 N·m, the reference torque of the engine fueled with D100, DP20, and DP30, calculated by Equation (3), was 2330 N·m, 2063 N·m and 2038 N·m, respectively:
T r e f f = c T f · T r e f D 100
Considering that the friction resistance does not change significantly with the alteration of fuel. The instantaneous actual torque output of the engine under different fuel conditions can be considered to be approximately equal to the value calculated by Equation (4):
T a c t u a l , i f   =   τ t o t a l , i f · T r e f f     τ f r i c t i o n , i f · T r e f D 100
It is noteworthy that Tactual,i contained the torque required to drive the engine accessories, which can be observed from the OBD system and maintained at 23.3 N·m. In other words, torque correction factors are not applicable to the idling condition of the engine, because the engine output torque has to be dynamically maintained at 23.3 N·m under all fuel conditions to prevent stalling. Considering that the unstable state of the engine in which the positive torque output less than 23.3 N·m only contributed a little time and did not have a significant impact on the overall results, the minimum positive torque output was unified to 23.3 N·m. Assuming that the torque required by accessory load does not change during the whole driving process, the effective torque output of the engine can be calculated by Equation (5):
T e , i f = T a c t u a l , i f     23.3

2.6. Establishment of Transient Engine Maps

There were vast data sampled by the PEMS, such as engine speed, engine torque, fuel consumption rate, vehicle speed, pollutants emission rate and concentration, etc. Meshed engine maps [20] can illustrate the engine performance in a coherent way. In this paper, the method of meshed engine maps was extended to the RDE tests of PODE/diesel blended fuels. The entire engine operating range was meshed by 50 rpm and 50 N·m, where the speed range was from the speed of 500 rpm to 2000 rpm, and the engine torque was from 0 N·m to 2350 N·m, respectively. So that all the experimental operating points with positive effective torque output swept in PEMS could be allocated in the related bins. In practice, bins containing few grouped data (less than or equal to 3 points) were deleted in this study, which is similar to the previous study [20]. The meshed transient map shows that the engine operates within a shrunk range of speed and output torque. There can be about 200 effective bins for each fuel tested in this study.
The average of emissions and fuel consumption were treated as the representative value of each bin, which has been proved to be an effective approach for building engine maps [20,28,29]. In order to obtain more reliable engine maps, the boxplot was used to identify and exclude outliers in each bin. Based on the data in each bin, their features can be exhibited by boxplots [37]. Figure 5 presents an example of processing the data of fuel consumption rate and the boxplot analysis to the mesh of 1150–1200 rpm and 900–950 N·m. A boxplot contained information of the upper and lower outliers, upper and lower extremes, upper and lower quantiles, and the median about the test data in the specific bin. The difference between the 75% (Q3) and 25% quantiles (Q1) was recorded as the interquartile range (IQR). (Q3 + 1.5 × IQR) and (Q1 − 1.5 × IQR) were regarded as upper and lower limits, respectively. Data outside the range specified by the upper and lower limits are outliers to be excluded.
The mean rate for bin k can be calculated by Equation (6):
E R p , i , k f ¯   =   i   =   1 N k E R p , i , k f N k   or   F C i , j , k f ¯ = i   =   1 N k F C i , k f N k
where E R p , i f and F C i f is second-by-second emission rates for pollutant p and fuel consumption rates under condition of using fuel f at second i. Nk is the number of data points scattered in the bin k after eliminating rate outliers.
To find brake specific emission and fuel consumption, effective engine power ( P i f ) was calculated from the corrected effective torque output T e , i f and engine speed (ni) by Equation (7), instead of using power data in the OBD system:
P i f = T e , i f · n i 9550
Then the mean brake specific emissions ( B S E p , k f ¯ ) of pollutant p, brake specific fuel consumption rates ( B S F C k f ¯ ) and brake thermal efficiency ( B T E k f ¯ ) of fueling with f in bin k can be calculated by Equations (8)–(10):
B S E p , k f   ¯ = 3600 · t · N k · E R p , i , k f ¯ i   =   1 N k P i , k f · t
B S F C k f ¯ = 3600 · t · N k · F C i , k f ¯ i   =   1 N k P i , k f · t
B T E k f ¯ = 100 · i   =   1 N k P i , k f · t N k · t · F C i . k f ¯ · L H V f
where L H V f is the lower heat value of fuel f and t is the time interval which is 1 s in this study.
For the purpose of facilitating the analysis of engine maps, information such as pollutant emission rates, brake specific emissions, fuel consumption, and brake thermal efficiency of bins were divided into several levels and marked with colors related to their representative values. Since one of the main purposes of this study is to investigate the impact of PODE blended fuels on pollutant emissions and fuel economy under real driving conditions, color scales were calibrated using maps of D100 by adopting equi-depth binning to define intervals of output levels. Maps of DP20 and DP30 were then colored according to the calibrated color scales of D100. In this study, the maps of CO2 emission rates and fuel consumption rates were scaled into 10 color levels to improve the sensitivity of the engine maps. For other subjects of engine maps, they were scaled into 6 color levels. In this way, the engine performance characteristics of emissions and BTE can be shown in colored figures, and the data can be compared visually to some extent.

2.7. Evaluation of Engine Emission and Fuel Economy

Although transient mesh maps record emission characteristics and the fuel economy performance of the engine under different fuel conditions on the scale of speed-torque bin, it is difficult to evaluate emission and fuel economy performances macroscopically affected by uneven time distributions under real driving conditions. To investigate the data further, a mean distance specific emission ( D S E p , s f ¯ ) of pollutant p of fuel f was computed. Each section can be treated independently and indicated by the subscript s (Equation (11)). So do the fuel consumption factor ( D S F C s f ¯ , Equation (12)), as well as average brake specific emissions ( B S E p , s f ¯ , Equation (13)), fuel consumption ( B S F C s f ¯ , Equation (14)) and brake thermal efficiency ( B T E s f ¯ , Equation (15)):
D S E p , s f ¯ = 1000 · t · Ν s · E R p , i , s f ¯ i   =   1 N s d i , s f
D S F C s f ¯ = 1000 · t · Ν s · F C i , s f ¯ i   =   1 N s d i , s f
B S E p , s f ¯ = 3600 · t · N s · E R p , i , s f ¯ i   =   1 N s P i , s f · t
B S F C s f ¯ = 3600 · t · N s · F C i , s f ¯ i   =   1 N s P i , s f · t
B T E s f ¯ = 100 · i   =   1 N s P i , s f · t N s · t · F C i . s f ¯ · L H V f
where d i , s f is the distance that the vehicle traveled in second i, expressed in m, and Ns is the number of effective data.

3. Results

In this paper, pure diesel named D100 and the PODE blended fuels of DP20 and DP30 were tested. Their emission and fuel economy characteristics were processed into colored maps. Because of the regulations, CO, NOx, and PN emissions were investigated, HC emission was not concerned; however, it is in the same or little lower level as CO [38]. Based on the data, the brake power specific and distance specific parameters of the test and each road segment of the test were studied respectively in the following sections.

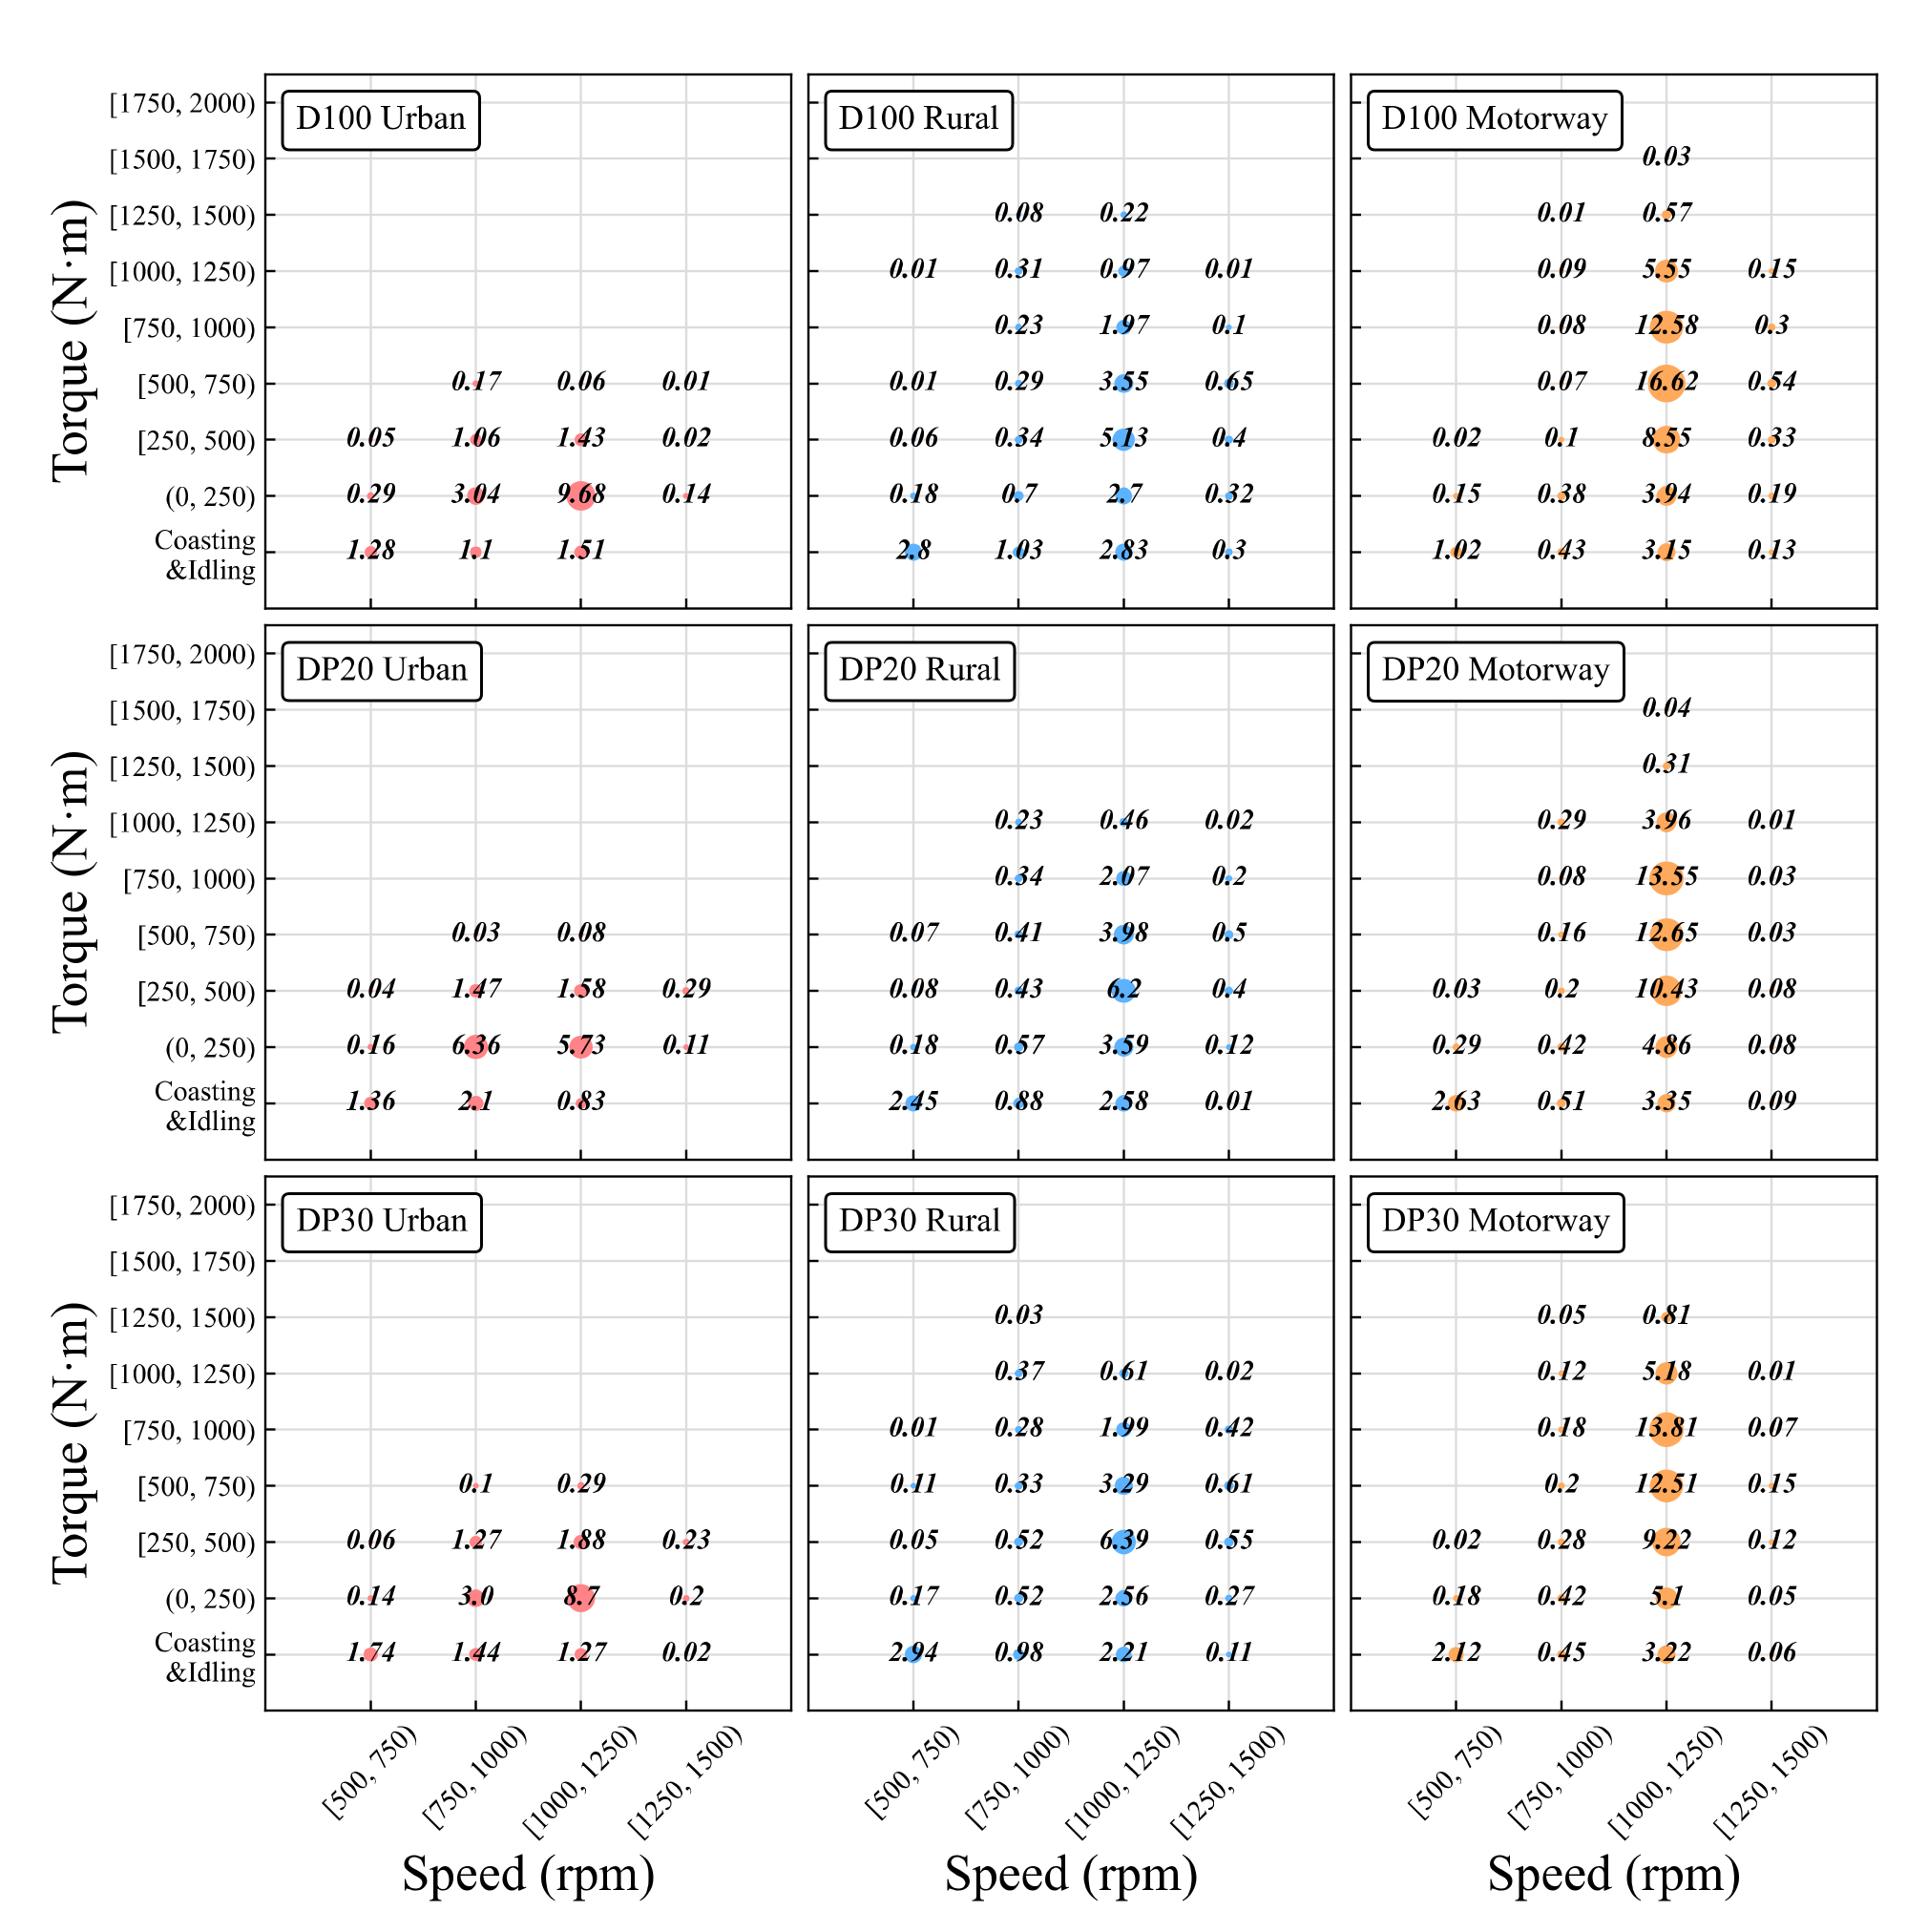
3.1. Engine Operation Condition Statistics

As shown in Figure 5, the meshed operation map of the engine during the real driving test of D100 can give a direct impression on the engine conditions, and it can be seen that most of the engine operating conditions were within the speed range of 1150 to 1250 rpm. For a more detailed operation time distribution, Figure 6 illustrates the proportion of time spent in different speed and torque operating ranges in three driving sections. Each row of subgraphs is for the same fuel condition, and from left to right in each row are the urban, rural, and motorway driving conditions under the corresponding fuel conditions. Each grid node represents the engine operating condition range of 250 rpm and 250 N·m. The percentage of time at each node for all three driving conditions under the corresponding fuel condition was marked and also reflected by the size of the point. It can be seen clearly that the engine operation pattern during the real driving test statistically. The engine ran in a similar range of operating conditions in the rural section and the motorway section. From the perspective of torque, the engine mainly ran in the range of 0–250 N·m during the urban section, while the common torque range was extended to 0–1000 N·m and 0–1250 N·m, respectively, in the rural and motorway sections. From the perspective of engine speed, the speed range of 1000–1250 rpm occupied about 80% of the total time, and the speed range greater than 1250 rpm only occupied around 3% of the total time.

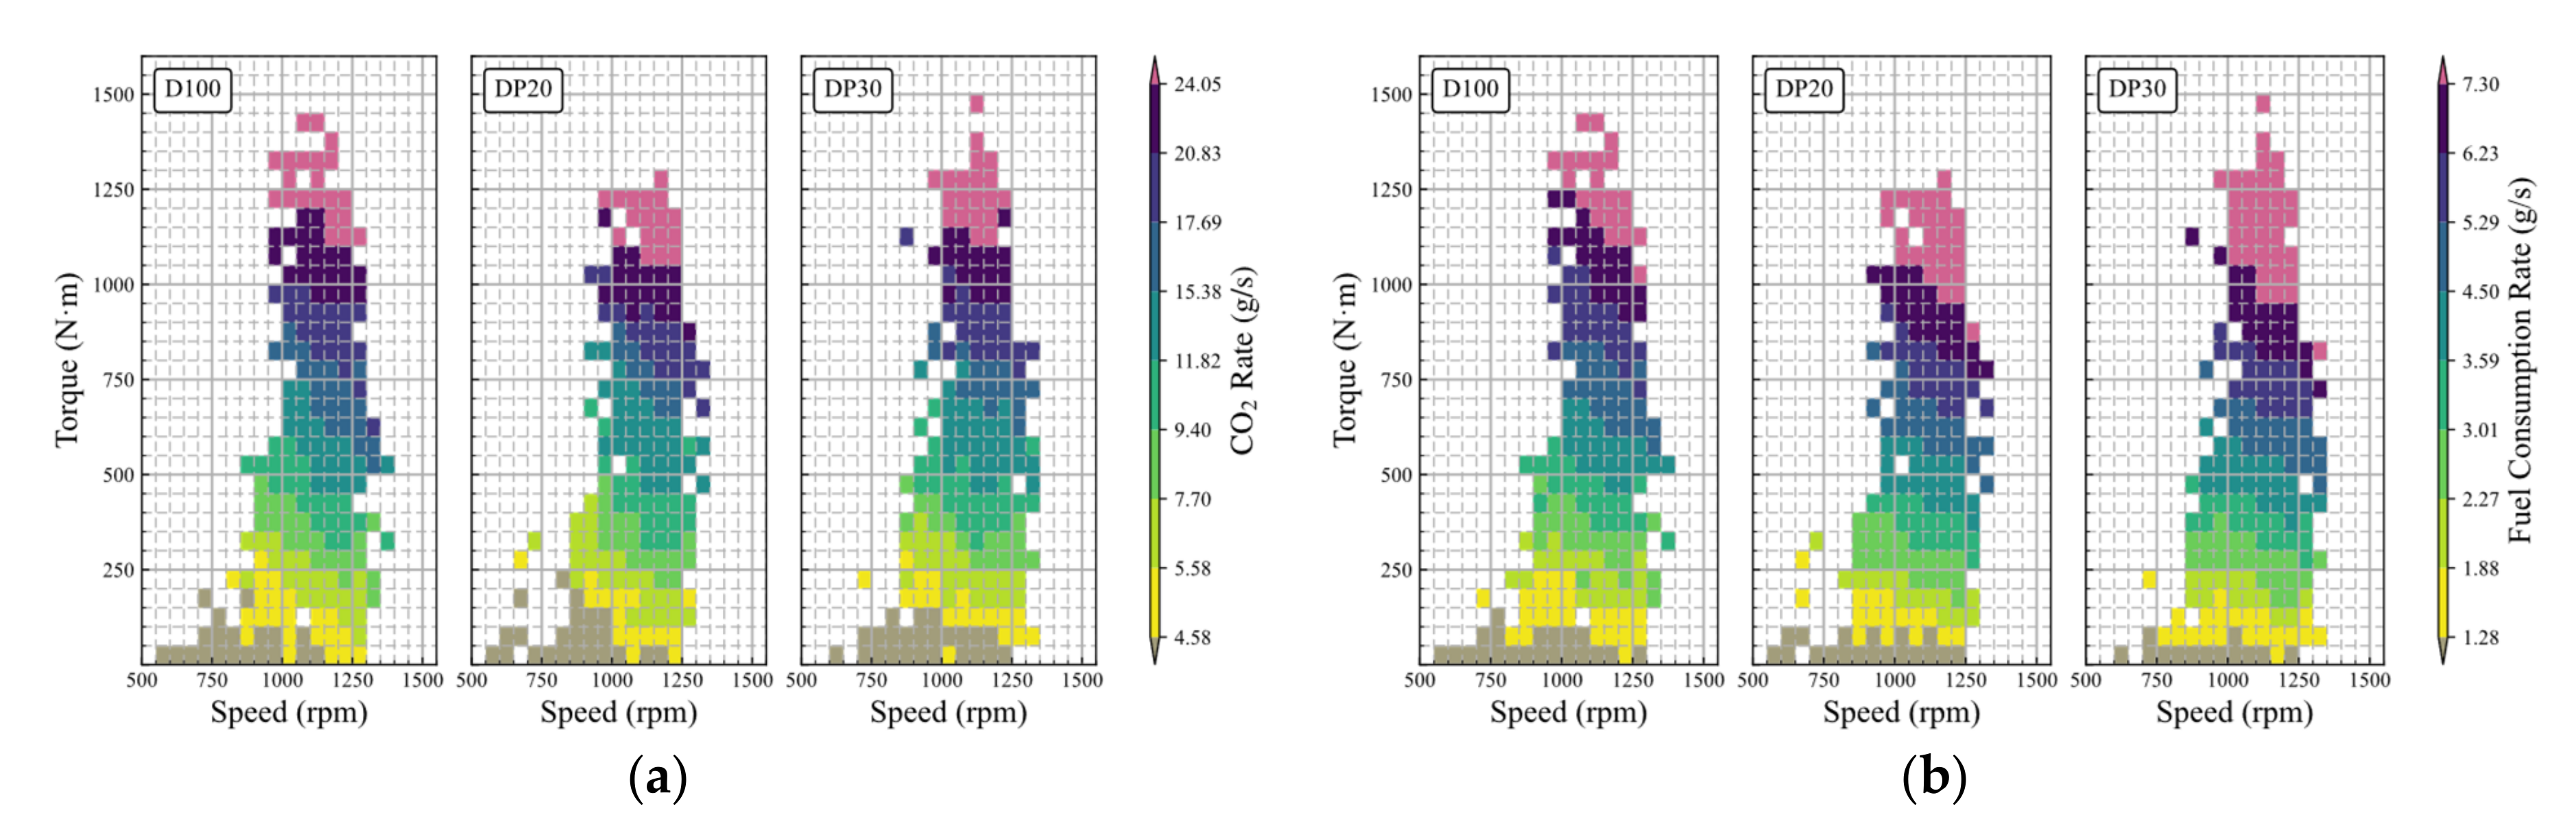
3.2. CO2 Emission and Fuel Consumption Rates

There is no doubt that the CO2 emission rate is closely related to the fuel consumption rate; therefore, their performance maps are quite similar, seen in Figure 7. Though they look exactly alike, to analyze carefully, the regions representing higher fuel consumption rates (red, dark blue, and dark green) expand downwards to some extent in the maps of DP20 and DP30 compared with the map of D100, which indicates that more blended fuels were burned during the tests due to the decrease in the lower heating value of the blended fuels for the addition of PODE. The impact of the increase in fuel consumption rates, however, can be offset to some extent due to the decrease in the carbon content of the blended fuels [39], resulting in no significant change in CO2 emission rates.

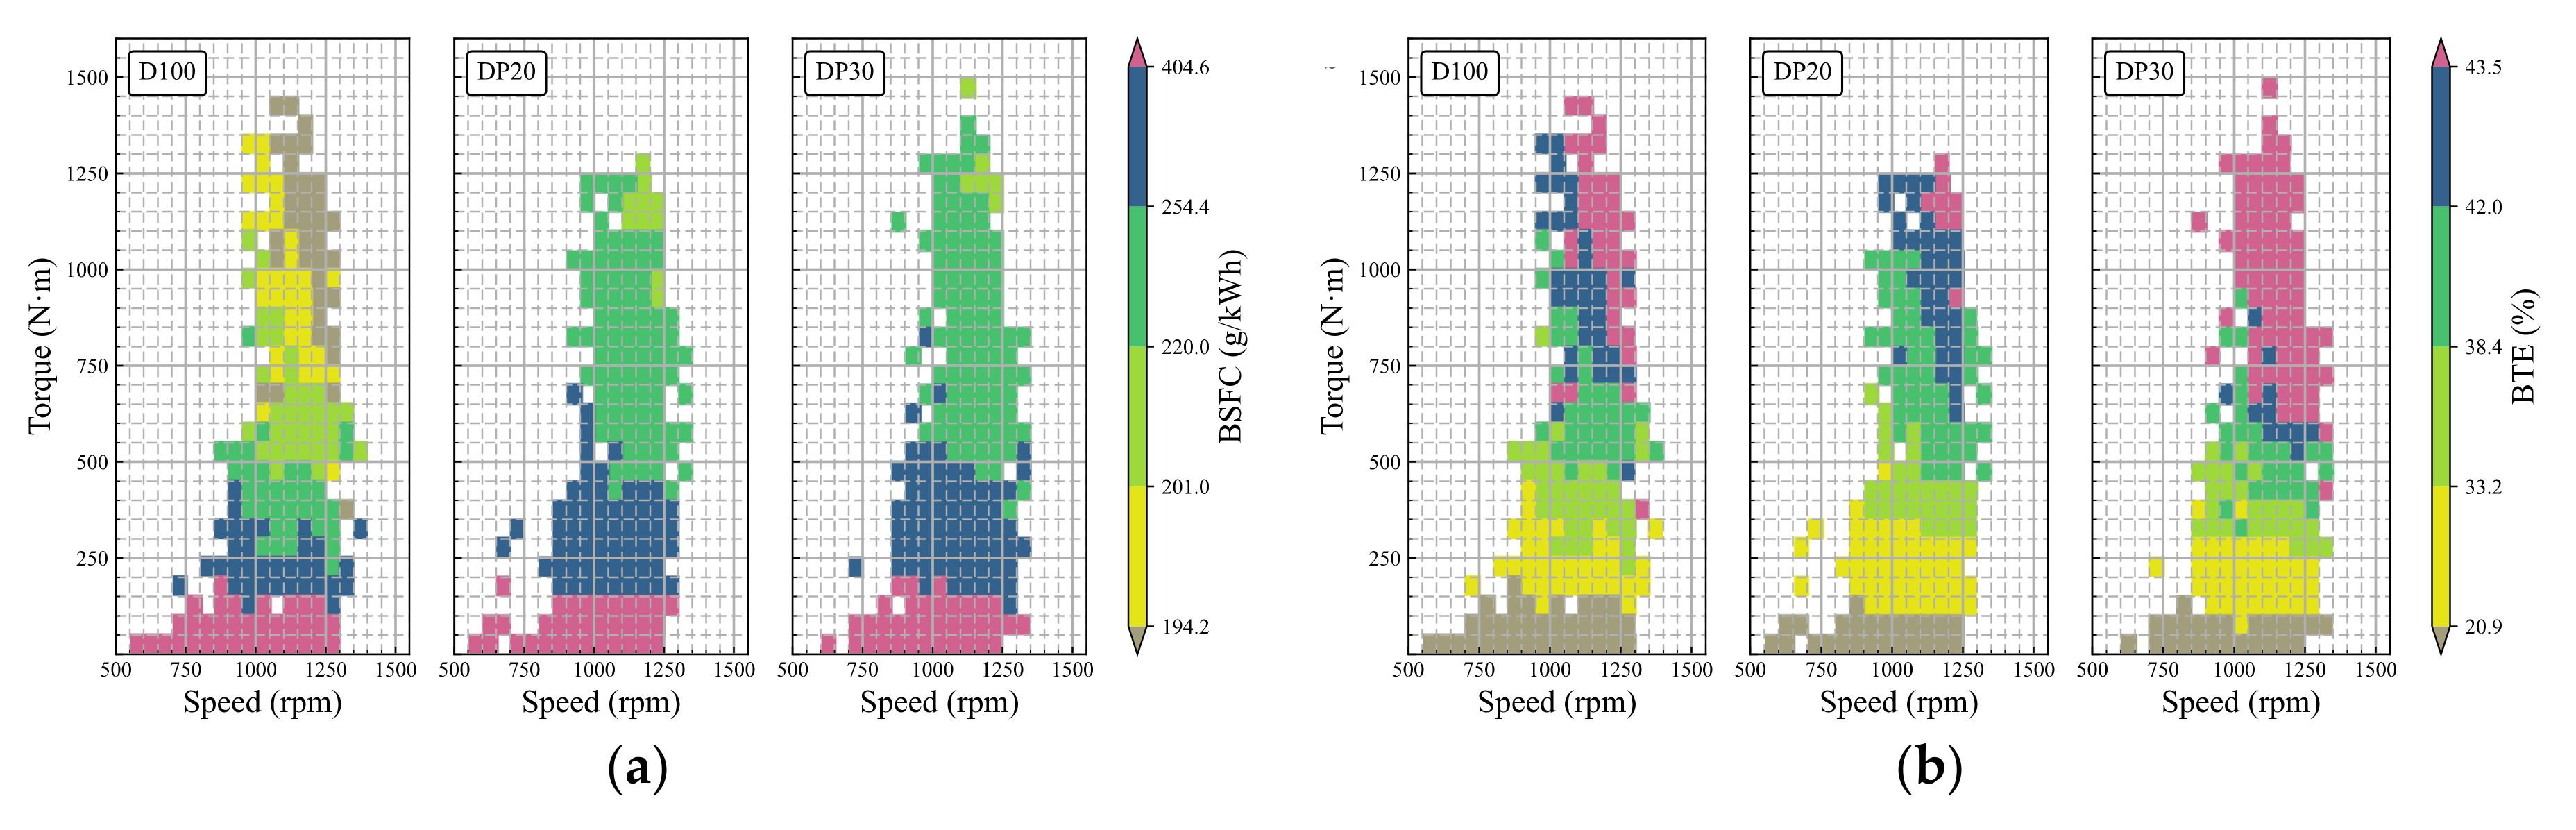
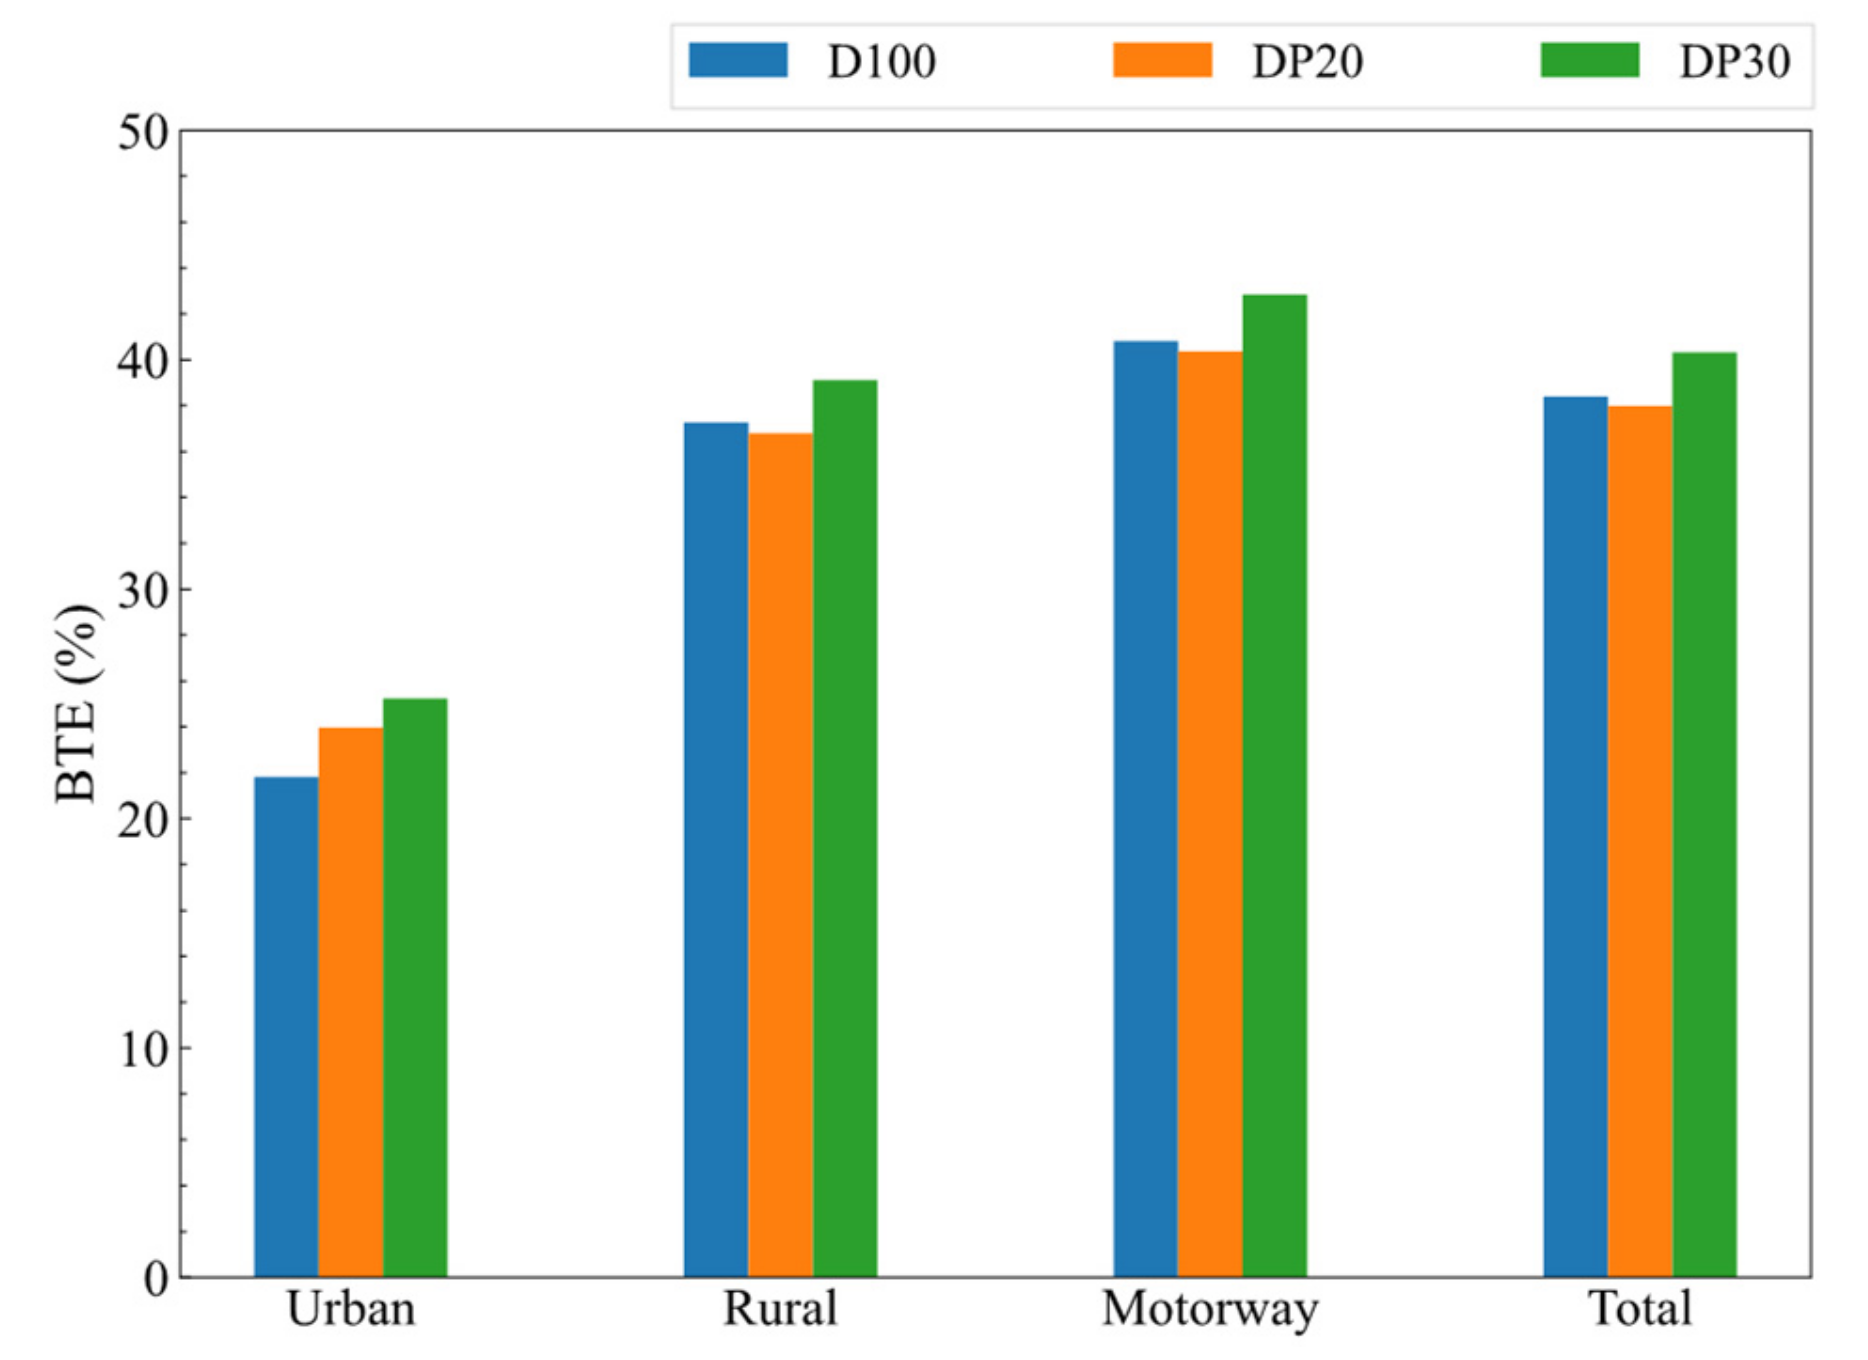
3.3. Characteristics of BSFC and BTE

Due to the smaller LHV of PODE, more blended fuels could be consumed in order to produce the same engine power, which led to the rise of BSFC. Figure 8a shows the calculated results; yellow bins become less while green and blue bins become more in the BSFC maps of DP20 and DP30. The BTE map of DP30 in Figure 8b shows much better compared to the D100 case. The red region indicating higher BTE expands and moves downward to lower load conditions. When using the PODE/diesel blends, the improvement of the BTE mainly lies in the improvement of fuel spray, a faster burning speed, and more sufficient oxygen. The lower viscosity and smaller surface tension of the PODE are beneficial to reduce the Sauter mean diameter (SMD) of the blended fuel spray [13]. The better performance of spray atomization contributes to the improvement of combustion conditions, which has an effect on improving brake thermal efficiency. Higher volatility and ignitability of the PODE increase the mixing rate and chemical reaction rate, respectively, which shortens the combustion duration [17]. The rise in the degree of constant volume caused by the growth in the combustion rate increases the thermal efficiency of the engine. The oxygen-lack condition of the over-rich mixture is improved because of the intramolecular oxygen of the PODE [14], which promotes the combustion more sufficient and improves the thermal efficiency.
The addition of PODE can improve the brake thermal efficiency of the vehicle. Figure 9 illustrates the averaged brake thermal efficiencies in the different driving sections. The application of DP20 and DP30 increases the BTE by 9.9% and 15.7%, respectively, when driving in the urban section. The test averaged BTE of D100, DP20, and DP30 are 38.4%, 38.0%, and 40.3%, respectively. The abnormal BTE of DP20 can be attributed to driving conditions, for there is less high load condition recorded as shown in Figure 8b. The importance is that 30% PODE addition promoted BTE nearly 2 percentage points.

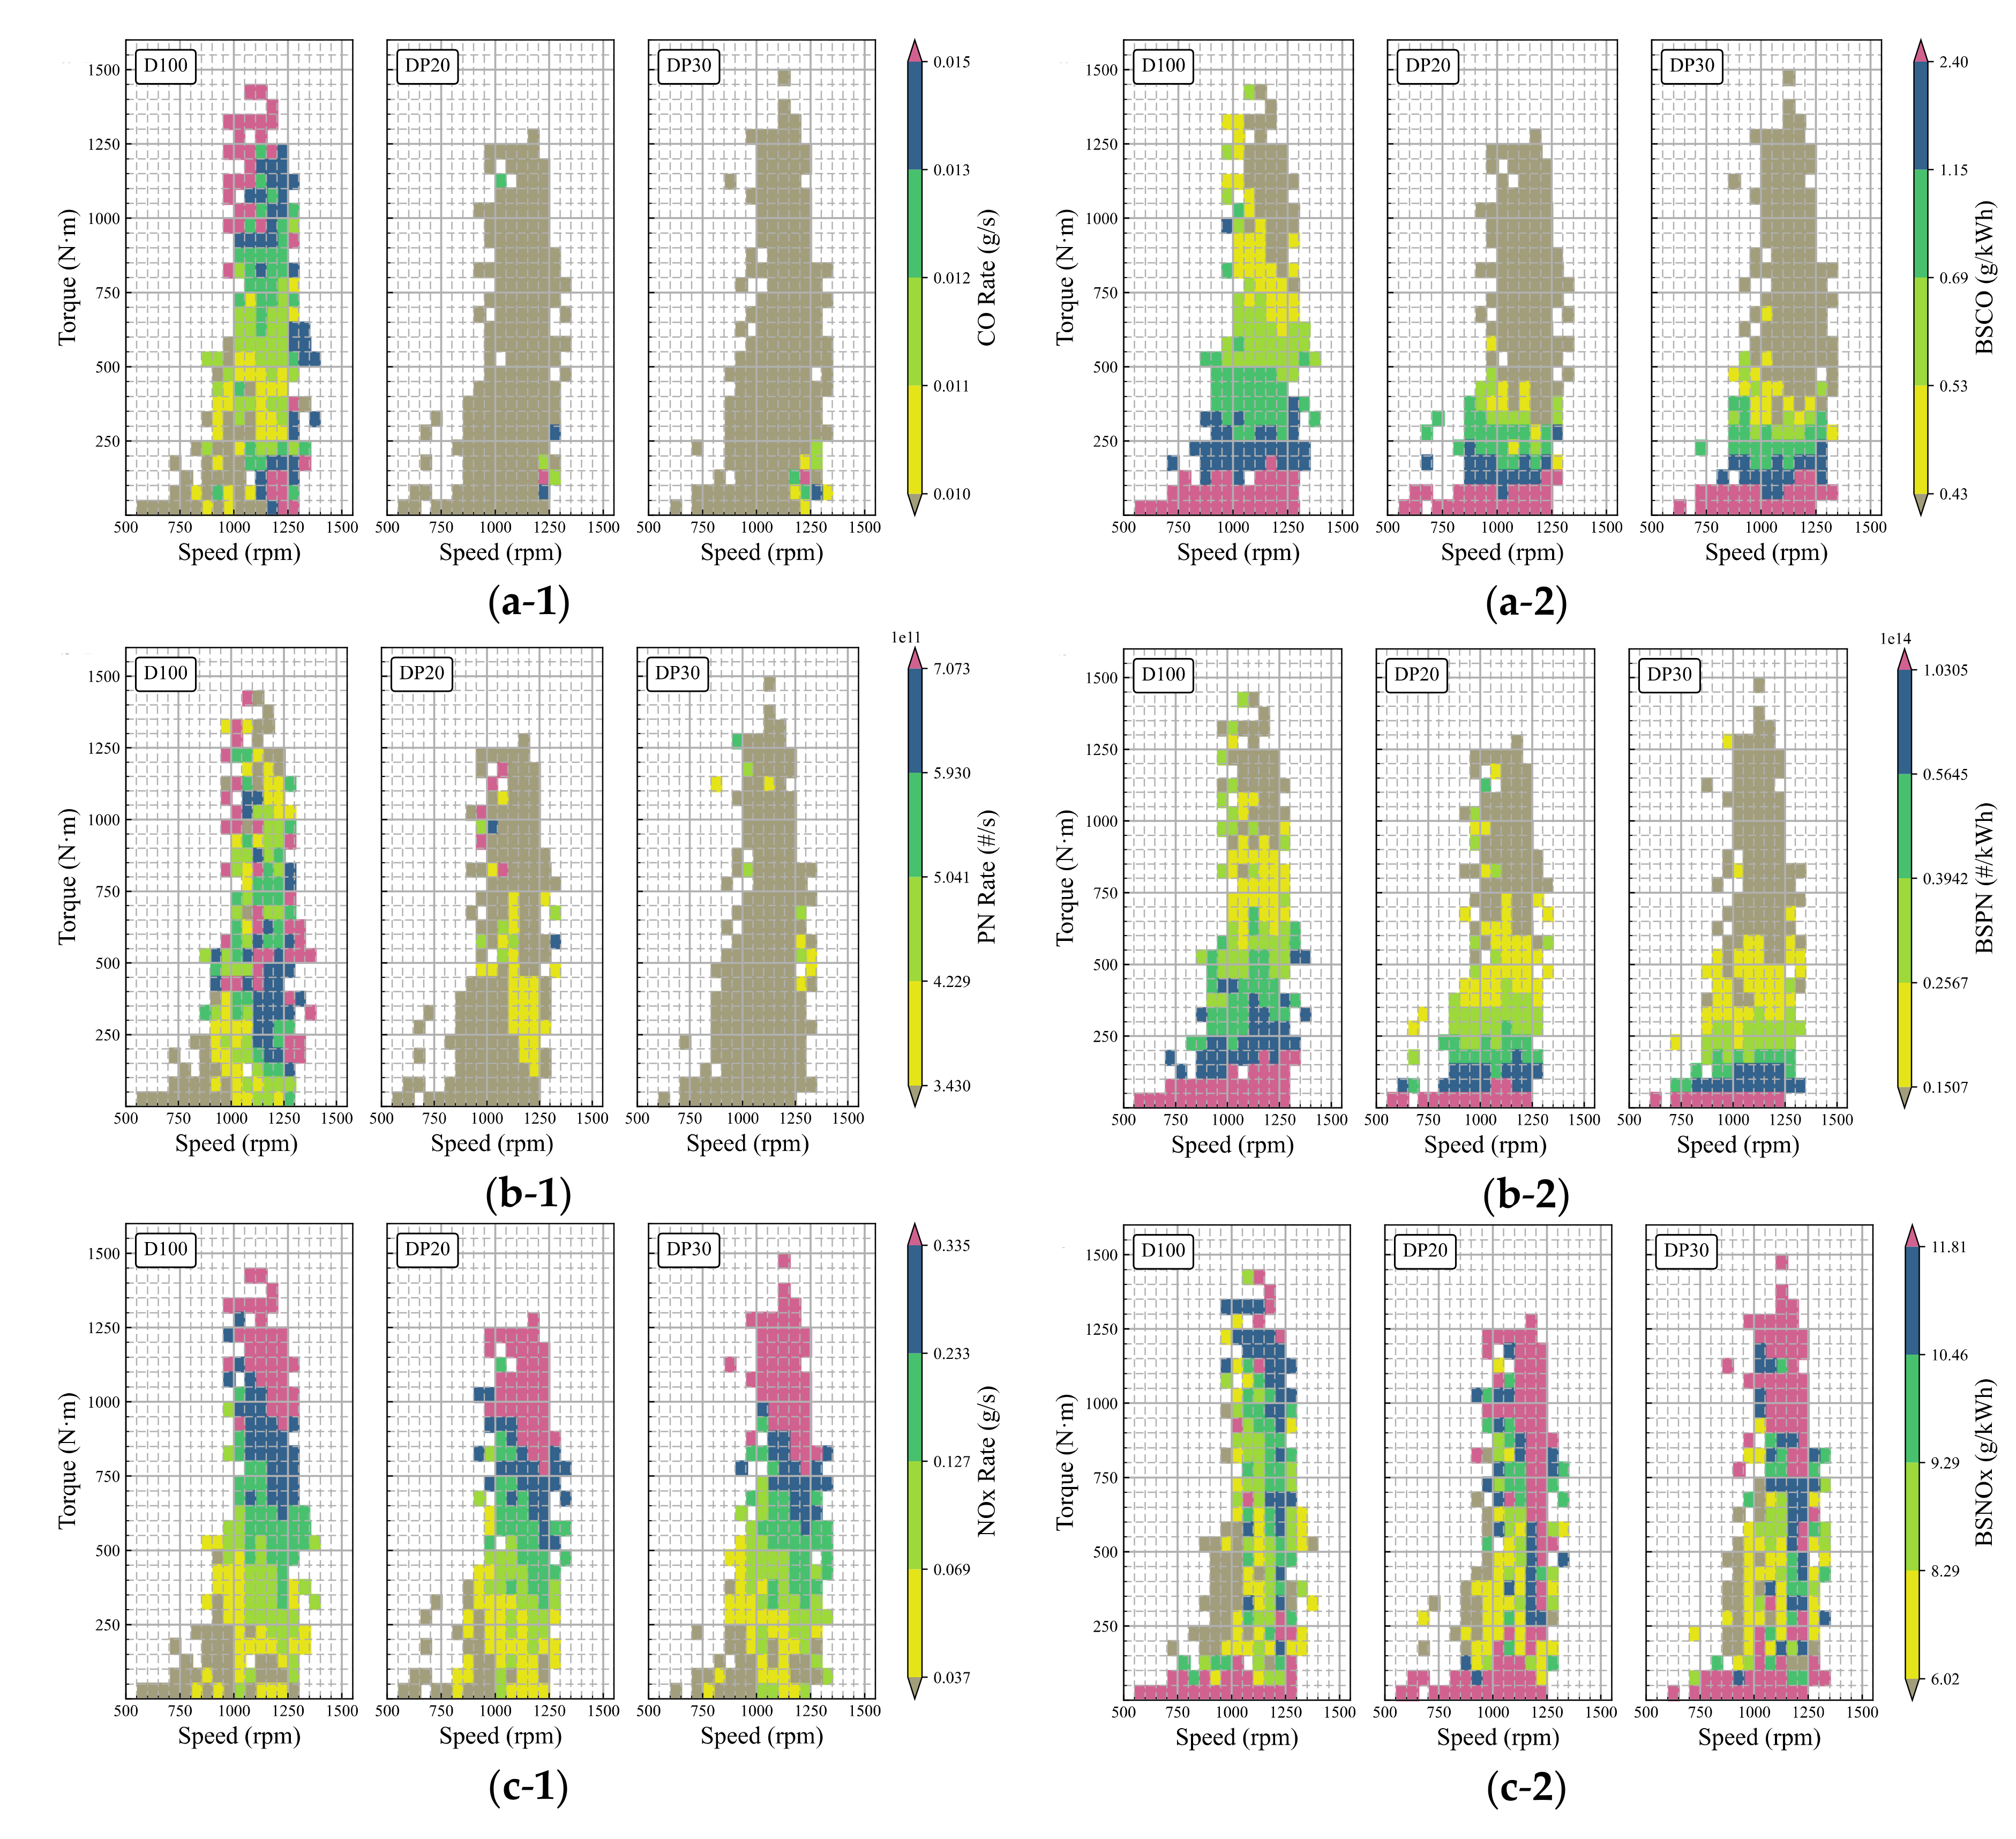
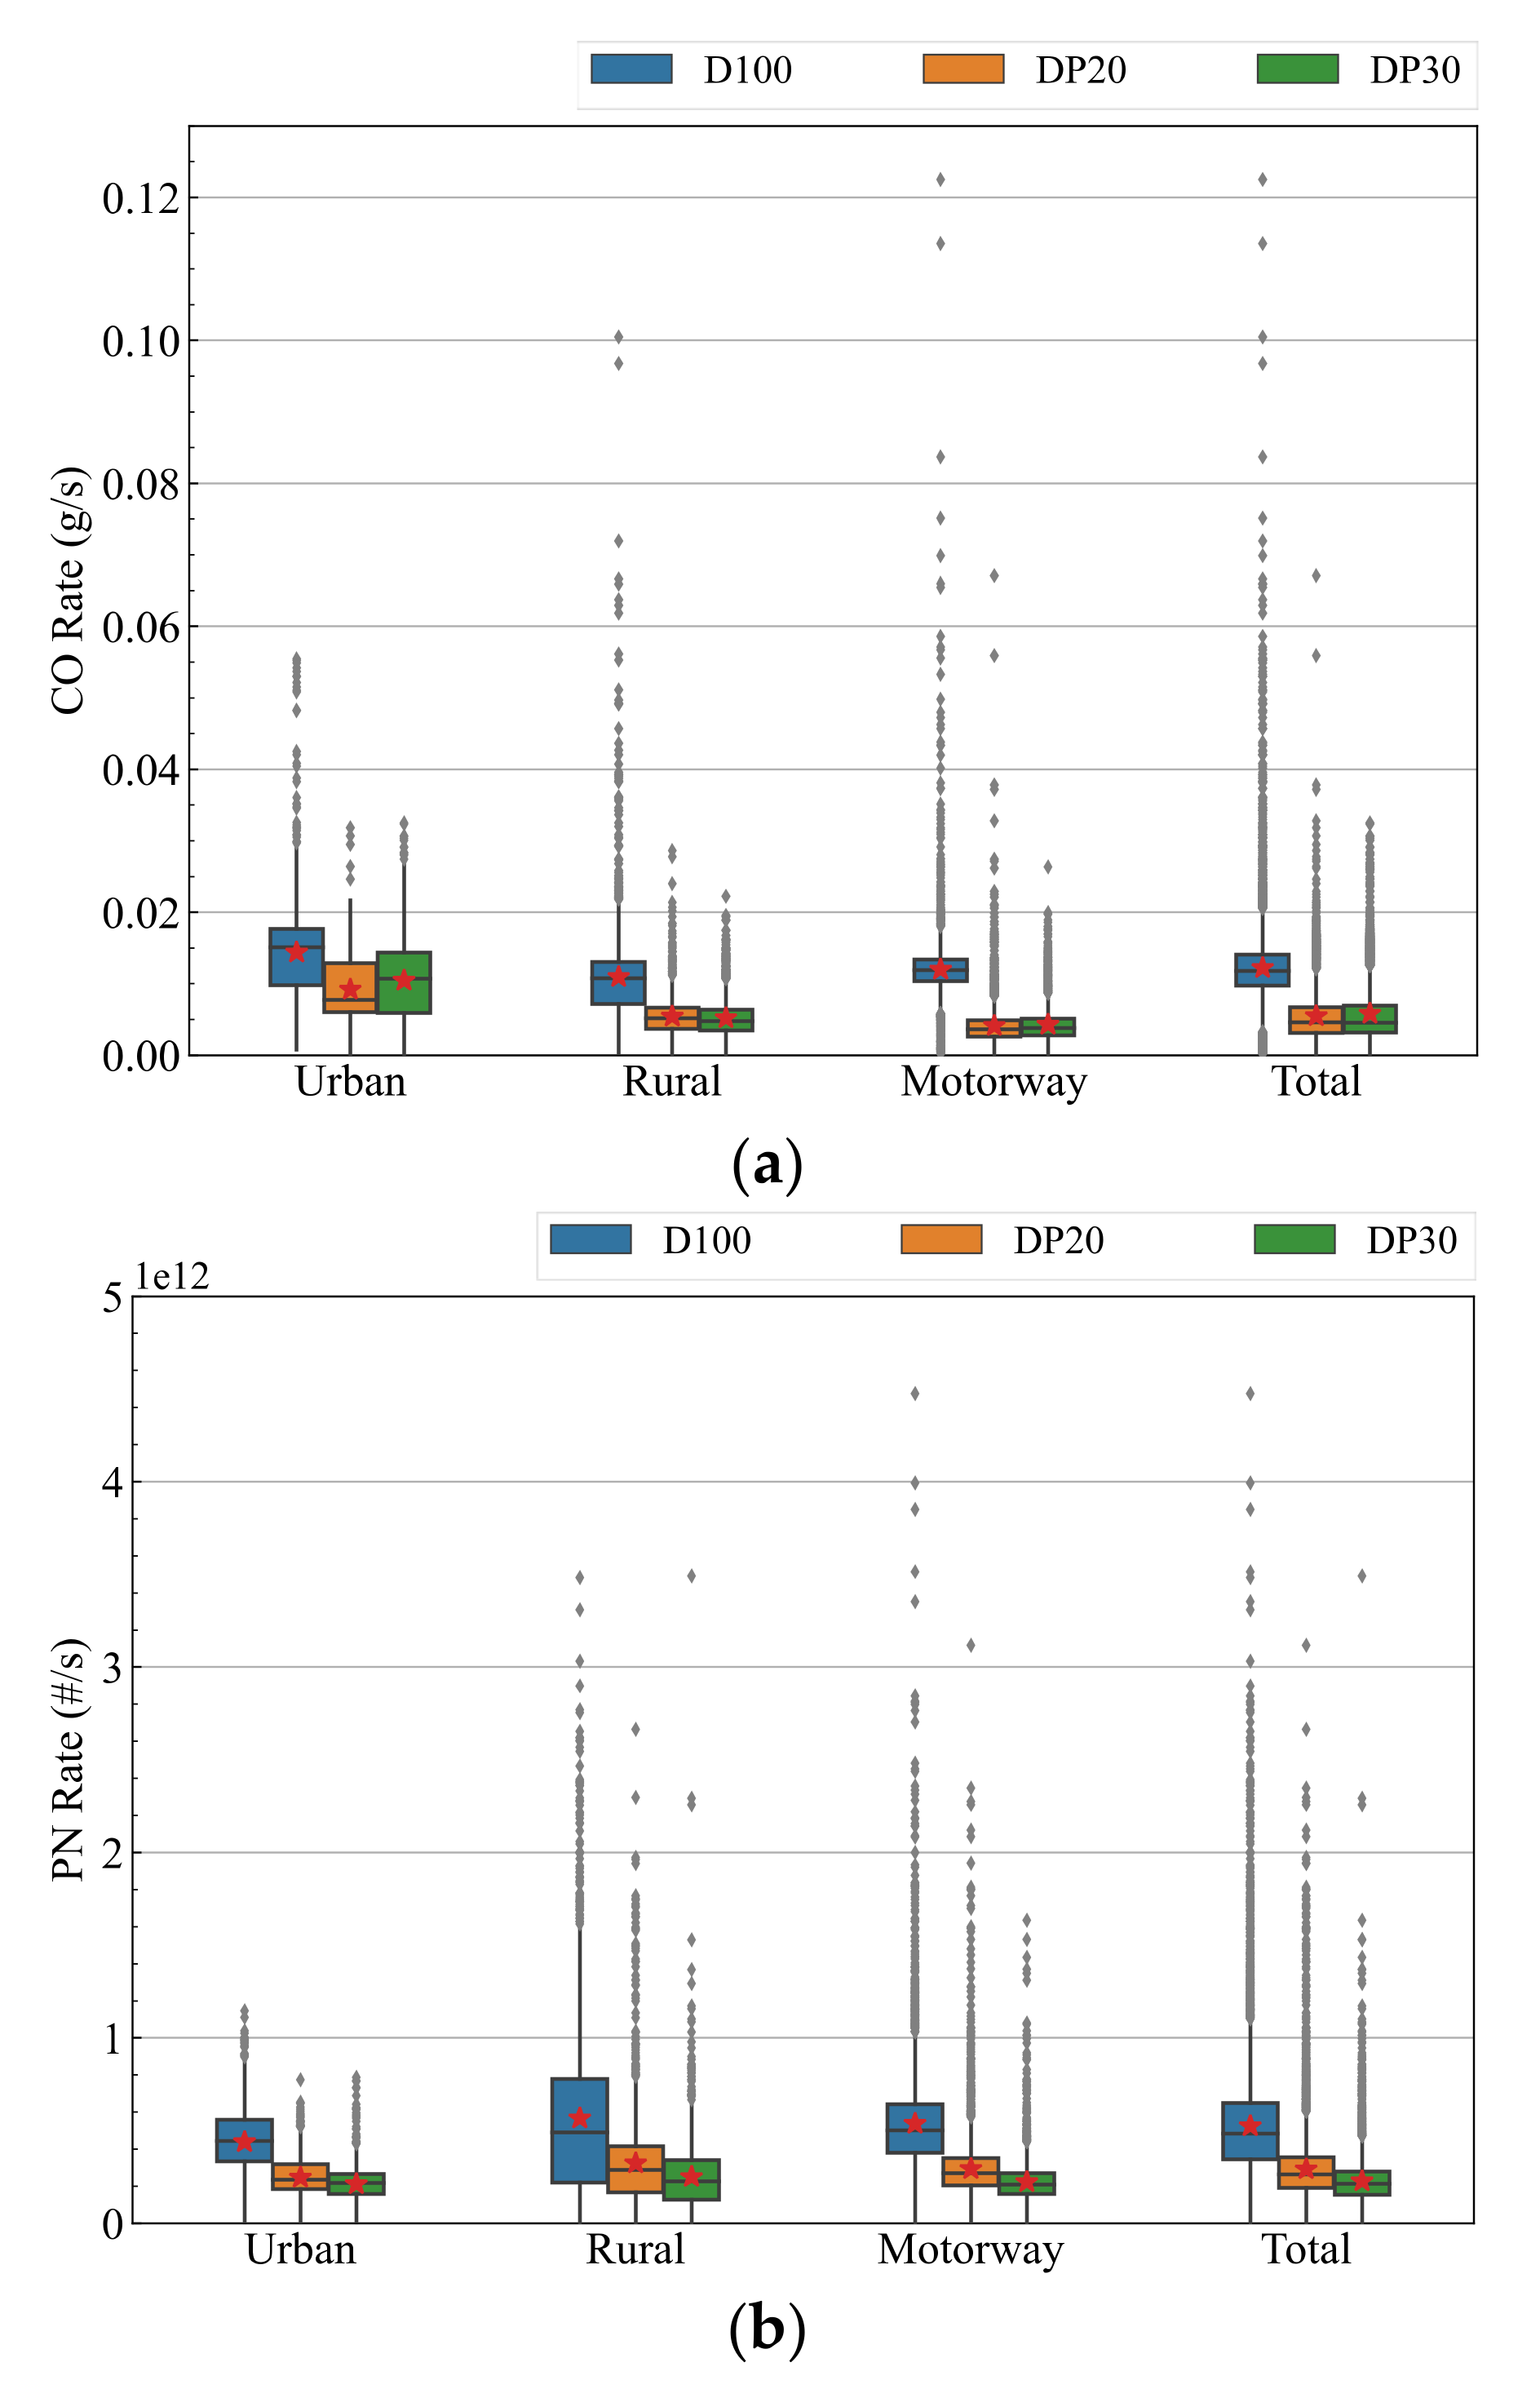
3.4. Engine CO, PN and NOx Emission Characteristics

Figure 10 shows the transient engine performance maps of CO, PN, and NOx emissions. For the emission rates of CO and PN compared to pure diesel D100 operation, most areas in the maps of DP20 and DP30 are gray, implying that the addition of the PODE makes the engine emit quite lower. It is also obviously indicated that the more addition of PODE, the higher the reduction in PN emission. For their brake power specific emissions, D100 operation gives the highest BSCO and BSPN, the regions of the same level of BSCO and BSPN conditions come down significantly due to PODE addition in diesel, and higher BSCO and BSPN occur under low load conditions (0–250 N·m) for the three test fuels. The intramolecular oxygen and the absence of the C-C bond in PODE, as well as the increase in oxygen content in the blended fuel, can prompt the combustion within the engine cylinder, which results in the reduction in CO and PN formation and emission [14]. The PODE, however, has higher volatility, which means the lean mixture is more likely to volatilize into unburned hydrocarbons and be further oxidized to CO when using the DP30. At low load conditions and around 1200 rpm, however, there are more bins with higher CO emission levels on the map of DP30 than on the map of DP20. Considering the high latent heat of vaporization and the low lower heating value of the PODE [14], the main reason is that the combustion temperature is lower at low load conditions, and the increase in the PODE blending ratio further reduces the temperature of the in-cylinder gas, thereby inhibiting the oxidation of the CO to some extent.
The NOx emission rate is a little higher in the maps of DP20 and DP30 for the downward expansion of the red region. The differences of BSNOx maps are presented under higher load (>750 N·m) and engine speed conditions for PODE addition. The addition of PODE increases the oxygen content in the cylinder, which promotes the formation of NOx.
Figure 11 exhibits boxplots of the test results of CO, PN, and NOx emission rates in the three segments of the driving cycle. In each box, the star and the bar present the mean value and the median value of all data in the corresponding road section, respectively. Different from Figure 6, which shows the engine operating conditions and related time, Figure 11 exhibits the measured emissions statistically. Though there is a larger dispersity due to the transient operation, such as rapid acceleration, which is out of the scope of this paper, Figure 11a–c still gives clear characteristics about CO, PN, and NOx emission levels. Diesel operation gives out more CO and PN emissions in the whole driving cycle, and PODE addition reduces about half of CO and PN emissions. Though a little increase can be seen observed, NOx emissions are at the same level for the test fuels.
From the perspective of distance, Figure 12 presents the calculated distance-specific emissions, and they are compared with the brake specific ones under the same driving section. It can be seen that distance-specific parameters of CO, PN, and NOx emissions are quite similar to those of brake specific ones in their tendencies. The RDE limits of the CHINA VI regulation are marked on the figures (Except for the CO RDE limit, because the CO RDE limit, which is 6000 mg/kWh, is out of the axis range). The PN and NOx RDE measurement results were much larger than the limit since the raw emissions were measured in this study.
For the CO emissions, the heavy-duty engine used in the experiment can already control the original BSCO to a fairly low level. Because even if the diesel is used, the BSCO emissions of the rural section, the motorway section, and the whole test route under the real driving conditions are even lower than the steady-state limit of the CHINA VI regulation (1500 mg/kWh). The WHTC and WNTE limits of the CHINA VI regulation are also marked on the figure. The addition of PODE can even further reduce DSCO and BSCO by about 50%. Since the DP30 has less effect on CO emission reduction than the DP20 in the operating range with the largest proportion of time in the urban section (1000–1250 rpm, 0–250 N·m), shown in Figure 6 and Figure 10(a-1), the DP30 has a rise of DSCO and BSCO than DP20 in the urban segment.
The decreases in DSPN and BSPN are both positively correlated with the PODE blending ratio. DP20 and DP30 reduce DSPN and BSPN by approximately 40% and 55%, respectively.
For CO and PN emissions, the DSCO(PN) and BSCO(PN) of the urban section are significantly higher than those of the rural or the motorway section, indicating that the urban driving mode must be considered carefully both to the distance specific and brake specific parameters in order to control CO and PN emissions.
For the NOx emissions, the rural section and the motorway section reflect the strongest deteriorating effect of PODE addition on the DSNOx emission and the BSNOx emission. From the perspective of the entire test route, the usage of the DP20 could increase DSNOx and BSNOx by 18.0% and 19.3%, respectively. The usage of the DP30 could increase DSNOx and BSNOx by 17.9% and 14.7%, respectively.

4. Discussion

Liu et al. summarized previous studies on PODE/diesel blends [11] and found that the usage of PODE/diesel blends often leads to an increase in NOx emissions when the EGR strategy of the engine is not optimized [14,17,40]. They also reported that engines with a higher EGR ratio more easily achieve better emission performance. Zhao et al. have conducted steady-state bench tests on the same model of engine used in this study (WP12.460), and they reported that fueling with diesel/PODE blends can simultaneously reduce the NOx and PN emissions [41]. Considering the absence of the EGR technology in this engine, this result is quite exciting, because it shows the new potential of the addition of PODE in reducing NOx emissions of an engine without EGR. However, situations may not be so optimistic under transient conditions. In this study, the addition of PODE can effectively reduce the PN emission under real driving conditions, but it also significantly has the effect of increasing the NOx emission. Since the engine model was the same, the engine specifications and engine control strategies could not introduce additional disturbances to the measurement results. The comparison between the results of this study and the results of Zhao et al. are listed in Table 7. Although the steady-state experiments performed by Zhao et al. has a different operating pattern from the RDE tests in this study, the test route in this study meets the requirements of the PEMS experiment in the CHINA VI emission regulation, which means that the scope of operating conditions covered in this study is much closer to the real-world situation than steady-state experiments. Therefore, for heavy-duty engines without EGR technology, NOx reduction is still one of the important issues that need to be faced when considering the application of PODE/diesel blended fuels.

5. Conclusions

In this paper, the real driving emissions of CO, PN, and NOx, as well as the vehicle fuel economy of a CHINA VI heavy-duty diesel vehicle, were measured with an AVL PEMS to study the effects of PODE addition. Experiments were carried out on the selected roads consisting of three segments of urban, rural, and motorway sections. The sampled data met the requirement of the RDE test of CHINA VI regulation. The data from the PEMS and the OBD system were statistically analyzed to illustrate engine transient operation maps. By studying characteristics of the engine operating condition and time, fuel consumption, BTE, and the averaged distance-specific and brake specific emissions, the following conclusions can be made:
(1)
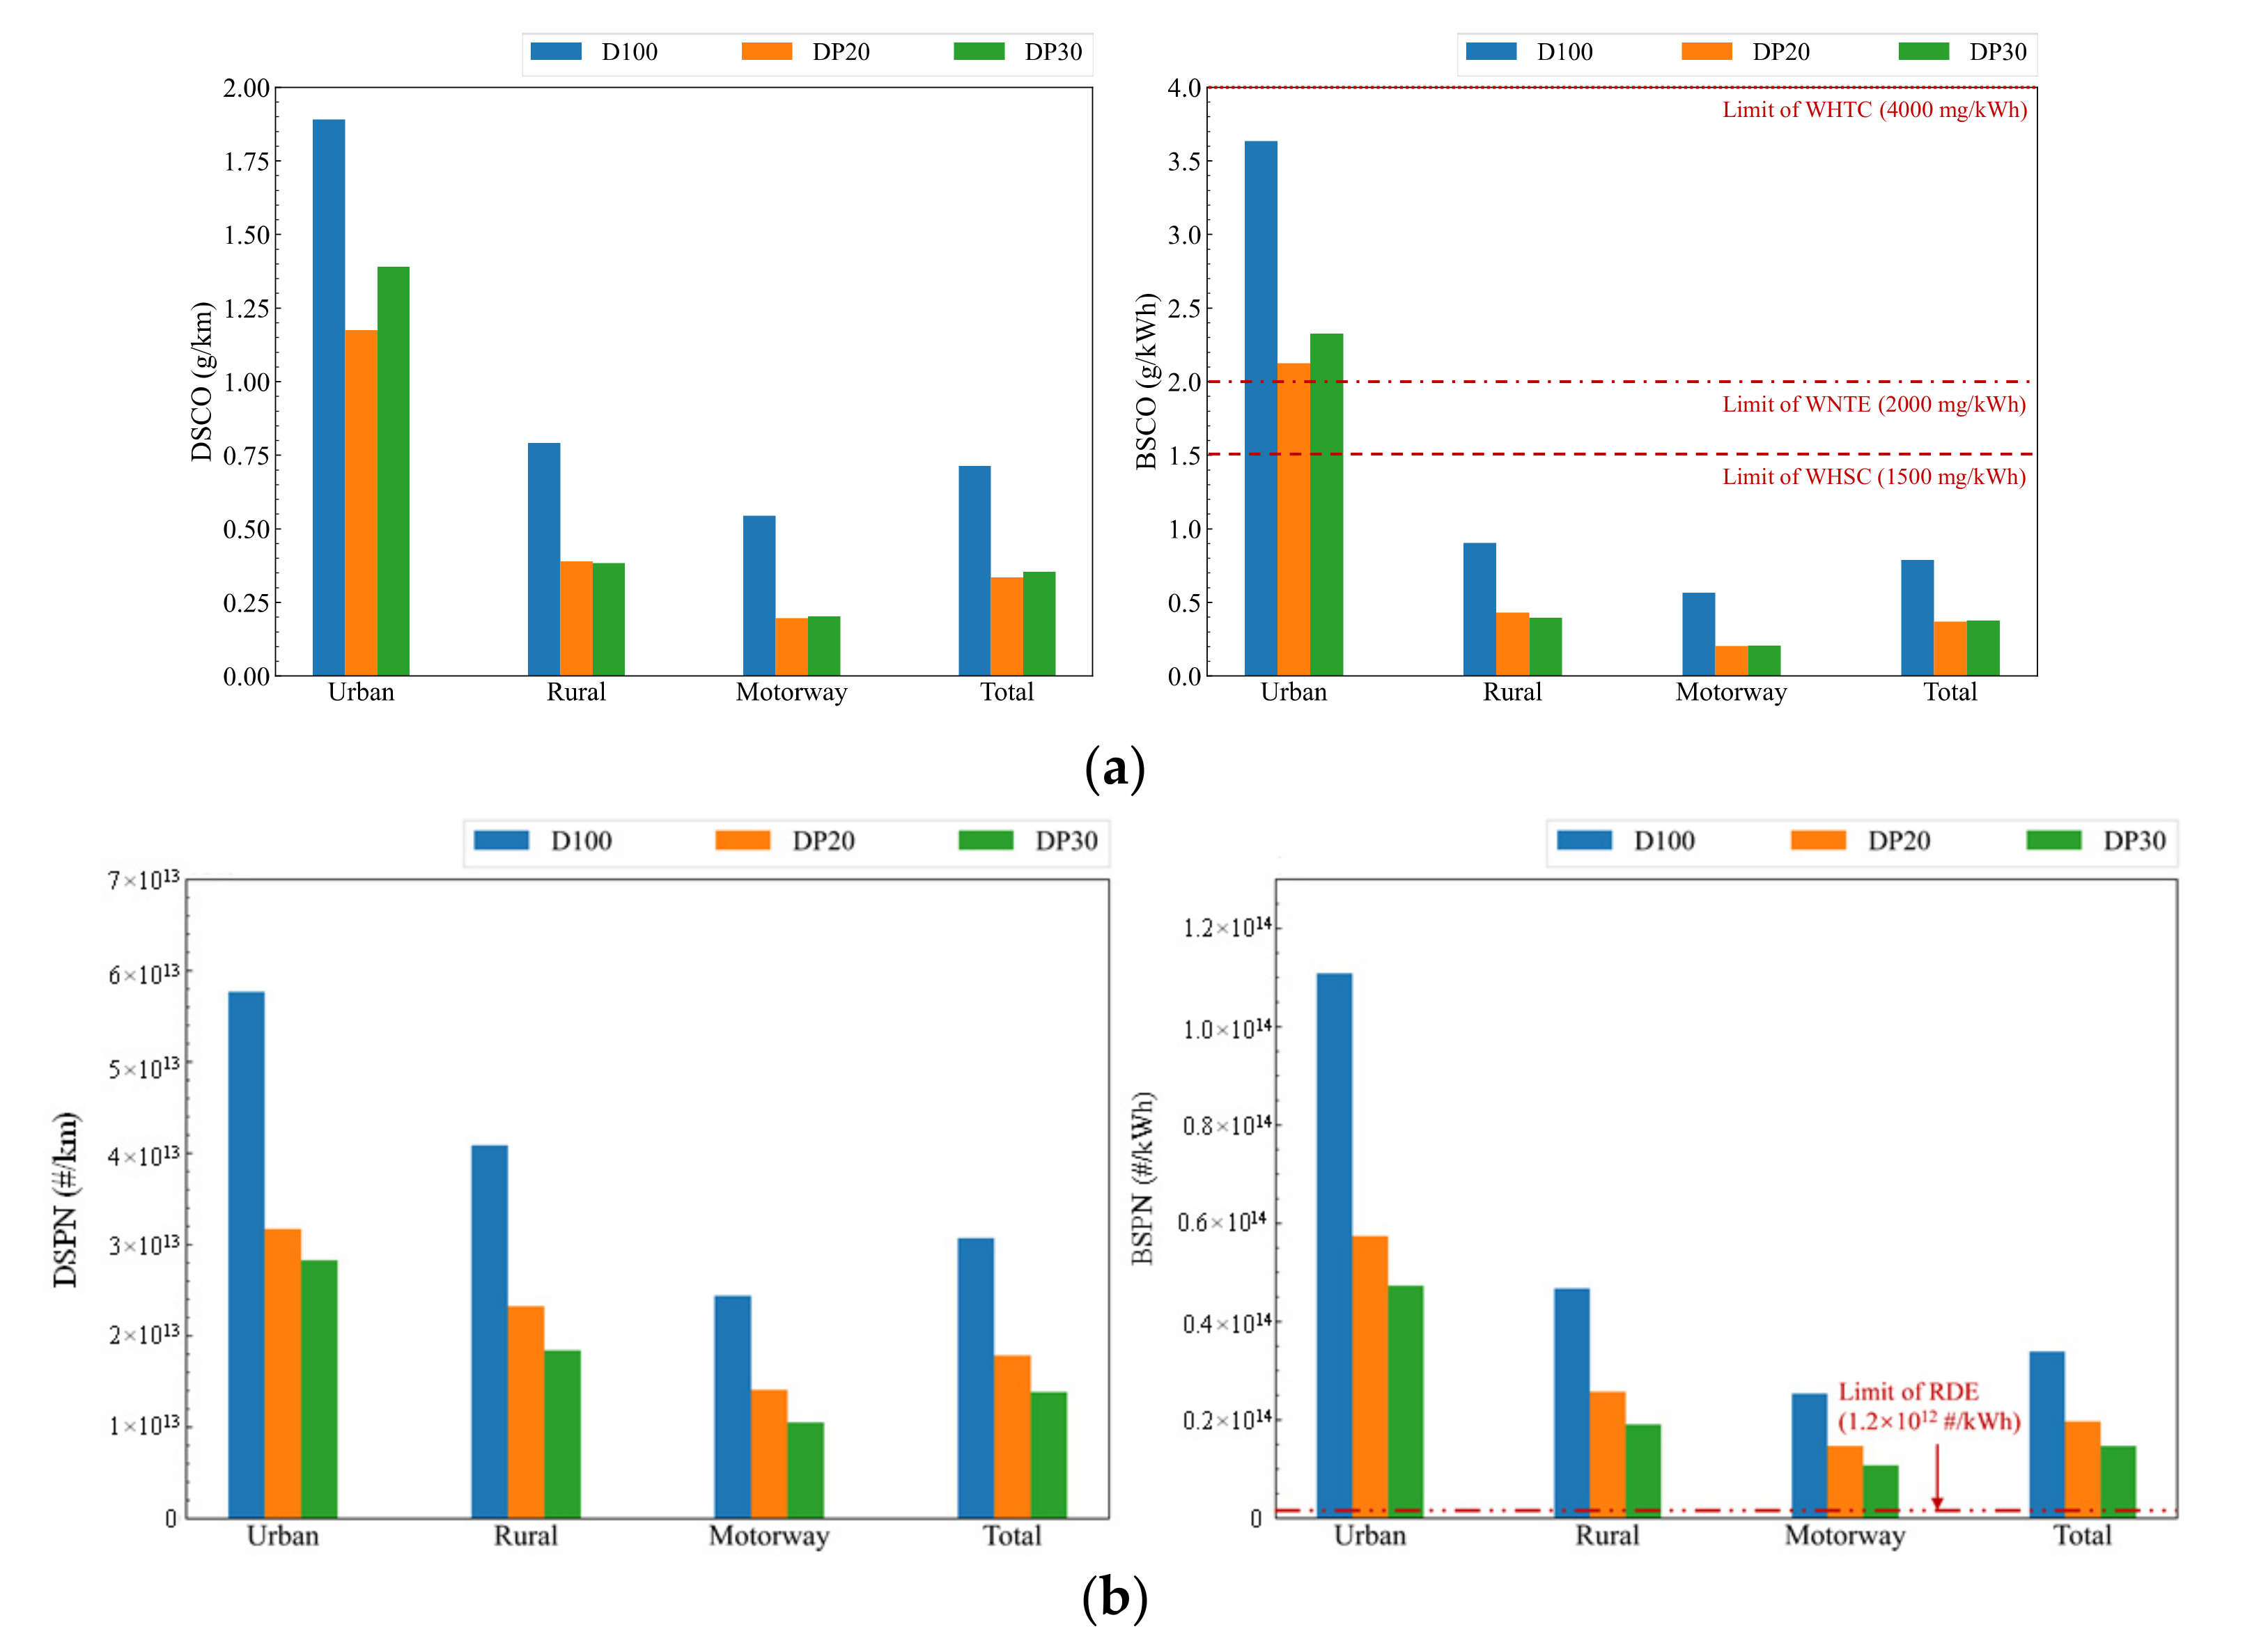
The addition of PODE had a fairly obvious inhibitory effect on the transient CO and PN emissions in a considerable range of operating conditions. However, even if PODE/diesel blends were used, the low load condition (0–250 N·m) was still the area with the highest BSCO and BSPN emissions.
(2)
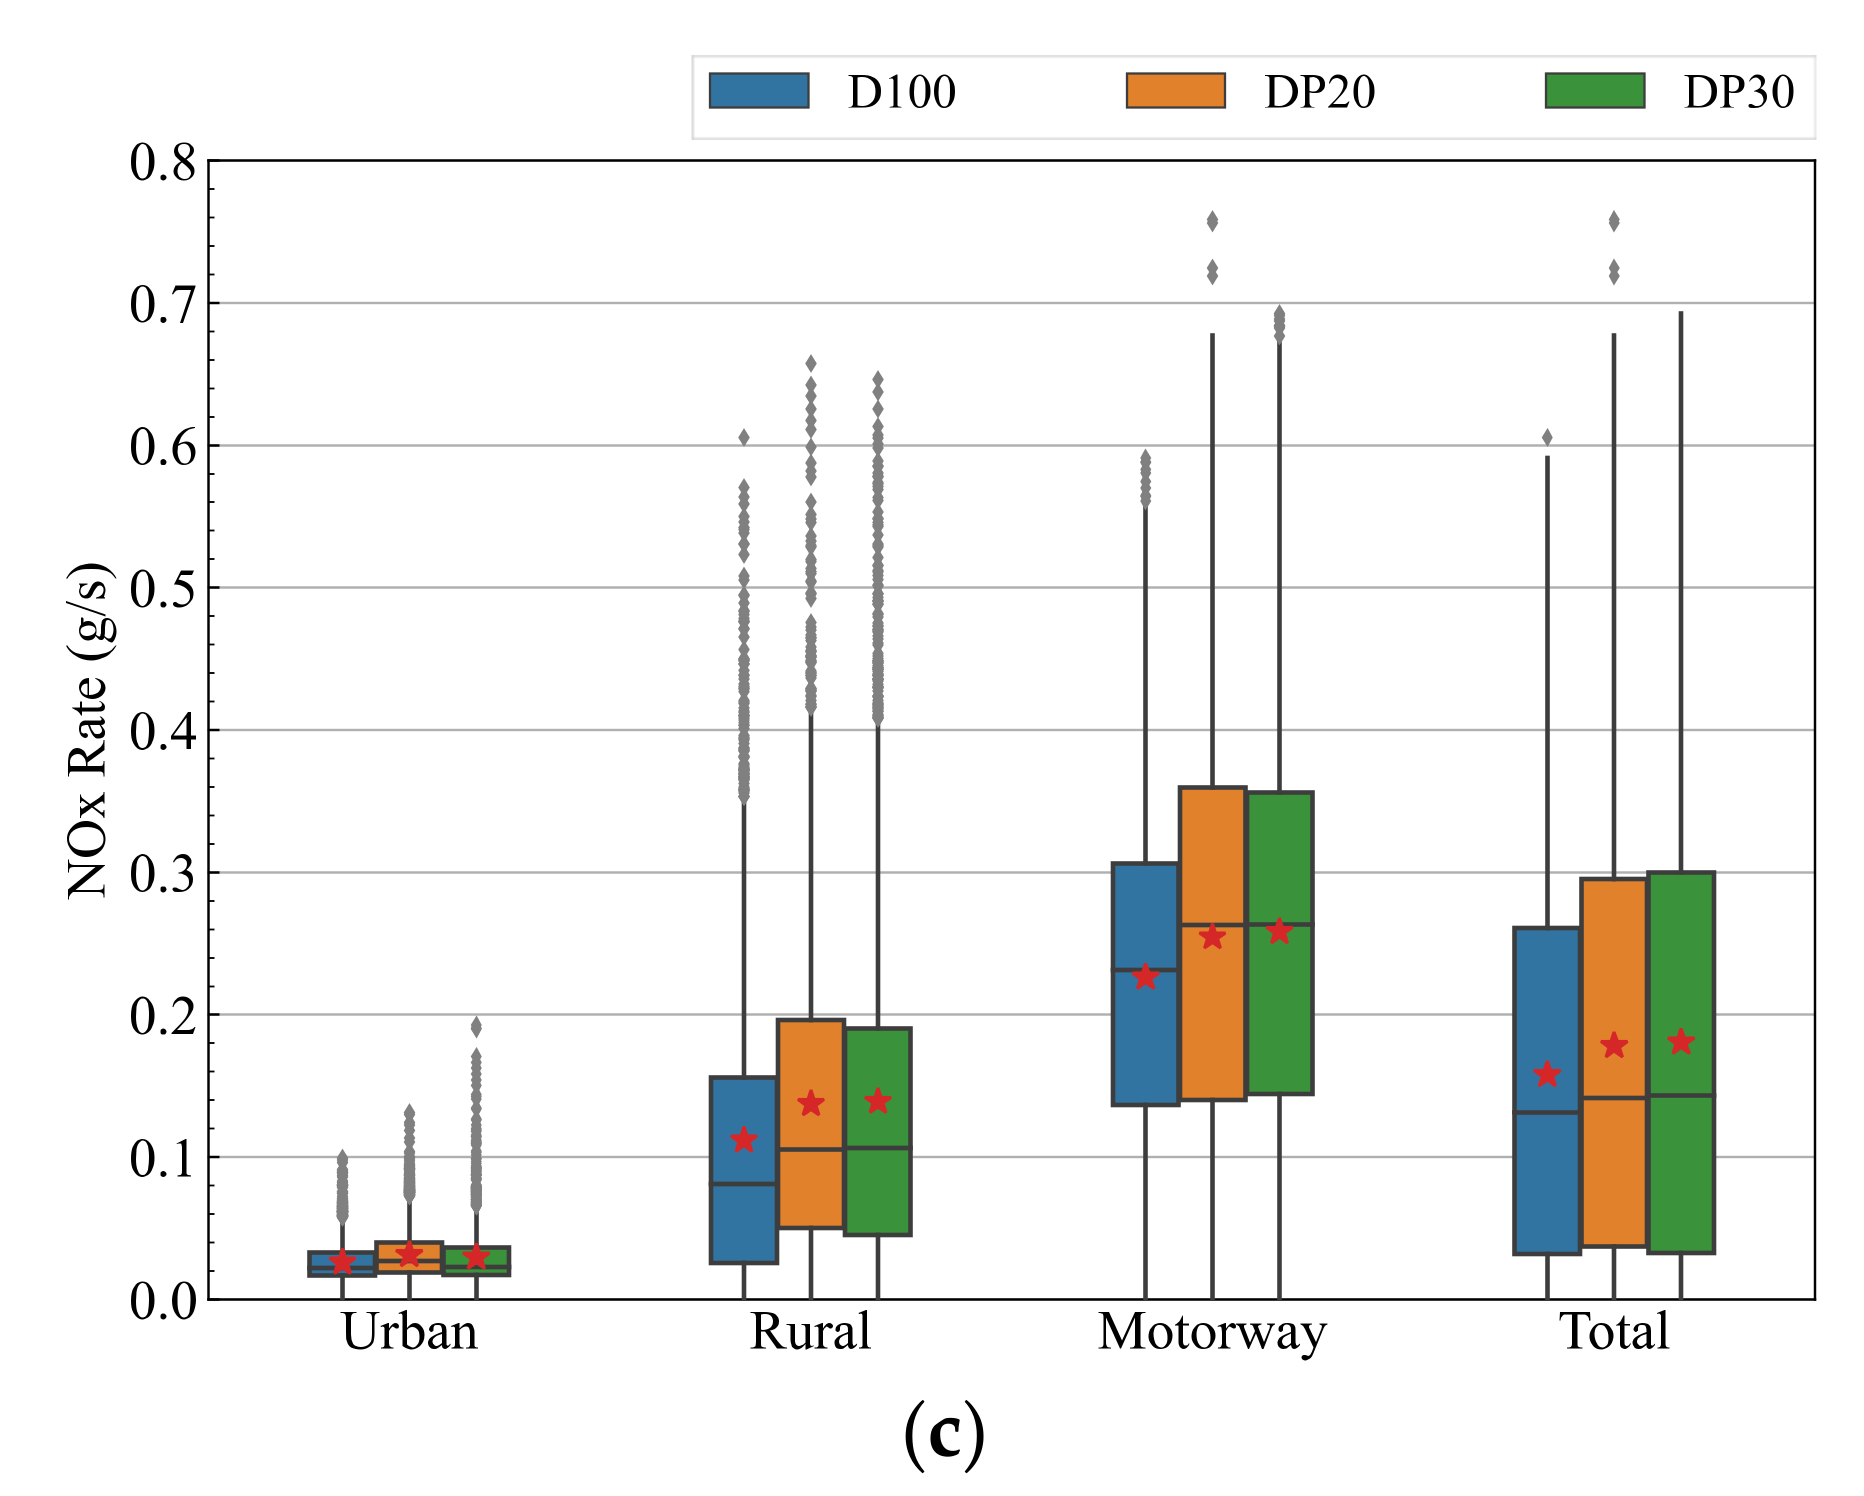
Under real driving conditions, the usage of PODE/diesel blends can increase BSNOx emissions in a wide range of operating conditions, which makes the high load condition (>750 N·m) high emission areas of BSNOx.
(3)
Regardless of the fuel type, the CO and PN emissions in the urban section were the highest. From the perspective of the entire test route, the addition of PODE can reduce the emissions of CO and PN by about 50%. On the contrary, the NOx emissions were the highest in the motorway section. The usage of blended fuels can increase the overall NOx emissions by no more than 20%.
(4)
The addition of PODE can lead to an increase in fuel consumption due to its lower LHV. The averaged BTE of the whole RDE test, however, reached 40.3%, which was better than 38.4% of the pure diesel operation when fueled with the DP30.
For the engine without EGR used in the experiment, the transient NOx emissions under real driving conditions were still increased when the PODE/diesel blends were used, even though the addition of PODE had an inhibitory on NOx emissions under certain steady-state operating conditions. The workload of the SCR system will increase, which means the matching and the optimization of the aftertreatment system for the application of the PODE/diesel blends may become a new challenge. However, the reduction in CO and PN emissions and the improvement of the vehicle BTE in the RDE tests are fascinating, creating greater tolerance for the EGR. Therefore, the application of PODE has considerable potential in controlling transient emissions. The impact of the addition of PODE on the aftertreatment system under real driving conditions needs to be investigated in detail in the future.

Author Contributions

Conceptualization, H.G. and S.L.; formal analysis, H.G., S.L., Y.W. and X.Z.; resources, X.L.; data curation, H.G., X.Z. and Z.L.; Writing—original draft preparation, H.G.; Writing—review and editing, H.G. and S.L.; funding acquisition, S.L. and Y.W. All authors have read and agreed to the published version of the manuscript.

Funding

This research was funded by the Shaanxi Provincial Key R&D Program, grant number 2018ZDCXL-GY-05-06 and the National Natural Science Foundation of China, grant number 91741110.

Institutional Review Board Statement

Not applicable.

Informed Consent Statement

Not applicable.

Data Availability Statement

Data is contained within the article.

Conflicts of Interest

The authors declare no conflict of interest.

Nomenclature

BTEbrake thermal efficiency
BS **brake specific ** (g/kWh or #/kWh)
COcarbon monoxide
CO2carbon dioxide
CNcetane number
CANcontroller area network
DOCdiesel oxidation catalyst
DPFdiesel particulate filter
DS **distance specific ** (g/km or #/km)
ECUengine control units
EFMexhaust flow measurement unit
EGRexhaust gas recirculation
GPSglobal position system
HDVheavy-duty vehicles
Hi-SCRhigh-efficiency selective catalytic reduction
LHVlower heating value (MJ/kg)
NOxnitrogen oxides
OBDon-board diagnostic
PMparticulate matter
PNparticle number
PODEpolyoxymethylene dimethyl ethers
PEMSportable emission measurement system
RDEreal driving emission
THCtotal hydrocarbon

References

  1. Kirsch, S. Running out? Rethinking resource depletion. Extr. Ind. Soc. 2020, 7, 838–840. [Google Scholar] [CrossRef]
  2. Gao, W.; Liu, J.; Sun, P.; Wang, T.; Chen, L.; Wang, B.; Kang, T.; Liu, S.; Shi, K. Numerical simulation on NO and soot formation process of a diesel engine with polyoxymethylene dimethyl ethers-diesel blend fuel. Energy Sources Part A Recovery Util. Environ. Eff. 2020, 1–16. [Google Scholar] [CrossRef]
  3. IARC Working Group on the Evaluation of Carcinogenic Risks to Humans. Diesel and Gasoline Engine Exhausts and Some Nitroarenes. Iarc Monographs on the Evaluation of Carcinogenic Risks to Humans. IARC Monogr. Eval. Carcinog. Risks Hum. 2014, 105, 9. [Google Scholar]
  4. Burnett, R.; Chen, H.; Szyszkowicz, M.; Fann, N.; Hubbell, B.; Pope, C.A.; Apte, J.S.; Brauer, M.; Cohen, A.; Weichenthal, S.; et al. Global estimates of mortality associated with long-term exposure to outdoor fine particulate matter. Proc. Natl. Acad. Sci. USA 2018, 115, 9592–9597. [Google Scholar] [CrossRef] [Green Version]
  5. Anenberg, S.C.; Henze, D.K.; Tinney, V.; Kinney, P.L.; Raich, W.; Fann, N.; Malley, C.S.; Roman, H.; Lamsal, L.; Duncan, B.; et al. Estimates of the Global Burden of Ambient PM2.5, Ozone, and NO2 on Asthma Incidence and Emergency Room Visits. Environ. Health Perspect. 2018, 126, 107004. [Google Scholar] [CrossRef] [Green Version]
  6. Pelletier, S.; Jabali, O.; Laporte, G. The electric vehicle routing problem with energy consumption uncertainty. Transp. Res. Part B Methodol. 2019, 126, 225–255. [Google Scholar] [CrossRef]
  7. Barbosa, F.C. Heavy Duty Diesel Emission Standards Regulation Evolution Review—Current Outcomes and Future Perspectives; SAE International: Warrendale, PA, USA, 2020. [Google Scholar] [CrossRef]
  8. Ziegler, M. The combustion engine has not by any means reached the end of the line. MTZ Worldw. 2021, 82, 26–29. [Google Scholar] [CrossRef]
  9. Xiao, H.; Guo, F.; Li, S.; Wang, R.; Yang, X. Combustion performance and emission characteristics of a diesel engine burning biodiesel blended with n-butanol. Fuel 2019, 258, 115887. [Google Scholar] [CrossRef]
  10. Liu, H.; Wang, X.; Wu, Y.; Zhang, X.; Jin, C.; Zheng, Z. Effect of diesel/PODE/ethanol blends on combustion and emissions of a heavy duty diesel engine. Fuel 2019, 257, 116064. [Google Scholar] [CrossRef]
  11. Liu, H.; Wang, Z.; Li, Y.; Zheng, Y.; He, T.; Wang, J. Recent progress in the application in compression ignition engines and the synthesis technologies of polyoxymethylene dimethyl ethers. Appl. Energy 2019, 233–234, 599–611. [Google Scholar] [CrossRef]
  12. Frei, M.S.; Capdevila-Cortada, M.; García-Muelas, R.; Mondelli, C.; López, N.; Stewart, J.A.; Curulla Ferré, D.; Pérez-Ramírez, J. Mechanism and microkinetics of methanol synthesis via CO2 hydrogenation on indium oxide. J. Catal. 2018, 361, 313–321. [Google Scholar]
  13. Li, D.; Gao, Y.; Liu, S.; Ma, Z.; Wei, Y. Effect of polyoxymethylene dimethyl ethers addition on spray and atomization characteristics using a common rail diesel injection system. Fuel 2016, 186, 235–247. [Google Scholar] [CrossRef]
  14. Liu, J.; Sun, P.; Huang, H.; Meng, J.; Yao, X. Experimental investigation on performance, combustion and emission characteristics of a common-rail diesel engine fueled with polyoxymethylene dimethyl ethers-diesel blends. Appl. Energy 2017, 202, 527–536. [Google Scholar] [CrossRef]
  15. Liu, J.; Wang, H.; Li, Y.; Zheng, Z.; Xue, Z.; Shang, H.; Yao, M. Effects of diesel/PODE (polyoxymethylene dimethyl ethers) blends on combustion and emission characteristics in a heavy duty diesel engine. Fuel 2016, 177, 206–216. [Google Scholar] [CrossRef]
  16. Liu, H.; Wang, Z.; Wang, J.; He, X.; Zheng, Y.; Tang, Q.; Wang, J. Performance, combustion and emission characteristics of a diesel engine fueled with polyoxymethylene dimethyl ethers (PODE3-4)/diesel blends. Energy 2015, 88, 793–800. [Google Scholar] [CrossRef]
  17. Liu, H.; Wang, Z.; Zhang, J.; Wang, J.; Shuai, S. Study on combustion and emission characteristics of Polyoxymethylene Dimethyl Ethers/diesel blends in light-duty and heavy-duty diesel engines. Appl. Energy 2017, 185, 1393–1402. [Google Scholar] [CrossRef]
  18. Chen, H.; Su, X.; Li, J.; Zhong, X. Effects of gasoline and polyoxymethylene dimethyl ethers blending in diesel on the combustion and emission of a common rail diesel engine. Energy 2019, 171, 981–999. [Google Scholar] [CrossRef]
  19. Chen, H.; Huang, R.; Huang, H.; Pan, M.; Teng, W. Potential improvement in particulate matter’s emissions reduction from diesel engine by addition of PODE and injection parameters. Appl. Therm. Eng. 2019, 150, 591–604. [Google Scholar] [CrossRef]
  20. Rosero, F.; Fonseca, N.; López, J.-M.; Casanova, J. Real-world fuel efficiency and emissions from an urban diesel bus engine under transient operating conditions. Appl. Energy 2020, 261, 114442. [Google Scholar] [CrossRef]
  21. Badshah, H.; Posada, F.; Muncrief, R. Current State NOₓ Emissions from In-Use Heavy-Duty Diesel Vehicles in the United States; International Council on Clean Transportation (ICCT): Washington, DC, USA, 2019. [Google Scholar]
  22. Mendoza-Villafuerte, P.; Suarez-Bertoa, R.; Giechaskiel, B.; Riccobono, F.; Bulgheroni, C.; Astorga, C.; Perujo, A. NOx, NH3, N2O and PN real driving emissions from a Euro VI heavy-duty vehicle. Impact of regulatory on-road test conditions on emissions. Sci. Total Environ. 2017, 609, 546–555. [Google Scholar] [CrossRef]
  23. Grigoratos, T.; Fontaras, G.; Giechaskiel, B.; Zacharof, N. Real world emissions performance of heavy-duty Euro VI diesel vehicles. Atmos. Environ. 2019, 201, 348–359. [Google Scholar] [CrossRef]
  24. Ministry of Ecology and Environment. Limits and Measurement Methods for Emissions from Diesel Fueled Heavy-Duty Vehicles (CHINA VI); Ministry of Ecology and Environment: Beijing, China, 2018; Volume GB17691-2018.
  25. Söderena, P.; Nylund, N.O.; Pettinen, R.; Mäkinen, R. Real Driving NOx Emissions from Euro VI Diesel Buses. SAE Tech. Pap. Ser. 2018, 2018. [Google Scholar] [CrossRef]
  26. Yu, Q.; Yang, Y.; Xiong, X.; Sun, S.; Liu, Y.; Wang, Y. Assessing the impact of multi-dimensional driving behaviors on link-level emissions based on a Portable Emission Measurement System (PEMS). Atmos. Pollut. Res. 2021, 12, 414–424. [Google Scholar] [CrossRef]
  27. Rosero, F.; Fonseca, N.; López, J.-M.; Casanova, J. Effects of passenger load, road grade, and congestion level on real-world fuel consumption and emissions from compressed natural gas and diesel urban buses. Appl. Energy 2021, 282, 116195. [Google Scholar] [CrossRef]
  28. Bishop, J.D.K.; Stettler, M.E.J.; Molden, N.; Boies, A.M. Engine maps of fuel use and emissions from transient driving cycles. Appl. Energy 2016, 183, 202–217. [Google Scholar] [CrossRef] [Green Version]
  29. Seo, J.; Park, J.; Park, J.; Park, S. Emission factor development for light-duty vehicles based on real-world emissions using emission map-based simulation. Environ. Pollut. 2021, 270, 116081. [Google Scholar] [CrossRef]
  30. McCaffery, C.; Zhu, H.; Li, C.; Durbin, T.D.; Johnson, K.C.; Jung, H.; Brezny, R.; Geller, M.; Karavalakis, G. On-road gaseous and particulate emissions from GDI vehicles with and without gasoline particulate filters (GPFs) using portable emissions measurement systems (PEMS). Sci. Total Environ. 2020, 710, 136366. [Google Scholar] [CrossRef] [Green Version]
  31. Giechaskiel, B.; Clairotte, M.; Valverde-Morales, V.; Bonnel, P.; Kregar, Z.; Franco, V.; Dilara, P. Framework for the assessment of PEMS (Portable Emissions Measurement Systems) uncertainty. Environ. Res. 2018, 166, 251–260. [Google Scholar] [CrossRef]
  32. Giechaskiel, B.; Valverde, V.; Clairotte, M. Real Driving Emissions (RDE): 2020 Assessment of Portable Emissions Measurement Systems (PEMS) Measurement Uncertainty; Luxembourg Publications Office of the European Union: Luxembourg, 2021. [Google Scholar] [CrossRef]
  33. Giechaskiel, B.; Lähde, T.; Melas, A.D.; Valverde, V.; Clairotte, M. Uncertainty of laboratory and portable solid particle number systems for regulatory measurements of vehicle emissions. Environ. Res. 2021, 197, 111068. [Google Scholar] [CrossRef]
  34. Albin Rajasingham, T. SI and CI Engine Control Architectures. In Nonlinear Model Predictive Control of Combustion Engines: From Fundamentals to Applications; Springer International Publishing: Cham, Switzerland, 2021; pp. 175–194. [Google Scholar] [CrossRef]
  35. Giechaskiel, B.; Bonnel, P.; Perujo, A.; Dilara, P. Solid Particle Number (SPN) Portable Emissions Measurement Systems (PEMS) in the European Legislation: A Review. Int. J. Environ. Res. Public Health 2019, 16, 4819. [Google Scholar] [CrossRef] [Green Version]
  36. Pavlovic, J.; Fontaras, G.; Broekaert, S.; Ciuffo, B.; Ktistakis, M.A.; Grigoratos, T. How accurately can we measure vehicle fuel consumption in real world operation? Transp. Res. Part D Transp. Environ. 2021, 90, 102666. [Google Scholar] [CrossRef]
  37. McGill, R.; Tukey, J.W.; Larsen, W.A. Variations of Box Plots. Am. Stat. 1978, 32, 12–16. [Google Scholar] [CrossRef]
  38. Xie, M.; Ma, Z.J.; Wang, Q.H.; Liu, J.C.; Liu, S.H. Investigation of Engine Combustion and Emission Performance Fuelled with Neat PODE and PODE/Diesel Blend. J. Xi’an Jiaotong Univ. 2017, 51, 32–37. [Google Scholar] [CrossRef]
  39. Wang, T.; Liu, J.; Sun, P.; Ji, Q.; Gao, W.; Yang, C. Influence of injection parameters on combustion, gaseous emissions and particle size distribution of a CRDI diesel engine operating with PODE/diesel blends. Fuel 2020, 281, 118733. [Google Scholar] [CrossRef]
  40. Zhu, Y.; Lin, D.; Wei, X.; Zhang, W. Effect of PODE on Combustion and Emission Characteristics of a Turbo–Charged Intercooled Diesel Engine. J. Shanghai Jiao Tong Univ. 2017, 51, 33. [Google Scholar]
  41. Zhao, Y.; Xie, Y.; Wang, X.; Li, Z.; Niu, T.; Liu, S. Energy balance analysis, combustion characteristics, and particulate number concentration-NOx trade-off of a heavy-duty diesel engine fueled with various PODEn/diesel blends. Energy Convers. Manag. 2020, 225, 113489. [Google Scholar] [CrossRef]
Figure 1. Semi-trailing tractor used in the study with a six-ton trailer attached.
Energies 15 02379 g001
Figure 2. The GPS trajectory of the selected test route.
Energies 15 02379 g002
Figure 3. Second-by-second speed and altitude records of the vehicle under different fuel conditions.
Energies 15 02379 g003
Figure 4. The schematic diagram of PEMS.
Energies 15 02379 g004
Figure 5. An example of processing fuel consumption rate data.
Energies 15 02379 g005
Figure 6. The percentage of time at each engine operating range for all three driving conditions under the corresponding fuel condition.
Energies 15 02379 g006
Figure 7. Transient maps of (a) CO2 emission and (b) fuel consumption rates.
Energies 15 02379 g007
Figure 8. Transient engine maps of (a) BSFC and (b) BTE.
Energies 15 02379 g008
Figure 9. Brake thermal efficiencies under different driving sections.
Energies 15 02379 g009
Figure 10. Transient engine maps of (a-1) CO, (b-1) PN, (c-1) NOx emission rates and brake specific (a-2) CO, (b-2) PN, (c-2) NOx emissions.
Energies 15 02379 g010
Figure 11. Boxplots of (a) CO, (b) PN and (c) NOx emission rates.
Energies 15 02379 g011aEnergies 15 02379 g011b
Figure 12. Comparison of distance-specific and brake specific (a) CO, (b) PN and (c) NOx emissions.
Energies 15 02379 g012aEnergies 15 02379 g012b
Table 1. Some of physical and chemical properties of the diesel and PODE used in tests.
PropertyD100PODEDP20DP30
Molecular formulaC10~C21CH3O(CH2O)nCH3--
Oxygen content (wt%) 1≈045.469.0913.64
Density at 20 °C (g/cm3) 20.821.040.860.87
Cetane number≥51 376>51>51
Lower heating value (MJ/kg)42.59 417.83 437.64 135.16 1
1 Calculated from the molecular formula or mass fraction. 2 The measurement process was based on GB/T 1884-2000 and GB/T 1885-1998). 3 Required by the national standard GB 19147-2016. 4 The measurement process was based on GB/T 384-1981.
Table 2. Specifications of the engine.
Engine ParameterValue
ManufacturerWEICHAI Power
ModelWP12.460
Bore (mm) × Stroke (mm)126 × 155
CylindersInline-6
Displacement (L)11.596
Compression ratio17
Rated speed (rpm)1900
Rated power (kW)338
Max torque (N·m)2200
Aftertreatment systemDOC + DPF + Hi-SCR
Emission standardCHINA VI
Table 3. Specifications of the vehicle.
Vehicle ParameterValue
ModelM3000
Model year2020
ClassificationN3
Transmission12-Speed Manual
Drive axle11.5 t Single-reduction drive axle (3.7)
Weight of the tractor (kg)8330
Weight of the trailer (kg)6070
Curb weight (kg)14,400
Table 4. Actual driving distance and time of experiments under conditions of different fuels.
UrbanRuralMotorwayTotal
D100Distance (km)13.21 (8.8%)30.50 (20.4%)105.89 (70.8%)149.60
Time (s)1735 (19.8%)2204 (25.2%)4813 (55.0%)8752
AVG. Velocity (km/h)27.4149.8279.2061.54
DP20Distance (km)14.16 (9.6%)32.57 (22.0%)101.45 (68.4%)148.18
Time (s)1811 (20.1%)2317 (25.8%)4862 (54.1%)8990
AVG. Velocity (km/h)28.1550.6175.1259.34
DP30Distance (km)13.54 (9.2%)30.83 (21.1%)102.07 (69.7%)146.44
Time (s)1805 (20.4%)2250 (25.3%)4821 (54.3%)8876
AVG. Velocity (km/h)27.0049.3376.2259.40
Table 5. Data acquisition methods in the experiment.
The Type of AnalysisMeasurement PrincipleInstrument
CO/CO2 concentrationNDIRAVL gas PEMS 493
NOx (NO/NO2) concentrationNDUVAVL gas PEMS 493
PN concentrationDiffusion chargerAVL PN PEMS 496
Exhaust flow-EFM
Fuel consumption rate-OBD
Engine speed-OBD
Engine torque-OBD
Vehicle geographic location-GPS
Table 6. Accuracy of the sensors.
SensorsAccuracy
CO0–1499 ppm: ±30 ppm
1500–49,999 ppm: ±2%
CO20–9.99 vol%: ±0.06 vol%
10–20 vol%: ±2%
NO±0.2% Full Scale or ±2% (Whichever is larger)
NO2±0.2% Full Scale or ±2% (Whichever is larger)
PN concentrationTypically around ±5% (excluding technical tolerance) [32,35]
Exhaust flow±0.5% Full Scale or ±2% (Whichever is larger)
Fuel consumption rateWithin ±5% [36]
Engine speed±1 rpm
Engine torqueWithin ±5% [24]
Vehicle distanceAbout 2.8%
Table 7. The comparison of results of the steady-state experiment and the RDE tests of the same model of CHINA VI heavy-duty engine.
DP20DP30
NOxBSNOxPNBSPNBTE **NOxBSNOxPNBSPNBTE **
ppmg/kWhN/cm3#/kWh-ppmg/kWhN/cm3#/kWh-
S *−7.3%-−56.7%-+1.1%−11.6%-−64.4%-+1.8%
T *-+17.9%-−41.9%−0.4% +14.7%-−56.6%+1.9%
* S: Steady state, T: Transient state (RDE tests) ** Absolute increase in the brake thermal efficiency.
Publisher’s Note: MDPI stays neutral with regard to jurisdictional claims in published maps and institutional affiliations.

