
Techno Economic Analysis of Electric Vehicle Grid Integration Aimed to Provide Network Flexibility Services in Italian Regulatory Framework

 ,
,  ,
, 
 ,
,  ,
,  and
and
Abstract
:1. Introduction
1.1. State of Art
1.2. Paper Contribution
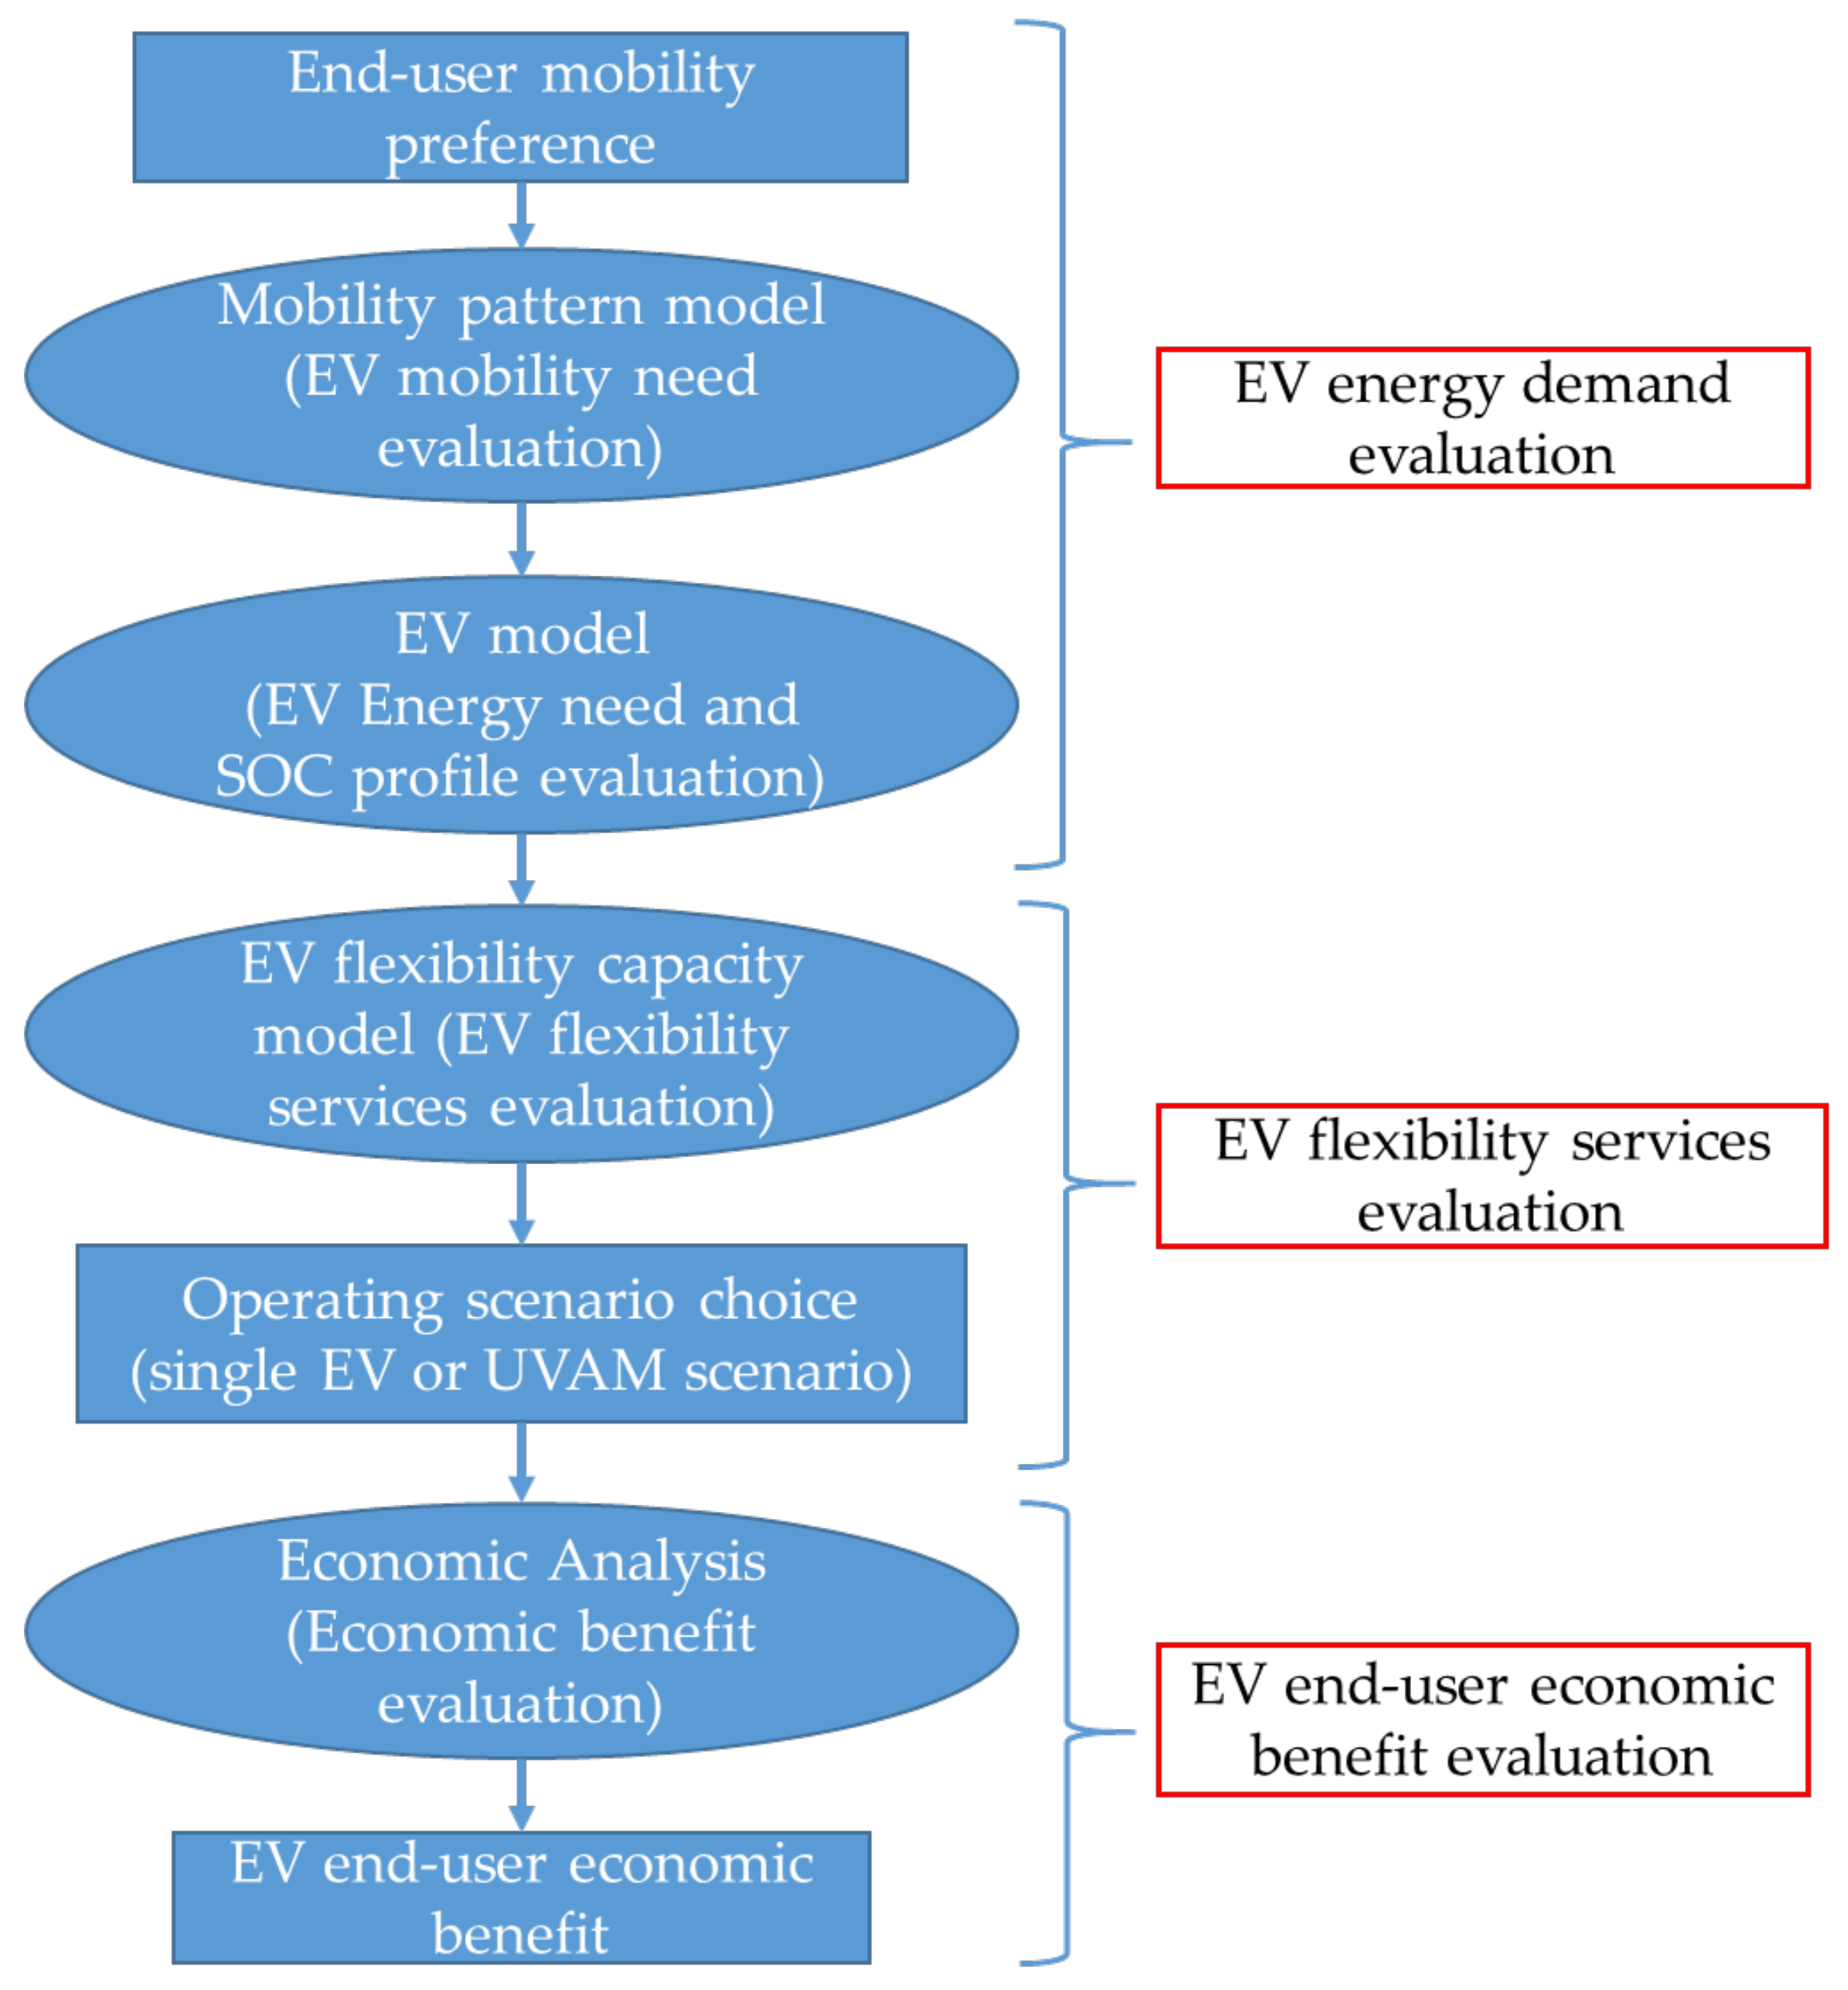
- (1)
- Definition of end-user mobility patterns;
- (2)
- Electric vehicle modeling to assess energy needs based on the planned mobility pattern;
- (3)
- Implementation of a methodology for evaluating the flexibility service that a single EV can offer and therefore determining the charge and discharge profile and the economic benefit for the end-user;
- (4)
- Implementation of a methodology for evaluating the reserve that an electric vehicle belonging to a fleet can offer and therefore determining the charge and discharge profile and the economic benefit for the end-user;
- (5)
- Numerical simulation testing the effectiveness of the adopted methodology.
2. Brief Review on EV Technical Characteristics
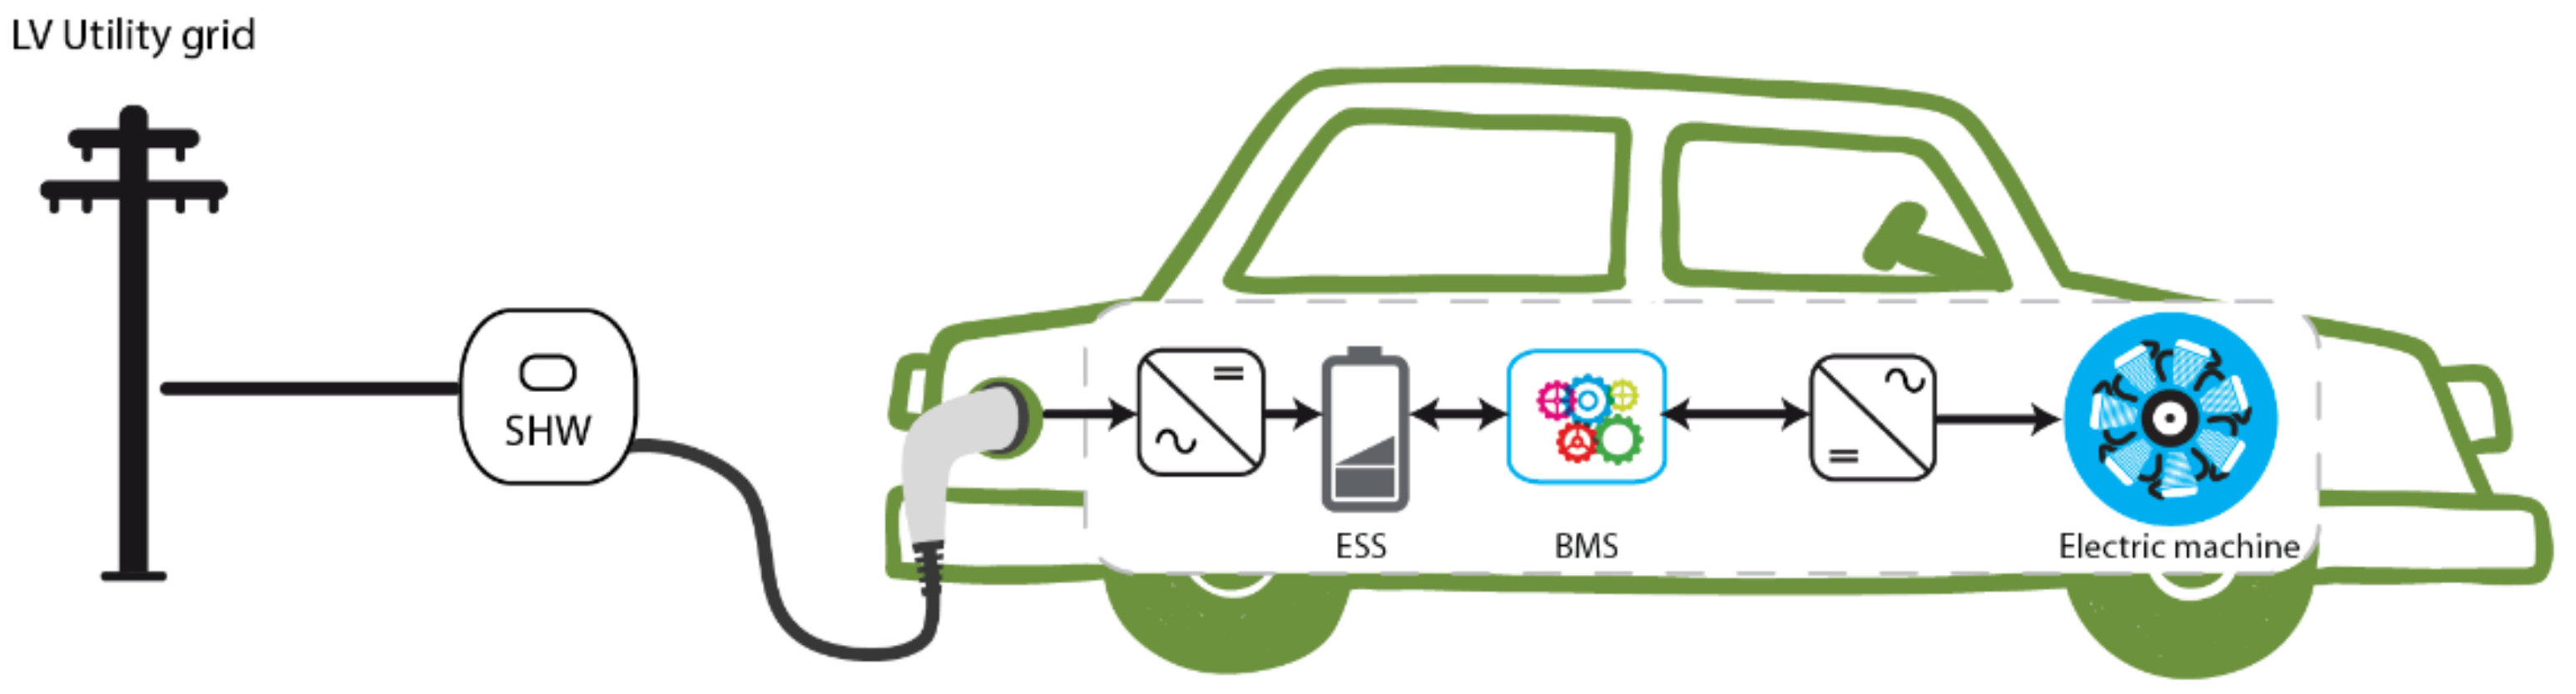
- V1G. This usage scenario enables smart charging, defined as the one-way exchange (the vehicle absorbs power from the grid only) that must be managed to combine the end-user’s mobility need and at the same time guarantee the safe operation of the electric system.
- V2G. This EVs use method provides for bi-directional energy exchanges with the grid to offer the so-called “ancillary services”, without violating the end-user’s mobility needs.
3. Proposed EV Day-Ahead Charging Scheduling Approach to Provide Flexibility Service
- (1)
- Support and Compensation of the Intermittent Renewable Energy Sources;
- (2)
- Provision of Ancillary Services (aim of the paper);
- (3)
- Load Shifting.
4. EV Energy Demand
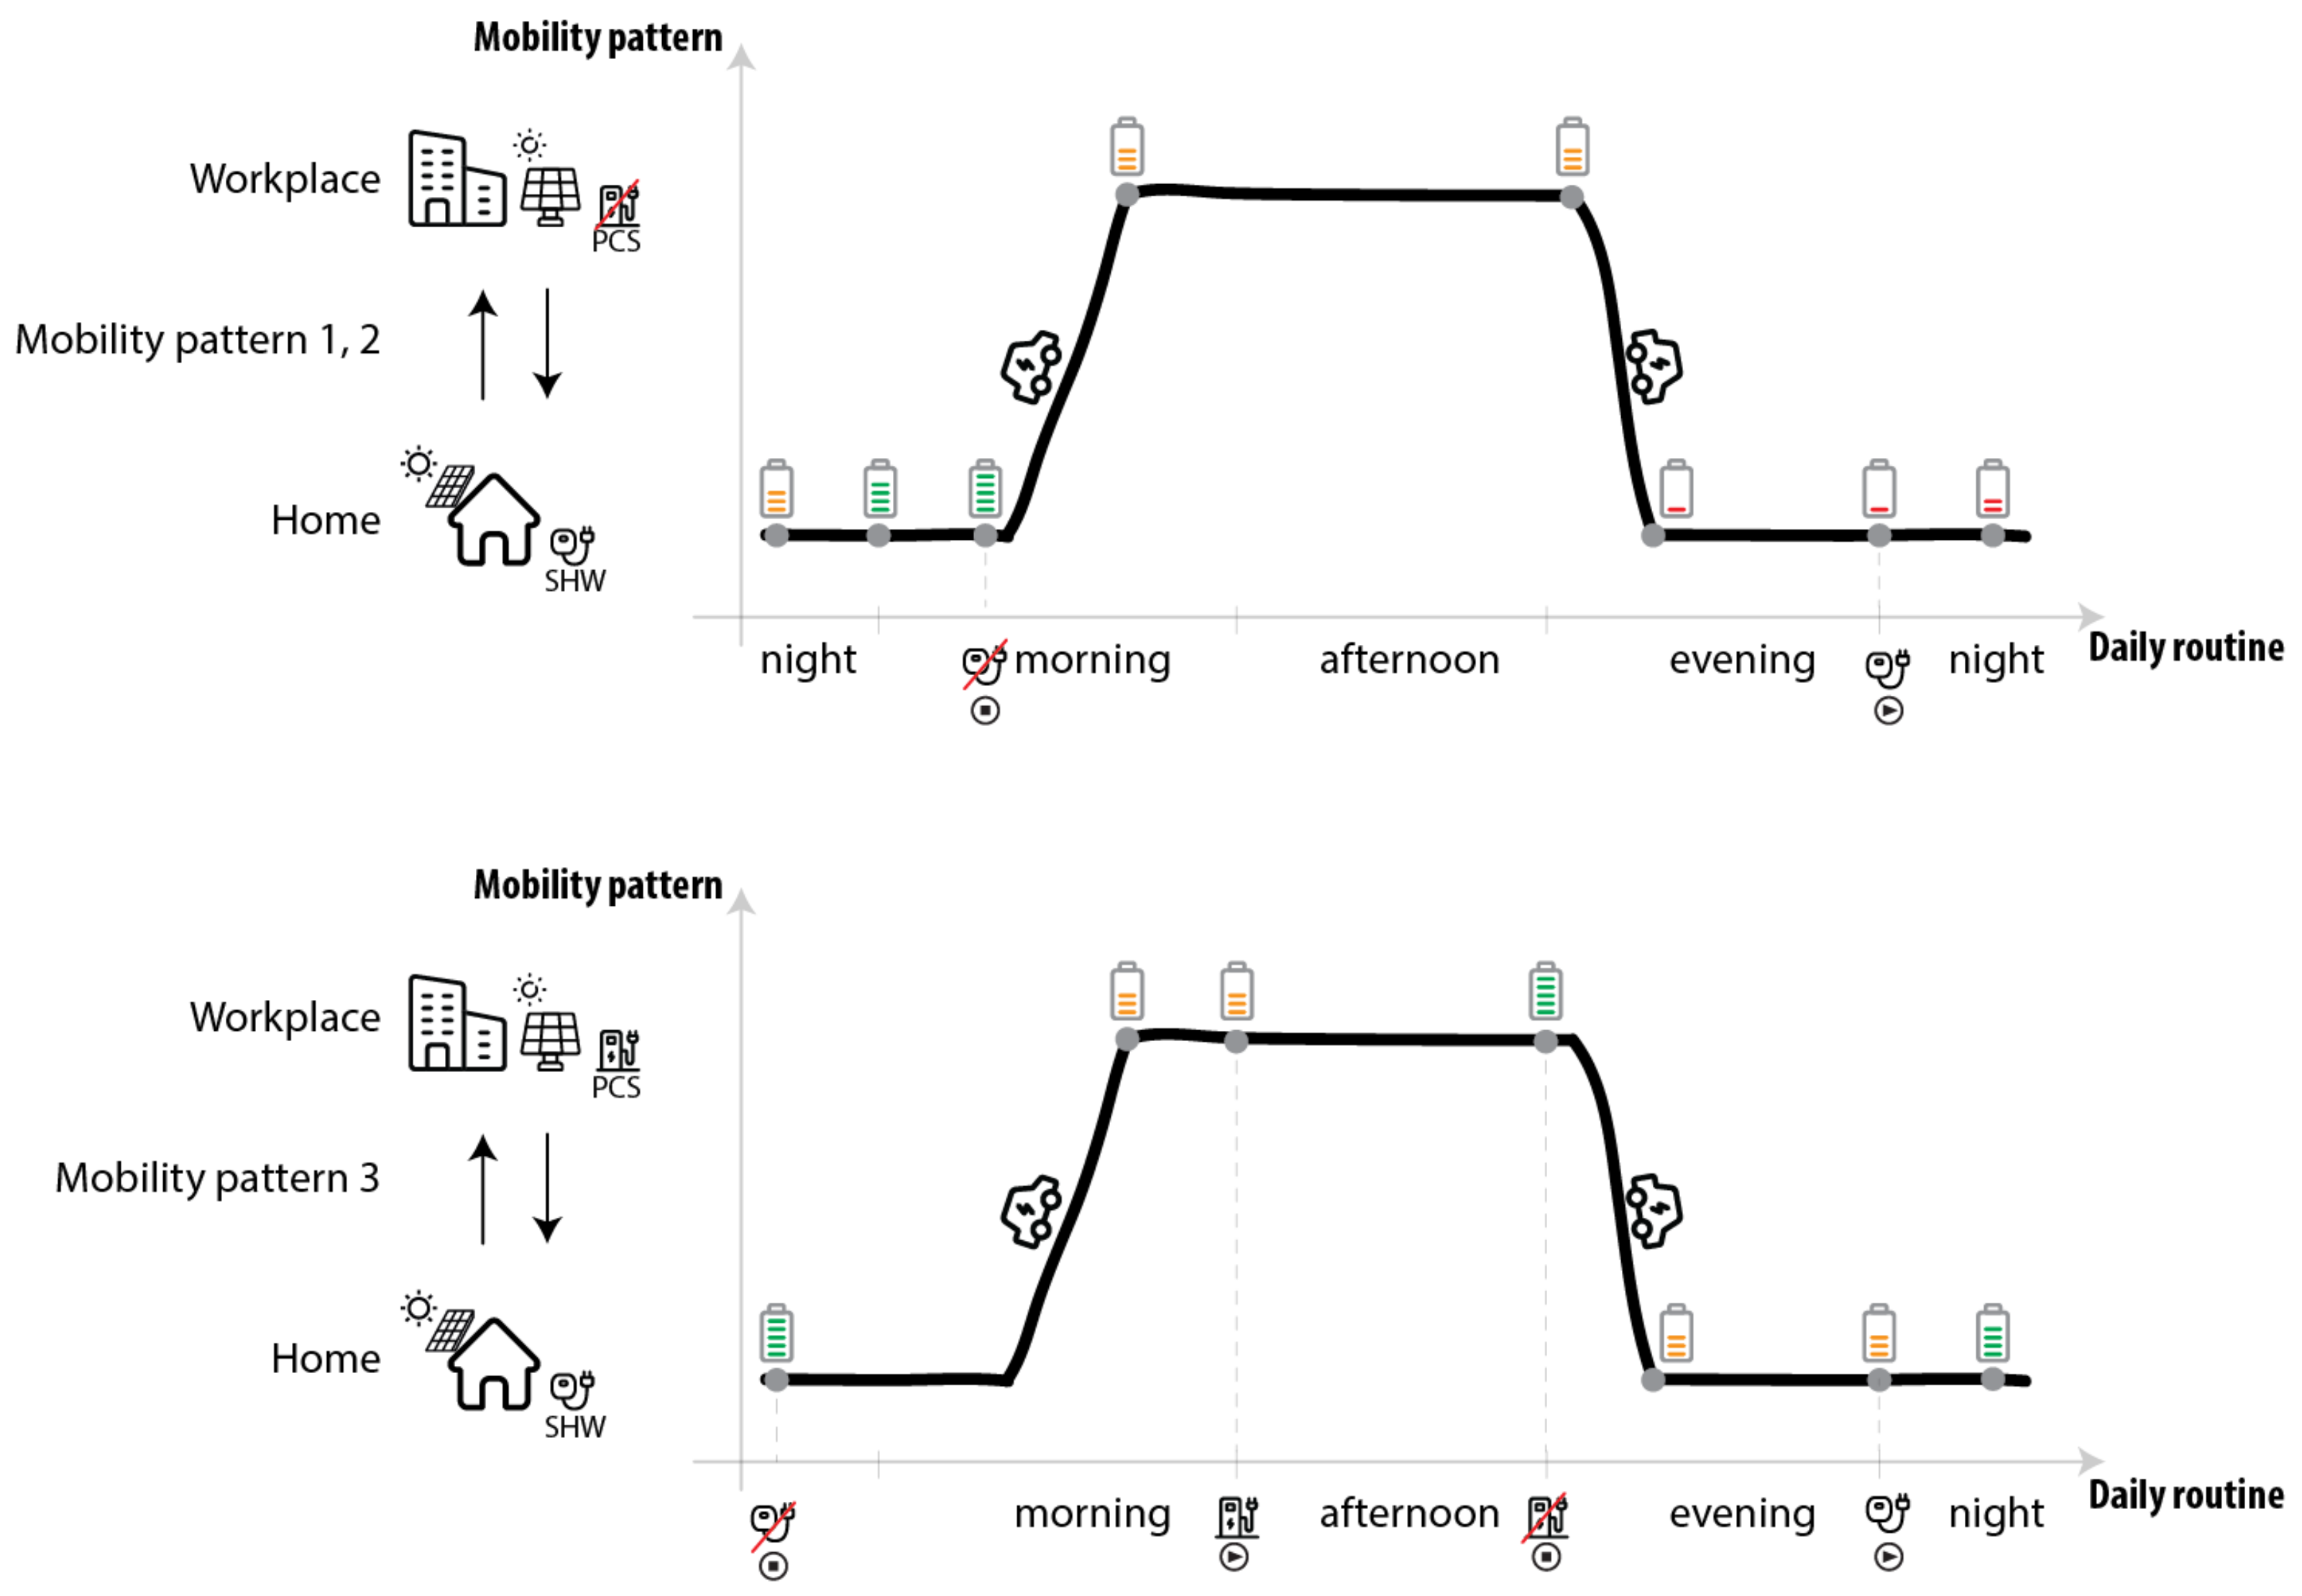
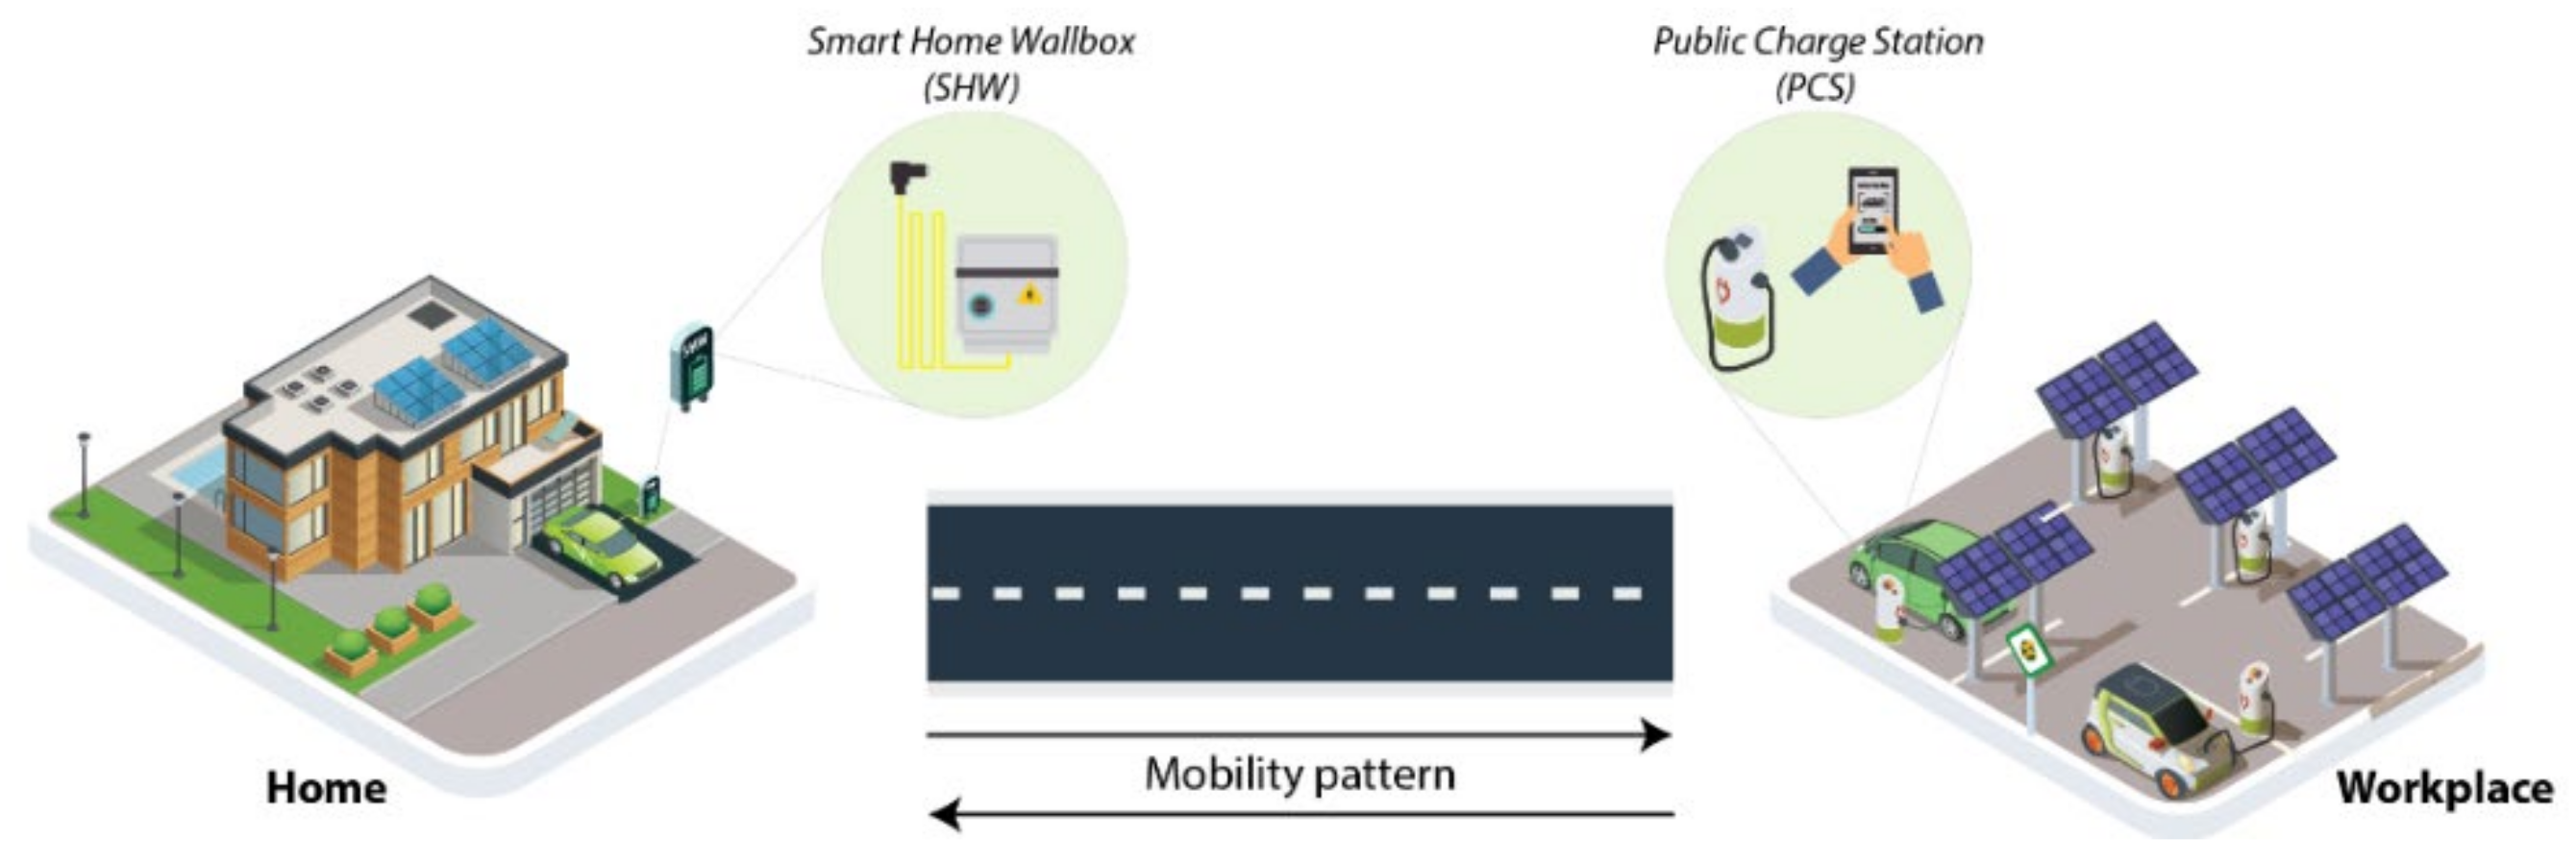
4.1. Mobility Pattern Model
4.1.1. Mobility Pattern Creation
4.1.2. Mobility Pattern 1
4.1.3. Mobility Pattern 2
4.1.4. Mobility Pattern 3
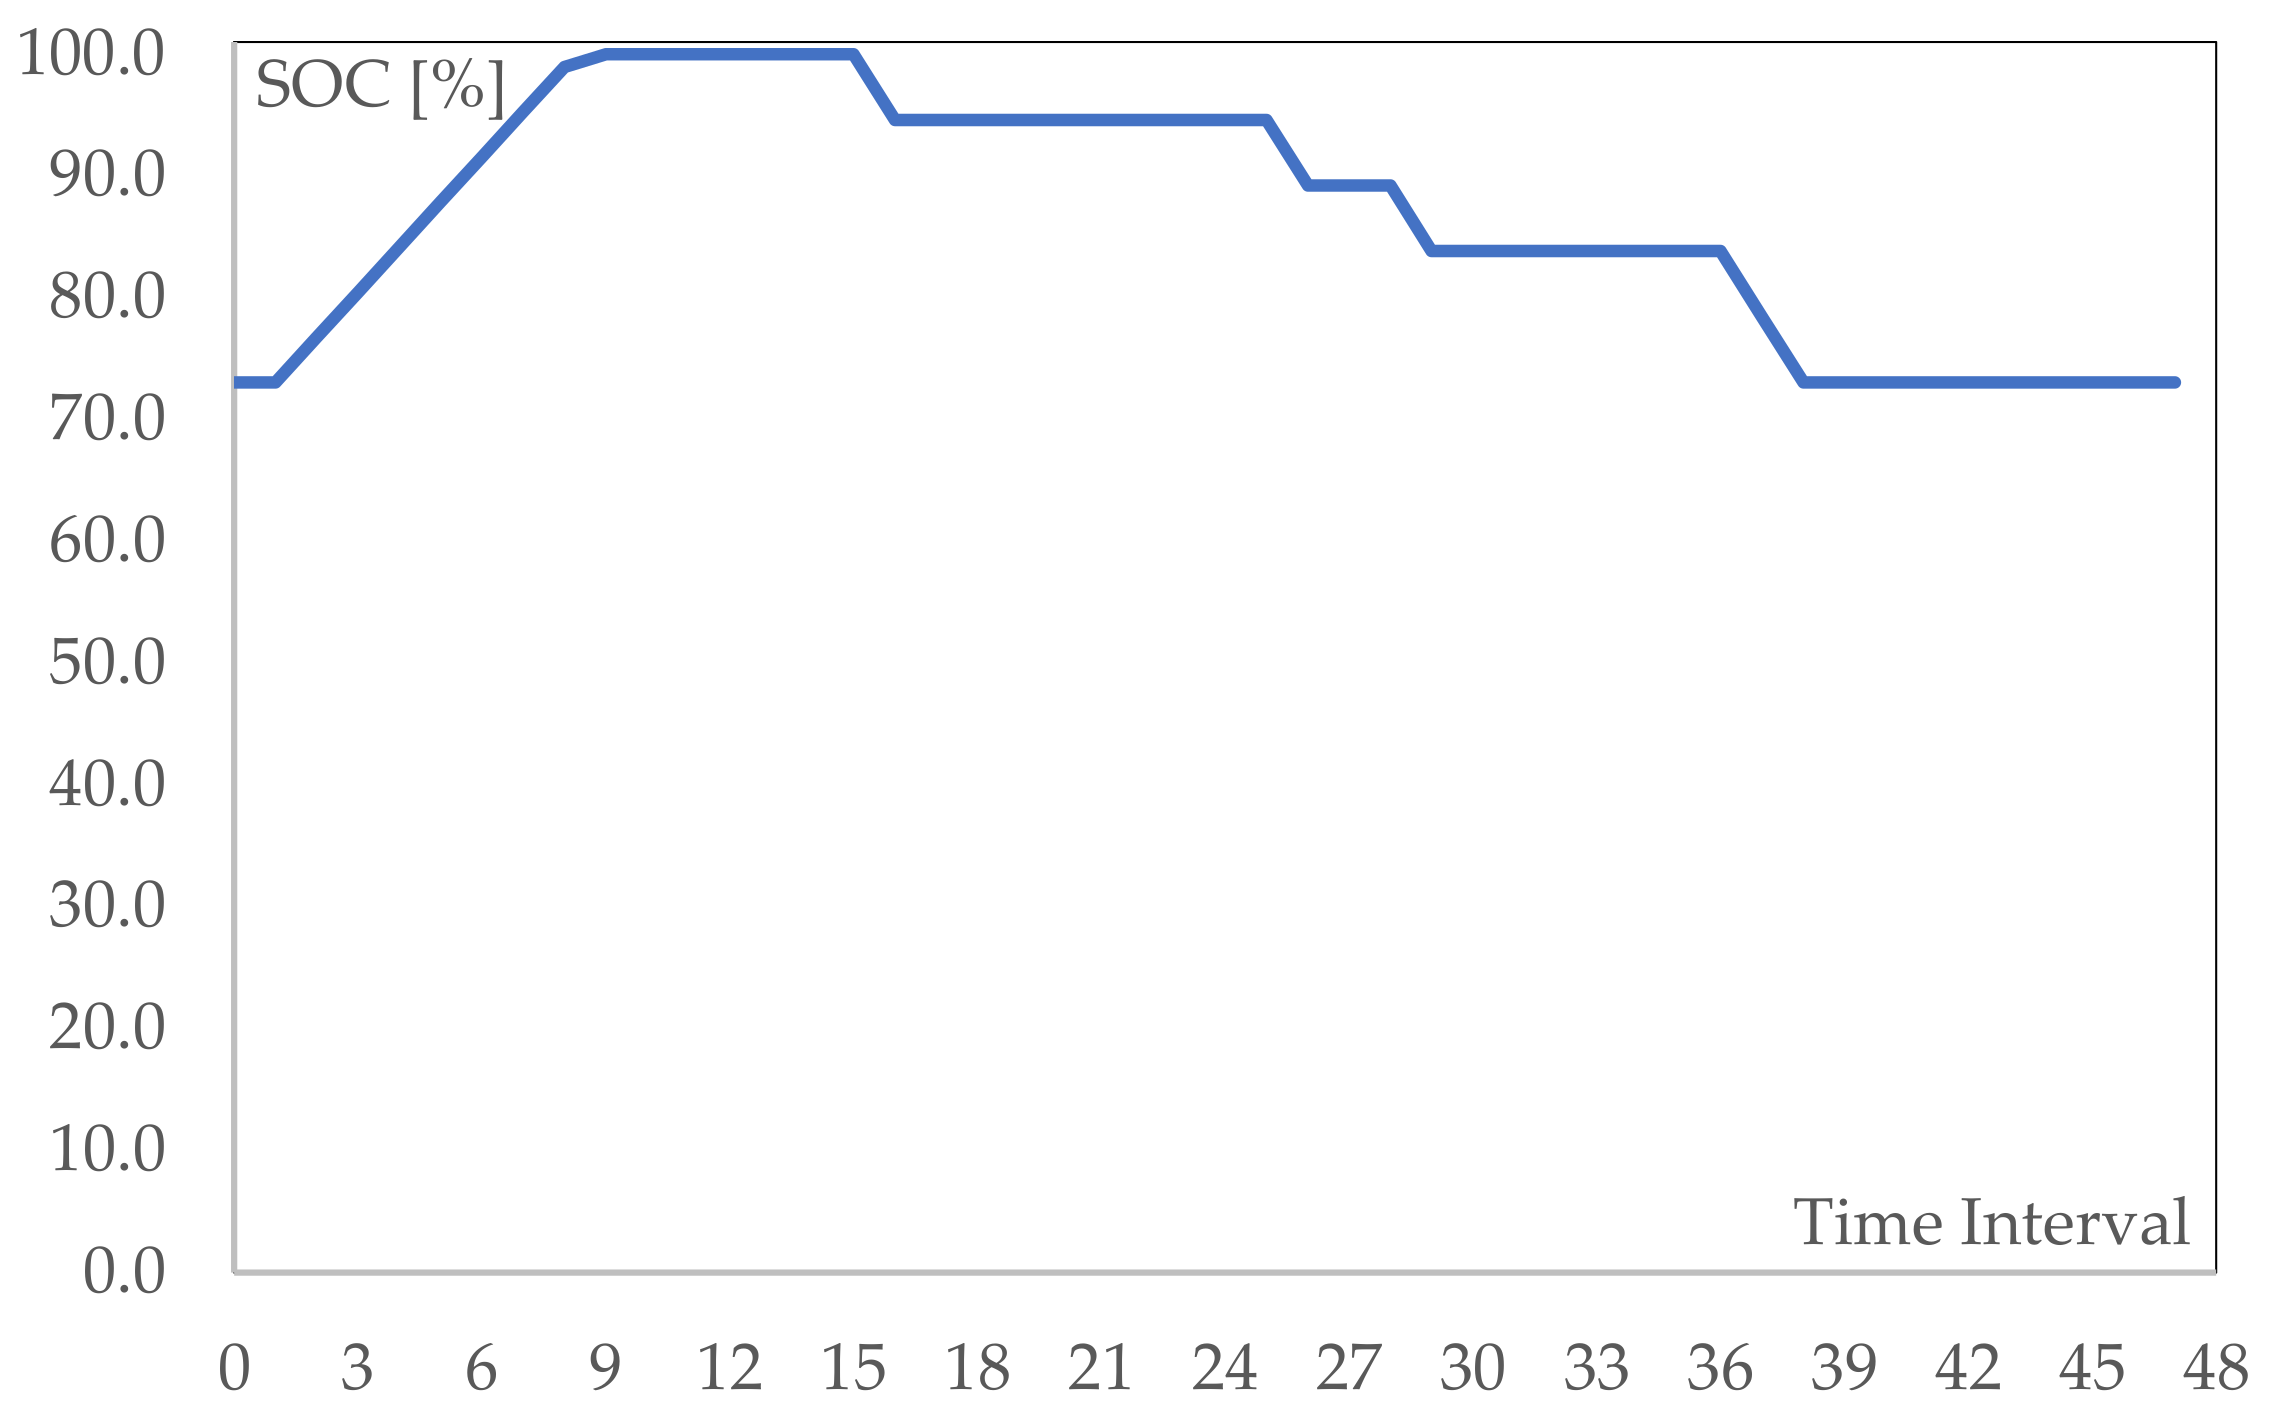
4.2. EV Model
5. EV Flexibility Service Evaluation
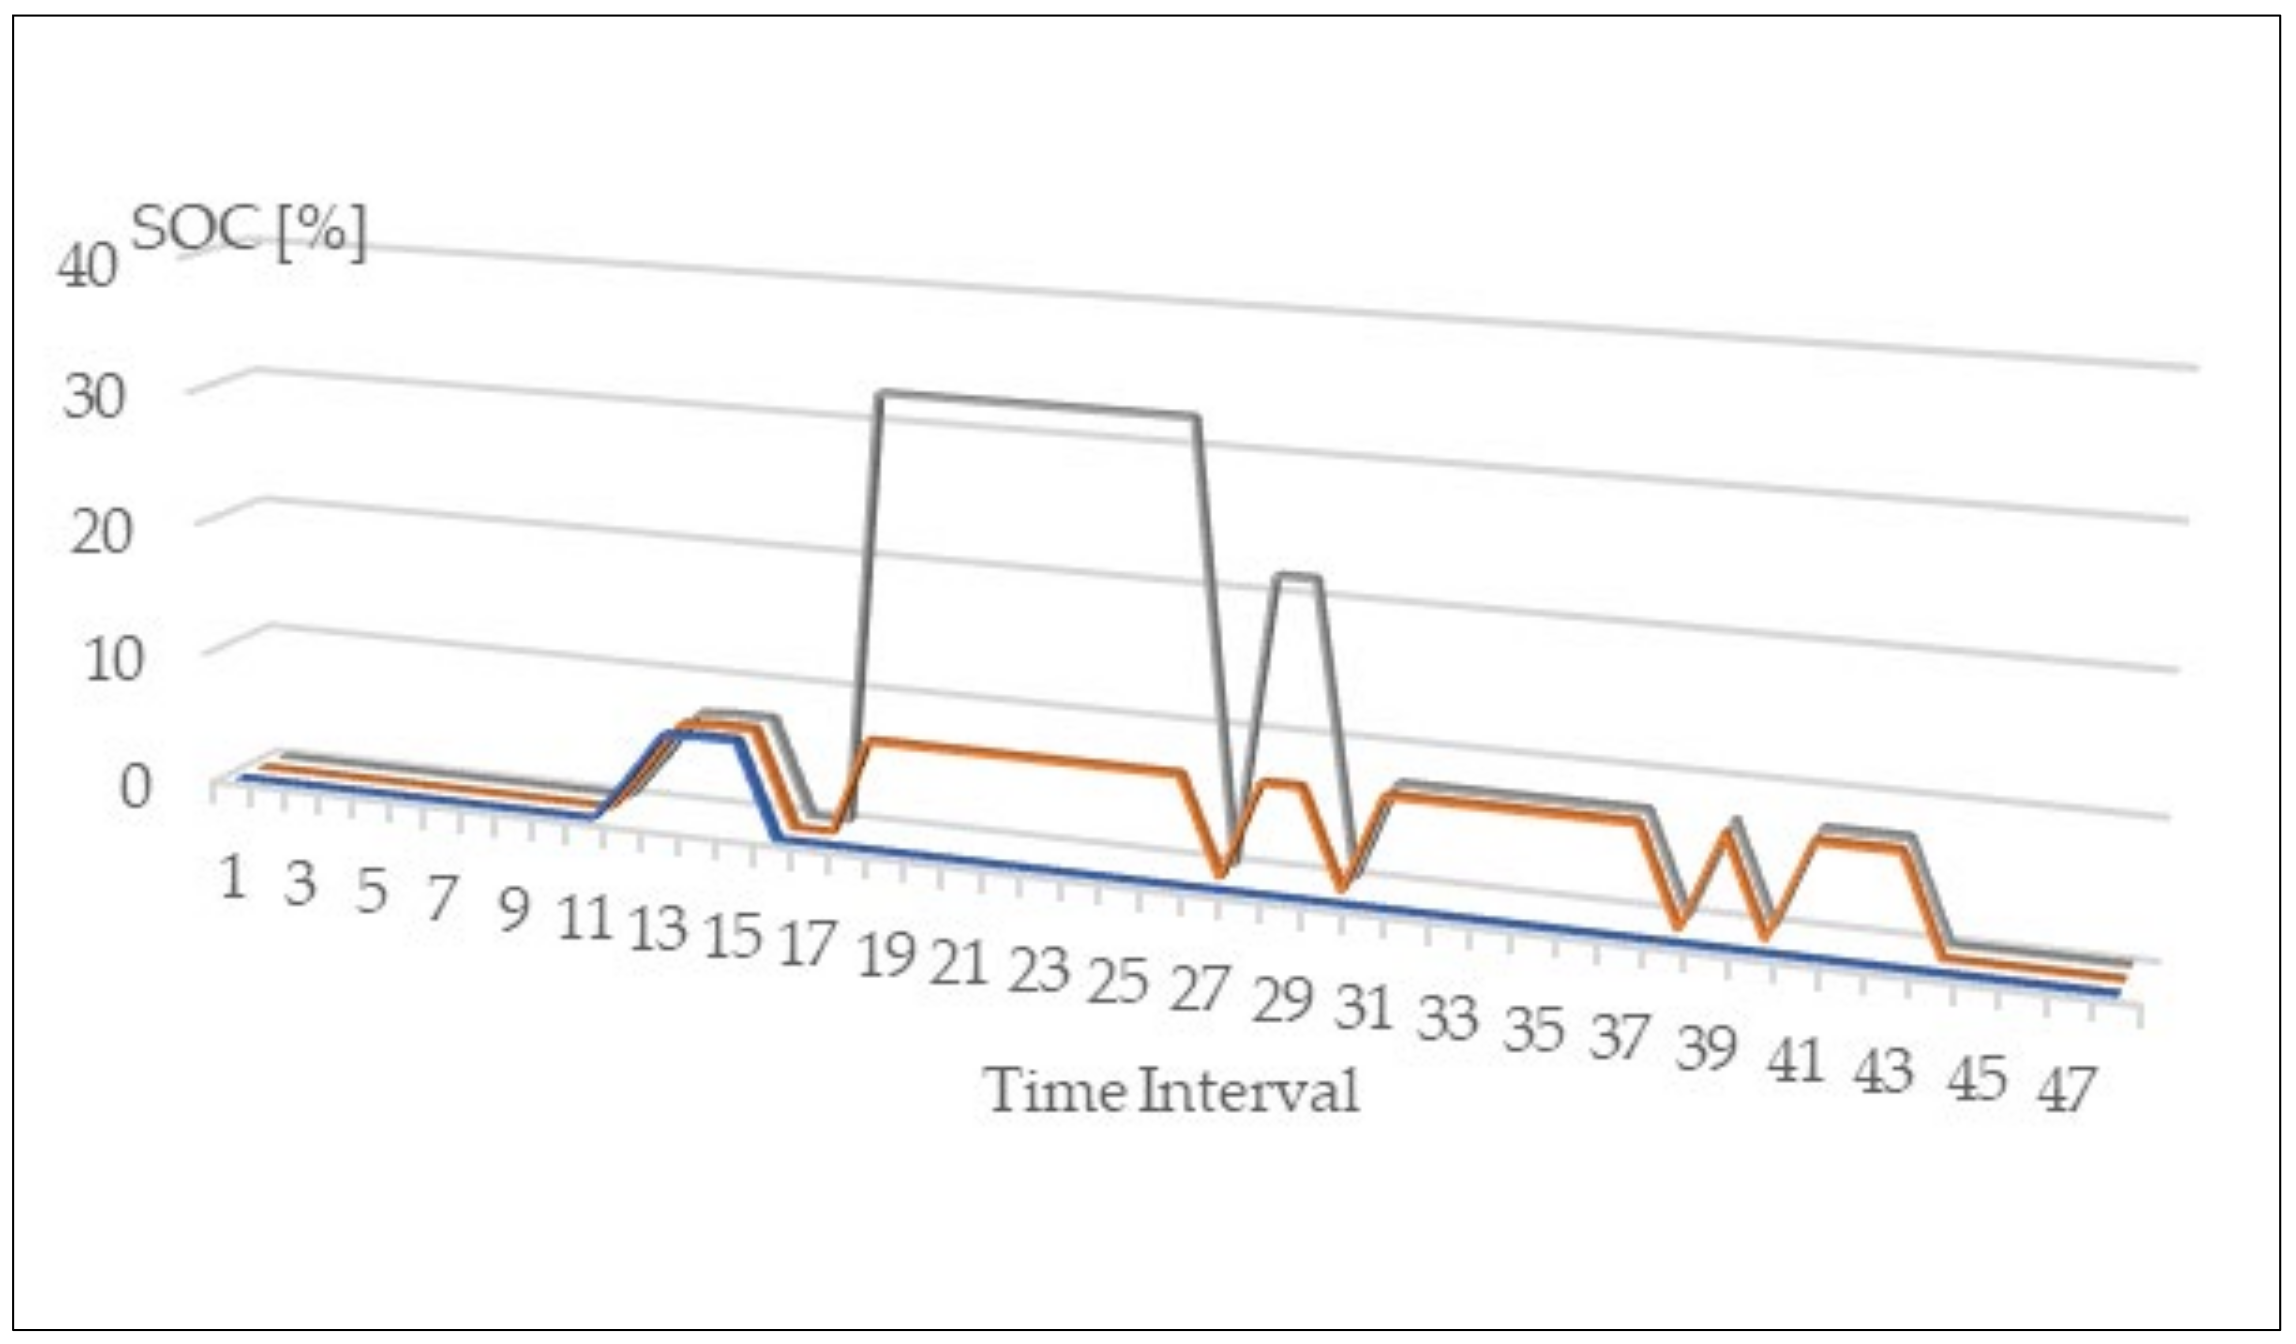
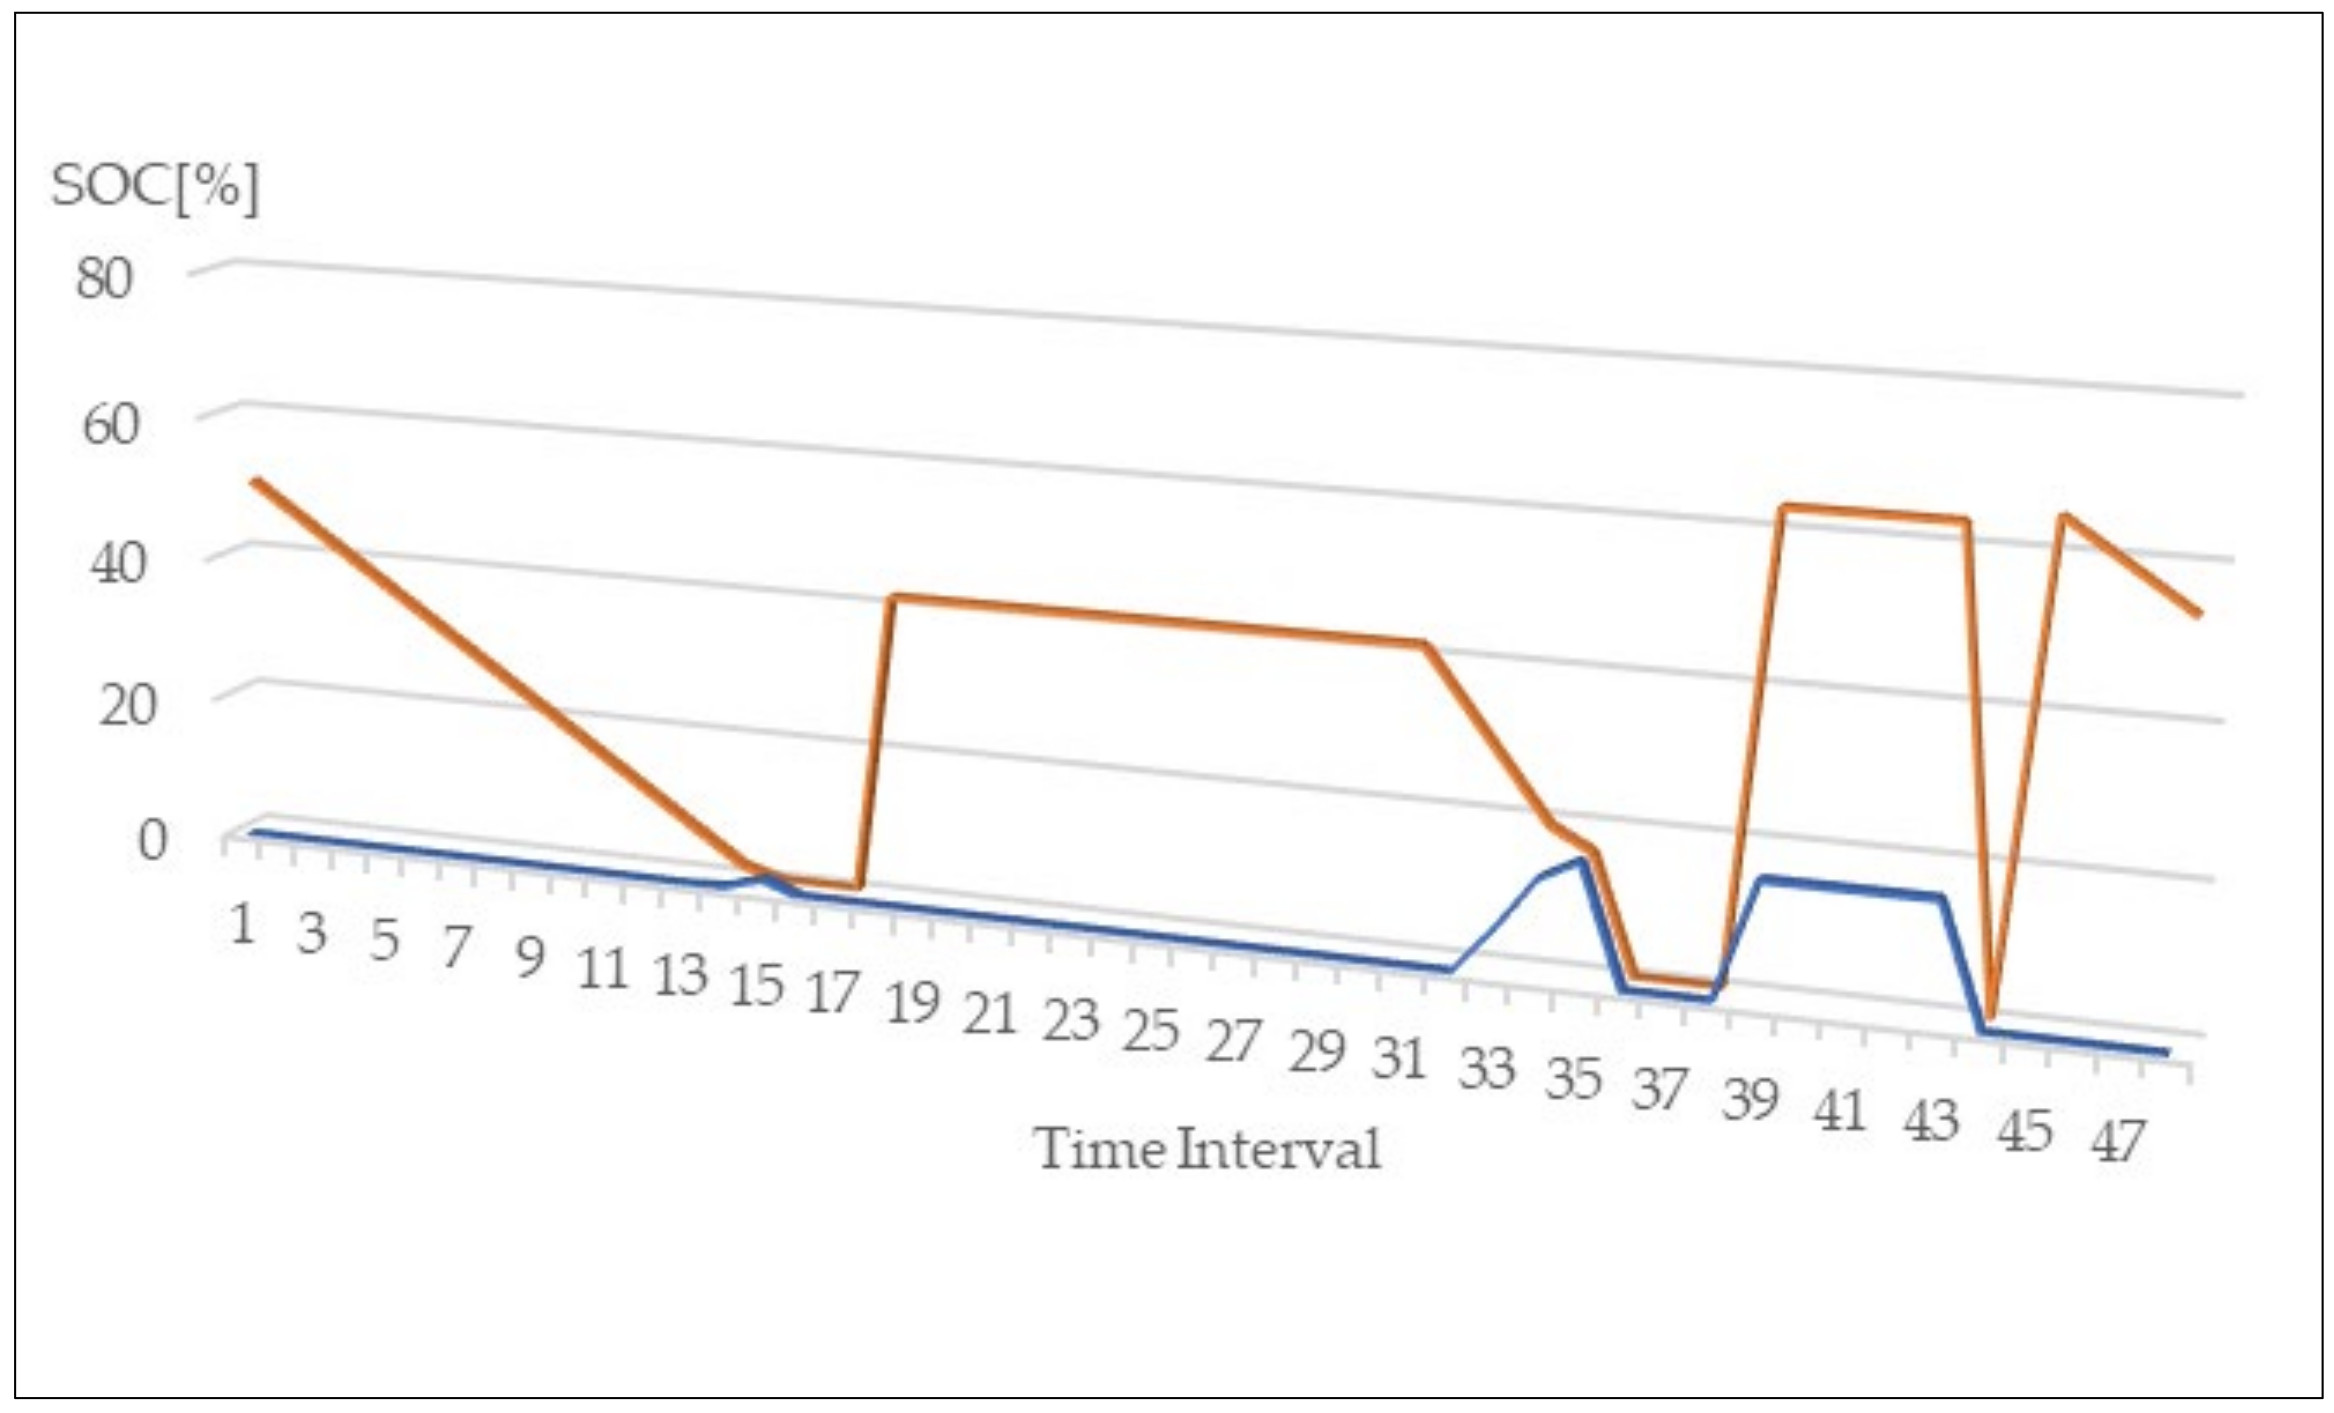
5.1. EV Flexibility Capacity Model
5.1.1. Mobility Pattern 1
5.1.2. Mobility Pattern 2
- (a)
- Charging scenario 1: using the SHW only;
- (b)
- Charging scenario 2: using both the SHW and the PCS;
- (c)
- Charging scenario 3: using both the SHW and the PCS, in which the method of calculating the minimum SOC of mobility has been changed. The energy necessary for mobility needs, with reference to the time slot 8:30/13:00, considers only the need to return home and to the workplace by 15:00, and in this way the up-flexibility increases.
5.1.3. Mobility Pattern 3
6. Economic Analysis
6.1. Use Case 1
6.1.1. Mobility Pattern 1
- Basic solution: in this case, the upward flexibility is offered in the time slot 5:00/8:00 by the SHW and 8:30/9:30 by the PCS.
- Solution A: the upward flexibility is offered only by the PCS during working hours.
- Solution B: this is a situation like scenario A in terms of recharging infrastructure, but which has a maximum SOC value of the storage system equal to 90%.
6.1.2. Mobility Pattern 2
- Basic solution: the up-flexibility service is offered during the morning, providing an afternoon recharge by the PCS at the workplace.
- Solution A: the flexibility service is offered in the same range as the basic solution, with the aim of minimizing recharging from the PCS.
- Solution B: in this scenario, the up-and-downward flexibility service is offered by the SHW in the time slot 6:00/7:30 and subsequently also by the PCS.
6.1.3. Mobility Pattern 3
- Basic solution: the EV during the early morning hours (8: 30/10: 00) provides the pick-up service and recharges in the afternoon to meet mobility needs.
- Solution A: the energy recharged by the PCS is minimized, increasing energy exchanges by the SHW.
6.2. Use Case 1 Discussion
7. Use Case 2
7.1. EV Fleet Configuration
7.2. Economic Benefits Evaluation
7.2.1. Mobility Pattern 1
- Solution A: the EV offers the upward flexibility in the time slots 06:30/08:00 a.m. and 08:00/09:00 p.m. by the SHW, while the recharging takes place in night and morning at home.
- Solution A*: the connection time to the home charging infrastructure is minimized, sufficient to reach the workplace with a residual SOC equal to 35% and so to charge the EV during the working hours using the PCS and the PV generation.
- Solution A**: which derives from solution A* providing that the recharge in the 09:00/11:00 a.m. time slot takes place as a downward flexibility service offer, benefiting from a lower cost than the supply contractual condition as well as deleting the cost of charges and transport components.
7.2.2. Mobility Pattern 2
- Solution A: the recharging is in the morning by the PCS replacing the discharge of the battery pack to provide the up-ward flexibility service respect to the mobility pattern 1. A charging at night allows to reach a charge level of 90% so to meet the end user’s daily mobility needs for the next day.
- Solution A*: Unlike solution A, SOC increases during the morning hours and a controlled discharge is also provided (upward flexibility service) during the time slot 08:00/09:30 p.m.
- Solution A**: similar to the case of mobility pattern 1.
7.2.3. Mobility Pattern 3
7.3. Use Case 2 Discussion
- (a)
- Scenario B: return of some tariff components relating to the energy withdrawn from the grid and subsequently reinjected.
- (b)
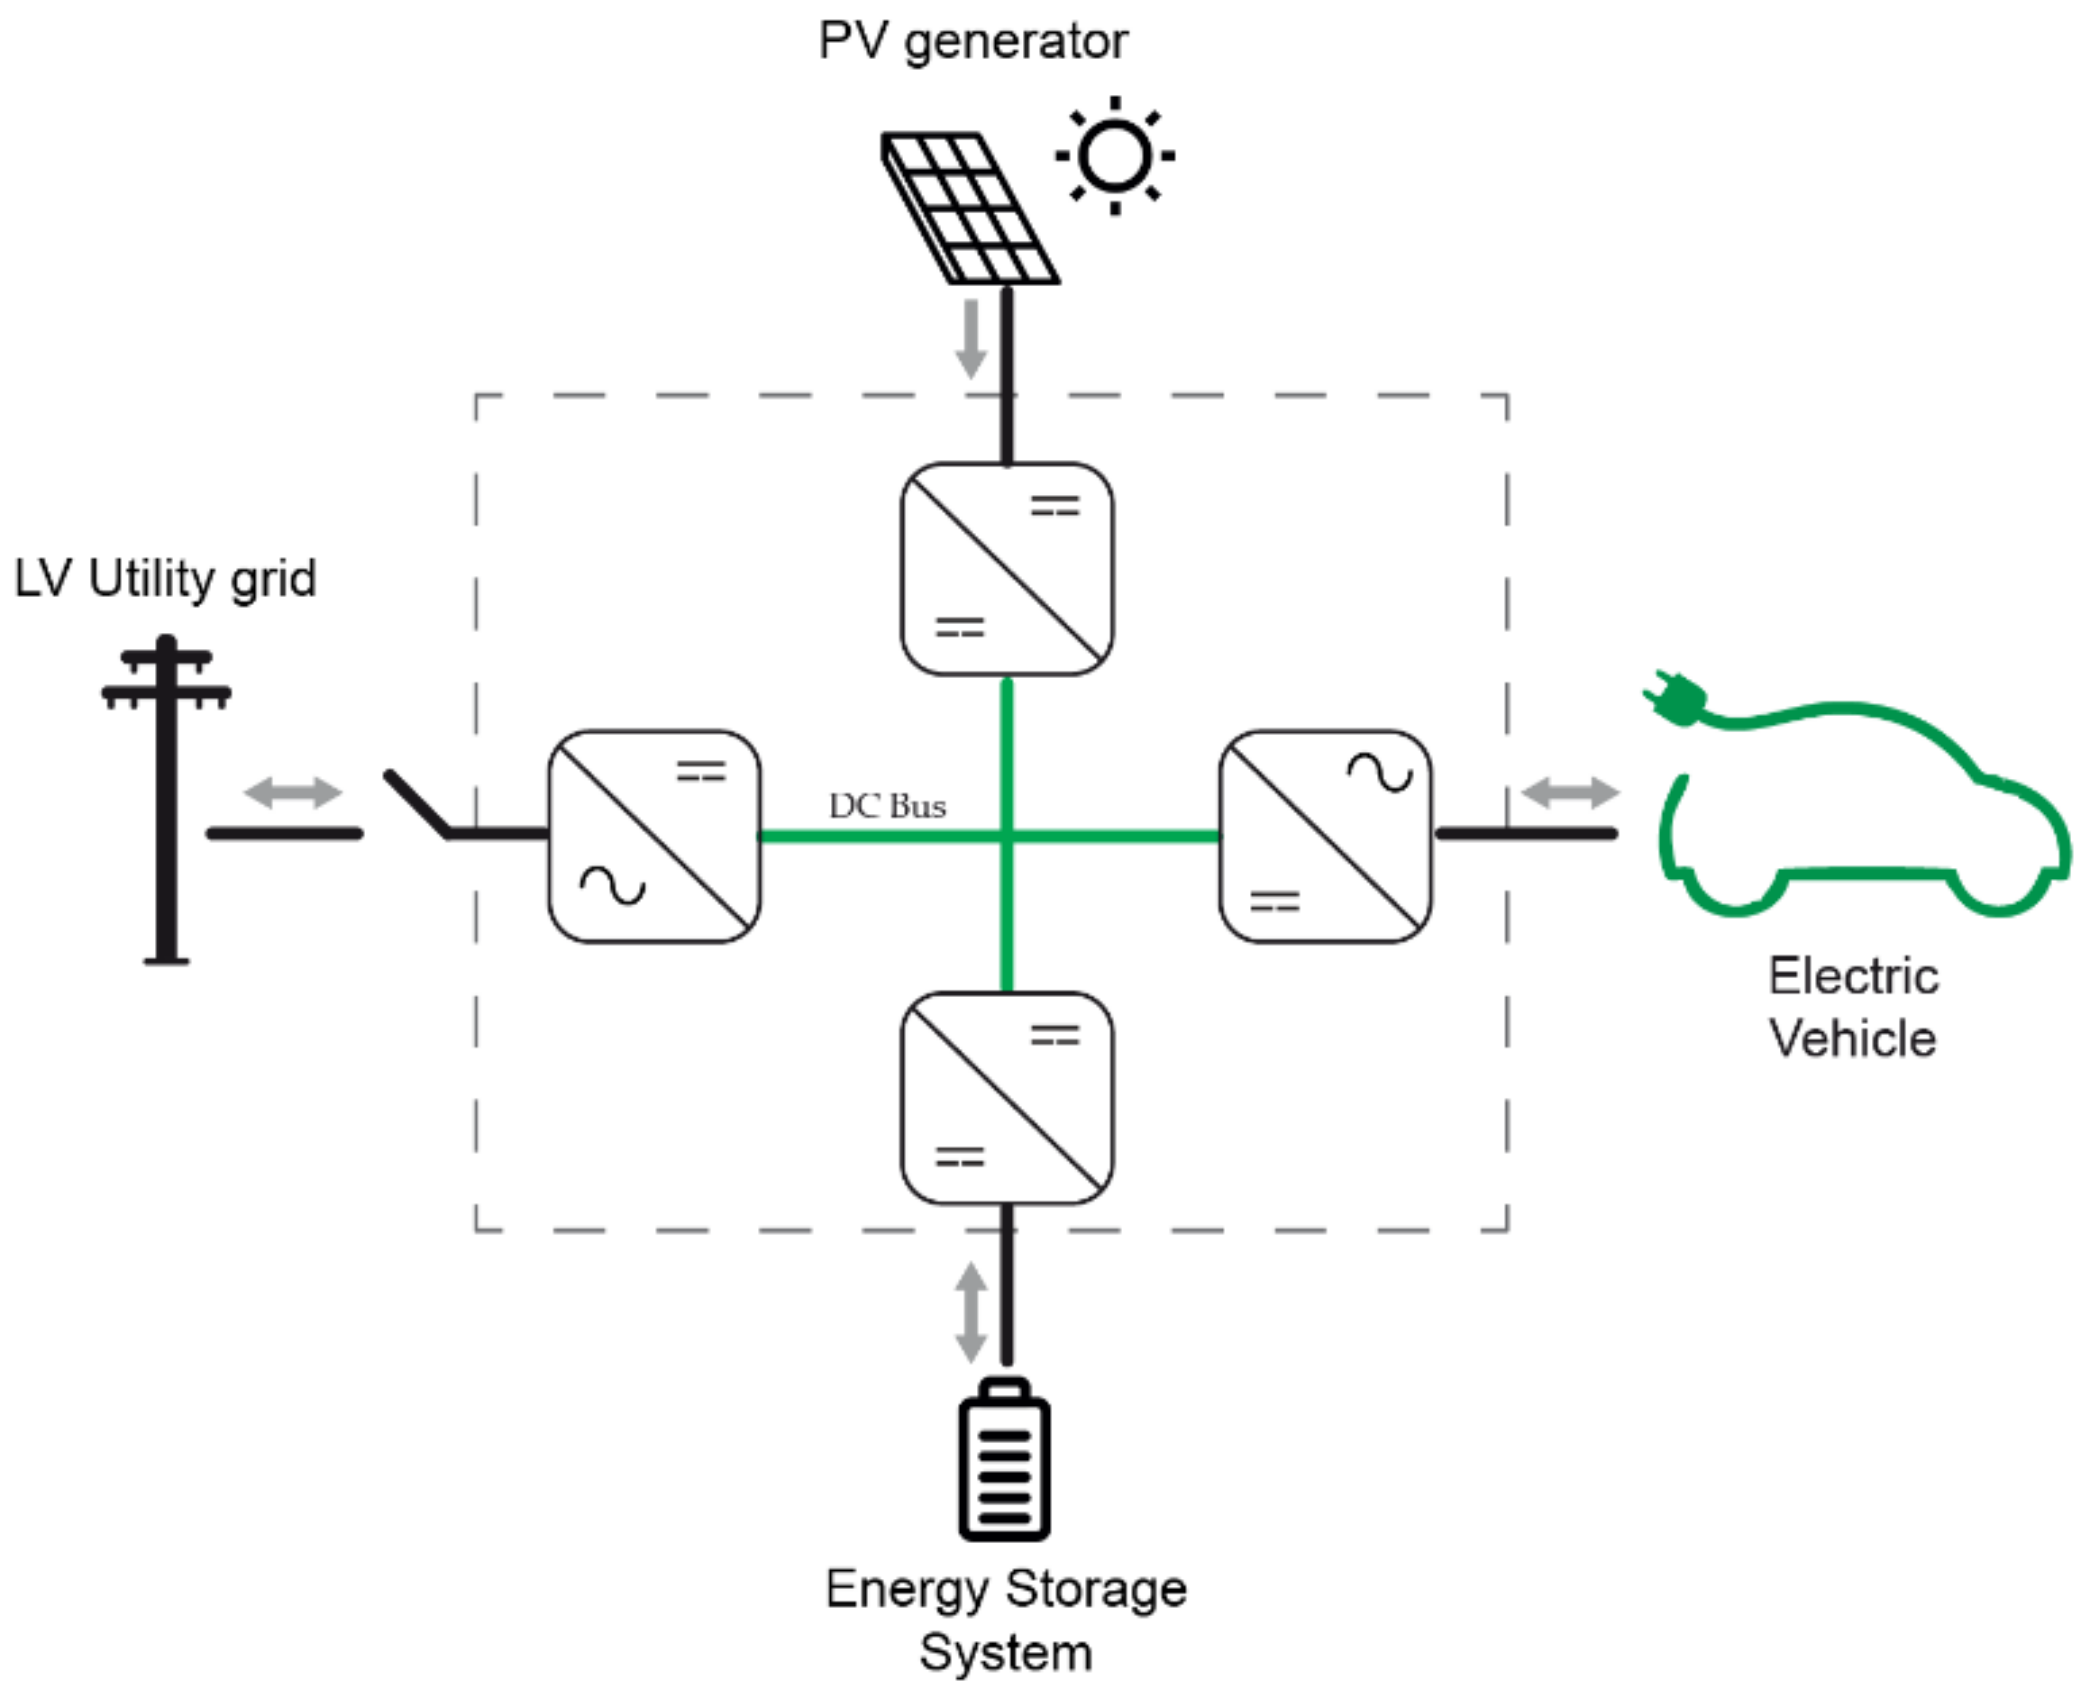
- Scenario C: return of some tariff components relating to the energy adsorbed from the grid and subsequently reinjected, to which is added the possibility of recharging the EV using local generation as self-consumption (PV and/or storage system), as illustrated in Figure 13. It is supposed that the PV plant already exists and only a part of its energy is used to supply the EV, in particular, the self-produced energy by the PV plant will be equal to the 50% of the energy consumed by the SWH.
7.3.1. Scenario “B”
7.3.2. Scenario “C”
7.4. Final Use Case 2 Discussion
8. Conclusions
8.1. Economic Charging Conditions
8.2. RES Generation and Self-Consumption
8.3. Flexibility Service Remuneration
8.4. UVAM Fixed Benefit
8.5. Summary Economic Results
Author Contributions
Funding
Institutional Review Board Statement
Informed Consent Statement
Data Availability Statement
Conflicts of Interest
Abbreviations
| ARERA | Italian Regulatory Authority for Energy, Networks and the Environment |
| DSM | Dispatching Services Market |
| EV | Electric Vheicle |
| EVSE | Electric Vehicle Supply Equipment |
| NEDC | New Europea Driving Cycle |
| PCS | Public Charge Station |
| PV | Photovoltaic |
| RES | Renewable Energy Sources |
| SHW | Smart Home Wall box |
| SO | System Operator |
| SOC | State of Charge |
| TSO | Transmission System Operator |
| V1G | Smart Unidirectional Charge |
| V2G | Vehicle-to-Grid (bidirectional) |
References
- Gubernali, A.; Salvati, R.; Zaottini, R. Partecipazione alla Regolazione di Frequenza e Frequenza-Potenza. Terna Codice di Rete, 2008, Allegato A15. Available online: https://download.terna.it/terna/0000/0105/32.pdf (accessed on 25 January 2022).
- Habibi, M.; Vahidinasab, V.; Shafie-khah, M.; Catalão, J.P. Coordinated scheduling of energy storage systems as a fast reserve provider. Int. J. Electr. Power Energy Syst. 2021, 130, 106941. [Google Scholar] [CrossRef]
- ARERA. Authority for Electricity Gas and the Water System. Deliberazione R/EEL, n. 300/2017. 2017. Available online: https://www.arera.it/allegati/docs/17/300-17 (accessed on 25 January 2022).
- MISE. Ministry of Economic Development. Criteri e Modalita’ per Favorire la Diffusione Della Tecnologia di Integrazione tra i Veicoli Elettrici e la Rete Elettrica, Denominata Vehicle to Grid. 2020, Decree January 30, 2020, GU n.37 del 14-2-2020. Available online: https://www.mise.gov.it/images/stories/normativa/DM_30-01-2020.pdf (accessed on 25 January 2022).
- Ravi, S.S.; Aziz, M. Utilization of Electric Vehicles for Vehicle-to-Grid Services: Progress and Perspectives. Energies 2022, 15, 589. [Google Scholar] [CrossRef]
- Sovacool, B.K.; Kester, J.; Noel, L.; de Rubens, G.Z. Actors, business models, and innovation activity systems for vehicle-to-grid (V2G) technology: A comprehensive review. Renew. Sustain. Energy Rev. 2020, 131, 109963. [Google Scholar] [CrossRef]
- Karnouskos, S.; De Holanda, T.N. Simulation of a smart grid city with software agents. In Proceedings of the IEEE Third UkSim European Symposium on Computer Modeling and Simulation, Athens, Greece, 25–27 November 2009. [Google Scholar]
- Pillai, J.R.; Bak-Jensen, B. Impacts of electric vehicle loads on power distribution systems. In Proceedings of the IEEE Vehicle Power and Propulsion Conference, Lille, France, 1–3 September 2010. [Google Scholar]
- Shumei, C.; Xiaofei, L.; Dewen, T.; Qianfan, Z.; Liwei, S. The construction and simulation of V2G system in micro-grid. In Proceedings of the IEEE International Conference on Electrical Machines and Systems, Beijing, China, 20–23 August 2011. [Google Scholar]
- Arancibia, A.; Strunz, K. Modeling of an electric vehicle charging station for fast DC charging. In Proceedings of the 2012 IEEE International Electric Vehicle Conference, Greenville, SC, USA, 4–8 March 2012. [Google Scholar]
- Cardoso, G.; Stadler, M.; Bozchalui, M.C.; Sharma, R.; Marnay, C.; Barbosa-Póvoa, A.; Ferrão, P. Optimal investment and scheduling of distributed energy resources with uncertainty in electric vehicle driving schedules. Energy 2014, 64, 17–30. [Google Scholar] [CrossRef]
- The Distributed Energy Resources Customer Adoption Model (DER-CAM). Available online: https://gridintegration.lbl.gov/der-cam (accessed on 25 January 2022).
- Novosel, T.; Perković, L.; Ban, M.; Keko, H.; Pukšec, T.; Krajačić, G.; Duić, N. Agent based modelling and energy planning–utilization of MatSim for transport energy demand modelling. Energy 2015, 92, 466–475. [Google Scholar] [CrossRef] [Green Version]
- Canizes, B.; Soares, J.; Costa, A.; Pinto, T.; Lezama, F.; Novais, P.; Vale, Z. Electric vehicles’ user charging behaviour simulator for a smart city. Energies 2019, 12, l470. [Google Scholar] [CrossRef] [Green Version]
- Wenzel, G.; Negrete-Pincetic, M.; Olivares, D.E.; MacDonald, J.; Callaway, D.S. Real-time charging strategies for an electric vehicle aggregator to provide ancillary services. IEEE Trans. Smart Grid 2017, 9, 5141–5151. [Google Scholar] [CrossRef] [Green Version]
- Clairand, J.M. Participation of electric vehicle aggregators in ancillary services considering users’ preferences. Sustainability 2020, 12, 8. [Google Scholar] [CrossRef] [Green Version]
- Osório, G.J.; Lotfi, M.; Gough, M.; Javadi, M.; Espassandim, H.M.; Shafie-khah, M.; Catalão, J.P. Modeling an electric vehicle parking lot with solar rooftop participating in the reserve market and in ancillary services provision. J. Clean. Prod. 2021, 318, 128503. [Google Scholar] [CrossRef]
- Rossini, M.; Sandroni, C.; Vignali, R. A stochastic optimization approach to the aggregation of electric vehicles for the provision of ancillary services. IFAC-PapersOnLine 2020, 53, 7431–7438. [Google Scholar] [CrossRef]
- Sortomme, E.; El-Sharkawi, M.A. Optimal combined bidding of vehicle-to-grid ancillary services. IEEE Trans. Smart Grid 2011, 3, 70–79. [Google Scholar] [CrossRef]
- Sortomme, E.; El-Sharkawi, M.A. Optimal scheduling of vehicle-to-grid energy and ancillary services. IEEE Trans. Smart Grid 2011, 3, 351–359. [Google Scholar] [CrossRef]
- Al-Obaidi, A.A.; Farag, H.E. Electric Vehicles Optimal Scheduling for Peer-to-Peer Energy Trade and Ancillary Services Provision to the Grid. In Proceedings of the IEEE Power & Energy Society General Meeting, Montreal, QC, Canada, 3–6 August 2020. [Google Scholar]
- Michael, N.E.; Hasan, S.; Mishra, S. Virtual inertia provision through data center and electric vehicle for ancillary services support in microgrid. IET Renew. Power Gener. 2020, 14, 3792–3801. [Google Scholar] [CrossRef]
- Gough, R.; Dickerson, C.; Rowley, P.; Walsh, C. Vehicle-to-grid feasibility: A techno-economic analysis of EV-based energy storage. Appl. Energy 2017, 192, 12–23. [Google Scholar] [CrossRef] [Green Version]
- Das, R.; Wang, Y.; Putrus, G.; Kotter, R.; Marzband, M.; Herteleer, B.; Warmerdam, J. Multi-objective techno-economic-environmental optimisation of electric vehicle for energy services. Appl. Energy 2020, 257, 113965. [Google Scholar] [CrossRef]
- Huda, M.; Koji, T.; Aziz, M. Techno economic analysis of vehicle to grid (V2G) integration as distributed energy resources in Indonesia power system. Energies 2020, 13, 1162. [Google Scholar] [CrossRef] [Green Version]
- Latini, L.; Armani, F.B.; Leva, S.; Di Ninno, F.; Ravina, G. Economics of Vehicle-to-Grid application for providing ancillary services in Italy. In Proceedings of the IEEE Milan PowerTech, Milan, Italy, 23–27 June 2019; pp. 1–6. [Google Scholar]
- Borghetti, F.; Colombo, C.G.; Longo, M.; Mazzoncini, R.; Panarese, A.; Somaschini, C. Vehicle-To-Grid: A Case Study of ATM E-Bus Depots in the City of Milan in Italy. In Proceedings of the AEIT International Annual Conference (AEIT), Milan, Italy, 4–8 October 2021; pp. 1–6. Available online: https://convegni.aeit.it/aeit2021 (accessed on 18 February 2022).
- Moncecchi, M.; Rancilio, G.; Dimovski, A.; Bovera, F. Smart Charging Algorithm for Flexibility Provision with Electric Vehicle Fleets. In Proceedings of the IEEE 15th International Conference on Compatibility, Power Electronics and Power Engineering (CPE-POWERENG), Florence, Italy, 14–16 July 2021; pp. 1–8. [Google Scholar]
- Urbanelli, A.; Sallati, A.; Ciasca, F.; Aluisio, B.; Vergine, C.; Zeni, L.; Trovato, M. Electric vehicle grid impacts Opportunities and evaluation on the Italian Trasmission Grid. In Proceedings of the AEIT International Annual Conference, Bari, Italy, 3–5 October 2018; pp. 1–6. [Google Scholar]
- Regulation No 101 of the Economic Commission for Europe of the United Nations (UN/ECE). Uniform Provisions Concerning the Approval of Passenger Cars Powered by an Internal Combustion Engine only, or Powered by a Hybrid Electric Power Train with Regard to the Measurement of the Emission of Carbon Dioxide and Fuel Consumption and/or the Measurement of Electric Energy Consumption and Electric Range, and of Categories M1 and N1 Vehicles Powered by an Electric Power Train only with Regard to the Measurement of Electric Energy Consumption and Electric Range. Off. J. Eur. Union 2012, 138, 1–77. Available online: https://eur-lex.europa.eu/legal-content/EN/TXT/?uri=CELEX:42012X0526(01) (accessed on 25 January 2022).
- Boni, R. Prova su strada Opel Corsa-E. Quattroruote 2021, 786. Available online: https://www.autoblog.it/post/opel-corsa-e-prova-su-strada (accessed on 25 January 2022).
- TERNA. Regolamento Recante le Modalità per la Creazione, Qualificazione e Gestione di unità Virtuali Abilitate Miste (UVAM) al Mercato dei Servizi di Dispacciamento. 2019. Available online: https://download.terna.it/terna/0000/1117/98.PDF (accessed on 25 January 2022).
- ARERA. Orientamenti Relativi Alla Partecipazione dei Veicoli Elettrici al Mercato per i Servizi di Dispacciamento, per il Tramite Delle Infrastrutture di Ricarica Dotate di Tecnologia Vehicle to Grid; Documento per la Consultazione 201/2020/R/EEL, 3 June 2020; ARERA: Milan, Italy, 2020; Available online: https://www.arera.it/allegati/docs/20/201-20.pdf (accessed on 25 January 2022).
- Repubblica Italiana. Decreto-Legge 19 maggio 2020, n. 34 “Misure Urgenti in Materia di Salute, Sostegno al Lavoro e all’Economia, Nonché di Politiche Sociali Connesse all’Emergenza Epidemiologica da COVID-19”, Gazzetta Ufficiale della Repubblica Italiana. 2020. Available online: https://www.gazzettaufficiale.it/eli/id/2020/05/19/20G00052/sg (accessed on 25 January 2022).
- Mutani, G.; Santantonio, S.; Beltramino, S. Indicators and Representation Tools to Measure the Technical-Economic Feasibility of a Renewable Energy Community. The Case Study of Villar Pellice (Italy). Planning 2021, 16, 1–11. [Google Scholar] [CrossRef]


| Op. Number | Type | Acceleration [m/s2] | Speed [km/h] | Duration | Time [s] |
|---|---|---|---|---|---|
| 1 | Stop | 0 | 0 | 11 | 11 |
| 2 | Acceleration | 1.04 | 0–15 | 4 | 15 |
| 3 | Constant Speed | 0 | 15 | 8 | 23 |
| 4 | Deceleration | −0.83 | 15–0 | 5 | 28 |
| 5 | Stop | 0 | 0 | 21 | 49 |
| 6 | Acceleration | 0.69 | 0–15 | 6 | 55 |
| 7 | Acceleration | 0.79 | 15–32 | 6 | 61 |
| 8 | Constant Speed | 0 | 32 | 24 | 85 |
| 9 | Deceleration | −0.81 | 32–0 | 11 | 96 |
| 10 | Stop | 0 | 0 | 21 | 117 |
| 11 | Acceleration | 0.69 | 0–15 | 6 | 123 |
| 12 | Acceleration | 0.51 | 15–35 | 11 | 134 |
| 13 | Acceleration | −0.46 | 35–50 | 9 | 143 |
| 14 | Constant Speed | 0 | 50 | 12 | 155 |
| 15 | Deceleration | −0.52 | 50–35 | 8 | 163 |
| 16 | Constant Speed | 0 | 35 | 15 | 178 |
| 17 | Deceleration | −0.97 | 35–0 | 10 | 188 |
| 18 | Stop | 0 | 0 | 7 | 195 |
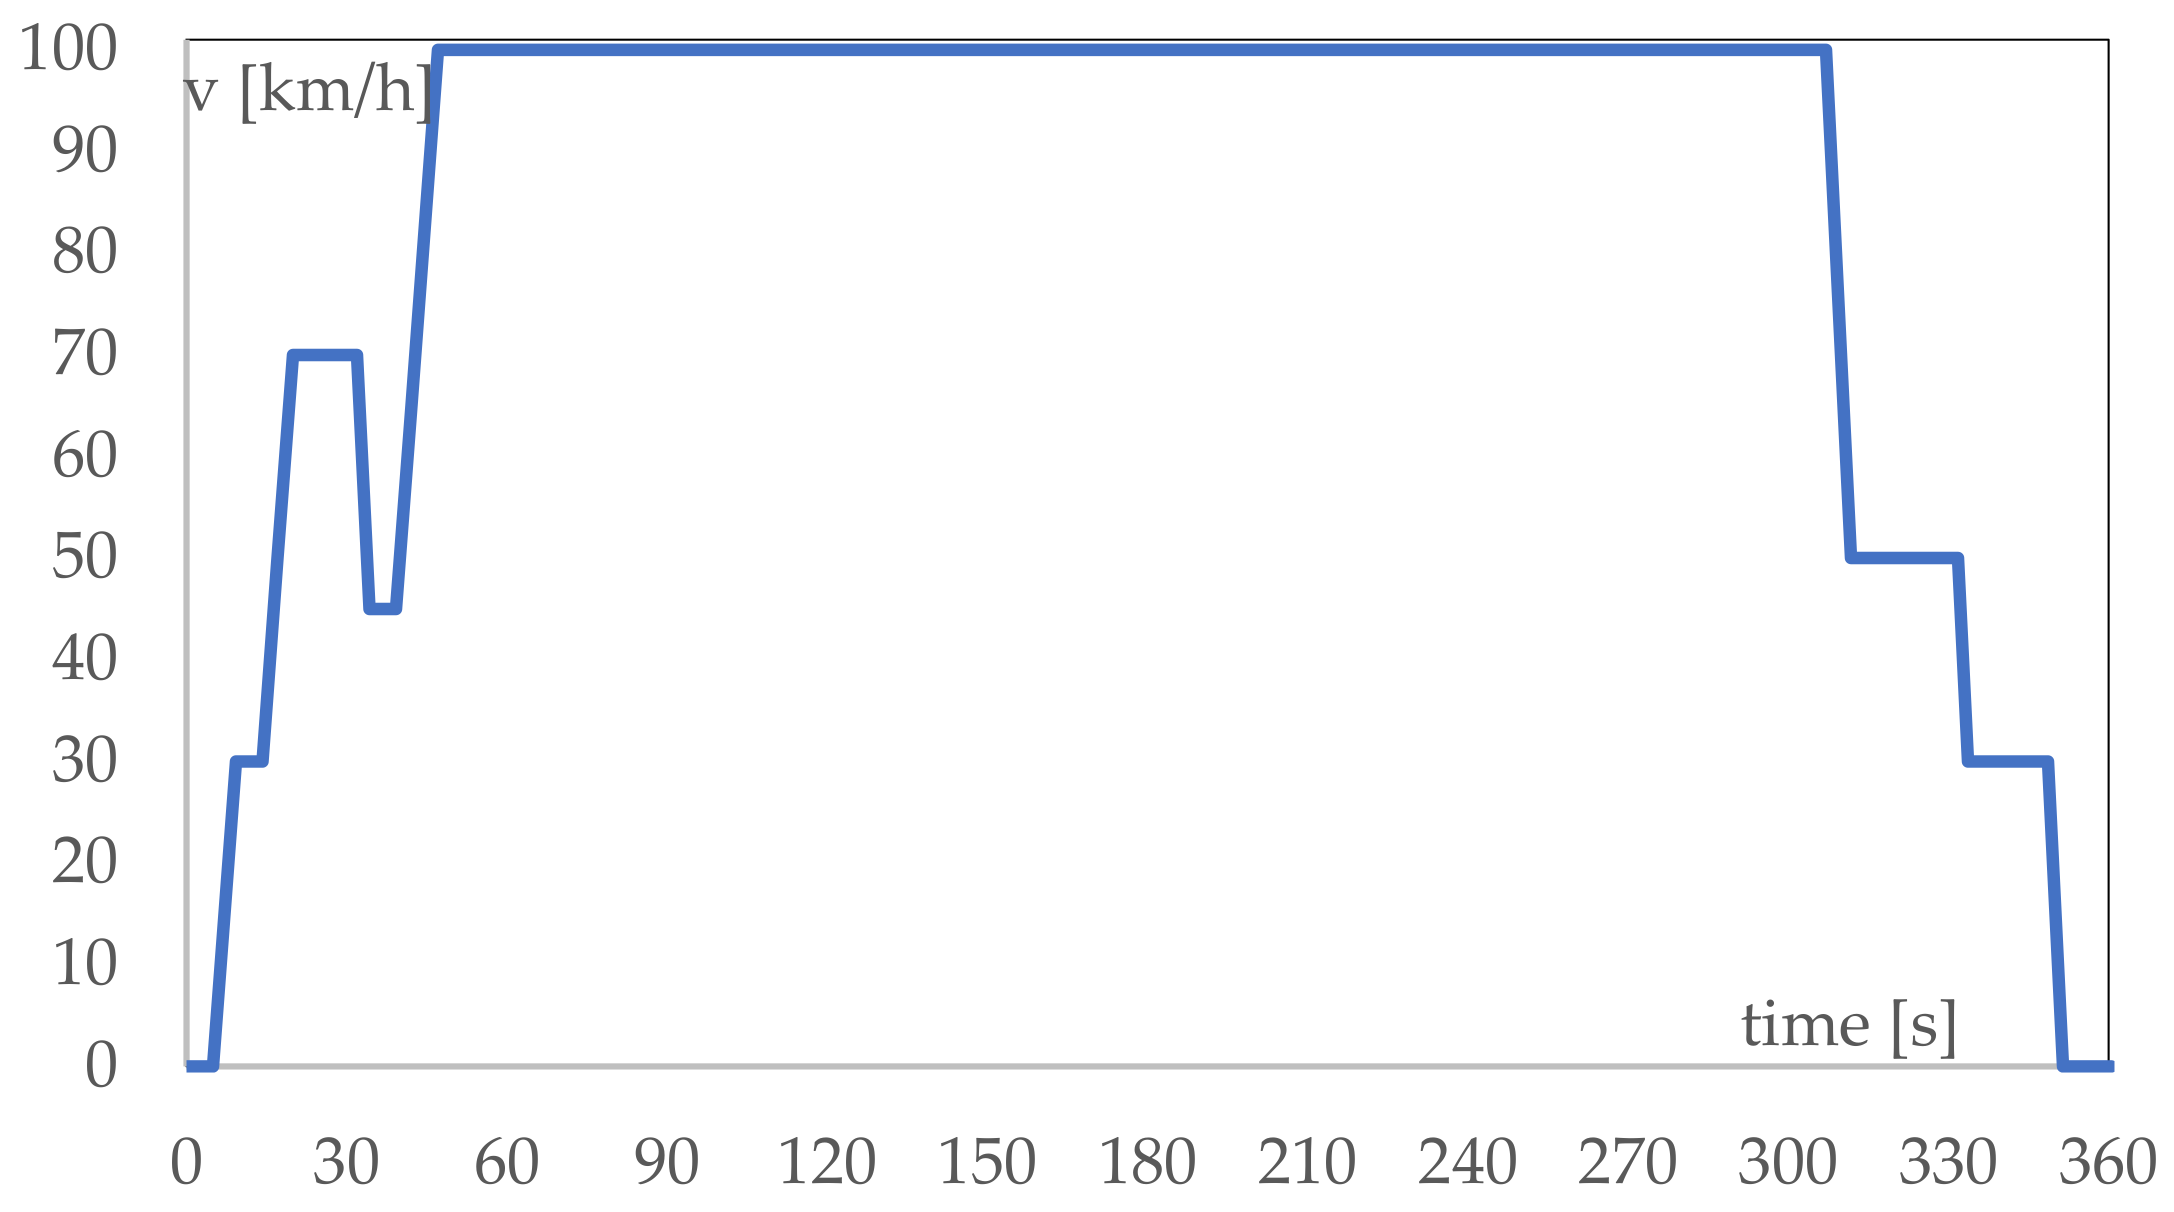
| Op. Number | Type | Acceleration [m/s2] | Speed [km/h] | Duration | Time [s] |
|---|---|---|---|---|---|
| 1 | Stop | 0 | 0 | 20 | 20 |
| 2 | Acceleration | 0.69 | 0–15 | 6 | 26 |
| 3 | Acceleration | 0.51 | 15–35 | 11 | 37 |
| 4 | Acceleration | 0.42 | 35–50 | 10 | 47 |
| 5 | Acceleration | 0.40 | 50–70 | 14 | 61 |
| 6 | Constant Speed | 0 | 70 | 50 | 111 |
| 7 | Deceleration | −0.69 | 70–50 | 8 | 119 |
| 8 | Constant Speed | 0 | 50 | 69 | 188 |
| 9 | Acceleration | 0.43 | 50–70 | 13 | 201 |
| 10 | Constant Speed | 0 | 70 | 50 | 251 |
| 11 | Acceleration | 0.24 | 70–100 | 35 | 286 |
| 12 | Constant Speed | 0 | 100 | 30 | 316 |
| 13 | Acceleration | 0.28 | 100–120 | 20 | 336 |
| 14 | Constant Speed | 0 | 120 | 10 | 346 |
| 15 | Deceleration | −0.69 | 120–80 | 16 | 362 |
| 16 | Deceleration | −1.04 | 80–50 | 8 | 370 |
| 17 | Deceleration | −1.39 | 50–0 | 10 | 380 |
| 18 | Stop | 0 | 0 | 20 | 400 |
| Time Interval | Route Type | Length [km] | Cycles Number |
|---|---|---|---|
| 8:00–8:30 | Urban | 12.28 | 10 |
| 13:00–13:30 | Urban | 12.28 | 10 |
| 14:30–15:00 | Urban | 12.28 | 10 |
| 18:30–19:00 | Urban | 12.28 | 10 |
| 19:00–19:30 | Urban | 12.28 | 10 |
| Time Interval | Route Type | Length [km] | Cycles Number |
|---|---|---|---|
| 7:30–8:00 | Urban | 12.28 | 10 |
| 8:00–8:30 | Extra-urban | 32.97 | 5 |
| 13:00–13:30 | Extra-urban | 32.97 | 5 |
| 14:30–15:00 | Extra-urban | 32.97 | 5 |
| 18:30–19:00 | Extra-urban | 32.97 | 5 |
| 19:30–20:00 | Urban | 12.28 | 10 |
| 21:30–22:00 | Urban | 12.28 | 10 |
| Time Interval | Route Type | Length [km] | Cycles Number |
|---|---|---|---|
| 7:30–8:00 | Extra-urban | 10.04 | 5 |
| 8:00–8:30 | Extra-urban | 10.04 | 5 |
| 17:30–18:00 | Extra-urban | 10.04 | 5 |
| 18:00–18:30 | Extra-urban | 10.04 | 5 |
| 18:30–19:00 | Urban | 2.88 | 10 |
| 21:30–22:00 | Urban | 2.88 | 10 |
| Characteristic | Value |
|---|---|
| Maximum Engine Power [kW] | 100 |
| Maximum Engine Torque [Nm] | 260 |
| Rated battery capacity [kWh] | 50 |
| Real battery capacity [kWh] | 45 |
| Frontal area [m2] | 2.089 |
| Aerodynamic Coefficient (CX) | 0.29 |
| Electrical efficiency (ηel) | 0.9 |
| Pneumatic radius [m] | 0.31 |
| Op. Number | Type | ||||
|---|---|---|---|---|---|
| 1 | Stop | 0 | 0 | 2 | 0.003 |
| 2 | Acceleration | 3425.8 | 10.2 | 13.37 | 0.011 |
| 3 | Constant Speed | 240.0 | 1.4 | 3.15 | 0.018 |
| 4 | Deceleration | −4566.6 | −11.8 | −7.44 | −0.004 |
| 5 | Stop | 0 | 0 | 2 | 0.010 |
| 6 | Acceleration | 3424.2 | 7.7 | 10.52 | 0.006 |
| 7 | Acceleration | 3442.6 | 24.2 | 28.85 | 0.019 |
| 8 | Constant Speed | 263.2 | 2.5 | 4.80 | 0.036 |
| 9 | Deceleration | −4560.8 | −18.9 | −13.08 | −0.011 |
| 10 | Stop | 0 | 0 | 2 | 0.008 |
| 11 | Acceleration | 3424.2 | 7.7 | 10.52 | 0.006 |
| 12 | Acceleration | 3445.4 | 25.7 | 30.59 | 0.024 |
| 13 | Acceleration | 3489.3 | 44.3 | 51.21 | 0.030 |
| 14 | Constant Speed | 318.1 | 4.8 | 7.28 | 0.071 |
| 15 | Deceleration | −4503.2 | −49.4 | −37.55 | −0.015 |
| 16 | Constant Speed | 270.7 | 2.8 | 5.14 | 0.039 |
| 17 | Deceleration | −4558.9 | −20.6 | −14.49 | −0.013 |
| 18 | Stop | 0 | 0 | 2 | 0.005 |
| Op. Number | Type | ||||
|---|---|---|---|---|---|
| 1 | Stop | 0 | 0 | 2 | 10 |
| 2 | Acceleration | 3430.5 | 15.4 | 19.0 | 81.0 |
| 3 | Constant Speed | 258.6 | 2.3 | 4.5 | 64.0 |
| 4 | Acceleration | 3481.6 | 41.6 | 48.2 | 136.5 |
| 5 | Acceleration | 3555.9 | 63.7 | 72.8 | 206.2 |
| 6 | Constant Speed | 407.3 | 8.5 | 11.4 | 802.3 |
| 7 | Deceleration | −4447.4 | −66.1 | −50.8 | −120.0 |
| 8 | Constant Speed | 300.4 | 4.0 | 6.4 | 162.2 |
| 9 | Acceleration | 3534.6 | 58.1 | 66.5 | 188.3 |
| 10 | Acceleration | 3645.4 | 84.4 | 95.7 | 338.9 |
| 11 | Constant Speed | 526.2 | 14.1 | 17.7 | 2657.6 |
| 12 | Deceleration | −4388.2 | −79.4 | −61.4 | −232.1 |
| 13 | Constant Speed | 318.1 | 4.8 | 7.2 | 254.7 |
| 14 | Deceleration | −4510.9 | −46.6 | −35.2 | −66.6 |
| 15 | Constant Speed | 258.6 | 2.3 | 4.5 | 114.4 |
| 16 | Deceleration | −4562.0 | −17.7 | −12.1 | −34.4 |
| 17 | Stop | 0 | 0 | 2 | 18 |
| Time Interval | Consumed Electric Energy [kWh] | Electric Energy Recovered [kWh] | Net Consumed Electric Energy [kWh] |
|---|---|---|---|
| 8:00–8:30 | 2.88 | −0.43 | 2.45 |
| 13:00–13:30 | 2.88 | −0.43 | 2.45 |
| 14:30–15:00 | 2.88 | −0.43 | 2.45 |
| 18:30–19:00 | 2.88 | −0.43 | 2.45 |
| 19:00–19:30 | 2.88 | −0.43 | 2.45 |
| Time Interval [h] | Consumed Electric Energy [kWh] | Electric Energy Recovered [kWh] | Net Consumed Electric Energy [kWh] | Length [km] | Charge Energy [kWh] |
|---|---|---|---|---|---|
| 0:00–0:30 | 0 | 0 | 0 | 0 | 0 |
| 0:30–1:00 | 0 | 0 | 0 | 0 | 0 |
| 1:00–1:30 | 0 | 0 | 0 | 0 | −1.67 |
| 1:30–2:00 | 0 | 0 | 0 | 0 | −1.67 |
| 2:00–2:30 | 0 | 0 | 0 | 0 | −1.67 |
| 2:30–3:00 | 0 | 0 | 0 | 0 | −1.67 |
| 3:00–3:30 | 0 | 0 | 0 | 0 | −1.67 |
| 3:30–4:00 | 0 | 0 | 0 | 0 | −1.67 |
| 4:00–4:30 | 0 | 0 | 0 | 0 | −1.67 |
| 4:30–5:00 | 0 | 0 | 0 | 0 | −0.47 |
| 5:00–8:00 | 0 | 0 | 0 | 0 | 0 |
| 8:00–8:30 | 2.85 | −0.43 | 2.42 | 12.28 | 0 |
| 8:30–13:00 | 0 | 0 | 0 | 0 | 0 |
| 13:00–13:30 | 2.85 | −0.43 | 2.42 | 12.28 | 0 |
| 13:30–14:30 | 0 | 0 | 0 | 0 | 0 |
| 14:30–15:00 | 2.85 | −0.43 | 2.42 | 12.28 | 0 |
| 15:00–18:30 | 0 | 0 | 0 | 0 | 0 |
| 18:30–19:00 | 2.85 | −0.43 | 2.42 | 12.28 | 0 |
| 19:00–19:30 | 2.85 | −0.43 | 2.42 | 12.28 | 0 |
| 19:30–24:0 | 0 | 0 | 0 | 0 | 0 |
| Time Interval | Consumed Electric Energy [kWh] | Electric Energy Recovered [kWh] | Net Consumed Electric Energy [kWh] |
|---|---|---|---|
| 7:30–8:00 | 2.85 | −0.43 | 2.45 |
| 8:00–8:30 | 6.99 | −0.63 | 6.36 |
| 13:00–13:30 | 6.99 | −0.63 | 6.36 |
| 14:30–15:00 | 6.99 | −0.63 | 6.36 |
| 18:30–19:00 | 6.99 | −0.63 | 6.36 |
| 19:30–20:00 | 2.85 | −0.43 | 2.45 |
| 21:30–22:00 | 2.85 | −0.43 | 2.45 |
| Time Interval [h] | Consumed Electric Energy [kWh] | Electric Energy Recovered [kWh] | Net Consumed Electric Energy [kWh] | Length [km] | Charge Energy [kWh] |
|---|---|---|---|---|---|
| 0:00–0:30 | 0 | 0 | 0 | 0 | −2.03 |
| 0:30–1:00 | 0 | 0 | 0 | 0 | −2.03 |
| 1:00–1:30 | 0 | 0 | 0 | 0 | −2.03 |
| 1:30–2:00 | 0 | 0 | 0 | 0 | −2.03 |
| 2:00–2:30 | 0 | 0 | 0 | 0 | −2.03 |
| 2:30–3:00 | 0 | 0 | 0 | 0 | −2.03 |
| 3:00–3:30 | 0 | 0 | 0 | 0 | −2.03 |
| 3:30–4:00 | 0 | 0 | 0 | 0 | −2.03 |
| 4:00–4:30 | 0 | 0 | 0 | 0 | −2.03 |
| 4:30–5:00 | 0 | 0 | 0 | 0 | −2.03 |
| 5:00–5:30 | 0 | 0 | 0 | 0 | −2.03 |
| 5:30–6:00 | 0 | 0 | 0 | 0 | −2.03 |
| 6:00–6:30 | 0 | 0 | 0 | 0 | −1.67 |
| 6:30–7:00 | 0 | 0 | 0 | 0 | −0.08 |
| 7:00–7:30 | 0 | 0 | 0 | 0 | 0.00 |
| 7:30–8:00 | 2.85 | −0.42 | 2.42 | 12.28 | 0 |
| 8:00–8:30 | 6.99 | −0.62 | 6.36 | 32.97 | 0 |
| 8:30–13:00 | 0 | 0 | 0.00 | 0 | 0 |
| 13:00–13:30 | 6.99 | −0.62 | 6.36 | 32.97 | 0 |
| 13:30–14:30 | 0 | 0 | 0.00 | 0 | 0 |
| 14:30–15:00 | 6.99 | −0.62 | 6.36 | 32.97 | 0 |
| 15:00–18:30 | 0 | 0 | 0.00 | 0 | 0 |
| 18:30–19:00 | 6.99 | −0.62 | 6.36 | 32.97 | 0 |
| 19:00–19:30 | 0 | 0 | 0.00 | 0 | 0 |
| 19:30–20:00 | 2.85 | −0.43 | 2.42 | 12.28 | 0 |
| 20:00–21:30 | 0 | 0 | 0.00 | 0 | 0 |
| 21:30–22:00 | 2.85 | −0.42 | 2.42 | 12.28 | 0 |
| 22:00–22:30 | 0 | 0 | 0.00 | 0 | −1.67 |
| 22:30–23:00 | 0 | 0 | 0.00 | 0 | −1.67 |
| 23:00–23:30 | 0 | 0 | 0.00 | 0 | −1.67 |
| 23:30–24:00 | 0 | 0 | 0.00 | 0 | −1.67 |
| Time Interval [h] | Consumed Electric Energy [kWh] | Electric Energy Recovered [kWh] | Net Consumed Electric Energy [kWh] | Length [km] | Charge Energy [kWh] |
|---|---|---|---|---|---|
| 0:00–0:30 | 0 | 0 | 0 | 0 | −1.67 |
| 0:30–1:00 | 0 | 0 | 0 | 0 | −1.67 |
| 1:00–1:30 | 0 | 0 | 0 | 0 | −1.67 |
| 1:30–2:00 | 0 | 0 | 0 | 0 | −1.67 |
| 2:00–2:30 | 0 | 0 | 0 | 0 | −1.67 |
| 2:30–3:00 | 0 | 0 | 0 | 0 | −1.67 |
| 3:00–3:30 | 0 | 0 | 0 | 0 | −1.67 |
| 3:30–4:00 | 0 | 0 | 0 | 0 | −1.67 |
| 4:00–4:30 | 0 | 0 | 0 | 0 | −1.67 |
| 4:30–5:00 | 0 | 0 | 0 | 0 | −1.67 |
| 5:00–5:30 | 0 | 0 | 0 | 0 | −1.67 |
| 5:30–6:00 | 0 | 0 | 0 | 0 | −1.67 |
| 6:00–6:30 | 0 | 0 | 0 | 0 | −1.67 |
| 6:30–7:00 | 0 | 0 | 0 | 0 | −1.67 |
| 7:00–7:30 | 0 | 0 | 0 | 0 | −0.73 |
| 7:30–8:00 | 10.03 | −0.73 | 9.30 | 41.92 | 0 |
| 8:00–8:30 | 10.03 | −0.73 | 9.30 | 41.92 | 0 |
| 8:30–15:30 | 0 | 0 | 0.00 | 0 | 0 |
| 15:30–16:00 | 0 | 0 | 0.00 | 0 | −3.33 |
| 16:00–16:30 | 0 | 0 | 0.00 | 0 | −3.33 |
| 16:30–17:30 | 0 | 0 | 0.00 | 0 | 0 |
| 17:30–18:00 | 10.03 | −0.73 | 9.30 | 41.92 | 0 |
| 18:00–18:30 | 10.03 | −0.73 | 9.30 | 41.92 | 0 |
| 18:30–19:00 | 2.85 | −0.42 | 2.42 | 12.28 | 0 |
| 19:00–21:30 | 0 | 0 | 0.00 | 0 | 0 |
| 21:30–22:00 | 2.85 | −0.42 | 2.42 | 12.28 | 0 |
| 22:00–22:30 | 0 | 0 | 0.00 | 0 | −1.67 |
| 22:30–23:00 | 0 | 0 | 0.00 | 0 | −1.67 |
| 23:00–23:30 | 0 | 0 | 0.00 | 0 | −1.67 |
| 23:30–24:00 | 0 | 0 | 0.00 | 0 | −1.67 |
| No Services to the Grid | Basic Solution | Solution A | Solution B | |
|---|---|---|---|---|
| Recharged energy from SWH [kWh] | 12.12 | 31.64 | 30.87 | 32.23 |
| Total cost [€] | 2.48 | 6.48 | 6.32 | 6.60 |
| Injected energy for upward services [kWh] | 0 | 18.81 | 18.68 | 19.98 |
| Revenue for upward services [€] | 0 | 1.64 | 1.74 | 1.86 |
| Net daily cost [€] | 2.48 | 4.84 | 4.59 | 4.74 |
| No Services to the Grid | Basic Solution | Solution A | Solution B | |
|---|---|---|---|---|
| Recharged energy from SWH (kWh) | 32.71 | 35.94 | 42.88 | 38.91 |
| Total cost [€] | 6.70 | 7.36 | 8.82 | 8.01 |
| Recharged energy from PCS | 0 | 11.26 | 4.33 | 5.99 |
| Total cost [€] | 0 | 5.08 | 1.95 | 2.71 |
| Injected energy for upward services [kWh] | 0 | 14.46 | 14.46 | 12.15 |
| Revenue for upward services [€] | 0 | 1.34 | 1.34 | 1.09 |
| Net daily cost [€] | 6.70 | 11.11 | 9.44 | 9.62 |
| No Services to the Grid | Basic Solution | Solution A | |
|---|---|---|---|
| Recharged energy from SWH (kWh) | 35.43 | 35.40 | 35.24 |
| Total cost [€] | 7.26 | 7.25 | 7.22 |
| Recharged energy from PCS | 6.66 | 16.65 | 15.18 |
| Total cost [€] | 3.00 | 7.52 | 6.85 |
| Injected energy for upward services [kWh] | 0 | 9.99 | 8.33 |
| Revenue for upward services [€] | 0 | 0.93 | 0.70 |
| Net daily cost [€] | 10.26 | 13.84 | 13.38 |
| No Services to the Grid | Solution A | Solution A* | Solution A** | |
|---|---|---|---|---|
| Recharged energy from SWH (kWh) | 12.19 | 27.81 | 5.56 | 5.56 |
| Total cost [€] | 2.27 | 5.70 | 1.14 | 1.14 |
| Recharged energy from PCS | 2.5 | 5.35 | 17.65 | 18.67 |
| Total cost [€] | 0 | 2.41 | 7.97 | 4.88 |
| Injected energy for upward services [kWh] | 0 | 22.37 | 13.32 | 13.32 |
| Revenue for upward services [€] | 0 | 2.01 | 1.21 | 1.21 |
| Net daily cost [€] | 2.5 | 5.57 | 7.36 | 4.27 |
| No Services to the Grid | Solution A | Solution A* | Solution A** | |
|---|---|---|---|---|
| Recharged energy from SWH (kWh) | 12.19 | 33.30 | 11.53 | 11.53 |
| Total cost [€] | 2.27 | 6.82 | 2.39 | 2.39 |
| Recharged energy from PCS | 2.5 | 5.18 | 17.65 | 18.67 |
| Total cost [€] | 0 | 2.34 | 7.97 | 4.88 |
| Injected energy for upward services [kWh] | 0 | 27.18 | 19.80 | 19.80 |
| Revenue for upward services [€] | 0 | 2.45 | 1.79 | 1.79 |
| Net daily cost [€] | 2.5 | 5.91 | 7.76 | 4.67 |
| No Services to the Grid | Solution A | Solution A* | Solution A** | |
|---|---|---|---|---|
| Recharged energy from SWH (kWh) | 32.73 | 36.13 | 27.27 | 27.27 |
| Total cost [€] | 6.71 | 7.40 | 5.62 | 5.62 |
| Recharged energy from PCS | 0 | 14.33 | 22.42 | 23.45 |
| Total cost [€] | 0 | 6.47 | 10.12 | 7.03 |
| Injected energy for upward services [kWh] | 0 | 19.98 | 19.98 | 19.98 |
| Revenue for upward services [€] | 0 | 1.81 | 1.81 | 1.81 |
| Net daily cost [€] | 6.71 | 11.53 | 13.39 | 10.30 |
| No Services to the Grid | Solution A | Solution A* | Solution A** | |
|---|---|---|---|---|
| Recharged energy from SWH (kWh) | 32.73 | 35.96 | 33.79 | 33.79 |
| Total cost [€] | 6.71 | 7.37 | 6.95 | 6.95 |
| Recharged energy from PCS | 0 | 17.30 | 19.56 | 20.12 |
| Total cost [€] | 0 | 7.81 | 8.83 | 5.74 |
| Injected energy for upward services [kWh] | 0 | 23.13 | 23.13 | 23.13 |
| Revenue for upward services [€] | 0 | 2.08 | 2.10 | 2.10 |
| Net daily cost [€] | 6.71 | 12.29 | 12.89 | 9.80 |
| No Services to the Grid | Solution A | Solution A* | |
|---|---|---|---|
| Recharged energy from SWH (kWh) | 35.43 | 37.09 | 37.09 |
| Total cost [€] | 7.26 | 7.60 | 7.60 |
| Recharged energy from PCS | 6.66 | 16.31 | 17.33 |
| Total cost [€] | 3.00 | 7.36 | 3.21 |
| Injected energy for upward services [kWh] | 0 | 13.32 | 13.32 |
| Revenue for upward services [€] | 0 | 1.20 | 1.20 |
| Net daily cost [€] | 10.26 | 13.22 | 9.07 |
| No Services to the Grid | Base Solution | Solution A* | Solution A** | |
|---|---|---|---|---|
| Recharged energy from SWH (kWh) | 12.19 | 27.81 | 5.56 | 5.56 |
| Total cost [€] | 2.50 | 5.70 | 1.14 | 1.14 |
| Recharged energy from PCS | 0 | 5.35 | 17.65 | 18.67 |
| Total cost [€] | 0 | 2.41 | 7.97 | 4.88 |
| Injected energy for upward services [kWh] | 0 | 22.37 | 13.32 | 13.32 |
| Revenue for upward services [€] | 0 | 2.01 | 1.21 | 1.21 |
| Return of tariff components [€] | 0 | 2.30 | 2.19 | 1.82 |
| Fixed fee [€] | 0 | 0.54 | 0.54 | 0.54 |
| Net daily cost [€] | 2.5 | 3.27 | 5.17 | 2.45 |
| No Services to the Grid | Base Solution | Solution A* | Solution A** | |
|---|---|---|---|---|
| Recharged energy from SWH (kWh) | 12.19 | 33.30 | 11.53 | 11.53 |
| Total cost [€] | 2.50 | 6.82 | 2.39 | 2.39 |
| Recharged energy from PCS | 0 | 5.18 | 17.65 | 18.67 |
| Total cost [€] | 0 | 2.34 | 7.97 | 4.88 |
| Injected energy for upward services [kWh] | 0 | 27.18 | 19.80 | 19.80 |
| Revenue for upward services [€] | 0 | 2.45 | 1.79 | 1.79 |
| Return of tariff components [€] | 0 | 2.72 | 2.94 | 2.35 |
| Fixed fee [€] | 0 | 0.8 | 0.8 | 0.8 |
| Net daily cost [€] | 2.5 | 3.19 | 4.82 | 2.32 |
| No Services to the Grid | Base Solution | Solution A* | Solution A** | |
|---|---|---|---|---|
| Recharged energy from SWH (kWh) | 32.73 | 36.13 | 27.27 | 27.27 |
| Total cost [€] | 6.71 | 7.40 | 5.62 | 5.62 |
| Recharged energy from PCS | 0 | 14.33 | 22.42 | 23.45 |
| Total cost [€] | 0 | 6.47 | 10.12 | 7.03 |
| Injected energy for upward services [kWh] | 0 | 19.98 | 19.98 | 19.98 |
| Revenue for upward services [€] | 0 | 1.81 | 1.81 | 1.81 |
| Return of tariff components [€] | 0 | 2.31 | 2.65 | 2.28 |
| Fixed fee [€] | 0 | 0.54 | 0.54 | 0.54 |
| Net daily cost [€] | 6.71 | 9.22 | 11.28 | 8.02 |
| No Services To The Grid | Base Solution | Solution A* | Solution A** | |
|---|---|---|---|---|
| Recharged energy from SWH (kWh) | 32.73 | 35.96 | 33.79 | 33.79 |
| Total cost [€] | 6.71 | 7.37 | 6.95 | 6.95 |
| Recharged energy from PCS | 0 | 17.30 | 19.56 | 20.12 |
| Total cost [€] | 0 | 7.81 | 8.83 | 5.74 |
| Injected energy for upward services [kWh] | 0 | 23.13 | 23.13 | 23.13 |
| Revenue for upward services [€] | 0 | 2.08 | 2.10 | 2.10 |
| Return of tariff components [€] | 0 | 2.77 | 2.87 | 2.39 |
| Fixed fee [€] | 0 | 0.8 | 0.8 | 0.8 |
| Net daily cost [€] | 6.71 | 9.52 | 10.02 | 7.41 |
| No Services to the Grid | Base Solution | Solution A* | |
|---|---|---|---|
| Recharged energy from SWH (kWh) | 35.43 | 37.09 | 37.09 |
| Total cost [€] | 7.26 | 7.60 | 7.60 |
| Recharged energy from PCS | 6.70 | 16.31 | 17.33 |
| Total cost [€] | 3.00 | 7.36 | 4.08 |
| Injected energy for upward services [kWh] | 0 | 13.32 | 13.32 |
| Revenue for upward services [€] | 0 | 1.20 | 1.20 |
| Return of tariff components [€] | 0 | 1.57 | 1.28 |
| Fixed fee [€] | 0 | 0.54 | 0.54 |
| Net daily cost [€] | 10.26 | 11.66 | 8.66 |
| No Services to the Grid | Base Solution | Solution A* | Solution A** | |
|---|---|---|---|---|
| Recharged energy from SWH (kWh) | 12.19 | 27.81 | 5.56 | 5.56 |
| Self-consumption energy recharged [kWh] | 0 | 13.90 | 2.78 | 2.78 |
| Total cost [€] without self-consumption | 2.50 | 5.70 | 1.14 | 1.14 |
| Total cost [€] with self-consumption | 0 | 2.85 | 0.57 | 0.57 |
| Recharged energy from PCS | 0 | 5.35 | 17.65 | 18.67 |
| Total cost [€] | 0 | 2.41 | 7.97 | 4.88 |
| Injected energy for upward services [kWh] | 0 | 22.37 | 13.32 | 13.32 |
| Revenue for upward services [€] | 0 | 2.01 | 1.21 | 1.21 |
| Return of tariff components [€] | 0 | 2.21 | 2.33 | 2.05 |
| Fixed fee [€] | 0 | 0.54 | 0.54 | 0.54 |
| Net daily cost [€] | 2.50 | 0.51 | 4.45 | 1.65 |
| No Services to the Grid | Base Solution | Solution A* | Solution A** | |
|---|---|---|---|---|
| Recharged energy from SWH (kWh) | 12.19 | 33.30 | 11.53 | 11.53 |
| Self-consumption energy recharged [kWh] | 0 | 16.65 | 5.77 | 5.77 |
| Total cost [€] without self-consumption | 2.50 | 6.82 | 2.39 | 2.39 |
| Total cost [€] with self-consumption | 0 | 3.41 | 1.21 | 1.21 |
| Recharged energy from PCS | 0 | 5.18 | 17.65 | 18.67 |
| Total cost [€] | 0 | 2.34 | 7.97 | 4.88 |
| Injected energy for upward services [kWh] | 0 | 27.18 | 19.80 | 19.80 |
| Revenue for upward services [€] | 0 | 2.45 | 1.79 | 1.79 |
| Return of tariff components [€] | 0 | 2.41 | 3.24 | 2.69 |
| Fixed fee [€] | 0 | 0.80 | 0.80 | 0.80 |
| Net daily cost [€] | 2.50 | 0.09 | 3.34 | 0.80 |
| No Services to the Grid | Base Solution | Solution A* | Solution A** | |
|---|---|---|---|---|
| Recharged energy from SWH (kWh) | 32.73 | 36.13 | 27.27 | 27.27 |
| Self-consumption energy recharged [kWh] | 0 | 18.06 | 13.64 | 13.64 |
| Total cost [€] without self-consumption | 6.71 | 7.40 | 5.62 | 5.62 |
| Total cost [€] with self-consumption | 0 | 3.70 | 2.82 | 2.82 |
| Recharged energy from PCS | 0 | 14.33 | 22.42 | 23.45 |
| Total cost [€] | 0 | 6.47 | 10.12 | 7.03 |
| Injected energy for upward services [kWh] | 0 | 19.98 | 19.98 | 19.98 |
| Revenue for upward services [€] | 0 | 1.81 | 1.81 | 1.81 |
| Return of tariff components [€] | 0 | 2.63 | 3.00 | 2.60 |
| Fixed fee [€] | 0 | 0.54 | 0.54 | 0.54 |
| Net daily cost [€] | 6.71 | 5.19 | 7.60 | 4.91 |
| No Services to the Grid | Base Solution | Solution A* | Solution A** | |
|---|---|---|---|---|
| Recharged energy from SWH (kWh) | 32.73 | 35.96 | 33.79 | 33.79 |
| Self-consumption energy recharged [kWh] | 0 | 17.98 | 16.90 | 16.90 |
| Total cost [€] without self-consumption | 6.71 | 7.37 | 6.95 | 6.95 |
| Total cost [€] with self-consumption | 0 | 3.68 | 3.49 | 3.49 |
| Recharged energy from PCS | 0 | 17.30 | 19.56 | 20.21 |
| Total cost [€] | 0 | 7.81 | 8.83 | 5.74 |
| Injected energy for upward services [kWh] | 0 | 23.13 | 23.13 | 23.13 |
| Revenue for upward services [€] | 0 | 2.08 | 2.10 | 2.10 |
| Return of tariff components [€] | 0 | 3.16 | 3.27 | 2.68 |
| Fixed fee [€] | 0 | 0.80 | 0.80 | 0.80 |
| Net daily cost [€] | 6.71 | 5.44 | 6.15 | 3.66 |
| No Services to the Grid | Base Solution | Solution A* | |
|---|---|---|---|
| Recharged energy from SWH (kWh) | 35.43 | 37.09 | 37.09 |
| Self-consumption energy recharged [kWh] | 0 | 18.55 | 18.55 |
| Total cost [€] without self-consumption | 7.26 | 7.60 | 7.60 |
| Total cost [€] with self-consumption | 0 | 3.80 | 3.80 |
| Recharged energy from PCS | 6.66 | 16.31 | 17.33 |
| Total cost [€] | 3.00 | 7.36 | 4.08 |
| Injected energy for upward services [kWh] | 0 | 13.32 | 13.32 |
| Revenue for upward services [€] | 0 | 1.20 | 1.20 |
| Return of tariff components [€] | 0 | 1.79 | 1.39 |
| Fixed fee [€] | 0 | 0.54 | 0.54 |
| Net daily cost [€] | 10.26 | 7.63 | 4.75 |
Publisher’s Note: MDPI stays neutral with regard to jurisdictional claims in published maps and institutional affiliations. |
© 2022 by the authors. Licensee MDPI, Basel, Switzerland. This article is an open access article distributed under the terms and conditions of the Creative Commons Attribution (CC BY) license (https://creativecommons.org/licenses/by/4.0/).
Share and Cite
Menniti, D.; Pinnarelli, A.; Sorrentino, N.; Vizza, P.; Brusco, G.; Barone, G.; Marano, G. Techno Economic Analysis of Electric Vehicle Grid Integration Aimed to Provide Network Flexibility Services in Italian Regulatory Framework. Energies 2022, 15, 2355. https://doi.org/10.3390/en15072355
Menniti D, Pinnarelli A, Sorrentino N, Vizza P, Brusco G, Barone G, Marano G. Techno Economic Analysis of Electric Vehicle Grid Integration Aimed to Provide Network Flexibility Services in Italian Regulatory Framework. Energies. 2022; 15(7):2355. https://doi.org/10.3390/en15072355
Chicago/Turabian StyleMenniti, Daniele, Anna Pinnarelli, Nicola Sorrentino, Pasquale Vizza, Giovanni Brusco, Giuseppe Barone, and Gianluca Marano. 2022. "Techno Economic Analysis of Electric Vehicle Grid Integration Aimed to Provide Network Flexibility Services in Italian Regulatory Framework" Energies 15, no. 7: 2355. https://doi.org/10.3390/en15072355
APA StyleMenniti, D., Pinnarelli, A., Sorrentino, N., Vizza, P., Brusco, G., Barone, G., & Marano, G. (2022). Techno Economic Analysis of Electric Vehicle Grid Integration Aimed to Provide Network Flexibility Services in Italian Regulatory Framework. Energies, 15(7), 2355. https://doi.org/10.3390/en15072355