Article

Geochemical Characteristics and Process of Hydrocarbon Generation Evolution of the Lucaogou Formation Shale, Jimsar Depression, Junggar Basin

1
College of Geosciences, China University of Petroleum (Beijing), Beijing 102249, China
2
Research Institute of Exploration and Development, Xinjiang Oilfield Company, PetroChina, Urumqi 830013, China
3
Key Laboratory of Deep Oil and Gas, School of Geosciences, China University of Petroleum (East China), Qingdao 266580, China
*
Author to whom correspondence should be addressed.
Energies 2022, 15(7), 2331; https://doi.org/10.3390/en15072331
Submission received: 6 February 2022 / Revised: 10 March 2022 / Accepted: 21 March 2022 / Published: 23 March 2022
(This article belongs to the Special Issue Advances in Unconventional Oil and Gas)

Abstract

:
Lacustrine shale, represented by the Middle Permian Lucaogou Formation in the Jimsar Depression in the eastern Junggar Basin, has become one of the main areas of shale oil exploration in China. In this study, we used 137 samples of shale from the Lucaogou Formation, drawn from 14 wells in the Jimsar Depression, to investigate their characteristics of pyrolysis, organic carbon and soluble organic matter content, biomarkers, organic microscopic composition, and vitrinite reflectance. Basin simulation and hydrocarbon generation thermal simulation experiments were also conducted in a closed system. The results of this study indicate that the input of an algae source was dominant in the source rocks of the Lucaogou Formation, that the water in which the rocks were deposited had high salinity and strong reducibility, and that the source rocks were oil-prone. The Lucaogou source rocks generally had good hydrocarbon generation capability, but showed significant heterogeneity. At the end of the Cretaceous period, the shales in the Lucaogou Formation entered the oil-generation window as a whole. Currently, the shales of the Lucaogou Formation are generally in the high-maturity stage in the deep part of the depression, producing a large amount of high-maturity oil and condensate gas, while those in the shallow part have relatively low maturity and can only produce a large amount of conventional crude oil. The maximum crude oil generation rate of the Lucaogou Formation shale obtained from the thermal simulation results was 220.2 mg/g of the total organic carbon (TOC), and the maximum hydrocarbon expulsion efficiency was estimated to be 59.3–76.4%.

1. Introduction

Crude oil and gas exploration in the Junggar Basin began in 1909 and has a history of more than 100 years. As of 2013, the proven crude oil and natural gas reserves in the Junggar Basin were 23.34 × 10⁸ t and 1972 × 108 m3, respectively [1]. The Junggar Basin is one of the most important onshore oil and gas production sites in China [1,2]. Although the current oil and gas exploration in the Junggar Basin is dominated by conventional reservoirs, the exploration of unconventional shale oil, represented by the Middle Permian Lucaogou Formation (P2l) in the Jimsar Depression, the Middle Permian Pingdiquan Formation (P2p) in the Wucaiwan–Shishugou area, and the Lower Permian Fengcheng Formation (P1f) in Fengcheng area of the northwestern margin, has shown promising results [3,4,5].
Compared with conventional oil reservoirs, shale oil reservoirs are significantly different, and the main differences are as follows: (1) source–reservoir integration and near-source or intra-source accumulation; (2) extremely low porosity and permeability; (3) the ambiguous boundary conditions of the trap; and (4) Darcy’s law of seepage flow not being met during the secondary migration of oil and gas [6,7,8]. At present, this type of integrated source–reservoir shale oil and gas exploration is still in its infancy in China, and the predicted resource amount is around 11 × 109 t, of which Junggar Basin alone accounts for 29 × 108 t (26.4% of the total) [6]. Unlike foreign shale oil, which is dominated by marine deposits, the shale oil in China is dominated by lacustrine deposits. The source rocks in the lake are typically thick, with a small distribution, and their porosity (<10%) and permeability (<0.1 mD) are lower than those in the maritime environment [6,9]. The P2l lacustrine source rocks in the Jimsar Depression, located in the eastern part of the Junggar Basin, can be regarded as the world’s largest lacustrine mudstone in terms of its thickness and organic matter abundance (Figure 1a,b) [10]. At present, this area is one of the main areas of shale oil exploration in China, with a predicted resource amount of 7.02 × 10⁸ t [1,6].
The organic matter abundance and hydrocarbon generation capacity of source rocks are the most important factors used for evaluating the quality of shale oil [8]. Previous researchers had studied P2l shale oil in the Jimsar Depression, mainly focusing on the sedimentary facies and lithology of the P2l shale [11], oil and gas source comparison [12], the heterogeneity of the source rocks [13], and the hydrocarbon accumulation process [14,15]. These studies have greatly enriched research on unconventional oil and gas, and promoted the exploration and development of shale oil in the Jimsar Depression. However, current research on the characteristics of hydrocarbon generation and the evolution of P2l source rocks in the study area is still in a relatively early stage. Based on the analysis of the static hydrocarbon generation capacity of the P2l source rocks, in this study a gold-tube thermal simulation experiment was conducted in a closed system. Based on this and the two-dimensional basin simulation, the hydrocarbon generation mechanism, hydrocarbon expulsion efficiency, and the evolution process were systematically studied, providing strong support for the evaluation of continental shale oil and gas.

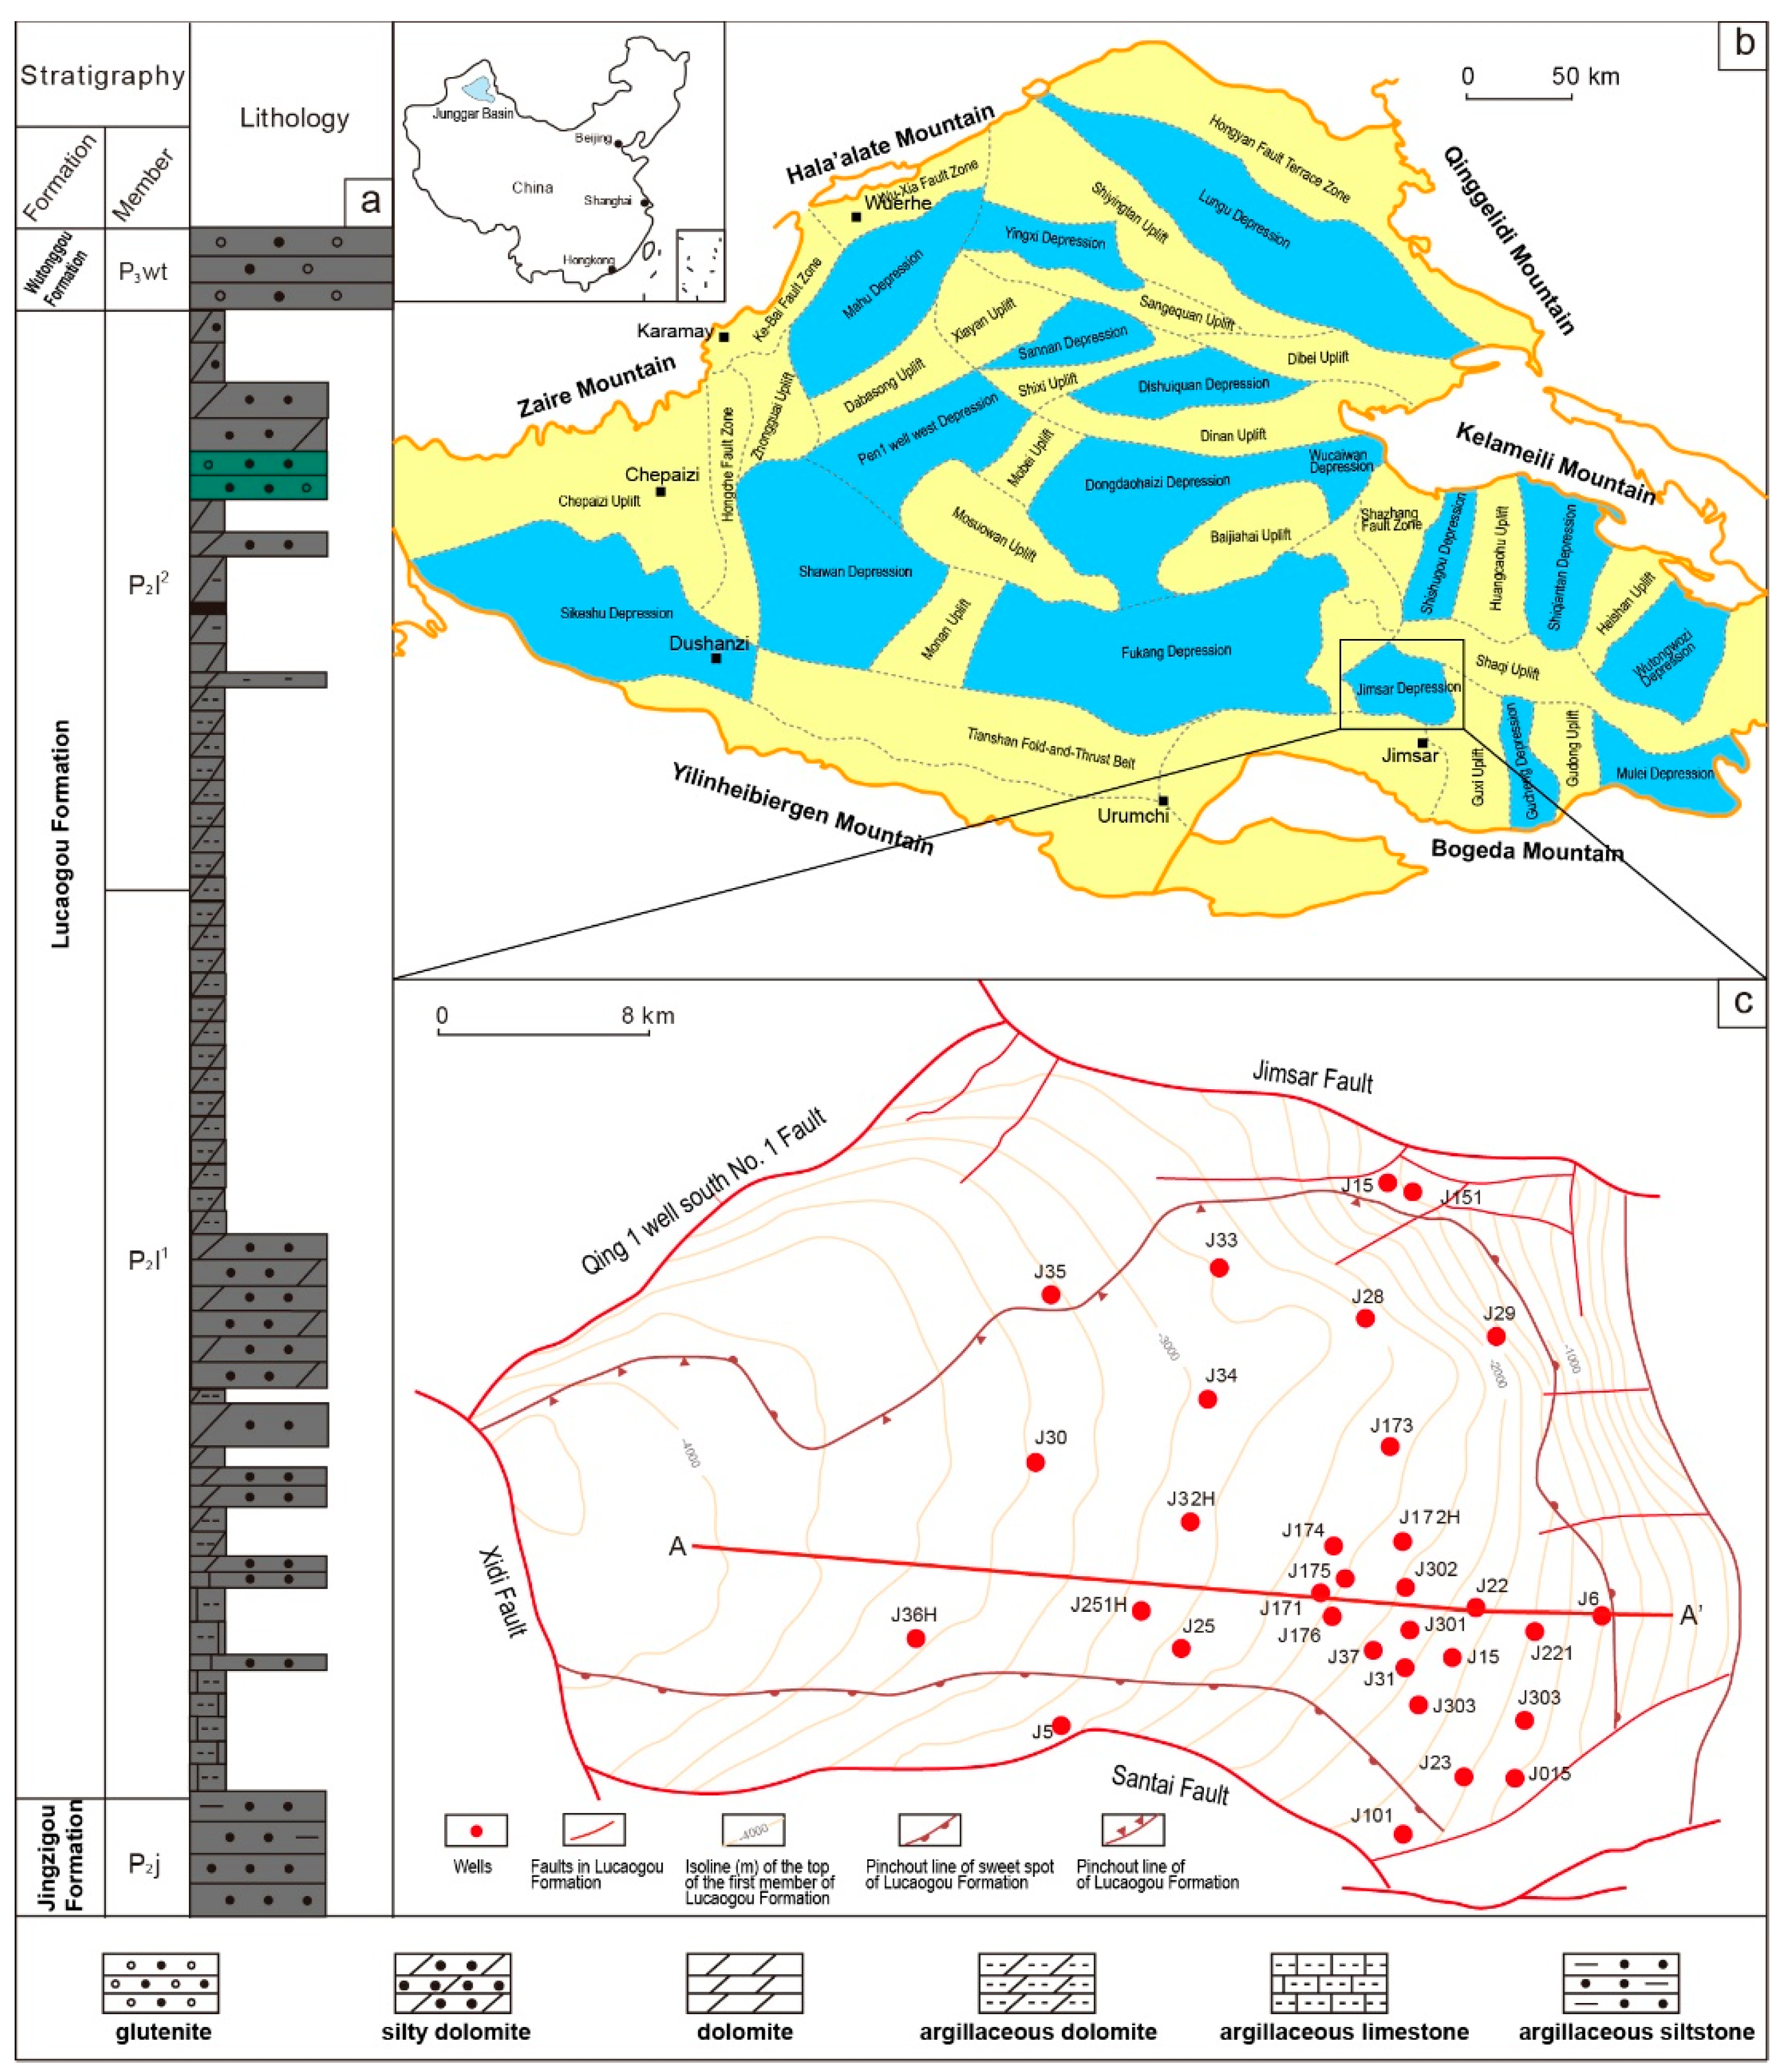
2. Geologic Background

The Junggar Basin is located in the Xinjiang Uygur Autonomous Region in northwestern China, with an area of approximately 1.3 × 10⁵ km2. It can be divided into a total of six primary structural units, including two major depressions (the Central Depression and the Wulungu Depression), three major uplifts (the Luliang Uplift, the Western Uplift, and the Eastern Uplift), and a thrust-fold belt (the North Tianshan Thrust-Fold Belt) (Figure 1b) [16,17]. The study area is a secondary structural unit in the Eastern Uplift in the Jimsar Depression, bounded by the Shaqi Uplift to the north, the Santai Uplift to the west, the Fukang Fault Zone to the south, and the Guxi Uplift to the east, and has an area of around 1500 km2 (Figure 1c) [1,18]. The depression has undergone multiple tectonic movements (Hercynian, Indosinian, Yanshanian, and Himalayan movements). There are huge, thick Paleozoic–Cenozoic sedimentary rocks overlying the Precambrian crystalline basement and Paleozoic metamorphic basement. At their thickest, the rocks exceed 5000 m, and the deposits in the depression gradually become thinner from west to east (Figure 1c) [1,17].
The Middle Permian Lucaogou Formation in the Jimsar Depression was formed in a saline lacustrine basin environment after the relict sea was closed [1,19], and it is widely distributed in the depression, with an area of approximately 1278 km2, a thickness of 200–350 m, and a maximum thickness of >500 m (Figure 1a) [20]. The Lucaogou Formation is a set of lacustrine deposits that has recorded multiple complete cycles of lake water depth fluctuations from shallow to deep, and can be further divided into the upper sub-member (P2l2) and the lower sub-member (P2l1) (Figure 1a). Previous studies have shown that the Lucaogou Formation contains a set of lacustrine source rocks that are rich in organic matter [15,18,21]. Their lithology includes gray–black mudstone, dolomitic mudstone, siltstone, and dolomite [15,21]. The main lithology of the reservoir includes dolomite, dolomitic siltstone, sandy dolomite, diabase, and a small amount of tuff [11,17]. The storage space of the reservoir is dominated by nanopores and microfractures, the pore throat radius is 100–500 nm, the porosity is 2.5–16.27%, and the permeability is less than 0.1 mD [6].

3. Samples and Analytical Methods

3.1. Samples

In this study, a total of 137 samples of the P2l source rocks were collected from 14 wells in the Jimsar Depression, including 40 samples from the P2l1 member and 97 samples from the P2l2 member. The locations of the wells are shown in Figure 1c. Based on these samples, various analytical measurements were carried out on more than 700 samples, including the pyrolysis, extraction, and quantification of the organic carbon and soluble organic matter; the analysis of biomarker compounds; the determination of the whole-rock organic microscopic composition; and the determination of the vitrinite reflectance (Ro).

3.2. Analytical Methods

3.2.1. Evaluation of Source Rocks

The source rock samples were cut into thin sections to observe the lithology of the source rocks and the characteristics of the organic detritus, and determine the Ro. The “Method for Isolation of Kerogen in Sedimentary Rocks”, published and implemented in 2003, was used to isolate the kerogen, and the component identification, quantification, and the classification of the kerogen types of the isolated kerogen were carried out based on the “Methods for Microscopic Composition Identification and Type Classification by Transmitted Light-Fluorescence” industry standard (SY/T5125-2014).
The pyrolysis of the source rocks was conducted using a Rock-Eval VI standard pyrolysis instrument (France). The sample was crushed, and 100 mg of the sample was heated in helium gas. The hydrocarbons released during the pyrolysis were monitored using a hydrogen flame ionization monitor, and the CO and CO2 generated by the heating and oxidation of the residual organic matter after the pyrolysis were detected using a thermal conductivity detector. Following the rock pyrolysis analysis standard (GB/T18602-2012), a constant temperature of 300 °C was set for 3 min to obtain S1; the temperature was increased from 300 °C to 650 °C at a rate of 25 °C for 1 min to obtain S2. Then the highest pyrolysis peak temperature (Tmax), Hydrocarbon Index (HCI), Hydrogen Index (HI), Oxygen Index (OI), Hydrocarbon Generation Potential (S1 + S2), and Production Index (PI) were obtained through equations for calculating the pyrolysis parameters.

3.2.2. Simulation of Two-Dimensional Basin

The simulation of a two-dimensional basin was carried out using the PetroMod software. The data of heat flows of present and past, and the electrical conductivity of the source rocks, were obtained from previous studies that had carried out simulations [22,23]. The solution (EasyRo) given by Sweeney and Burnham (1990) [24] was used to convert the result to source rock maturity, and the applicable maturity interval was 0.3–4.6% Ro.

3.2.3. Thermal Simulation Experiment in a Closed System

The source rock sample was sealed in a gold tube under the protection of an argon gas atmosphere. The gold tube was placed in an autoclave, and the autoclave was filled with water using a high-pressure pump. The high-pressure water caused the gold tube to be flexibly deformed, thereby exerting pressure on the sample. The sample was sealed under the protection of argon to ensure that there was no air contamination. The gold tube was sealed via arc welding. The samples were heated at rates of 20 °C/min and 2 °C/min. The temperature difference between each autoclave was less than 1 °C. The pressure was 50 MP, and the pressure fluctuation was less than 1 MP. The temperature range was 150–456 °C, and the temperature fluctuation was less than 1 °C. After heating, the gold tube was removed from the autoclave. The detected contents were gas (C1–C4), light hydrocarbons (C6–C14), and heavy hydrocarbons (C14+).

4. Results and Discussion

4.1. Depositional Environment of Source Rocks

4.1.1. Normal Alkanes and Isoprenoid Alkanes
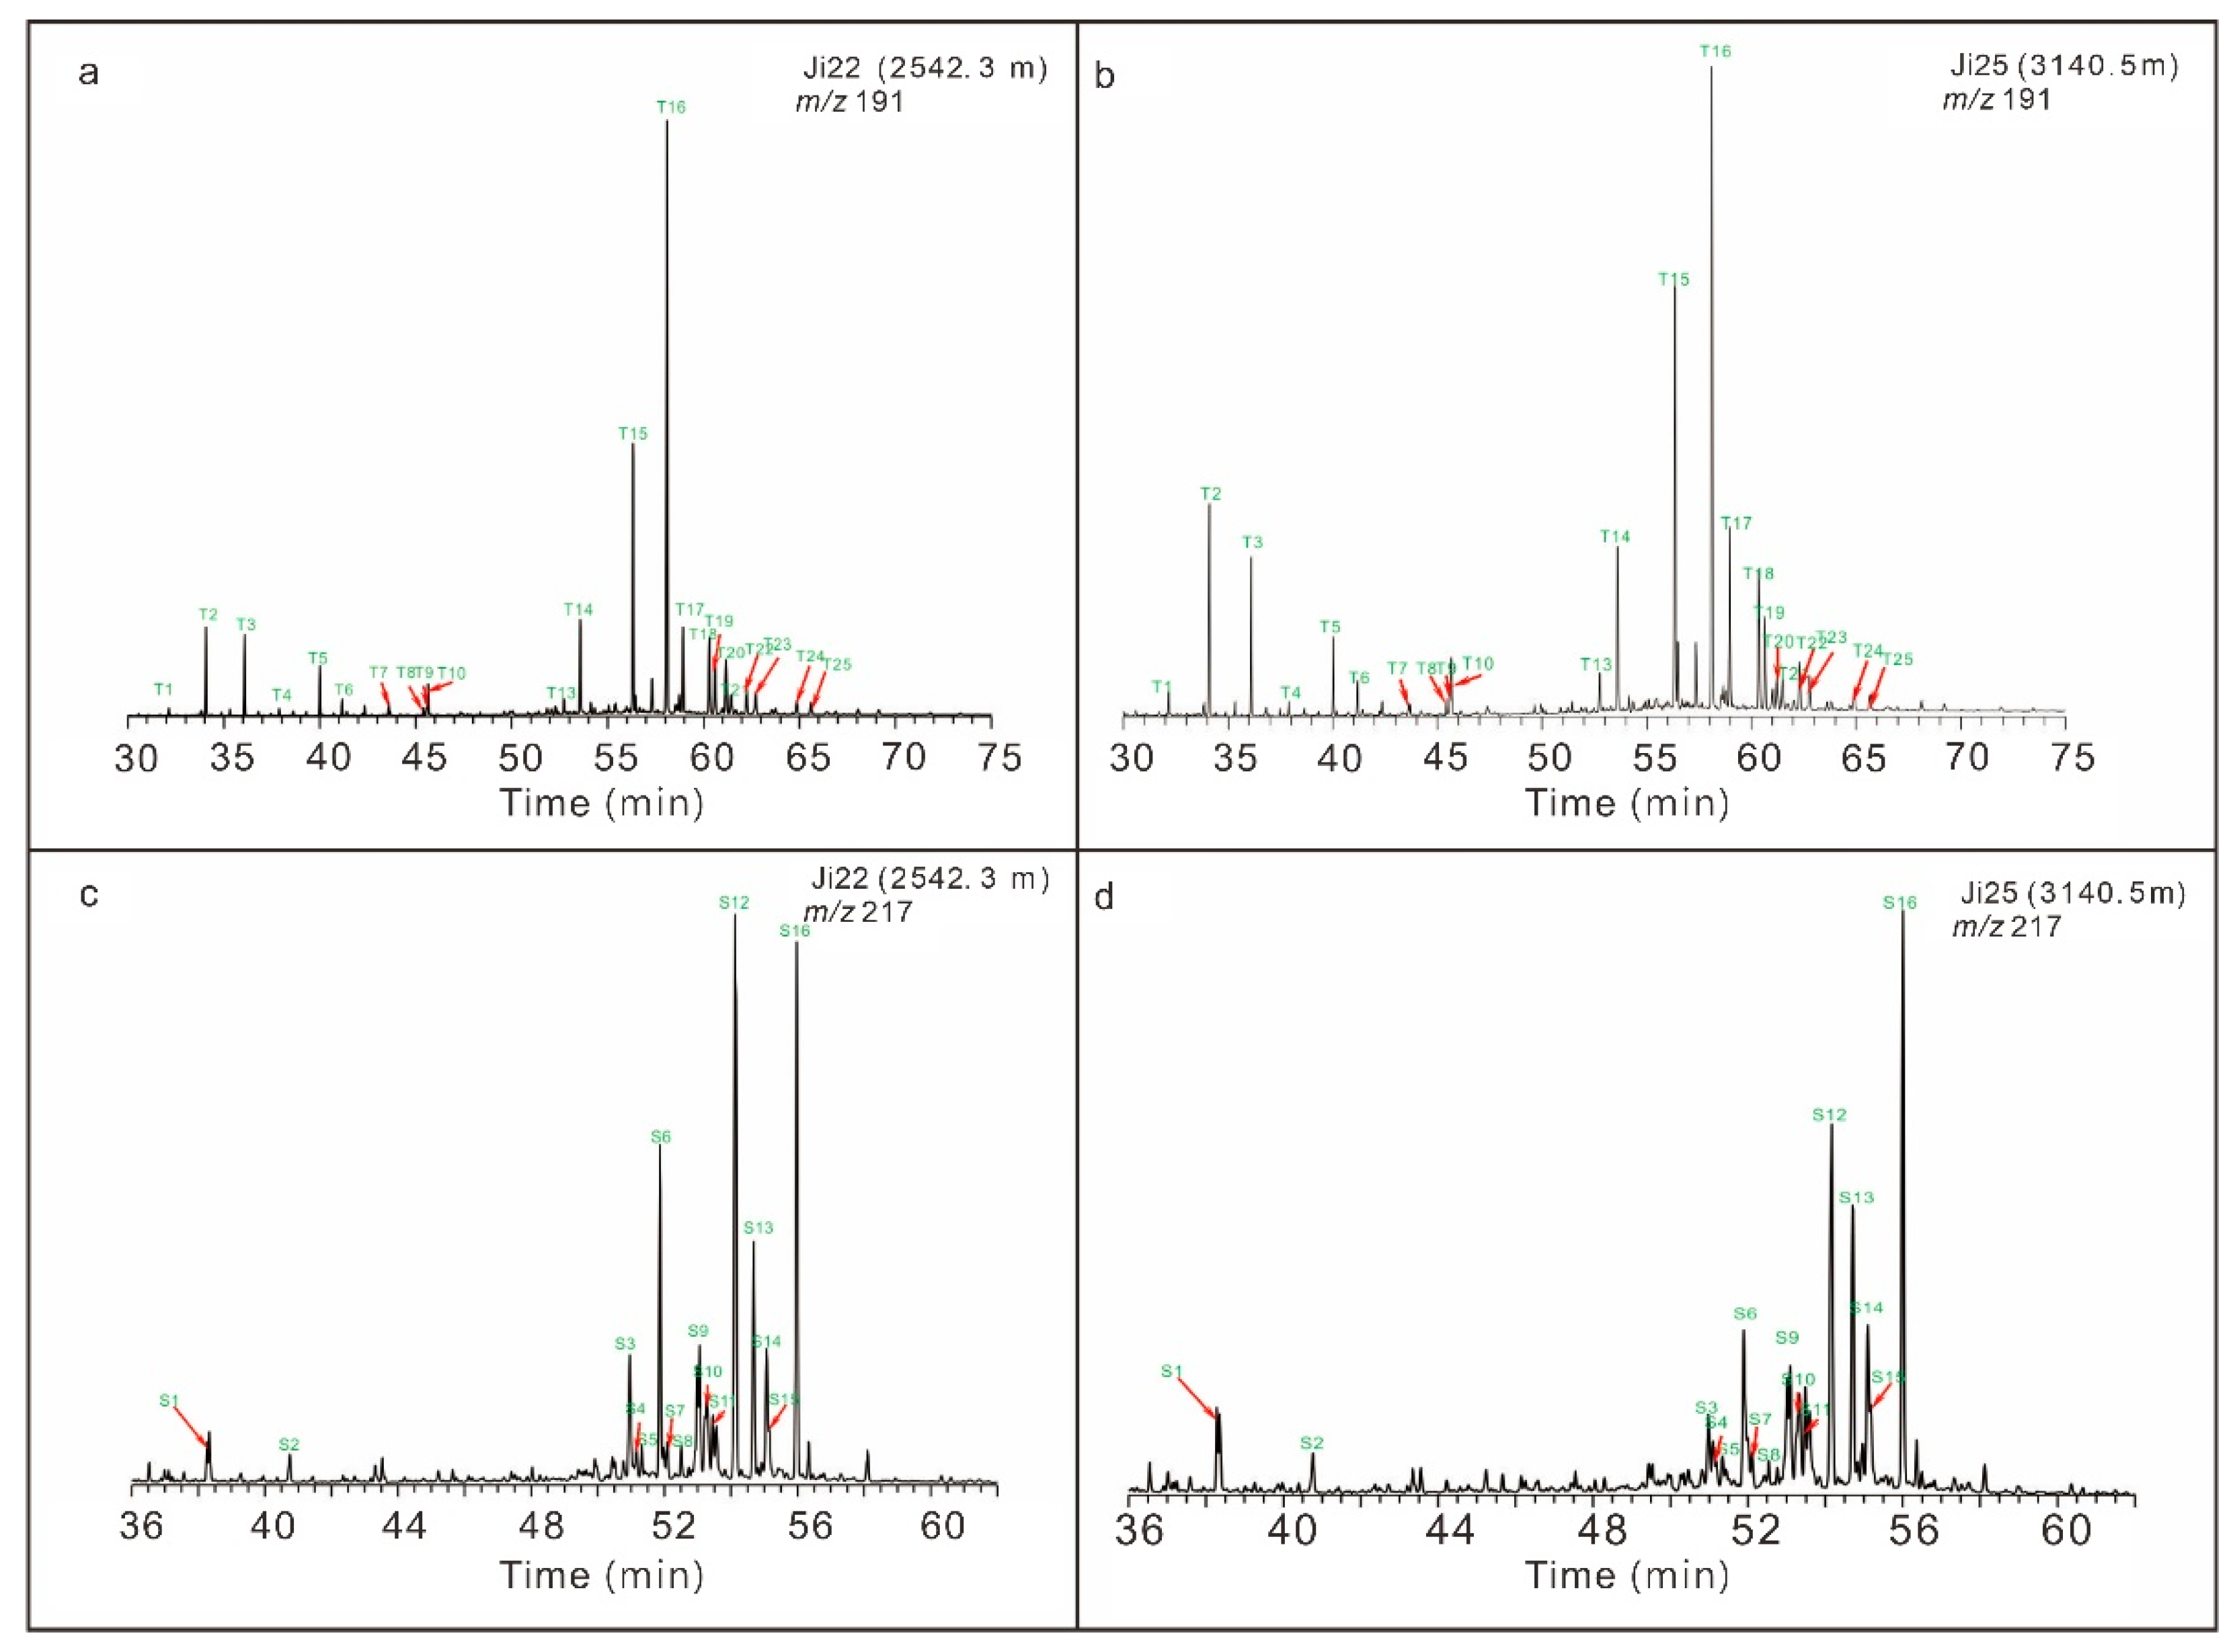
Isoprenoid alkane compounds are commonly used as indicators of the sedimentary environment [25,26]. The pristane/phytane (Pr/Ph) ratios of the P2l source rocks in the Jimsar Depression were 0.81–2.62, with an average of 1.37. Most of the values were in the range of 0.75–1.5, but quite a few samples had values of >2 (Table 1). Peters et al. (2005) [25] pointed out that when the Pr/Ph ratio is 0.8–3.0, there is great uncertainty in using this ratio to explain the depositional environment of the source rock. Therefore, the ratio of isoprenoid to normal alkanes [27] was used in this study. As is shown in Figure 2, the Pr/n-C17 and Ph/n-C18 values were 0.14–6.40 (average 1.54) and 0.09–4.33 (average 1.43), respectively, indicating a reducing environment overall, with bacteria and algae as the main sources of organic matter. The contribution of land-based organic matter was low, and the maturity was not high. It should be noted that the distribution characteristics of the isoprenoid alkanes and n-alkanes are also controlled by their maturity [25,28]. The maturity of the samples from the study area was relatively low, so the impact of the maturity could generally be ignored (Table 1, Figure 2).

4.1.2. Terpanes

Tricyclic terpanes are abundant in the P2l shale of the study area, mainly in the range of C19–C28 (Figure 3), indicating that their formation was closely related to the input of an algae source [29]. The baseline of the GC–MS spectra is nearly horizontal, with no UCM “hump”, suggesting that there was nearly no influence of biodegradation. The source rocks are rich in hopanes. The C30αβ-hopane/C29ααα,(R + S)-sterane ratios are 1.26–19.28, with an average of 6.12 (Figure 3, Table 1), suggesting that bacteria reproduced rapidly in a lake environment and provided a large amount of hopane precursors. The ratios of some individual samples were relatively low, which may be related to a certain amount of terrestrial organic matter input. C31–C35 homohopanes are closely related to prokaryotic microorganisms, and high abundance of C35 homohopane often indicates a strongly reducing depositional environment [25,30]. The C35 homohopane index (C35/(C31–C35) homohopane%) of the P2l shale is relatively high, with a range of 1.46–7.19 and an average of 3.17, indicating that the sedimentary water body had strong reducibility (Figure 3, Table 1). The C31R homohopane/C30 hopane ratios are 0.08–0.25, with an average of 0.17, also exhibiting the characteristics of lacustrine crude oil (Figure 3, Table 1). Gammacerane can effectively reflect the stratification of sedimentary water bodies, which in turn is related to the salinity of the water body [31]. The abundance of gammacerane in coal-measure source rocks formed in a swamp environment is very low, and their gammacerane index (Gammacerane/(Gammacerane + C30αβ-hopane)) is usually less than 0.05 (or even less than 0.01). The abundance of gammacerane in lacustrine sedimentary mudstone is relatively high, and the gammacerane index is greater than 0.05 in most cases [31,32]. The gammacerane index values of P2l shale source rocks in the study area were 0.12–0.61, with an average of 0.30 (Figure 3, Table 1), indicating that evaporation was very strong and the sedimentary water body had a fairly high salinity. In other words, in the Middle Permian, the Jimsar Depression was a saline lake basin.

4.1.3. Sterane

The data suggest that the Lucaogou source rocks were rich in C27 and C28 steranes, implying the existence of large quantities of algae organic matter [33]. The contents of the C27, C28, and C29 regular steranes in the P2l shale in the study area were 13.1–42.2% (average 22.9%), 17.4–57.3% (average 33.0%), and 28.1–57.3% (average 44.1%), respectively (Table 1, Figure 3 and Figure 4). The total content of the C27 and C28 regular steranes in the source rock samples exceeded the content of C29 regular steranes. This indicates that algae organic matter was dominant; however, it also indicates that there may have been some contribution from terrestrial organic matter to source rocks in the study area. The relatively high C29 sterane content was not just related to the source of the organic matter; it was also affected by the depositional environment of the source rocks. Generally, lacustrine source rocks dominated by input of algae sources have higher relative C29 sterane content than marine carbonate/shale [34,35,36]. Overall, the P2l shale had relatively high C27 and C28 sterane content (Figure 4).

4.2. Type and Abundance of Source Rocks

4.2.1. Types of Organic Matter

The elemental analysis revealed that the H/C atomic ratios of the P2l1 member in the study area were 0.79–1.33 (average 1.06); the O/C atomic ratios were 0.04–0.08 (average 0.06); the H/C atomic ratios of the P2l2 member were 0.82–1.60 (average 1.23); the O/C atomic ratios were 0.03–0.30 (average 0.08); and the two sets of source rocks did not exhibit significant differences, mainly exhibiting the characteristics of type II kerogen (Figure 5a). Hunt (1996) [37] pointed out that when the H/C atomic ratio is >0.8, organic matter starts to have the capability to generate oil. According to this standard, the P2l shale had a relatively high H/C atomic ratio and was a set of oil-prone source rocks. It should be noted that large differences in the H/C atomic ratios of the different samples indicated that this set of source rocks was strongly heterogeneous.
Based on the pyrolysis HI values of >600, 300–600, 200–300, 50–200, and <50 mg hydrocarbons/g TOC, the organic matter can be divided into five types: type I (extremely oil-prone type), type II (oil-prone type), II/III type (oil/gas-prone type), type III (gas-prone type), and type IV (non-source rock) (Figure 5b) [38,39]. The HI values of the P2l1 member in the study area were 12–781 mg hydrocarbons/g TOC (average of 367 mg hydrocarbons/g TOC), the HI values of the P2l2 member were 72–808 mg hydrocarbons/g TOC (average of 390 mg hydrocarbons/g TOC), and there was no large difference between the two sets of source rocks (Figure 5b). The type I, type II, type II/III, type III, and type IV samples accounted for 14.5%, 47.1%, 21.0%, 15.2%, and 2.0% of the total samples, respectively, indicating that the P2l source rocks were dominated by type II kerogen, and that type I kerogen did not account for a large proportion. In addition, this set of source rocks was very strongly heterogeneous, and the types of parent materials involved were very different. This heterogeneity was very obvious even in samples from the same well. As an example, for Well Ji174, from which a large number of samples were collected, the HI values of the P2l1 and P2l2 members were 48–294 and 72–808 mg hydrocarbons/g TOC, respectively.
The analysis of the organic microscopic compositions of whole-rock samples revealed that the contents of the vitrinite group and exinite group of the P2l source rocks were low (<20%), while the contents of the sapropelinite group + exinite group were very high (62.3–78.7%). In general, the sapropelinite group component mainly generated crude oil, the vitrinite group component mainly generated natural gas, the exinite group component generated both, and the inertinite group component had almost no potential for hydrocarbon generation. Therefore, the P2l source rocks in the study area should mainly be oil-generating. Figure 6 shows the results of the whole-rock organic microscopic composition analysis of a core sample (2321.4 m) of P2l1 from Well Ji15. Under reflected fluorescence, the clay (Cl) substrate exhibited a strong fluorescence, and, among them, the parallel-distributed microsporinite (MiS), resinite (R), liptodetrinite (Ld), and vitrodetrinite (Cd) were also widely distributed (Figure 6). Under reflected plane-polarized light (oil immersion), the clay (Cl) minerals exhibited a granular structure in which Cd and semifusinite (SF) fragments were distributed and the latter’s structure was broken. Pyrite (Py) was widely distributed, reflecting the strong reducibility of the sedimentary environment and the good organic matter preservation conditions (Figure 6).

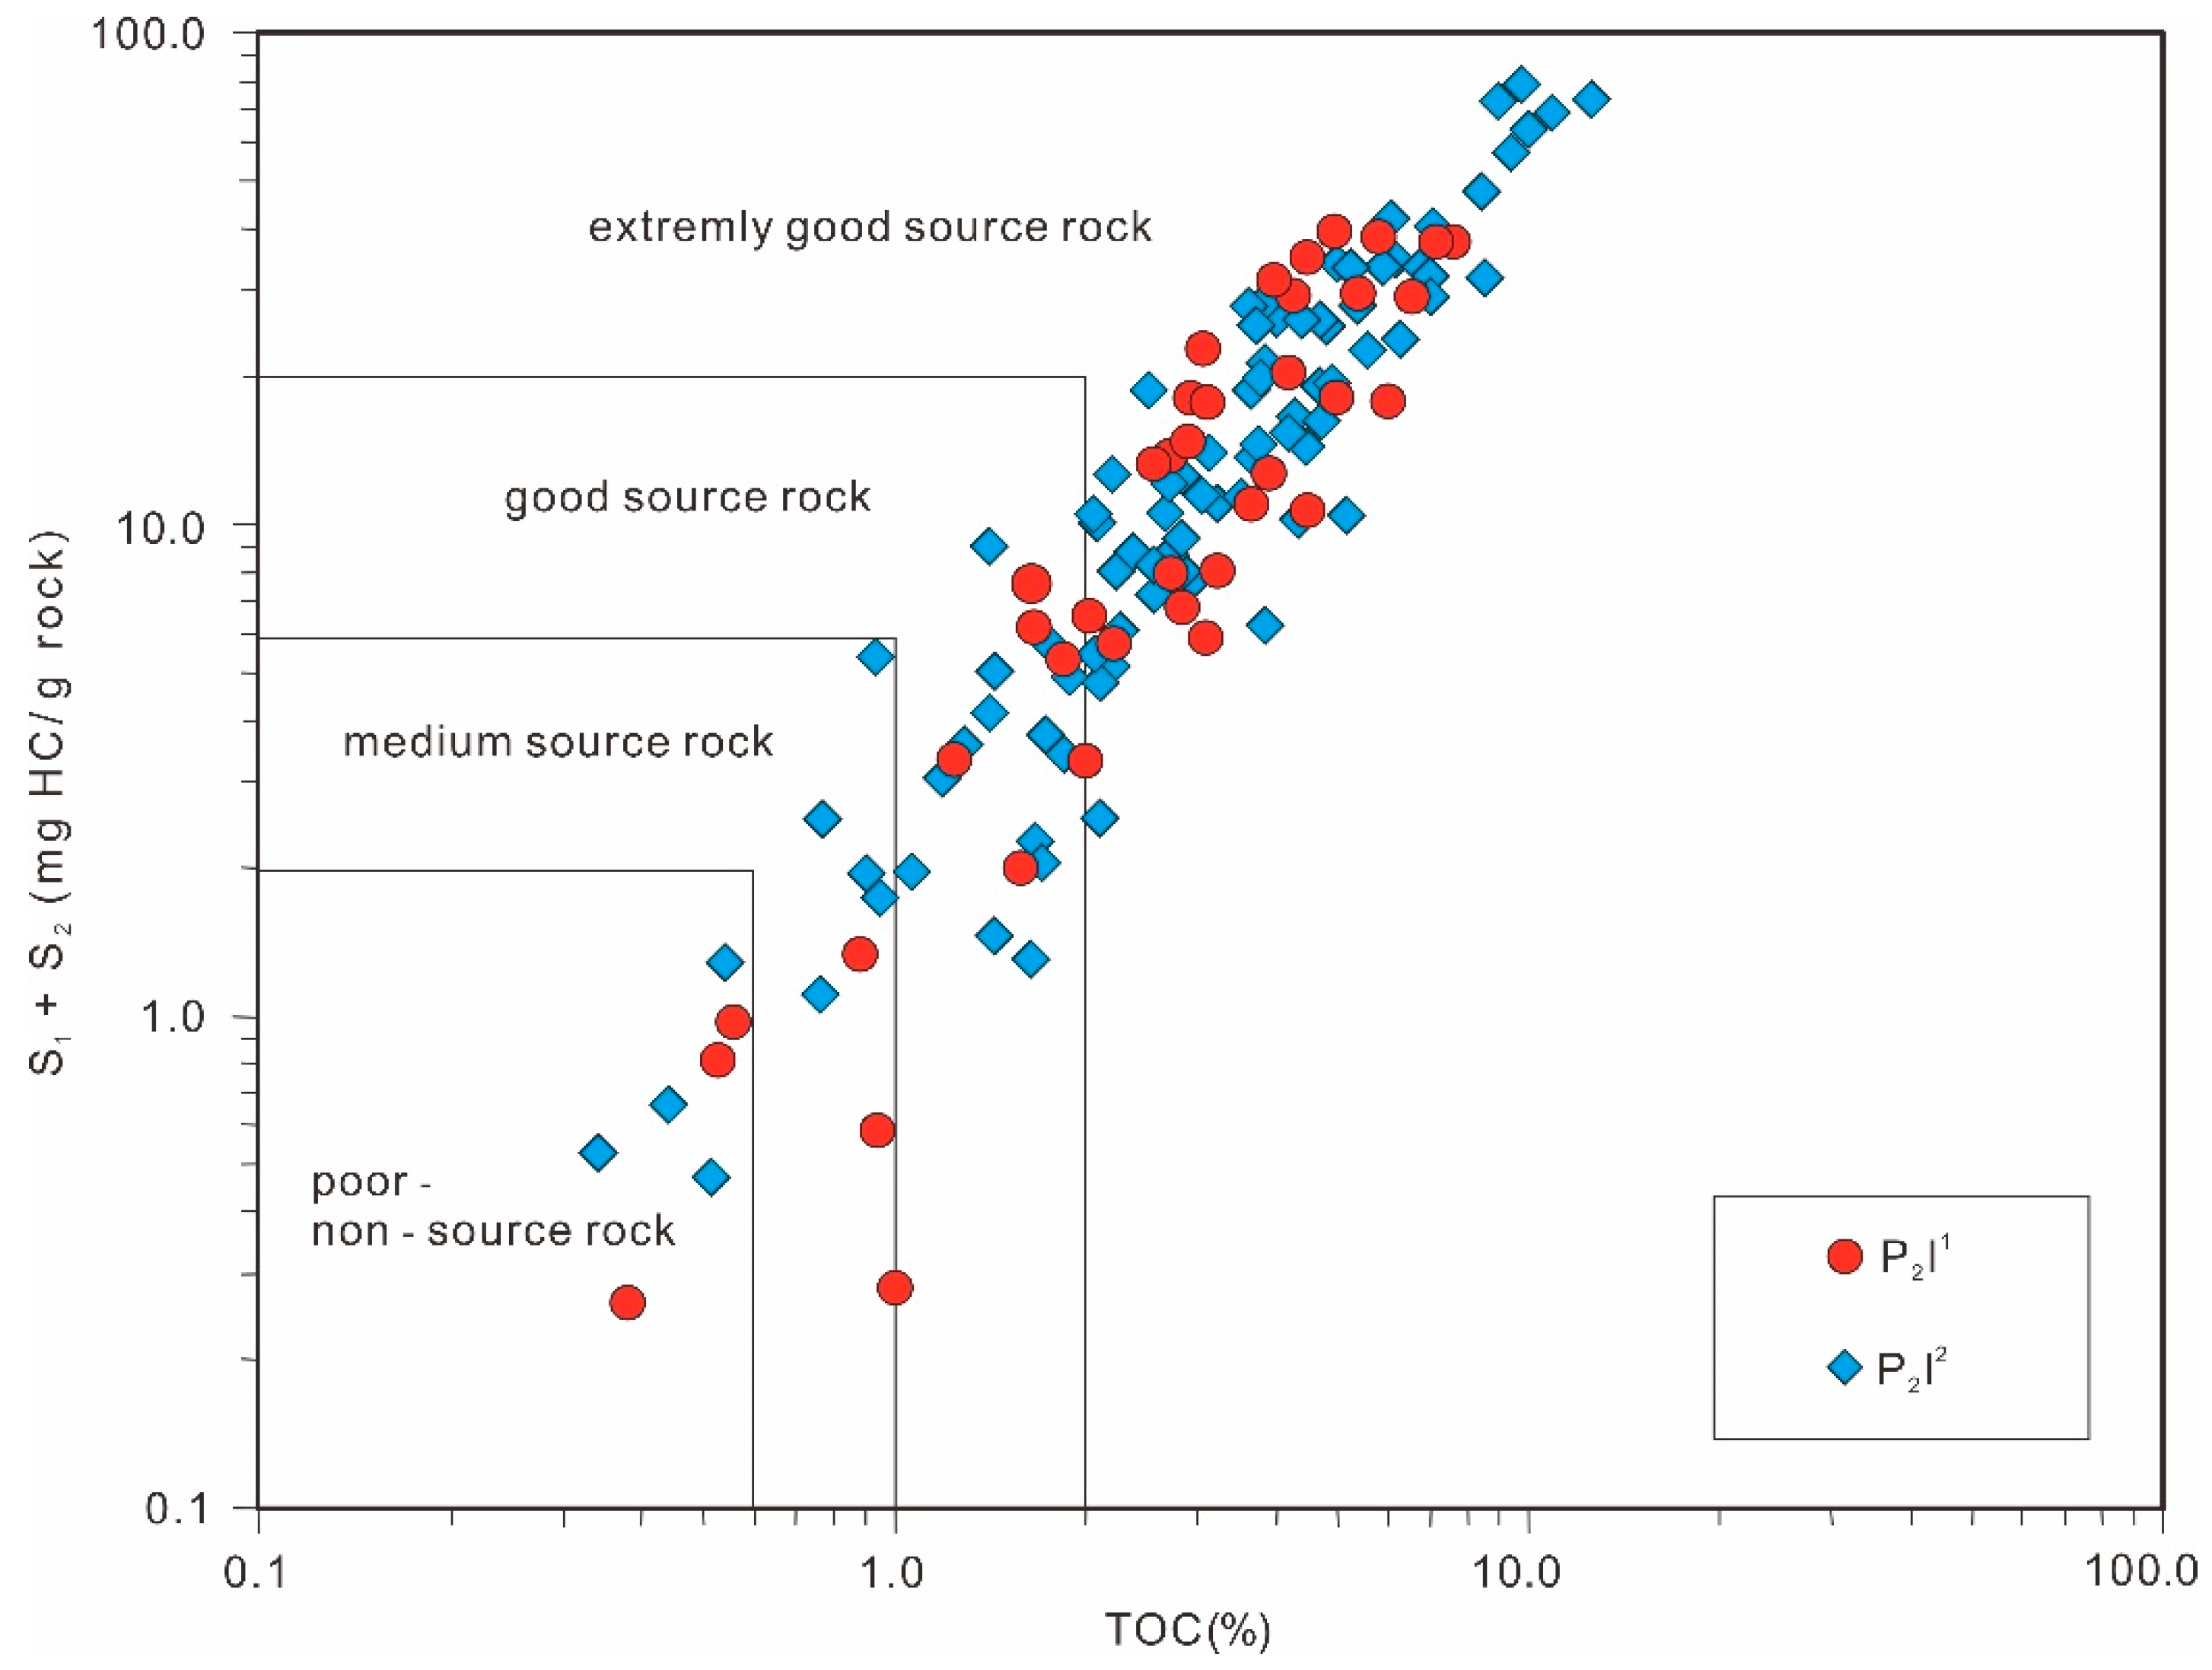
4.2.2. Abundance of Organic Matter

Huang et al. (1982) [40] summarized the abundance of organic matter in the source rocks of the main petroliferous basins in China, and proposed corresponding evaluation criteria for lacustrine source rocks deposited in freshwater and brackish water environments (Figure 7). The TOC values of the P2l1 and P2l2 source rocks were 0.38–7.55% (average 3.30%) and 0.34–12.45% (average 3.80%), respectively. From the perspective of organic carbon, the proportions of good and extremely good source rocks in the P2l1 source rocks were 15.0% and 70.0%, respectively, while the proportions of good and extremely good source rocks in the P2l2 source rocks were 14.3% and 75.5%, respectively. The source rock S1 + S2 values of the P2l1 and P2l2 members were 0.26–39.44 mg hydrocarbons/g rock (average of 15.21 mg hydrocarbons/g rock) and 0.47–78.96 mg hydrocarbons/g rock (average of 17.60 mg hydrocarbons/g rock), respectively (Figure 7). In terms of S1 + S2, the proportions of the good and extremely good source rocks in the P2l1 member were 40% and 30%, respectively, while the proportions of the good and extremely good source rocks in the P2l2 source rocks were 37.8% and 34.7%, respectively (Figure 7).
From the perspective of the TOC and S1 + S2, the P2l source rocks were generally good to extremely good source rocks, but they also exhibited a strong heterogeneity (Figure 7). It should be noted that when the TOC was used as the evaluation standard, the quality of the source rocks was considerably better than the results obtained using the hydrocarbon generation potential as the standard. For example, when TOC was used as the evaluation criterion, the proportion of extremely good source rocks out of the total number of samples was twice as high as the results obtained based on S1 + S2. This is mainly due to the difference in the hydrogen content of the source rocks. In thermochemical reactions, carbon must be combined with hydrogen to generate hydrocarbons. If the hydrogen content is low, even if the organic carbon content is high, the result is often ineffective. The heterogeneity of the hydrogen content of the source rocks, which is reflected in the analysis of organic elements and the pyrolysis hydrogen index, also confirms this view (Figure 5). When evaluating the P2l source rocks, the results obtained using the pyrolysis hydrocarbon generation potential as the standard may be more reliable.

4.3. Thermal Evolution of the Source Rocks

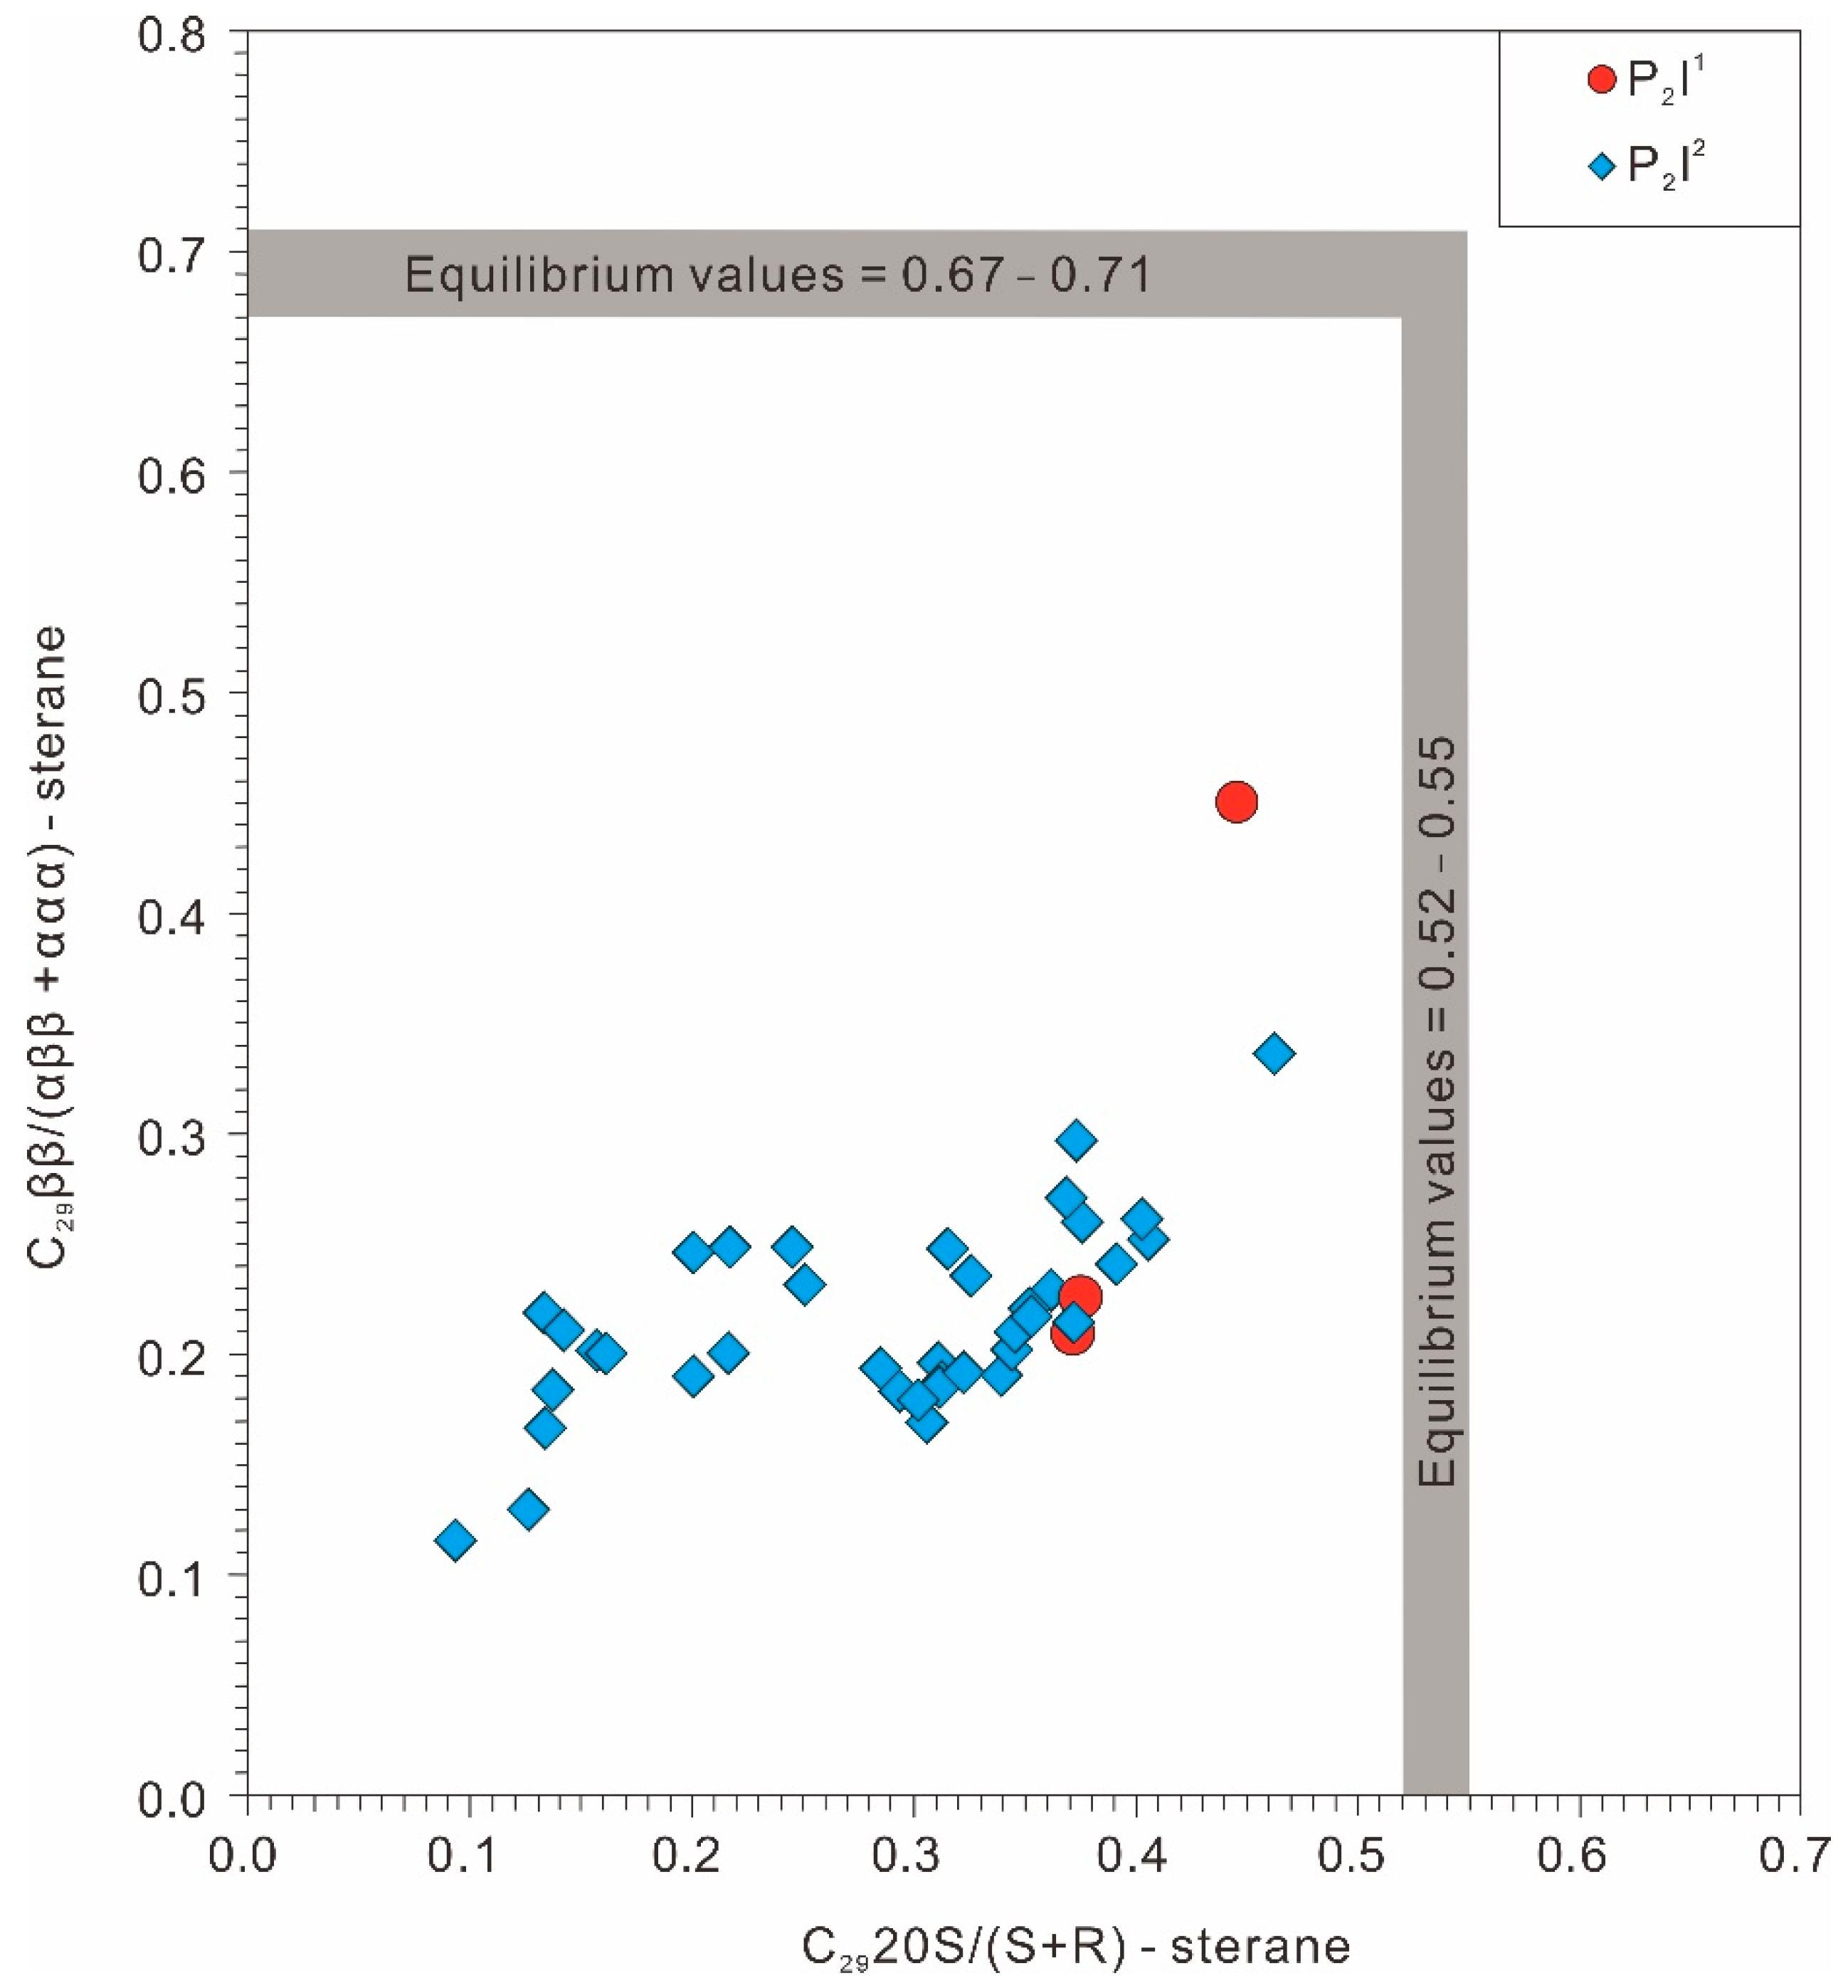
4.3.1. Maturity of the Source Rocks

The vitrinite reflectance values of the P2l source rocks in the study area were 0.52–1.24%, with an average of 0.71%, meaning they were within the main oil generation window. It is generally believed that when S2 is less than 0.2 mg hydrocarbons/g rock, Tmax is unreliable [41]. Except for the two samples from Well Ji5, the S2 values of the samples from the study area were greater than 0.2 mg hydrocarbons/g rock. The Tmax values obtained based on these values were generally reliable, ranging from 428 °C to 454 °C, with an average of 445 °C. The samples were essentially in a mature stage, which is consistent with the situation reflected by the vitrinite reflectance.
The gas chromatographic analysis of the extracted source-rock bitumen revealed that the carbon preference index (CPI) values of the P2l source rocks in the Jimsar Depression were 1.18–2.0 (average 1.41), and the odd-to-even preference (OEP) was 1.14–1.71 (average 1.30), exhibiting a significant odd–even predominance, which indicates that the maturity of the source rocks was not high. The C2920S/(S + R)-sterane and C29ββ/(αββ + ααα)-sterane ratios of the source rock extracts were 0.09–0.46 and 0.11–0.45, respectively, making them lower than the equilibrium values (0.67–0.71 and 0.52–0.55), though they were still within the oil generative window (Figure 8, Table 1) [25].

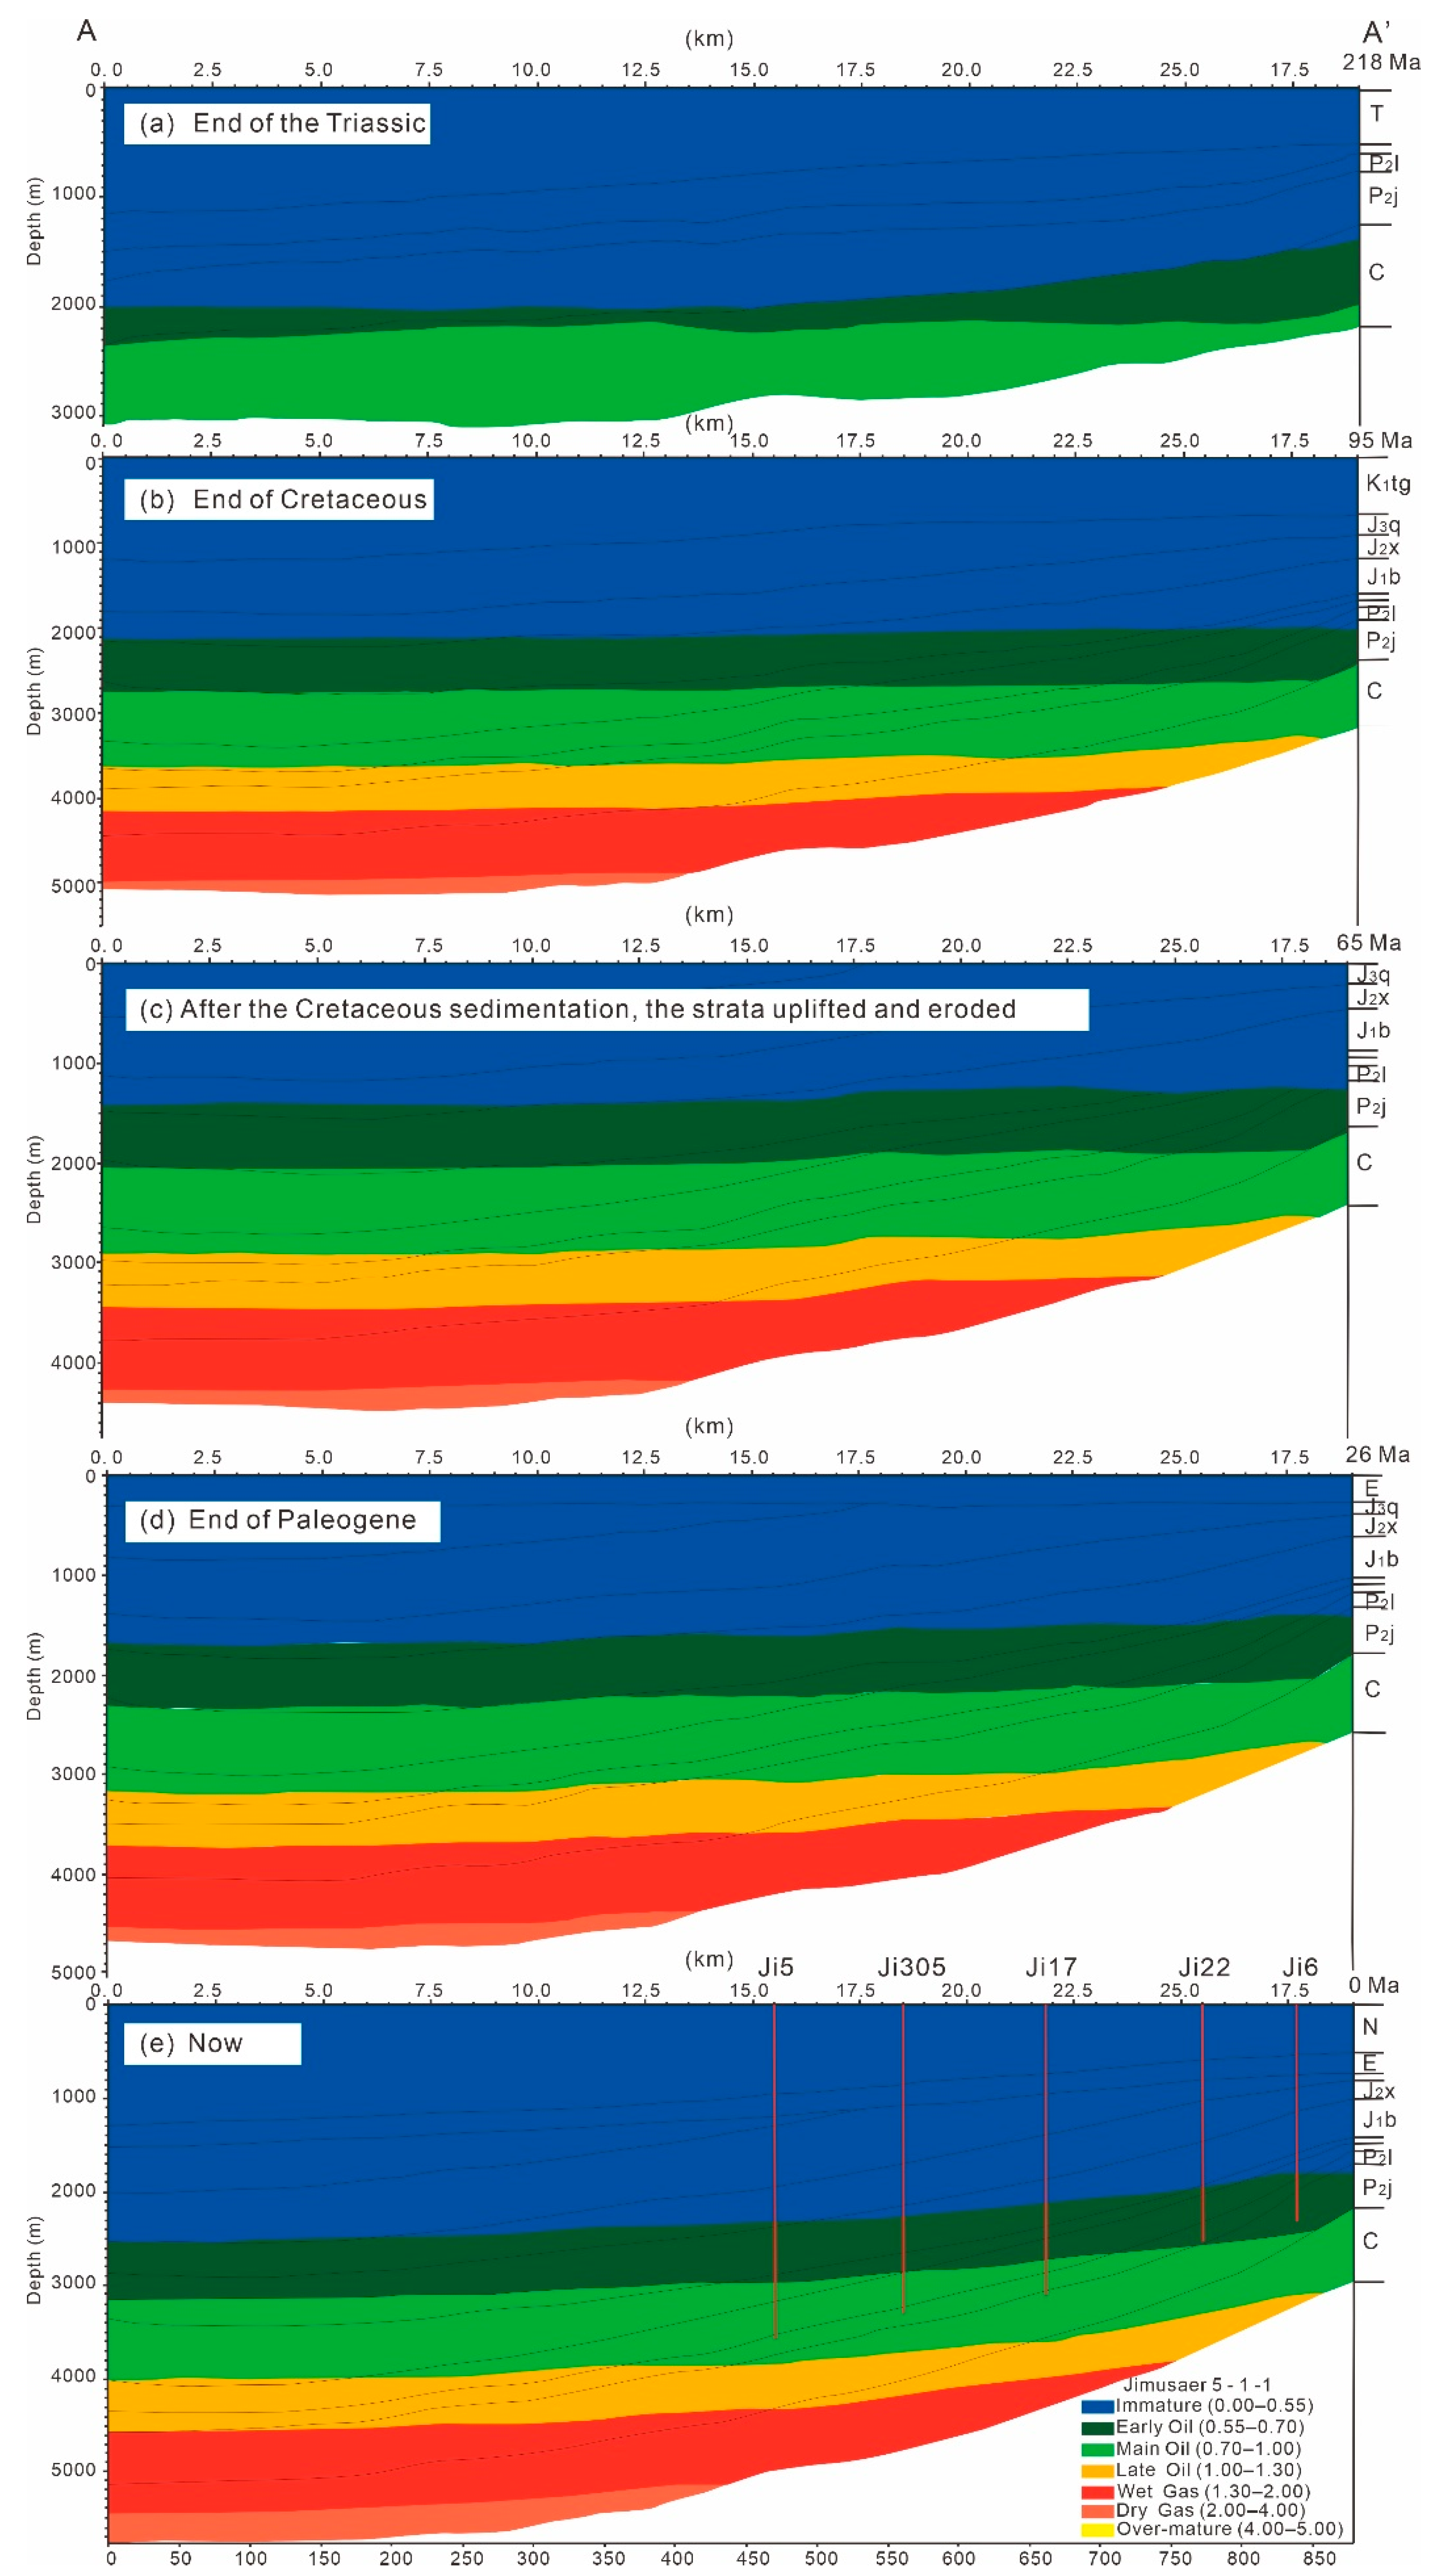
4.3.2. Thermal Evolution of the Source Rocks

Based on a two-dimensional seismic profile crossing the Jimsar Depression in the east–west direction, we restored the hydrocarbon generation and expulsion history and burial history of the P2l source rocks (Figure 9; the location of the profile is shown in Figure 1c). At the end of the Triassic, the maturity of the P2l shale was low, EasyRo < 0.5%, and it had not yet reached the oil generation threshold (Figure 9a). The maturity of the P2l shale increased significantly at the end of the Cretaceous, with an EasyRo > 0.7%, and it entered the main oil generation window, producing a large amount of normal crude oil. The highly mature stage (1.0–1.3% EasyRo) was reached in the deep part of the Depression, and certain amounts of highly mature crude oil and condensate gas were generated (Figure 9b). After the Cretaceous deposition, the formation was uplifted and denuded, and the hydrocarbon generation process in the P2l source rocks stalled (Figure 9c). In the Paleogene, P2l continued to settle (Figure 9d). Currently, the deep part of the depression has generally reached the high-maturity stage, producing a large amount of highly mature oil and condensate gas (1.0–1.3% Ro). The shallow part had relatively low maturity and could only generate a large amount of normal crude oil (0.7–1.0% EasyRo) (Figure 9e).

4.4. Thermal Simulation Experiment on Source Rocks in a Closed System

In this study, a P2l calcareous and siliceous black shale sample (core, 2321.4 m; sampling location is shown in Figure 1c) from Well Ji15 in the eastern margin of the Jimsar Depression was selected. Its kerogen was extracted, and a gold-tube thermal simulation experiment was carried out in a closed system. The total organic carbon content of this sample was 2.46%, the hydrocarbon generation potential (S1 + S2) was 13.36 mg hydrocarbons/g rock, and the HI was 491 mg/g TOC. Generally speaking, the abundance index was in the middle of the range of the P2l shales in the Jimsar Depression, and was representative. In addition, the maturity of the sample was relatively low, the measured vitrinite reflectance was 0.54%, and the sample was determined to be an ideal thermal simulation sample.
When the gas leaves the gold tube under the internal pressure of 1 × 10² Pa and enters the vacuum equipment for gaseous compound analysis, large quantities of C6 and C7 compounds evaporate and are lost. Therefore, when the total amount of liquid hydrocarbon compounds produced was determined, only the amount of C8+ compounds was measured (Figure 10). At 2 °C/h and 20 °C/h, the maximum amounts of oil generated by the P2l shale in the experiment were 209.2 mg/g (0.96EASY%Ro) and 172.3 mg/g (1.08EASY%Ro), respectively (Figure 10). There was no large difference in the maximum amount of oil generated by the sample at the heating rates of 2 °C/h and 20 °C/h. When EASY%Ro > 1.0, the maximum amount of oil generated at a heating rate of 2 °C/h was slightly higher than that generated at a heating rate of 20 °C/h (Figure 10). The experimental results show that the heating rate was not the key factor controlling the crude oil yield in this study. During the thermal simulation process, when the kerogen was cracked to produce crude oil for the first time, part of the crude oil was cracked to generate natural gas at the same time. Therefore, we could assume that the measured maximum amount of oil generated represented a conversion rate of 95% for the kerogen sample [42]. Based on this assumption, the maximum amount of oil generated by the sample in this study was 220.2 mg/g TOC (209.2 mg/g TOC/0.95).
The organic adsorption model proposed by Pepper (1992) and Sandvik et al. (1992) [43,44] can be used to estimate the amount of oil expelled from the source rocks. We defined R as the amount of residual oil in g/g TOC, and we defined M and W as the final amount of oil generated and the final amount of oil expelled per gram of initial organic carbon in the source rocks, respectively [42]. Assuming that the carbon content of the expelled crude oil was 80% after the oil expulsion was completed, the amount of residual organic carbon and residual oil per gram of original organic carbon in the source rocks were (1 − 0. 8 × W) and R × (1 − 0.8 × W), respectively; thus, the following equations could be established [42]:
M = W + R × (1 − 0.8 × W),
W = (M − R)/(1 − 0.8 × R),
where the units of M and W are g/g TOC. As previously mentioned, according to the pyrolysis experiment conducted in the closed system, the maximum amount of oil generated (M) by the sample was 220.2 mg/g TOC. The content (R) of bitumen extracted from the P2l source rocks in the Jimsar Depression was mainly in the range of 60–100 mg/g, the maximum amount of expelled crude oil (W) was 130.7–168.2 mg/g TOC, and the maximum hydrocarbon expulsion efficiency was 59.3–76.4% [42,43,45].

5. Conclusions

Based on data from the hydrocarbon pyrolysis, the contents of organic carbon and soluble organic matter, the biomarkers, the organic microscopic composition, the vitrinite reflectance, the basin simulation and hydrocarbon generation experiments, the sedimentary environment, hydrocarbon generation capacity, quality, and maturity of the Lucaogou Formation were discussed. Four main conclusions could be drawn.
(1)
The majority of the organic matter in the Lucaogou Formation came from algae, and the sedimentary water environment had high reducibility and salinity.
(2)
The organic microscopic components of the Lucaogou source rocks were dominated by the sapropelinite group and exinite group, and they were a set of oil-prone source rocks. Most of them were rated as good and extremely good, but their heterogeneity was strong.
(3)
At the end of the Cretaceous period, the Lucaogou Formation source rocks entered the main oil generation window and began to generate a large amount of normal crude oil. Currently, the deep part of the depression has generally reached the high-maturity stage and is generating a large amount of highly mature oil and condensate gas. The maturity of the shallow part is relatively low, and only a large amount of conventional crude oil can be generated.
(4)
The thermal simulation experiment conducted in a closed system suggests that the Lucaogou source rocks have great hydrocarbon generation capacity and expulsion efficiency, and the heating rate did not have a significant impact on the maximum amount of oil generated.

Author Contributions

Conceptualization, W.H., D.L. and G.L.; methodology, W.H.; software, D.W. and Y.L.; validation, Y.L.; formal analysis, G.L.; investigation, G.G.; resources, W.H. and L.H.; data curation, L.H. and Y.Q.; writing—original draft preparation, W.H. and Y.L.; writing—review and editing, Y.L.; visualization, D.W. and Y.L.; supervision, D.L. and G.L.; project administration, W.H.; funding acquisition, W.H. and Y.L. All authors have read and agreed to the published version of the manuscript.

Funding

This research was funded by the Strategic Priority Research Program of the Chinese Academy of Sciences (Grant No. XDA14010301), National Natural Science Foundation of China (Grant No. 41702138).

Institutional Review Board Statement

Not applicable.

Informed Consent Statement

Not applicable.

Data Availability Statement

Not applicable.

Acknowledgments

We want to thank the Xinjiang Oilfield Company for the support in preparing this manuscript. We also thank the editors and anonymous reviewers for their helpful suggestions and comments.

Conflicts of Interest

The authors declare no conflict of interest.

References

  1. Bai, H.; Pang, X.Q.; Kuang, L.C.; Pang, H.; Wang, X.L.; Jia, X.Y.; Zhou, L.M.; Hu, T. Hydrocarbon expulsion potential of source rocks and its influence on the distribution of lacustrine tight oil reservoir, Middle Permian Lucaogou Formation, Jimsar Sag, Junggar Basin, Northwest China. J. Pet. Sci. Eng. 2017, 149, 740–755. [Google Scholar] [CrossRef]
  2. Chen, Z.H.; Cao, Y.C.; Ma, Z.J.; Zhen, Y.S. Geochemistry and origins of natural gases in the Zhongguai area of Junggar Basin, China. J. Pet. Sci. Eng. 2014, 119, 17–27. [Google Scholar] [CrossRef]
  3. Su, Y.; Zha, M.; Liu, K.Y.; Ding, X.J.; Qu, J.X.; Jin, J.H. Characterization of Pore Structures and Implications for Flow Transport Property of Tight Reservoirs: A Case Study of the Lucaogou Formation, Jimsar Sag, Junggar Basin, Northwestern China. Energies 2021, 14, 1251. [Google Scholar] [CrossRef]
  4. Jiang, Y.H.; Hou, D.J.; Li, H.; Zhang, Z.M.; Guo, R.B. Impact of the Paleoclimate, Paleoenvironment, and Algae Bloom: Organic Matter Accumulation in the Lacustrine Lucaogou Formation of Jimsar Sag, Junggar Basin, NW China. Energies 2020, 13, 1488. [Google Scholar] [CrossRef] [Green Version]
  5. Tang, Y.; Cao, J.; He, W.J.; Shan, X.; Liu, Y.; Zhao, K.B. Development Tendency of Geological Theory of Total Petroleum System: Insights from the Discovery of Mahu Large Oil Province. Xinjiang Pet. Geol. 2021, 42, 1–9, (In Chinese with English abstract). [Google Scholar]
  6. Jia, C.Z.; Zou, C.N.; Li, J.Z.; Li, D.H.; Zheng, M. Assessment criteria, main types, basic features and resource prospects of the tight oil in China. Acta Pet. Sin. 2012, 33, 343–350, (In Chinese with English abstract). [Google Scholar]
  7. Zou, C.N.; Yang, Z.; Tao, S.Z.; Yuan, X.J.; Zhu, R.K.; Hou, L.H.; Wu, S.T.; Sun, L.; Zhang, G.S.; Bai, B.; et al. Continuous hydrocarbon accumulation over a large area as a distinguishing characteristic of unconventional petroleum; the Ordos Basin, north-central China. Earth-Sci. Rev. 2013, 126, 358–369. [Google Scholar] [CrossRef] [Green Version]
  8. Zou, C.N.; Zhu, R.K.; Bai, B.; Yang, Z.M.; Hou, L.H.; Zha, M.; Fu, J.H.; Shao, Y.; Liu, K.Y.; Cao, H.; et al. Significance, Geologic Characteristics, Resource Potential and Future Challenges of Tight Oil and Shale Oil. Bull. Mineral. Petrol. Geochem. 2015, 34, 3–17, (In Chinese with English abstract). [Google Scholar]
  9. Katz, B.; Lin, F. Lacustrine basin unconventional resource plays: Key differences. Mar. Pet. Geol. 2014, 56, 255–265. [Google Scholar] [CrossRef]
  10. Carroll, A.R. Upper Permian lacustrine organic facies evolution, southern Junggar Basin, NW China. Org. Geochem. 1998, 28, 649–667. [Google Scholar] [CrossRef]
  11. Jiang, Y.Q.; Liu, Y.Q.; Yang, Z.; Nan, Y.; Wang, R.; Zhou, P.; Yang, Y.J.; Kou, J.Y.; Zhou, N.C. Characteristics and origin of tuff-type tight oil in Jimusar Depression, Junggar Basin, NW China. Pet. Explor. Dev. 2015, 42, 741–749, (In Chinese with English abstract). [Google Scholar] [CrossRef]
  12. Wang, Y.T.; Yang, Z.M.; Ma, W.C.; Pan, C.C.; Wang, F. Geochemical Characteristics and Genesis of Tight Oil in Lucaogou Formation of Jimsar Sag. Xinjiang Pet. Geol. 2017, 38, 379–384, (In Chinese with English abstract). [Google Scholar]
  13. Hu, T.; Pang, X.Q.; Jiang, S.; Wang, Q.F.; Zheng, X.W.; Ding, X.G.; Zhao, Y.; Zhu, C.X.; Li, H. Oil content evaluation of lacustrine organic-rich shale with strong heterogeneity: A case study of the Middle Permian Lucaogou Formation in Jimusaer Sag, Junggar Basin, NW China. Fuel 2018, 221, 196–205. [Google Scholar] [CrossRef]
  14. Kuang, L.C.; Wang, X.T.; Guo, X.G.; Chang, Q.S.; Jia, X.Y. Geological Characteristics and Exploration Practice of Tight Oil of Lucaogou Formation in Jimsar Sag. Xinjiang Pet. Geol. 2015, 36, 629–634, (In Chinese with English abstract). [Google Scholar]
  15. Gao, G.; Xiang, B.L.; Li, T.T.; Ren, J.L.; Kong, Y.H. Tight Oil System Particularity of Lucaogou Formation in Jimusaer Sag, Junggar Basin. Acta Sedimentol. Sin. 2017, 35, 824–833, (In Chinese with English abstract). [Google Scholar]
  16. Wang, X.L.; Zhi, D.M.; Wang, Y.T.; Chen, J.P.; Qin, Z.J.; Liu, D.G.; Xiang, Y.; Lan, W.F.; Li, N. Organic Geochemistry of Source Rocks and Hydrocarbons in the Junggar Basin; Petroleum Industry Press: Beijing, China, 2013; pp. 18–73. (In Chinese) [Google Scholar]
  17. Wu, H.G.; Hu, W.X.; Tang, Y.; Cao, J.; Wang, X.L.; Wang, Y.C.; Kang, X. The impact of organic fluids on the carbon isotopic compositions of carbonate-rich reservoirs: Case study of the Lucaogou Formation in the Jimusaer Sag, Junggar Basin, NW China. Mar. Pet. Geol. 2017, 85, 136–150. [Google Scholar] [CrossRef]
  18. Shao, Y.; Yang, Y.Q.; Wan, M.; Qiu, L.W.; Cao, Y.C.; Yang, S.C. Sedimentary Characteristic and Facies Evolution of Permian Lucaogou Formation in Jimsar Sag, Junggar Basin. Xinjiang Pet. Geol. 2015, 36, 635–641, (In Chinese with English abstract). [Google Scholar]
  19. Hou, L.H.; Zou, C.N.; Liu, L.; Wen, B.H.; Wu, X.Z.; Wei, Y.Z.; Mao, Z.G. Geologic essential elements for hydrocarbon accumulation within Carboniferous volcanic weathered crusts in northern Xinjiang, China. Acta Pet. Sin. 2012, 33, 533–540, (In Chinese with English abstract). [Google Scholar]
  20. Kuang, L.C.; Hu, W.X.; Wang, X.L.; Wu, H.G.; Wang, X.L. Research of the Tight Oil Reservoir in the Lucaogou Formation in Jimusar Sag: Analysis of Lithology and Porosity Characteristics. Geol. J. China Univ. 2013, 19, 529–535, (In Chinese with English abstract). [Google Scholar]
  21. Cao, Z.; Liu, G.D.; Kong, Y.H.; Wang, C.Y.; Niu, Z.C.; Zhang, J.Y.; Geng, C.B.; Shan, X.; Wei, Z.P. Lacustrine tight oil accumulation characteristics: Permian Lucaogou Formation in Jimusaer Sag, Junggar Basin. Int. J. Coal Geol. 2016, 153, 37–51. [Google Scholar] [CrossRef]
  22. Wang, S.J.; Hu, S.B.; Li, T.J.; Wang, J.Y.; Zhao, W.Z. Terrestrial heat flow in Junggar Basin, Northwest China. Chin. Sci. Bull. 2000, 45, 1327–1332, (In Chinese with English abstract). [Google Scholar] [CrossRef]
  23. Wang, S.J.; Hu, S.B.; Wang, J.Y. The Characteristics of heat flow and geothermal fields in Junggar Basin. Chin. J. Geophys. 2000, 43, 771–779, (In Chinese with English abstract). [Google Scholar] [CrossRef]
  24. Sweeney, J.J.; Burnham, A.K. Evaluation of a Simple Model of Vitrinite Reflectance Based on Chemical Kinetics. AAPG Bull. 1990, 74, 1559–1570. [Google Scholar]
  25. Peters, K.E.; Walters, C.C.; Moldowan, J.M. The Biomarker Guide: Interpreting Molecular Fossils in Petroleum and Ancient Sediments; Cambridge University Press: Cambridge, UK, 2005; pp. 1–1155. [Google Scholar]
  26. Powell, T.G. Pristane/phytane ratio as environmental indicator. Nature 1988, 333, 604. [Google Scholar] [CrossRef]
  27. Shanmugan, G. Significance of coniferous rain forests and related oil, Gippsland Basin, Australia. AAPG Bulletin 1985, 69, 1241–1254. [Google Scholar]
  28. Vu, T.T.A.; Zink, K.G.; Mangelsdorf, K.; Sykes, R.; Wilkes, H.; Horsfield, B. Changes in bulk properties and molecular compositions within New Zealand Coal Band solvent extracts from early diagenetic to catagenetic maturity levels. Org. Geochem. 2009, 40, 963–977. [Google Scholar] [CrossRef]
  29. Azevedo, D.A.; Aquino Neto, F.R.; Simoneit, B.R.T.; Pinto, A.C. Novel series of tricyclic aromatic terpanes characterized in Tasmanian tasmanite. Org. Geochem. 1992, 18, 9–16. [Google Scholar] [CrossRef]
  30. Ourisson, G.; Albrecht, P.; Rohmer, M. The hopanoids, paleochemistry and biochemistry of a group of natural products: Pure Applied Chemistry. Pure Appl. Chem. 1979, 51, 709. [Google Scholar] [CrossRef]
  31. Damsté, J.S.S.; Duin, A.; Hollander, D.; Kohnen, M.E.L.; Leeuw, J.W.D. Early diagenesis of bacteriohopanepolyol derivatives: Formation of fossil homohopanoids. Geochim. Cosmochim. Acta 1995, 59, 5141–5157. [Google Scholar] [CrossRef]
  32. Ten Haven, H.L.; De Leeuw, J.W.; Sinninghe, D.J.S.; Schenck, P.A.; Palmer, S.E.; Zumberge, J.E. Application of Biological Markers in the Recognition of Palaeohypersaline Environments. In Lacustrine Petroleum Source-Rocks; Fleet, A.J., Kelts, K., Talbot, M.R., Eds.; Geological Society Special Publication: Oxford, UK, 1988; Volume 40, pp. 123–130. [Google Scholar]
  33. Schwark, L.; Empt, P. Sterane biomarkers as indicators of palaeozoic algal evolution and extinction events. Palaeogeogr. Palaeoclimatol. Palaeoecol 2006, 240, 225–236. [Google Scholar] [CrossRef]
  34. Moldowan, J.M.; Seifert, W.K.; Gallegos, E.J. Relationship between Petroleum Composition and Depositional Environment of Petroleum Source Rocks1. AAPG Bull. 1985, 69, 1255–1268. [Google Scholar]
  35. Dai, J.X. Large Coal-Formed Gas Fields and Gas Sources in China; Science Press: Beijing, China, 2017; pp. 1–454. (In Chinese) [Google Scholar]
  36. Gong, D.Y.; Lan, W.F.; Xiang, H.; Ding, J.; Wu, W.A.; Hu, Z.L. Genetic types and origins of natural gases from the eastern Junggar basin. J. China Univ. Min. Technol. 2019, 48, 142–152, (In Chinese with English abstract). [Google Scholar]
  37. Hunt, J.M. Petroleum Geology and Geochemistry; Freeman Company: San Francisco, CA, USA, 1996. [Google Scholar]
  38. Tissot, B.P.; Welte, D.H. Petroleum Formation and Occurrence; Springer: Berlin/Heidelberg, Germany; New York, NY, USA, 1984; pp. 1–699. [Google Scholar]
  39. Bordenave, M.L. Applied Petroleum Geochemistry; Editions Technip: Paris, France, 1993; pp. 344–353. [Google Scholar]
  40. Huang, D.F.; Li, J.C. Continental Hydrocarbon Generation in China; Petroleum Industry Press: Beijing, China, 1982; pp. 1–355. (In Chinese) [Google Scholar]
  41. Peters, K.E. Guidelines for Evaluating Petroleum Source Rock Using Programmed Pyrolysis1. AAPG Bulletin 1986, 70, 318–329. [Google Scholar]
  42. Xiang, B.L.; Li, E.T.; Gao, X.W.; Wang, M.; Wang, Y.; Xu, H.; Huang, P.; Yu, S.; Liu, J.Z.; Zou, Y.R.; et al. Petroleum generation kinetics for Permian lacustrine source rocks in the Junggar Basin, NW China. Org. Geochem. 2016, 98, 1–17. [Google Scholar] [CrossRef]
  43. Pepper, A.S. Estimating of Petroleum Expulsion Behavior of Source Rocks: A Novel Quantitative Approach. In Petroleum Migration; England, A.J., Fleet, A.J., Eds.; Geological Society Special Publication: London, UK, 1992; Volume 59, pp. 9–31. [Google Scholar]
  44. Sandvik, E.I.; Young, W.A.; Curry, D.J. Expulsion from hydrocarbon sources: The role of organic absorption. Org. Geochem. 1992, 19, 77–87. [Google Scholar] [CrossRef]
  45. Cooles, G.P.; Mackenzie, A.S.; Quigley, T.M. Calculation of petroleum masses generated and expelled from source rocks. Org. Geochem. 1986, 10, 235–245. [Google Scholar] [CrossRef]
Figure 1. Overview of the petroleum geology of the Jimsar Depression. (a) The lithology column of Lucaogou Formation; (b) The location of Jimsar Depression in the Junggar Basin; (c) Detailed structural map of the Jimsar Depression.
Energies 15 02331 g001
Figure 2. Plot of Pr/n-C17 vs. Ph/n-C18 showing the depositional environment of the P2l source rocks in the Jimsar Depression (modified after Shanmugam, 1985) [27] (terrestrial organic matter/oxidation environment; maturity; marine organic matter/reducing environment).
Energies 15 02331 g002
Figure 3. Gas chromatography–mass spectroscopy (GC–MS) spectra of the biomarkers of the (a,b) terpanes (m/z 191) and (c,d) steranes (m/z 217) in the P2l source rocks in the Jimsar Depression (the compounds corresponding to all of the labels are shown in Table 2).
Energies 15 02331 g003
Figure 4. Ternary diagram of the relative percentages of the C27, C28, and C29 regular steranes in the P2l source rocks in the Jimsar Depression.
Energies 15 02331 g004
Figure 5. Plots of (a) O/C vs. H/C and (b) atomic ratio of HI vs. Tmax showing the organic matter types of the P2l source rocks in the Jimsar Depression (H/C, atomic ratio; O/C, atomic ratio; immature; mature; oil generation window; highly mature; condensate oil-wet gas; over-mature; dry gas generation).
Energies 15 02331 g005
Figure 6. Analysis of the organic microscopic composition of the whole-rock P2l1 sample (2321.4 m) from Well Ji15 (left image: reflected fluorescence; right image: reflected plane-polarized light). Cl is clay; MiS is microsporinite; R is resinite (R); Ld is liptodetrinite; Cd is vitrodetrinite; SF is semifusinite; MB is mineral bitumen; Py is pyrite.
Energies 15 02331 g006
Figure 7. TOC vs. S1 + S2 diagram showing the abundance of organic matter in the P2l source rocks in the Jimsar Depression (extremely good source rock; good source rock; medium-grade source rock; poor-non-source rock).
Energies 15 02331 g007
Figure 8. Use of sterane isomer maturity parameters to determine the organic matter maturity of the P2l source rocks in the Jimsar Depression.
Energies 15 02331 g008
Figure 9. Two-dimensional simulation profile of the thermal evolution and burial history of the P2l source rocks in the Jimsar Depression (Late Triassic (a); Late Cretaceous (b); after Cretaceous deposition, uplift and denudation of formations (c); Late Paleogene (d); present day(e)). The location of this section can be found in Figure 1c.
Energies 15 02331 g009
Figure 10. Simulation results of the oil production rate under different heating rates of the P2l source rocks in the Jimsar Depression.
Energies 15 02331 g010
Table 1. Biomarker fingerprints of P2l shale in the Jimsar Depression.
WellDepth(m)StrataLithologyC19/C21-Tricyclic TerpaneTricyclic Terpane/Pentacyclic TerpaneC24-Tetracyclic Terpane/C26-Tricyclic TerpaneC35/(C31–C35)Homohopane %C30αβ-Hopane/C29ααα,(R + S)-SteraneGammacerane IndexC31R/C30-HopaneTs/(Ts + Tm)C27-Sterane (%)C28-Sterane (%)C29-Sterane (%)
Ji152280.63P2l1Dark gray fluorescent mudstone0.410.291.127.076.790.230.100.4323.7823.7752.46
Ji1743218.97P2l1Dark gray calcareous mudstone0.120.121.952.724.850.280.120.0513.8037.2448.96
Ji1743227.14P2l1Dark gray dolomitic mudstone0.130.131.552.666.590.310.170.0414.8137.1148.09
Ji241691.75P2l1Gray black mudstone0.080.070.622.875.580.31n.d.0.2718.4132.7748.83
Ji173138.01P2l2Black gray mudstone0.100.141.064.168.200.280.110.0914.9935.3949.62
Ji173138.01P2l2Black gray mudstone0.100.050.824.0112.730.360.160.3234.8126.1339.06
Ji173135.33P2l2Gray black mudstone0.130.061.403.799.880.390.220.3336.5126.1737.33
Ji173135.33P2l2Gray black mudstone0.070.040.714.0519.280.350.150.2942.1522.1635.70
Ji1743135.31P2l2Dark gray mudstone0.120.151.282.404.620.340.120.0720.2534.0945.66
Ji1743113.3P2l2Dark gray mudstone0.100.161.462.574.080.420.220.1018.8833.3947.73
Ji1743134.05P2l2Black gray mudstone0.080.101.382.705.440.350.200.1022.9431.5645.50
Ji1743146.16P2l2Dark gray mudstone 0.120.181.652.903.390.19n.d.0.1218.5341.4540.01
Ji1743158.88P2l2Dark gray mudstone0.320.048.932.566.010.210.180.2319.8439.0741.10
Ji1743166.74P2l2Dark gray mudstone0.110.212.422.233.020.270.170.1621.4740.2938.24
Ji1743177.55P2l2Dark gray mudstone0.160.093.622.136.440.120.120.2522.0837.8740.05
Ji1743217.51P2l2Dark gray calcareous mudstone0.120.171.302.804.890.310.110.0613.1035.7951.11
Ji1743130.76P2l2Black gray mudstone0.120.122.292.328.370.260.160.1425.8130.8343.36
Ji1743114.73P2l2Dark gray mudstone0.110.161.372.397.260.390.200.1431.8328.7239.45
Ji1743117.75P2l2Dark gray mudstone0.130.151.962.4511.130.41n.d.0.1020.5932.5446.88
Ji1743118.78P2l2Dark gray mudstone0.140.192.152.047.080.380.190.0917.6534.2248.13
Ji1743122.14P2l2Dark gray mudstone0.180.095.373.394.140.310.190.1715.7631.3152.93
Ji1743146.19P2l2Dark gray mudstone0.120.161.113.662.800.120.200.1119.2244.6036.19
Ji1743152.98P2l2Dark gray mudstone0.180.214.312.946.270.270.180.1214.6952.9532.36
Ji1743155.32P2l2Dark gray dolomitic mudstone0.220.108.541.465.910.260.210.1514.6957.2628.05
Ji1743162.02P2l2Dark gray mudstone0.220.037.272.347.270.250.180.2218.7641.5639.68
Ji1743196.3P2l2Dark gray dolomitic mudstone0.090.161.552.447.470.270.160.1820.7037.2842.02
Ji222543.06P2l2Dark gray mudstone0.100.151.691.755.250.350.130.1223.9733.6342.40
Ji222554.54P2l2Dark gray dolomitic mudstone0.060.130.872.446.560.400.080.0823.6930.9645.35
Ji222552.67P2l2Dark gray dolomitic mudstone0.090.092.391.515.970.250.080.2135.3532.1132.54
Ji222554.8P2l2Dark gray dolomitic mudstone0.080.071.762.3510.360.550.220.1033.0733.1333.80
Ji232296.12P2l2Gray black calico mudstone0.050.070.812.598.570.510.210.2131.1130.4438.46
Ji232296.04P2l2Gray black mudstone0.040.060.612.488.320.500.210.2230.0230.4139.57
Ji53535.56P2l2Gray black mudstone1.430.08n.d.n.d.4.730.370.250.5217.4332.5150.06
Ji72059P2l2Gray black mudstone0.160.051.264.761.720.160.210.3017.4217.3665.22
Ji71949.61P2l2Gray black mudstone0.050.081.196.701.260.240.170.2418.7331.9149.36
Ji72069.99P2l2Dolomitic mudstone0.290.19n.d.n.d.2.100.130.230.0932.4631.1536.39
Ji72160.2P2l2Dolomitic mudstone0.130.123.623.622.500.240.250.3424.8931.3143.79
Ji72287.45P2l2Dolomitic mudstone0.090.171.062.751.290.14n.d.0.3522.8317.6959.47
Ji71949.61P2l2Dark gray dolomitic mudstone0.000.081.177.192.160.250.210.2619.6933.7946.52
Ji72160.2P2l2Dark gray dolomitic mudstone0.240.0510.90n.d.8.140.230.130.3729.3830.6339.99
Ji72287.45P2l2Dark gray dolomitic mudstone0.330.062.803.069.210.20n.d.0.1032.7026.0541.25
Ji72069P2l2Black mudstone0.070.080.86n.d.1.510.27n.d.0.2117.6128.0654.33
Ji72160P2l2Black dolomitic mudstone0.150.061.865.314.140.61n.d.0.2816.6423.6359.73
Table 2. The definition of the biomarker code.
CodeNameCodeName
S15α(H),14β(H)-pregnaneT6C24,13β(H),14α(H)-tricyclic terpane
S2C22-homopregnaneT7C25,13β(H),14α(H)-tricyclic terpane
S320S-ααα-steraneT8C26-tricyclic terpane
S420R-αββsteraneT9C26-tricyclic terpane
S520S-αββ-steraneT10C24-tetracyclic terpane
S620R-ααα-steraneT11C28-tricyclic terpane
S720R-24-ethyl-10α13β17α-rearranged steraneT12C28-tricyclic terpane
S820S-24-ethyl-10α13α17β-rearranged steraneT1318α,-22,29,30-trisnorhopane(Ts)
S920S-24-methyl-ααα-steraneT1417α,-22,29,30-trisnorhopane(Tm)
S1020R-24-methyl-αββ-steraneT1517α,21β-30-norhopane
S1120S-24-methyl-αββ-steraneT1617α(H),21β(H)-hopane
S1220R-24-methyl-ααα-steraneT1717β(H),21α(H)-moretane
S1320S-24-ethyl-ααα-steraneT1822S-17α(H),21β(H)-homohopane
S1420R-24-ethyl-αββ-steraneT1922R-17α(H),21β(H)-homohopane
S1520S-24-ethyl-αββ-steraneT20Gammacerane
S1620R-24-ethyl-ααα-steraneT2122R-17β(H),21α(H)-homohopane
T1C19,14β(methyl)-tricyclic terpaneT2222S-17α(H),21β(H)-double homohopane
T2C20,13β(H),14α(H)-tricyclic terpaneT2322R-17α(H),21β(H)-double homohopane
T3C21,13β(H),14α(H)-tricyclic terpaneT2422S-17α(H),21β(H)-trishomohopane
T4C22,13β(H),14α(H)-tricyclic terpaneT2522R-17α(H),21β(H)-trishomohopane
T5C23,13β(H),14α(H)-tricyclic terpane
Publisher’s Note: MDPI stays neutral with regard to jurisdictional claims in published maps and institutional affiliations.

