Article

Experimental Study on the Efficiency Improvement of Flat Plate Solar Collectors Using Hybrid Nanofluids Graphene/Waste Cotton

by
Abu Shadate Faisal Mahamude
1,
Wan Sharuzi Wan Harun
1,
Kumaran Kadirgama
2,
Devarajan Ramasamy
1,
Kaniz Farhana
3,
Khalid Saleh
4 and
Talal Yusaf
5,*
1
College of Engineering, Universiti Malaysia Pahang, Gambang 26300, Pahang, Malaysia
2
Faculty of Mechanical and Automotive Engineering Technology, Universiti Malaysia Pahang, Pekan 26600, Pahang, Malaysia
3
Department of Apparel Engineering, Bangladesh University of Textiles, Dhaka 1208, Bangladesh
4
School of Engineering, University of Southern Queensland, Toowoomba, QLD 4350, Australia
5
School of Engineering and Technology, Central Queensland University, Brisbane, QLD 4008, Australia
*
Author to whom correspondence should be addressed.
Energies 2022, 15(7), 2309; https://doi.org/10.3390/en15072309
Submission received: 4 January 2022 / Revised: 11 February 2022 / Accepted: 8 March 2022 / Published: 22 March 2022
(This article belongs to the Section A5: Hydrogen Energy)

Abstract

:
Flat plate solar collectors can easily be termed as the most vastly studied alternative energy transforming and generating technology of the twenty-first century. As the world is racing towards the fourth industrial revolution (Industry 4.0), more and more energy is being consumed for mega projects to be materialized. Electronic devices are not only confined to conventional intermittent and costlier electric energy, but also fuel. Solar energy is now being shared to work smart devices, transform electric energy, and operate automobiles, aeronautics, water heating, and space heating. Traditional flat plate solar collectors can only occupy 50–60% of their thermal efficiency, resulting in less heat generation and a low thermal performance because of using a common absorber made of copper tubing compared to a high conductive metal sheet (copper or aluminum). To ameliorate the thermal efficiency of the solar collector, it is imperative to find a superior alternative heat exchanger that will result in improved thermal performance of the solar collector. In this study, light has been shed in terms of substituting conventional heat absorbers with crystal nano-cellulose (CNC) and a graphene hybrid. An empirical comparison has been drawn by comparing the familiar 0.3% base fluid, 0.5% graphene, and CNC separately, as well as 0.3%, 0.5% CNC, and graphene hybrids at different temperatures. Remarkably, this work has proven that a CNC and graphene hybrid fluid with a volumetric fraction of 0.5% concentration and at a high temperature of 80 °C, gave astounding results for improved thermal conductivity, viscosity, and other parameters. CNC and graphene hybrid nanofluid can be a superior substitute for a conventional base fluid, resulting in prolific thermal performance.

1. Introduction

World energy demand in a variety of contexts, including current state-of-the-art, can cause a devastating impact on global warming in various situation-s; to the point where countries and people are now collaborating to achieve the Paris agreement targets of well below temperature 2 °C [1,2]. The global use of energy has increased exponentially in recent decades, rising from 8588.9 million tons (Mtoe) in 1995 to 13,147.3 Mtoe in 2015 [3]. Energy performance is one of the most important pillars of any policy aimed at ensuring inclusive and sustainable economic growth around the world. Cost-effective measures to improve energy supply security, reduce the carbon footprint of energy networks, and improve the International Energy Agency’s (IEA) welfare and competitiveness remain in place. In recent times, the total primary energy consumption (approximately 80%) has come from fossil fuels [4,5]. Although humans have utilized the sun as a primary source of heat since prehistoric times, solar heating was only widely used for producing hot water for home consumption in the 1960s, primarily in Australia, Israel, and Japan [6]. A rising energy demand, combined with the depletion of traditional energy sources, necessitates a greater use of renewable energy resources. Because of its inexhaustibility and green property, solar energy is the most appropriate alternative to conventional energy sources of all renewable energy resources [7]. Over the last decade, solar photovoltaics (PV) have demonstrated impressive cost reductions and increases in deployment: limiting global warming to 1.5 °C necessitates a rapid and profound transformation of our energy system. Solar photovoltaics (PV) is a mature technology that can assist with this challenge. Solar PV has installed more capacity than any other power-generation technology over the last decade, with a cumulative capacity of more than 600 GW at the end of 2019 [8].
Improvements in the heat transfer capabilities of solar systems appear to be critical, as humans have yet to be successful in commercializing such systems. To address this scarcity [9], one such device is a solar collector, which converts solar energy into thermal energy by using a heat exchanging fluid as an absorber fluid [10]. The most common type of collector is a flat plate solar collector [11]. Using nanofluid as the absorber fluid rather than conventional fluid is an efficient way to improve the performance of a solar collector. A nanofluid is a fluid that contains nano-sized particles known as nanoparticles [12]. These nanofluids are primarily created using one-step and two-step methodologies. The addition of nanoparticles improves the thermal and optical properties of conventional fluids [13]. As a result, the performance of the solar collector is improved, and the collector size is reduced. Many studies have been conducted to improve thermal conductivity using nanofluids [14,15,16]. The absorber fluid effectiveness of nanofluid is determined by particle material, particle size, base fluid material, additives, particle shape, temperature, pH value, particle volume concentration, and nanofluid stability [17]. The addition of surfactant and ultrasonic processing improves the stability of nanofluids [18].
Many solutions, such as the use of nanofluids, have been investigated, and thanks to the advancement of nanotechnology, this method is now possible. Most researchers will find this to be true, researching techniques for increasing the temperature of a small collector’s outlet and comparing it to a real-life one They concluded that nanofluid is the only way, because more thermal efficiency and copper (II) oxide (CuO) nanoparticles are produced in comparison to silicon, having the best performance. Furthermore, SiO2 (silicon dioxide), TiO2 (titanium dioxide), and Al2O3 (aluminum oxide), magnesium, Al2O3, and ZnO (zinc oxide) have an impact. The effect of MgO (magnesium oxide) on the efficiency of cylindrical solar collectors has been studied and demonstrated [19]. A flat solar collector was used to test CuO (volume fraction 0.4%) dispersed in water, and thermal efficiency of 16.7% compared to pure water was recorded [20]. The thermal efficiency was evaluated by considering different flow rates (6, 24, 42, and 60 Lh−1), two-volume fractions of MLG (0.00045% and 0.00068%) with and without a concentrator. Compared to autonomy, the best performance was obtained at 42 Lh−1. In addition, the use of the parabolic concentrator increased the thermal efficiency by approximately 298% compared to the collector without a concentrator. An excellent fit (R2 = 0.970) was obtained between the efficiencies estimated by the semi-empirical equation and those estimated by the measurements made in the present study. The multi-layer graphene nanofluid at concentrations of 0.00045% by volume and 0.00068% by volume, increased the thermal efficiency of the solar collector by 31% and 76%, respectively, compared to the base fluid [21]. The authors experimentally analyzed an evacuated tube solar collector and the usage of a single-walled carbon nanotube (SWCNT) dispersed in water (0.2 vol%). They said that the solar collector usage of this nanofluid exhibited an enhanced thermal performance of 10% compared to the sun collector and the usage of natural water [22].
Graphene has high thermal conductivity (5000 Wm−1·K−1). Furthermore, its dispersion in base fluids improves heat transfer, making graphene an excellent option for nanofluid production [23,24]. Furthermore, this material is extracted from natural graphite and can produce nanostructures with few graphene layers and excellent physical properties [25]. However, it has yet to be studied in works involving solar collectors because the majority of the works in the literature are related to the use of graphene or reduced graphene oxide (rGO) [26]. In the latter case, the thermal conductivity of these nanostructures is not as high as that of pristine graphene, reaching 1390 Wm−1·K−1 [27]. Higher concentrations have been used, necessitating the use of surfactants to prevent rGO agglomeration in the dispersion, raising final production costs and reducing the positive impact of these nanostructures on desirable thermal properties [28]. Several studies in the literature report improvements in the thermal efficiency of solar collectors using graphene-based nanofluids. In comparison to water as the base fluid, graphene-based nanofluid (0.02 wt percent) improved thermal efficiency by 13% in equipment, whereas distilled water recorded a 69.96% thermal efficiency. Nanofluids composed of graphene nanoplatelets with deionized water at mass fractions of 0.0005%, 0.001%, and 0.005% recorded maximum thermal efficiency values of 83.54%, 89.71%, and 93.24%, respectively [20].
The significance of this study is to apply noble hybrid nanofluids at various volume concentrations inside FPSC under direct solar irradiation to determine the efficacy enhancement. These kinds of noble hybrid nanofluids did not occur in FPSC in any previous study. Considering the high thermal conductivity of graphene nanoparticles, the present study aimed to assess the increase in thermal efficiency generated by graphene, CNC, and a hybrid (graphene+CNC) used at low volumetric fractions (0.1% and 0.3%), dispersed in water and ethylene glycol (60%:40%), without surfactant. The system adopted in the present study was a flat plate solar collector. In addition, a semi-empirical equation has been used to estimate the thermal efficiency values. The equation proposed here was based on the experimental data collected here and on dimensional analyses. Furthermore, the efficiency of FPSC will be examined in this study by considering the FPSC tubes (the header and riser) through which the nanofluids can circulate. As a result, standard methods will be used to prepare and characterize graphene and crystal nano-cellulose (CNC) nanoparticles; thermo-physical performances of nanofluids will be evaluated, and finally, nanofluids and hybrid nanofluids will be applied in FPSC to observe the efficiency enhancement of the collector in the steady-state condition under solar radiation impact. The measured thermo-physical properties of the prepared nanofluids and hybrid nanofluids, as well as a comparison with other available studies, will be included in the results.

2. Materials and Methodology for Nano-Cellulose Preparation

According to Lu, et al. [29], the crystal nano-cellulose (CNC) nanoparticle was derived from waste cotton, and the nano-cellulose whisker was prepared by ultrasonic or the microwave assistant method. The reaction conditions were optimized with response surface methodology. Nano-cellulose whisker was prepared by acid hydrolysis [30]. Nano-cellulose was prepared from wood and involved different processes, such as mechanical sharing, chopping, scouring, bleaching, oxidation, sulfuric acid treatment, or hydrolysis [31,32,33,34,35]. Nano-cellulose has been prepared by a low-energy method by using a swelling agent. This swelling agent converts the crystalline area to a more absorbent area. By this low-energy method, the swollen agent converts to nano-cellulose [36,37]. Except for various mechanical and other processes, the nano-cellulose commercial production still depends on the harsh chemical treatment of technology [38]. From Jonathan, waste cotton lint can be used for the preparation of nano-cellulose. The process is to clean the cellulose. There was a combination process applied, named scouring and bleaching. The chemicals used for this process were caustic hydrogen peroxide, wetting agents, detergent, and sodium silicate at a temperature of 90 °C, stirring for 3 h. Afterward, the chemically treated cotton was washed several times for neutralization, then dried in an oven at 100 °C until the weight was constant. The next process was used for the hydrolysis of sulphuric acid and nitric acid. After washing and a few processes, nanocrystalline cellulose was achieved [39]. Nano-cellulose was prepared from Beer Industrial Residuals by acid hydrolysis or the ultrasound method using three hydrolysis times. The diameter range between the nano-cellulose is 73 to 146 nm [40].
The nano-cellulose preparation process was being carried out by ultrasonic and sulphuric acid hydrolysis. The hydrolysis process operation was run in different conditions: 60% (w/v) of H2SO4 solution in an ultrasound bath (Elma 37 kHz, power capacity 320 W, Germany) at a temperature of 45 °C; 55% (w/v) of H2SO4 solution in an ultrasound bath (Elma 37 kHz, power capacity 320 W, Germany) at a temperature of 45 °C; 55% (w/v) of H2SO4 solution in an ultrasound bath (Elma 37 kHz, power capacity 320 W, Germany) at a temperature of 45 °C [41]. After hydrolysis, the milky suspension was folded with a total of 10% solution of cold deionized (DI) water to end the reaction. After that process, a huge amount of water was used for the continuous wash as well as to remove the excessive sulphuric acid after hydrolysis. To recover the sulphuric acid, the solution was heated to remove the excess water through distillation to collect the concentrated acid, which could be used again. The whole process of preparing nano-cellulose from waste cotton has been displayed in Figure 1.

3. Nanoparticles and Base Fluids for the Experiment

3.1. Graphene Nanoparticles

To improve solar collector performance, graphene has natural characteristics of heat flow and thermal conductivity enhancement. Huge graphene-based nanofluids are being explored in the modern era. The unbelievable matter is that many assessments have been done on graphene-based nanofluids; and always, graphene shows the best heat conductivity generation. This is the key driving force that influences many modern scientists and industries to use graphene in the electrical and mechanical fields as well as the total heat flow system of nanofluid and hybrid nanofluids [42]. Graphene has taken the attention of researchers making observations due to the concerning number of applications. Graphene nanofluids provide possible quality applications in powering material, substance units, and heat exchangers for heat to move from one position to another. Challenging as it, it is important to prepare stable nanofluids by graphene nanoparticles to impose the correct action in fluid flow mechanics [43]. The larger superficial interaction area between adjacent graphene particles results in a strong inter-plane van der Waals attraction and irreversible accumulation. The research provides information on the sonication time as well as important findings for preventing graphene nanoparticle aggregation through stirring and vibrations to maintain long-term stability and dispersion for better fluid efficiency [44]. Graphene nanoparticles are nowadays very available in the market. Normally, the size of graphene in the market is 60 mm to 100 mm. Graphene nanoparticles are blackish and 98.5% pure with a specific surface area of less than equal to 40 m2/g. Furthermore, preparing fluids with graphene is very easy and stable, with just a weight meter, ultra-sonication stirring, and an ultrasonic cleaner required. Normally, 45 min is required for a graphene nanofluids preparation. Other particles are not so easy for sonication, and it takes lots of time and is oftentimes very hard to achieve stable nanofluids working. To improve the thermal conductivity of graphene nanofluids, researchers updated Hummers’ process. However, as the concentration of nanoparticles increased, thermal conductivity improved. However, in our research, sodium dodecylbenzene sulfate was used as a surfactant, and the nanofluid was prepared in one phase. Nanoparticle settling was visible with the naked eye in a 0.2 volume percent concentration of nanofluid. As a result, the residual volume concentrations of nanofluids were considered. The aim of experimenting with different volumes, such as 0.1%, 0.3%, and 0.5% vol. concentrations were to find the best optimum nanofluid concentration for real-time experimentation [45]. Graphene collected was the American supermarket brand.

3.2. Crystal Nano-Cellulose (CNC)

Heat transfer improvement has become an important challenge in the field of thermal engineering. Because of their immense application within thermal energy transfer, researchers have found a modern technique for enhancing heat transfer performance. This will be done by the dispersion of the nano-sized particles into the bottom liquids, which might manufacture a better heat transfer constant once it is compared to traditional liquids [46]. As per practical measurement by using CNC in the solar fluid flow, the thermal conductivity increases as per the nanofluids concentration. For example, the thermal conductivity of the nanofluid was tested at three different temperatures (30 °C, 50 °C, and 70 °C) and at volume concentrations of 0.1%, 0.3%, 0.5%, 0.7%, 0.9%, 1.1%, 1.3%, and 1.5%. It is clear from observation that thermal conductivity increases as the CNC volume concentration and temperature rise. With a CNC volume concentration of 1.3% and 1.5% and a temperature of 70 °C, the highest thermal conductivity is achieved. Meanwhile, at a temperature of 30 °C and a CNC volume concentration of 0.1%, the lowest thermal conductivity is obtained [47]. Crystal nano-cellulose (CNC) is made from waste cotton using different concentrations, such as 0.1%, 0.3% and 0.5%. Moreso, we used different temperatures, such as 30 °C, 50 °C, and 70 °C. Nano-cellulose sizes were below 50 nm.

3.3. Ethylene Glycol and Hybrid Nanofluid

Ethylene glycol is a common organic compound that is used in both research and industry, such as the energy, car, and plastic industries. Due to unique physical and chemical characteristics, there is a long variety of use explored in the research field of ethylene glycol (EG). Ethylene glycol is easily mixed with water and has a comfortable flow in a variety of situations [48]. Furthermore, EG is non-flammable and low-toxic, and it outperforms higher volumetric energy density. Moreover, it is fully soluble in water and other polar solvents [49,50]. A typical heat transfer fluid mixture (water + ethylene glycol) was sonicated with nanographene at various concentrations. The main goal was to find a nanofluid that was more efficient but did not put too much strain on the solar collector loop due to pump failure caused by higher viscosity, which would force a device to redesign. Since the solar collector must withstand all forms of weather, a mixture of water and ethylene glycol was chosen instead of water. Ethylene glycol is a highlighted fluid in the research area of solar collector fluid flow to enhance the efficiency of a solar collector [51]. Nowadays, there is a rapid development of solar systems/solar collectors, so efficiency enhancement is a challenge. For preparing nanofluid or hybrid nanofluids, base fluid is important because it is related to the stability of the fluids after preparation and the performance under different conditions. For example, temperature, viscosity, density are the variables. Thus, considering the base fluid to control the operating variables in the different conditions is a challenge [52]. The corrosion behavior of ethylene glycol was studied experimentally, and it was discovered that a coating of Al-alcohol products decreases the metal’s corrosion rate. With the thermal efficiency and corrosion impact of nanofluids in mind, EG with distilled water (W:EG 60:40) was chosen as the base or working fluids.

4. Preparation of CNC, Graphene, and Hybrid (Graphene+CNC) Nanofluids

The first and most important aspect of experimental research on nanofluids is the preparation method, which should be agglomeration-free and have low deposition over a long-time span in actual applications. Nanofluids are a complex mixture of liquid (base fluid) and solid (nanoparticle) that require some special requirements, such as a long-term stable suspension, negligible agglomeration of nanoparticles, no chemical change to the base fluid (acidic), and so on. Nanofluids are created by dispensing nano-sized particles in a base fluid, such as water, oil, or ethylene glycol (EG), and are typically created in a single (e.g., graphene oxide) or two-step (e.g., graphene nanofluid) method [53]. The two-step method was used in this study to prepare the nanofluids, which is similar to many previous studies, such as [47,54]. CNC nanoparticles were dispersed in the base fluid (W:EG 60:40) at various volume fractions, such as 0.1%, 0.3%, and 0.5%. Using the volume concentration, the required mass of nanoparticles was calculated [7] by Equation (1) [55]. Then it was mixed for 60 min by magnetic stirrer and checked until there was a clear stable mixture.
φ = W / ρ p W ρ p + w b f / ρ b f
Here, φ is the volume concentration, W is the mass of the fraction, the subscripts p, and bf stand for nanoparticles and base fluid, respectively. The sonication of nanofluids is a critical step in preparing stable nanofluids by uniformly dispersing the nanoparticles into the base fluids and avoiding any agglomeration or agitation of nanoparticles that may occur during the preparation process.
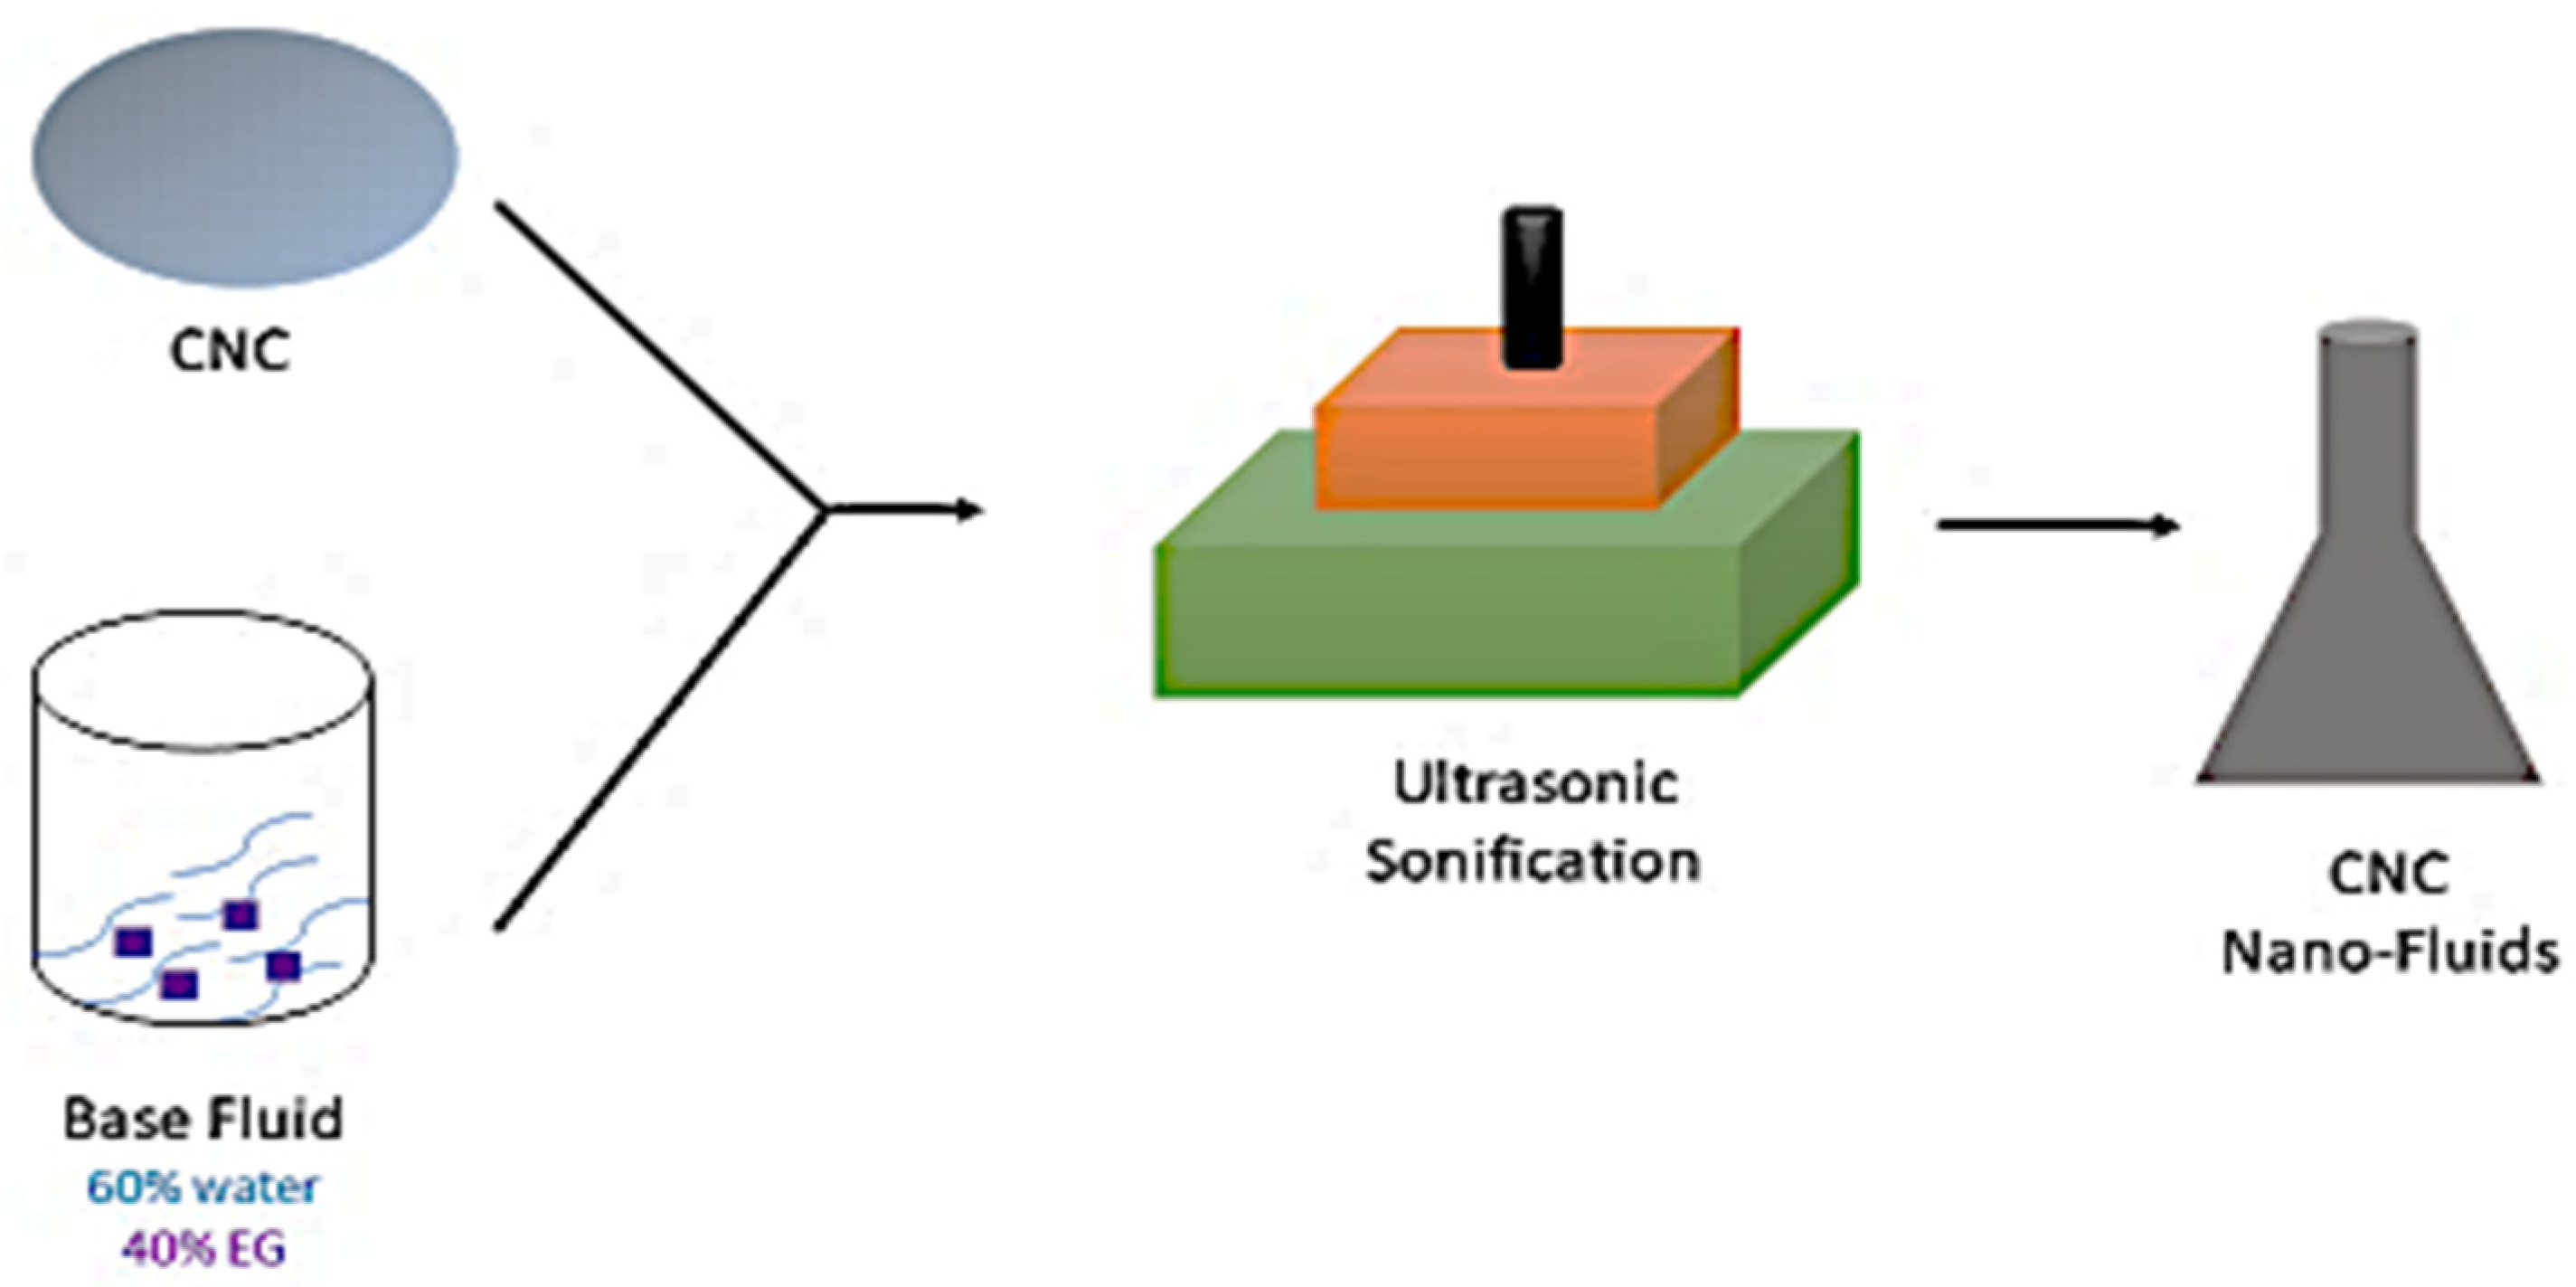
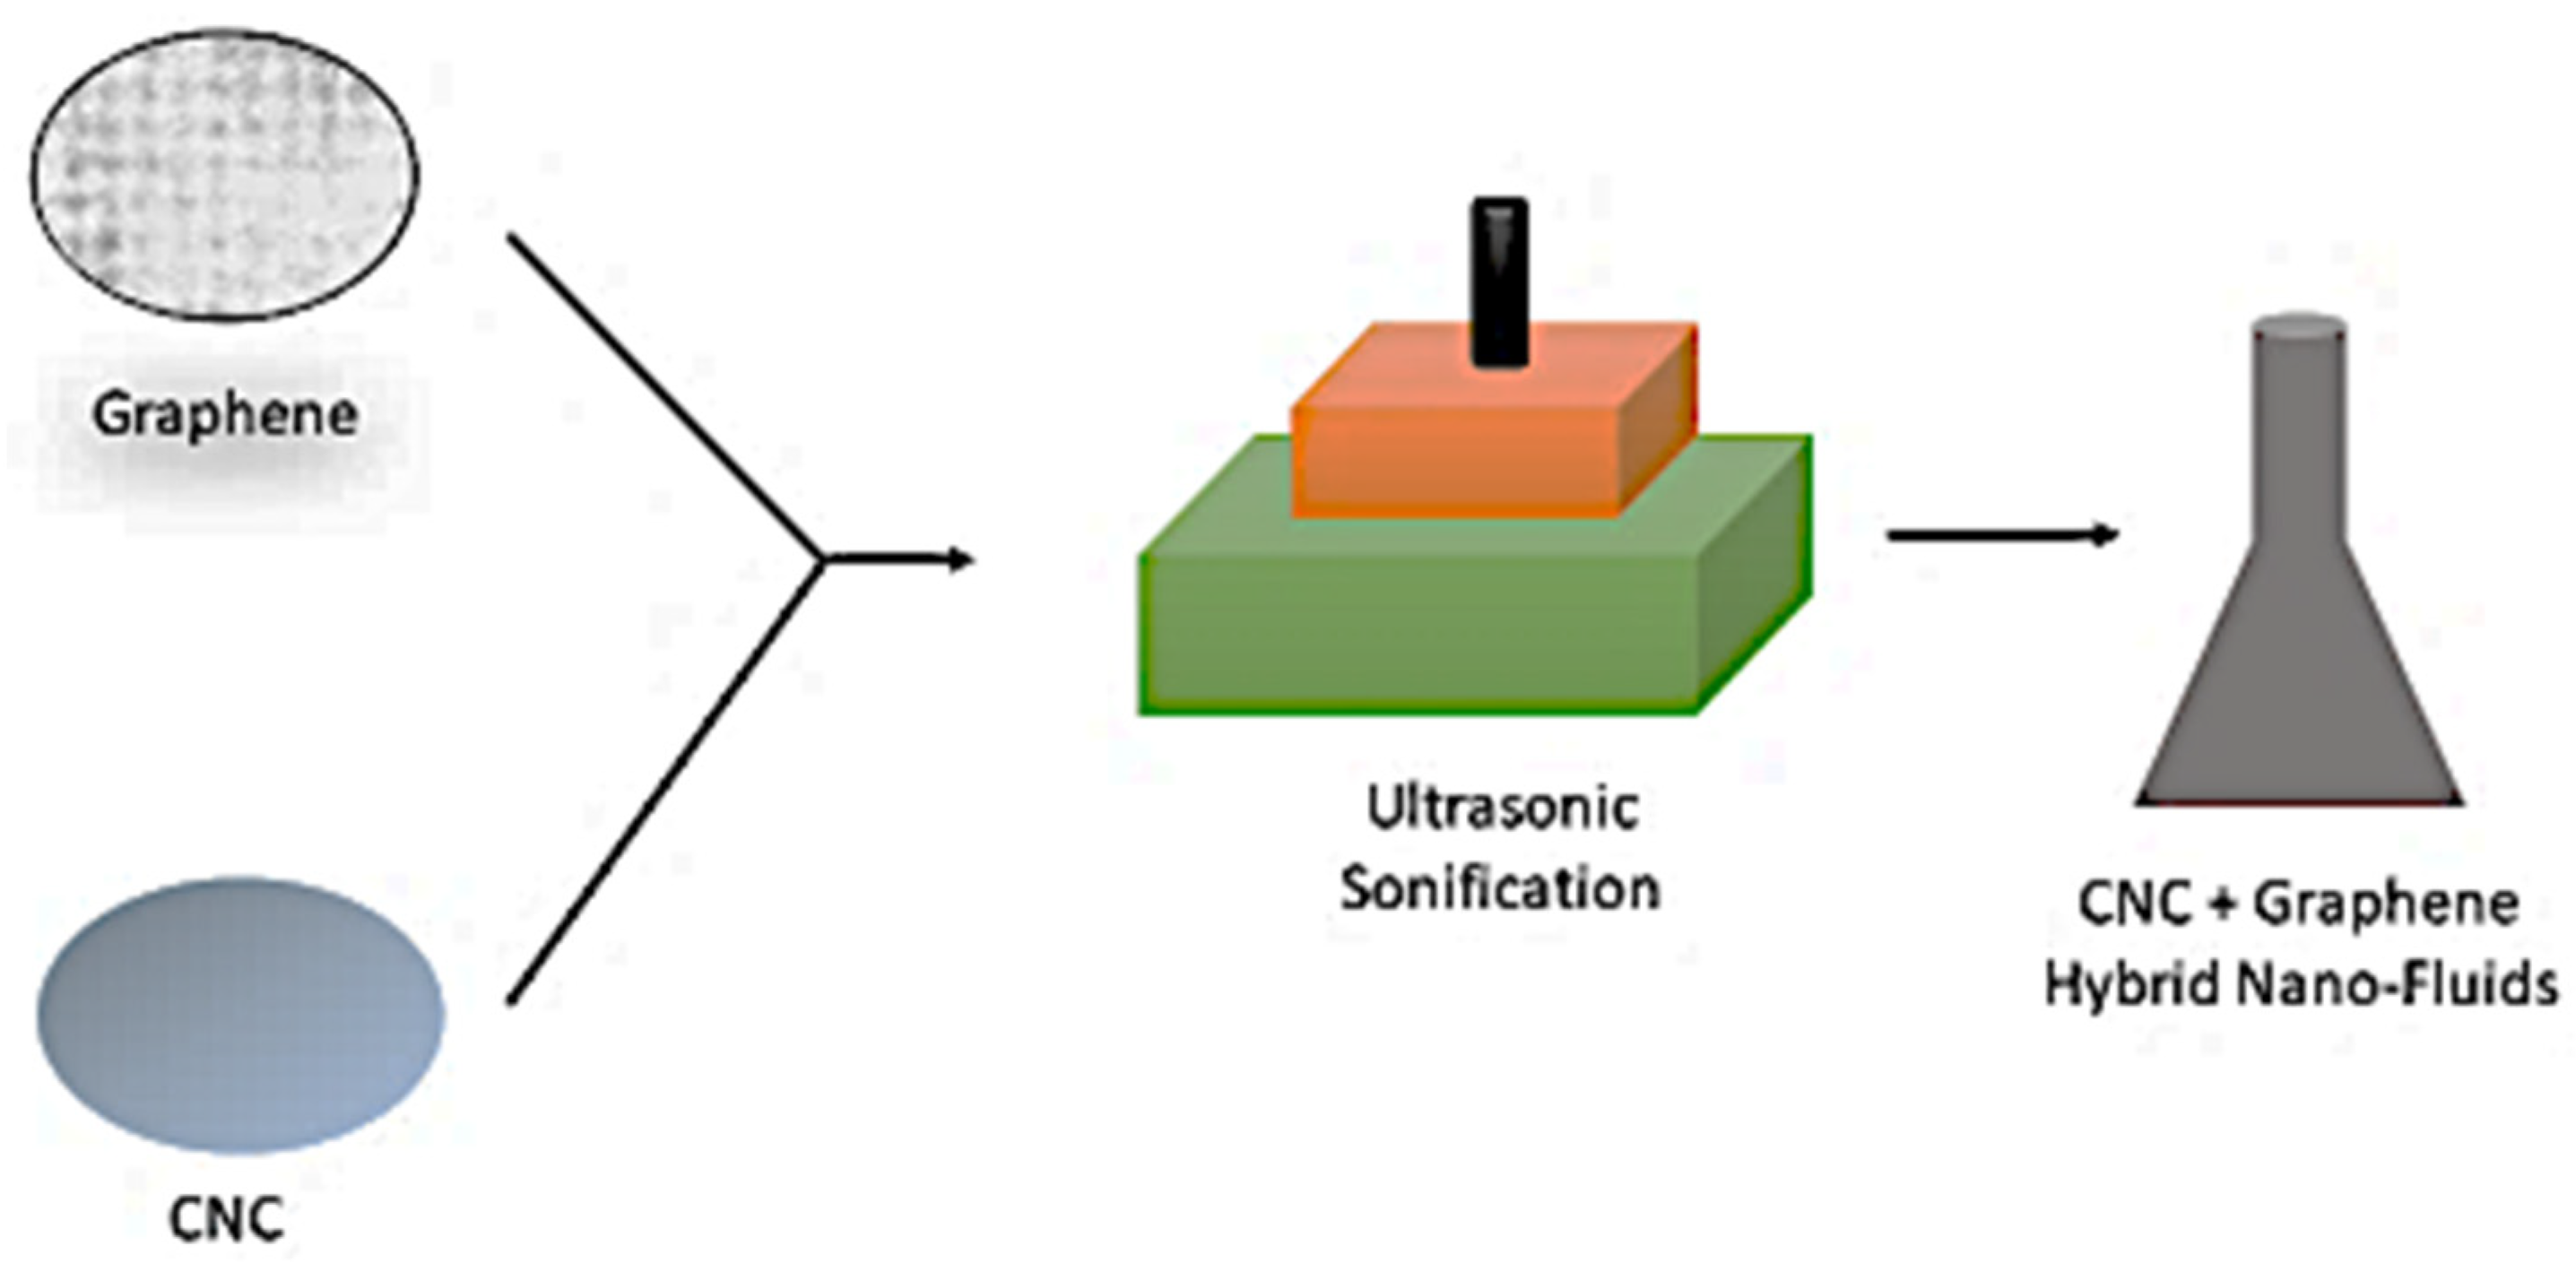
Chemical techniques, such as sol-gel and vapor state analysis, as well as mechanical techniques, such as grinding and milling, are used to obtain the dry powder; two-step methods are used in that process [56]. The finely ground powder is then mixed with a base fluid, such as ethylene glycol, using ultrasonic vibrators, ball milling, amalgamation, and high-quality mixing. Frequent stirring reduces nanofluid aggregation, which is a major concern in the synthesis of nanofluids. A two-step analysis methodology is a cost-effective way to develop nanofluids at an effective rate [57]. Graphene, CNC, and the hybrid (graphene+CNC) preparation methods have been portrayed in Figure 2, Figure 3 and Figure 4, respectively.
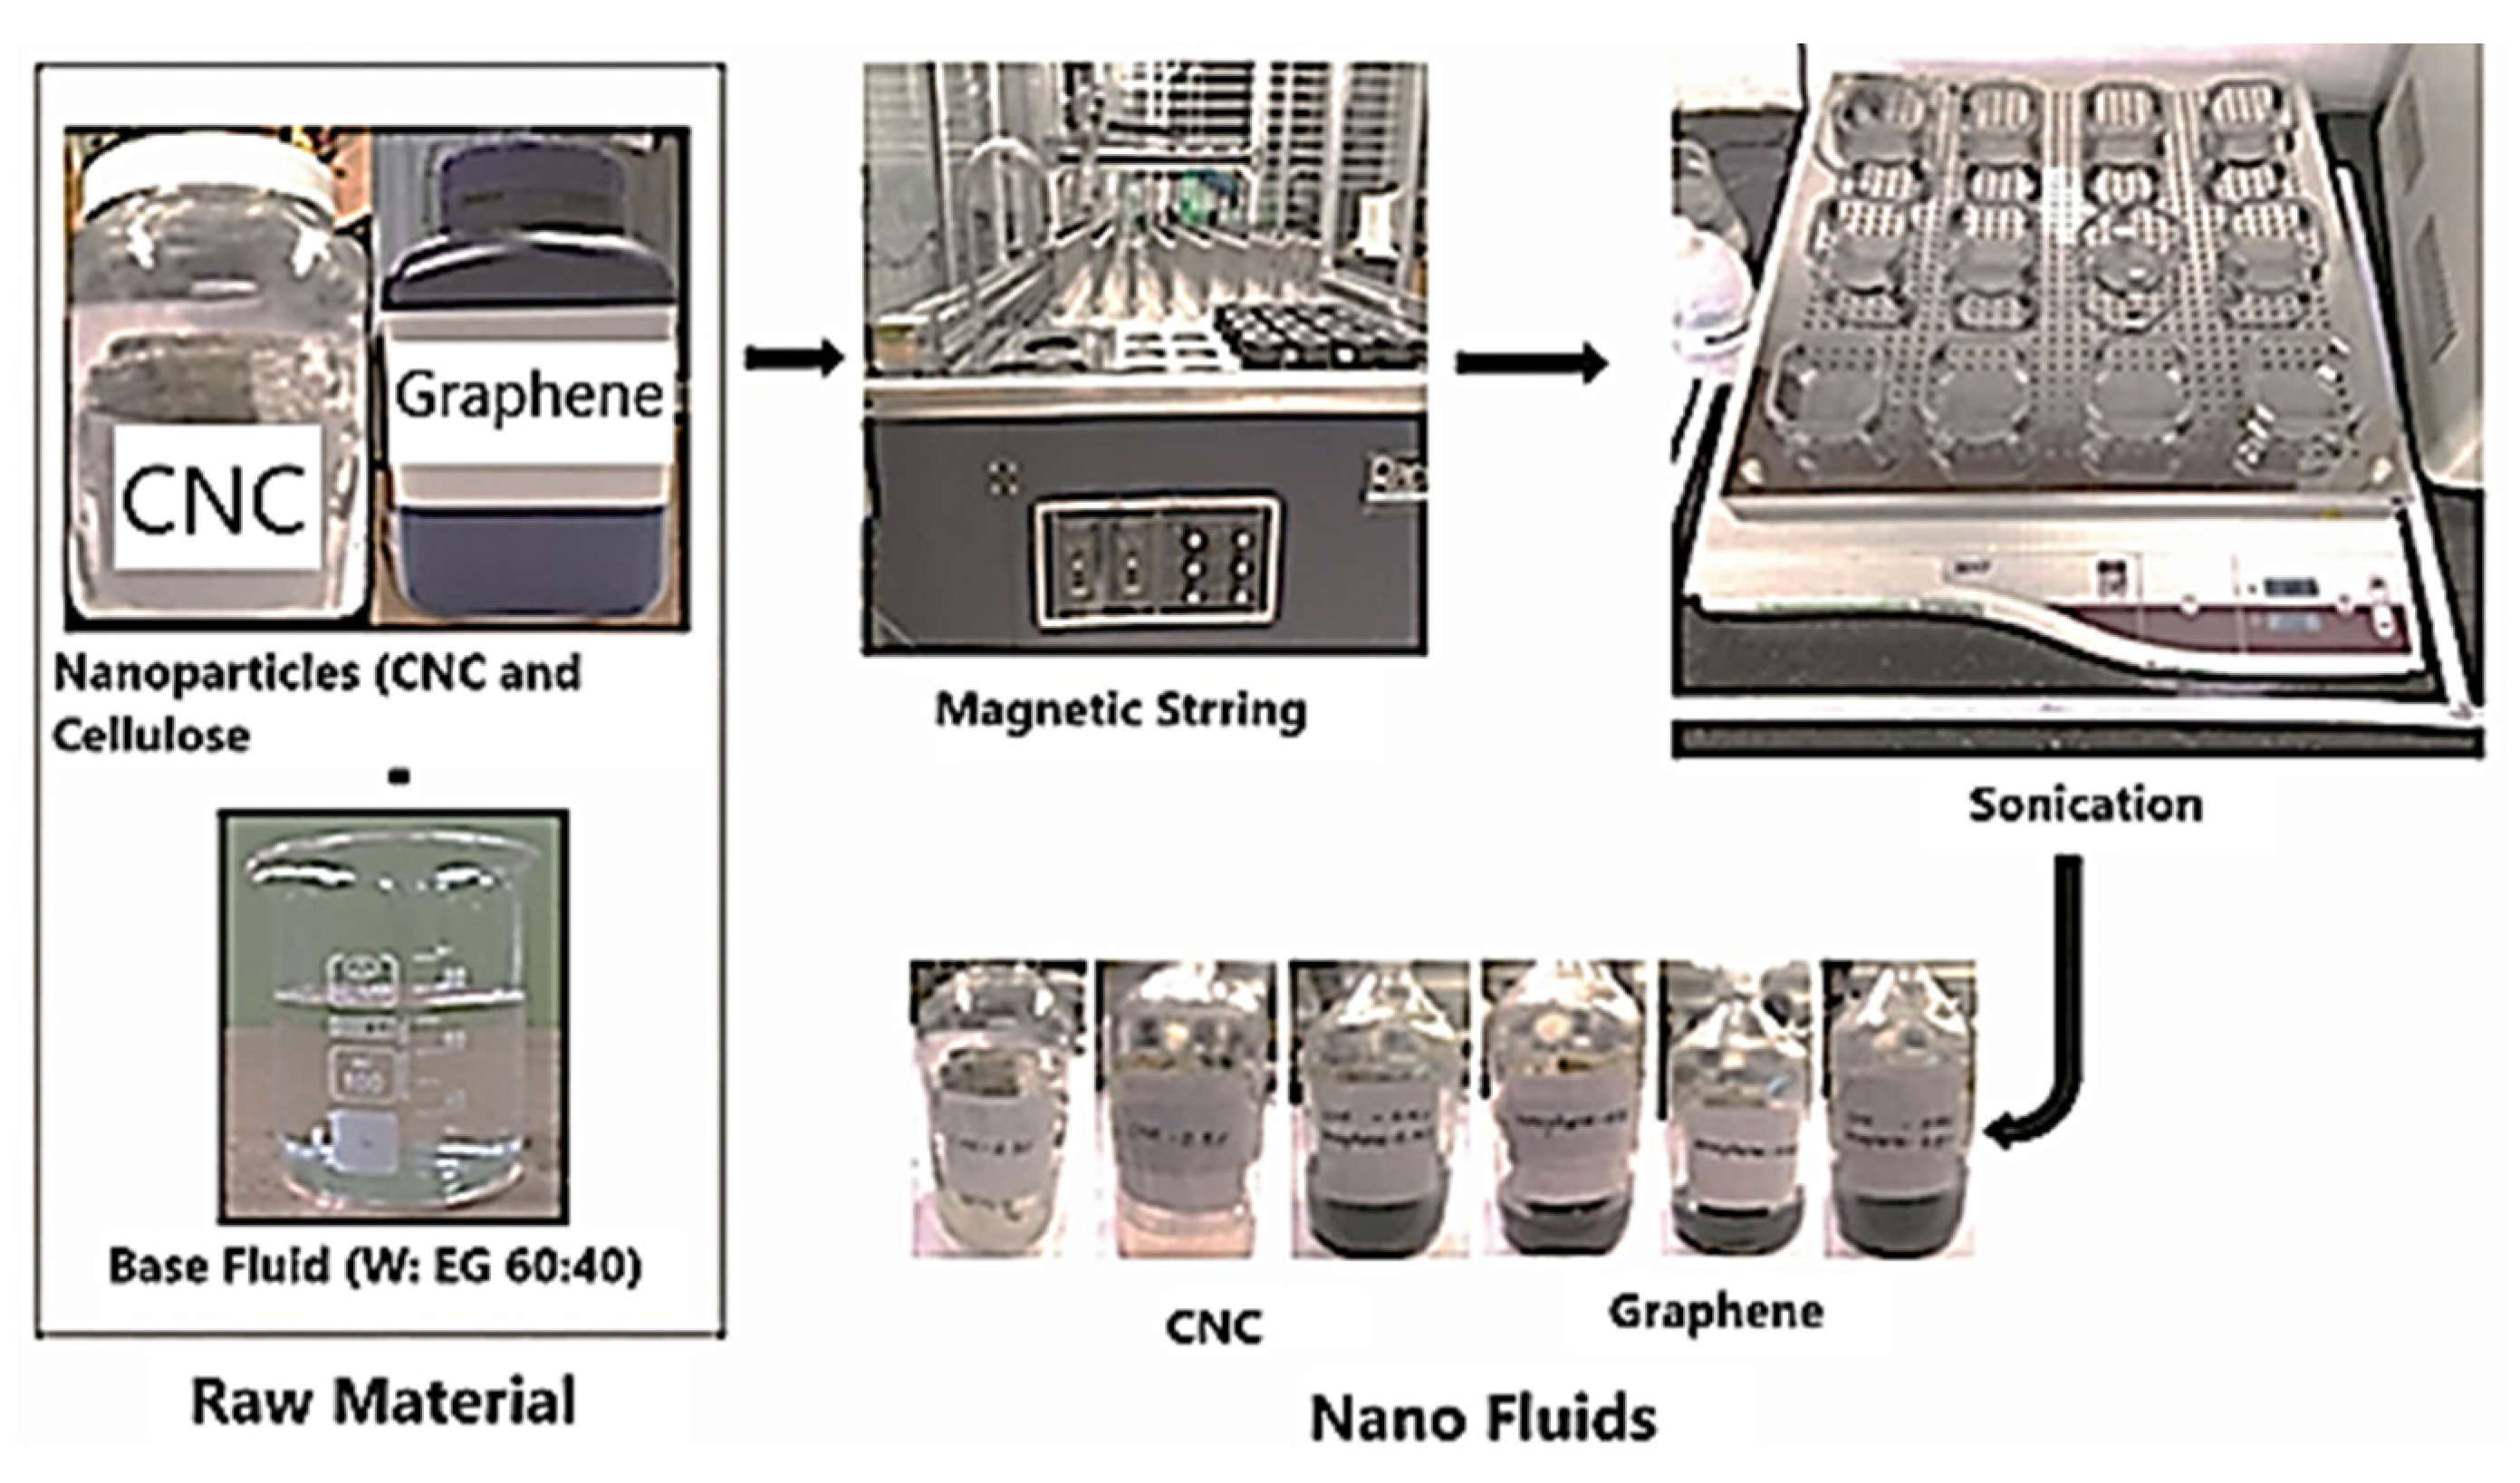
Stability is the major issue of nanofluids and hybrid nanofluids. Indeed, even with advanced and innovative techniques for preparing nanofluids, there are many challenges in preparing ideal nanofluids that go beyond focusing on improving agglomerates that source the arrangement and step-up small-scale heat moving objects. The accumulation of nanoparticles in liquids is primarily caused by the solid van der Waals force, as well as high surface territories between nano-sized powders and sedimentation [58]. On the other hand, the preparation of graphene nanofluids without surfactants was a challenge due to the water solubility of graphene nanoparticles. There are few special cares needed at the time of stirring. Magnetic stirring is used for proper mixing with water and ethylene glycol (60%:40%). Temperature also had to be maintained at 60 °C at the time of stirring. As of late, carbon nanomaterials like carbon nanotubes and graphene have been considered to manufacture improved thermal heat transfer nanofluids; yet utilizing them to prepare stable nanofluids alters testing, considering their hydrophobicity. Thus, a stable fluid graphene and carbon nanotube scattering was arranged utilizing nanostructured cellulose with practically no extra synthetic substances [59]. We mixed nanofluids from nano-cellulose and nanofluids from graphene together, and then again, followed the procedure of magnetic stirring rather than ultrasonic in the laboratory until the solution showed a better visible result. The entire laboratory’s process of the preparation of graphene, CNC, and hybrid nanofluids is shown in Figure 5.

5. Experimental Setup

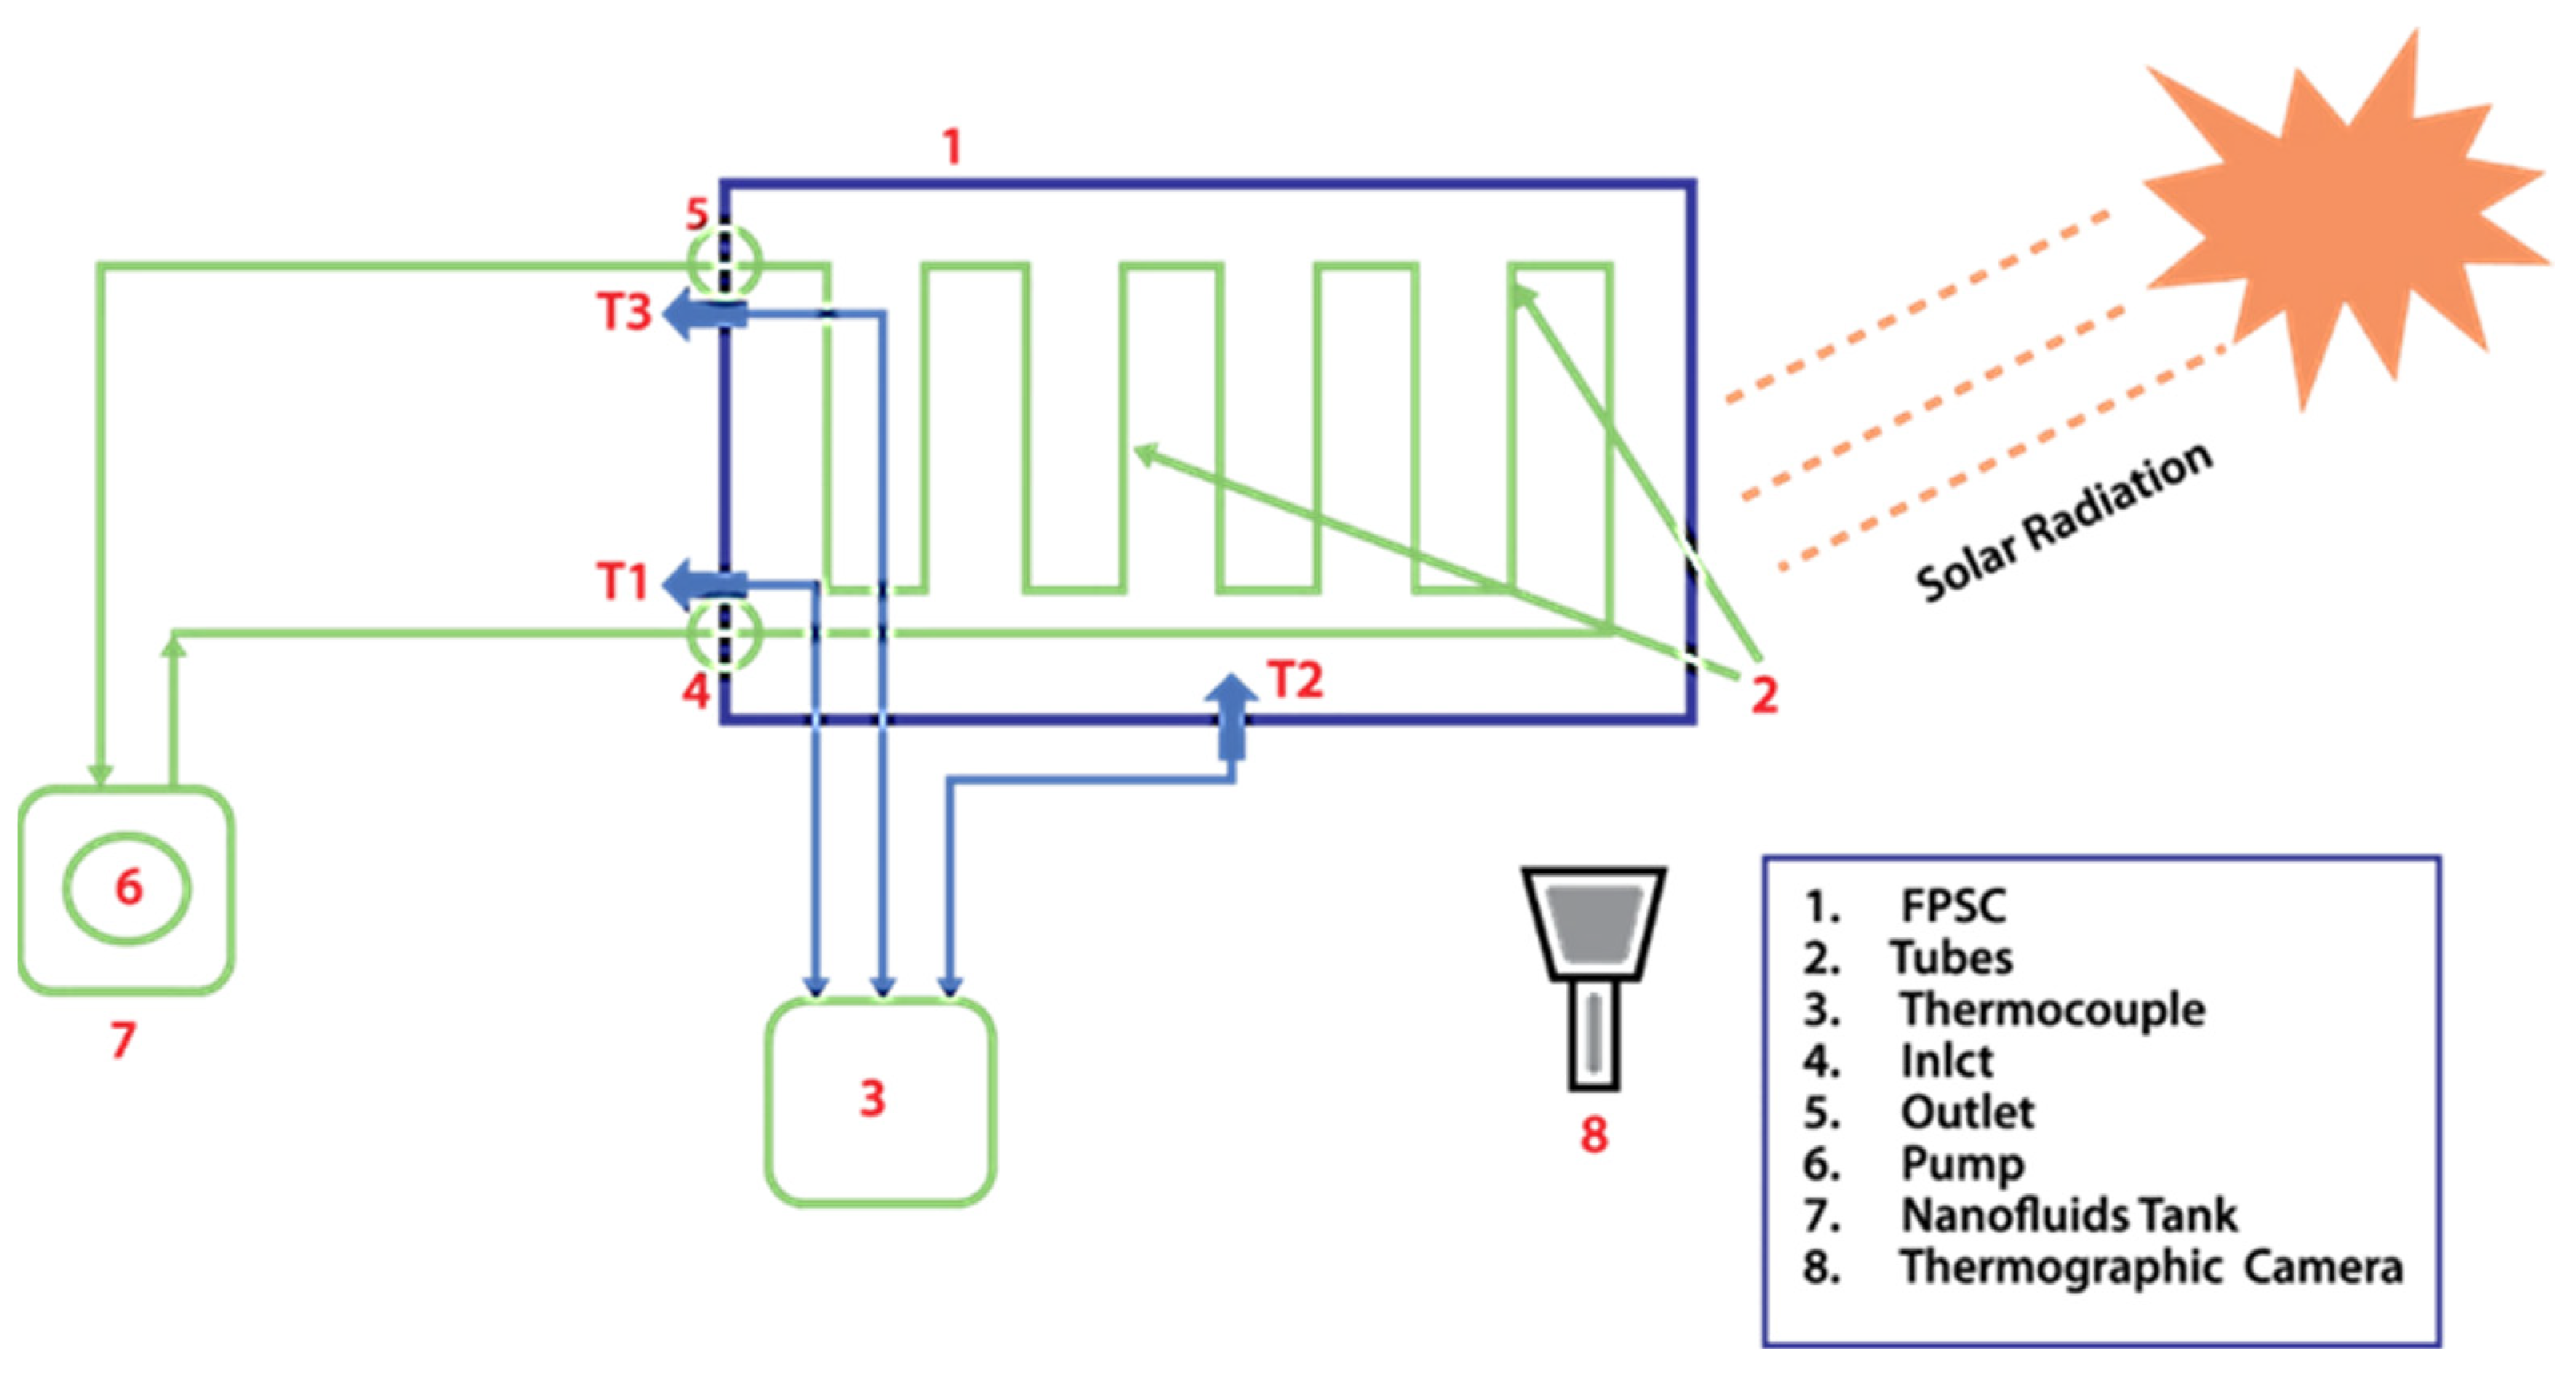
Ethylene glycol has been used instead of water, but here, 60:40 was the ratio for water: ethylene glycol. Figure 6 expresses the total experimental arrangement of the study. The flow rate of the submersible pump was tested before putting the nanofluids in FPSC. Entropy generation, energy efficiency, collector size reduction, and pumping power are some of the other performance metrics to consider. The most essential aspects that influence FPSC efficiency are discussed. The experimental designing model of flat plate solar collector, as shown in Table 1, specifically the arrangement of header and riser tubes has been selected based on the study of [7] and the development of the solar collector has been depicted in Figure 7. The authors experimentally investigated the efficiency of FPSC by using Al2O3 and CNC nanofluids at 0.3% and 0.5% volume concentrations under direct solar radiation. They reported a significant enhancement of FPSC about 2.48% and 8.48% by Al2O3 and CNC at 0.5% volume concentration, whereas following the authors’ procedure, we used the same concentration of graphene and CNC and added one hybrid solution of graphene+CNC (0.3%) and graphene+CNC (0.5%) to discover the efficiency of the solar collector. The entire process is shown in Figure 8.

6. Wavelength Analysis

Solar energy is by far the most exploitable resource among renewable energy sources. It is completely free to use and does not require transportation [60]. Solar thermal energy is the most often used application among them. Traditional sun thermal collectors include flat plate and vacuum tube collectors. Solar thermal collectors now catch light energy on an absorbing surface, which must then transfer the energy to a flowing fluid via convection. This solar thermal collection mode will have two negative consequences [61]. Hence, graphene nano-nanofluid can be used in solar thermal systems as well as flat plate solar collectors. CNC, graphene, and hybrid nanofluid were absorbed in the cotton fabric, then it was analyzed by the Data Color Spector 700 UV model.
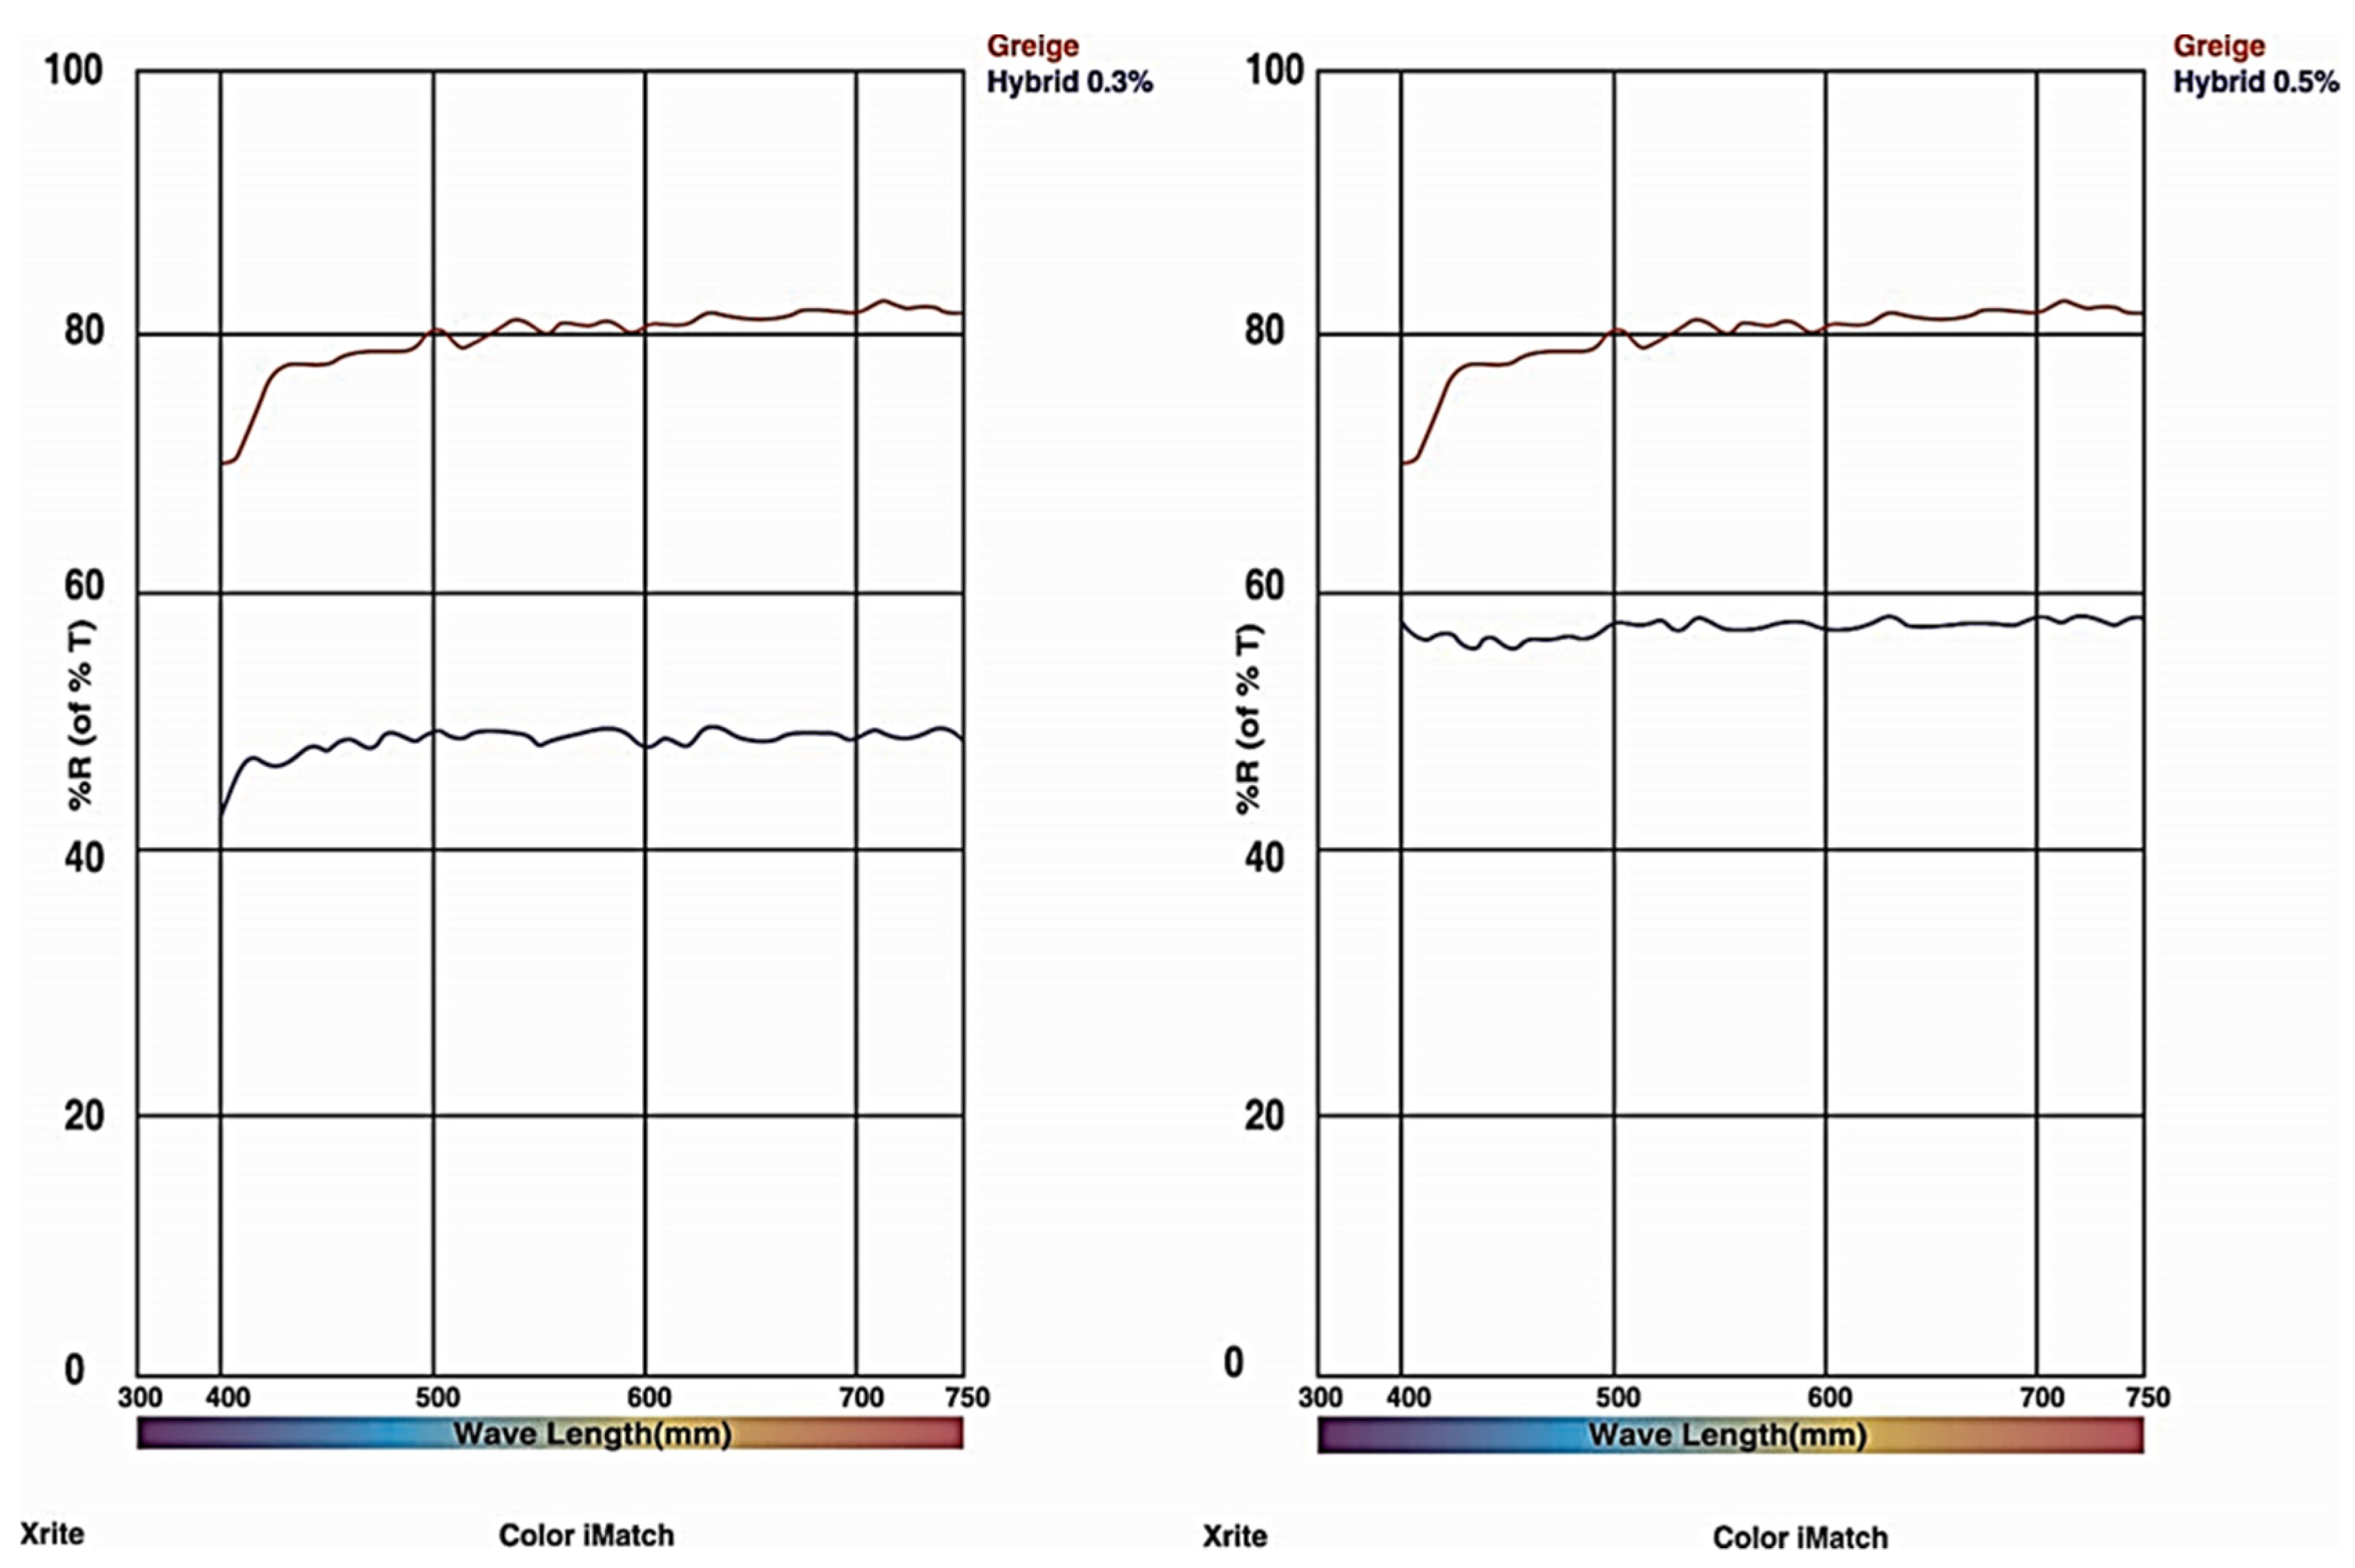
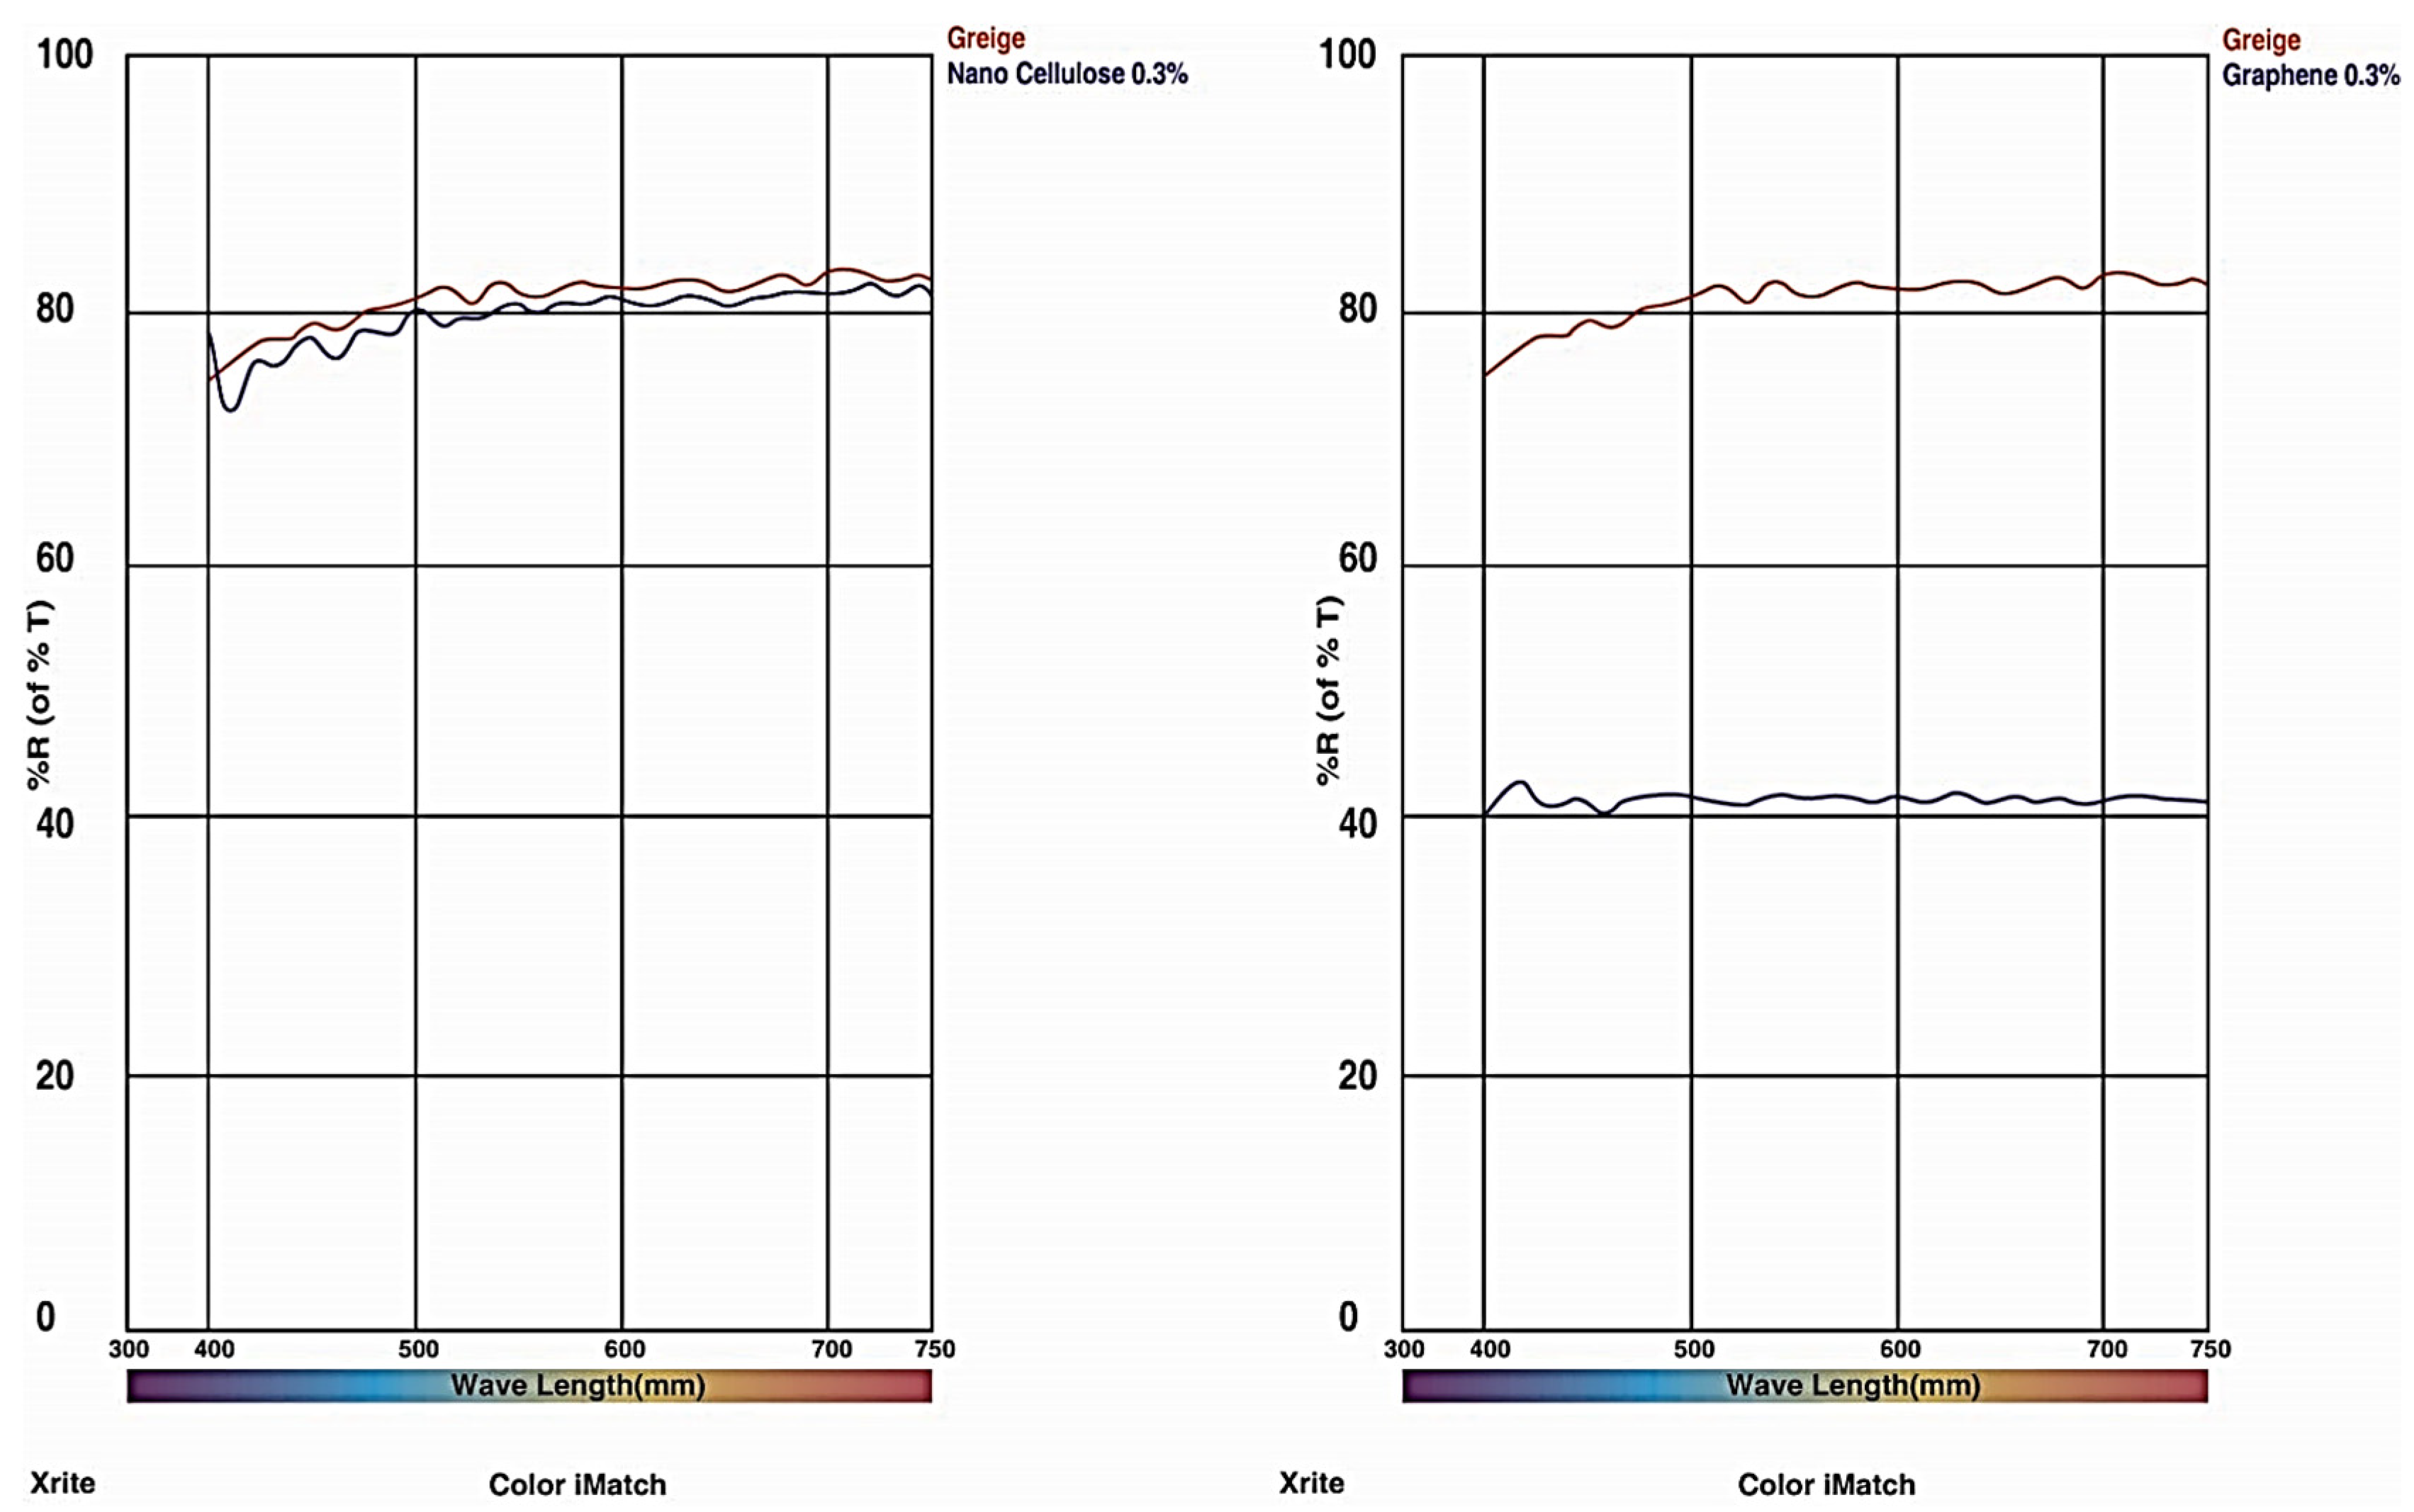
Figure 9 illustrates the hybrid wavelength and radiation percentage; blue color denotes the radiation percentage of nanofluids with fabric and the red color denotes only fabric. A 0.5% hybrid nanofluid showed more radiation near to 60%. As seen in Figure 10 a comparison of CNC and graphene of the same volume concentration is 0.3% only. Nano-cellulose demonstrates the best result in the radiation, and it crosses 80% of R%. On the other hand, graphene nanofluid shows as a usual radiation percentage on the fabric, where R% of 0.3% graphene was 40%. In nanofluids, a strong absorption band in the range of 400–750 nm exists (this range of wavelengths is in the visible region of the sun). This indicates that at larger concentrations of graphene nanofluids, roughly 100% of sunlight is absorbed inside the thin layer of liquid flowing in a conventional solar thermal receiver.

6.1. Thermo-Physical Theoretical Analysis

A two-step method was utilized to prepare the nanofluid solution [62]. Firstly, the amount of the nanoparticles required for each volume fraction was calculated using Equation (2):
= 1 100 m ρ n p ρ b f + 1 × 100 %
where denotes volume fraction of the nanoparticles, m denotes the nanoparticles mass, ρ n p denotes the nanoparticles bulk density, and ρ b f is referred to as the base fluid density. Certain operational parameters, namely absorbed heat by the fluid, the thermal heat capacity of nanofluid are required to assess the thermal efficiency of FPSC, however, at first, the amount of heat absorbed by the collector must be determined. To concise this, the amount of heat was calculated using the relations (3) or (4) presented in ASHRAE Standard no. 93–86 [63,64,65].
Q = m ˙ C p   ( t 0 t i )
Q = A C F R [ G τ a U L ( t i t a ) ]
Here, absorbed heat Q is arrested by the agent fluid to produce energy. The equations mentioned above, the quantity Q signifies the amount of heat absorbed by the agent fluid, m ˙ denotes to as flow rate of base fluid C p refers to the thermal heat capacity, t o addresses the outlet fluid temperature, t i addresses the inlet fluid temperature, t a denotes the ambient temperature, A C refers to the collector level, F R refers to the heat dissipation factor, G denotes the amount of the light source radiation, τ a is the absorption/product conversion, and U L is the general loss coefficient of the solar collector. Specific heat capacity bears the significance of expressing the amount of heat required to increase the temperature of a unit mass material to an extent of one unit. However, the specific heat capacity of the nanofluid ( C p , n f ) is calculated by using the following relation [66] Equation (5):
C p , n f = n p ( ρ c ) n p + ( 1 n p ) ( ρ c ) b f ( 1 n p )   ρ b f + n p ρ n p
This equation illustrates the specific heat capacity of the fluid where represents the volume fraction of nanoparticles, C p , n p represents specific heat capacity of nanoparticles, and C p , b f refers to the specific heat capacity of the base fluid. Hence, the empirical thermal efficiency of the solar thermal collector can be measured by using [67] Equations (5) or (6):
η i = Q A C G = m ˙ C p   ( t o t i ) A C G
η i = F R   ( τ α ) F R U L   ( t i t a G )
The insulating tendency or inefficiency of a material to hold absorbed is termed as the heat dissipation factor ( F R ) can be estimated by Equation (8):
F R = m ˙ C p   ( t 0 t i ) A C [ G τ a U L ( t i t a ) ]
The density of the nanofluid can be calculated by using [66] Equation (9):
ρ n f = ρ n p ( ) + ρ b f ( 1 )  
As a whole, the thermal conductivity of the nanofluid can be extrapolated thoroughly by using the following equation [66] Equation (10):
K n f = K b f   [ K n p + ( n 1 )   K b f ( n 1 )   ( K b f K n p ) ] [ K n p + ( n 1 )   K b f +   ( K b f K n p ) ]
Here, parameter n is equal to 3 as the consequence of the spherical shape of the particles.
The efficiency of the solar collector has been computed using Equation (11):
η = Q u I t A c
where
  • η   = Efficiency (%) of the FPSC
  • Q u = Energy gain (kW) by the FPSC
  • I t = Solar radiance (W/m2)
  • A c = Surface area (m2) of FPSC

6.2. Thermophysical Experimental Analysis: Viscosity Analysis

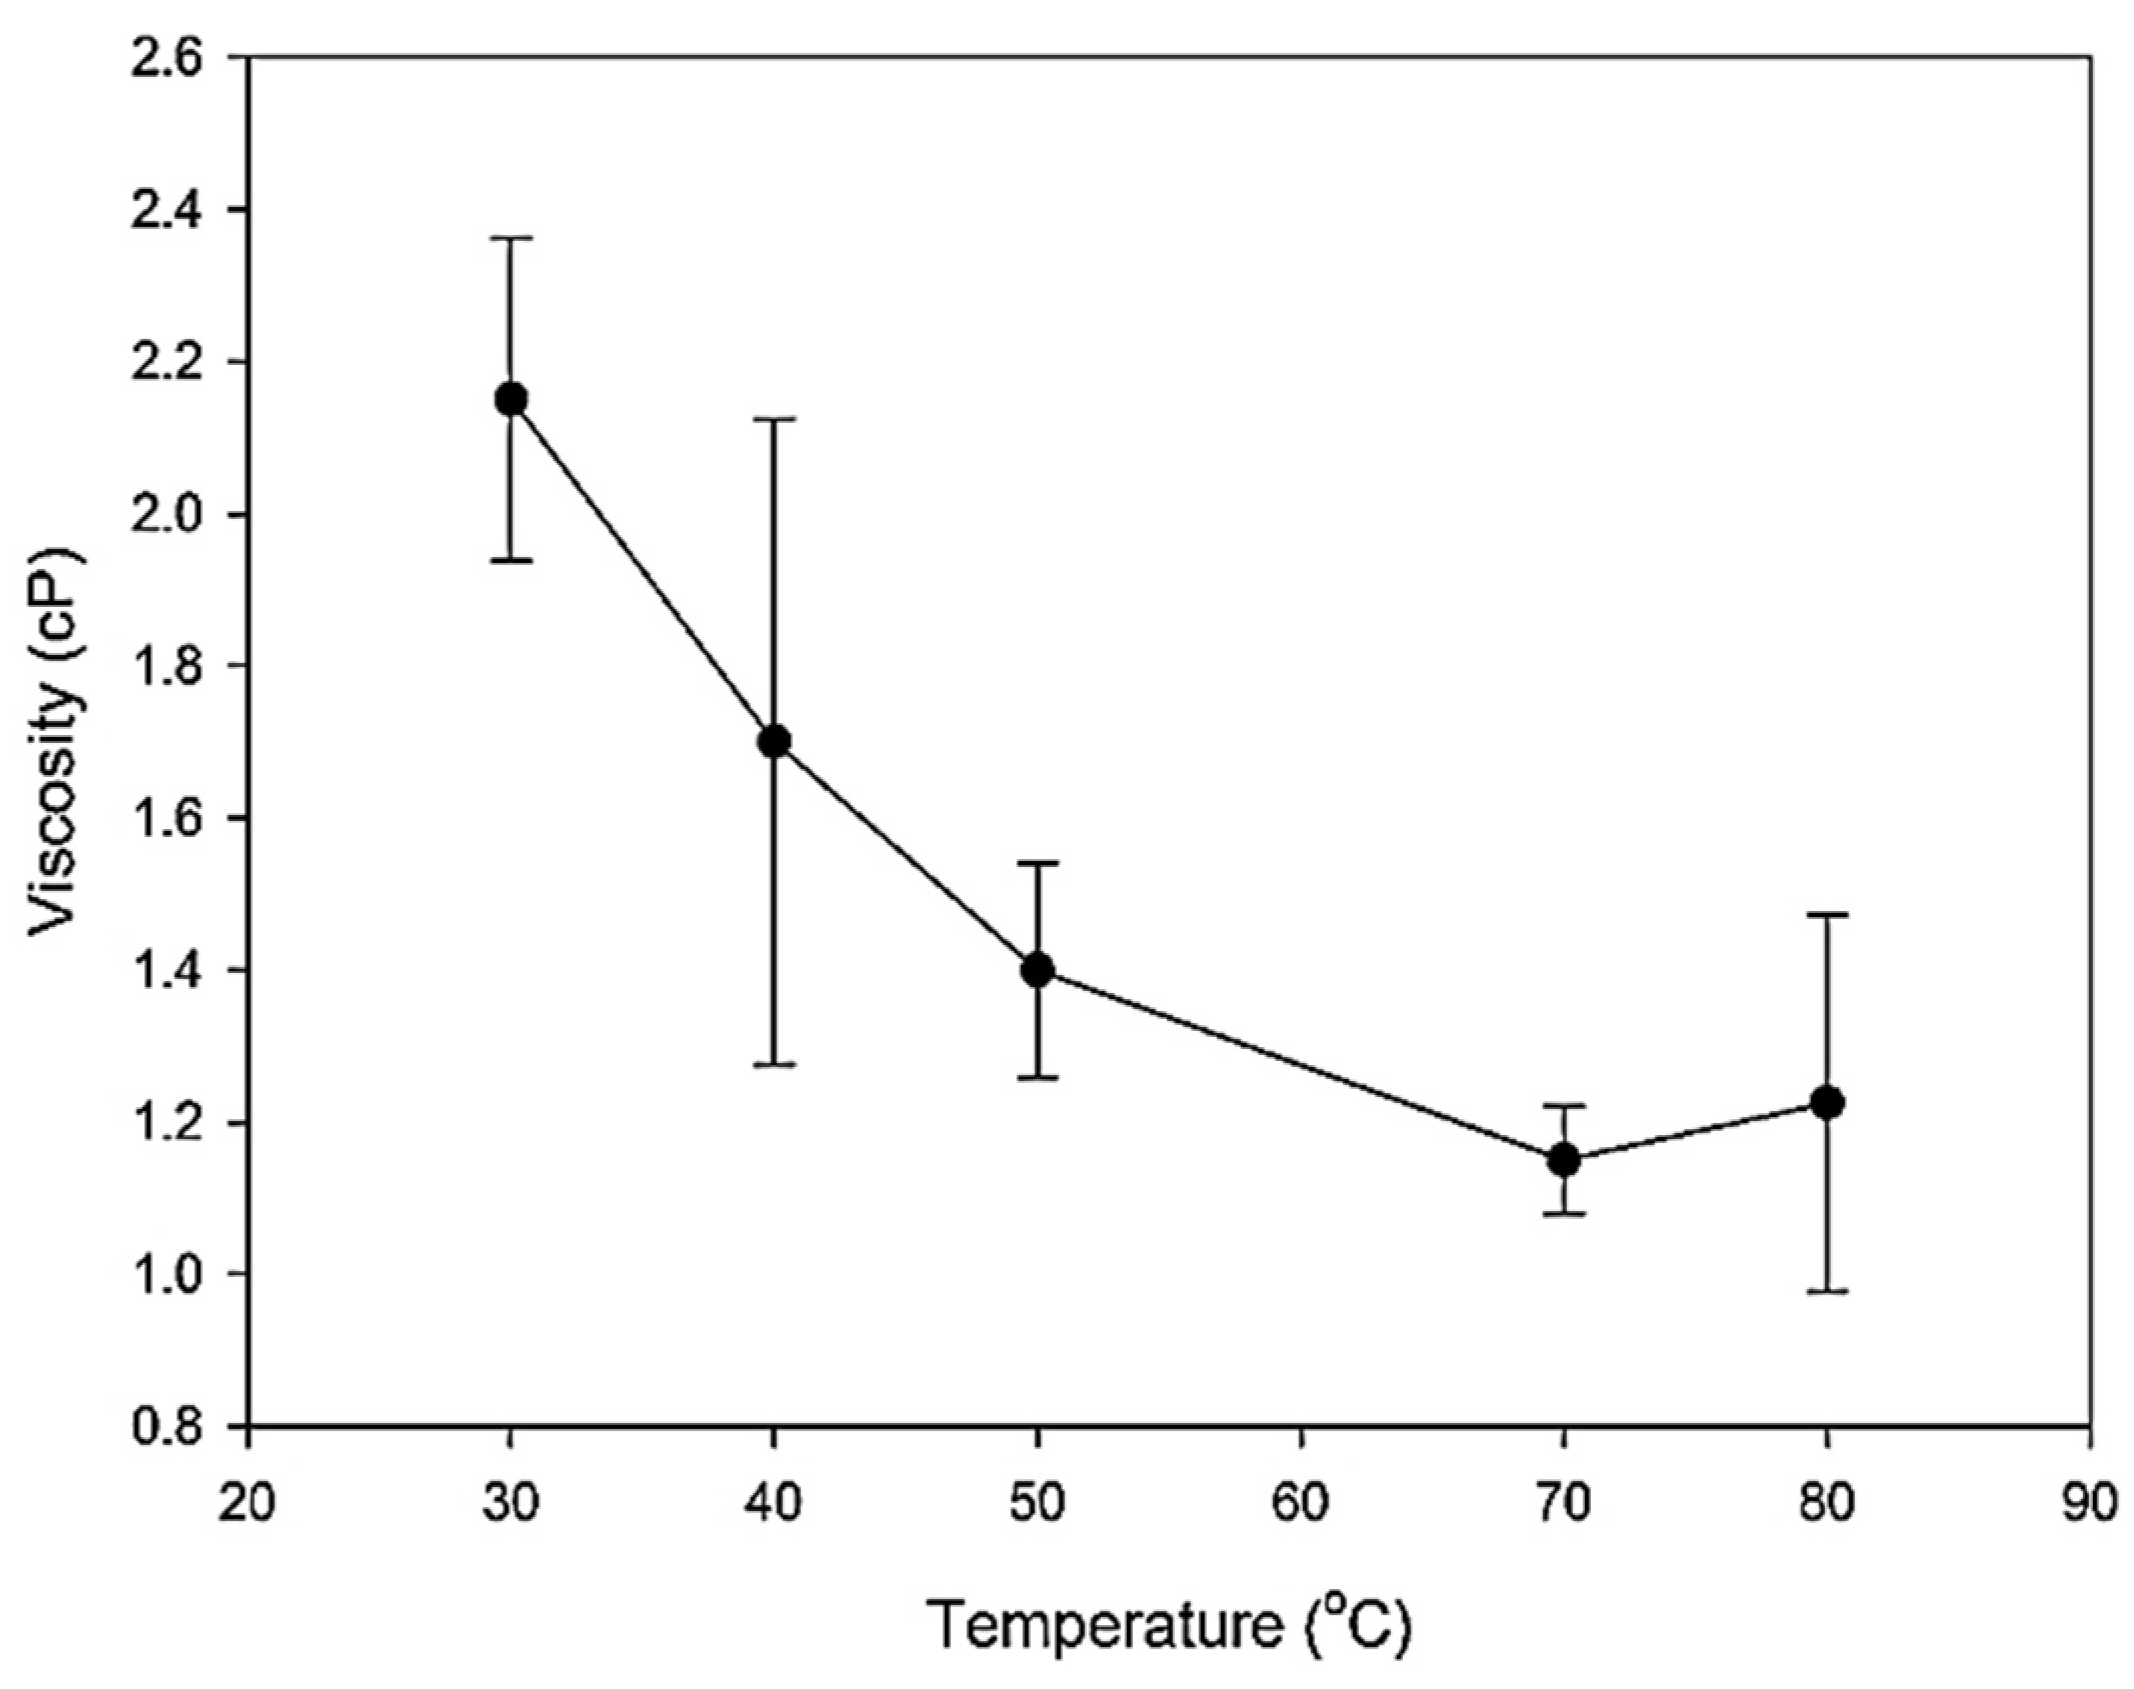
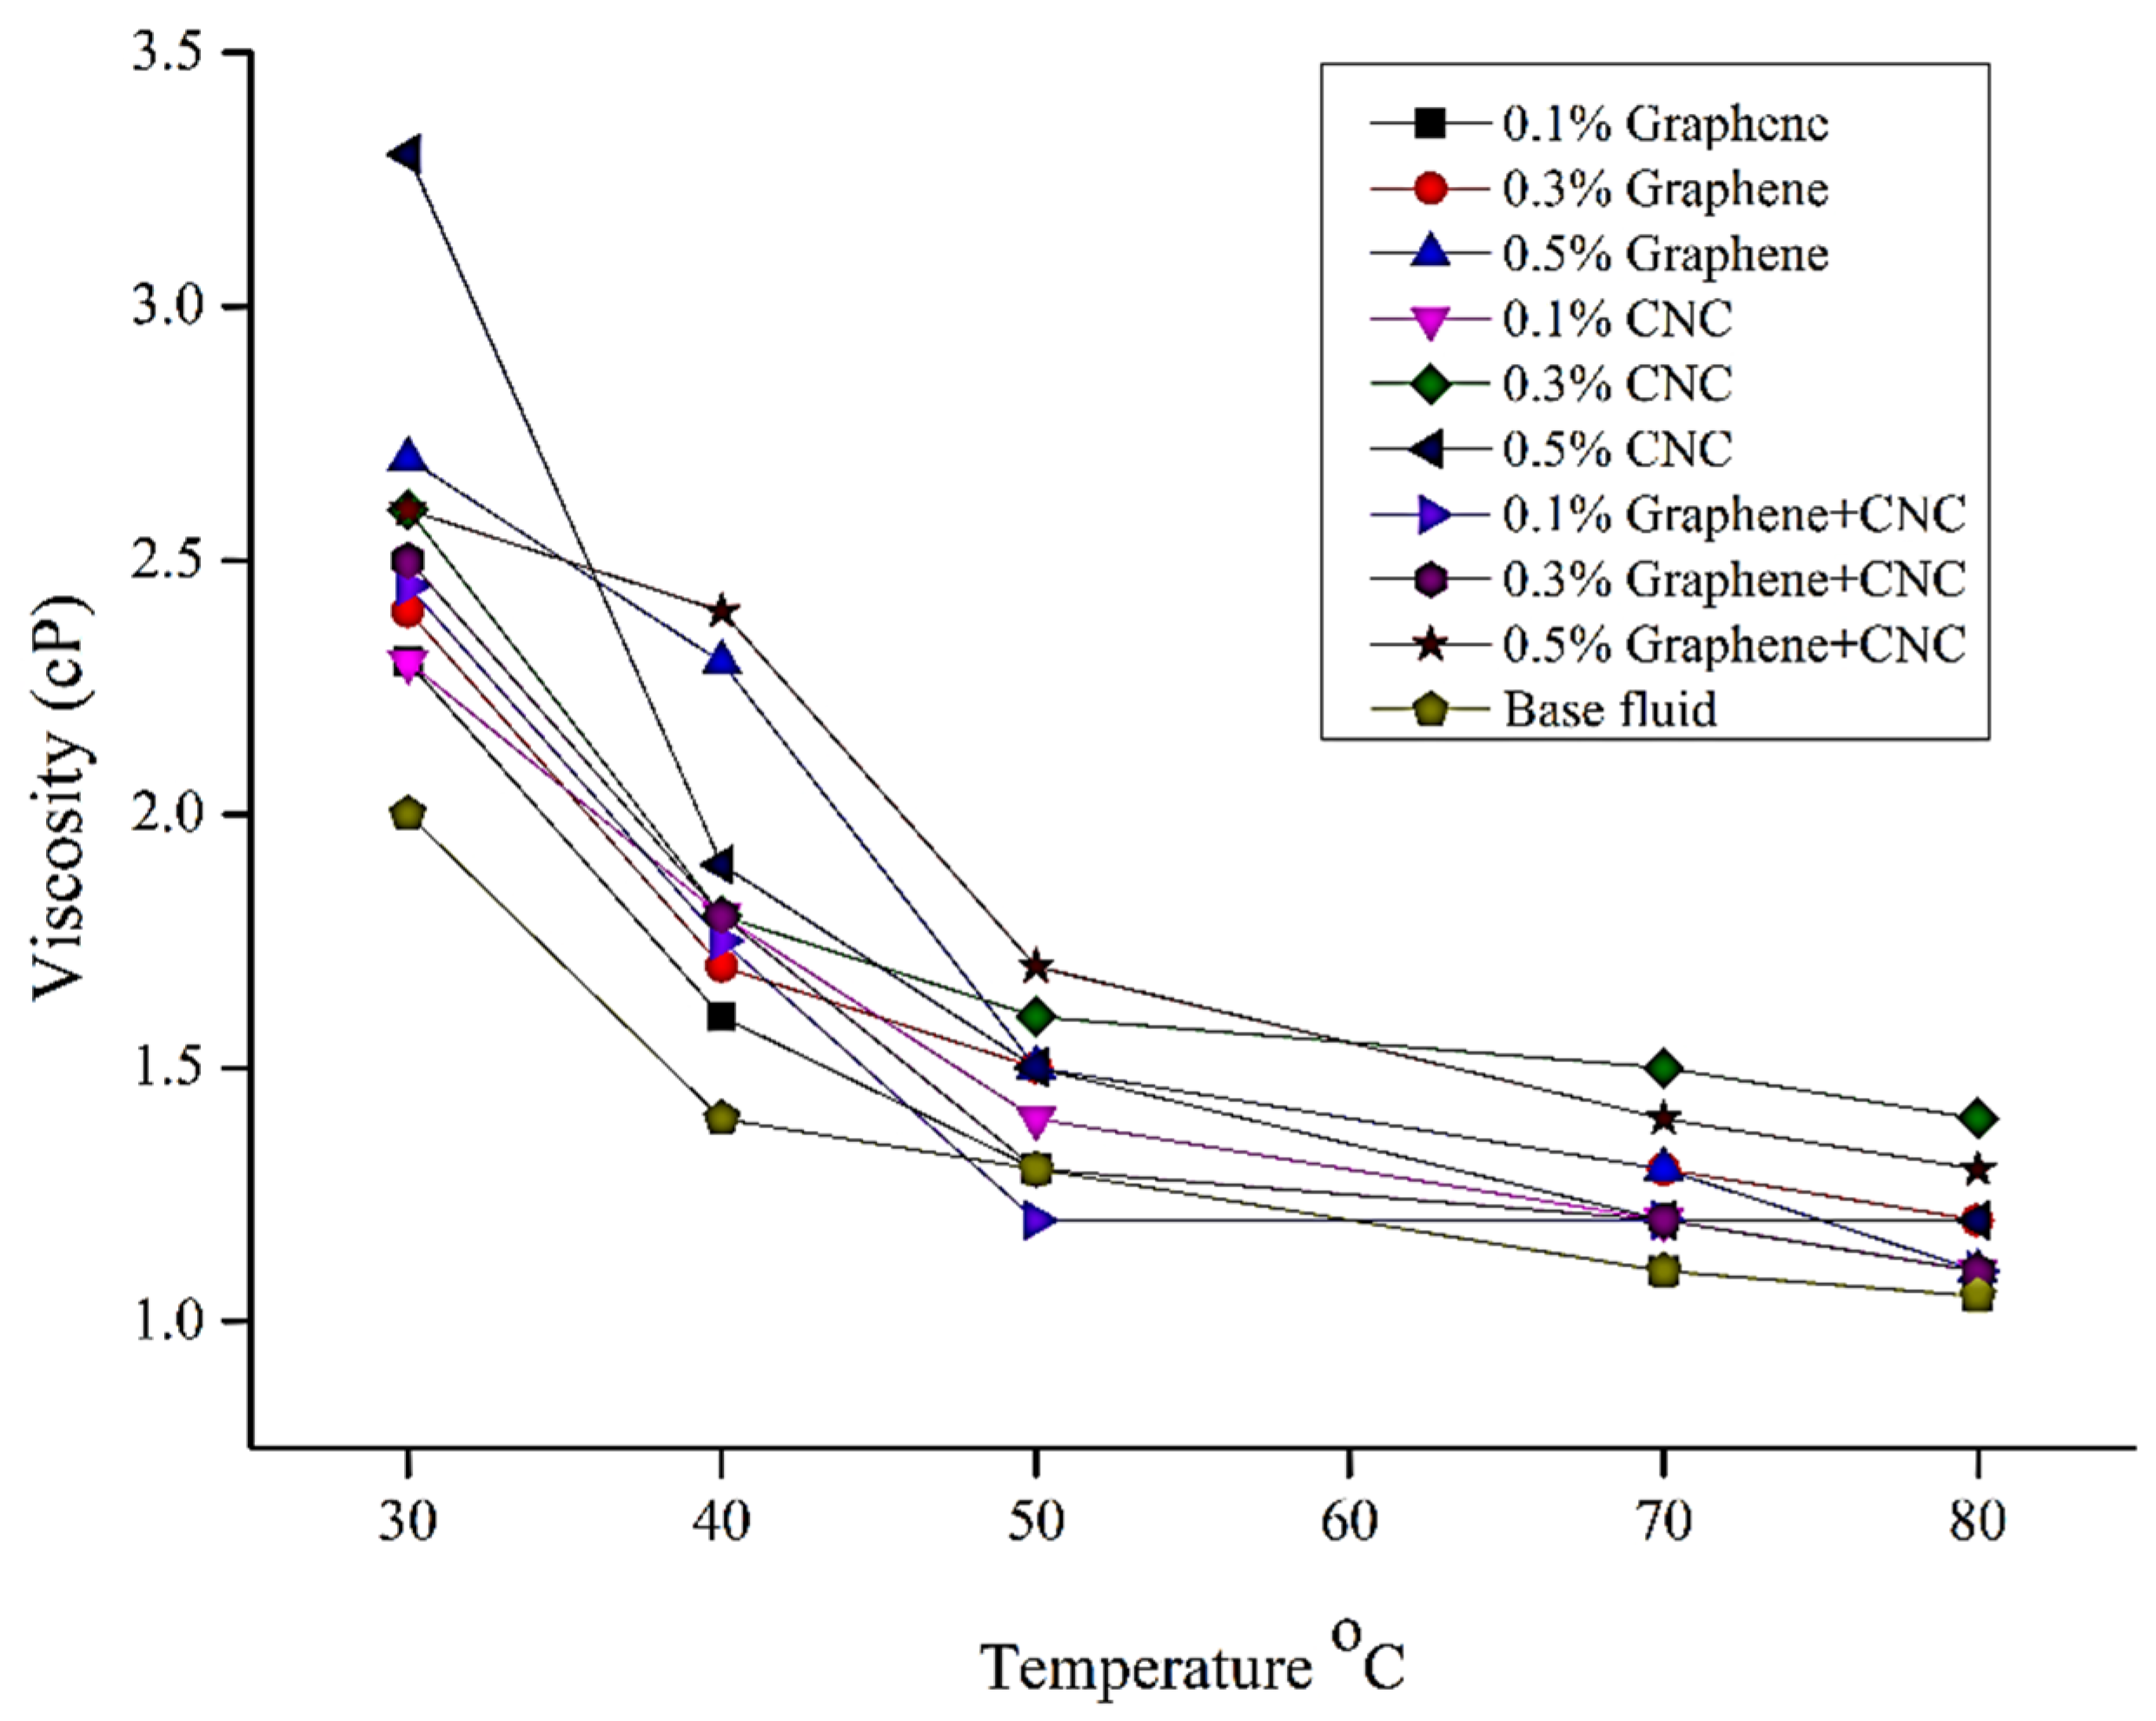
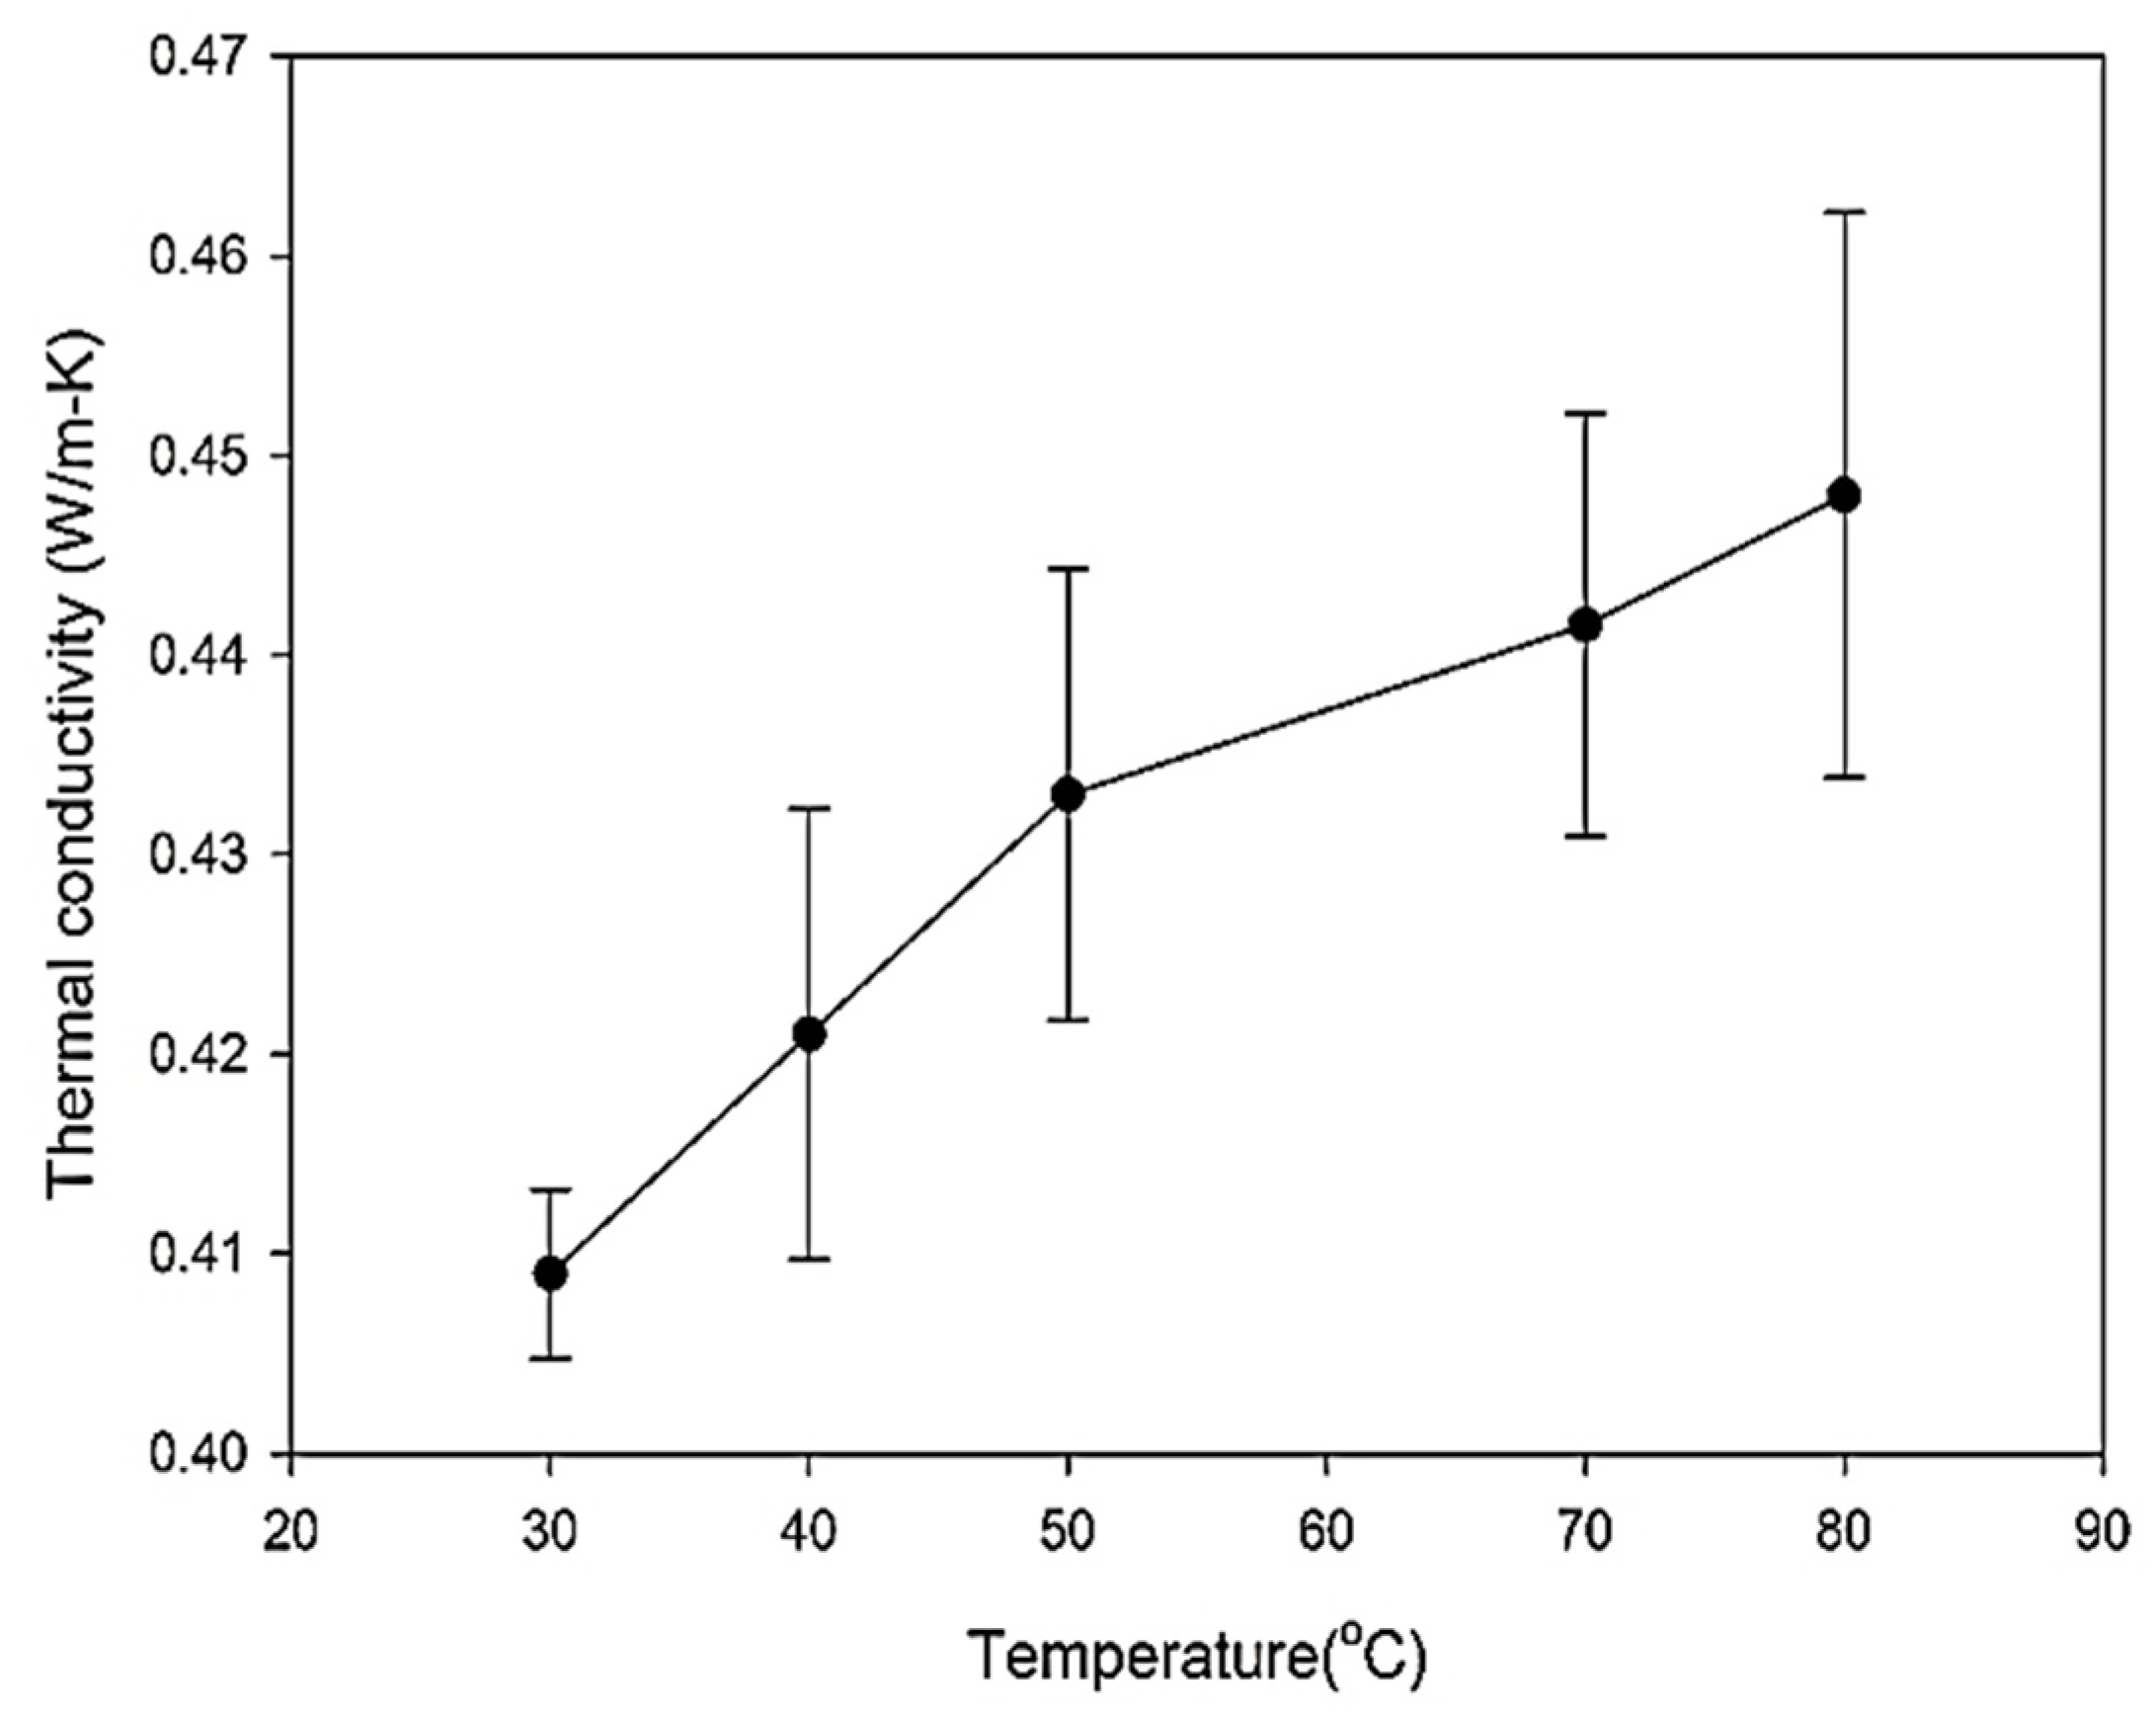
The viscosity of base fluid (60:40 W:EG) was measured initially, followed by the viscosity of nanofluid (graphene and CNC) with varied volume concentrations (0.1%, 0.3%, and 0.5%) measured at four different temperatures: 30 °C, 40 °C, 50 °C, 70 °C, and 80 °C, and have been displayed in Figure 11 and Figure 12. The difference between experimental viscosity data and ASHRAE Standard data for the base fluid was previously examined and reported by Farhana, et al. [68] in their study, and following them, this has also been done in this study, as shown in Figure 12. The viscosity of nanofluids increases as the internal shear stress improves, and the increasing volume concentration has a greater impact on this shear stress.
Viscosity shows a valiant character concerning temperature, as displayed in Figure 12. The Cp% drops almost 42.83% with the 10 °C temperature (from 30 °C to 40 °C) increase in the case of 0.5% CNC, but later, increases from 40 °C to 50 °C and further, at 60 °C, 70 °C and 80 °C it decreases gradually, slowly keeping an average of 8–21% for 0.5% CNC. However, the data shows a gradual decrease of Cp% for other wt.% of CNC, whereas, for graphene, the Cp percentage does not drop a lot and still holds a percentage of 28.26% with a 10 °C temperature (from 30 °C to 40 °C) for 0.1% graphene. Almost the same goes for 0.3 and 0.5 wt.% of graphene as well. Although it is not a very bumpy ride for the other temperature differences after 50 °C, holding an average of 9% to 24% increase. Almost the same is said for the base fluid and the hybrid of different wt.%. Though, the significant part includes an increase from 50 °C to 80 °C for the case of 0.1% hybrid. As in this period, the Cp % tends to gradually rise to 5–17%.
In Farhana, Kadirgama, Ramasamy, Samykano and Najafi [68], the basic fluid’s thermal conductivity (60% water and 40% EG) and varied volume CNC nanofluids (0.1%, 0.3%, and 0.5%) were measured at four temperatures, such as 30 °C, 50 °C, 70 °C, 80 °C. The results show that 0.1% CNC thermal conductivity raised to 30 °C above the remaining two-volume fractions of the nanofluids and basic fluids. In addition, the CNC nanofluid concentration increased significantly with thermal conductivity of 0.5% at 50 °C. Thermal conductivity is also provided with the CNC nanofluid and was improved at a maximum of 80 °C for 0.3%. In addition, all CNC concentrations exhibit an increasing trend at 80 °C, while basic fluid shows a decreasing trend in thermal conductivity. The concentrations are increasing. However, at a temperature of 50 °C and 70 °C, the thermal conductivity of 0.1% of CNC nanofluids is slightly lower than the base fluid.
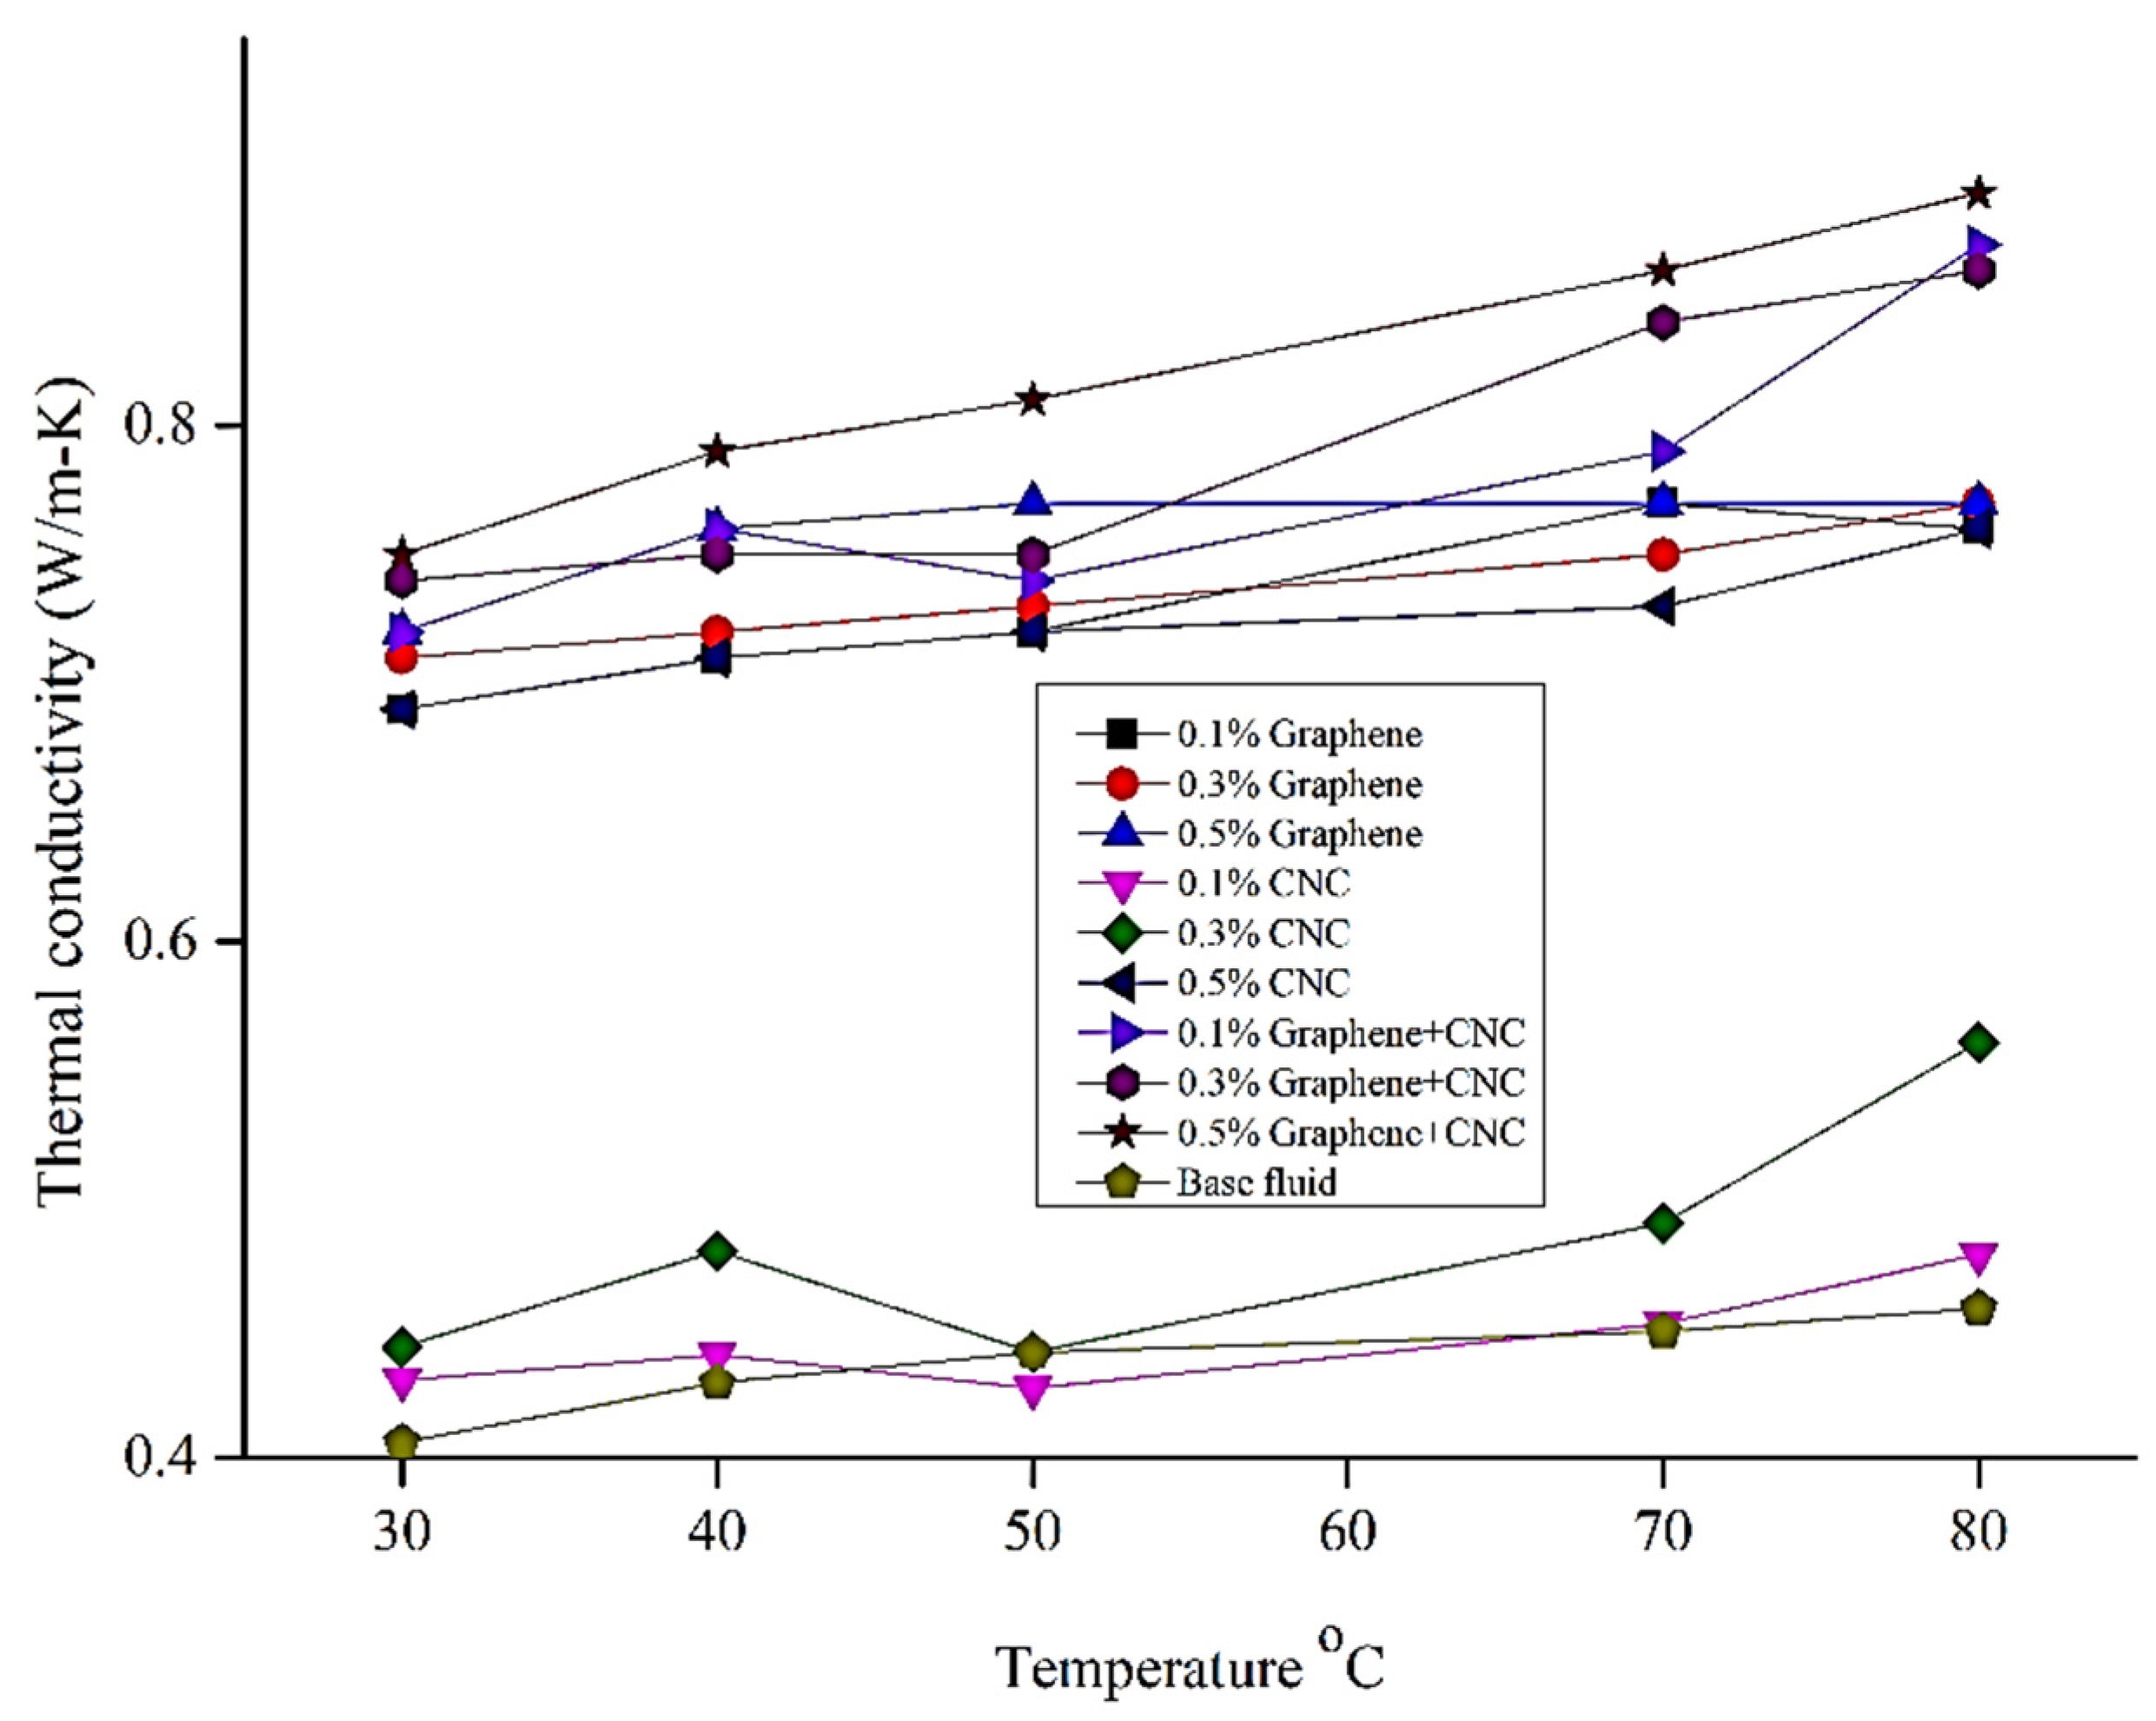
Figure 13 shows the change in the thermal conductivity of graphene, CNC, and hybrid nanofluids at different temperatures. Units of thermal conductivity were measured by Wm−1·K−1. Overall, the thermal conductivity measured in different concentrations of graphene, (temperature 30 °C) 0.1%, 0.3%, and 0.5%, and thermal conductivity, differ—0.69, 0.71, and 0.72—compared with CNC of the same concentration of gradual thermal conductivity at 0.43, 0.443, and 0.69. At the start of the 30 °C period, the hybrid nanofluid (graphene+CNC) shows the best thermal result at the density of 0.3% and 0.5%, whereas the thermal conductivity is 0.74 and 0.75, respectively. On the other hand, growing the temperate results in increasing the thermal conductivity of all types of fluids and hybrid nanofluid. Thermal conductivity, which reached a high of just 80 °C temperature with hybrid nanofluids of 0.3% and 0.5% concentration, as well as the results, are 0.86 and 0.89, respectively, as shown in Figure 14. However, graphene nanofluid gives better results compared with the CNC nanofluid. The thermal conductivity of CNC nanofluid and graphene results in 0.561 Wm−1·K1 and 0.77 Wm−1·K−1 in the same temperature of 80 °C and the same density of 0.3%. Therefore, using graphene dramatically increases thermal conductivity.

6.3. Specific Heat Analysis

By Selvam, et al. [69], the specific heat of graphene nanoparticles varies with different concentrations at the same temperature and goes down in regards to temperature. Whereas the concentration increases at a similar temperature of 30 °C (concentration 0.1%, 0.15%, 0.3%, 0.5%) and the specific heat reduce gradually regarding the volume concentration of graphene mixed nanoparticles (3.52, 3.45, 3.35 and 3.3) KJ·kg−1·K−1. The biggest decline in specified heat was 8% for 0.45% volume, compared with 0% volume. In addition, the specific thermal capacity of graphene nanofluid is compared to the physical mixture rule principle. The observed special heat capacity of nanofluids is seen to be less than the values predicted by the mixing rule. In terms of graphene loads determined from the mixture rule, the specified heat capacity decreases somewhat. The change in the heat capacitance is within an error limit of 0.15 vol% of graphene charges, while the deviation surpasses the error bandwidth after 0.15% of graphene.
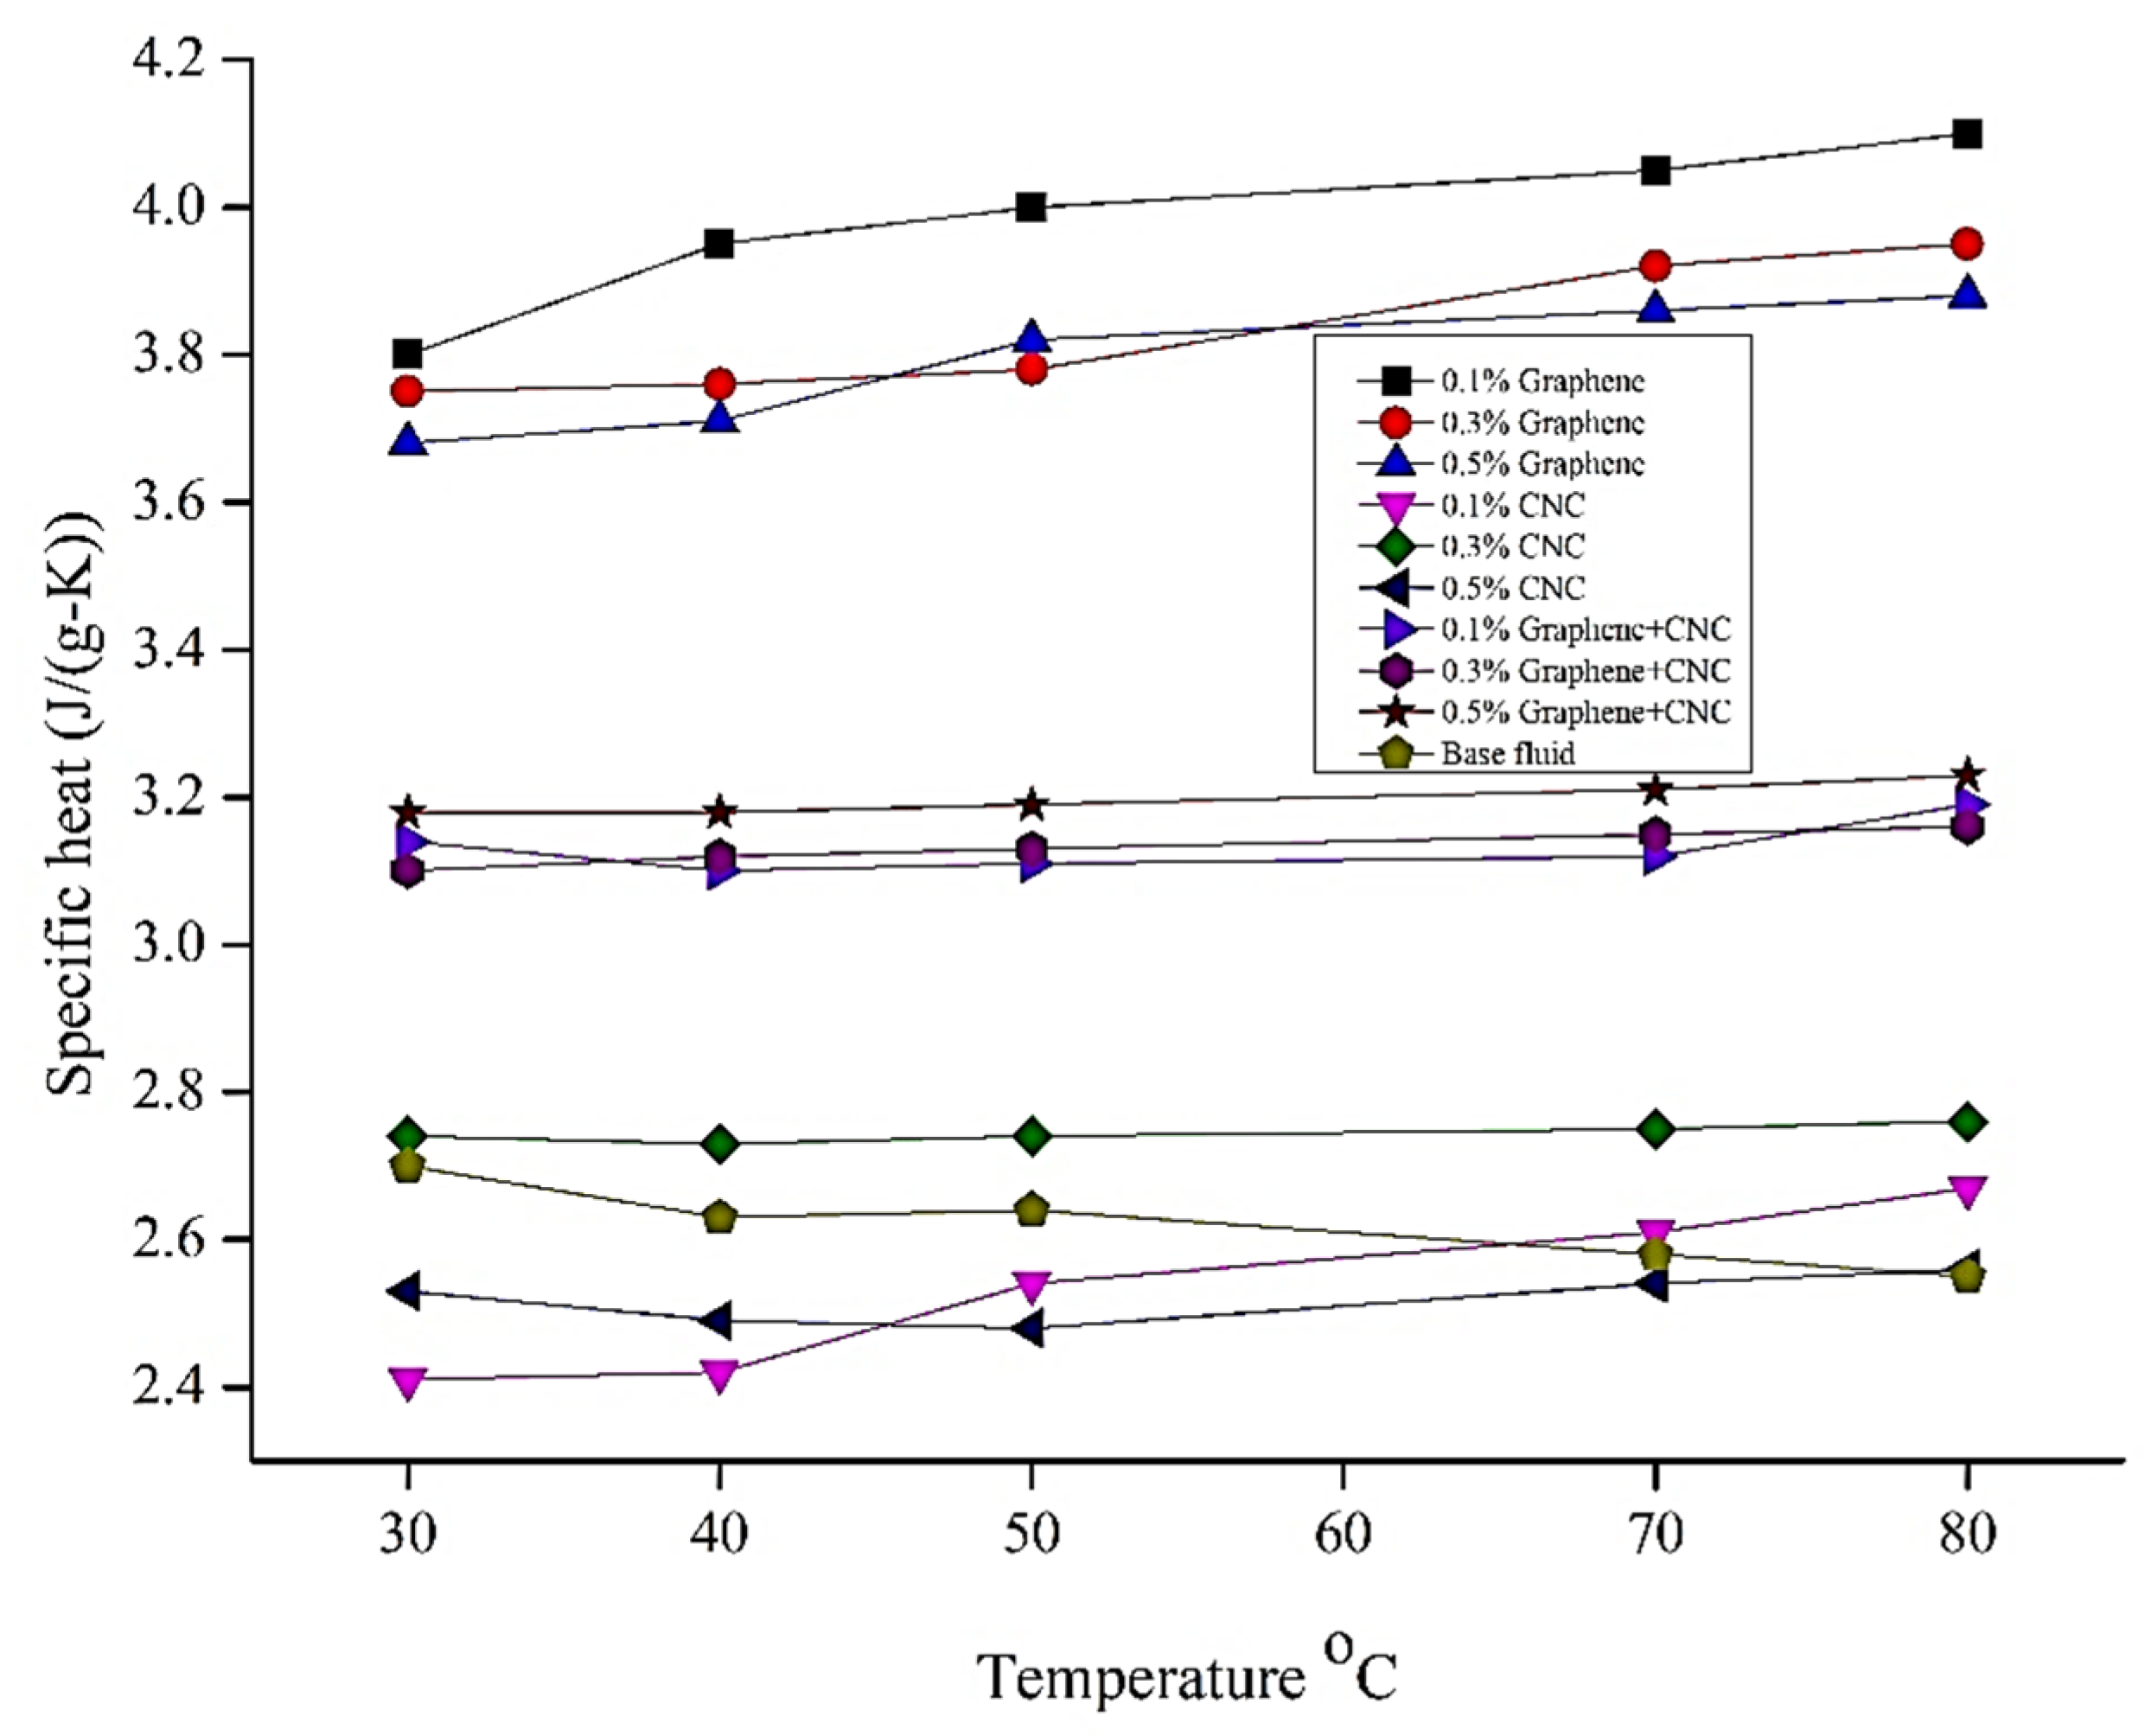
For specific heat, the hybrid shows very little change in a range of 3.1 J/g-K to 3.23 J/g-K within 30 °C to 40 °C of temperature. Rather than that, for CNC, it increases by 0.1% CNC with the increase in temperature but decreases for 0.3% and 0.5% wt.%. However, graphene with the increase in temperature gradually increases. Figure 15 shows the specific heat increases in terms of temperature increase. By considering a temperature of 30 °C, it has been measured the specific heat of graphene nanofluid (0.1%, 0.3%, and 0.5%) and the results were 3.8, 3.75, and 3.68, respectively, as well as the unit of specific heat J/g-K. Similarly, at a temperature of 80 °C, specific heat was 4.1, 3.95, and 3.88. Thus, if we observe the results, then we have seen that there is a specific decline in terms of density. Determining the specific of CNC in 30 °C temperature at the same density, the specific heat differs 2.41 J/g-K, 2.74 J/g-K, and 2.53 J/g-K, as well as 80 °C. On the other hand, with the hybrid nanofluids (0.3% graphene+CNC, 0.5% graphene+CNC) specific heat at 30 °C temperature was 3.1 J/g-K, 3.18 J/g-K one by one. As demonstrated, the specific heat value is less than graphene nanofluid and higher than CNC nanofluid and demonstrates the same trend we have seen with the 80 °C temperature, which is lower than graphene and higher than CNC nanofluids.

6.4. Density Analysis

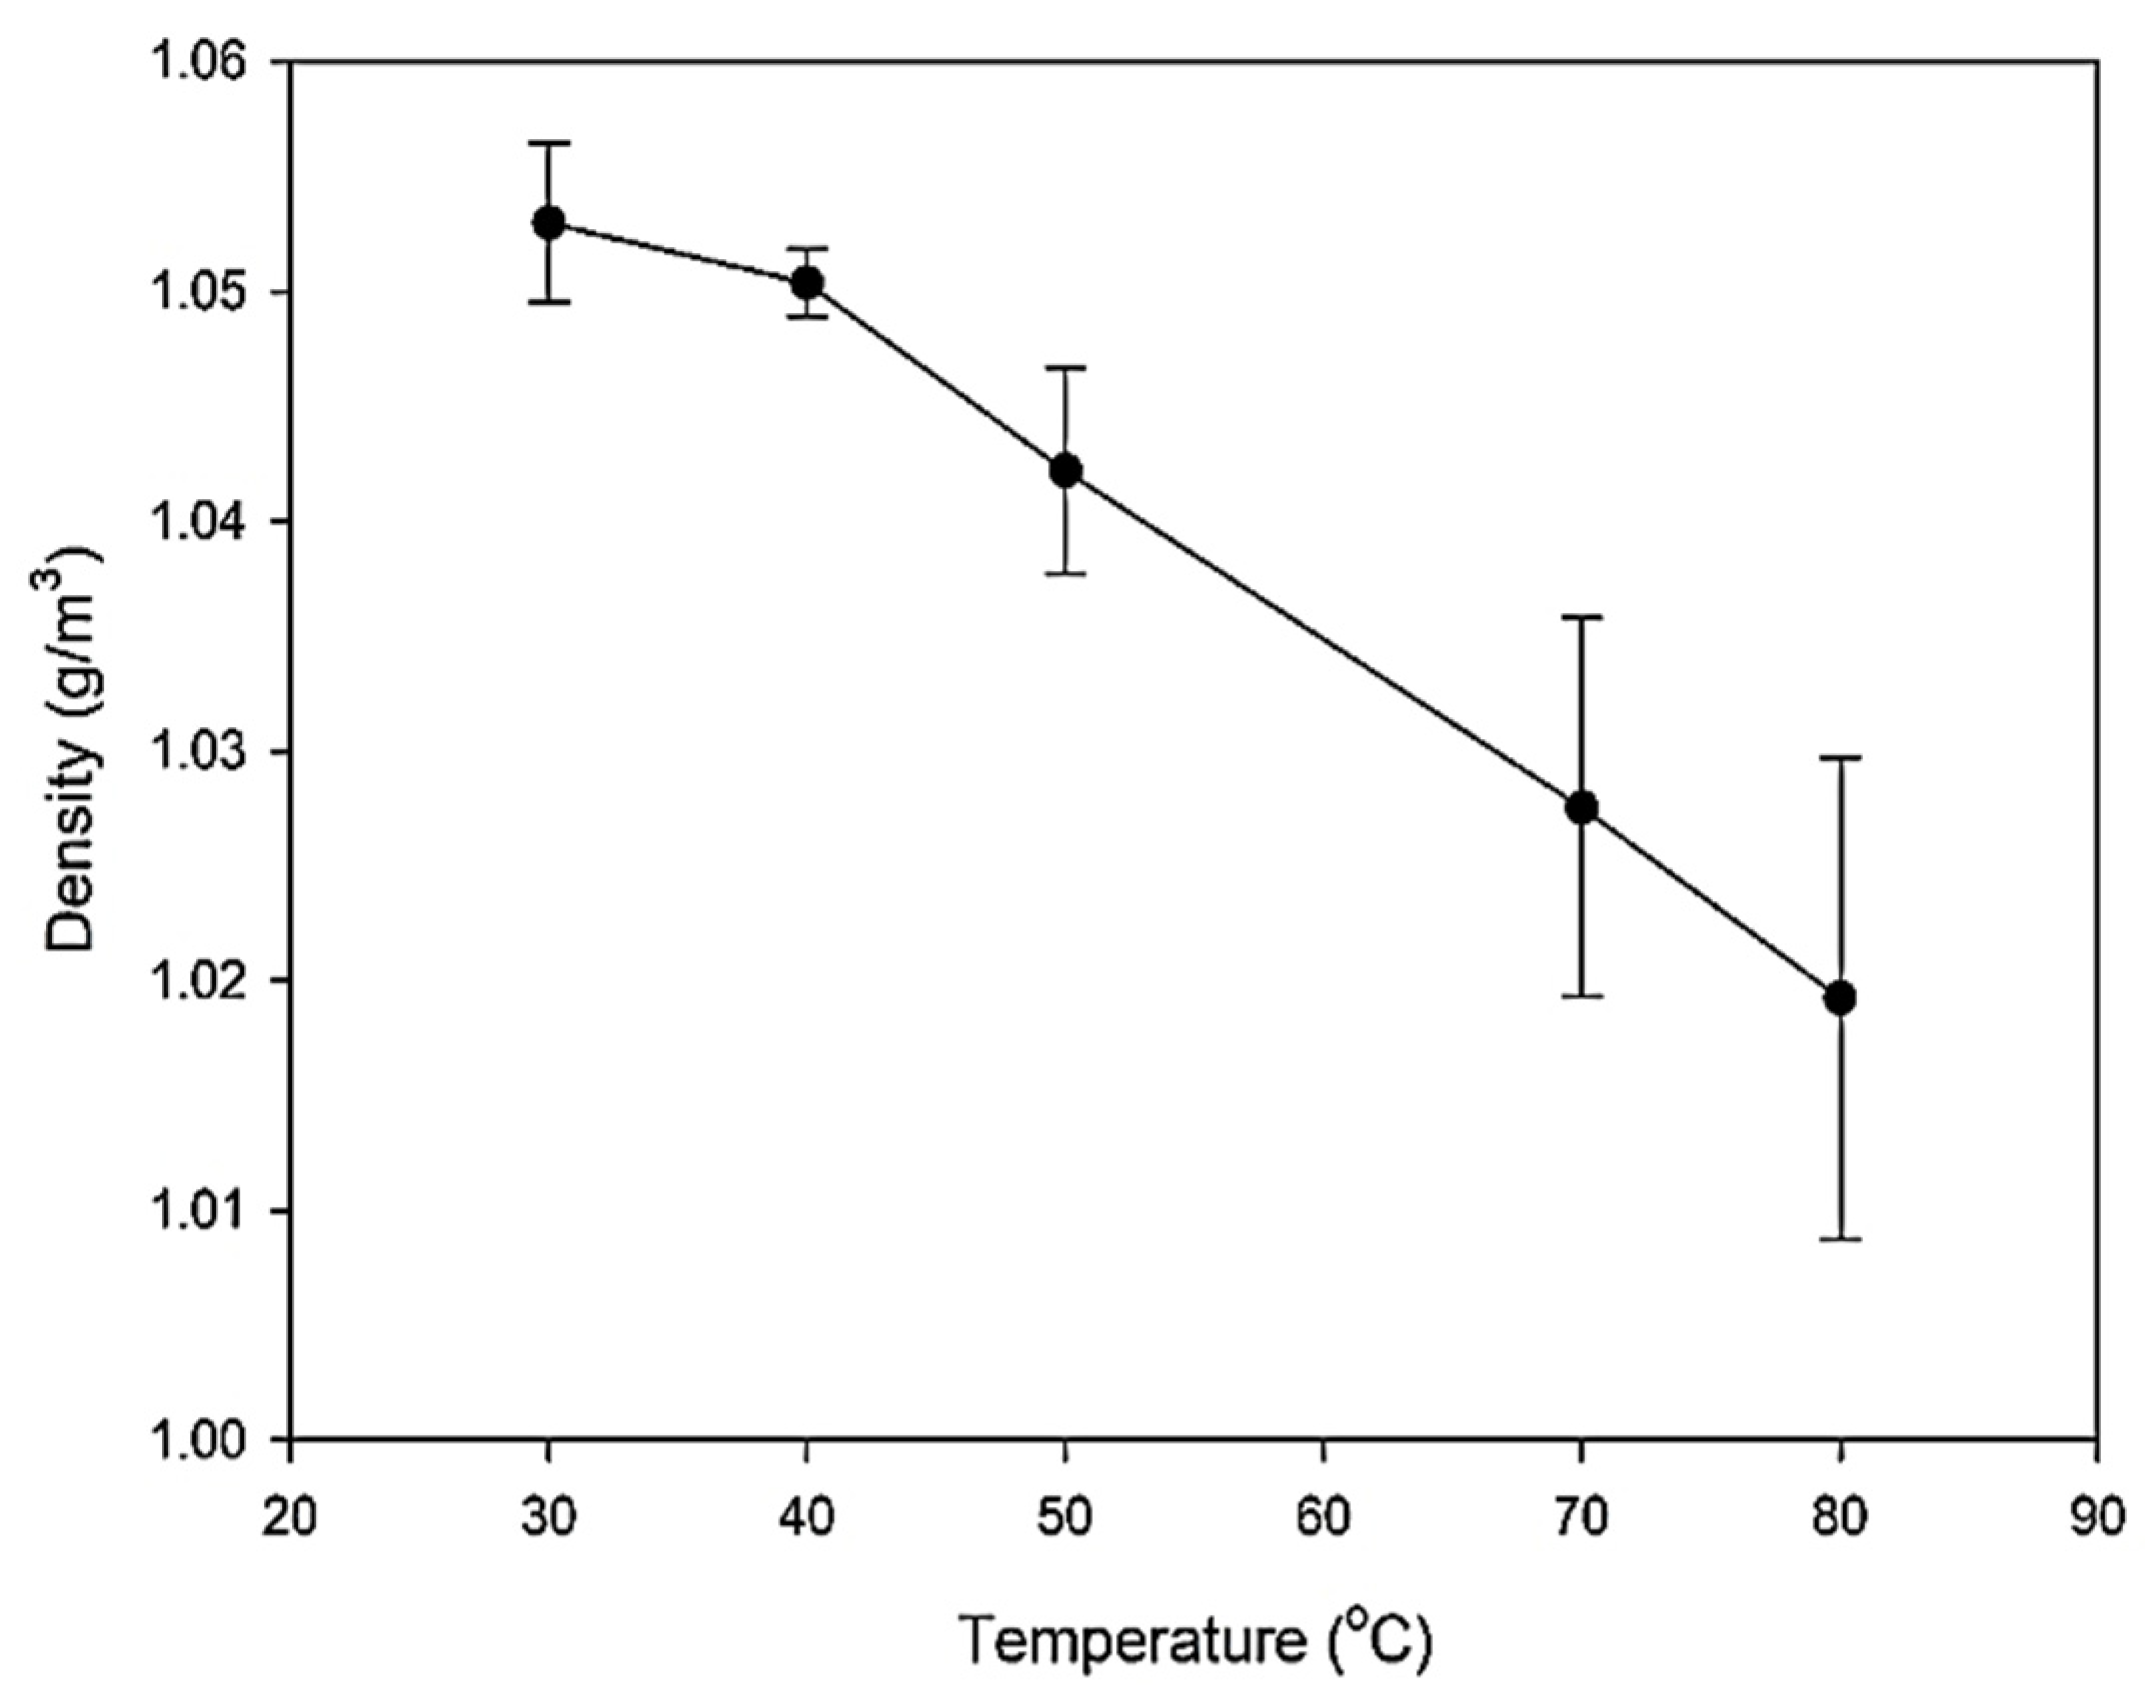
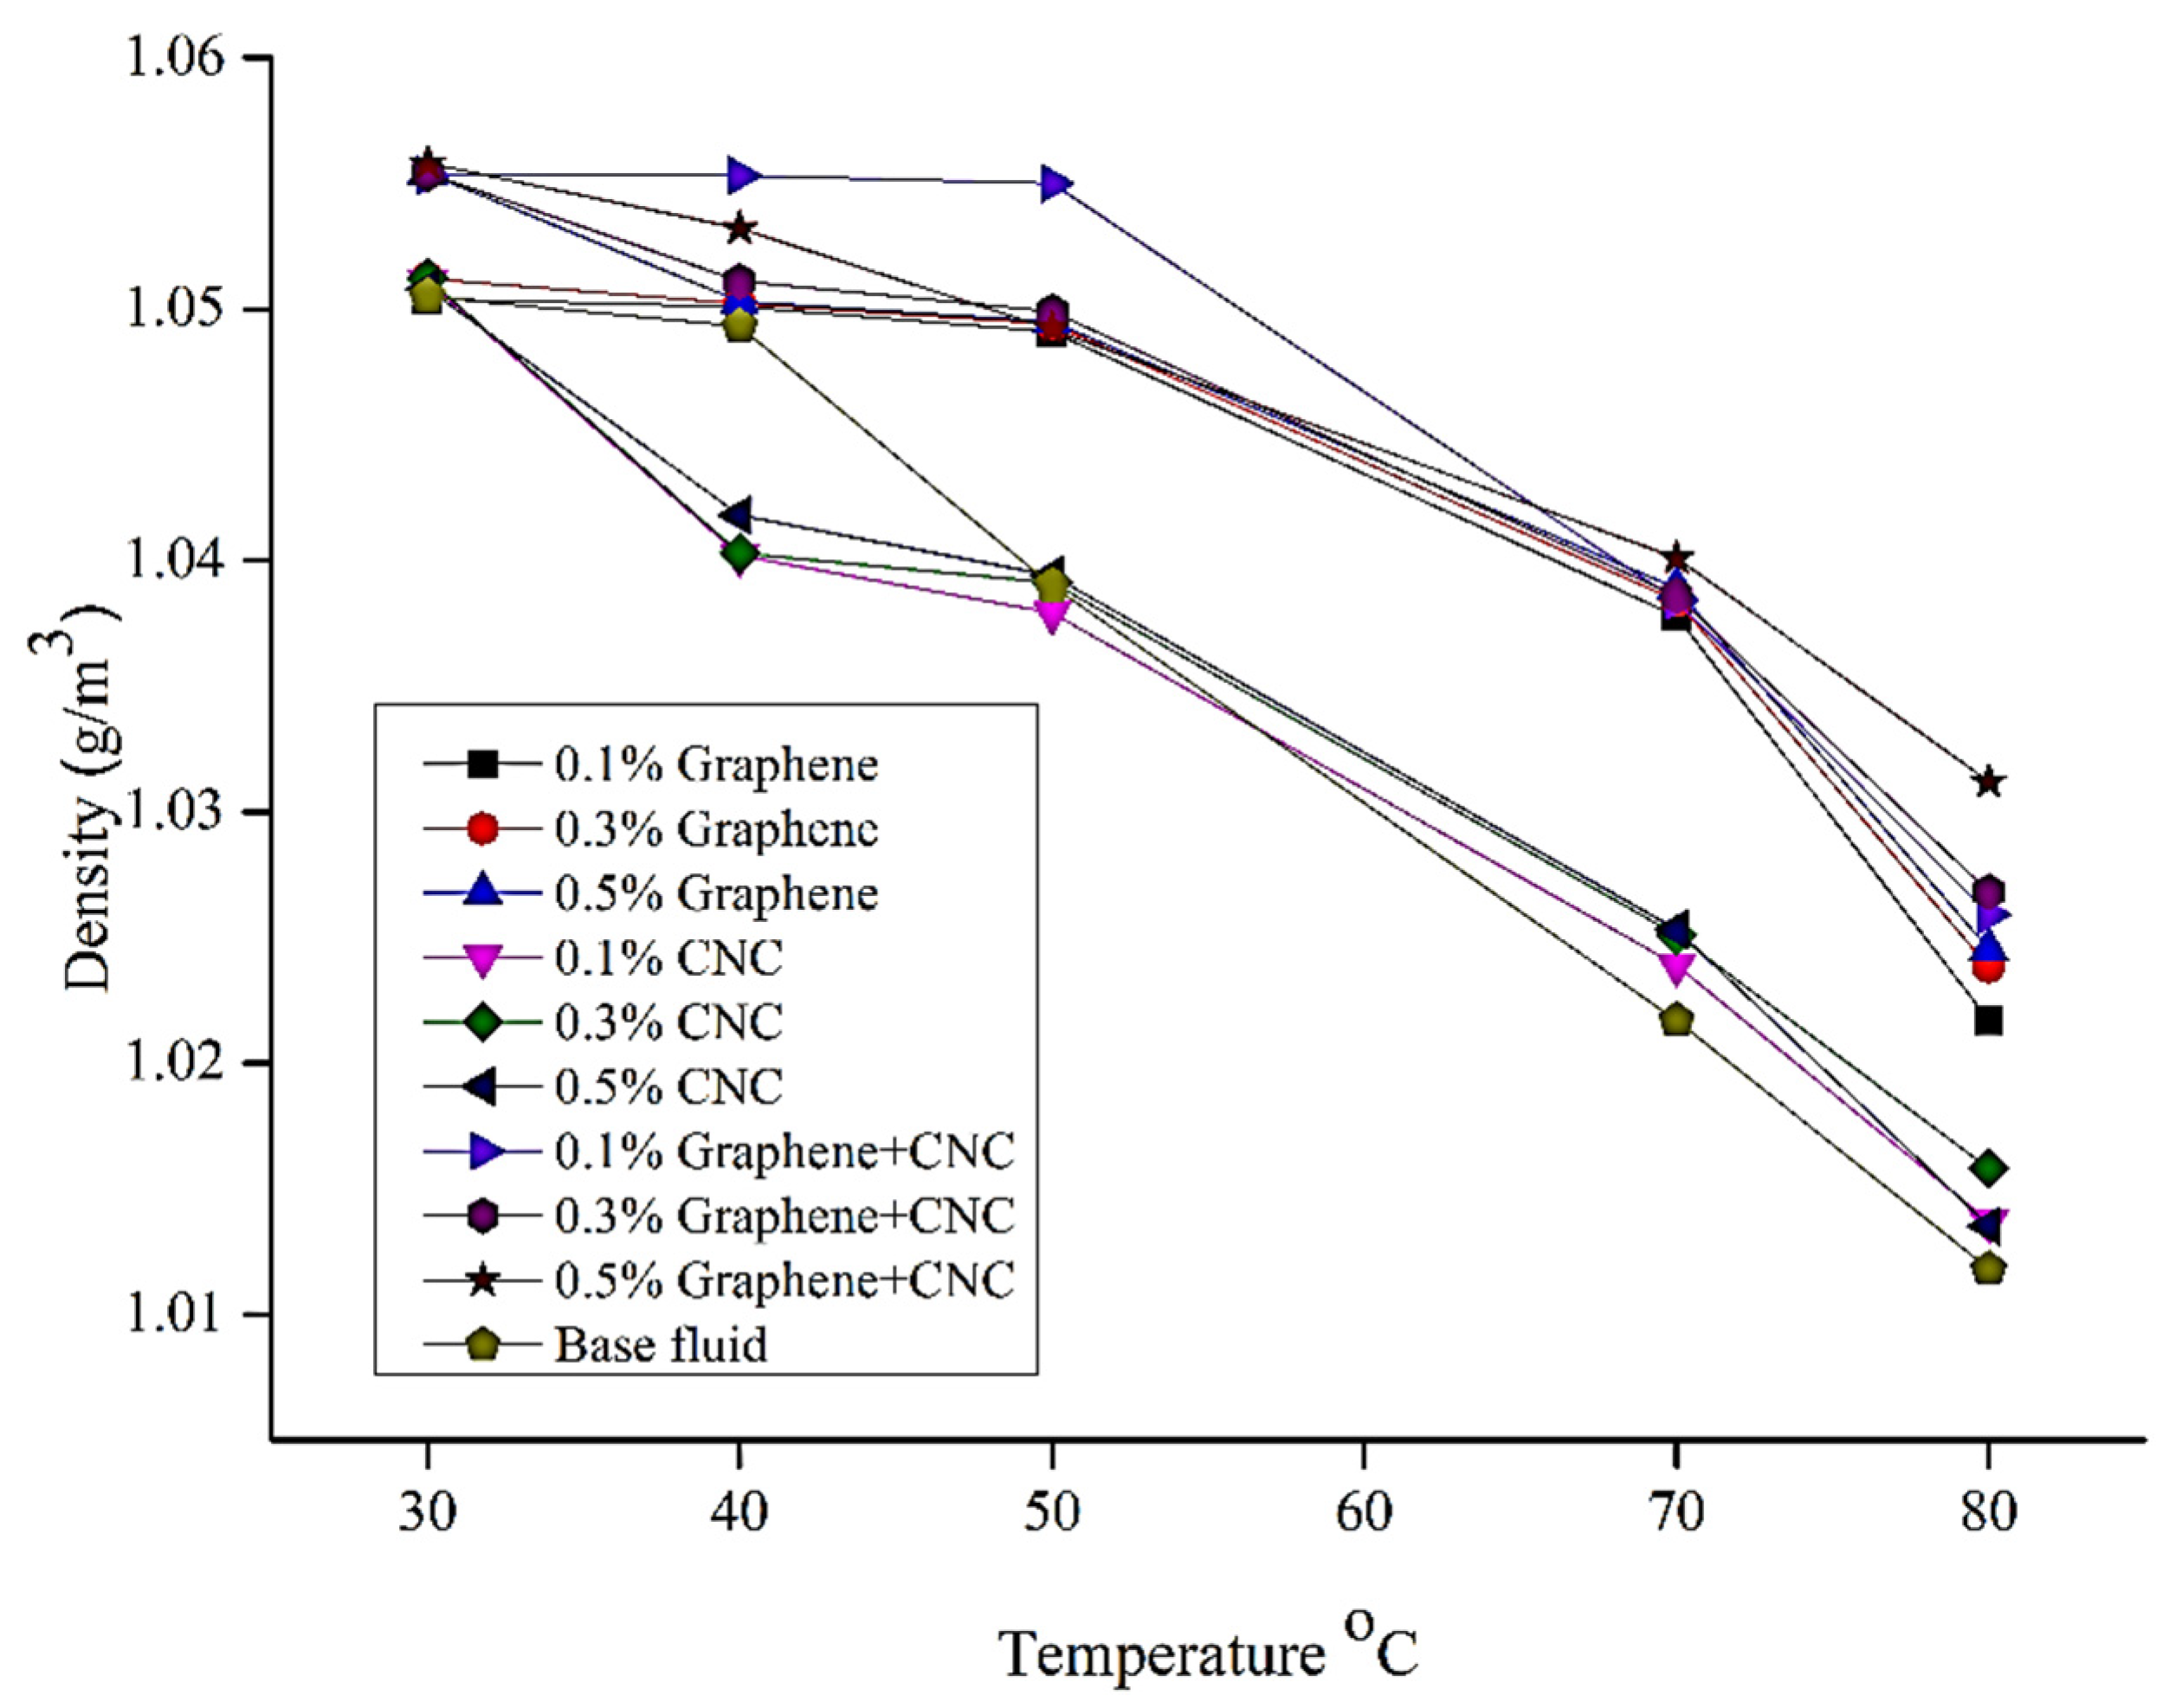
The volume ratio of nanoparticles and base fluids is the same as the density of nanofluids. Base fluids play an important role in carrying out the result of the density of nanofluids. Temperature is also a key factor in measuring density, as it is negatively proposed to each other. If temperature increases, then the density decreases, vice versa [70]. The density error of base fluid between ASHRAE and experimental data has been portrayed in Figure 16.
The most constant character of CNC, graphene and their hybrids are shown in the case of density, as it is a universal fact that their density constantly decreases with the rise of temperature. Except for base fluids, the chemicals show a very sharp decrease in density for even the slightest temperature change. The density of two types of nanofluids (CNC and graphene) and one kind of hybrid nanofluid (graphene+CNC) has been portrayed in Figure 17. Graphene density proposals are less, regarding temperature. As we have seen, that graphene nanofluid 0.1% volume concentration density 1.05 g/m3 is almost the same in 30 °C, 40 °C, and 50 °C, however, the green color bar is smaller at 70 °C and 80 °C. Nanofluid shows almost similar results of density around 1. However, for hybrid nanofluids with a density of 0.3%, 0.5% (vol. con.) density shows 1.0554 g/m3, 1.0558 g/m3, respectively, at a temperature of 30 °C, whereas at 80 °C temperature, density was 1.0268 and 1.0312 at the same volume concentrations.

6.5. pH Analysis

One of the major characteristics of nanofluids is the potential of hydrogen (pH), which depends on its stability. The increase in thermal conductivity depends on nanofluids’ stability and their surface load condition [71]. The pH value of many nanoparticles reported was not equal and depended on temperature, volume, and particle size literature [72,73]. In a study, Jia-Fei, et al. [74]. It has been found that there are considerable pH values variations from 5 to 7 on a small size of nanoparticles. In addition, a low pH value provides strong nanofluid heat transfer characteristics. Because the suspension increases in low pH, hydration forces between the particles, leads to mobility improvements in the nanofluids in the suspension to contribute to heat transportation. [75]. On the contrary, Goudarzi, et al. [76], experimentally, demonstrated greater pH values in nanofluids to improve their efficiency compared to lower pH values.
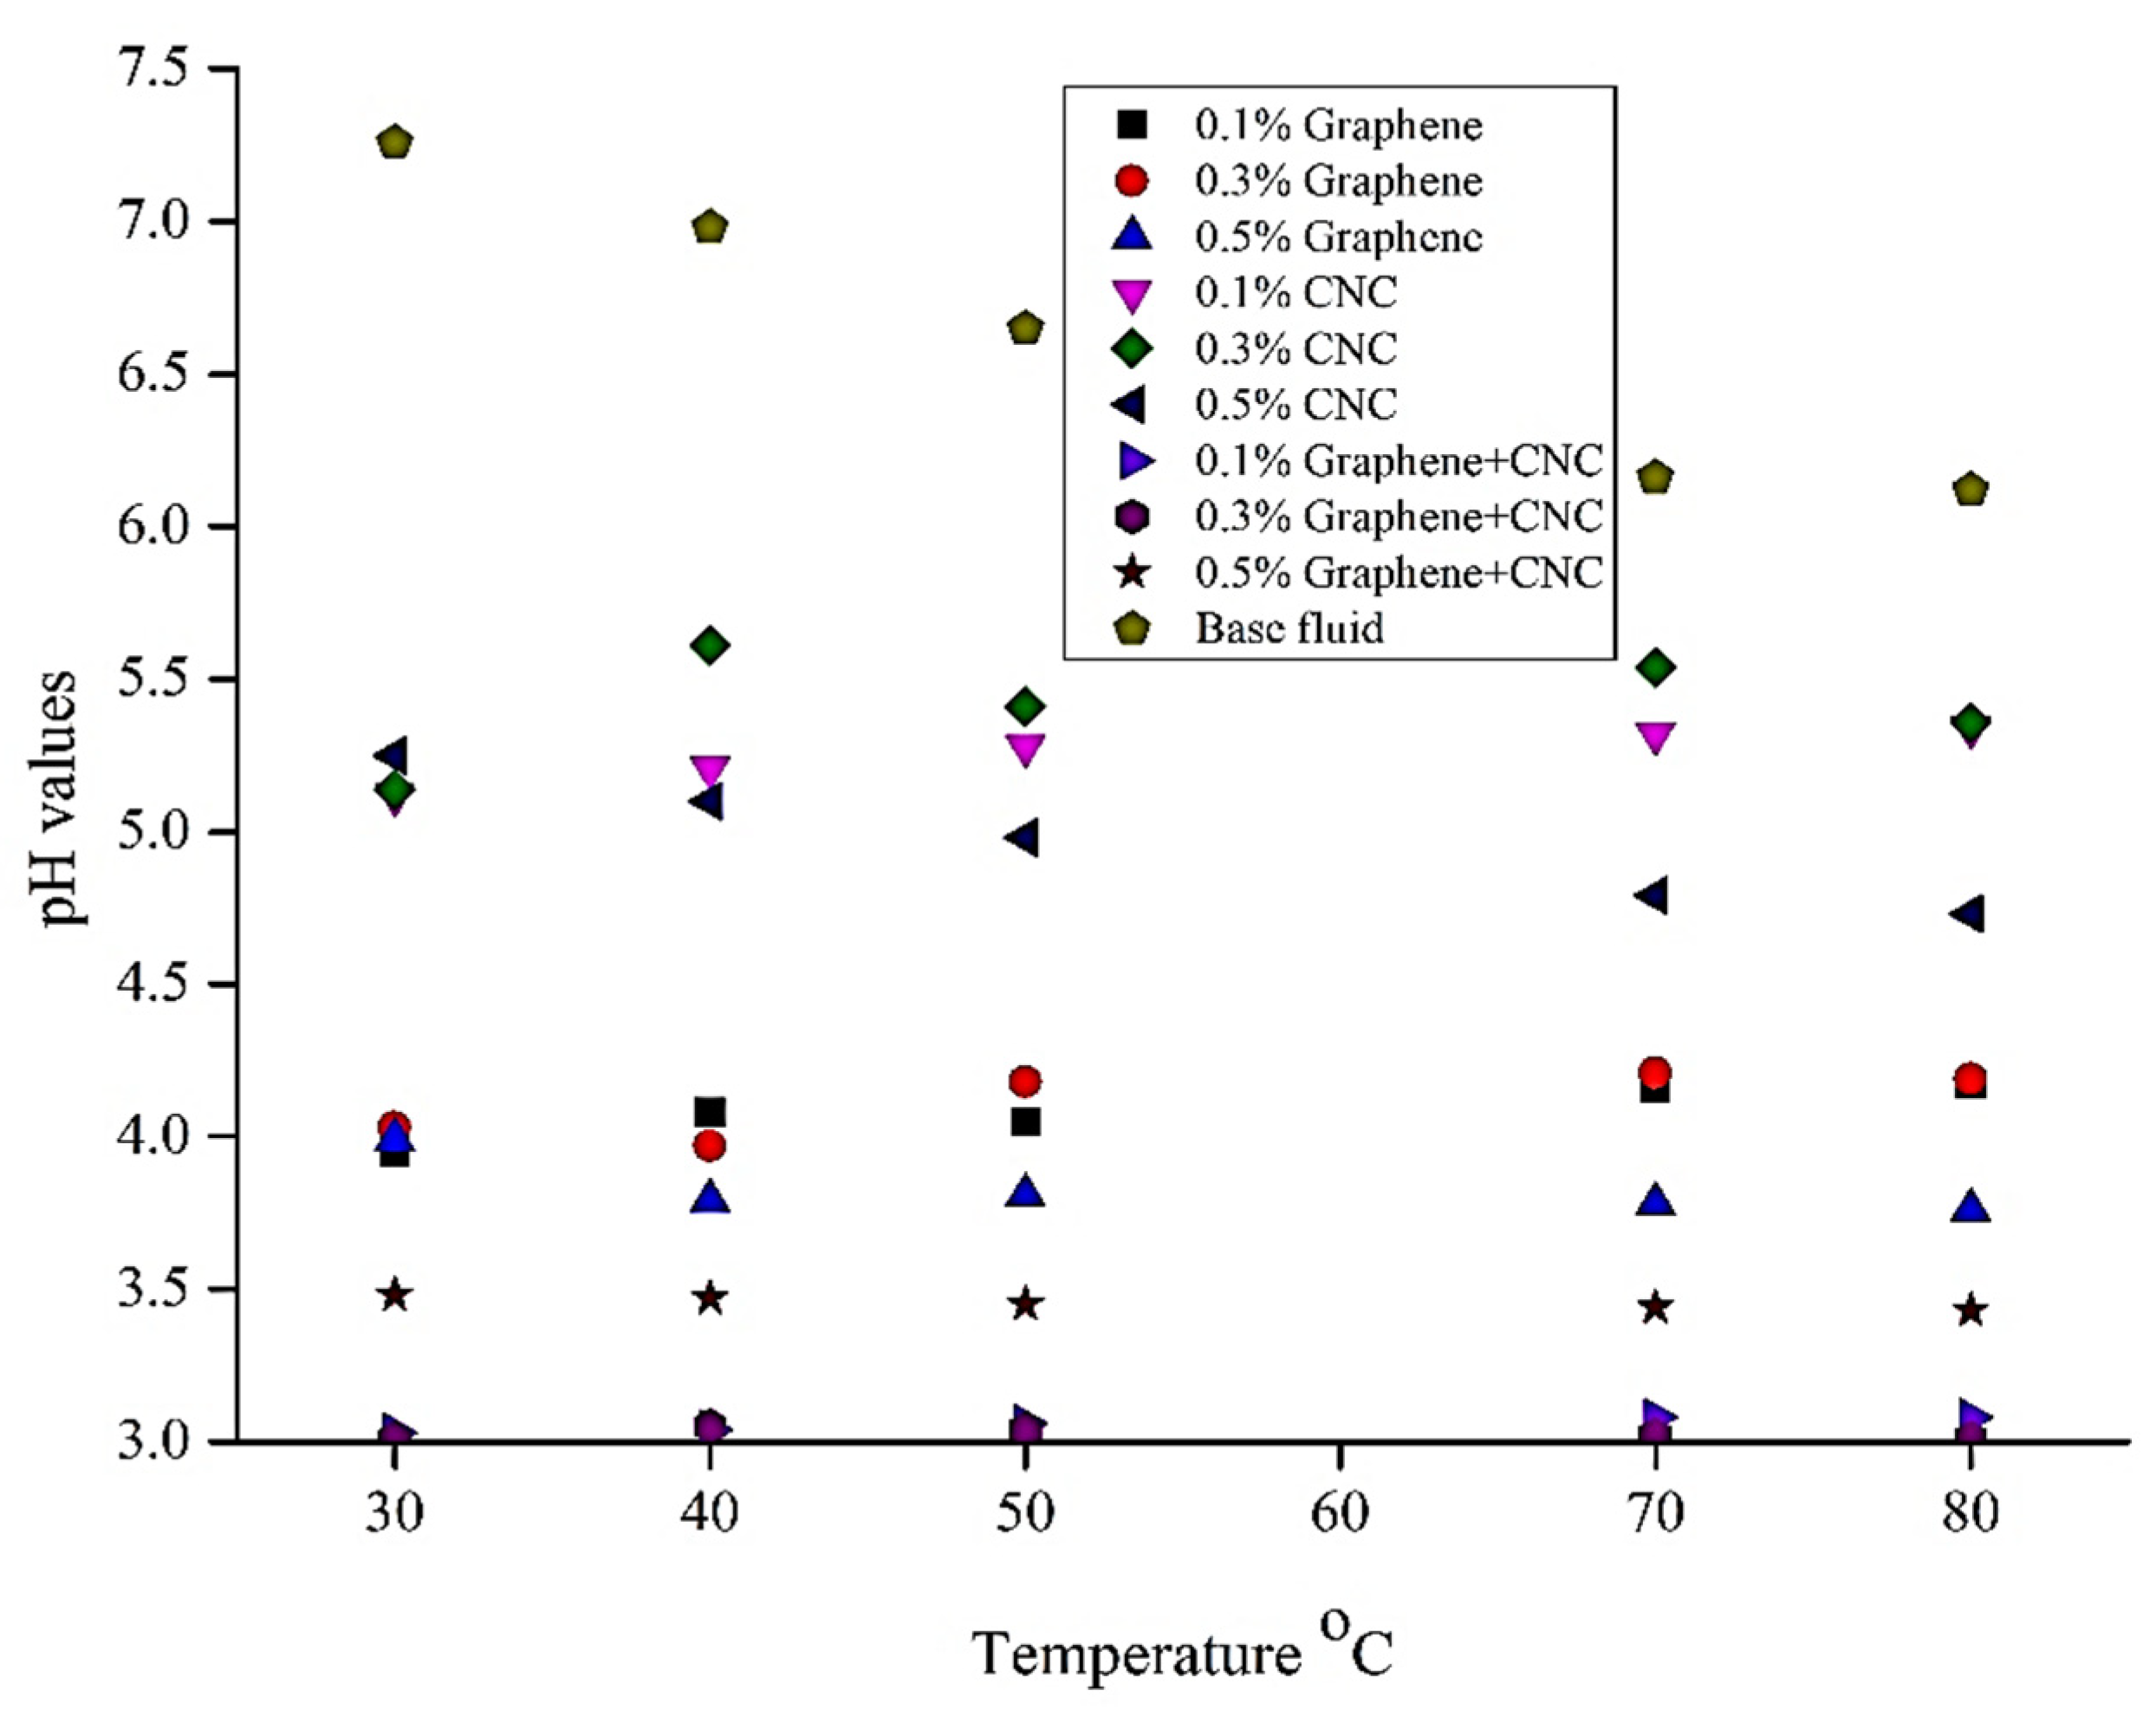
When the nanofluid pH is equal to one, the zeta potential of nanofluids with 0.1, 0.2, and 0.3% concentrations is +34.9, +45.2, and +49.4 mV, respectively. When the nanofluid pH is 3, the zeta potential for nanofluids with 0.1, 0.2, and 0.3 volume percent concentrations is +40.8, +39.2, and +38.8 mV, respectively. Furthermore, when the nanofluid pH is 6, the zeta potential for nanofluids with 0.1, 0.2, and 0.3 volume percent concentrations is +37.3, +35.4, and +33.6 mV, respectively. These findings suggest that the stability of the nanofluid increases as the pH of the base fluid changes from neutral to acidic. However, nanofluids with pH levels lower than 3 (acidic) are not recommended because they will corrode the test tube, causing damage to the experimental setup [77]. An amount of 0.1% and 0.5% of CNC, as Figure 18 shows, is a very wavy change of pH parameters, as it increases gradually for 0.1% but slowly decreases for 0.5%. Whereas it starts to increase a little at 30 °C to 40 °C mark but decreases at 40 °C to 50 °C but then again increases in 50 °C to 60 °C, and then decreases, gradually maintaining similar change as a sine curve, and this shows a similar kind of behavior in graphene as well. For hybrid nanofluids, pH values were more acidic than the single nanofluids. As it was shown, for a 0.3% hybrid volume concentration at temperatures 30 °C to 80 °C, pH values were 3.01, 3.05, 3.04, 3.02, and 3.01, respectively. On the other hand, in a volume concentration of 0.5%, pH was a little higher at 3.48, 3.47, 3.45, 3.44, and 3.45, so the conclusion was that graphene and CNC made fluid more acidic. In this experiment, pH values were over 3 and for hybrid nanofluids, pH values were more or less 3.5. If it was below 3 then there was a risk of corrosion of the tube [78].

7. Performance Assessment

Thermal Performance Assessment

The heat transfer coefficient of the flowing fluid is directly proportional to the value of its thermal conductivity, resulting in a large increase in the efficiency of the solar collector. The thin thermal boundary layers formed at the riser pipe walls as a result of increased nanofluid thermal conductivity, as well as a decrease in thermal resistance between the working fluid and the inner wall surface of the riser pipe which was primarily responsible for the significant increase in the convective heat transfer coefficient [79]. The following sections detail the results of the thermal performance of the collectors, along with the uncertainty analysis and discussion. As previously stated, the primary goal of this research is to learn more about the impacts of employing nanofluids and hybrid nanofluids as a working fluid in solar thermal collectors. As a result, parameters, such as the effects of the base fluid type and nanofluid synthesis process will not be studied in the current study. Deionized water and ethylene glycol were employed as the study’s base fluid and have been presented in Figure 8. By analyzing the thermo-physical properties of nanofluids, 0.3% and 0.5% volume fractions of nanofluids and hybrid nanofluids (both graphene and CNC) were selected and used in FPSC in this work. Because of various inconsistencies in thermo-physical properties, the 0.1% volume concentration of nanofluids and hybrid nanofluids (both graphene and CNC) was abandoned. The most essential attribute of heat transfer applications is thermal conductivity. All temperature differences and performance showed with the precious thermocouple.
FPSC’s energy gain and efficiency were calculated. Ref. [80] using the data presented in Table 2. The scenario of the specific heat of base fluid, and the 0.3% and 0.5% volume fraction nanofluids and hybrid nanofluids (both graphene and CNC) at 30 °C, 40 °C, 50 °C, 70 °C temperatures and at the 80 °C temperature was depicted in Table 3. All fluids flowed at a constant mass rate of 0.0106 kg/s. For the individual specific heat of the base fluid, 0.3% and 0.5% volume fraction nanofluids, both graphene, and CNC in the 30 °C to 80 °C temperature range, the FPSC outlet, and inlet temperatures recorded in Table 2 were repeated. In this study, solar radiance has been considered as a constant value, which is 830 W/m2; this value has been selected from the experimental work of solar collectors performed by Gaos, et al. [81]. The authors tracked down the maximum sun-powered brilliance at 830 W/m2. Furthermore, the space of the sun-powered gatherer was 0.97526 m2, which has been determined by physically utilizing the genuine estimation of lines, as displayed in Table 1. The internal and external breadth (mm) of header and riser tubes was the same and the all-out number of lines was ten, as shown in Table 2, using thermocouples in the inlet (Tin) and exit (Tout).
With the elevation of temperature per 10 °C ranging from 30 °C to 80 °C base fluid, 0.3% CNC, 0.3% graphene nanofluid, and the volumetric fraction of 0.3% and 0.5%, hybrid nanofluids’ physical characteristics, such as thermal conductivity, viscosity, specific heat, and density were measured and tabulated in Table 3. It is seen that, with the gradual increase of temperature, the thermal conductivity of all nanofluids and base fluid exhibited prolific results with improved viscosity. All the subjected fluids have shown the best results in terms of thermal conductivity at 80 °C. At 80 °C, the base fluid’s thermal conductivity was recorded 0.458 Wm−1·K−1 whereas 0.3% and 0.5% CNC had 0.561 Wm−1·K−1 and 0.76 Wm−1·K−1, respectively. On the other hand, 0.3% and 0.5% graphene nanofluid both hold a thermal conductivity of 0.77 Wm−1·K−1 at 80 °C. Most prominently, hybrid nanofluids volumetric fractions of 0.3% and 0.5% show prolific results at elevated temperatures of 80 °C. At 80 °C hybrid nanofluid of 0.3% and 0.5%, volumetric fraction possesses a thermal conductivity of 0.86 Wm−1·K−1 and 0.89 Wm−1·K−1, respectively, whereas they showed a good viscosity property of 3.16 and 3.23, respectively. Thus, certainly, it can be drawn from the empirical data that, hybrid nanofluid with a 0.5% volumetric fraction shows the best result in terms of thermal conductivity and viscosity, superseding the other subjected absorber fluids which strengthen its place as an ideal substitute for regular heat exchanger fluid.
The improvement of thermal conductivity causes the enhancement of heat transfer, and as a result, the outlet temperature of FPSC improved. Not only that, when the temperature increased the thermal conductivity also increased, resulting in a higher outlet temperature. The energy gain equation showed that the energy gain is directly proportional to the mass flow rate. However, the mass flow rate was fixed in this study. Therefore, energy gain depends on the specific heat and temperature differences and is directly proportional to them. The energy gain was calculated based on the different specific values at different temperatures of the base fluid and nanofluids (graphene and CNC). However, the outlet temperature was fixed for the specific heat at different temperatures. The energy gain calculation revealed that the higher the specific heat of base fluid and CNC nanofluids performed, the higher the energy gain than the graphene nanofluids in FPSC. The efficiency of FPSC increased according to the energy gain of FPSC. The maximum energy gains and efficiency are achieved by FPSC when the value of specific heat is considered at 80 °C temperature. On the other hand, the hybrid nanofluids reflex had a more considerable and reliable energy gain and efficiency enhancement, and the highest pick point was 80 °C.
An experimental investigation was carried out for the first time, to document and articulate the effect of CNC, graphene–water/EG nanofluids for the enhancement of thermal efficiency of the FPSC. The thermal performance of the solar collector enhances with the increase in mass concentration and mass flow rates and decreases with an increase in reduced temperature parameters. The highest thermal performance of a solar collector has reached 78% at a mass concentration of 0.1 mass percent and a flow rate of 0.0106 kg·s−1, which is 18.2% higher than water at the same flow rate conditions [79]. The size and shape of nanoparticles also greatly affect the thermal conductivity, heat transfer, and efficiency of the system [82]. Not only that but also stability has a great effect on thermal conductivity: after 15 days of stability, the graphene nanofluids were stable, however, after 45 days, the graphene had little sedimentation and thermal conductivity and was going down in terms of stability [83]. The stability of graphene nanofluids, at the 0.3% and 0.5% volume concentrations, was good.
As seen in Figure 19, 0.3% of graphene has an efficiency of 14.43% at a temperature of 80 °C and the lowest value of efficiency percentage was 13.7% at the 30 °C temperature. The increase of volume concentration of graphene from 0.3% to 0.5% shows the same trend of efficiency. The bar diagram of hybrid nanofluids has a completely different appearance compared to nanofluids. The efficiency enhancement was directly proportional to the temperature. The 30 °C temperature showed the lowest efficiency, while 80 °C showed the highest efficiency. A 0.3% CNC has sowed the highest efficiency at 16.88% at a temperature of 80 °C among the whole bar diagram, whereas hybrid nanofluids present 15.86% efficiency at the same temperature but with a volume concentration of 0.5%.
It was also discovered that using a hybrid turbulator with a Reynolds number of 20,000 and a volume fraction of 3% of nanoparticles resulted in the best exergy efficiency mode when compared to a parabolic trough solar collector containing hybrid nanofluid and equipped with compound turbulator [84]. Nanoparticles in various forms must be used in various devices because they affect the thermal conductivity and viscosity of the fluid. The impact of nanoparticles with different shapes of blade, platelet, brick, and cylinder on a flat plate collector is studied due to the importance of solar energy on the one hand, and the importance of using nanoparticles with different shapes on the other. This research is carried out by utilizing existing relationships. In addition, because hexagonal cross-sections can transfer more heat than circle cross-sections, hexagonal cross-section tubes are used to measure their effect on heat transfer in the collector. The collector is studied using two metals, steel, and copper, and the results are compared [85].
In this study, CNC, and graphene nanoparticles were used to enhance the efficiency of the FPSC system. Earlier, there was no study conducted with the Graphene+CNC hybrid nanoparticle on the efficiency enhancement of the FPSC system. Therefore, it was very difficult to compare the efficiency enhancement of FPSC with other studies. A lot of studies were conducted with CNC, graphene, and other nanoparticles dispersed into water. Graphene has been selected for its extraordinary characteristics. Graphene has a wide range of theoretical areas (2630 m2 g−1), 200 000 cm2·v−1·s−1 inherent mobility, high Young’s modulus (~1.0 TPa), the conductivity of high heat (~5000 Wm−1·K−1), optical transmission capacity (~97.7%), and excellent electrical conductivity [86]. Currently, there are a few studies conducted with the mixture of water and ethylene glycol (60:40) as the base or working fluid for FPSC. This is due to the stability of nanoparticles in the water-EG mixture. Not all nanofluids are stable in water/EG base fluid. It is different compared with water, where nanoparticles are easily stable, specifically graphene nanoparticles. A comparison illustration of efficiency enhancement of FPSC using graphene, CNC nanofluids, and hybrid nanofluids with the experimental study of Meibodi, et al. [87] was prepared. The base fluid thermal conductivity plays an important part in the convection heat transfer concept. The thermal properties of nanofluids are improved by the evolution of nanoparticles in various base substances, such as mineral oil, lubricating oil, glycerol, ethylene glycol, and methanol. Liquid layering and the Brownian motion are two important elements that influence thermal conductivity in nanofluids. The Brownian motion is a process in which nanoparticles collide in a base fluid, allowing direct heat transfer between two particles and improving the thermal conductivity of the base fluid [88]. However, there are different investigations, that could not figure out how to defeat agglomeration and sedimentation of nanoparticles. It has been seen in various studies that the efficiency of flat plate solar collectors should be increased by using nanofluids instead of water [89]. Besides, the results of efficiency enhancement depend upon the parameters of inlet and outlet temperature, mass flow rate, and specific heat, and the efficiency will decrease if the solar radiance and surface area increase, which is shown in Equations 3 and 11. The difference in inlet and outlet temperature has a bearing on various factors, such as copper tube pipe, the thickness of the pipe, and the surface area of the pipe. Test condition temperatures, such as sunlight radiance, in this case, demonstrated that the difference of inlet and outlet temperature difference was higher than that of the efficiency and will be more advanced. Graphene, CNC, and hybrid nanofluids provided excellent efficiency enhancement compared with other studies, as illustrated in Table 4. CNC/water-EG have provided a 16.88% efficiency output, whereas graphene/water-EG displayed a 11.99% efficiency enhancement, however, for hybrid/water-EG, it displayed 15.88%, which was in between two nanofluids.
Thermal efficiency is material-dependent and varies with nanoparticle loading for different flow regimes due to material-dependent thermo-physical properties and heat transfer coefficients. Some distinguished conclusions had been made primarily based totally on the works; the enhancement of thermal conductivity of nanofluids is dependent on temperature and thermal conductivity and will increase with temperature growth, functionalized graphene nanoparticles growth balance and the sturdiness of the nanofluids, and the suspension of graphene nanoparticles within the base fluid will increase the thermal conductivity. It became obvious from the comparative evaluation that the addition of graphene nanofluids drastically complements viscosity. In this study, CNC, and graphene nanoparticles were used to enhance the efficiency of the FPSC system. Earlier, there was no study conducted regarding the graphene+CNC hybrid nanoparticles’ efficiency enhancement of the FPSC system. Previously, there was no research for a hybrid including graphene nanoparticles. Though graphene has excellent thermal and heat transfer capability, a small change of sunlight created a better output of efficiency than other nanofluids. Therefore, it was very difficult to compare the efficiency enhancement of FPSC with other studies. A lot of studies were conducted with CNC, graphene, and other nanoparticles dispersed into the water in numerous solar collectors. In the case of an evacuated tube solar collector, when the collector was operated with carbon nanotube nanofluid at a concentration of 0.2 vol%, thermal efficiency increased by only 16.4% [22]. CuO nanofluids at 0.03 vol% in an evacuated tube solar collector escalated thermal efficiency by 14% when associated with the base fluid [90]. Even at very low multi-layer graphene (MLG) concentrations, the MLG nanofluids are an auspicious preference for enhancing heat transfer efficiency in evacuated tube solar collectors, as the thermal efficiency raised by up to 76% [21]. The most obvious challenges when using nanofluids or hybrid nanofluids with flat panel solar collectors are nanoparticle instability, sunlight temperature consistency, increased viscosity leading to frictional pressure drops and increased pumping power. On the other hand, the size of nanoparticles and the stability of nanofluids were two important factors in increasing efficiency. It is very difficult to understand the behavior of nonpareil size, and because of ongoing developments in the field of nanotechnology, all these challenges may be resolved soon.

8. Conclusions

The objective of this research was to examine the consequences for FPSC execution because of the use of watery colloidal scatterings of carbon-based nanostructures as elective working liquids at different weight fixations. The experimental hybrid nanofluid was examined, studied, and revised thoroughly to draw the results. Although the FPSC is still used as an alternative source of transmitting energy because of less heat generation, large accommodation, and less cost-effectiveness, the world is progressing towards technology with mega projects and structures. However, dependence on weather conditions and the inability to store much energy, together with poor thermal conductivity, makes the traditional FPSC vulnerable to use in homes. This study shows that very much highly conductive graphene and CNC hybrid nanofluid can be an optimum solution to the stated problems. This work demonstrated that the hybrid nanofluid results in 194% more conductivity than the regular nanofluid at 80 °C, and is 3.05 times more viscose than the base fluid at 80 °C. Such results indicate the promising aspects of the hybrid nanofluid as a stable and ideal substitute for regular absorber material. Here, 0.3% CNC nanofluid exhibited the highest efficiency among all nanofluids, and hybrid nanofluids of about 16.88% and 0.5% hybrid (graphene+CNC) performed the maximum efficacy performance among hybrid nanofluid volume concentrations of about 15.86%. The improved thermal and optical properties of the hybrid nanofluids are credited with the increased efficiency. Graphene and CNC hybrid nanofluid show exceptional advancement as absorber fluid and hence can be studied extensively and further commercialized. Because of their modified properties, hybrid nanofluids have several advantages over conventional types. Because of their improved thermo-physical and rheological properties, they are more suitable for solar energy systems. The improved thermal properties of the convective fluid are the most important reason for the improved performance of nanofluidic solar energy systems. Statistics studies show that, by 2050, solar energy will produce 45% of the whole electricity supply for the country alone. Further initiatives are needed to replace conventional heat exchanger fluid to improve its thermal performance.

Author Contributions

Conceptualization, A.S.F.M. and W.S.W.H.; resources, W.S.W.H.; data curation, K.K.; writing—original draft preparation, D.R. and A.S.F.M.; writing—review and editing, K.F.; visualization; supervision, W.S.W.H.; project administration, T.Y.; funding acquisition, K.S. All authors have read and agreed to the published version of the manuscript.

Funding

This research was funded by [Ministry of Higher Education of Malaysia] grant number [FRGS/1/2019/TK03/UMP/02/15] and Universiti Malaysia Pahang internal grant [RDU213308]. The APC was funded by [RDU1903134]. Information regarding the funder and the funding number should be provided. Please check the accuracy of funding data and any other information carefully.

Institutional Review Board Statement

Not applicable.

Informed Consent Statement

Not applicable.

Data Availability Statement

Not applicable.

Acknowledgments

The authors sincerely thank the Ministry of Higher Education of Malaysia and Universiti Malaysia Pahang Research.

Conflicts of Interest

The authors declare no conflict of interest.

Nomenclature

ρ Density (kg/m3 or g/m3)
ϕ Volumetric concentration of particles (%)
C p Specific heat (J/kg-K or J/g-K)
D Characteristic linear dimension (m)
k Thermal conductivity (Wm−1·K−1)
μ Viscosity (kg/m. s or cP)
w Mass fraction
Q u Energy gain (kW)
m   ˙ Mass flow rate (kg/s)
I t Incident solar radiation (W/m2)
A c Area of the solar collector (m2)
η Efficiency (%)
T Temperature (K or °C)
ν Characteristic velocity (m/s)
Q Volumetric flow rate (m3/s)
A Cross-sectional area of the tube (m2)

References

  1. Kona, A.; Bertoldi, P.; Monforti-Ferrario, F.; Rivas, S.; Dallemand, J.F.J. Covenant of mayors signatories leading the way towards 1.5 degree global warming pathway. Sustain. Cities Soc. 2018, 41, 568–575. [Google Scholar] [CrossRef]
  2. IEA. World Energy Outlook 2011; IEA: Paris, France, 2011; Volume 666. [Google Scholar]
  3. Dong, K.; Dong, X.; Jiang, Q.J. How renewable energy consumption lower global CO2 emissions? Evidence from countries with different income levels. World Econ. 2020, 43, 1665–1698. [Google Scholar] [CrossRef]
  4. Zhang, X.; Estoque, R.C.; Murayama, Y. An urban heat island study in Nanchang City, China based on land surface temperature and social-ecological variables. Sustain. Cities Soc. 2017, 32, 557–568. [Google Scholar] [CrossRef]
  5. Jamshidi, M.; Askarzadeh, A. Techno-economic analysis and size optimization of an off-grid hybrid photovoltaic, fuel cell and diesel generator system. Sustain. Cities Soc. 2019, 44, 310–320. [Google Scholar] [CrossRef]
  6. Maurano, A.; Amatya, R.; Bulovic, V.; Stoner, R. Solar Heating for Residential and Industrial Processes; Working Paper; MIT Energy Initiative: Cambridge, MA, USA, 2015. [Google Scholar]
  7. Farhana, K.; Kadirgama, K.; Mohammed, H.A.; Ramasamy, D.; Samykano, M.; Saidur, R.J. Analysis of efficiency enhancement of flat plate solar collector using crystal nano-cellulose (CNC) nanofluids. Sustain. Energy Technol. Assess. 2021, 45, 101049. [Google Scholar] [CrossRef]
  8. Victoria, M.; Haegel, N.; Peters, I.M.; Sinton, R.; Jäger-Waldau, A.; del Cañizo, C.; Breyer, C.; Stocks, M.; Blakers, A.; Kaizuka, I.; et al. Solar photovoltaics is ready to power a sustainable future. Joule 2021, 5, 1041–1056. [Google Scholar] [CrossRef]
  9. Nazari, M.A.; Maleki, A.; Assad, M.E.H.; Rosen, M.A.; Haghighi, A.; Sharabaty, H.; Chen, L. A review of nanomaterial incorporated phase change materials for solar thermal energy storage. Sol. Energy 2021, 228, 725–743. [Google Scholar] [CrossRef]
  10. Ceylan, I.; Gürel, A.E.; Ergün, A.; Ali, İ.H.G.; Ağbulut, Ü.; Yıldız, G. A detailed analysis of CPV/T solar air heater system with thermal energy storage: A novel winter season application. J. Build. Eng. 2021, 42, 103097. [Google Scholar] [CrossRef]
  11. Sheikholeslami, M.; Farshad, S.A.; Ebrahimpour, Z.; Said, Z. Recent progress on flat plate solar collectors and photovoltaic systems in the presence of nanofluid: A review. J. Clean. Prod. 2021, 293, 126119. [Google Scholar] [CrossRef]
  12. Abid, M.; Khan, M.S.; Ratlamwala, T.A.H.; Malik, M.N.; Ali, H.M.; Cheok, Q. Thermodynamic analysis and comparison of different absorption cycles driven by evacuated tube solar collector utilizing hybrid nanofluids. Energy Convers. Manag. 2021, 246, 114673. [Google Scholar] [CrossRef]
  13. Choi, S.; Zhang, Z.; Yu, W.; Lockwood, F.; Grulke, E.J.A. Anomalous thermal conductivity enhancement in nanotube suspensions. Appl. Phys. Lett. 2001, 79, 2252–2254. [Google Scholar] [CrossRef]
  14. Eastman, J.A.; Choi, U.; Li, S.; Thompson, L.; Lee, S.J. Enhanced thermal conductivity through the development of nanofluids. MRS Online Proc. Libr. 1996, 457, 3. [Google Scholar] [CrossRef]
  15. Eastman, J.A.; Choi, S.; Li, S.; Yu, W.; Thompson, L.J.A. Anomalously increased effective thermal conductivities of ethylene glycol-based nanofluids containing copper nanoparticles. Appl. Phys. Lett. 2001, 78, 718–720. [Google Scholar] [CrossRef]
  16. Farhana, K.; Kadirgama, K.; Rahman, M.M.; Ramasamy, D.; Noor, M.M.; Najafi, G.; Samykano, M.; Mahamude, A.S. Improvement in the performance of solar collectors with nanofluids—A state-of-the-art review. Nano-Struct. Nano-Objects 2019, 18, 100276. [Google Scholar] [CrossRef]
  17. Ghozatloo, A.; Rashidi, A.M.; Shariaty-Niasar, M.J. Effects of surface modification on the dispersion and thermal conductivity of CNT/water nanofluids. Int. Commun. Heat Mass Transf. 2014, 54, 1–7. [Google Scholar] [CrossRef]
  18. Shanbedi, M.; Heris, S.Z.; Maskooki, A.J. Experimental investigation of stability and thermophysical properties of carbon nanotubes suspension in the presence of different surfactants. J. Therm. Anal. Calorim. 2015, 120, 1193–1201. [Google Scholar] [CrossRef]
  19. Li, Y.; Xie, H.Q.; Yu, W.; Li, J. Investigation on heat transfer performances of nanofluids in solar collector. Mater. Sci. Forum 2011, 694, 33–36. [Google Scholar] [CrossRef]
  20. Vakili, M.; Hosseinalipour, S.; Delfani, S.; Khosrojerdi, S.; Karami, M.J. Experimental investigation of graphene nanoplatelets nanofluid-based volumetric solar collector for domestic hot water systems. Sol. Energy 2016, 131, 119–130. [Google Scholar] [CrossRef]
  21. Natividade, P.S.G.; de Moraes Moura, G.; Avallone, E.; Bandarra Filho, E.P.; Gelamo, R.V.; Gonçalves, J.C. Experimental analysis applied to an evacuated tube solar collector equipped with parabolic concentrator using multilayer graphene-based nanofluids. Renew. Energy 2019, 138, 152–160. [Google Scholar] [CrossRef]
  22. Mahbubul, I.; Khan, M.M.A.; Ibrahim, N.I.; Ali, H.M.; Al-Sulaiman, F.A.; Saidur, R.J. Carbon nanotube nanofluid in enhancing the efficiency of evacuated tube solar collector. Renew. Energy 2018, 121, 36–44. [Google Scholar] [CrossRef]
  23. Sadeghinezhad, E.; Mehrali, M.; Saidur, R.; Mehrali, M.; Latibari, S.T.; Akhiani, A.R.; Metselaar, H.S. A comprehensive review on graphene nanofluids: Recent research, development and applications. Energy Convers. Manag. 2016, 111, 466–487. [Google Scholar] [CrossRef]
  24. Mahamude, A.S.F.; Harun, W.S.W.; Kadirgama, K.; Farhana, K.; Ramasamy, D.; Samylingam, L.; Aslfattahi, N.J. Thermal performance of nanomaterial in solar collector: State-of-play for graphene. J. Energy Storage 2021, 42, 103022. [Google Scholar] [CrossRef]
  25. Catania, F.; Marras, E.; Giorcelli, M.; Jagdale, P.; Lavagna, L.; Tagliaferro, A.; Bartoli, M. A review on recent advancements of graphene and graphene-related materials in biological applications. Appl. Sci. 2021, 11, 614. [Google Scholar] [CrossRef]
  26. Chen, L.; Liu, J.; Fang, X.; Zhang, Z.J. Reduced graphene oxide dispersed nanofluids with improved photo-thermal conversion performance for direct absorption solar collectors. Sol. Energy Mater. Sol. Cells 2017, 163, 125–133. [Google Scholar] [CrossRef]
  27. Kumar, P.; Shahzad, F.; Yu, S.; Hong, S.M.; Kim, Y.-H.; Koo, C.M.J. Large-area reduced graphene oxide thin film with excellent thermal conductivity and electromagnetic interference shielding effectiveness. Carbon 2015, 94, 494–500. [Google Scholar] [CrossRef]
  28. Schwamb, T.; Burg, B.R.; Schirmer, N.C.; Poulikakos, D.J. An electrical method for the measurement of the thermal and electrical conductivity of reduced graphene oxide nanostructures. Nanotechnology 2009, 20, 405704. [Google Scholar] [CrossRef]
  29. Lu, Z.; Fan, L.; Zheng, H.; Lu, Q.; Liao, Y.; Huang, B.J.B. Preparation, characterization and optimization of nanocellulose whiskers by simultaneously ultrasonic wave and microwave assisted. Bioresour. Technol. 2013, 146, 82–88. [Google Scholar] [CrossRef]
  30. Bondeson, D.; Mathew, A.; Oksman, K.J.C. Optimization of the isolation of nanocrystals from microcrystalline cellulose by acid hydrolysis. Cellulose 2006, 13, 171. [Google Scholar] [CrossRef]
  31. Iwamoto, S.; Nakagaito, A.; Yano, H.J.A.P.A. Nano-fibrillation of pulp fibers for the processing of transparent nanocomposites. Appl. Phys. A 2007, 89, 461–466. [Google Scholar] [CrossRef]
  32. Isogai, A. Wood nanocelluloses: Fundamentals and applications as new bio-based nanomaterials. J. Wood Sci. 2013, 59, 449–459. [Google Scholar] [CrossRef]
  33. Panthapulakkal, S.; Sain, M.J.I.J. Preparation and characterization of cellulose nanofibril films from wood fibre and their thermoplastic polycarbonate composites. Int. J. Polym. Sci. 2012, 2012, 381342. [Google Scholar] [CrossRef]
  34. Osong, S.H.; Norgren, S.; Engstrand, P.J.C. Processing of wood-based microfibrillated cellulose and nanofibrillated cellulose, and applications relating to papermaking: A review. Cellulose 2016, 23, 93–123. [Google Scholar] [CrossRef]
  35. Gabr, M.H.; Phong, N.T.; Abdelkareem, M.A.; Okubo, K.; Uzawa, K.; Kimpara, I.; Fujii, T.J.C. Mechanical, thermal, and moisture absorption properties of nano-clay reinforced nano-cellulose biocomposites. Cellulose 2013, 20, 819–826. [Google Scholar] [CrossRef]
  36. Graveson, I.; English, R. Low Energy Method for the Preparation of Non-Derivatized Nanocellulose. U.S. Patent 9,371,401 B2, 21 June 2016. [Google Scholar]
  37. Mahamude, A.S.F.; Harun, W.S.W.; Kadirgama, K.; Ramasamy, D.; Farhana, K. Cotton waste research follows the effect of pre-treatment and the observation of physical appearance. IOP Conf. Series. Mater. Sci. Eng. 2021, 1078, 012014. [Google Scholar] [CrossRef]
  38. Lin, J.; Yu, L.; Tian, F.; Zhao, N.; Li, X.; Bian, F.; Wang, J.J.C. Cellulose nanofibrils aerogels generated from jute fibers. Carbohydr. Polym. 2014, 109, 35–43. [Google Scholar] [CrossRef]
  39. Orasugh, J.T.; Saha, N.R.; Rana, D.; Sarkar, G.; Mollick, M.M.; Chattoapadhyay, A.; Mitra, B.C.; Mondal, D.; Ghosh, S.K.; Chattopadhyay, D. Jute cellulose nano-fibrils/hydroxypropylmethylcellulose nanocomposite: A novel material with potential for application in packaging and transdermal drug delivery system. Ind. Crops Prod. 2018, 112, 633–643. [Google Scholar] [CrossRef]
  40. Shahabi-Ghahafarrokhi, I.; Khodaiyan, F.; Mousavi, M.; Yousefi, H.J.F. Preparation and characterization of nanocellulose from beer industrial residues using acid hydrolysis/ultrasound. Fibers Polym. 2015, 16, 529–536. [Google Scholar] [CrossRef]
  41. Vieira, D.C.; Lima, L.N.; Mendes, A.A.; Adriano, W.S.; Giordano, R.C.; Giordano, R.L.; Tardioli, P.W.J. Hydrolysis of lactose in whole milk catalyzed by β-galactosidase from Kluyveromyces fragilis immobilized on chitosan-based matrix. Biochem. Eng. J. 2013, 81, 54–64. [Google Scholar] [CrossRef]
  42. Balandin, A.A.; Ghosh, S.; Bao, W.; Calizo, I.; Teweldebrhan, D.; Miao, F.; Lau, C.N.J.N. Superior thermal conductivity of single-layer graphene. Nat. Mater. 2008, 8, 902–907. [Google Scholar] [CrossRef]
  43. Bahiraei, M.; Heshmatian, S.J.E.C. Graphene family nanofluids: A critical review and future research directions. Energy Convers. Manag. 2019, 196, 1222–1256. [Google Scholar] [CrossRef]
  44. Ciesielski, A.; Samori, P.J.C.S.R. Graphene via sonication assisted liquid-phase exfoliation. Chem. Soc. Rev. 2014, 43, 381–398. [Google Scholar] [CrossRef] [PubMed]
  45. Wahab, A.; Khan, M.A.Z.; Hassan, A.J.J. Impact of graphene nanofluid and phase change material on hybrid photovoltaic thermal system: Exergy analysis. J. Clean. Prod. 2020, 277, 123370. [Google Scholar] [CrossRef]
  46. Saidur, R.; Leong, K.; Mohammed, H.A. A review on applications and challenges of nanofluids. Renew. Sustain. Energy Rev. 2011, 15, 1646–1668. [Google Scholar] [CrossRef]
  47. Samylingam, L.; Anamalai, K.; Kadirgama, K.; Samykano, M.; Ramasamy, D.; Noor, M.M.; Najafi, G.; Rahman, M.M.; Xian, H.W.; Sidik, N.A. Thermal analysis of cellulose nanocrystal-ethylene glycol nanofluid coolant. Int. J. Heat Mass Transf. 2018, 127, 173–181. [Google Scholar] [CrossRef]
  48. Yue, H.; Zhao, Y.; Ma, X.; Gong, J.J.C.S.R. Ethylene glycol: Properties, synthesis, and applications. Chem. Soc. Rev. 2012, 41, 4218–4244. [Google Scholar] [CrossRef]
  49. Zhang, H.; Zhai, C.; Gao, H.; Fu, N.; Zhu, M. High Efficient Ethylene Glycol Electrocatalytic Oxidation Based on Bimetallic PtNi on 2D Molybdenum Disulfide/Reduced Graphene Oxide Nanosheets. J. Colloid Interface Sci. 2019, 547, 102–110. [Google Scholar] [CrossRef]
  50. Kim, H.J.; Choi, S.M.; Green, S.; Tompsett, G.A.; Lee, S.H.; Huber, G.W.; Kim, W.B. Highly active and stable PtRuSn/C catalyst for electrooxidations of ethylene glycol and glycerol. Appl. Catal. B Environ. 2011, 101, 366–375. [Google Scholar] [CrossRef]
  51. Bioucas, F.; Vieira, S.; Lourenço, M.; Santos, F.; De Castro, C.N.J. Performance of heat transfer fluids with nanographene in a pilot solar collector. Sol. Energy 2018, 172, 171–176. [Google Scholar] [CrossRef]
  52. Sani, E.; Papi, N.; Mercatelli, L.; Żyła, G.J.R.E. Graphite/diamond ethylene glycol-nanofluids for solar energy applications. Renew. Energy 2018, 126, 692–698. [Google Scholar] [CrossRef]
  53. Yu, W.; Xie, H.; Bao, D.J. Enhanced thermal conductivities of nanofluids containing graphene oxide nanosheets. Nanotechnology 2009, 21, 055705. [Google Scholar] [CrossRef]
  54. Ramachandran, K.; Hussein, A.; Kadirgama, K.; Ramasamy, D.; Azmi, W.; Tarlochan, F.; Kadirgama, G.J. Thermophysical properties measurement of nano cellulose in ethylene glycol/water. Appl. Therm. Eng. 2017, 123, 1158–1165. [Google Scholar] [CrossRef]
  55. Sundar, L.S.; Ramana, E.V.; Graça, M.; Singh, M.K.; Sousa, A.C.J.I.C.; Transfer, M. Nanodiamond-Fe3O4 nanofluids: Preparation and measurement of viscosity, electrical and thermal conductivities. Int. Commun. Heat Mass Transf. 2016, 73, 62–74. [Google Scholar] [CrossRef]
  56. Arshad, A.; Jabbal, M.; Yan, Y.; Reay, D.J. A review on graphene based nanofluids: Preparation, characterization and applications. J. Mol. Liq. 2019, 279, 444–484. [Google Scholar] [CrossRef]
  57. Li, Y.; Wu, Z.; Xie, H.; Tang, D.; Wang, Y.; Li, Z. The preparation, characterization and application of glycol aqueous base graphene oxide nanofluid. MATEC Web Conf. 2018, 238, 02001. [Google Scholar] [CrossRef]
  58. Eletskii, A.V.; Iskandarova, I.M.; Knizhnik, A.A.; Krasikov, D.N.J. Graphene: Fabrication methods and thermophysical properties. Physics-Uspekhi 2011, 54, 227. [Google Scholar] [CrossRef]
  59. Dovjuu, O.; Kim, S.; Lee, A.; Kim, J.; Noh, J.; Huh, S.; Choi, B.; Jeong, H. A simple approach for heat transfer enhancement of carbon nanofluids in aqueous media. J. Nanosci. Nanotechnol. 2020, 20, 2337–2343. [Google Scholar] [CrossRef] [PubMed]
  60. Hui, L.; N’Tsoukpoe, K.E.; Lingai, L.J. Evaluation of a seasonal storage system of solar energy for house heating using different absorption couples. Energy Convers. Manag. 2011, 52, 2427–2436. [Google Scholar] [CrossRef]
  61. Minardi, J.E.; Chuang, H.N. Performance of a “black” liquid flat-plate solar collector. Sol. Energy 1975, 17, 179–183. [Google Scholar] [CrossRef]
  62. Li, X.; Zhu, D.; Wang, X.J. Evaluation on dispersion behavior of the aqueous copper nano-suspensions. J. Colloid Interface Sci. 2007, 310, 456–463. [Google Scholar] [CrossRef]
  63. Yousefi, T.; Veysi, F.; Shojaeizadeh, E.; Zinadini, S.J. An experimental investigation on the effect of Al2O3–H2O nanofluid on the efficiency of flat-plate solar collectors. Renew. Energy 2012, 39, 293–298. [Google Scholar] [CrossRef]
  64. Faizal, M.; Saidur, R.; Mekhilef, S.; Alim, M.A.J. Energy, economic and environmental analysis of metal oxides nanofluid for flat-plate solar collector. Energy Convers. Manag. 2013, 76, 162–168. [Google Scholar] [CrossRef]
  65. He, Q.; Zeng, S.; Wang, S.J. Experimental investigation on the efficiency of flat-plate solar collectors with nanofluids. Appl. Therm. Eng. 2015, 88, 165–171. [Google Scholar] [CrossRef]
  66. Zhang, X.; Gu, H.; Fujii, M.J. Effective thermal conductivity and thermal diffusivity of nanofluids containing spherical and cylindrical nanoparticles. Exp. Therm. Fluid Sci. 2007, 31, 593–599. [Google Scholar] [CrossRef]
  67. Duffie, J.A.; Beckman, W.A. Solar Engineering of Thermal Processes; John Wiley & Sons: Hoboken, NJ, USA, 2013. [Google Scholar]
  68. Farhana, K.; Kadirgama, K.; Ramasamy, D.; Samykano, M.; Najafi, G.J.J. Experimental Studies on Thermo-Physical Properties of Nanocellulose–Aqueous Ethylene Glycol Nanofluids. J. Adv. Res. Mater. Sci. 2020, 69, 1–15. [Google Scholar] [CrossRef]
  69. Selvam, C.; Lal, D.M.; Harish, S. Thermal conductivity and specific heat capacity of water–ethylene glycol mixture-based nanofluids with graphene nanoplatelets. J. Therm. Anal. Calorim. 2017, 129, 947–955. [Google Scholar] [CrossRef]
  70. Vajjha, R.; Das, D.; Mahagaonkar, B. Density measurement of different nanofluids and their comparison with theory. Pet. Sci. Technol. 2009, 27, 612–624. [Google Scholar] [CrossRef]
  71. Huang, J.; Wang, X.; Long, Q.; Wen, X.; Zhou, Y.; Li, L. Influence of pH on the stability characteristics of nanofluids. In Proceedings of the 2009 Photonics and Optoelectronics, Wuhan, China, 14–16 August 2009. [Google Scholar] [CrossRef]
  72. Yousefi, T.; Shojaeizadeh, E.; Veysi, F.; Zinadini, S.J. An experimental investigation on the effect of pH variation of MWCNT–H2O nanofluid on the efficiency of a flat-plate solar collector. Sol. Energy 2012, 86, 771–779. [Google Scholar] [CrossRef]
  73. Adio, S.A.; Sharifpur, M.; Meyer, J.P. Factors affecting the pH and electrical conductivity of MgO–ethylene glycol nanofluids. Bull. Mater. Sci. 2015, 38, 1345–1357. [Google Scholar] [CrossRef]
  74. Jia-Fei, Z.; Zhong-Yang, L.; Ming-Jiang, N.; Ke-Fa, C. Dependence of nanofluid viscosity on particle size and pH value. Chin. Phys. Lett. 2009, 26, 066202. [Google Scholar] [CrossRef]
  75. Xie, H.; Wang, J.; Xi, T.; Liu, Y.; Ai, F.; Wu, Q. Thermal conductivity enhancement of suspensions containing nanosized alumina particles. J. Appl. Phys. 2002, 91, 4568–4572. [Google Scholar] [CrossRef]
  76. Goudarzi, K.; Nejati, F.; Shojaeizadeh, E.; Yousef-abad, S.A. Experimental study on the effect of pH variation of nanofluids on the thermal efficiency of a solar collector with helical tube. Exp. Therm. Fluid Sci. 2015, 60, 20–27. [Google Scholar] [CrossRef]
  77. Sundar, L.S.; Mesfin, S.; Said, Z.; Singh, M.K.; Punnaiah, V.; Sousa, A.C. Energy, economic, environmental and heat transfer analysis of a solar flat-plate collector with pH-treated Fe 3 O 4/water nanofluid. Int. J. Energy A Clean Environ. 2021, 22, 55–98. [Google Scholar] [CrossRef]
  78. Farhana, K.; Mahamude, A.J. Experimental Analysis of pH of Nanofluids in Different Conditions. J. Eng. Adv. Mater. Appl. 2020, 1, 1–5. [Google Scholar]
  79. Akram, N.; Sadri, R.; Kazi, S.N.; Ahmed, S.M.; Zubir, M.N.; Ridha, M.; Soudagar, M.; Ahmed, W.; Arzpeyma, M.; Tong, G.B. An experimental investigation on the performance of a flat-plate solar collector using eco-friendly treated graphene nanoplatelets–water nanofluids. J. Therm. Anal. Calorim. 2019, 138, 609–621. [Google Scholar] [CrossRef]
  80. Verma, S.K.; Sharma, K.; Gupta, N.K.; Soni, P.; Upadhyay, N.J.E. Performance comparison of innovative spiral shaped solar collector design with conventional flat plate solar collector. Energy 2020, 194, 116853. [Google Scholar] [CrossRef]
  81. Gaos, Y.S.; Yulianto, M.; Juarsa, M.; Nurrohman; Marzuki, E.; Yuliaji, D.; Budiono, K. The performance of solar collector CPC (compound parabolic concentrator) type with three pipes covered by glass tubes. AIP Conf. Proc. 2017, 1826, 020022. [Google Scholar]
  82. Suganthi, K.; Rajan, K. Metal oxide nanofluids: Review of formulation, thermo-physical properties, mechanisms, and heat transfer performance. Renew. Sustain. Energy Rev. 2017, 76, 226–255. [Google Scholar] [CrossRef]
  83. Zhang, H.; Wang, S.; Lin, Y.; Feng, M.; Wu, Q.J. Stability, thermal conductivity, and rheological properties of controlled reduced graphene oxide dispersed nanofluids. Appl. Therm. Eng. 2017, 119, 132–139. [Google Scholar] [CrossRef]
  84. Khetib, Y.; Alahmadi, A.; Alzaed, A.; Sharifpur, M.; Cheraghian, G.; Siakachoma, C. Simulation of a parabolic trough solar collector containing hybrid nanofluid and equipped with compound turbulator to evaluate exergy efficacy and thermal-hydraulic performance. Energy Sci. Eng. 2021. [Google Scholar] [CrossRef]
  85. Alanazi, A.K.; Khetib, Y.; Abo-Dief, H.M.; Rawa, M.; Cheraghian, G.; Sharifpur, M. The effect of nanoparticle shape on alumina/EG-water (50:50) nanofluids flow within a solar collector: Entropy and exergy investigation. Case Stud. Therm. Eng. 2021, 28, 101510. [Google Scholar] [CrossRef]
  86. Zhu, Y.; Murali, S.; Cai, W.; Li, X.; Suk, J.W.; Potts, J.R.; Ruoff, R.S.J. Graphene and graphene oxide: Synthesis, properties, and applications. Adv. Mater. 2010, 22, 3906–3924. [Google Scholar] [CrossRef] [PubMed]
  87. Meibodi, S.S.; Kianifar, A.; Niazmand, H.; Mahian, O.; Wongwises, S. Experimental investigation on the thermal efficiency and performance characteristics of a flat plate solar collector using SiO2/EG–water nanofluids. Int. Commun. Heat Mass Transf. 2015, 65, 71–75. [Google Scholar] [CrossRef]
  88. Zhu, H.; Zhang, C.; Tang, Y.; Wang, J.; Ren, B.J. Preparation and thermal conductivity of suspensions of graphite nanoparticles. Carbon 2007, 45, 226–228. [Google Scholar] [CrossRef]
  89. Ziyadanogullari, N.B.; Yucel, H.; Yildiz, C. Thermal performance enhancement of flat-plate solar collectors by means of three different nanofluids. Therm. Sci. Eng. Prog. 2018, 8, 55–65. [Google Scholar] [CrossRef]
  90. Ghaderian, J.; Sidik, N.A.; Kasaeian, A.; Ghaderian, S.; Okhovat, A.; Pakzadeh, A.; Samion, S.; Yahya, W.J. Performance of copper oxide/distilled water nanofluid in evacuated tube solar collector (ETSC) water heater with internal coil under thermosyphon system circulations. Appl. Therm. Eng. 2017, 121, 520–536. [Google Scholar] [CrossRef]
Figure 1. Nano-cellulose preparation process from waste cotton.
Energies 15 02309 g001
Figure 2. Graphene nanofluids preparation process.
Energies 15 02309 g002
Figure 3. CNC nanofluids preparation process.
Energies 15 02309 g003
Figure 4. Hybrid nanofluids preparation process from CNC and graphene nanofluids.
Energies 15 02309 g004
Figure 5. Experimental presentation of CNC and graphene hybrid nanofluids preparation.
Energies 15 02309 g005
Figure 6. Arrangement of FPSC under solar radiation.
Energies 15 02309 g006
Figure 7. The developed experimental arrangement used in this study.
Energies 15 02309 g007
Figure 8. Entire process flow chart of the experiment.
Energies 15 02309 g008
Figure 9. Image of the nano wavelength distribution of (Graphene+CNC) hybrid nanofluids.
Energies 15 02309 g009
Figure 10. Schematic presentation of the nano wavelength distribution of (CNC and graphene) nanofluids.
Energies 15 02309 g010
Figure 11. Variation of error of dynamic viscosity of experimental and ASHRAE Standard data of base fluid.
Energies 15 02309 g011
Figure 12. Viscosity (Cp) of graphene, CNC, Graphene+CNC nanofluids, and hybrid nanofluid concerning temperature.
Energies 15 02309 g012
Figure 13. Graphene, CNC, and hybrid nanofluid thermal conductivity at a range of temperatures.
Energies 15 02309 g013
Figure 14. Graphical presentation of error difference of thermal conductivity of experimental and ASHRAE Standard data of base fluid.
Energies 15 02309 g014
Figure 15. Assessment of the temperature correlated specific heat of the nanofluids graphene, CNC, and (hybrid graphene+CNC).
Energies 15 02309 g015
Figure 16. Density error of base fluid (experimental and ASHRAE Standard data).
Energies 15 02309 g016
Figure 17. Nanofluids and hybrid nanofluids density measurement at varying temperatures (graphene, CNC, and hybrid (graphene+CNC)).
Energies 15 02309 g017
Figure 18. A pH of different concentrations of graphene, CNC nanofluids, and hybrid nanofluids.
Energies 15 02309 g018
Figure 19. Improvement in the efficiency of flat plate solar collector.
Energies 15 02309 g019
Table 1. Description of the experiment.
Serial. noName of the ApparatusCharacteristicsNumber of Apparatus
1FrameWoodenOne
2TubesCopper; outer diameter 12.7 mm; inner diameter 12.5 mm; length 1 m Ten
3ThermocouplesSensing element: Coiled bimetallicThree
4Pump (Dolphin PA500)Electrical submersible filterOne
5BucketPlasticOne
Table 2. Experimental data of flat plate solar collector where solar irradiation is 830 W/m2.
ParametersCp (J/kg-k) m ˙ (Kg/s) Tout °CTin °CEfficiency %
Base fluid2700 at 30 °C 0.010641.340.14.2
0.3% Graphene3750 at 30 °C 42.794013.7
0.5% Graphene3680 at 30 °C 40.7238.3611.37
0.3% CNC2740 at 30 °C 41.8437.1716.76
0.5% CNC2530 at 30 °C 40.1737.179.94
0.3% (CNC+graphene3100 at 30 °C 42.3439.1712.87
0.5% (CNC+graphene)3180 at 30 °C 42.9239.1715.62
Base fluid2630 at 40 °C 41.340.14.13
0.3% Graphene3760 at 40 °C 42.794013.74
0.5% Graphene3710 at 40 °C 40.7238.3611.47
0.3% CNC2730 at 40 °C 41.8437.1716.7
0.5% CNC2490 at 40 °C 40.1737.179.78
0.3% (CNC+graphene)3120 at 40 °C 42.3439.1712.95
0.5% (CNC+graphene)3180 at 40 °C 42.9239.1715.62
Base fluid2640 at 50 °C 41.340.14.15
0.3% Graphene3780 at 50 °C 42.794013.81
0.5% Graphene3820 at 50 °C 40.7238.3611.81
0.3% CNC2740 at 50 °C 41.8437.1716.76
0.5% CNC2780 at 50 °C 40.1737.179.74
0.3% (CNC+graphene)3130 at 50 °C 42.3439.1712.99
0.5% (CNC+graphene)3190 at 50 °C 42.9239.1715.66
Base fluid2580 at 70 °C 41.340.14.05
0.3% Graphene3920 at 70 °C 42.794014.32
0.5% Graphene3860 at 70 °C 40.7238.3611.93
0.3% CNC2750 at 70 °C 41.8437.1716.82
0.5% CNC2540 at 70 °C 40.1737.179.98
0.3% (CNC+graphene)3150 at 70 °C 42.3439.1713.08
0.5% (CNC+graphene)3210 at 70 °C 42.9239.1715.76
Base fluid2250 at 80 °C 41.340.14.007
0.3% Graphene3950 at 80 °C 42.794014.43
0.5% Graphene3880 at 80 °C 40.7238.3611.99
0.3% CNC2760 at 80 °C 41.8437.1716.88
0.5% CNC2560 at 80 °C 40.1737.1710.06
0.3% (CNC+graphene)3160 at 80 °C 42.3439.1713.12
0.5% (CNC+graphene)3230 at 80 °C 42.9239.1715.86
Table 3. Experimental thermo-physical properties of nanofluid and hybrid nanofluids.
ParametersTemperature °CThermal Conductivity Wm−1·K−1Viscosity (Cp)Specific Heat (J/g-k)Density (g/m3)
Base fluid300.40622.71.0505
400.4291.42.631.0493
500.4411.32.641.039
700.4491.12.581.0217
800.4581.052.551.0118
0.3% CNC300.4432.742.741.0512
400.482.732.731.0403
500.4412.742.741.0391
700.4912.752.751.0251
800.5612.762.761.0158
0.5% CNC300.692.532.531.0508
400.712.492.491.0418
500.722.482.481.0394
700.732.542.541.0253
800.762.562.561.0135
0.3% graphene300.712.43.751.0512
400.721.73.761.0502
500.731.53.781.0494
700.751.33.921.0384
800.771.23.951.0238
0.5% graphene300.722.73.681.0554
400.762.33.711.0503
500.771.53.821.0495
700.771.33.861.0389
800.771.13.881.0245
0.3% hybrid (CNC+graphene)300.743.13.11.0554
400.753.123.121.0511
500.753.133.131.0499
700.843.153.151.0386
800.863.163.161.0268
0.5% hybrid (CNC+graphene)300.753.183.181.0558
400.793.183.181.0532
500.813.193.191.0492
700.863.213.211.0401
800.893.233.231.0312
Table 4. Comparison of efficiency with previous studies.
NanofluidsEfficiency (%) Comparison
Experimental ResultsFarhana, Kadirgama, Mohammed, Ramasamy, Samykano and Saidur [7]Meibodi, Kianifar, Niazmand, Mahian and Wongwises [87]
CNC/water-EG16.888.46-
SiO2/water-EG--8
Al2O3/water-EG-2.48-
Graphene/water-EG11.99--
Hybrid/water-EG15.86--
Publisher’s Note: MDPI stays neutral with regard to jurisdictional claims in published maps and institutional affiliations.