
Experimental Analysis of Clearance Leakage Characteristics at Blade Edge Plates of a Gas Turbine Engine


1
School of Power and Energy, Northwestern Polytechnical University, Xi’an 710129, China
2
Shaanxi Key Laboratory of Thermal Science in Aero-Engine System, Northwestern Polytechnical University, Xi’an 710072, China
*
Author to whom correspondence should be addressed.
Energies 2022, 15(7), 2303; https://doi.org/10.3390/en15072303
Submission received: 27 January 2022
/
Revised: 15 March 2022
/
Accepted: 18 March 2022
/
Published: 22 March 2022
Abstract
:The loss of cold air from the blade edge plates of the turbine has a negative impact on engine performance and safety. Using an experimental method, this paper investigates the effect of geometric and aerodynamic parameters on cold air leakage through pressure and mass flow measurements. Based on the results, it can be concluded that, with a change in sheet spacing, the proportion of bypass leakage and clearance leakage changes. At the same sheet spacing, the edge plate clearance is increased from 1 mm to 1.1 mm, resulting in a 30% increase of total leakage and a 25.7% increase of leakage equivalent mass flow. The edge plate clearance was increased from 1.1 mm to 1.2 mm, the total leakage increased by 19.2%, and the equivalent mass flow of leakage was 19%. The proportion of clearance leakage in the total leakage increased gradually for a given edge plate clearance. When the sheet spacing was 1 mm, bypass leakage accounted for 68% of the total leakage and was the primary source of leakage. The clearance leakage accounted for 83% of the total leakage with a plate spacing of 10 mm. When the sheet spacing is small, bypass leakage dominates; when it is large, clearance leakage dominates. The variation law of leakage with pressure, structural parameters and the ratio of sheet spacing to sealing slot length play an important role in the design of sealing structures.
1. Introduction
Advanced sealing technology influences engine performance and is a crucial link to meeting the thrust-to-weight ratio, fuel consumption, durability and life of aero engines [1,2]. In the future, 50% of the performance improvement potential of aero engines will depend on the improvement of sealing technology and the reduction in leakage [3]. It can be seen that sealing technology is one of the breakthrough directions that can significantly improve the performance of the engine [4,5,6].
Sealing technology can be divided into dynamic sealing and static sealing. Dynamic seals are used to seal the tips of compressor blades or turbine blades [7]. Dynamic sealing mainly includes grate sealing, graphite sealing, brushing type sealing, fingertip sealing, end face sealing, and other sealing technologies. Zhang et al. [8] used the quasi-labyrinth seal technology to control the surface flow of the scraper and analyzed the influence of the surface leakage on the aero-thermal performance of the end wall and the cooling of the suction side surface model for the blade. Yue et al. [9] studied the influence of the brush seal structure on the sealing performance. Wang et al. [10,11] proposed an anisotropic porous media model for fingertip seal leakage analysis. Li et al. [12] experimentally analyzed fingertip seals’ leakage and wear characteristics in cold and hot conditions. Nayak et al. [13,14] used numerical simulation methods to study the effects of stepped labyrinth seal leakage, swirl development and wind resistance temperature rises and analyzed the rotation effect of smooth honeycomb cells and honeycomb cells under different sealing clearances and speeds. Meffert et al. [15] conducted an experimental study on the static and dynamic deformation of the radial shaft seal, thereby expanding the understanding of the performance of the seal ring under different static and dynamic position deviations. Dong et al. [16] designed and established a new type of steam turbine bite ring engineering sealing and corresponding experimental bench, and based on the k-ω SST turbulence model, numerically studied and experimentally verified the leakage characteristics of the rim seal. Chougule et al. [17] proposed an improved scheme for the labyrinth seal with variable teeth and high straight teeth. Vinogradov et al. [18] proposed a radial end face contact seal design method for the deformation of aero-engine supporting elements under different working conditions. Andres et al. [19] introduced an improved gas sealing rotor dynamic performance experimental device and showed the five-tooth gas seal leakage and cavity pressure measurement results. In order to improve the sealing performance, Zhang et al. [20] proposed a hybrid labyrinth seal with two specially designed side teeth installed on the staggered labyrinth seal. Jia et al. [21] proposed a new type of T-labyrinth seal to reduce the excitation force caused by the flow in the seal area, thereby reducing the vibration of the aero-engine rotor. Wang et al. [22] numerically investigated the influence of four types of pre-swirls on the leakage, flow field, and fluid-induced force of a rotary straight-through labyrinth gas seal (RSTLGS) using the proposed steady computational fluid dynamics (CFD) method based on the three-dimensional models of the RSTLGS. Qiao et al. [23] used a computational fluid dynamics (CFD) model to consider the labyrinth seal leakage channels (two shoulder seals, one interstage sealing, and one balanced piston seal) and the flow characteristics of the second stage after the four-stage centrifugal compressor. Gaowen Liu et al. [24,25,26] studied the influence of the pressure ratio and Reynolds number on the flow characteristics of the compressor interstage grate seal. Sun et al. [27] studied the calculation model of the air network of the compressor interstage grate sealed air network under a swirling flow and wind resistance temperature rise. Many scholars have also conducted research on the sealing and leakage characteristics resulting from heat distribution and overall structure.
In the engine, static sealing is mostly used at the interface of static components (combustion chambers, nozzles, edge plates, fairings, etc.) to reduce leakage. For static sealing components, it is necessary to consider less wear and higher sealing effect during their lifetime in the presence of vibration. In addition, a certain margin should be reserved for thermal expansion and dislocation in the design. Effective sealing of these static interfaces can not only improve the efficiency and output power of the engine but also ensure the temperature distribution of the main intermediate stage turbine flow channels. At present, the research direction of most scholars lies in the leakage characteristics of different dynamic sealing structures, W sealing rings, elastic combined sealing, and other static sealing structures. However, few researchers have studied the leakage characteristics of static sealing structures, especially sealing sheet structures. Sealing sheets, also known as edge plate sealing and slot sealing, are a common static sealing technique. Research on sealing sheets structures focuses primarily on flow stability and the thermodynamics and aerodynamics of sealing fluids. Deng et al. [28] analyzed the influence of pressure fluctuations in the compressor or combustion chamber on the stable leakage characteristics of the sealing sheets. The aerodynamic and thermodynamic performances are of importance for engine safety operation [29,30,31]. Zhang et al. [32] revealed the influence of sealed airflow on the turbine’s flow field structure and aerodynamic performance. Especially, the thermal problem of high temperature is always a hot topic of engine research [33,34,35]. Joachimiak et al. [36] discussed the thermodynamic phenomena of gas flow in the sealing sheets. They analyzed it under irreversible adiabatic conditions and proposed a total enthalpy balance equation. However, there are few studies on the leakage characteristics of the turbine blade edge plate clearance. Although Zhou et al. [37,38] analyzed the leakage characteristics of the edge plate sealing of the turbine blade through experiments, he only obtained the influence of different displacements and edge plate clearance of the single-piece sealing plate on its leakage characteristics.
Due to the structural complexity of the sealing slot and the turbine blade edge plate, sealing sheets can be segmented or overlapped to facilitate assembly. This is more than a single sealing sheet. The current research on the leakage characteristics of the sealing sheet structure is limited to the leakage characteristics of a single sealing sheet. The effect of combined sealing geometry on leakage characteristics of the seal slot has not been studied. Therefore, the influence of the geometric structure of the combined sealing sheet on leakage cannot be determined at present. As a result of the inaccurate estimation of leakage, the economic performance of the whole engine is greatly reduced. In order to quantitatively analyze the influence of the combined sealing sheet on the leakage characteristics of the complex static sealing structure, this paper takes the common turbine edge static sealing structure as the research object and studies the influence of edge plate clearance and sheet spacing on leakage characteristics of the two-piece segmented sealing plate structure. In other words, it is the influence of the edge plate clearance and the sheet spacing on the sealing effect of the turbine blade edge plates. It is of significance to the installation and design of the engine turbine blades.
2. Experimental Object and Method
2.1. Experiment Object
In order to reduce leakage between adjacent turbine blade edge plates, sealing sheets are inserted into the sealing slots in the turbine blade edge plates. The sealing structure is shown in Figure 1. In the assembly process of turbine blades, a certain amount of clearance will inevitably occur between adjacent blade edges, leading to a leakage in the cooling airflow channels. This leaked airflow can mix with high-temperature airflow, which will reduce the thermal efficiency of the engine. Meanwhile, the turbine blades and edge plates are ablated due to the leakage of cooling airflow and the decrease in cooling efficiency. Therefore, it is necessary to be sealed between the turbine blade edge plates. As shown in Figure 1b, if the actual edge plate sealing slot structure is different, it is necessary to install two or more sealing pieces in the sealing slot. Multi-piece sealing sheet structure can reduce leakage caused by edge plate clearance as much as possible. For the turbine blade edge plates, several factors affect its leakage characteristics, including the edge plate clearances, the sealing slot structure, the size of the sealing sheet, and the spacing between the sealing sheets (referred to as the sheet spacing). The pressure ratio on both sides of the turbine blade edge plates also plays a role. Under the different pressure ratios, this paper focuses on the influence of edge plate clearance and sheet spacing on the leakage characteristics of turbine blade edge plates.
2.2. Experimenting Equipment
An experimental system was built to study the effect of edge plate clearance and sheet spacing on the leakage characteristics of the turbine blade edge plates. During the design of the experimental bench, the clearance guarantee, air intake method, experimental section processing and the versatility of the experimental bench are considered, and experiments with different geometrical conditions are realized by replacing the experimental pieces and the clearance adjustment blocks. The experimental system is shown in Figure 2. Specifically, it includes an air supply unit, a pressure regulating system, a flow measurement system, and an experimental section. The air supply system (air source) is mainly composed of a large-volume air storage tank and a cold dryer. The air dryer dehumidifies and dries the airflow to prevent moisture in the airflow from corroding downstream metal pipes and experiment parts. The volume of the air storage tank is 300 m3, which can maintain the stability of the gas pressure. There will be no large fluctuations in pressure during the experiment; the measuring system includes measuring equipment and connecting pipelines for measuring the pressure, temperature and mass flow of the experimental piece, and mass flow is measured by laminar flow meters. The acquisition system captures the signal of the measurement system and sends it in real-time to the computer for display and storage. The adjustment of the inlet pressures is completed by the pressure adjustment system.
Figure 3 is a photo of the experiment bench. The components along the flow direction of the airflow are an electric valve, a flow meter, an inlet section (inlet flange, inlet cavity, rectifying section), an experimental section, and an outlet section. The volume of the intake cavity in the inlet section is designed to be large enough to reduce the incoming stream velocity and stabilize the incoming stream pressure. At the same time, the rectifying section is designed with a Vickers curve, which allows airflow to enter the experimental section smoothly. To facilitate the installation of the outlet flange and the experimental section, the outlet section is designed as a small cavity. Through an inclined plane, it transitions to a large cavity. There are slots on the surface of the inlet and outlet flanges, and sealing gaskets are placed to seal the front and rear ends.
The experiment needs to measure the total pressure at the inlet, the total temperature at the inlet and outlet, and the static pressure at the outlet. After theoretical calculations, the research found that the pressure in the inlet cavity is relatively uniform, and the difference between the total pressure and the static pressure is slight. Due to the low speed, the total pressure loss from the inlet section to the experimental section is less, and the static pressure is the same as the total pressure.
2.3. The System of Measurement
Different measurement systems are built for the measurement of mass flow, pressure and temperature. The pressure measurement points of the experimental section are measured using the PSI9116 multi-channel pressure scanning valve. The pressure scanning valve has a range of 0~700 kPa and an accuracy of 0.05% FS; the temperature is measured by a PSI9046 multi-channel temperature scanning valve and a NiCr-NiSi thermocouple. The resolution of the temperature scanning valve is 0.06 °C, and the full-scale accuracy is 0.99 °C. The range of the thermocouple is −40~1350 °C, the accuracy is 2.5 °C, and it can be calibrated to 1 °C within the range of 0~100 °C. Two laminar flow meters with different ranges are used together for flow measurement. Its measuring range is 0.0043~5.4 g/s, and the measurement accuracy is 0.6%.
After systematic analysis, the layout of the pressure and temperature measuring points of the experiment bench is shown in Figure 4. During the experiment, the mass flow was so small that the maximum flow velocity did not exceed 1 m/s at the inlet section and outlet section. Therefore, the difference between the total pressure and the static pressure is within 0.01%. The static pressure measurement is more convenient and reliable than the total pressure measurement, so the inlet total pressure measurement is replaced by the static pressure measurement. The measuring points are arranged in the middle of the inlet and take the average pressure of the two symmetrical positions. In addition, because the low flow rate, outlet pressure and atmospheric pressure are so closely related, their differential pressure can be ignored. Thus, the outlet pressure can be atmospheric pressure, and the outlet pressure monitoring points are located in the middle of the outlet cavity. The measuring points of the inlet temperature and outlet temperature are arranged on the inlet and outlet chambers.
2.4. Experimental Components, Parameter Definitions and Experimental Conditions
In this paper, the two-piece segmented sealing structure was investigated. Thence, as shown in Figure 5 and Figure 6, the geometric parameters mainly include the edge plate clearance a and the sheet spacing c. Several sets of adjustment blocks of different thicknesses are processed to achieve the different edge plate clearances. As the sealing slot length L is fixed, the sheet spacing can be altered by changing the different sealing sheets.
(1) Edge plate clearance a (mm): The edge plate clearance is the circumferential distance between the two turbine blade edge plates, as shown in Figure 4.
(2) Sheet spacing c (mm) (as shown in Figure 6): Due to the assembly process, the inevitable existence of spacing leads to using multi-piece segmented sealing sheets in turbine blade edge plates. Thus, two-piece segmented sealing sheets are used. The sheet spacing c is the installation spacing between the two-piece sealing sheets.
(3) Leakage (g/s): Generally, the leakage of the sealing structure of the turbine blade edge plates can be classified into two types: bypass leakage mc and clearance leakage mr. The total leakage m is the sum of both leakages. As shown in Figure 5, the use of multi-piece segmented or multi-piece overlapped sealing sheets will inevitably result in spacing on the sealing sheets, causing clearance leakage mr. For the turbine blade edge plates sealing structure, clearance leakage is the leakage mass flow through the sheet spacing. Additionally, as shown in Figure 7, the bypass leakage mc is caused by the clearance between the sealing sheet and the sealing slot. Due to the surface roughness, there is a certain clearance between the height of the sealing sheet and the width of the actual sealing slot. Moreso, bypass leakage refers to the mass flow of circumference leakage through the clearance between the sealing sheets and on one side of the sealing slot. In this investigation, a single-piece sealing sheet is used to measure the bypass leakage. Its length was consistent with the length of the sealing slot, while the other structural parameters were in agreement with the two-piece sealing sheet.
(4) Leakage length proportion Y:
In edge plate sealing, the proportion of the sheet spacing c to the total sealing slot length L is called the leakage length proportion Y. The total sealing slot length L is equal to the sum of the lengths of the two sealing sheets and the sheet spacing (as shown in Figure 5). The length of the sealing groove will differ in the actual engine. Therefore, in the actual engine air system design, according to the relationship between leakage length ratio Y and leakage in the experimental results, the leakage range under the different pressure ratios can also be calculated for the same leakage length ratio Y.
(5) Inlet and outlet pressure ratio π:
The pressure ratio is the ratio of the inlet total pressure to the outlet static pressure of the sealing structure. The outlet pressure is atmospheric pressure. Variation in pressure ratio is achieved by changing the inlet total pressure.
(6) Ideal mass flow mideal (kg/s):
For air, the critical pressure ratio is 1.892. The airflow is blocked at the critical pressure ratio. After that, as the pressure ratio continues to increase, the airflow is blocked, and the pressure ratio is fixed at 1.892.
(7) Equivalent mass flow G:
where m is the mass flow rate, the unit is g/s; is the inlet total temperature, where the unit is K; is the inlet total pressure, where the unit is Pa.
The specific experimental conditions are shown in Table 1.
2.5. Experimentation Method
In order to study the leakage characteristics, it is necessary to set up and test the experimental bench. The experimental bench and the experimental parts are sealed carefully, and the measurement instrument is calibrated. The experimental parts are installed, and the possible leakage points are sealed at non-research sites. The sealant is applied on both ends of the sealing slot, and the sealing sheet is inserted. In order to verify airtightness, the changes in pressure over time were measured. Leakage at non-research sites, such as inlet and outlet sections of the experimental bench, pipeline valves, etc., was also measured. Under the given edge plate clearance, the outlet pressure is fixed to atmospheric pressure by changing the inlet’s total pressure. Pressure ratios range from 1.1 to 3.5 as a result of the changes. In order to ensure the reliability of the experimental data, a repeatability experiment with a reverse stroke pressure ratio of 3.5–1.1 was carried out. Under each pressure ratio, the measurement and collection of experimental data are carried out. By adjusting the sheet spacing and repeating the above experiment steps, the leakage characteristic curves are obtained under different geometric conditions.
2.6. Error Analysis
Equivalent mass flow measurement on the turbine blade edge plates can be obtained from Equation (4).
It can be derived by
Substituting, by , and into the above formula, we obtain:
3. Results and Analysis
3.1. Effect of Pressure Ratio on Total Leakage at Various Edge Plate Clearances
The relationship between the total leakage against the pressure ratio under different edge plate clearances is investigated. The leakage characteristics at different edge plate clearances are obtained. The total leakage is measured by the two-piece segmented sealing sheet (as shown in Figure 5). This paper focuses on the leakage characteristics of two-piece segmented sealing sheets. Experiments can determine the total leakage and the bypass leakage, but they cannot determine the clearance leakage. Thus, the total leakage can be determined first, and then by subtracting the bypass leakage from the total leakage, we can obtain the clearance leakage indirectly. Bypass leakage cannot be measured in a two-piece segmented sealing structure directly, rather than in a single-piece sealing structure directly. Thus, its method of measurement is as follows: when the single-piece sealing sheet and two-piece sealing sheet are subjected to the same inlet conditions and pressure ratio, the measured bypass leakage should also be the same. From this, the bypass leakage of the two-piece sealing sheet structure can be obtained. In practice, in the case of the same sheet spacing, the total length of the sealing slot in the actual engine will differ. Thus, leakage per unit length is desirable.
As the edge plate clearance changes, the trends of leakage against the pressure ratio are essentially the same, no matter how sheet spacing changes. Therefore, Section 3.1 only shows the experimental results when the sheet spacing is c = 1 mm. Figure 8a shows curves of the total leakage experimental results under different edge plate clearances. It can be seen that as the pressure ratio increases, the total leakage also increases. The total leakage changes linearly with the pressure ratio when the pressure ratio is greater than 2. This is because the critical state is reached at a pressure ratio of 2. Accordingly, it can be seen from Equation (3) that the total leakage change is only related to inlet pressure because of the constant temperature during the experiments. Figure 8b shows that the equivalent mass flow of total leakage varies with the pressure ratio. Nevertheless, the increased rate of equivalent mass flow is faster at low-pressure ratios, and it tends to flatten when the pressure ratio exceeds 2. When the edge plate clearance is increased from 1 mm to 1.1 mm, the total leakage increases by 33%, and the equivalent mass flow of total leakage increases by 32.5%. When the edge plate clearance increases from 1.1 mm to 1.2 mm, the flow rate increases by 16.6%, and the equivalent mass flow of total leakage also increases by 16%. Table 2 shows the range of the total leakage and the critical equivalent mass flow of total the leakage against the pressure ratio under different edge plate clearances.
Additionally, the clearance leakage is also affected by geometric parameters in the two-piece sealing sheet structure. Therefore, this paper further investigates the effects of edge plate clearance and sheet spacing on clearance leakage. Figure 9a shows curves of the clearance leakage experimental results under different edge plate clearances. Similar to Figure 8, it can be seen that as the pressure ratio increases, the total leakage also increases. The total leakage changes linearly with the pressure ratio when the pressure ratio is greater than 2. Figure 9b shows that the equivalent mass flow of clearance leakage varies with the pressure ratio. Nevertheless, the increased rate of equivalent mass flow is faster at low-pressure ratios, and it tends to flatten when the pressure ratio exceeds 2. When the edge plate clearance is increased from 1.1 mm to 1.2 mm, the clearance leakage increases by 19.2% and the equivalent mass flow increases by 19%. Table 3 shows the range of the clearance leakage and the critical equivalent mass flow against the pressure ratio under each edge plate clearance.
3.2. The Influence of Pressure Ratio on Leakage at Various Sheet Spacing
As the sheet spacing changes, the effect of the pressure ratio on leakage is essentially the same no matter how the edge plate clearance changes. Therefore, this paper only presents the experimental results when the edge plate clearance is a = 1.0 mm. Figure 10a,b are the curves of the total leakage and equivalent mass flow of the total leakage under different sheet spacing. As shown in Figure 10a, when the sheet spacing increases, the clearance leakage area also increases, and the total leakage increases. When the pressure ratio is 3.5, the total leakage increases by 127% as the sheet spacing increases from 1 mm to 4 mm; when the sheet spacing increases from 4 mm to 7 mm, the total leakage only increases by 34%. Table 4 shows the range of the total leakage with the pressure ratio under each plate spacing. It also shows the total leakage per unit length, which is easy to convert to the leakage in the actual engine. It can be seen from Figure 10b that as the pressure ratio increases, the equivalent mass flow first increases. When the pressure ratio increases to about 2, the equivalent mass flow remains unchanged as the pressure ratio increases. Based on Equations (3) and (4), when the pressure ratio reaches a critical state, the equivalent mass flow is only affected by the total inlet temperature and throat area (due to the total temperature being constant during the experiment). In the experiment, the total inlet temperature is unchanged, so when the pressure ratio exceeds the critical pressure ratio, the equivalent mass flow remained unchanged.
Figure 11a,b shows the clearance leakage and equivalent mass flow of the clearance leakage with the pressure ratio. It can be seen from Figure 11a that with the increase of the sheet spacing, the clearance leakage also gradually increases. When the pressure ratio is 3.5, and sheet spacing rises from 1 mm to 4 mm, the clearance leakage is increased by approximately 400%. As the sheet spacing is increased from 4 mm to 7 mm, the clearance leakage is increased by approximately 48%. As the sheet spacing rises from 1 mm to 10 mm, the flow increases by approximately 1185%. That is why the flow resistance coefficient gradually decreases with the increase of the sheet spacing. It can be seen from Figure 11b that as the pressure ratio rises, the equivalent mass flow begins to increase. When the pressure ratio goes up to about 2, the equivalent mass flow remains unchanged, although the pressure ratio has gone up.
Under different sheet spacing, Table 5 shows the range of the clearance leakage with the pressure ratio at the different leakage length proportions Y. Moreover, the range of clearance leakage per unit length (1 mm) is given, which is convenient to convert into the actual engine leakage.
Table 6 shows the critical equivalent mass flow of clearance leakage under different sealing sheet spacing. When the flow reaches a critical state, the equivalent mass flow will remain unchanged after the pressure exceeds the critical pressure ratio of 2–2.5. After that, the clearance leakage under each pressure ratio can be inversely calculated according to the critical equivalent mass flow of clearance leakage.
3.3. Proportion Analysis for Clearance and Bypass Leakage
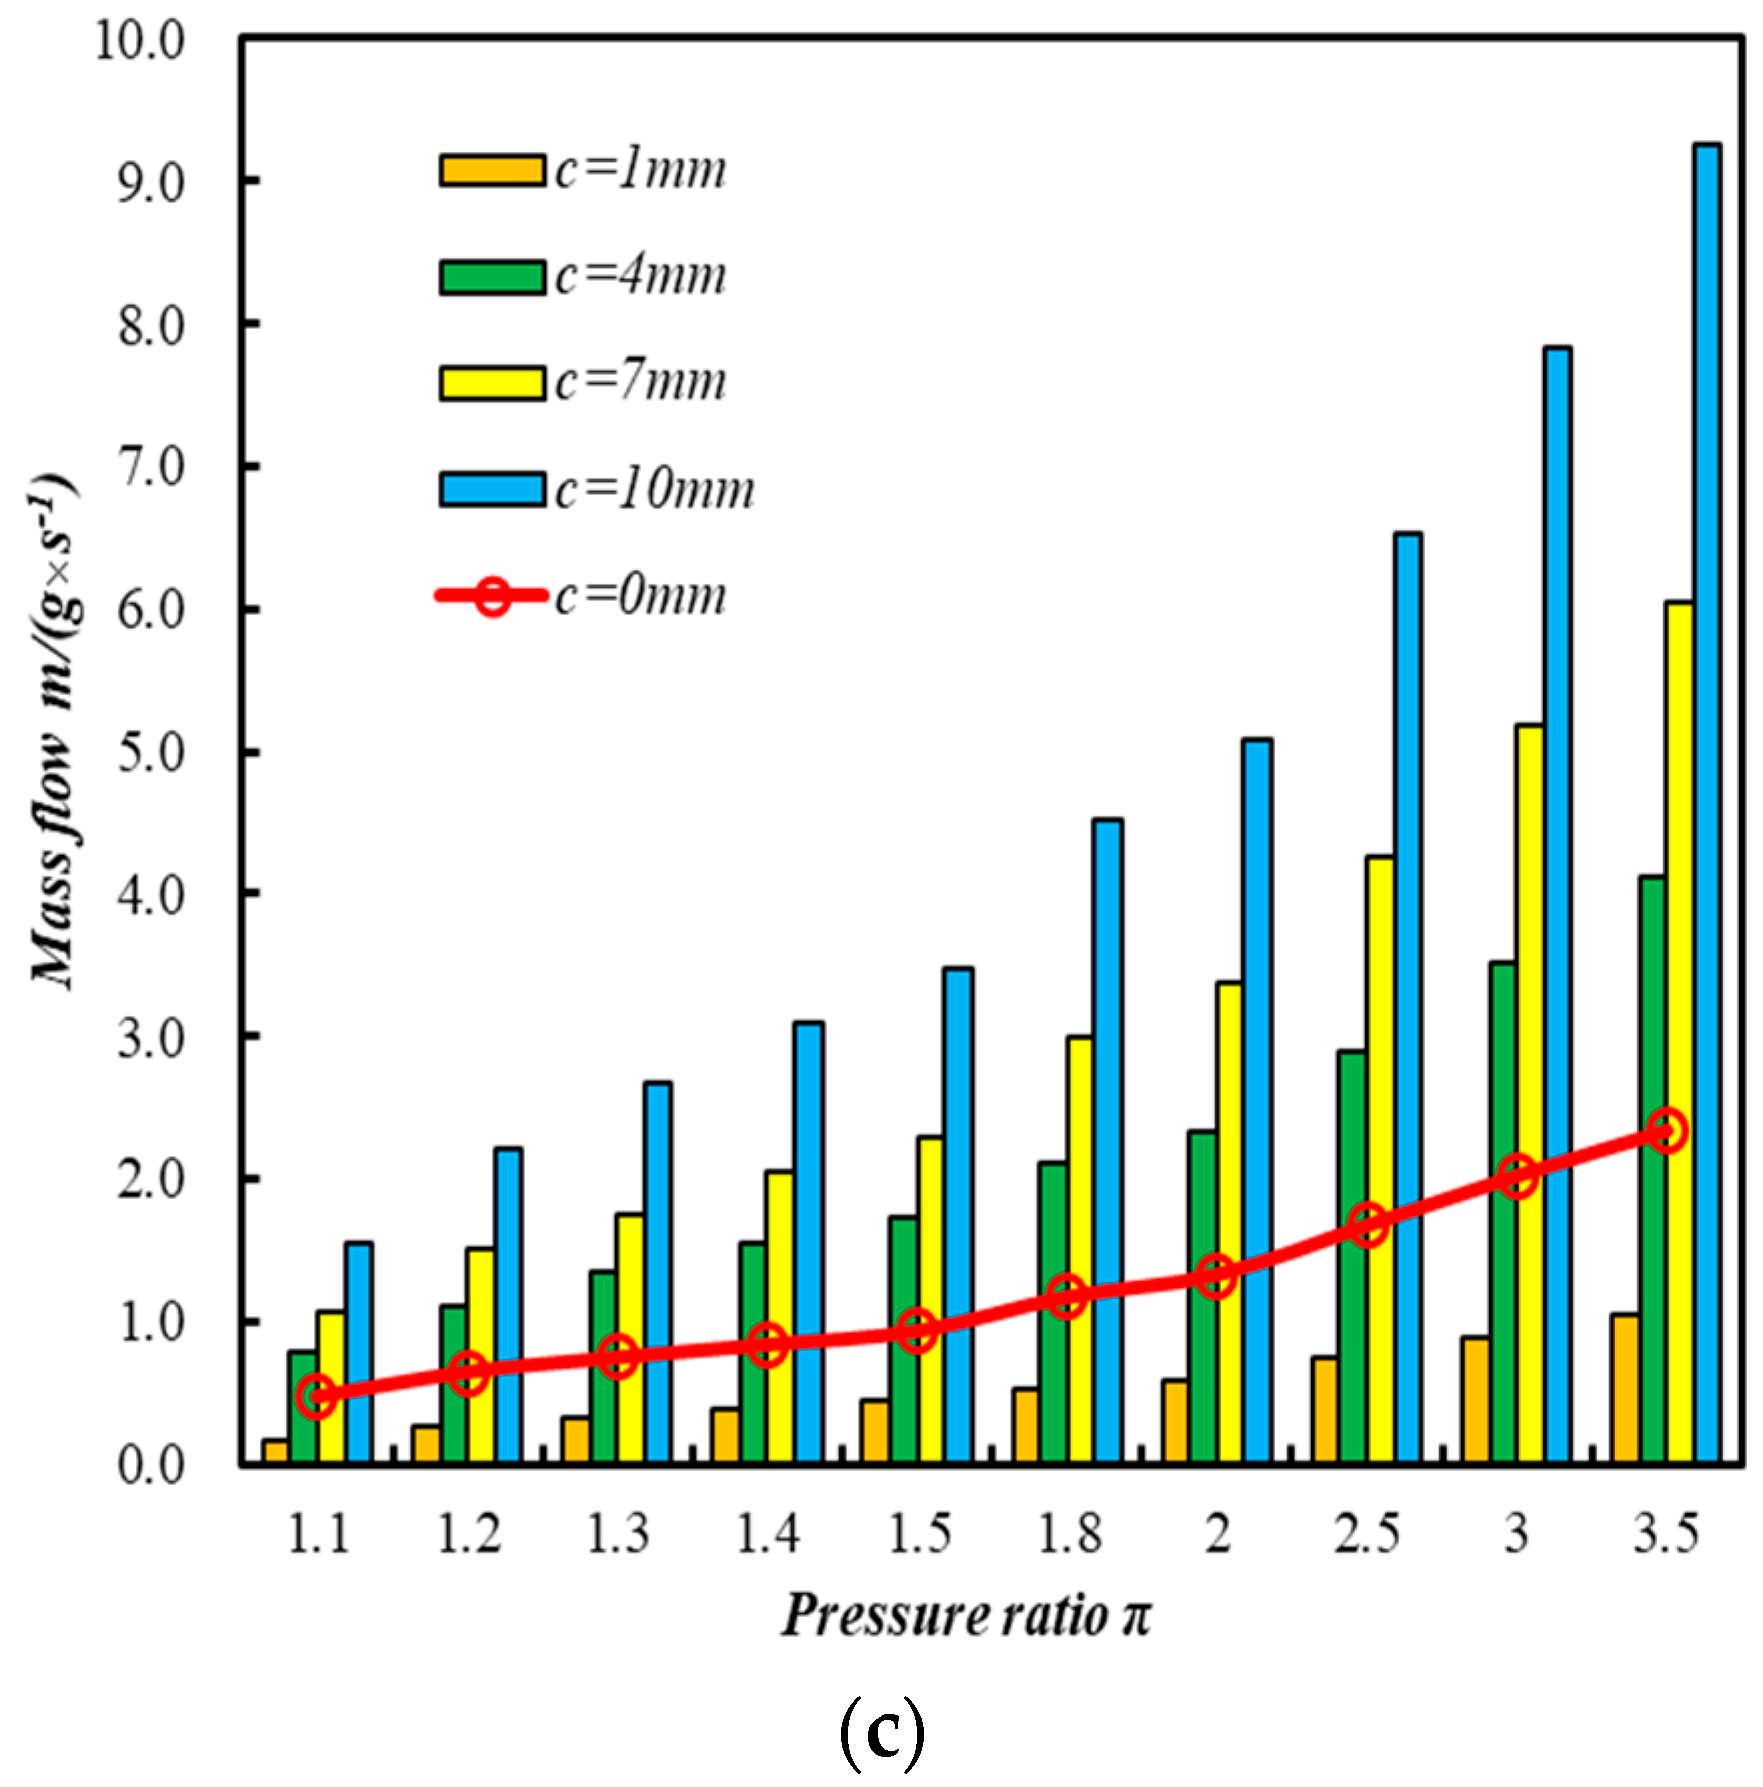
Figure 12 shows the comparison of leakage for bypass and clearance. The red line in the figure (a = 1.0 mm, c = 0 mm) is the bypass leakage. With increasing sheet spacing, the proportion of leakage length Y increases, and the proportion of clearance leakage in the total leakage gradually increases. When the pressure ratio exceeds the critical pressure ratio of 2.0, the equivalent mass flow will not change. When the sheet spacing is 1 mm, the bypass leakage is twice the clearance leakage. Bypass leakage accounts for 68% of the total leakage and is the main source. However, with the increase of sheet spacing, the proportion of clearance leakage gradually increases. When the sheet spacing is 10 mm, the proportion of clearance leakage has reached 83%, which has become the primary source of leakage.
3.4. Analysis of Flow Mechanisms
According to the experimental results, the leakage flow varies with the pressure ratio. The greater the pressure ratio, the greater the leakage and the less efficient the sealing effect.
By thermodynamics theory [39], airflows in the sealing structure are similar to the adiabatic flow of the nozzle. Ignoring dissipative effects during the experiment, the total enthalpy of the airflow at any site along the flow direction remains unchanged. The pressure ratio can be obtained by:
where Ma is Mach number; k isentropic exponent. According to Equation (7), it can be seen that as the pressure ratio increases, the flow Mach number also increases. Additionally, the airflow is more compressible, which makes it easier for the air to flow through the sealing structure. Therefore, the total leakage increases.
During the adiabatic flow, the critical state is characterized by Ma = 1. Based on Equation (7), the critical pressure ratio is:
Based on Equations (3) and (9), the maximum ideal mass flow can be obtained.
According to the ideal-gas equation of state, we can obtain:
where Rg is the gas constant, the unit is J/(kg∙K). Based on Equations (4) and (10), we obtain:
From Equation (11), the maximum value of the equivalent mass flow is only related to the throat area (A2). Because the throat area remains unchanged, after reaching the critical state, the equivalent mass flow cannot increase any further, and remains unchanged. Due to the energy dissipation in the actual flow process, the critical pressure ratio occurs around 2. The experimental results and theoretical analysis are in agreement regarding the variation law of the equivalent mass flow with pressure ratio.
4. Conclusion
Under the different edge plate clearance and sheet spacing, the experimental investigation and theoretical analysis were carried out on the influence of the leakage characteristics of the turbine blade edge plates, and the following conclusions were derived:
- (a)
- As the pressure ratio increases, the clearance leakage under different turbine edge plate clearances is increased. The increased rate is faster in the low-pressure ratio, however, the increased rate remains unchanged after the pressure ratio exceeds 2. Meanwhile, the equivalent mass flow of clearance leakage rises and then remains unchanged. What is more, a critical state is reached at a pressure ratio of 2. When the edge plate clearance is increased from 1 mm to 1.1 mm, the total leakage is increased by approximately 33%, and the equivalent mass flow is increased by 32.5%. When the edge plate clearance is changed from 1.1 mm to 1.2 mm, the total leakage is increased by 16.6%, and the equivalent mass flow is up by 16%.
- (b)
- Total leakage increases with the pressure ratio at certain edge plate clearances and sheet spacing, and the equivalent mass flow of total leakage initially goes up and then remains constant. Under certain edge plate clearances, the total leakage increases with sheet spacing. At a pressure ratio of 3.5, the total leakage increases by 127% as the sheet spacing increases from 1 mm to 4 mm. The total leakage increases by 34% as the sheet spacing increases from 4 mm to 7 mm.
- (c)
- At a given edge plate clearance, increasing the sheet spacing causes an increase in total leakage. The proportion of clearance leakage in the total leakage also gradually increases. When the sheet spacing is 1 mm, the bypass leakage is twice as much as the clearance leakage. Bypass leakage is the primary source of leakage when there is 1 mm sheet spacing. As the leakage length proportion increases, the proportion of clearance leakage in the total leakage also increases. Moreover, when the leakage length proportion exceeds 1%, the proportion of clearance leakage in the total leakage exceeds 50%. In the case of a 9% leakage length proportion Y, the proportion of clearance leakage exceeds 83%, and clearance leakage becomes the primary source of leakage.
- (d)
- According to the complex structure and leakage path of the sealing slot, leakage is divided into bypass leakage and clearance leakage. Using the analysis method of length ratio, the influence of the geometric characteristics of the combined sealing sheet on the leakage characteristics is experimentally studied. The leakage range and the proportion of bypass leakage and clearance leakage in the total leakage are accurately determined. The experimental results have an extremely crucial role in the optimal design of the structure.
Author Contributions
Conceptualization, Y.C.; methodology, Y.C. and G.L.; software, Y.C. and C.C.; validation, Y.C.; formal analysis, Y.C. and C.C.; investigation, Y.C. and C.C.; writing—original draft preparation, Y.C., C.C. and G.L.; writing—review and editing, Y.C., C.C. and G.L.; supervision, Y.C. and G.L. All authors have read and agreed to the published version of the manuscript.
Funding
This research received no external funding.
Acknowledgments
The authors’ special thanks are addressed to the Laboratory of Rotating Flow and Heat Transfer at Northwestern Polytechnical University.
Conflicts of Interest
The authors declare no conflict of interest.
References
- Hong, S.; Hui, Z.T.; Jie, C.Y. Improvement of Aero-Engine Sealing Technology. Gas Turbine Exp. Res. 2011, 24, 51–55. (In Chinese) [Google Scholar]
- Chen, Y.; Chen, L.; Chu, W. Effect Mechanism and Performance Evaluation of Flange Contact Thermal Resistance in an Aero-engine. Aerospace 2022, 9, 121. [Google Scholar] [CrossRef]
- Fu, L.C.; Ming, D. The Analysis of Aeroengine Structure; The Press of Northwestern Polytechnical University: Xi’an, China, 2006. [Google Scholar]
- Sturgess, G.J. Application of CFD to Gas Turbine Engine Secondary Flow System-The Labyrinth Seal. In Proceedings of the 24th Joint Propulsion Conference, Boston, MA, USA, 11–13 July 1988. [Google Scholar]
- Kong, X.; Liu, Y.; Liu, G.; Birch, D.; Zheng, L. Attempts on the Reduction of Leakage Flow Through the Stator Well in an Axial Compressor. J. Eng. Gas Turbines Power-Trans. ASME 2019, 141, 082501. [Google Scholar] [CrossRef]
- Kong, X.; Liu, G.; Liu, Y.; Zheng, L. Experimental Testing for the Influences of Rotation and Tip Clearance on the Labyrinth Seal in a Compressor Stator Well. Aerosp. Sci. Technol. 2017, 71, 556–567. [Google Scholar] [CrossRef]
- Chen, Y.; Lin, A.; Zhang, H.; Chu, W. Method of Improving Stability of a Highly-Loaded Axial Compressor Stage by Coupling Different Casing Treatments. J. Appl. Fluid Mech. 2022, 15, 645–657. [Google Scholar]
- Zhang, K.Y.; Li, Z.G.; Li, J. Influence of slashface leakage coupled with quasi-labyrinth seal technique on gas turbine endwall aerothermal performance and blade suction side surface phantom cooling. Proc. Inst. Mech. Eng. Part A J. Power Energy 2021, 235, 351–367. [Google Scholar] [CrossRef]
- Yue, C.; Bitian, S.; Lanzhu, Z.Z. Leakage performance predictions of a brush seal based on fluid-solid coupling method. Sci. Prog. 2020, 103. [Google Scholar] [CrossRef] [Green Version]
- Wang, Q.; Hu, Y.P.; Ji, H.H. An anisotropic porous media model for leakage analysis of finger seal. Proc. Inst. Mech. Eng. Part G J. Aerosp. Eng. 2020, 234, 280–292. [Google Scholar] [CrossRef]
- Wang, Q.; Hu, Y.P.; Ji, H.H. Leakage, heat transfer and thermal deformation analysis method for contacting finger seals based on coupled porous media and real structure models. Proc. Inst. Mech. Eng. Part C J. Mech. Eng. Sci. 2020, 234, 2077–2093. [Google Scholar] [CrossRef]
- Li, G.Q.; Zhang, Q.; Lei, G.; Yu, Q.P.; Xu, G.; Zhu, J.Q. Leakage and wear characteristics of finger seal in hot/cold state for aero-engine. Tribol. Int. 2018, 127, 209–218. [Google Scholar]
- Nayak, K.C.; Kandaswamy, N.P.; Faheemulla, S. Leakage and Windage Heating in Stepped Labyrinth Seals. In Proceedings of the ASME Gas Turbine India Conference, Chennai, Tamil Nadu, India, 5–6 December 2019. [Google Scholar]
- Nayak, K.C. Effect of Rotation on Leakage and Windage Heating in Labyrinth Seals with Honeycomb Lands. J. Eng. Gas Turb. Power 2020, 142, 081001. [Google Scholar] [CrossRef]
- Meffert, D.; Thielen, S.; Sauer, B. Influence of static and dynamic position deviations on the leakage of a sealing system with rectangular sealing rings. Res. Eng. 2020, 84, 255–268. [Google Scholar] [CrossRef]
- Dong, W.L.; Wang, S.F.; Li, P.F. Investigations of the leakage characteristic and the sealing effectiveness on turbine bite rim seals. J. Therm. Sci. Technol. 2018, 13, JTST0026. [Google Scholar] [CrossRef] [Green Version]
- Chougule, H.; Naik, A.; Qizar, M. Labyrinth seal with variable height teeth tips for efficient leakage control. In Proceedings of the ASME Gas Turbine India Conference, Chennai, Tamil Nadu, India, 5–6 December 2019. [Google Scholar]
- Vinogradov, A.S.; Sergeeva, T.V. Leakage Account for Radial Face Contact Seal in Aircraft Engine Support. IOP Conf. Ser. Mater. Sci. Eng. 2018, 302, 012003. [Google Scholar] [CrossRef]
- Andres, L.S.; Wu, T.C.; Barajas-Rivera, J.; Zhang, J.X.; Kawashita, R. Leakage and Cavity Pressures in an Interlocking Labyrinth Gas Seal: Measurements Versus Predictions. J. Eng. Gas Turbines Power-Trans. Asme 2019, 141, 101007. [Google Scholar]
- Zhang, M.J.; Yang, J.G.; Xu, W.J.; Xia, Y.L. Leakage and rotordynamic performance of a mixed labyrinth seal compared with that of a staggered labyrinth seal. J. Mech. Sci. Technol. 2017, 31, 2261–2277. [Google Scholar] [CrossRef]
- Jia, X.Y.; Zheng, Q.; Jiang, Y.T.; Zhang, H. Leakage and rotordynamic performance of T type labyrinth seal. Aerosp. Sci. Technol. 2019, 88, 22–31. [Google Scholar] [CrossRef]
- Wang, Q.F.; He, L.D. Effects of Four Types of Pre-swirls on the Leakage, Flow Field, and Fluid-Induced Force of the Rotary Straight-through Labyrinth Gas Seal. Chin. J. Mech. Eng. 2019, 32, 56. [Google Scholar] [CrossRef] [Green Version]
- Qiao, B.; Ju, Y.P.; Zhang, C.H. Numerical Investigation on Labyrinth Seal Leakage Flow and Its Effects on Aerodynamic Performance for a Multistage Centrifugal Compressor. J. Fluid Eng. 2019, 141, 071107. [Google Scholar] [CrossRef]
- Liu, G.; Kan, C.; Tie, G.; Liang, D.H. Influence of Pressure Ratio and Reynolds Number on Flow Characteristics of Labyrinth Seal in Compressor Stator Well. J. Aerosp. Power 2015, 30, 1554–1560. (In Chinese) [Google Scholar]
- Gong, W.; Liu, G.; Wang, J.; Wang, F.; Lin, A.; Wang, Z. Aerodynamic and thermodynamic analysis of an aero-engine pre-swirl system based on structure design and performance improvement. Aerosp. Sci. Technol. 2022, 123, 107466. [Google Scholar] [CrossRef]
- Liu, Y.; Liu, G.; Kong, X.; Wang, Y. Experimental Testing and Numerical Analysis on the Nozzle Effects in Pre-swirl System. AIAA J. Propuls. Power 2018, 34, 1015–1025. [Google Scholar] [CrossRef]
- Sun, K.; Liu, G.W.; Kong, X.Z.; Lei, Z. Network Model for Calculation of Labyrinth Sealin Compressor Stator Well with Swirl Flow and Windage Heating. J. Aerosp. Power 2018, 33, 1354–1362. (In Chinese) [Google Scholar]
- Deng, D.; Braun, M.J.; Hendricks, R.C. Flow Instabilities in Feather Seals Due to Upstream Harmonic Pressure Fluctuations. In Proceedings of the 12th International Symposium on Transport Phenomena and Dynamics of Rotating Machinery, Honolulu, HI, USA, 17–22 February 2008. [Google Scholar]
- Lin, A.; Liu, G.; Chen, Y.; Feng, Q.; Zhang, H. Evaluation and analysis of evaporation cooling on thermodynamic and pressure characteristics of intake air in a precooled turbine engine. Int. J. Hydrogen Energy 2021, 46, 24410–24424. [Google Scholar] [CrossRef]
- Liu, G.; Lei, Z.; Lin, A.; Chen, Y.; Feng, Q. Effect of pre-swirl nozzle closure modes on unsteady flow and heat transfer char-acteristics in a pre-swirl system of aero-engine. Proc. Inst. Mech. Eng. Part G J. Aerosp. Eng. 2021. [Google Scholar] [CrossRef]
- Liu, G.; Wang, X.; Gong, W.; Lin, A. Prediction of the sealing flow effect on the temperature drop characteristics of a pre-swirl system in an aero-engine. Appl. Therm. Eng. 2021, 189, 116717. [Google Scholar] [CrossRef]
- Zhang, W.H.; Zhou, Y.; Zou, Z.P.; Pan, S.N. The Influence of the Inlet Fillet of the Wheel Hub Flange plate on the Aerodynamic Performance of Turbine. J. Eng. Therm. Energy Power 2011, 26, 140–146. [Google Scholar]
- Lin, A.; Liu, G.; Wang, X.; Feng, Q. Comprehensive evaluations on performance and energy consumption of pre-swirl rotor–stator system in gas turbine engines. Energy Convers. Manag. 2021, 244, 114440. [Google Scholar] [CrossRef]
- Liu, G.; Gong, W.; Wu, H.; Pang, L.; Lin, A. Theoretical and experimental evaluation of temperature drop and power consumption in a cover-plate pre-swirl system for gas turbine cooling. Case Stud. Therm. Eng. 2021, 27, 101221. [Google Scholar] [CrossRef]
- Zhang, G.; Wang, X.; Dykas, S.; Aliabadi, M. Reduction entropy generation and condensation by NaCl particle injection in wet steam supersonic nozzle. Int. J. Therm. Sci. 2022, 171, 107207. [Google Scholar] [CrossRef]
- Joachimiak, D.; Krzys’lak, P. A model of gas flow with friction in a slotted seal. Arch. Thermodyn. 2016, 37, 95–108. [Google Scholar] [CrossRef] [Green Version]
- Zhou, G.T. Investigation on Plate Sealing Performance Characteristics of Turbine Blades; Nanjing University of Aeronautics and Astronautics: Nanjing, China, 2014. [Google Scholar]
- Zhou, G.T. Experimental Research on the Influence of Misplacement on Characteristics of Sealing Leakage. In Proceedings of the 8th Power Annual Congress of Chinese Society of Aeronautics and Astronautics, Shenyang, China, 18–19 September 2014. [Google Scholar]
- Feng, Q.; Li, S.W.; Zhang, L. Engineering Thermodynamics, 1st ed.; Northwestern Polytechnical University Press: Xi’an, China, 2006; pp. 224–260. [Google Scholar]
Figure 1.
Schematic diagram of the installation position of the actual turbine blade edge plates. (a) The installation position of the sealing sheet. (b) Section of the installation position for the sealing sheet.
Figure 1.
Schematic diagram of the installation position of the actual turbine blade edge plates. (a) The installation position of the sealing sheet. (b) Section of the installation position for the sealing sheet.
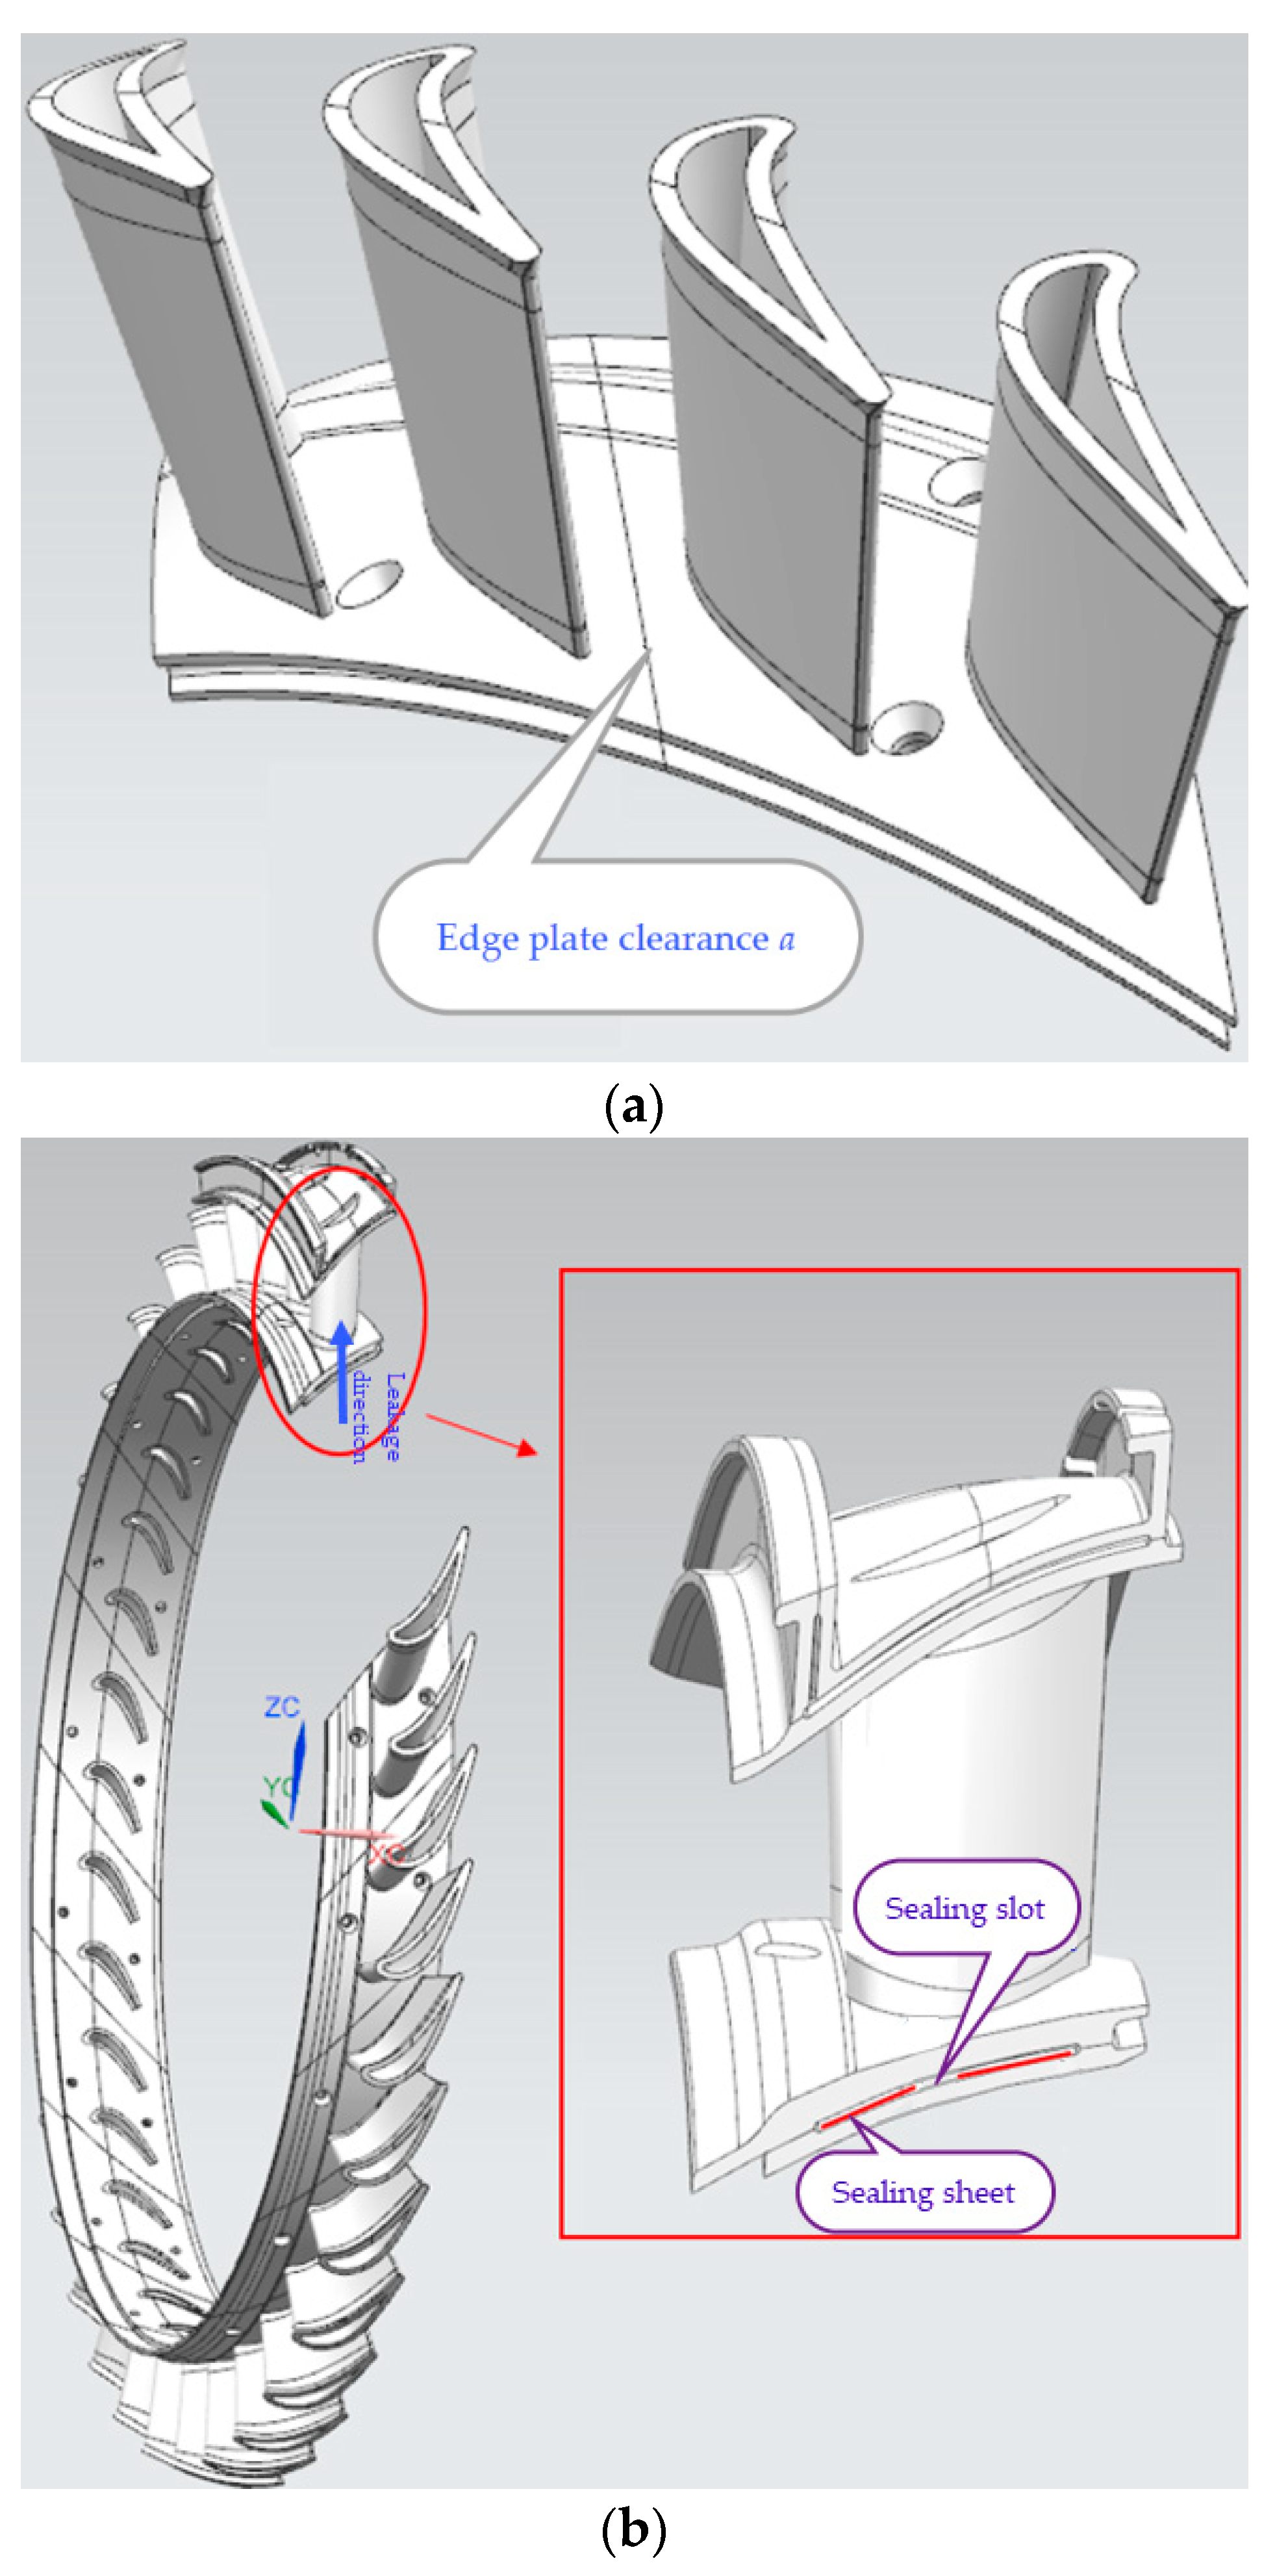
Figure 2.
Schematic of the experimental system.
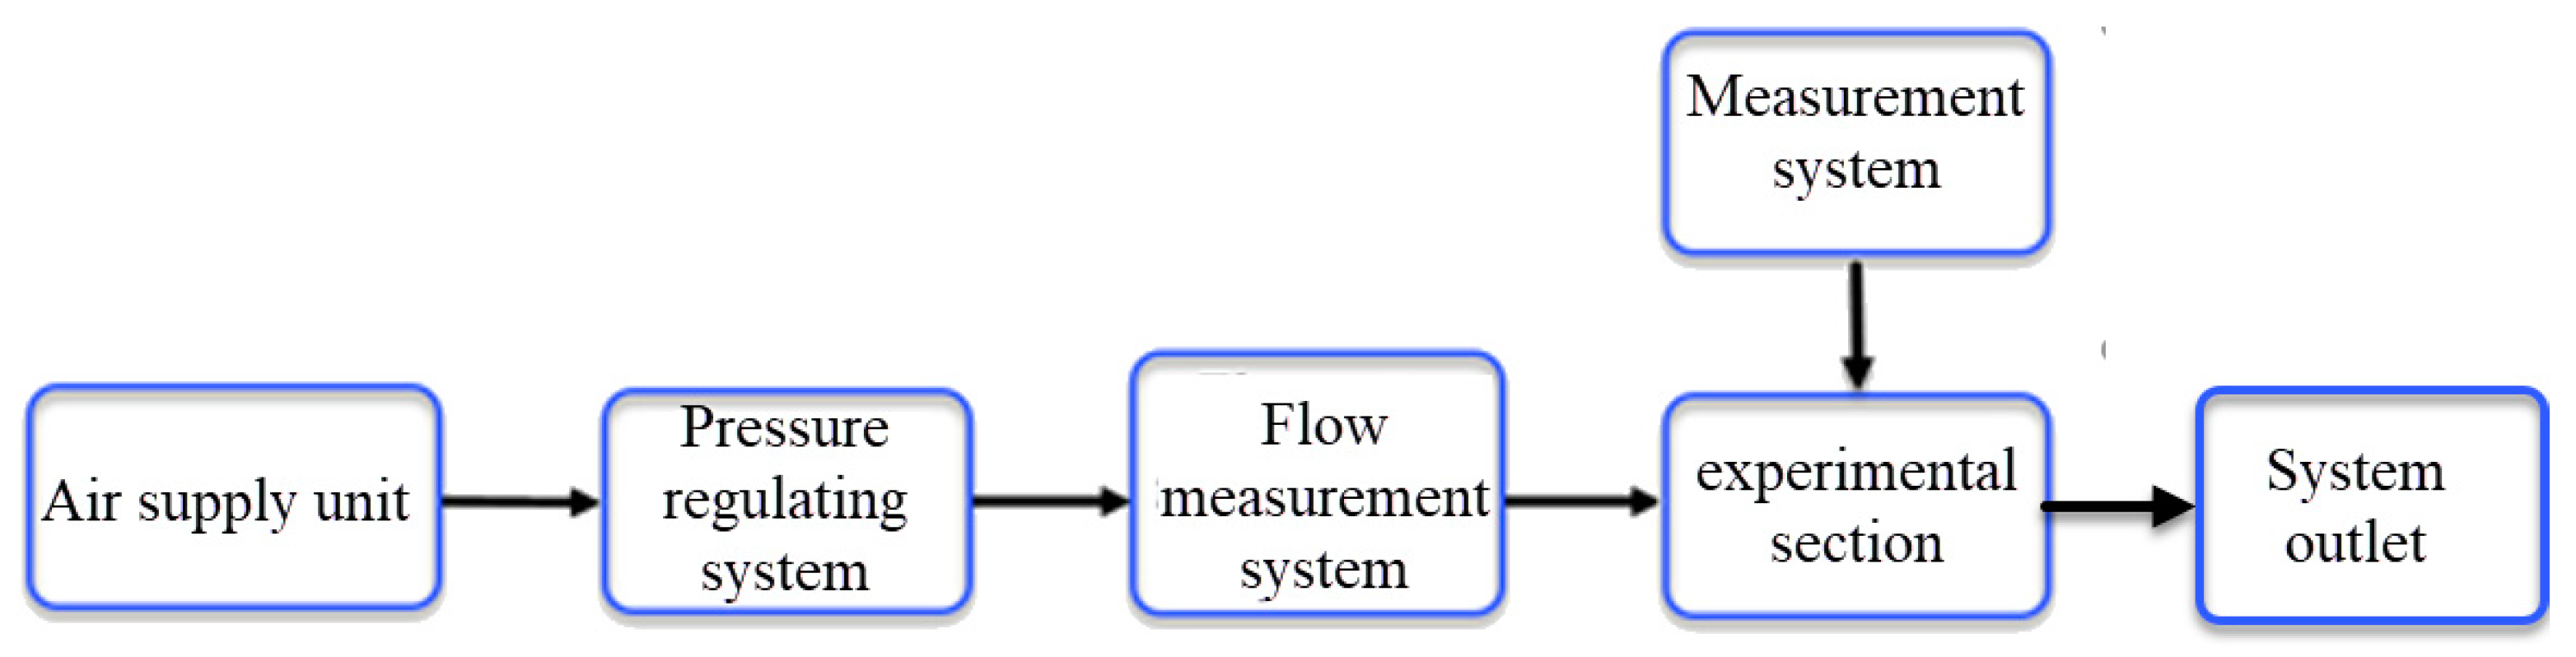
Figure 3.
Structure diagram of the experimental bench.
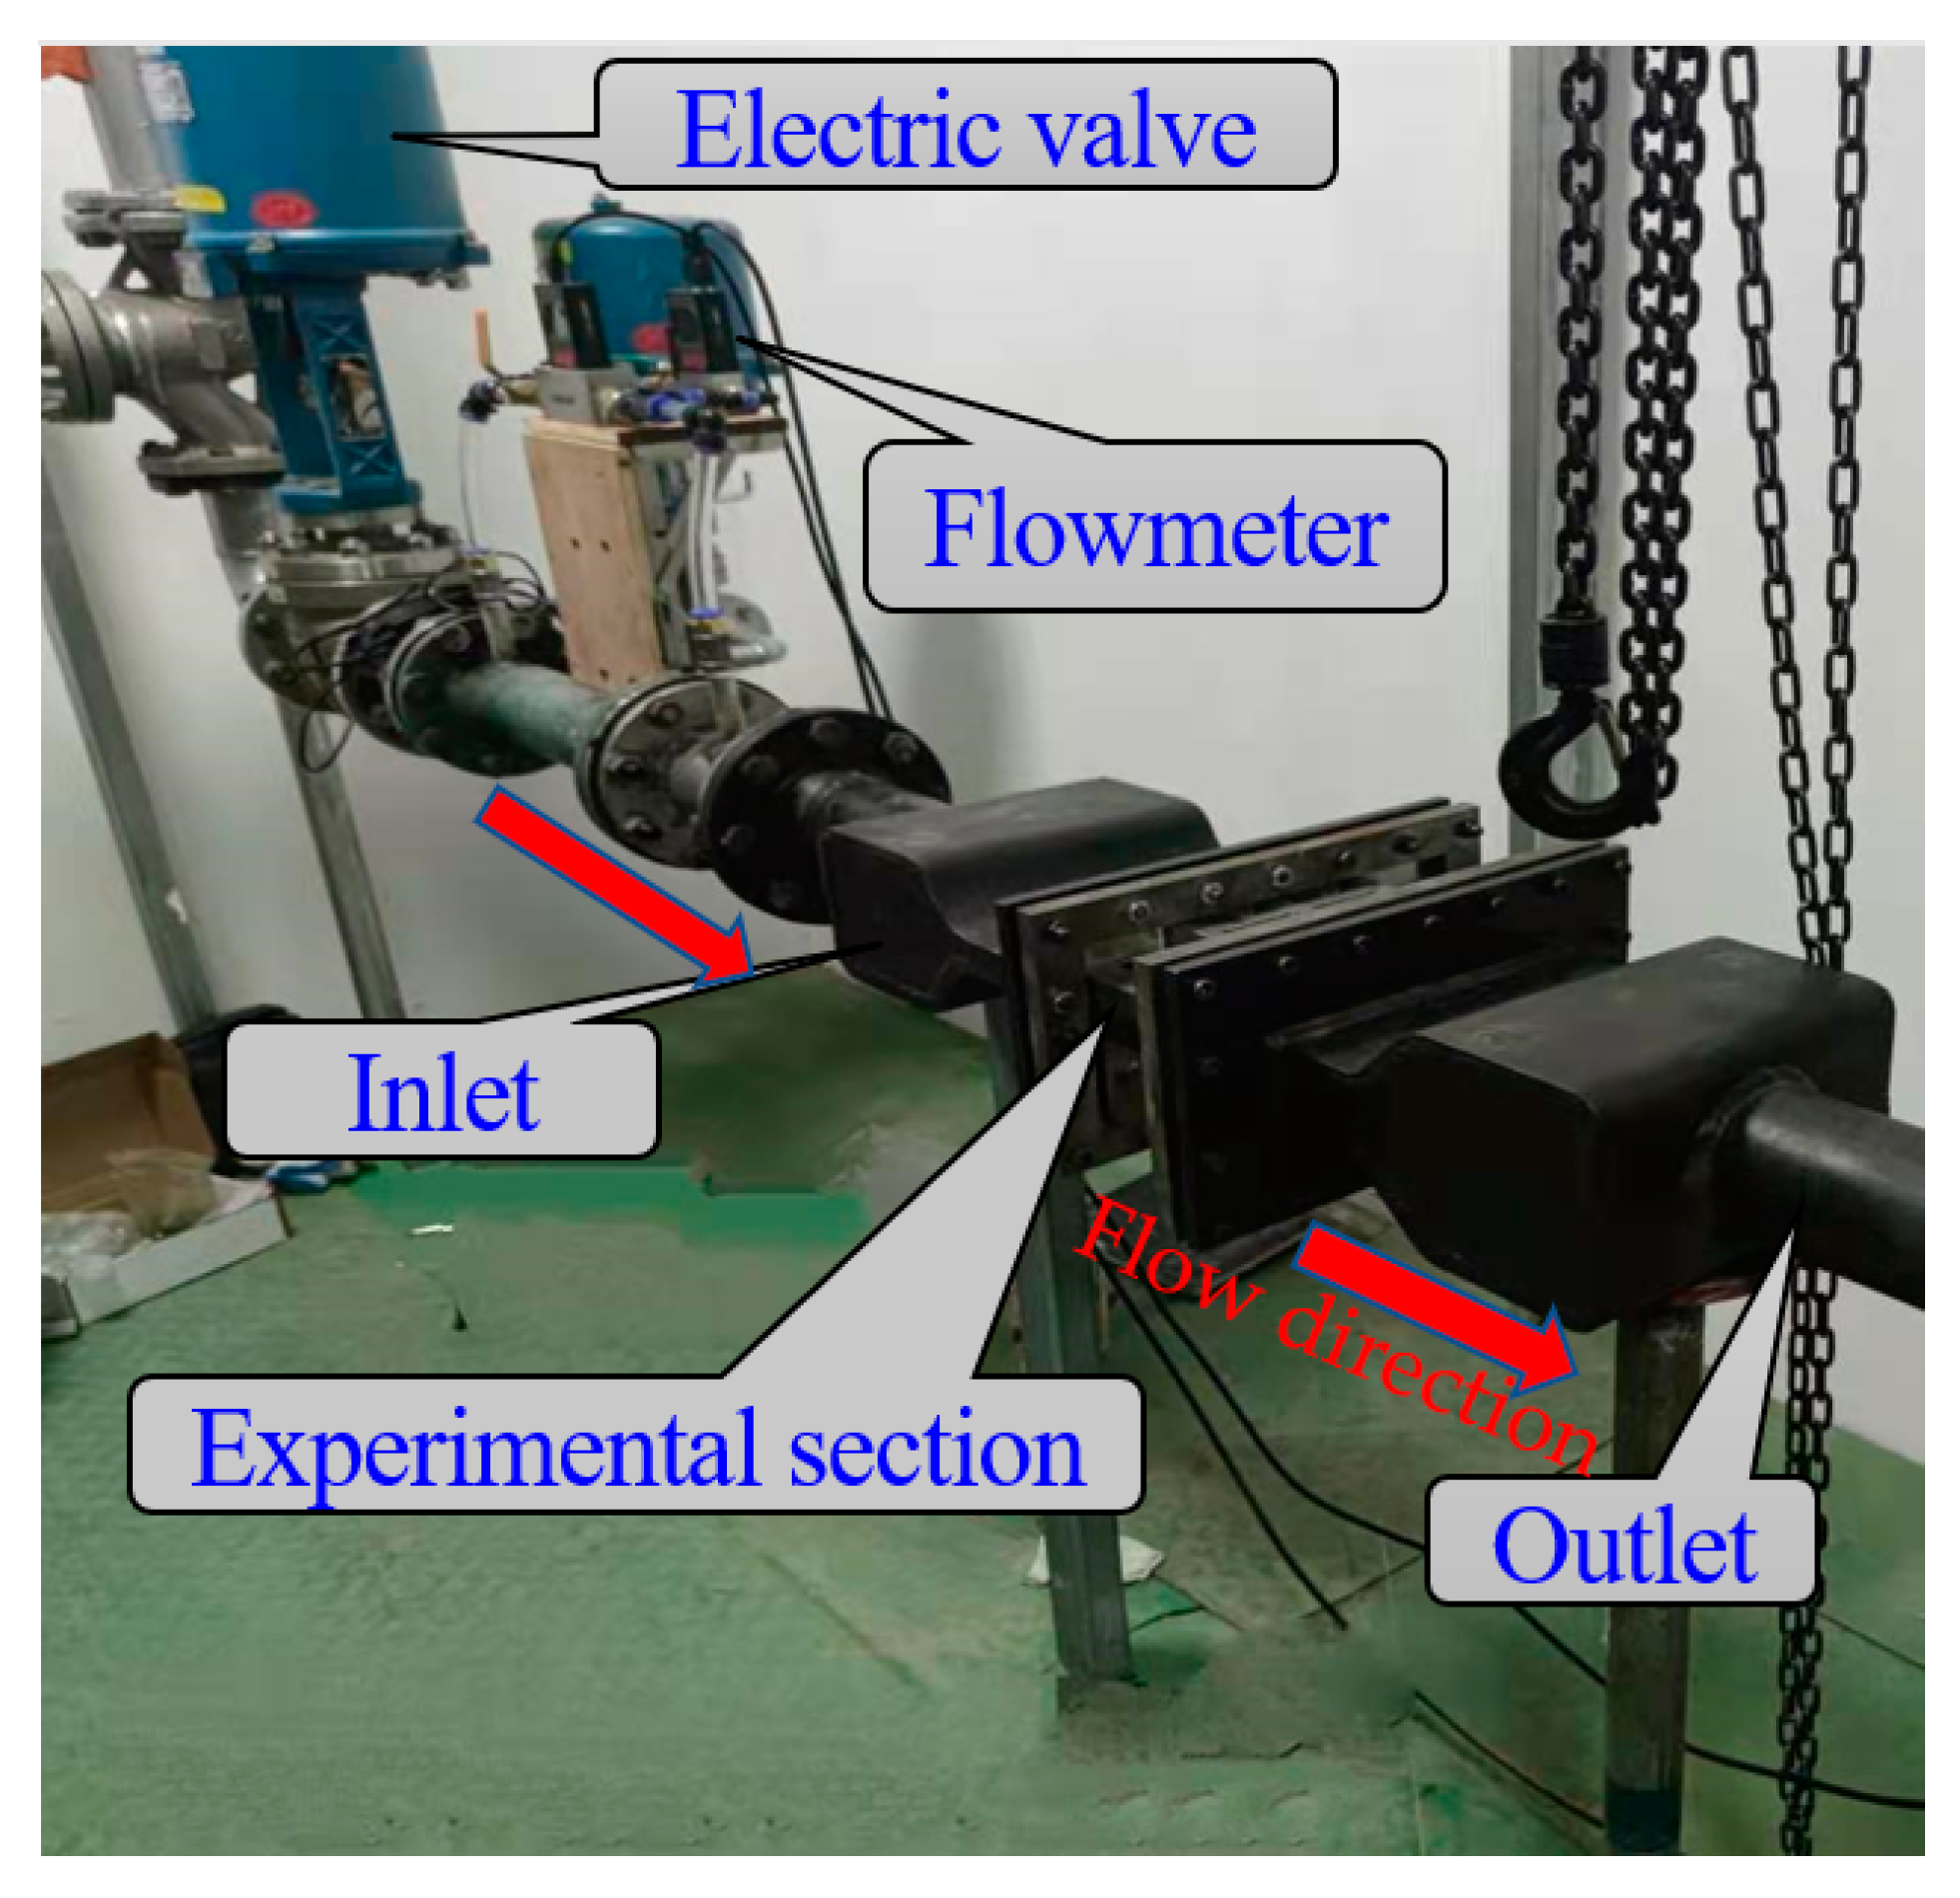
Figure 4.
Schematic diagram of the locations of the experimental measuring points.
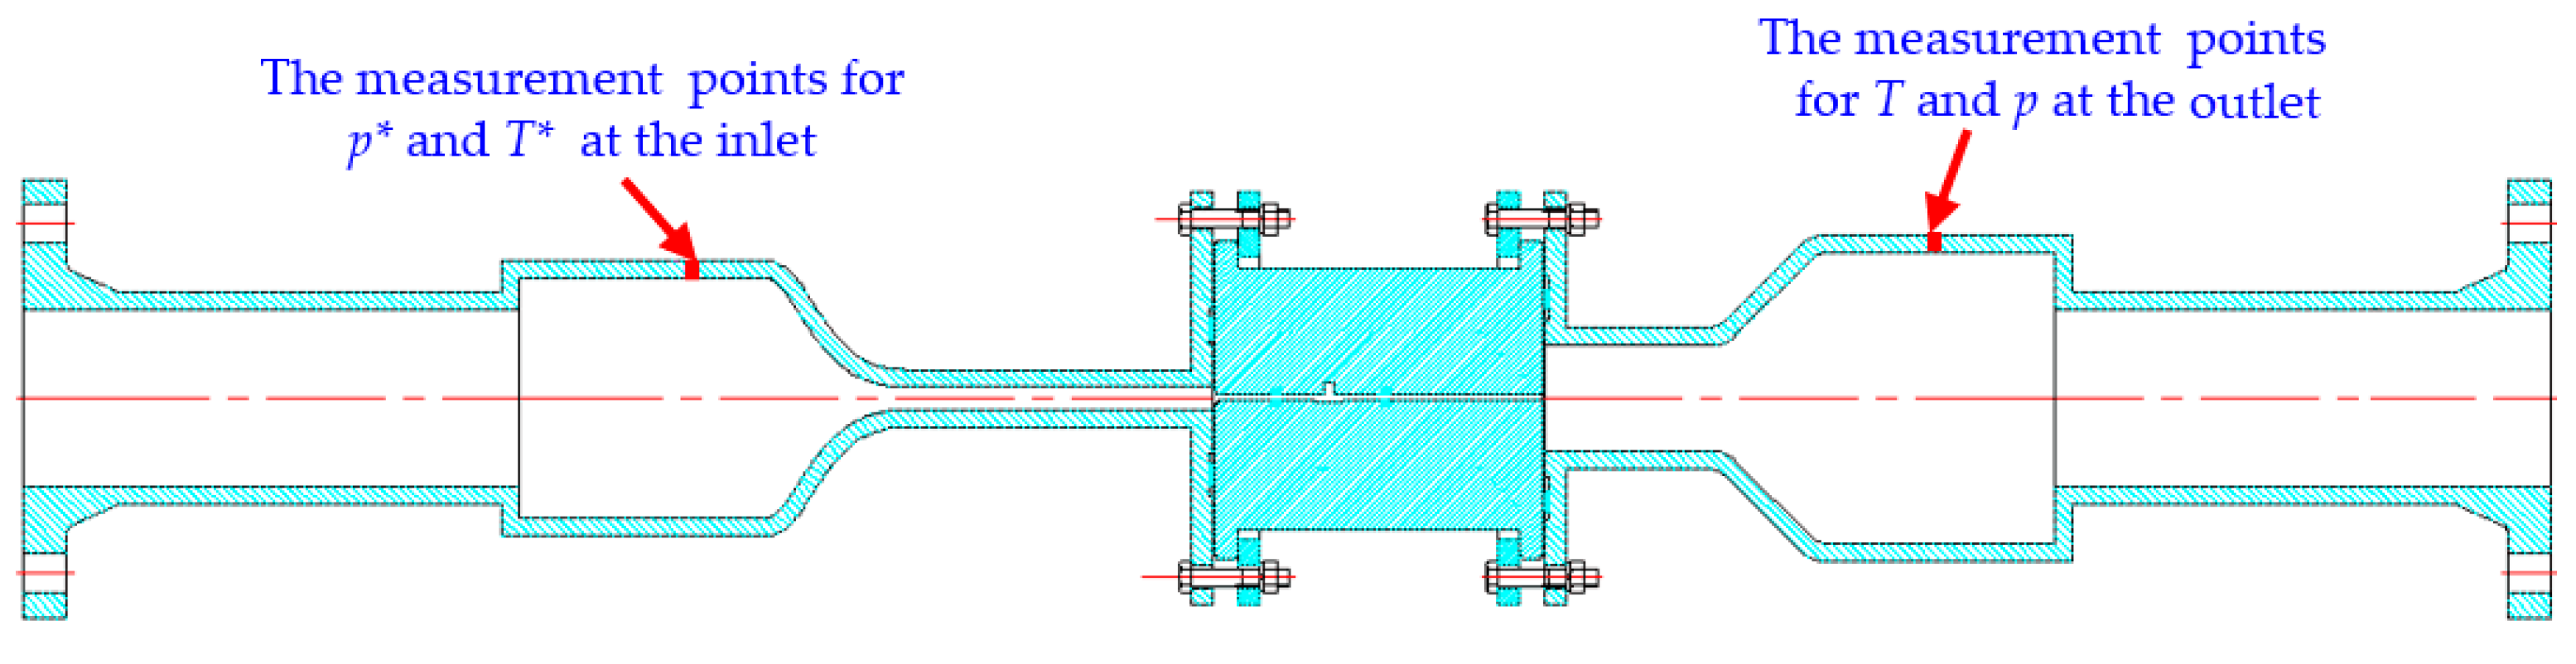
Figure 5.
Schematic diagram of edge plate clearance for turbine blades.
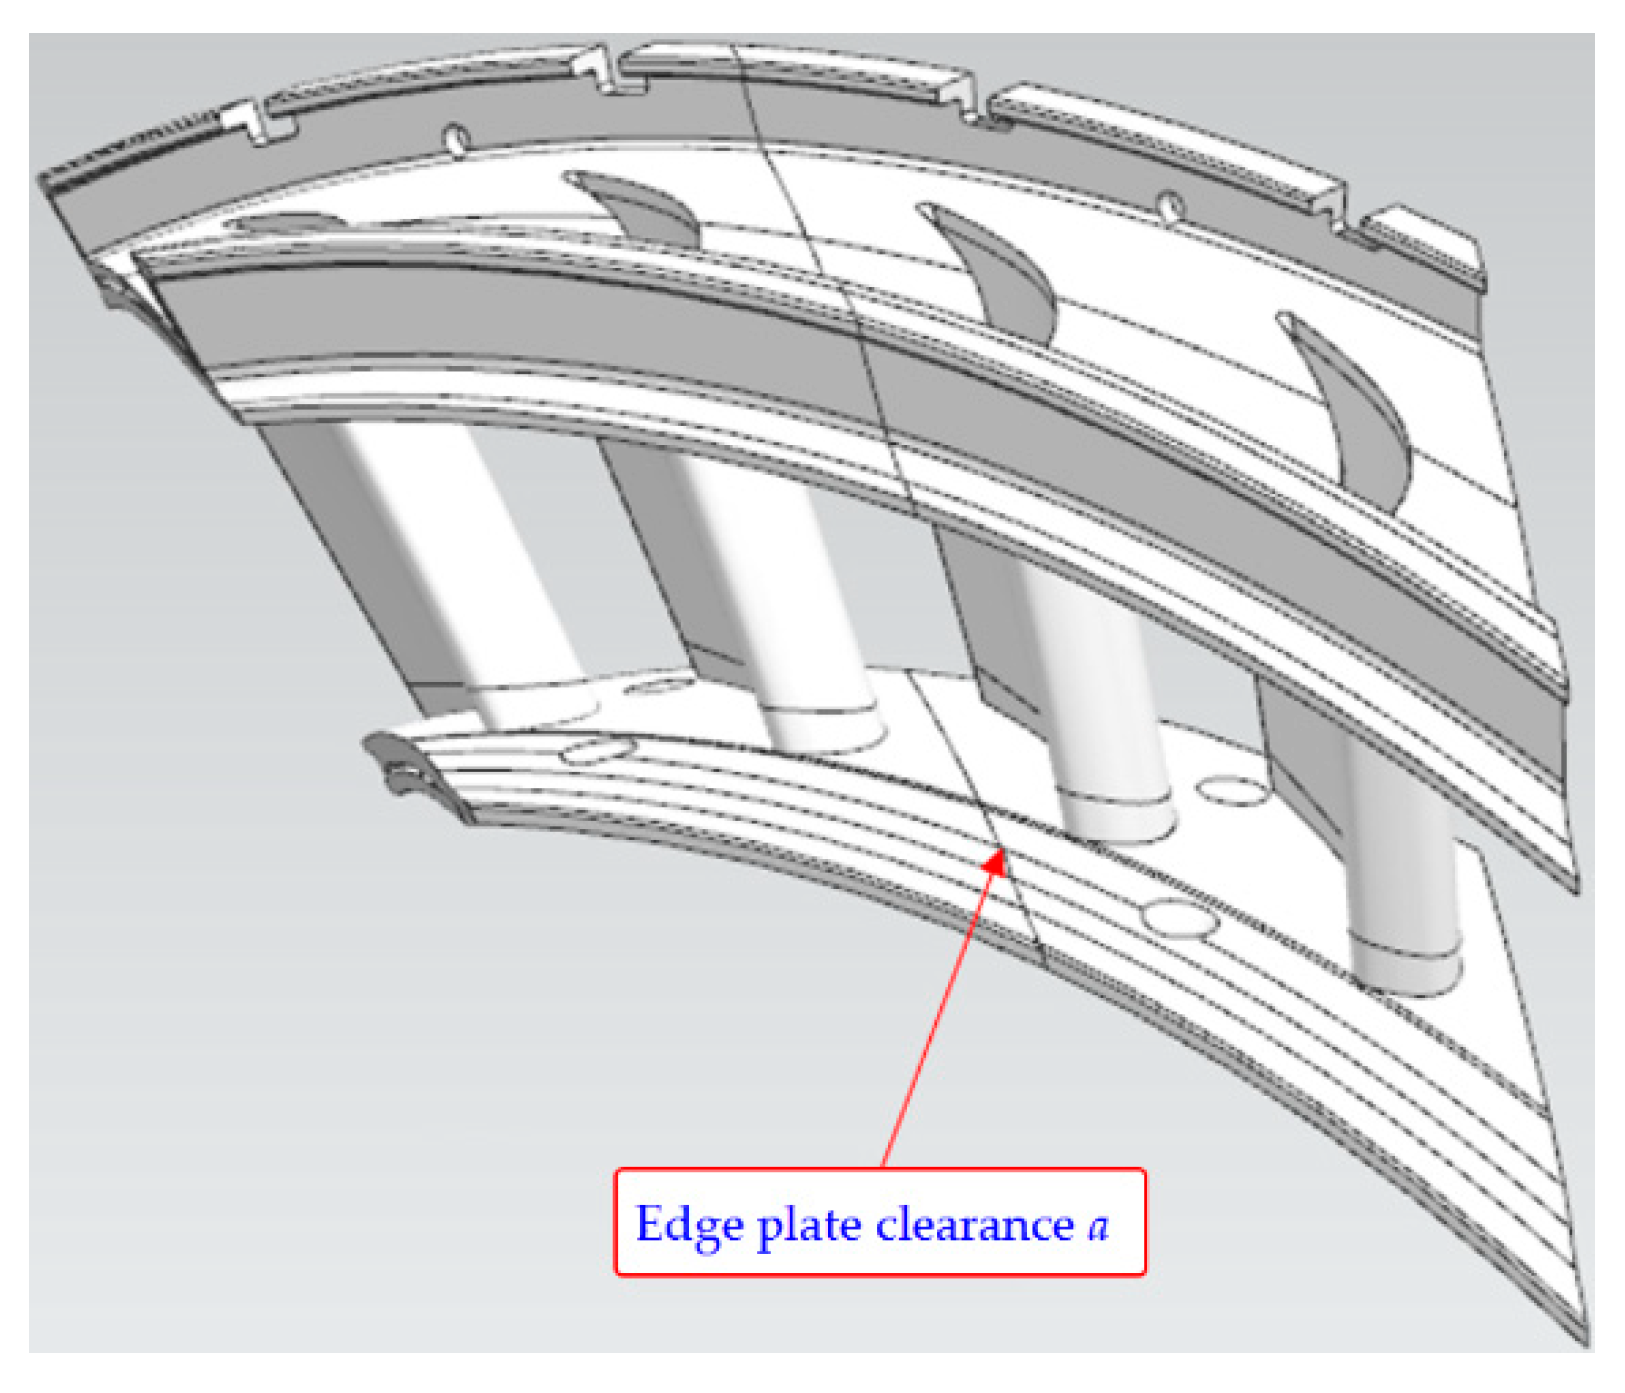
Figure 6.
Schematic diagram of the sheet spacing for the sealing sheet structure.
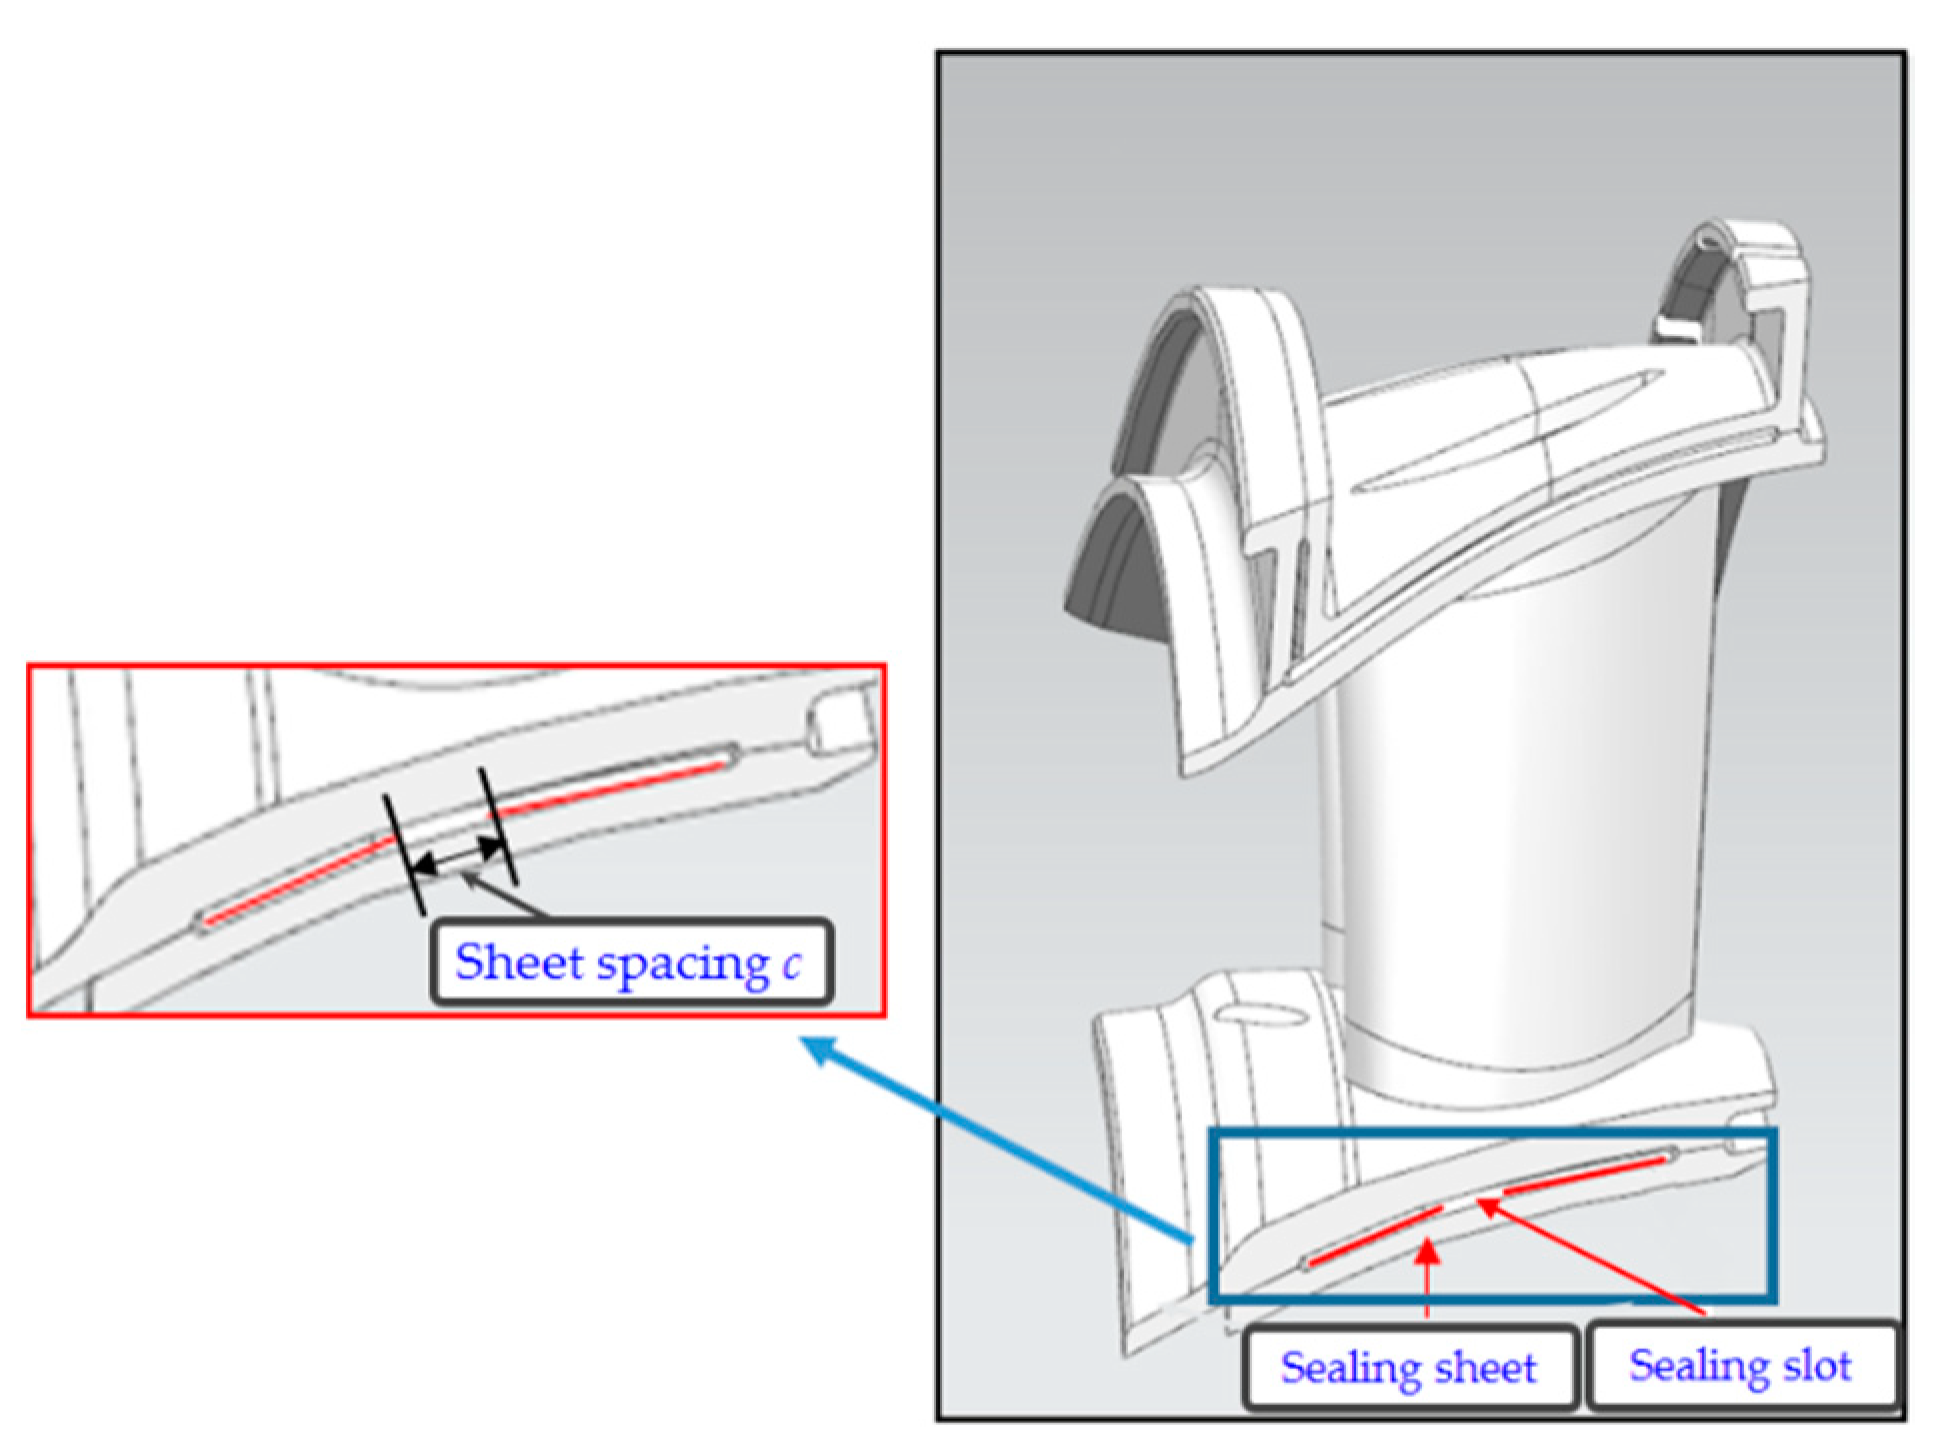
Figure 7.
Schematic diagram of bypass leakage (circumference leakage) for the sealing sheet.
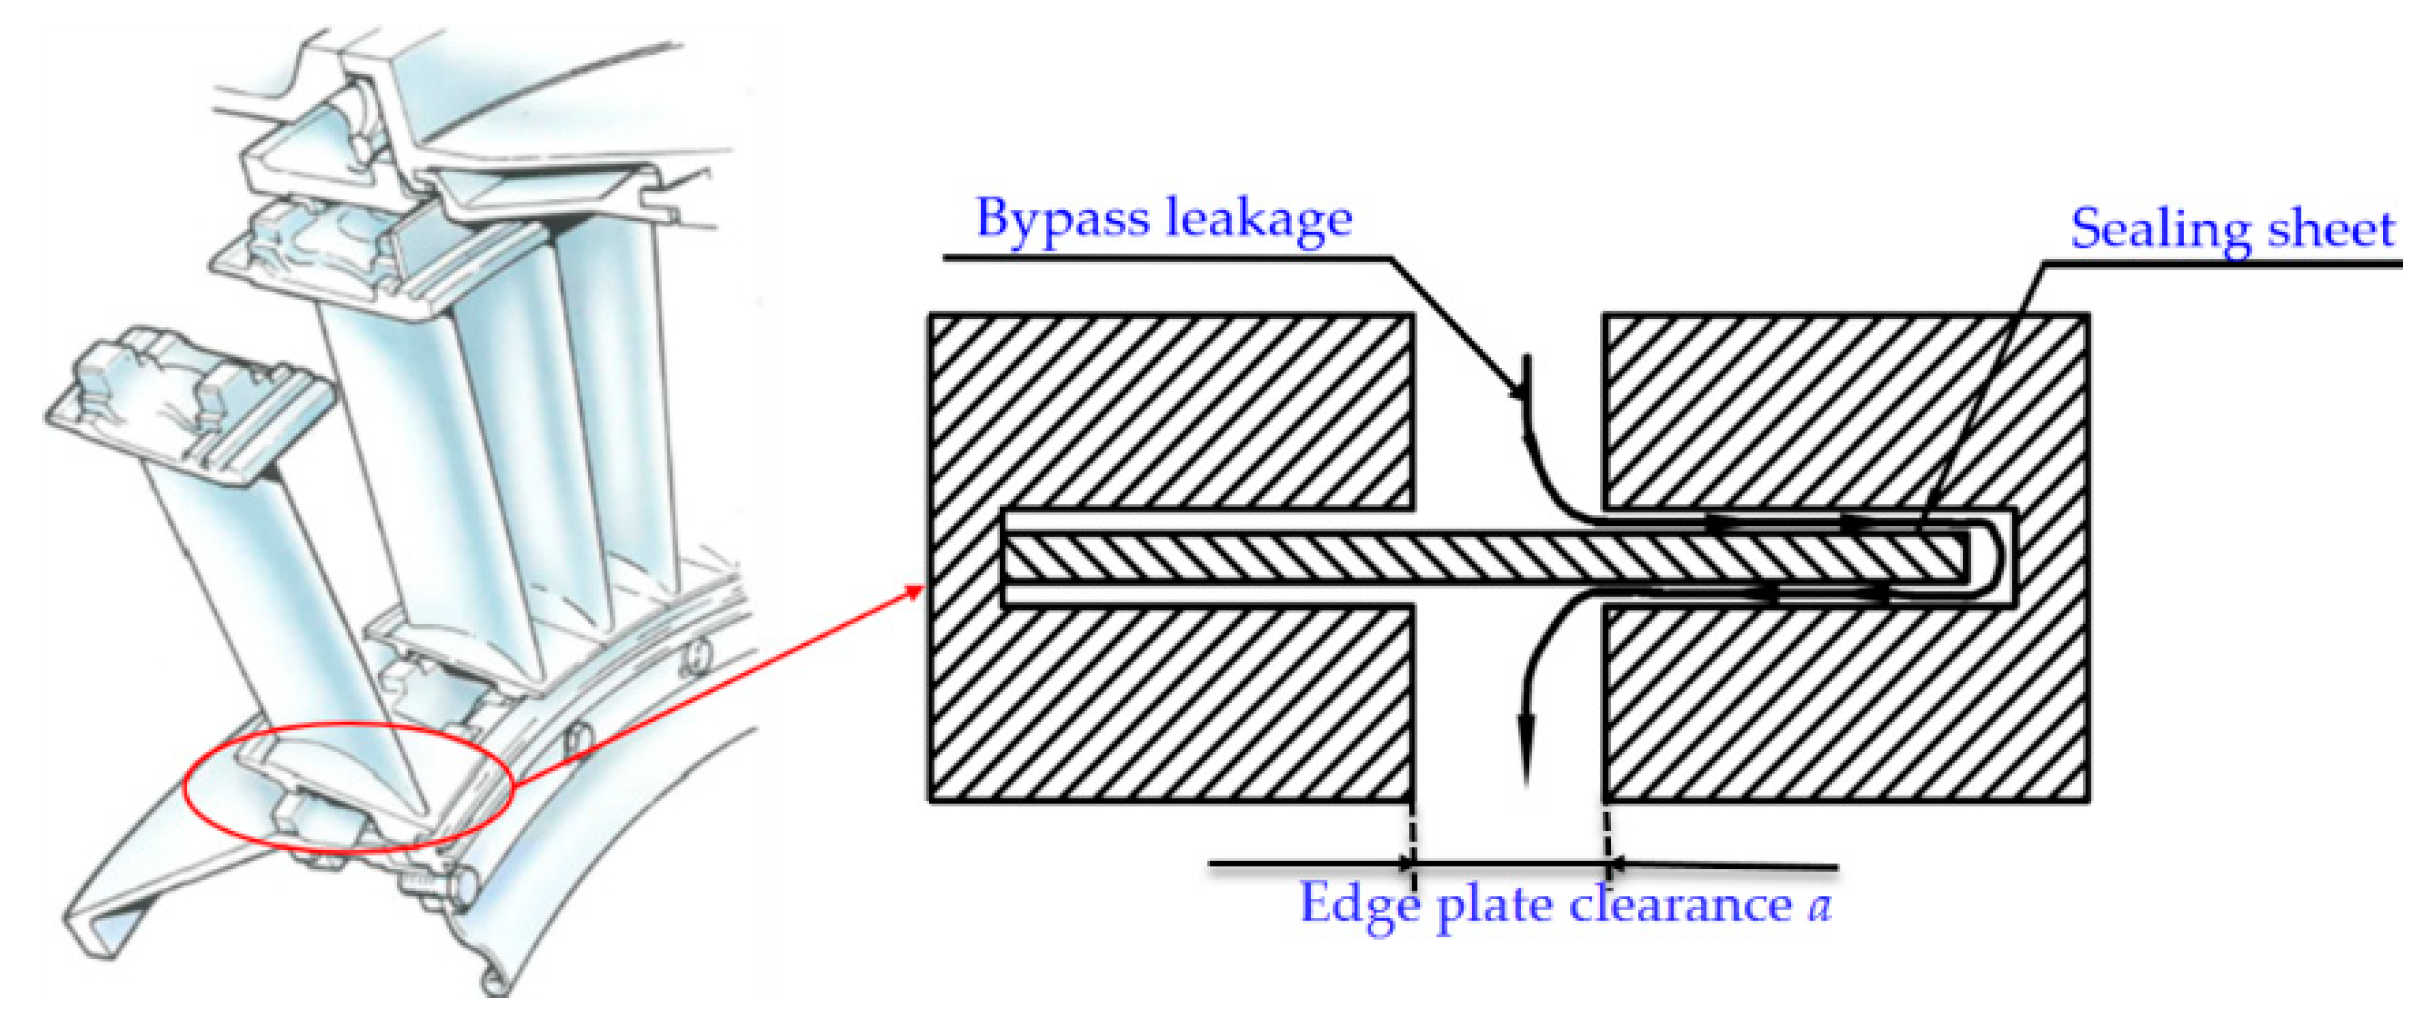
Figure 8.
Experimental results of different edge plate clearances (c = 1 mm). (a) Total leakage against the pressure ratio. (b) Equivalent mass flow of total leakage against pressure ratio.
Figure 8.
Experimental results of different edge plate clearances (c = 1 mm). (a) Total leakage against the pressure ratio. (b) Equivalent mass flow of total leakage against pressure ratio.
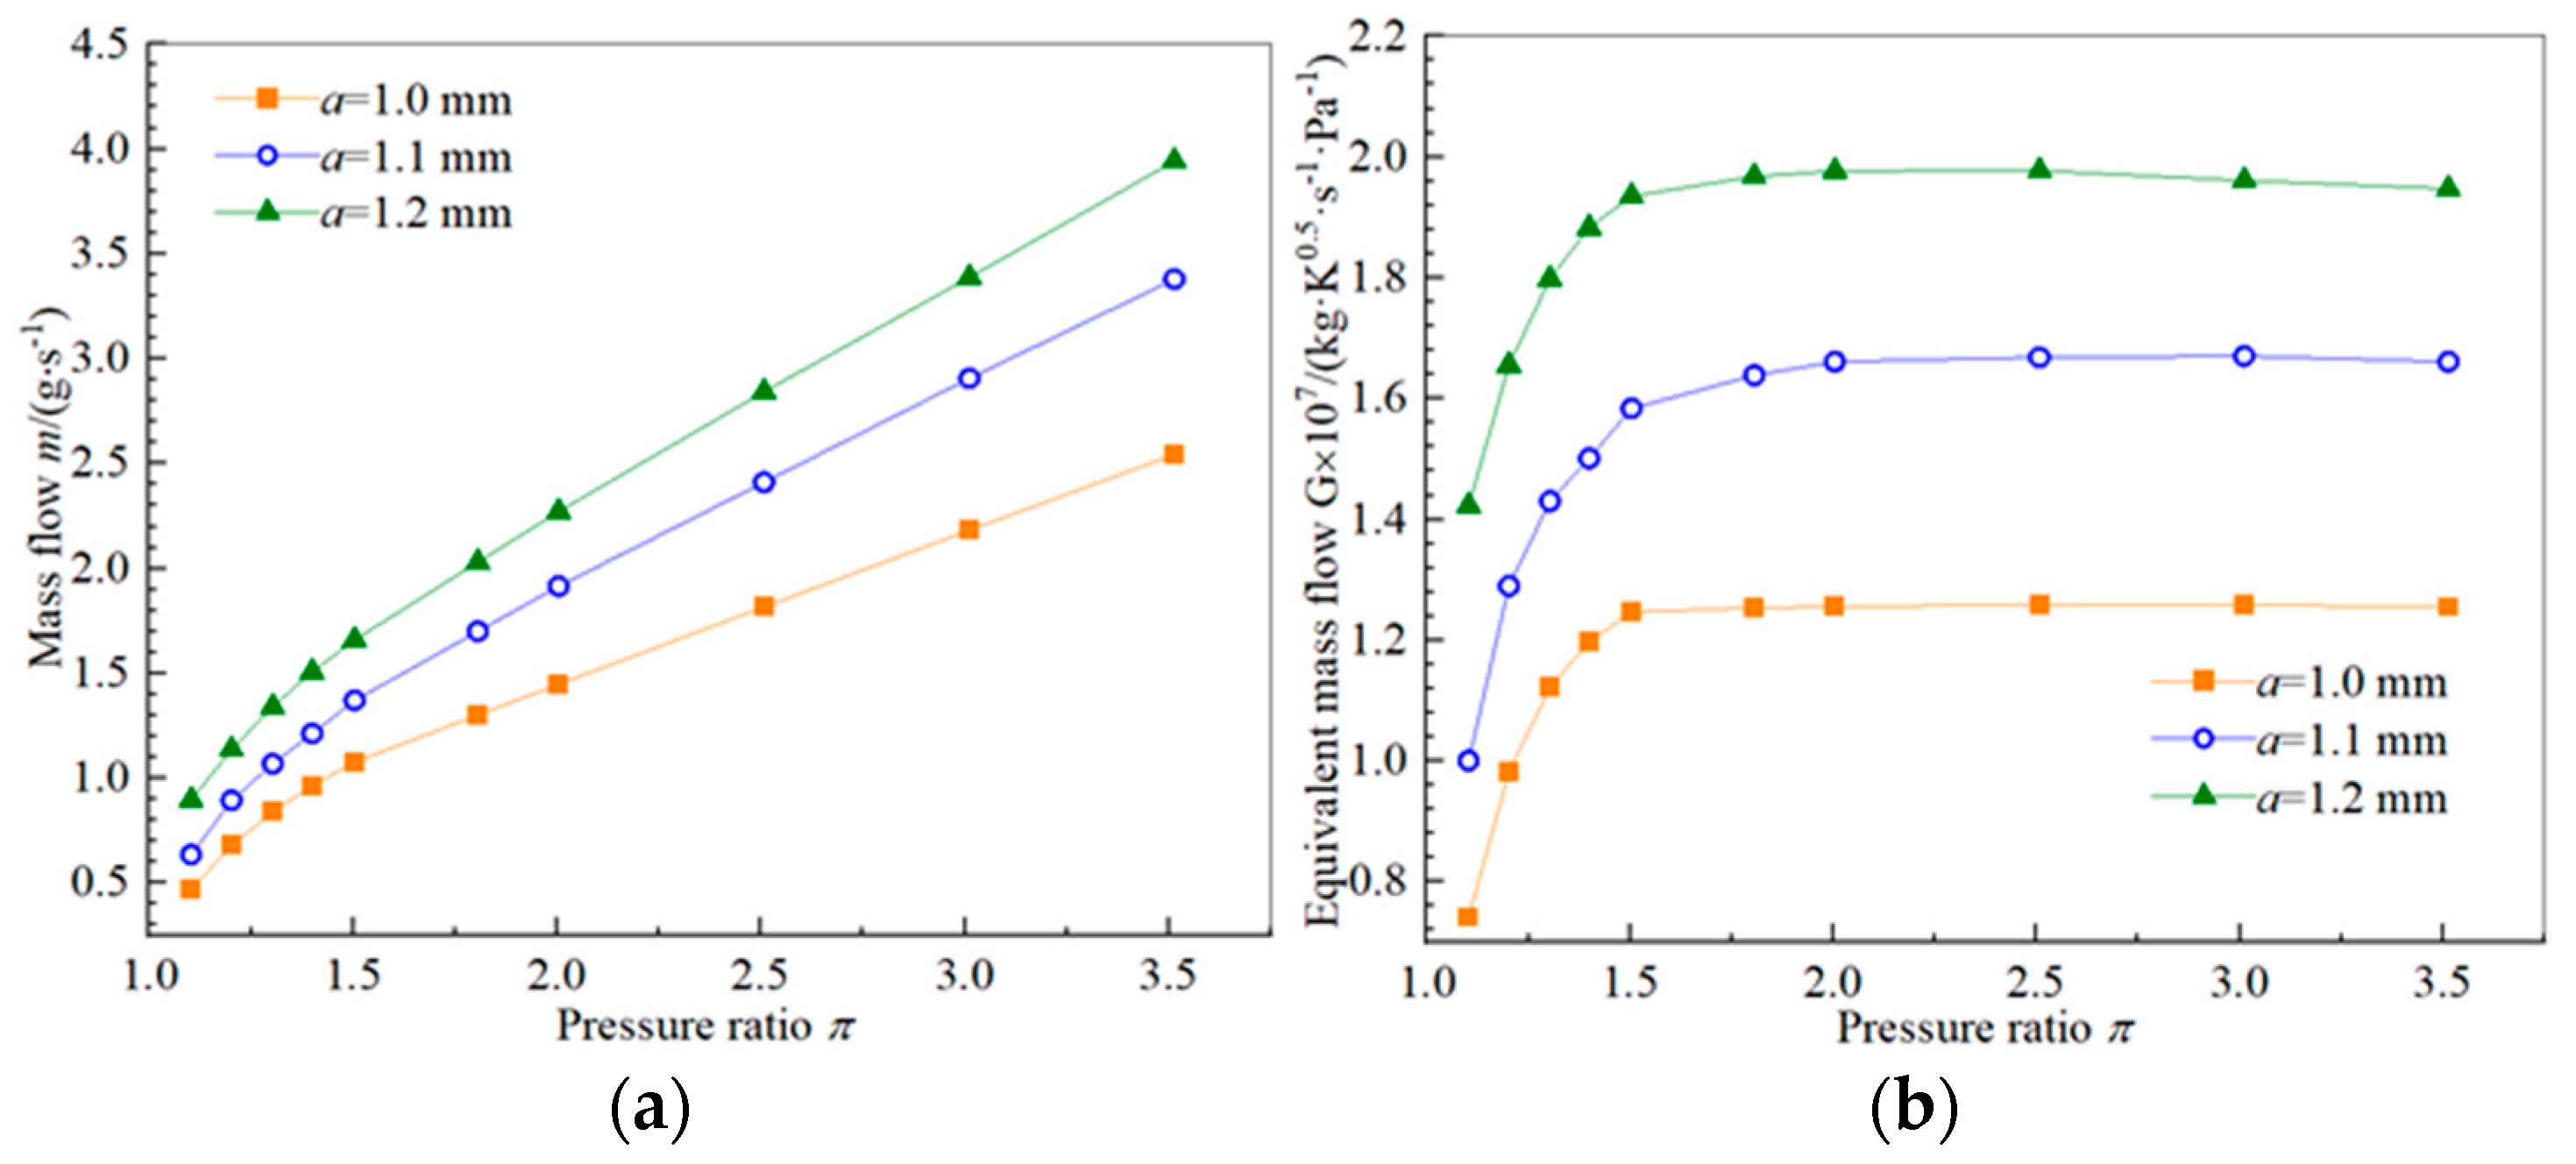
Figure 9.
Experiment with different edge plate clearances. (c = 1 mm). (a) Clearance leakage against pressure ratio. (b) Equivalent mass flow of clearance leakage against pressure ratio.
Figure 9.
Experiment with different edge plate clearances. (c = 1 mm). (a) Clearance leakage against pressure ratio. (b) Equivalent mass flow of clearance leakage against pressure ratio.
Figure 10.
Experimental results of total leakage and equivalent mass flow of total leakage under different sheet spacing (a = 1.0 mm). (a) Total leakage against the pressure ratio. (b) Equivalent mass flow of total leakage against the pressure ratio.
Figure 10.
Experimental results of total leakage and equivalent mass flow of total leakage under different sheet spacing (a = 1.0 mm). (a) Total leakage against the pressure ratio. (b) Equivalent mass flow of total leakage against the pressure ratio.
Figure 11.
The experimental results curves of clearance leakage and equivalent mass flow of clearance leakage under different sealing sheet spacing. (a = 1.0 mm). (a) Clearance leakage against pressure ratio. (b) Equivalent leakage against pressure ratio.
Figure 11.
The experimental results curves of clearance leakage and equivalent mass flow of clearance leakage under different sealing sheet spacing. (a = 1.0 mm). (a) Clearance leakage against pressure ratio. (b) Equivalent leakage against pressure ratio.
Figure 12.
Comparison of leakage for clearance and bypass. (a = 1.0 mm). (a) Bypass leakage (c = 0 mm) and clearance leakage. (b) Equivalent mass flow of clearance leakage and bypass leakage (c = 0 mm). (c) Comparison of clearance leakage and bypass leakage (c = 0 mm).
Figure 12.
Comparison of leakage for clearance and bypass. (a = 1.0 mm). (a) Bypass leakage (c = 0 mm) and clearance leakage. (b) Equivalent mass flow of clearance leakage and bypass leakage (c = 0 mm). (c) Comparison of clearance leakage and bypass leakage (c = 0 mm).

Table 1.
All experimental working conditions.
| Pressure ratio π | 1.1, 1.2, 1.3, 1.4, 1.5, 1.8, 2.0, 2.5, 3.0, 3.5 |
| Edge plate clearance a | 1.0 mm, 1.1 mm, 1.2 mm |
| Sheet spacing c | 0 mm, 1 mm, 4 mm, 7 mm, 10 mm |
Table 2.
The range of total leakage and the critical equivalent mass flow of total leakage.
| Edge Plate Clearance a mm | The Range of Total Leakage g·s−1 | The Range of Total Leakage per Unit Length g·s−1·mm−1 | Critical Equivalent Mass Flow of Total Leakage kg·K0.5·s−1·Pa−1 | Critical Equivalent Mass Flow of Total Leakage per Unit Length kg·K0.5·s−1·Pa−1·mm−1 |
|---|---|---|---|---|
| 1.0 | 0.47–2.54 | 0.00427–0.02311 | 1.26 × 10⁻⁷ | 1.14 × 10⁻⁹ |
| 1.1 | 0.64–3.38 | 0.00578–0.03072 | 1.67 × 10⁻⁷ | 1.51 × 10⁻⁹ |
| 1.2 | 0.89–3.94 | 0.00815–0.03583 | 1.95 × 10⁻⁷ | 1.77 × 10⁻⁹ |
Table 3.
The range of the clearance leakage and the equivalent mass flow of the clearance leakage under different edge plate clearances. (c = 1 mm).
Table 3.
The range of the clearance leakage and the equivalent mass flow of the clearance leakage under different edge plate clearances. (c = 1 mm).
| Edge Plate Clearance a mm | The Range of Clearance Leakage g·s−1 | The Range of Clearance Leakage per Unit Length g·s−1·mm−1 | Equivalent Mass Flow kg·K0.5·s−1·Pa−1 | Equivalent Mass Flow per Unit Length kg·K0.5·s−1·Pa−1·mm−1 |
|---|---|---|---|---|
| 1.0 | 0.14–0.80 | 0.0013–0.0073 | 4.05 × 10⁻⁸ | 3.71 × 10⁻¹⁰ |
| 1.1 | 0.17–1.04 | 0.0015–0.0095 | 5.09 × 10⁻⁸ | 4.63 × 10⁻¹⁰ |
| 1.2 | 0.33–1.24 | 0.0030–0.0113 | 6.07 × 10⁻⁸ | 5.52 × 10⁻¹⁰ |
Table 4.
The range of total leakage (a = 1.0 mm).
| Sheet Spacing c mm | Leakage Length Proportion Y | The Range of Total Leakage g·s−1 | The Range of Total Leakage per Unit Length g·s−1·mm−1 |
|---|---|---|---|
| 1 | 0.91% | 0.47–2.54 | 0.0043–0.0231 |
| 4 | 3.63% | 1.05–5.77 | 0.0096–0.0525 |
| 7 | 6.36% | 1.36–7.71 | 0.0124–0.0701 |
| 10 | 9.09% | 1.83–10.59 | 0.0167–0.0963 |
Table 5.
The range of clearance leakage (a = 1.0 mm).
| Sealing Sheet Clearance c mm | Leakage Length Proportion Y | The Range of Clearance Leakage g·s−1 | The Range Of Clearance Leakage per Unit Length g·s−1·mm−1 |
|---|---|---|---|
| 1 | 0.91% | 0.14–0.80 | 0.0013–0.0073 |
| 4 | 3.63% | 0.73–4.03 | 0.0066–0.0367 |
| 7 | 6.36% | 1.03–5.97 | 0.0094–0.0540 |
| 10 | 9.09% | 1.50–8.85 | 0.0137–0.0805 |
Table 6.
The critical equivalent mass flow of clearance leakage (a = 1.0 mm).
| Sheet Spacing c (mm) | Leakage Length Proportion Y | The Critical Clearance Leakage kg·k0.5·s−1·Pa−1 | The Critical Clearance Leakage per Unit Length kg·k0.5·s−1·Pa−1·mm−1 |
|---|---|---|---|
| 1 | 0.91% | 0.41 × 10⁻⁷ | 0.37 × 10⁻⁹ |
| 4 | 3.63% | 1.98 × 10⁻⁷ | 1.80 × 10⁻⁹ |
| 7 | 6.36% | 2.91 × 10⁻⁷ | 2.64 × 10⁻⁹ |
| 10 | 9.09% | 4.32 × 10⁻⁷ | 3.93 × 10⁻⁹ |
Publisher’s Note: MDPI stays neutral with regard to jurisdictional claims in published maps and institutional affiliations. |
© 2022 by the authors. Licensee MDPI, Basel, Switzerland. This article is an open access article distributed under the terms and conditions of the Creative Commons Attribution (CC BY) license (https://creativecommons.org/licenses/by/4.0/).
Share and Cite
MDPI and ACS Style
Chen, Y.; Cai, C.; Liu, G. Experimental Analysis of Clearance Leakage Characteristics at Blade Edge Plates of a Gas Turbine Engine. Energies 2022, 15, 2303. https://doi.org/10.3390/en15072303
AMA Style
Chen Y, Cai C, Liu G. Experimental Analysis of Clearance Leakage Characteristics at Blade Edge Plates of a Gas Turbine Engine. Energies. 2022; 15(7):2303. https://doi.org/10.3390/en15072303
Chicago/Turabian StyleChen, Yan, Chenkun Cai, and Gaowen Liu. 2022. "Experimental Analysis of Clearance Leakage Characteristics at Blade Edge Plates of a Gas Turbine Engine" Energies 15, no. 7: 2303. https://doi.org/10.3390/en15072303
Note that from the first issue of 2016, this journal uses article numbers instead of page numbers. See further details here.