Article

Characteristics and Affecting Factors of K2qn1 Member Shale Oil Reservoir in Southern Songliao Basin, China

1
College of Geosciences, China University of Petroleum-Beijing, Beijing 102249, China
2
State Key Laboratory of Petroleum Resource and Prospecting, China University of Petroleum-Beijing, Beijing 102249, China
3
Research Institute of Exploration and Development, PetroChina Jilin Oilfield Company, Songyuan City 138000, China
4
Institute of Unconventional Oil and Gas, Northeast Petroleum University, Daqing City 163318, China
*
Authors to whom correspondence should be addressed.
Energies 2022, 15(6), 2269; https://doi.org/10.3390/en15062269
Submission received: 12 January 2022 / Revised: 7 March 2022 / Accepted: 17 March 2022 / Published: 21 March 2022
(This article belongs to the Special Issue Shale Oil and Gas Accumulation Mechanism)

Abstract

:
Member 1 of the Cretaceous Qingshankou Formation (K2qn1 Member) in the Southern Songliao Basin, composed of mainly semi-deep and deep lacustrine shale layers, is rich in shale oil. Previous studies on shale reservoir characteristics mainly focused on marine shale strata, but few studies have considered lacustrine shale strata, so the pore-throat features and differences between the lacustrine shale reservoir and marine shale reservoir need to be studied. Taking the Class-I and II sweet spot sections and Class-III non-sweet spot section of Da’an shale oil demonstration area as examples, SEM (scanning electron microscopy) was used to qualitatively and semi-quantitatively describe the morphology and occurrence characteristics of the shale. Full-scale pore size distributions of lacustrine shale samples were quantitatively measured by N2GA (nitrogen absorption) combined with dominant pore size segments tested by experiments. Finally, the lacustrine shale reservoir was compared with classical marine shale reservoirs, and factors influencing semi-deep lacustrine and deep lacustrine shale oil in a large depression basin were analyzed by XRD (X-ray diffraction). The results show that Class-I and II sweet spots are rich in organic matter, quartz, and carbonate minerals, have mainly type H2 nitrogen adsorption hysteresis loops, and contain mainly inorganic pores, such as intergranular and intragranular pores in nano-scale, forming nano-scale reservoirs. Lacustrine shale is obviously different from marine shale in terms of pore structure, and the development characteristics of the lacustrine shale pore structure are more influenced by mineral components. Factors affecting the development of shale oil reservoirs in K2qn1 member include mineral components, TOC (total organic carbon), and diagenetic processes. Quartz and carbonate minerals are good for enhancing reservoir quality, while clay minerals are destructive to the development of reservoirs. TOC is the material foundation and main factor for forming organic pores, but the higher the TOC, the smaller the diameter of the organic pores will be. Compaction, cementation, and dissolution are the main diagenetic processes controlling the development of reservoir space.

1. Introduction

Shale oil is the oil accumulation that exists in shale strata with rich organic matter and nanopores, in which shale is both the source rock and reservoir, making it a typical source–reservoir accumulation [1,2,3]. Wide in terms of distribution range and huge in terms of resource abundance, shale oil is of great significance to the sustainable development of the world economy [4,5,6,7]. With lacustrine shale sequences extensively developing in continental basins, China has abundant geologic resource of shale oil. The most representative ones are the Chang 7 member in Ordos Basin, K2qn1 Member in Songliao Basin, and Shahejie Formation in Bohai Bay Basin, which have become important targets of shale oil exploration and development [2,3,8,9,10].
As shale oil exploration goes deeper, research on shale oil reservoirs are also reinforced constantly. Previous studies on shale reservoir characteristics and controlling factors mainly focused on the Barnett, Bakken, and Eagle Ford shales in the United States and Marine shales in southern China [11,12,13,14,15,16], but studies on the development characteristics of shale oil and gas reservoirs in the continental lacustrine basin have been rare, so the development characteristics of the pore throat of lacustrine shale reservoirs and the differences between lacustrine shale reservoirs and marine shale reservoirs need to be explored urgently. Meanwhile, lacustrine shale is more easily affected by the sedimentary environment, mineral composition, organic matter abundance, organic matter type, and other factors, and the key factors affecting the development and evolution of lacustrine shale oil reservoir space remain poorly understood.
This research is mainly based on scanning electron microscopy (SEM), argon ion polishing technology, and nano- computed tomography (CT) scanning to describe the development morphology, connectivity, and genesis of micropores in shale samples [17,18,19,20,21]. Although SEM can obtain fine pore structure images, the statistical representativeness of the pore size distribution from SEM is poor. When using high pressure mercury injection and low temperature nitrogen adsorption experiments to quantitatively characterize pore size, the experiments are different in the range of pores characterized and one-sided in test results, so these methods have limited applications.
Based on the above understanding, the lacustrine shale of K2qn1 Member in Da’an area, southern Songliao Basin is taken as the research object. With sample collection, experimental testing, and theoretical analysis as the train of thought, SEM is used to describe the morphology and occurrence characteristics of shale qualitatively and semi-quantitatively. The full-scale quantitative measurement of lacustrine shale pore size distribution was carried out by the nitrogen adsorption (N2GA) test method combined with the dominant pore size segment tested by each experiment. The controlling factors of pore development characteristics were assessed by X-ray diffraction (XRD). The comprehensive analysis of the experimental results is aimed at characterizing the morphological, structural characteristics, and pore size distribution of lacustrine shale and revealing the main controlling factors of shale pore development, thus providing an evaluation basis for the shale oil reservoirs in K2qn1 member of the Da’an shale oil demonstration area.

2. Geological Setting

Songliao Basin, one of the main hydrocarbon-bearing lacustrine basins in China, is a large Meso-Cenozoic lacustrine basin in the NNE–SSW strike in Northeastern China (Figure 1a). The Songliao Basin has gone through three stages of development, namely fault depression, depression, and structure reversal, and has sedimentary strata of fault depression and depression stages deposited [22,23,24]. The strata of depression stage contain the main hydrocarbon-producing layers, including the Lower Cretaceous Denglouku (K1d), Quantou formations (K1q), and the Upper Cretaceous Qingshankou (K2qn), Yaojia (K2y), Nenjiang (K2n), Sifangtai (K2s), and Mingshui (K2m) formations (Figure 1d). The southern part of the basin had three provenances, i.e., west, southwest, and southeast [10]. The west part of the basin had two rivers long, giving rise to two large delta complexes. Terminating at the west of Da’an area, the two delta complexes in wedge shape extend into the semi-deep and deep black shale strata, providing a large reservoir space for petroleum migration and accumulation.
During the two lake flooding periods in the Cretaceous, i.e., the depositional periods of members 1 and 2 of the Qingshankou Formation (K2qn1 Member and K2qn2 Member) and members 1 and 2 of Nenjiang Formation, affected by the short-term connection of Songliao Basin and the ocean, four sets of widely distributed thick shale layers with rich organic matter were deposited, and these are the most important petroleum source beds and regional caprocks [10,12,25,26]. In the central depression of the Songliao Basin, K2qn1 Member, with higher organic matter abundance, thermal evolution degree, and higher total organic content (TOC) belts in a ring shape at the lake center sag (Figure 1c), is the key area for the risk exploration of shale oil in the near and mid-term future.
The Da’an shale oil demonstration area is located at the west of central depression (as shown in Figure 1b), where dark shale layers with a high abundance of organic matter (TOC = 1.0–6.0%), type I and II1 kerogens, and higher thermal evolution degree (Ro = 0.5–1.3%, 1.05% on average) are well developed. This is the key area for shale oil risk exploration [27,28]. In recent years, shale oil exploration in the Da’an area of the southern Songliao Basin has seen major discoveries. Several horizontal shale oil wells tapped high production oil flows over 10 m3/d after fracturing, indicating the promising future of shale oil exploration and development in the Da’an area.

3. Samples and Methods

3.1. Samples

The samples used in the experiments were collected from K2qn1 Member of Well A in Da’an area, southern Songliao Basin (as shown in Figure 1c). According to core analysis, electric logging, testing data, and reservoir logging has the characteristics of low gamma, high resistivity, and low density (Figure 2). Referring to the three-point evaluation and classification criteria of shale oil resources in the southern Songliao Basin [29], sweet spot sections are classified into Class-I (with TOC > 1.8%), Class-II (with 1.8% > TOC > 0.8%), and Class- III non-sweet spot sections (with TOC < 0.8%) (Table 1). In total, 11 shale samples were collected from the K2qn1 member of Well A (2 from Class-I sweet spot section, 3 from Class-II sweet spot section, and 6 from Class-III non-sweet spot section) and used as main samples (as shown in Figure 2) to study the reservoir characteristics of different sweet spot sections. These shale samples were mainly used for mineral XRD, N2GA, desorption, argon ion polished SEM, pore throat image, and TOC tests, which were all conducted in the Schlumberger Reservoir Laboratory.

3.2. Methods

3.2.1. XRD

The shale samples were first broken into small pieces, then ground with ethanol and dried at 60 °C to obtain a clay powder < 4 µm by decantation separation. The powder was analyzed with XRD at 104,300 Pa and 18 °C to identify the components and get contents of the components.

3.2.2. N2GA

N2GA experiment was conducted with an Autosorb IQ3 (Quantachrome, Boynton Beach, FL, USA), automated gas adsorption analyzer produced by Quantachrome. The relative pressure (P/P0) of adsorption and desorption was 0.005–0.995. The adsorbent was 99.999% purity nitrogen. N2GA quantities under different relative pressures were tested at 77K, and pore diameter distribution, pore volume, and specific surface area were worked out by Brunauer–Emmett–Teller (BET) theory.

3.2.3. SEM

Shale samples with proper size were selected, polished with sand paper, then put into the argon ion polisher (IB-09010CP JEOL, Tokyo, Japan). At properly set parameters, the surface of each sample was hit by an argon ion beam. Then, each polished sample was fixed on the sample stage with conductive adhesive and sprayed with gold. Finally, each sample was analyzed and imaged with a SEM (FEI Quanta 650 FEG, Boynton Beach, FL, USA).

3.2.4. Analysis of SEM Images

The SEM images were extracted. Image Proplus software was used to calculate a series of geometric features of the selected areas. The specific steps were as follows: First, new scale was set according to the scale set in the SEM image. Second, the binarization method was used to extract pore information, proper gray value was selected to distinguish pores from matrix, and the pore and matrix were flagged by black and white respectively to pick out pores from the matrix. Third, the area, perimeter, average pore diameter, and roundness of the pores were calculated.

3.2.5. TOC

The shale sample was ground to a particle size of less than 0.2 mm. Then, diluted hydrochloric acid was used to remove the carbonate minerals. After inorganic carbon was removed (>10 g), the sample was burnt in a high temperature oxygen flow to convert TOC into CO2. Then, the quality of TOC in the sample was measured with an infrared detector.

4. Results

The main characteristics of the shale oil reservoir include petrologic characteristics, pore structure characteristics, and reservoir space type and characteristics. Class-I and Class-II sweet spots and a Class-III non-sweet spot section were studied systematically by comparing these characteristics.

4.1. Petrologic Characteristics of the Reservoirs

The XRD analysis results of 11 shale samples from K2qn1 member of Well A in the Da’an area, southern Songliao Basin show that the continental shale in K2qn1 member is complex in terms of mineral composition and strongly heterogeneous (Table 1 and Figure 3). Shale samples from the Class-I sweet spot section are mostly siliceous clayey hybrid shale, with the minimum and maximum contents of brittle minerals of 39.3% and 48.4%, and an average content of brittle minerals of 43.01%; the minimum and maximum clay mineral contents of 36.5% and 59.5%, and an average clay mineral content of 46.45%; the minimum and maximum contents of carbonate minerals of 1.2% and 21.4%, and an average content of carbonate minerals of 10.48%. The shale samples from the Class-II sweet spot section are mainly silica-bearing clayey shale and are composed of brittle minerals, such as quartz (22.7–25.6%, on average 24.075%) and feldspar (11.5–13.6%, on average 12.8%), clay minerals (53.9–60.6%, on average 57.33%), and a smaller amount of carbonate minerals (0.2–6.6%, on average 3.63%). The shale samples from Class-III non-sweet spot section are all silica-bearing clayey shale, with an average content of brittle minerals of 36.30% (35.9–36.7%), average clay mineral content of 58.80% (58.9–58.7%), and average carbonate mineral content of 4.90% (4.6–5.2%).
The clay minerals of the Da’an area in the southern Songliao Basin are mainly I/S mixed layer and illite, with a small amount of chlorite (as shown in Figure 3b), indicating that the early diagenesis stage has ended in this area and now it is at the late period of middle diagenesis B stage, which is the main stage of petroleum generation [30]. Clay minerals in different depths of Well A do not present much difference, with average contents of I/S mixed layer and illite of 61% (57–65%) and 32% (24–42%), respectively, an average chlorite content of 4% (1–10%), and a low average kaolinite content of 3% (1–8%).

4.2. Types of Reservoir Space

Experiencing multiple stages of thermal evolution and diagenesis, shale reservoirs often have complex pore-fracture systems. With diverse origins, pores in shale reservoirs have no uniform classification scheme yet [31,32,33]. To analyze the characteristics of pores and micro-fissures, by referring to the classification schemes of pore systems in shale reservoirs all over the world [4,7,11,34,35] based on previous researches, the characteristics of shale oil reservoirs in the Da’an area, and the results from SEM, we classify the reservoir space in Da’an shale oil reservoirs into organic pore, inorganic pore, and micro-fissure according to their origins.

4.2.1. Organic Pore

Types of Organic Pore

For continental deep water shale reservoirs, organic pore mainly refers to the pore formed by the volume shrinkage of organic matter after hydrocarbon generation [35,36]. Compared with high-maturity marine shale, the shale in Da’an area has a lower thermal evolution degree and generates larger hydrocarbon molecules, so the organic matter pores in the shale are smaller in number and irregular in shape. K2qn1 member in Well A of Da’an area has two types of organic matter, i.e., migratory organic matter (bitumen) and primary organic matter (kerogen).
Migratory organic matter pores most commonly seen in shale samples are formed by the degradation of bitumen (petroleum) adsorbed to clay minerals or filling between mineral particles [37]. These pores are in circle, triangle, and polygon shapes and 20–200 nm in diameter (Figure 4a).
Primary organic matter is the original kerogen retained in-situ during hydrocarbon generation and evolution [33]. The shale samples of the Da’an area have few primary organic matter pores and cannot form foamy clusters. However, they may have some organic matter pores at the edge between organic matter and inorganic minerals, which are mainly in a narrow slit shape (as shown in Figure 4b) and less than 10 nm in diameter.

Quantitative Characterization of Organic Matter Pores

The N2GA experiment can reflect the size distribution of pores in the shale samples but cannot show the distribution of pores in different components of the shale. By SEM image analysis, on the basis of organic matter and organic matter pore identification, the organic pores were quantitatively characterized [21,38,39,40].
Based on previous research, according to the development characteristics of organic matter pores in shale oil reservoirs of the Da’an area and the results of SEM image analysis, an evaluation model of organic matter porosity was built based on plane porosity from image analysis [14,15,20,41]. Suppose different view fields of a sample have equal or close organic matter plane porosity, then the organic matter porosity of the sample can be approximately expressed as the ratio of total area of organic matter pores to the total area of view fields in the images of the sample.
Φ omp = Φ s   ×   TOC   ×   ρ sh ρ om   ×   100 %
Φ a = 1 n Φ ompn   ×   TOCn 1 n TOCn     ×   100 %
where Φomp is organic matter porosity, %; Φs is organic matter plane porosity, %; TOC is content of organic carbon, %; ρ sh is shale density, g /cm3; ρom is organic matter density, set at 1.2 g/cm3 [41]; Φa is the average organic matter porosity of all samples, %; Φompn is organic matter porosity of the nth image, %; TOCn is the TOC of the nth image, %; n is the number of images, dimensionless.
The calculation results (Table 2) show that shale samples from K2qn1 member of Well A in the Da’an shale oil demonstration area have organic matter porosity between 0.095% and 0.223%, which means the shale samples have averagely developed organic pores. Specifically, shale samples from the Class-I sweet spot section have organic matter porosity between 0.184% and 0.223%, accounting for 2.79–4.02% (3.36% on average) of the total porosity. Shale samples from Class-II sweet spot section have organic matter porosity between 0.122% and 0.170%, accounting for 3.15–3.68% (3.43% on average) of the total porosity. Shale samples from the Class-III non-sweet spot section have organic matter porosity between 0.095% and 0.146%, accounting for 3.9–6.17% (5.03% on average) of the total porosity. In a word, shale samples from Class-I sweet spot section have better developed organic matter pores than those from the Class-II sweet spot section, and shale samples from the Class-III non-sweet spot section are poorest in terms of the development degree of organic matter pores. However, organic matter pores contribute most to the total porosity of shale samples from Class-III non-sweet spot section. The main reason for this is probably that these samples have few inorganic matter pores.

4.2.2. Inorganic Matter Pore

The inorganic matter pore is the pore in inorganic minerals of shale. Observation by SEM shows that shale samples from Well A in the Da’an shale oil demonstration area contain large amounts of inorganic matter pores in various shapes and types. According to their origins, inorganic matter pore can be subdivided into intergranular, intragranular, and intercrystalline pores (Table 3).
Intergranular pores: Sediments have large amounts of micro-sedimentary structures formed during migration, and incomplete cementation between various kinds of grains results in intergranular pores [42]. Intergranular pores mainly occur between different kinds of mineral particles, such as quartz, clay minerals, and pyrite. Intergranular pores in K2qn1 member of the Da’an area are mostly residual, with sizes dependent on the sizes of mineral particles and compaction degree. Sedimentary rocks with small sizes of particles and large amounts of plastic minerals are poor in terms of compaction resistance, so they would lose a large proportion of primary intergranular pores due to compaction during the shallow burial stage and cementation in the later stage, and the residual intergranular pores in them exist between high hardness brittle particles such as quartz ones (Figure 4c).
Intragranular pores mainly include intragranular pores inside clay mineral particles and dissolution pores inside particles. With illite-smectite mixed layer taking dominance in clay minerals of shale layers in the Da’an area (Figure 3b), the intergranular pores are often in narrow slit shape, parallel with bedding, directional, and mostly less than 500 nm in diameter (Figure 4d). Dissolution pores inside particles are secondary pores formed by the dissolution of quartz, feldspar, and carbonate minerals during diagenesis. Dissolution pores inside particles in shale samples from the Da’an area are mostly on the surface or edges of monomer mineral crystals and are formed largely due to feldspar dissolution. They are 200–2000 nm in diameter, mostly in irregular, long strip, and ellipse shapes and turn up in clusters (Figure 4d,e).
Intercrystalline pores mainly include intercrystalline pores in pyrite aggregations and between clay mineral grains. Those in pyrite aggregations are largely in triangle or polygon shapes, occasionally filled by organic matter, and 100–300 μm in size (Figure 4f). Those between clay mineral crystals appear often in illite and illite-smectite mixed layers, in sheet, layer, and fiber shapes, and nearly parallel with the laminar boundary (Figure 4g).

4.2.3. Micro-Fissures

Micro-fissures can not only serve as storage space, but also effectively improve permeability [33,34,43]. According to origins, micro-fissures can be divided into diagenetic type and structural type. Observation by SEM shows shale layers in Da’an area have few micro-fissures.
Diagenetic micro-fissure: This kind of micro-fissure is formed when brittle minerals cannot withstand the overburden pressure and break. These micro-fissures are limited in terms of distribution range and only occur at the edges or inside quartz, and feldspar particles. They are more than 10 μm long and 50–200 μm wide and appear as uneven lines with longer extensions in general (Figure 4h).
Tectonic micro-fissure: This kind of micro-fissure is formed by tectonic disruption. Tensional micro-fissures with a certain directionality of this type are often filled by calcite and quartz, in network or polygonal line shape, and more than 5 nm long and 20–500 μm wide (Figure 4i). As the Da’an area is stable tectonically, tectonic micro-fissures are under-developed in this area.

4.3. Features of Pore Structure

Shale samples from K2qn1 member of Well A in the Da’an shale oil demonstration area have total porosity of 3.4–8.4%, 5.7% on average, and matrix permeability of (0.071–0.093) × 10−3μm2, 0.083 × 10⁻³μm2 on average. To characterize pore structure features of different sweet spot sections, the N2GA experiment was conducted.

4.3.1. Features of Pore Sizes

According to adsorption and agglomeration theory, the N2GA hysteresis loop can reflect the shapes of pores in the shale. IUPAC (International Union of Pure and Applied Chemistry) divide hysteresis loops into four types: H1, H2, H3, and H4 [44,45]. Hysteresis loops of shale samples from Well A in the Da’an shale oil demonstration area are mainly H2 and H4 types (Figure 5).
Shale samples from the Class-III non-sweet spot section have largely H4 type hysteresis loops (Figure 5). This type of sample has a smaller hysteresis loop, adsorption curve similar with H2 type, and desorption curve almost parallel with the adsorption curve without obvious reflection points, forming a smaller hysteresis loop, indicating this type of sample has abundant narrow-fissure type pores. Pores in these samples have one subtle size peak at 2–3nm, suggesting these samples have high proportions of micro-pore and small pores not conducive to the storage of shale oil in free state, so these samples are poor in terms of pore structure.
Shale samples from the Class-I and Class-II sweet spot sections have mainly wide H2 type hysteresis loops (Figure 5). They have hysteresis loops occurring when the relative pressure is less than 0.5 abd adsorption curves rising gradually with the increase of relative pressure. At the relative pressure of more than 0.82, they increase rapidly in terms of adsorptive capacity, forming a desorption plateau. At the relative pressure of about 0.5, their desorption curves fall rapidly, forming obvious hysteresis loops, suggesting this kind of reservoir has mainly bottle-like pores with narrow neck and wide body. Sizes of pores in these samples have two peaks at about 3 nm and 7 nm, showing these samples have higher contents of small pores of 16 × 10−3μm2. However, samples from the Class-I sweet spot section have slightly higher small pore volumes than those from the Class-II sweet spot section.

4.3.2. Quantitative Characterization of Pore Structure

Pore volume, pore surface area, and average pore diameter were obtained through N2GA analysis [46] and the pore structure parameters of different sweet spot sections were summarized (Figure 5 and Table 4).
Shale samples from the Class-I sweet spot section have a BET (Brunauer–Emmett–Teller) pore surface area of 3.8974–7.2049 m2/g, 4.5645m2/g on average, and BJH (Barret–Johner–Halenda) single pore volume of (7.45–16.78) × 10−3μm2, 11.26 × 10⁻³μm2 on average. Generally, the larger the pore volume of shale, the larger the pore surface area of the shale will be. In other words, the two have a positive correlation [47]. These samples have pore sizes of 4.22–13.45 nm, 8.01 nm on average; highest contents of small pores (40.45–50.65%, 45.28% on average); micro-pores in second place (30.65–40.54%, 32.26% on average), and lowest content of mesopores (10.45–30.57%, 22.46% on average).
Shale samples from the Class-II sweet spot section have pore structure parameters slightly poorer than those from the Class-I sweet spot section, BET surface area of 3.8933–6.1624 m2/g, 4.0424 m2/g on average, and total pore volume of (7.45–16.78) × 10−3μm2, 10.36 × 10⁻³μm2 on average; average pore size of 4.00-12.55nm, 6.68nm on average; higher contents of micro-pores (40.32% on average), small pores (43.44% on average), and lowest content of mesopores (5.74–31.21%, 16.24% on average).
Shale samples from the Class-III non-sweet spot section have the smallest BET surface area 1.2514m2/g (1.0372–1.2668 m2/g) and total pore volume of 5.82 × 10⁻³μm2 (5.46–6.86 × 10⁻³μm2), smallest average pore size (2.16–7.86 nm, 4.21 nm on average), highest contents of micro-pores (29.65–84.21%, 55.42% on average), lower proportions of small pores (16.87–48.68%, 28.60% on average), and lower proportions of mesopores (5.29–36.12%, 15.98% on average).
Shale oil mainly exists in the adsorption state in micro-pores and free state in mesopores. The larger the surface area of the shale, the larger the amount of oil adsorbed will be. The larger the average pore diameter, the lower the ratio of adsorption oil and the higher the free oil will be [34,48]. In conclusion, the Class-I sweet spot section with the largest surface area of pores and largest average pore diameter has the most oil in free state and better pore structure. The Class-II sweet spot section with a higher ratio of micro-pores has mainly adsorption oil and is not conducive to the storage and flow of shale oil. The Class-III reservoir with the poorest pore structure, smaller average pore diameter, and higher ratio pf micro-pores has the poorest storage capacity and oil mobility

5. Discussion

5.1. Pore Structure Differences between Marine and Lacustrine Shales

The pore structure of shale reservoir is the main space for the occurrence of shale oil and has an important influence on the enrichment of shale oil [44,45]. To better understand the characteristics and controlling factors of continental lacustrine shale oil reservoirs in the southern Songliao Basin, the continental lacustrine shale oil reservoirs in the southern Songliao Basin were compared with the typical marine shale of the Longmaxi Formation in the Changning area of Sichuan Basin [14]. The marine Longmaxi Formation shale depositing in a shelf sedimentary environment is large in thickness and stable in distribution, and is characterized by high organic matter abundance, high thermal evolution degree, high brittle mineral content, and type I and II1 kerogens. It has organic micro-cracks, intergranular pores, and intragranular pores of inorganic minerals in good connectivity as a storage space [14,20,42,43].
Comparative analysis shows (Figure 6) that, for the samples with similar TOC contents, the mesopores of the marine Longmaxi Formation shale sample have much larger envelope areas than those in lacustrine K2qn1 Formation shale sample, indicating that mesopores make a greater contribution to the porosity of marine shale than to the porosity of lacustrine shale, and that marine shale is more developed in mesopores than continental shale. It is worth noting that the peak of micro-pores of the marine shale goes up significantly with the increase of total organic carbon (TOC) content, but the micro-pores in the lacustrine shale did not show a similar trend. This suggests that the micropores in the marine shale mainly come from organic matter, while the micropores in lacustrine shale are mainly affected by mineral components other than organic matter. The marine and lacustrine shale samples have no significant changes in terms of mesopore and macropore proportions with the increase of TOC content, indicating that the mesopores and macropores are more affected by mineral components. In conclusion, marine and lacustrine shales are significantly different in terms of pore structure, and the characteristics of the lacustrine shale pore structure are more influenced by mineral components.

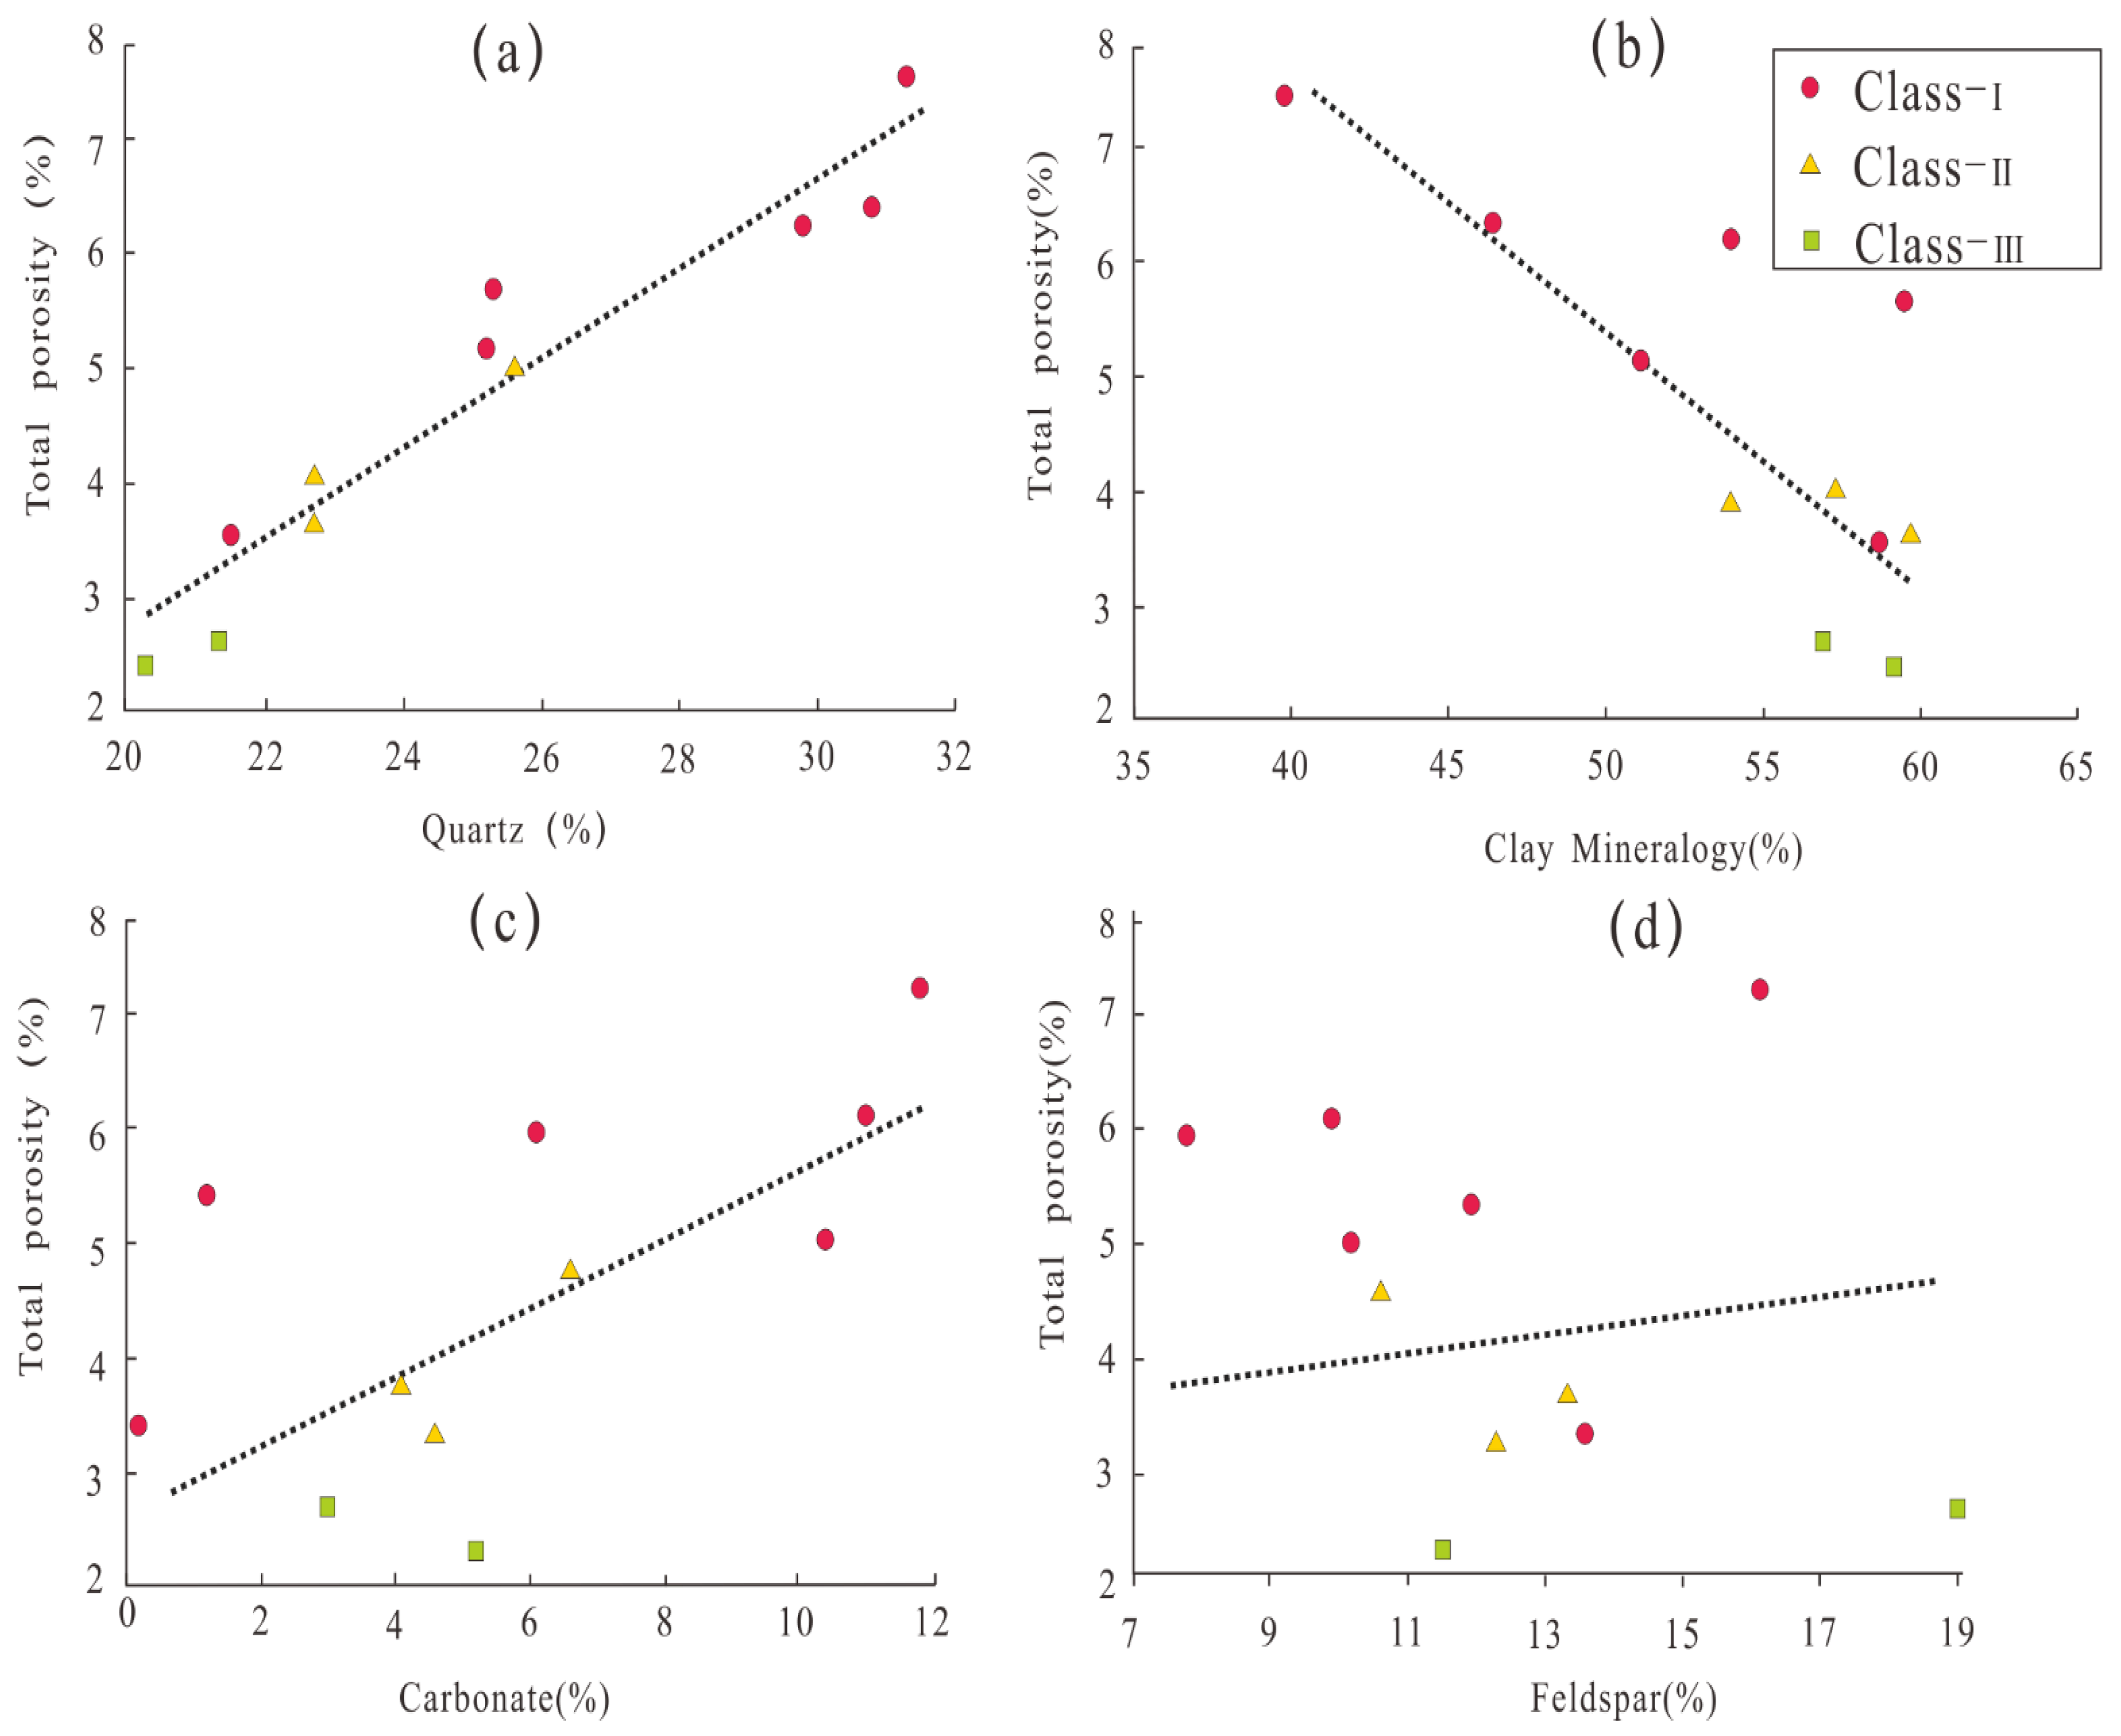
5.2. Effects of Mineral Components on Reservoir Quality

Mineral components determine the types and structure of pores in shale [49,50]. For the K2qn1 member shale oil reservoir in Well A of the Da’an shale oil demonstration area, southern Songliao Basin, the contents of mineral components have some correlation with total porosity (Figure 7).

5.2.1. Quartz

It can be seen from the cross-plot of quartz content and total porosity that the quartz content is in positive correlation with total porosity (Figure 7a). The higher the quartz content, the higher the porosity, indicating that quartz is conducive to the preservation of pores. This also implies the Class-I sweet spot section is better in terms of quality than Class-II and III sweet spot sections. Quartz is hard and not easily compacted physically, so pores between quartz grains can be better preserved. This is also corroborated by rich intergranular pores in the shale samples from SEM observation (Figure 4i).

5.2.2. Clay Minerals

The content of clay minerals is in obviously negative correlation with the total porosity (Figure 7b), suggesting that clay minerals are one of the factors hindering the development of pores. The K2qn1 member in Da’an area has mainly clay minerals, such as illite-smectite mixed layer and illite. With better plasticity, the illite-smectite mixed layer and illite are susceptible to compaction, resulting in the under-development of nano-pores in them. Moreover, the clay mineral particles are often filled by calcite, dolomite, and these carbonate minerals have no nano-pores, so the nano-pores in the clay minerals are not continuous, effectively sealing and blocking oil in the nano-scale reservoir with clay minerals as main carriers.

5.2.3. Carbonate Minerals

Carbonate minerals constitute another factor affecting total porosity of the shale. It can be seen from the relationship between carbonate mineral content and total porosity (Figure 7c) that a high carbonate mineral content is conducive to the preservation of pores. As the K2qn1 member in Well A of Da’an area is at the shallow-medium burial depth of 1700–2070 m, the compaction and cementation are not very strong, and the cementation of carbonate minerals occurs in the early diagenetic stage. The cementation can preserve the intergranular volume and provide material basis for the later dissolution. This is constructive to the formation and preservation of reservoir space.

5.2.4. Feldspar Minerals

It is commonly believed that the higher the feldspar content and the stronger the dissolution, the more secondary pores will be produced [51]. However, we can see from the cross-plot of feldspar content and total porosity of shale samples from Well A in the Da’an area that the feldspar content has a weak positive correlation with total porosity (Figure 7d). Statistics of feldspar content (Figure 3a) show that the samples have feldspar contents between 7.8% and 19%. Observation under microscope shows the samples only have dissolution pores in local parts (Figure 7d), and the dissolution pores, and secondary pores are mostly filled by carbonate minerals. The carbonate minerals plug the pores by cementation, inhibiting the development of pores in the shale to some extent. Therefore, feldspar content has little impact on the properties of shale reservoirs in the Da’an area.

5.3. Effect of TOC on Organic Matter Pore

So far, the understanding on the effect of TOC on organic matter pores has been consistent. TOC plays an important role in promoting the development of organic matter pores [35]. The cross-plot of TOC and organic matter porosity of shale samples from Well A in the Da’an area (Figure 8a) shows Class-I shale samples have TOC and organic matter porosity higher than Class-II and III shale samples, indicating that higher TOC is conducive to the development of organic matter pores.
However, analyzing the relationship between TOC and the size of organic matter pores, we found that with the increase of TOC, the size of organic pore decreases (Figure 8b). Especially for the Class-I sweet spot and Class-III non-sweet spot section, the pore size becomes noticeably smaller with the increase of TOC. This is probably because compaction and abnormal pressure during hydrocarbon generation [52,53] make the organic pores cave in at edges and thus close or shrink, not only resulting in the reduction of organic matter porosity, but also the reduction of pore size.

5.4. Effects of Diagenetic Processes on Reservoir Quality

For any reservoir in petroliferous basins, regardless of clastic rock, carbonate, or shale, diagenetic processes are one of the key factors controlling porosity and permeability [23,54,55,56,57]. The K2qn1 member in Well A of the Da’an area, at the medium burial depth of 1700–2070m, has experienced compaction, carbonate cementation, dissolution of feldspar and carbonates, reaction and transformation of clay minerals, and recrystallization of calcite etc., all diagenetic processes. Among these diagenetic processes, compaction, cementation, and dissolution have significant impacts on the development and later reformation of the shale reservoir space and are crucial diagenetic processes controlling its formation and development (Figure 9).

5.4.1. Compaction

Through in-depth analysis of the relationships between the total porosity and depth of different sweet spot sections, we found that compaction has a destructive effect on the reservoir space. Our data show that with the depth increase of 20 m, the Class-III non-sweet spot section and Class-II and Class-I sweet spot sections have porosity reductions of 0.10%, 0.38%, and 1.28%, respectively, indicating that compaction has a destructive impact on reservoir space. Shale samples from Class-I sweet spot section fall first and then rise in total porosity with the increase of depth. On the whole, during compaction, shale reduces in term of total porosity with the increase of overburden pressure (burial depth).

5.4.2. Cementation

In general, in cementation, cements fill the pore space, making the reservoir densify, but analysis of the relationship between carbonate mineral content and porosity shows that carbonate cementation may have a positive effect on the final reservoir (Figure 7). On one hand, with shallow burial depths, reservoirs in the Da’an area have suffered weak compaction and cementation. Carbonate cements formed early can help preserve intergranular pores, as being more compact in structure, they can resist compaction. On the other hand, they can provide a material basis for later dissolution.

5.4.3. Dissolution

We can see from the relationships between total porosity and the depth of different types of reservoirs in the Da’an area, southern Songliao Basin (Figure 9), that there is a significant total porosity increase between the Class-III non-sweet spot section and Class-II sweet spot section, between the Class-II sweet spot section and Class-I sweet spot section, and inside the Class-I sweet spot section. Through mineral composition and SEM analyses of samples from Well A, we think that dissolution makes a great contribution to the increase of pores in the shale oil reservoirs. The dissolution mainly occurs at the edges and inside feldspar, calcite, and dolomite crystals. Acid fluids flowed along micro-fissures formed by calcite recrystallization (Figure 9), making the diagenetic fluid flow smooth, forming a spatial fracture network, and improving reservoir quality.

6. Conclusions

(1)
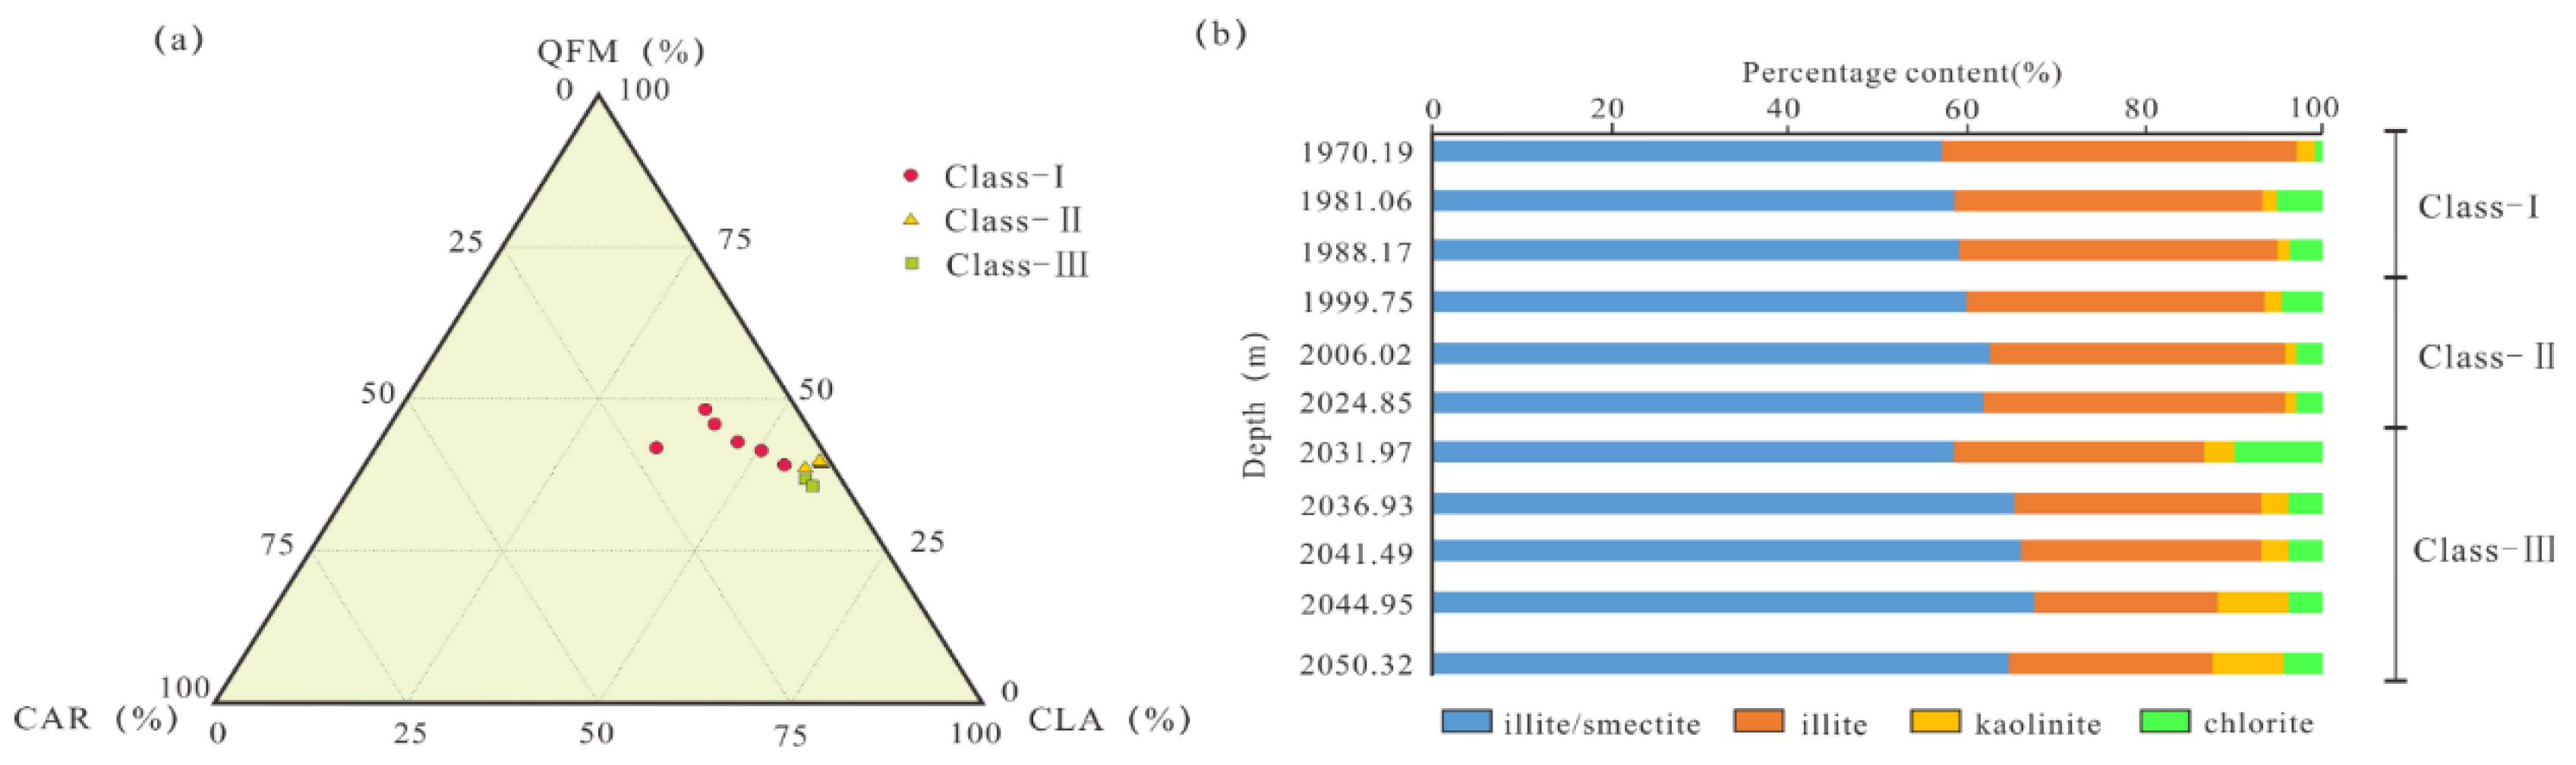
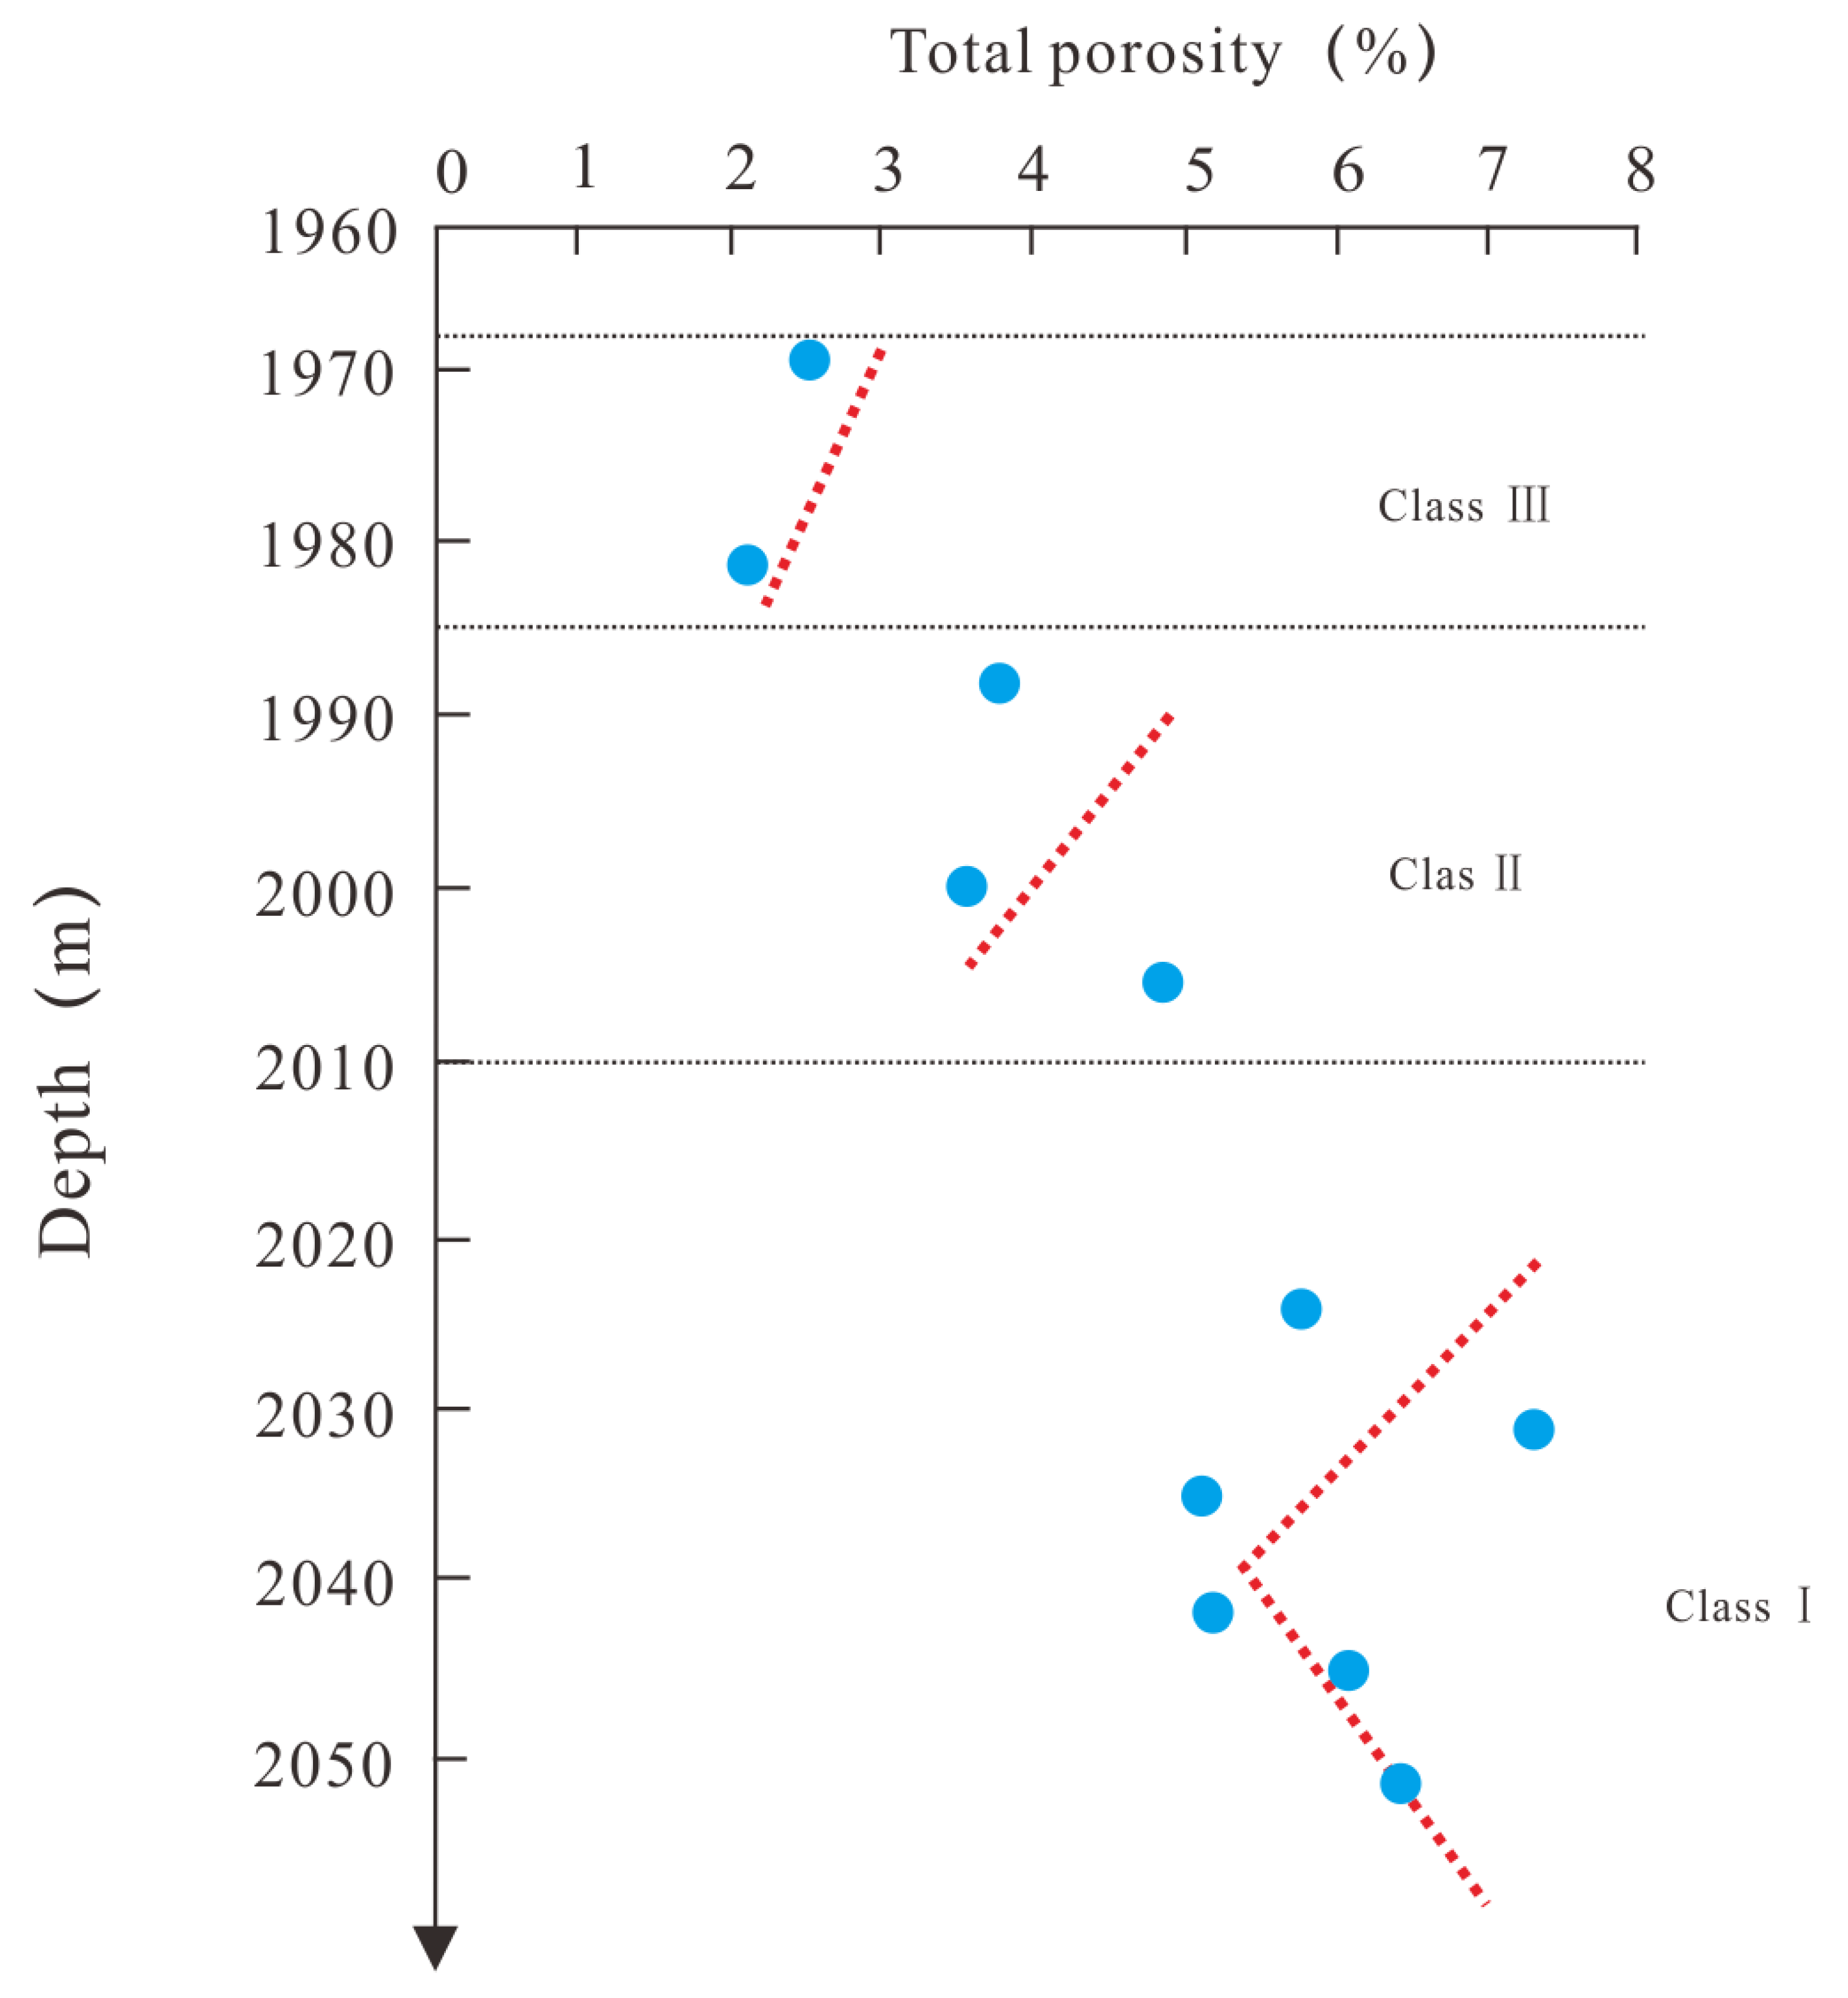
Shale samples from the Class-I sweet spot section in K2qn1 Member of the Da’an area, southern Songliao Basin are mainly made up of silica-bearing clayey hybrid shale and are characterized by high contents of siliceous and carbonate minerals and low content of clay minerals. Shale samples from the Class-II sweet spot section and Class-III reservoir have higher contents of clay minerals and are silica-bearing clayey shale. The clay minerals in the shale samples mainly consist of illite-smectite mixed layer and illite. Besides, they also contain a small amount of chlorite, indicating that the K2qn1 Member in this area has ended early diagenesis and is in the late episode of the middle diagenesis B stage.
(2)
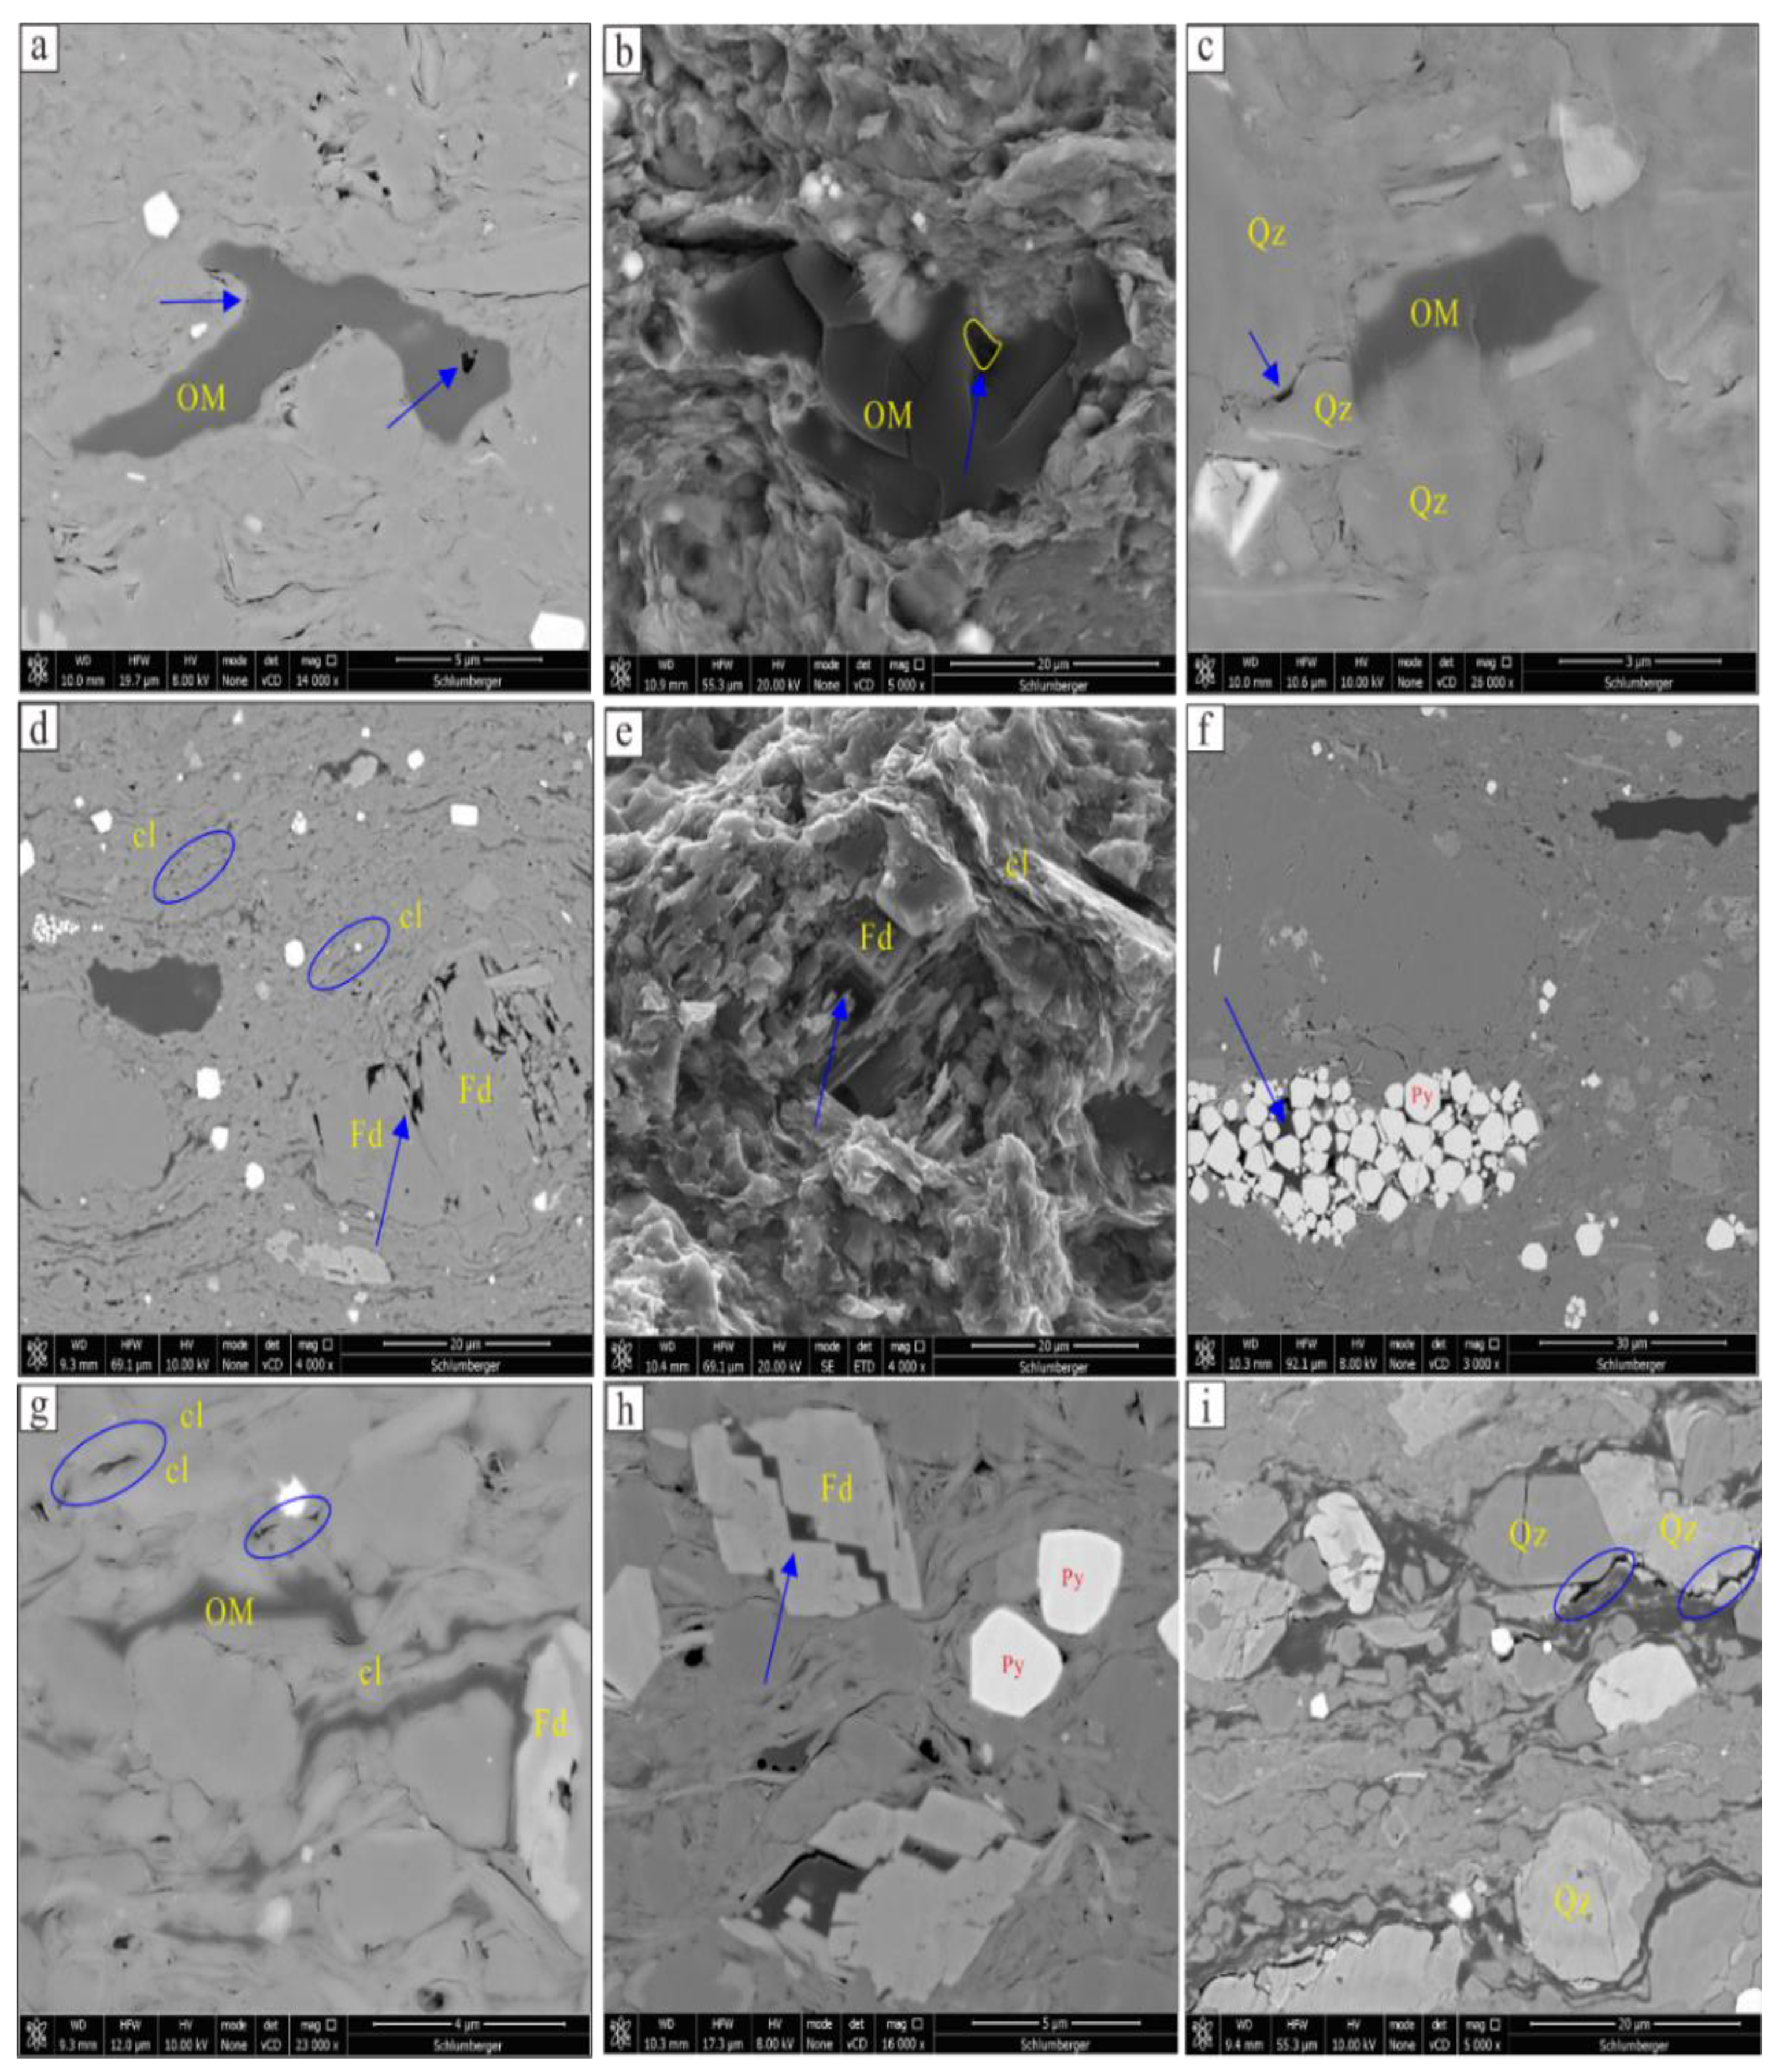
The reservoir space in K2qn1 Member shale of this area includes organic matter pores, inorganic matter pores, and micro-fissures. The shale samples from Class-I and II sweet spot sections have mainly inorganic pores, in which residual intergranular pores and intragranular dissolve pores take dominance. Shale samples from the Class-III non-sweet spot section have the highest clay mineral contents, the poorest anti-compaction capacity, mainly organic matter pores, and lower total pore volume. Shale samples from the Class-I sweet spot section have more organic pores than those from the Class-II sweet spot section. Shale samples from the Class-III non-sweet spot section have the lowest development degree of organic matter pore, but organic matter pores make the greatest contribution to the total porosity of these samples.
(3)
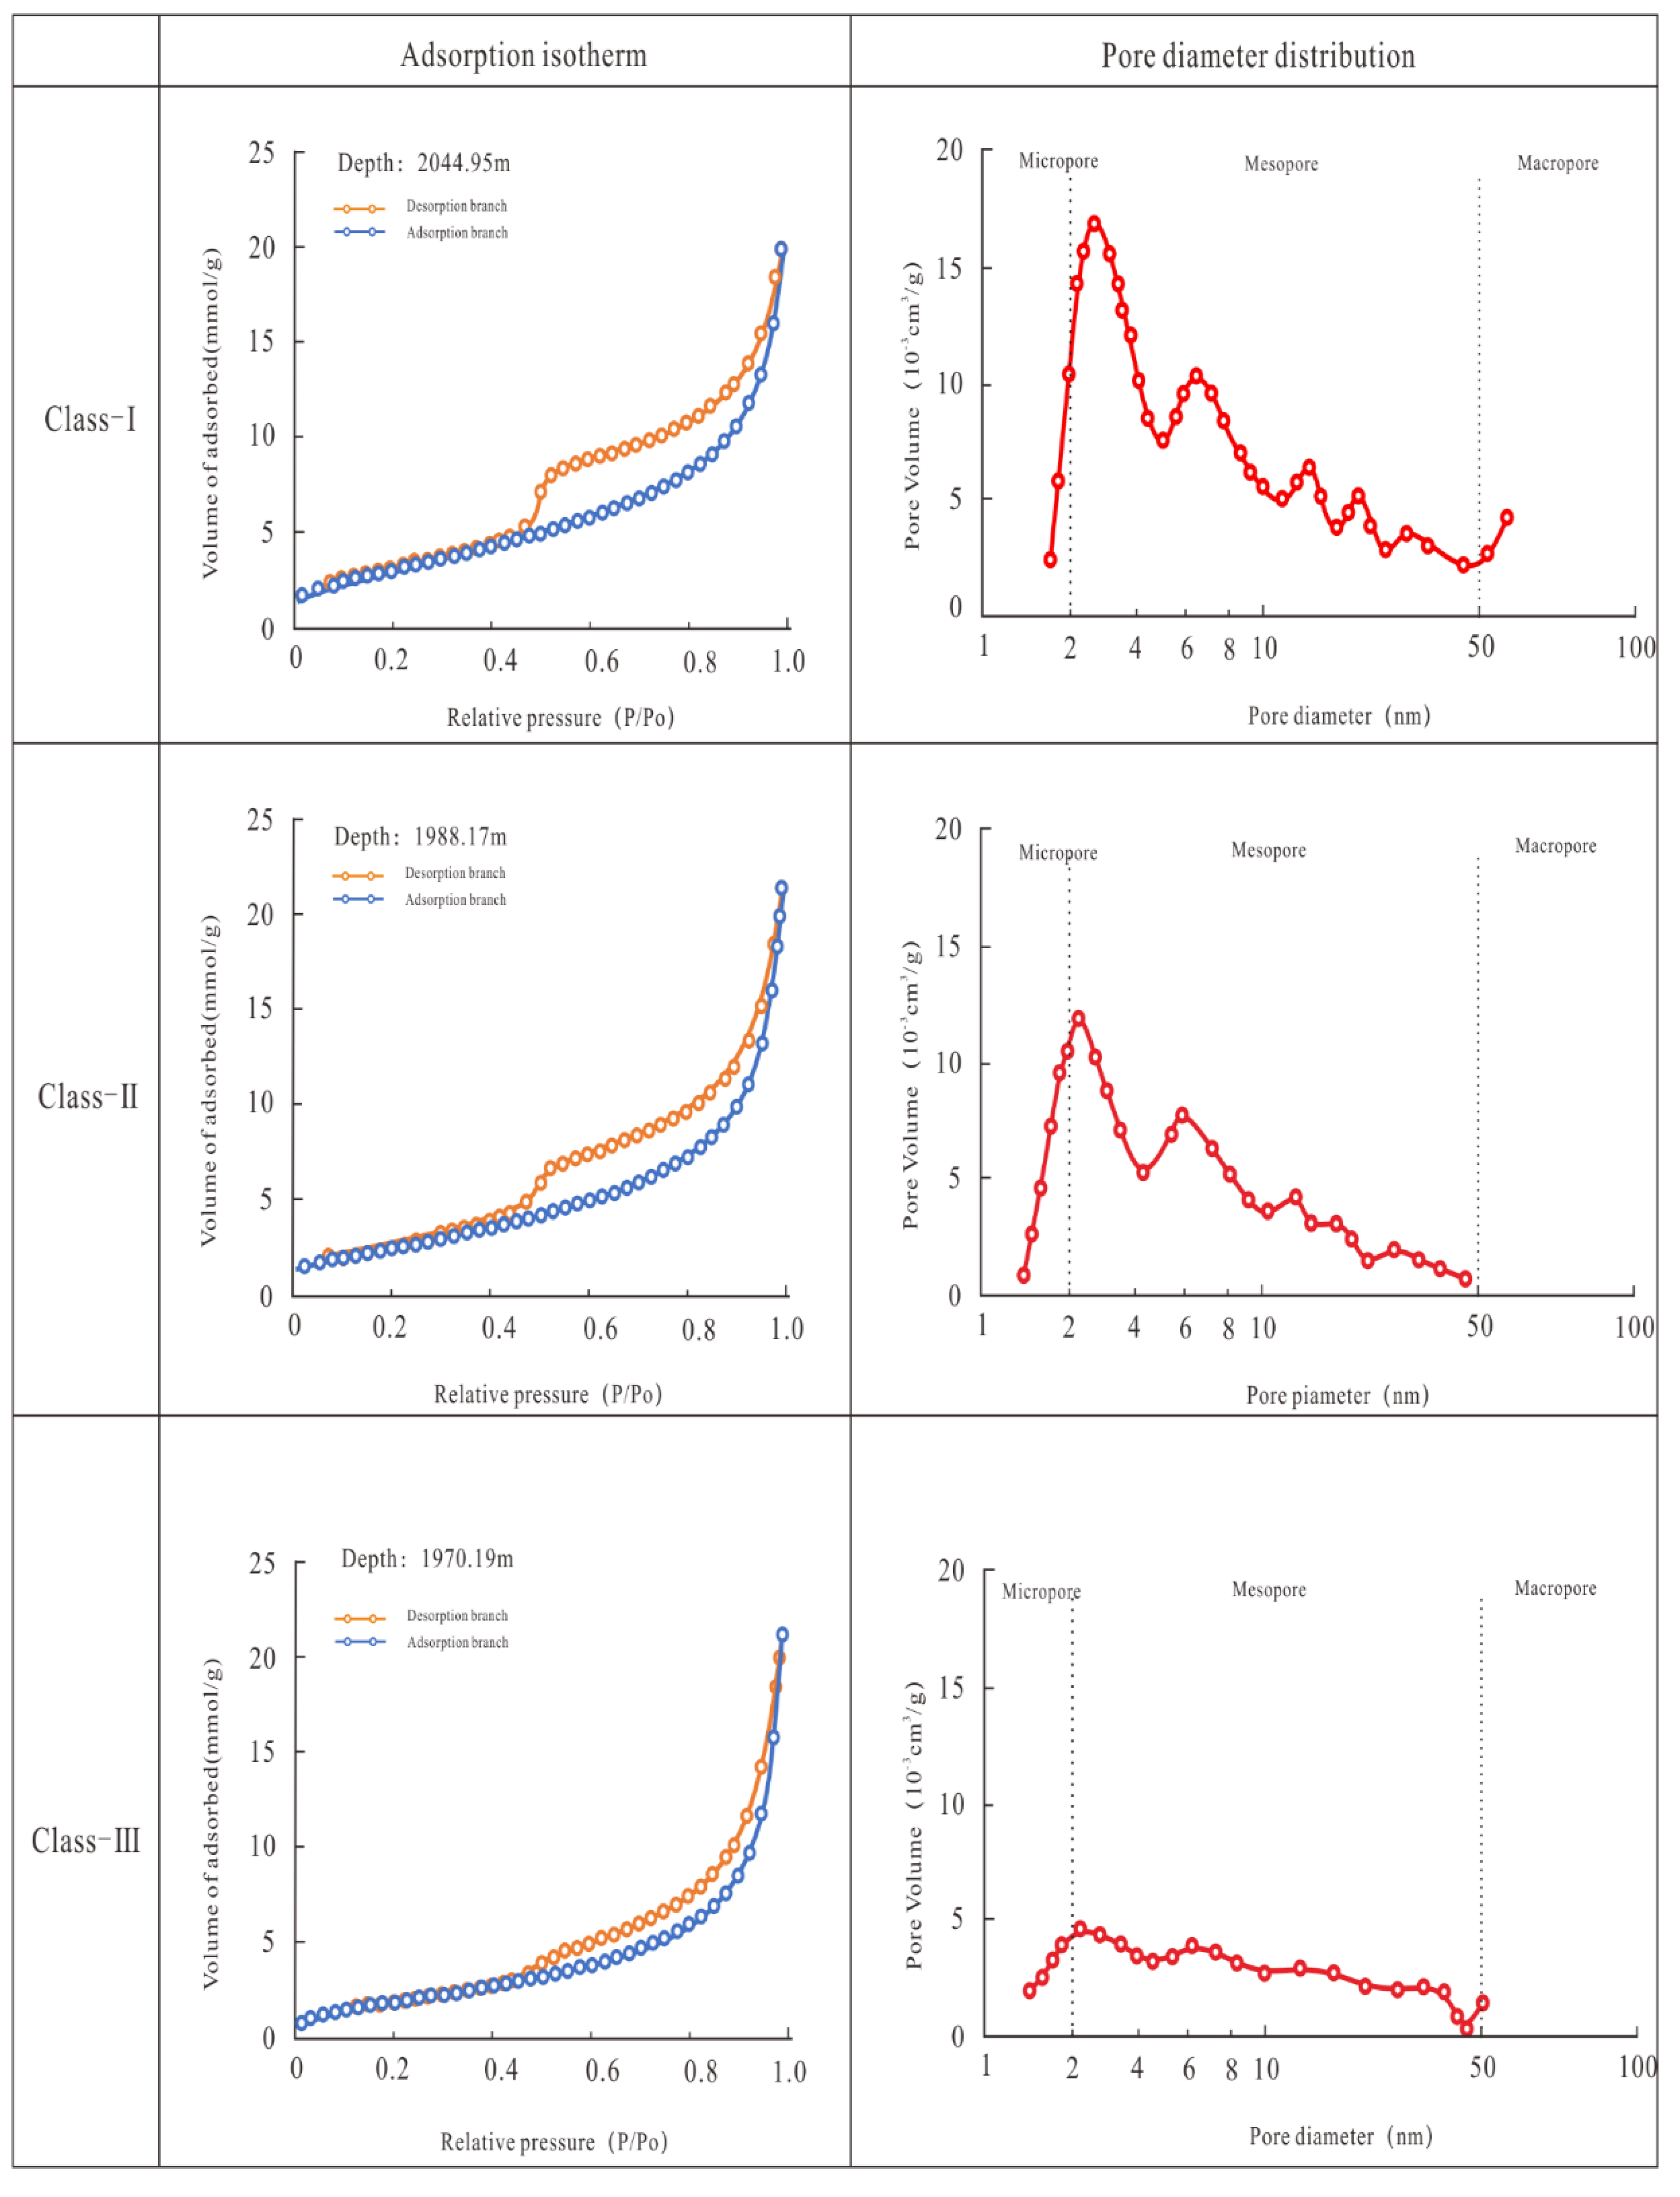
Shale samples from K2qn1 Member have mainly H2 and H4 types of N2GA hysteresis loops. Shale samples from Class-I and II sweet spot sections have largely H2 type hysteresis loops, while those from Class-III non-sweet spot section have mostly H4 type hysteresis loops. That means high quality shale reservoirs have much larger pore volumes than poor quality shale reservoirs.
(4)
The pore structures of marine shale and lacustrine shale are obviously different, and the development characteristics of lacustrine shale pore structures are more influenced by mineral components.
(5)
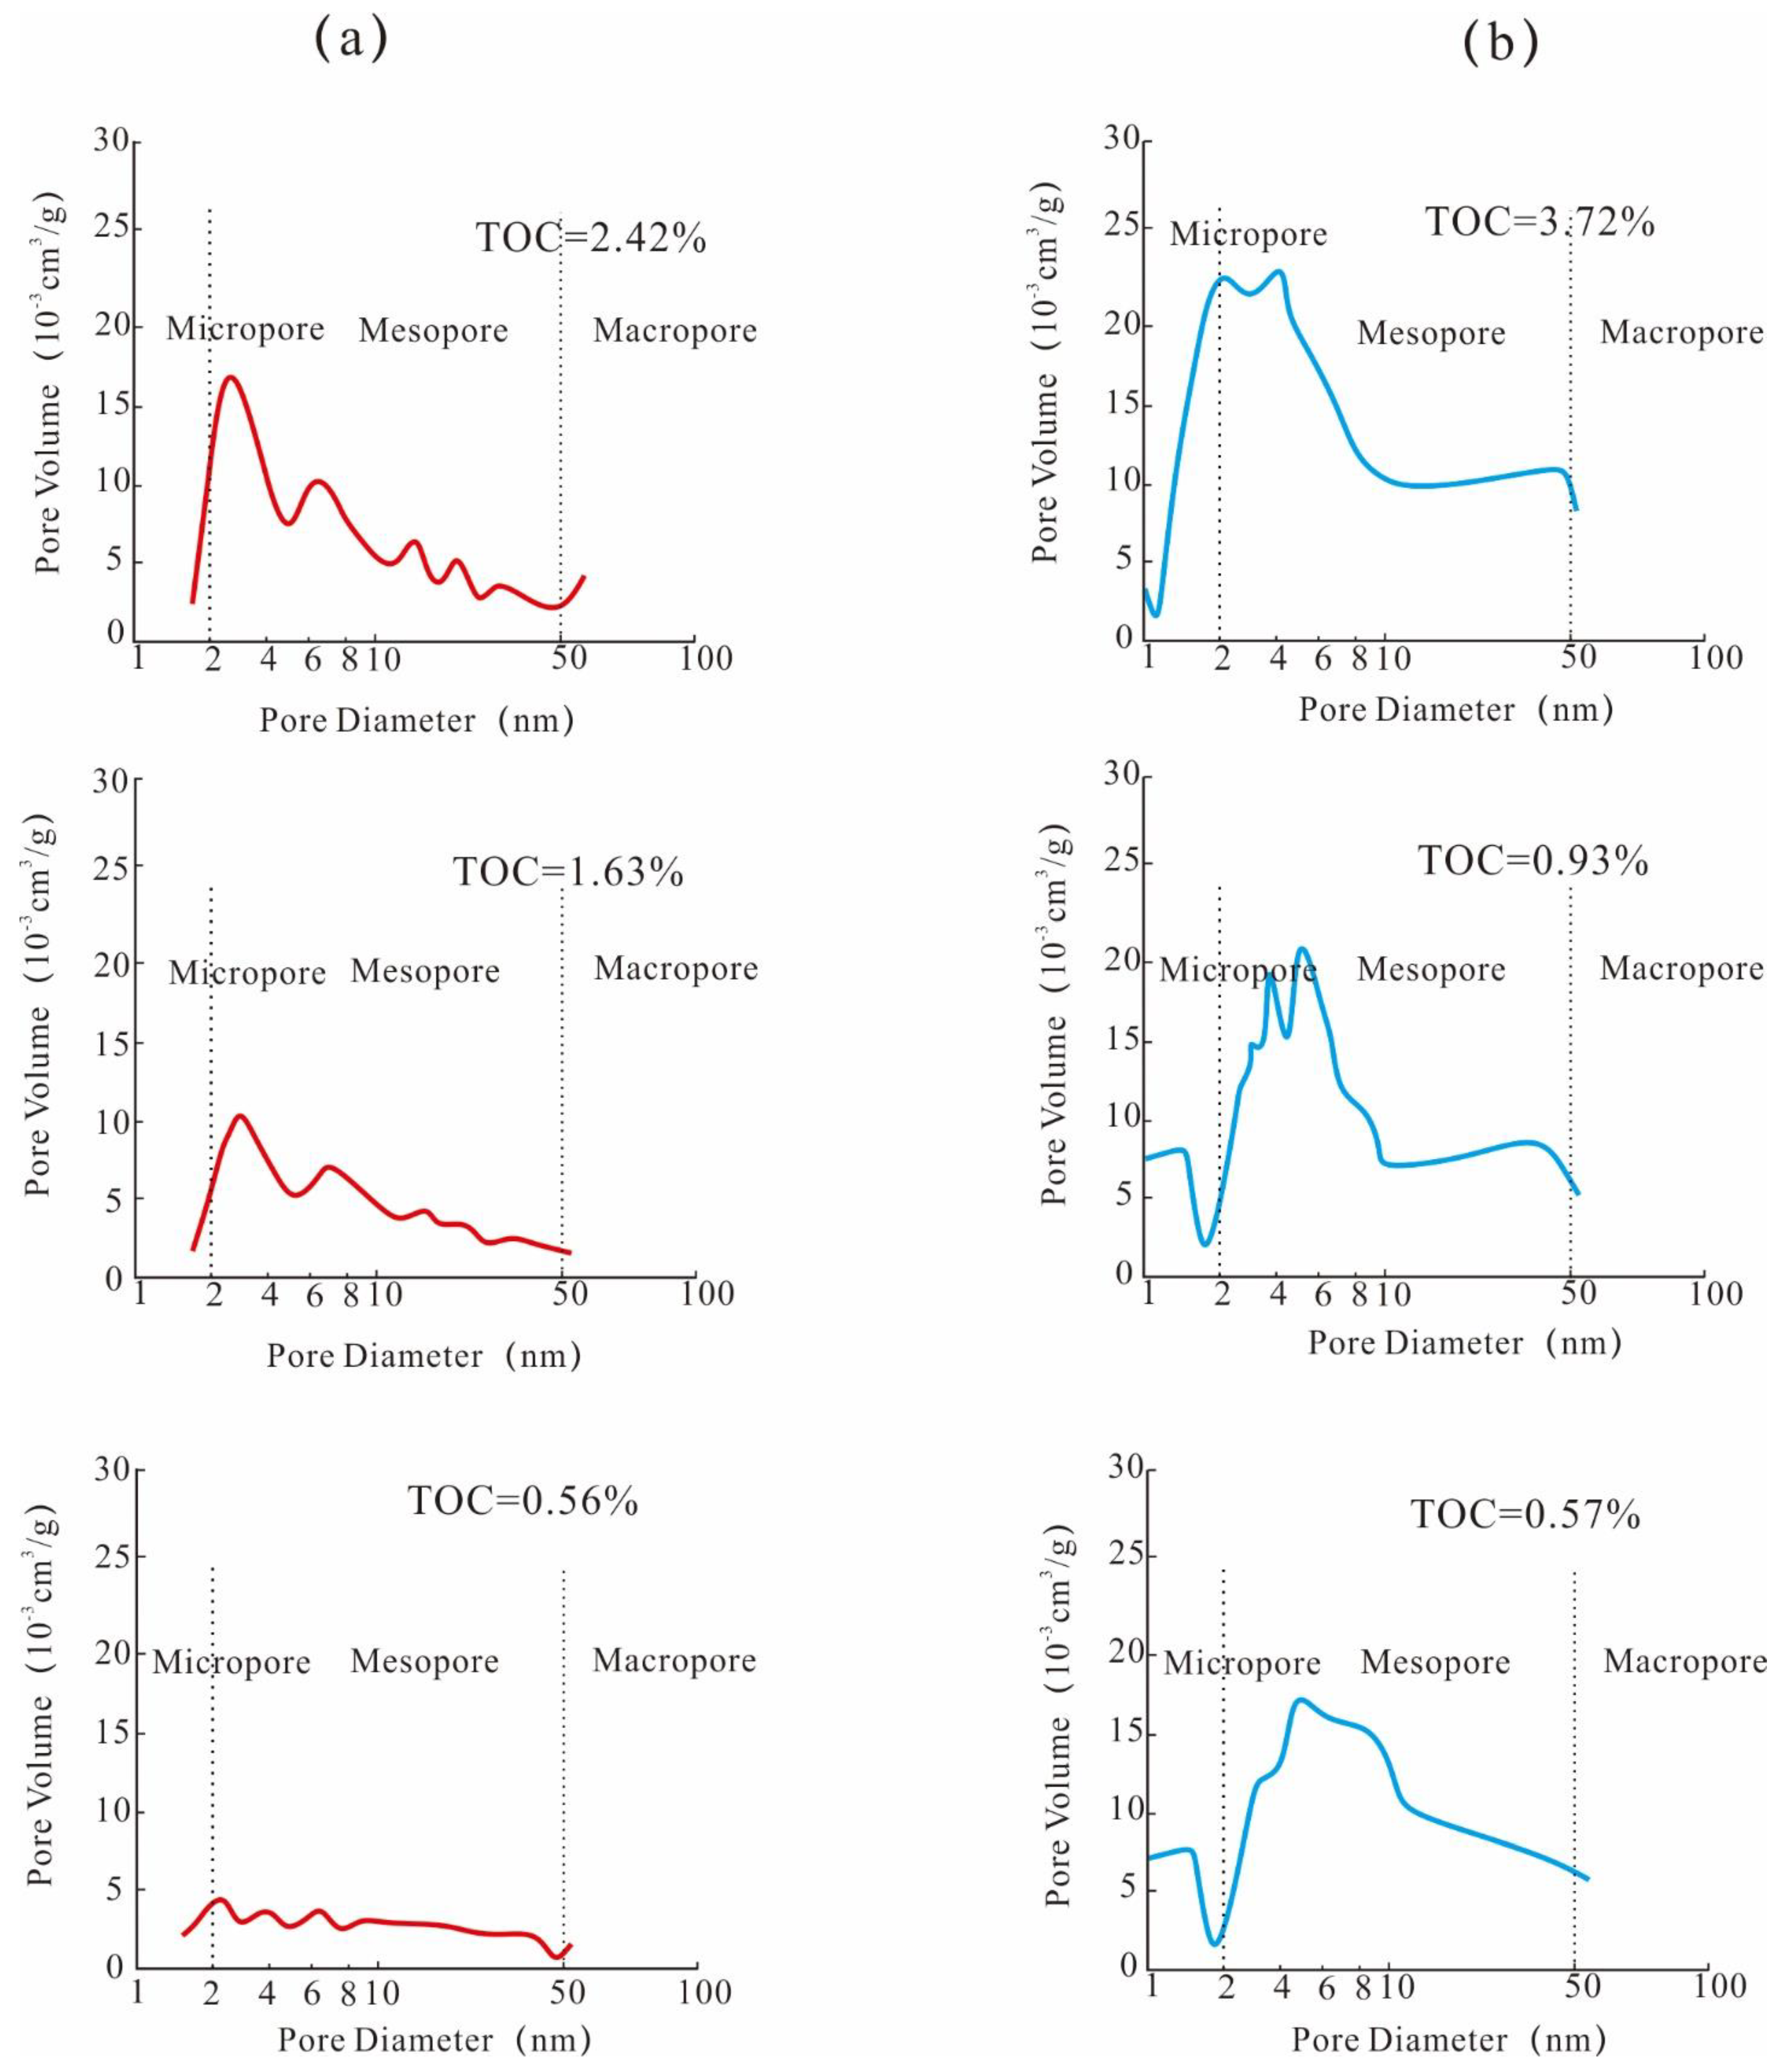
The main factors controlling the shale oil reservoirs in K2qn1 Member of the Da’an shale oil demonstration area are mineral composition, TOC, and diagenesis of the shale. Quartz and carbonate minerals are conducive to the formation of a high-quality reservoir, while clay minerals have a negative impact on reservoir quality. TOC is the material base and main control factor for the formation of organic matter pore, but the higher the TOC, the smaller the size of organic matter pore will be. Compaction has a destructive effect on the reservoir, while dissolution has a constructive effect.

Author Contributions

Conceptualization, Z.L. and Z.B.; methodology, Z.B. and L.L.; software, Z.W. and W.Z.; validation, H.W. and L.L.; formal analysis, W.D., Z.S., F.W., and W.T.; writing—original draft preparation, Z.L. and Z.B.; writing—review and editing, Z.B. and L.L. All authors have read and agreed to the published version of the manuscript.

Funding

Authors thank the supports from PETROCHINA (Grant Nos. 2021DJ0203, 2021DJ0205, 2021DJ2207).

Institutional Review Board Statement

Not applicable.

Informed Consent Statement

Not applicable.

Data Availability Statement

Data available from the authors upon request.

Acknowledgments

The authors would like to express their gratitude to the PetroChina Jilin Oilfield Company for providing the resources required to collect the samples used in this study. We also acknowledge the precious advice of the editors and reviewers.

Conflicts of Interest

The authors declare no conflict of interest.

References

  1. Guilera, R. Flow units: From conventional to tight-gas to shale-gas to tight-oil to shale-oil reservoirs. SPE Reserv. Eval. Eng. 2014, 17, 190–208. [Google Scholar] [CrossRef]
  2. Zhao, W.; Hu, S.; Hou, L.; Yang, T.; Li, X.; Guo, B.; Yang, Z. Types and resource potential of continental shale oil in China and its boundary with tight oil. Pet. Explor. Dev. 2020, 47, 1–11. [Google Scholar] [CrossRef]
  3. Zou, C.; Yang, Z.; Cui, J.; Zhu, R.; Hou, L.; Tao, S.; Yuan, X.; Wu, S.; Lin, S.; Wang, L.; et al. Formation mechanism, geological characteristics and development strategy of nonmarine shale oil in China. Pet. Explor. Dev. 2013, 40, 15–27. [Google Scholar] [CrossRef]
  4. Jarvie, D.M. . Shale Resource Systems for Oil and Gas: Part 2—Shale-oil Resource Systems. In Shale Reservoirs—Giant Resources for the 21st Century; Breyer, J.A., Ed.; AAPG Memoir; American Association of Petroleum Geologists: Tulsa, OK, USA, 2012; Volume 97, pp. 89–119. [Google Scholar] [CrossRef]
  5. Altun, N.E.; Hicyilmaz, C.; Hwang, J.-Y.; BaǦci, A.S.; Kök, M.V. Oil shales in the world and turkey; reserves, current situation and future prospects: A review. Oil Shale 2006, 23, 211–227. [Google Scholar]
  6. Zhang, L.; Zhao, Q.; Peng, S.; Qiu, Z.; Feng, C.; Zhang, Q.; Wang, Y.; Dong, D.; Zhou, S. Paleoenvironment and Organic Matter Accumulation Mechanism of Marine–Continental Transitional Shales: Outcrop Characterizations of the Carboniferous–Permian Strata, Ordos Basin, North China. Energies 2021, 14, 7445. [Google Scholar] [CrossRef]
  7. Zha, X.; Lai, F.; Gao, X.; Gao, Y.; Jiang, N.; Luo, L.; Li, Y.; Wang, J.; Peng, S.; Luo, X.; et al. Characteristics and Genetic Mechanism of Pore Throat Structure of Shale Oil Reservoir in Saline Lake—A Case Study of Shale Oil of the Lucaogou Formation in Jimsar Sag, Junggar Basin. Energies 2021, 14, 8450. [Google Scholar] [CrossRef]
  8. Jia, C.; Zou, C.; Yang, Z.; Zhu, R.; Chen, Z.; Zhang, B.; Jiang, L. Significant progress of continental petroleum geological theory in basins of Central and Western China. Pet. Explor. Dev. 2018, 45, 573–588. [Google Scholar] [CrossRef]
  9. Liu, B.; Bai, L.; Chi, Y.; Jia, R.; Fu, X.; Yang, L. Geochemical characterization and quantitative evaluation of shale oil reservoir by two-dimensional nuclear magnetic resonance and quantitative grain fluorescence on extract: A case study from the Qingshankou Formation in Southern Songliao Basin, northeast China. Mar. Pet. Geol. 2019, 109, 561–573. [Google Scholar] [CrossRef]
  10. Liu, B.; Sun, J.; Zhang, Y.; He, J.; Fu, X.; Yang, L.; Xing, J.; Zhao, X. Reservoir space and enrichment model of shale oil in the first member of Cretaceous Qingshankou Formation in the Changling Sag, southern Songliao Basin, NE China. Pet. Explor. Dev. 2021, 48, 608–624. [Google Scholar] [CrossRef]
  11. Pollastro, R.M.; Jarvie, D.M.; Hill, R.J.; Adams, C.W. Geologic framework of the Mississippian Barnett Shale, Barnett-Paleozoic total petroleum system, Bend arch–Fort Worth Basin, Texas. AAPG Bull. 2007, 91, 405–436. [Google Scholar] [CrossRef]
  12. Walls, J.D.; Diaz, E.; Derzhi, N.; Grader, A.; Dvorkin, J.; Arredondo, S.; Carpio, G.; Sinclair, S. Eagle Ford Shale Reservoir Properties from Digital Rock Physics. First Break 2011, 29, 6. [Google Scholar] [CrossRef]
  13. Adeyilola, A.; Nordeng, S.; Onwumelu, C.; Nwachukwu, F.; Gentzis, T. Geochemical, petrographic and petrophysical characterization of the Lower Bakken Shale, Divide County, North Dakota. Int. J. Coal Geol. 2020, 224, 103477. [Google Scholar] [CrossRef]
  14. Cai, S.; Xiao, Q.; Zhu, W.; Zhu, H.; Chen, J.; Chen, Q.; Jiang, X. Shale Reservoir Characteristics and Main Controlling Factors of Longmaxi Formation, Southern Sichuan Basin. Acta Sedimentol. Sin. 2021, 39, 1100–1110. [Google Scholar]
  15. Chalmers, G.R.; Bustin, R.M.; Power, I.M. Characterization of gas shale pore systems by porosimetry, pycnometry, surface area, and field emission scanning electron microscopy/transmission electron microscopy image analyses: Examples from the Barnett, Woodford, Haynesville, Marcellus, and Doig units. AAPG Bull. 2012, 96, 1099–1119. [Google Scholar] [CrossRef]
  16. Curtis, M.E.; Sondergeld, C.H.; Ambrose, R.J.; Rai, C.S. Microstructural investigation of gas shales in two and three dimensions using nanometer-scale resolution imaging Microstructure of Gas Shales. AAPG Bull. 2012, 96, 665–677. [Google Scholar] [CrossRef]
  17. Loucks, R.G.; Reed, R.M.; Ruppel, S.C. Morphology, Genesis, and Distribution of Nanometer-Scale Pores in Siliceous Mudstones of the Mississippian Barnett Shale. J. Sediment. Res. 2009, 79, 848–861. [Google Scholar] [CrossRef] [Green Version]
  18. Niu, B.; Bao, Z.; Yu, D.; Zhang, C.; Long, M.; Su, J.; Li, Y. Hierarchical modeling method based on multilevel architecture surface restriction and its application in point-bar internal architecture of a complex meandering river. J. Pet. Sci. Eng. 2021, 205, 108808. [Google Scholar] [CrossRef]
  19. Ding, C.; He, J.; Wu, H. Nanometer Pore Structure Characterization of Taiyuan Formation Shale in the Lin-Xing Area Based on Nitrogen Adsorption Experiments. Minerals 2021, 11, 298. [Google Scholar] [CrossRef]
  20. Wang, Y.; Cheng, H.; Hu, Q.; Liu, L.; Jia, L.; Gao, S.; Wang, Y. Pore structure heterogeneity of Wufeng-Longmaxi shale, Sichuan Basin, China: Evidence from gas physisorption and multifractal geometries. J. Pet. Sci. Eng. 2021, 208, 109313. [Google Scholar] [CrossRef]
  21. Huang, X.; Zhao, Y.P. Characterization of pore structure, gas adsorption, and spontaneous imbibition in shale gas reservoirs. J. Pet. Sci. Eng. 2017, 159, 197–204. [Google Scholar] [CrossRef]
  22. Wang, P.-J.; Mattern, F.; Didenko, N.A.; Zhu, D.-F.; Singer, B.; Sun, X.-M. Tectonics and cycle system of the Cretaceous Songliao Basin: An inverted active continental margin basin. Earth-Sci. Rev. 2016, 159, 82–102. [Google Scholar] [CrossRef] [Green Version]
  23. Zhang, L.; Bao, Z.; Dou, L.; Xu, Q. Diagenetic alterations related to sedimentary architecture of deltaic distributary channels in red beds of the Cretaceous Yaojia Formation, Songliao Basin. J. Pet. Sci. Eng. 2021, 203, 108564. [Google Scholar] [CrossRef]
  24. Zhang, L.; Bao, Z.; Dou, L.; Zang, D.; Mao, S.; Song, J.; Zhao, J.; Wang, Z. Sedimentary characteristics and pattern of distributary channels in shallow water deltaic red bed succession: A case from the Late Cretaceous Yaojia formation, southern Songliao Basin, NE China. J. Pet. Sci. Eng. 2018, 171, 1171–1190. [Google Scholar] [CrossRef]
  25. Wang, M.; Xue, H.; Tian, S.; Wilkins, R.W.; Wang, Z. Fractal characteristics of Upper Cretaceous lacustrine shale from the Songliao Basin, NE China. Mar. Pet. Geol. 2015, 67, 144–153. [Google Scholar] [CrossRef]
  26. Jia, J.; Bechtel, A.; Liu, Z.; Strobl, S.A.; Sun, P.; Sachsenhofer, R. Oil shale formation in the Upper Cretaceous Nenjiang Formation of the Songliao Basin (NE China): Implications from organic and inorganic geochemical analyses. Int. J. Coal Geol. 2013, 113, 11–26. [Google Scholar] [CrossRef]
  27. Liu, B.; Lü, Y.-f.; Ran, Q.; Dai, C.-l.; Li, M.; Wang, M. Geological conditions and exploration potential of shale oil in Qingshankou Formation, Northern Songliao Basin. Oil Gas Geol. 2014, 35, 280–285. [Google Scholar]
  28. Wu, H.; Lin, T.; Bai, Y.; Zhang, J.; Liu, X. Analyses of the mudstone (shale) oil exploration potential in North Songliao Basin. Pet. Geol. Oilfield Dev. Daqing 2019, 38, 78–86. [Google Scholar]
  29. Lu, S.; Huang, W.; Chen, F.; Li, J.; Wang, M.; Xue, H.; Wang, W.; Cai, X. Classification and evaluation criteria of shale oil and gas resources: Discussion and application. Pet. Explor. Dev. 2012, 39, 268–276. [Google Scholar] [CrossRef]
  30. Foscolos, A.; Powell, T.; Gunther, P. The use of clay minerals and inorganic and organic geochemical indicators for evaluating the degree of diagenesis and oil generating potential of shales. Geochim. Cosmochim. Acta 1976, 40, 953–966. [Google Scholar] [CrossRef]
  31. Ambrose, R.J.; Hartman, R.C.; Campos, M.D.; Akkutlu, I.Y.; Sondergeld, C.H. Shale Gas-in-Place Calculations Part I: New Pore-Scale Considerations. SPE J. 2012, 17, 219–229. [Google Scholar] [CrossRef]
  32. Loucks, R.G.; Reed, R.M.; Ruppel, S.C.; Hammes, U. Spectrum of pore types and networks in mudrocks and a descriptive classification for matrix-related mudrock pores. AAPG Bull. 2012, 96, 1071–1098. [Google Scholar] [CrossRef] [Green Version]
  33. Fu, Y.; Jiang, Y.; Dong, D.; Hu, Q.; Lei, Z.; Peng, H.; Gu, Y.; Ma, S.; Wang, Z.; Yin, X.; et al. Microscopic pore-fracture configuration and gas-filled mechanism of shale reservoirs in the western Chongqing area, Sichuan Basin, China. Pet. Explor. Dev. 2021, 48, 1063–1076. [Google Scholar] [CrossRef]
  34. Ross, D.J.K.; Bustin, R.M. The importance of shale composition and pore structure upon gas storage potential of shale gas reservoirs. Mar. Pet. Geol. 2009, 26, 916–927. [Google Scholar] [CrossRef]
  35. Milliken, K.L.; Rudnicki, M.; Awwiller, D.N.; Zhang, T.W. Organic matter-hosted pore system, Marcellus Formation (Devonian), Pennsylvania. AAPG Bull. 2013, 97, 177–200. [Google Scholar] [CrossRef]
  36. Han, J.; Chen, B.; Zhao, X.; Zheng, C.; Zhang, J. Development characteristics and influential factors of organic pores in the Permian shale in the Lower Yangtze Region. Nat. Gas Ind. 2017, 37, 17–26. [Google Scholar]
  37. Guo, X. Rules of two-factor enrichment for Marine shale gas in southern China: Understanding from the Longmaxi Formation shale gas in Sichuan Basin and its surrounding area. Acta Geol. Sin. 2014, 88, 1209–1218. [Google Scholar]
  38. Mccreesh, C.A.; Ehrlich, R.; Crabtree, S.J.; Mccreesh, C.A.; Ehrlich, R.; Crabtree, S.J. Petrography and reservoir physics II: Relating thin section porosity to capillary pressure, the association between pore types and throat size. Ann. Biol. Clin. 1991, 15, 83–88. [Google Scholar]
  39. Perrin, J.-C.; Benson, S.M. An Experimental Study on the Influence of Sub-Core Scale Heterogeneities on CO2 Distribution in Reservoir Rocks. Transp. Porous Media 2010, 82, 93–109. [Google Scholar] [CrossRef]
  40. Wang, Y.; Liu, L.; Cheng, H. Gas Adsorption Characterization of Pore Structure of Organic-rich Shale: Insights into Contribution of Organic Matter to Shale Pore Network. Nonrenewable Resour. 2021, 30, 2377–2395. [Google Scholar] [CrossRef]
  41. Dang, S.T.; Sondergeld, C.H.; Rai, C.S. A New Approach to Measuring Organic Density. Petrophysics 2016, 57, 112–120. [Google Scholar]
  42. Wang, P.; Jiang, Z.; Ji, W.; Zhang, C.; Yuan, Y.; Chen, L.; Yin, L. Heterogeneity of intergranular, intraparticle and organic pores in Longmaxi shale in Sichuan Basin, South China: Evidence from SEM digital images and fractal and multifractal geometries. Mar. Pet. Geol. 2016, 72, 122–138. [Google Scholar] [CrossRef]
  43. Gu, Y.; Ding, W.; Tian, Q.; Xu, S.; Zhang, W.; Zhang, B.; Jiao, B. Developmental characteristics and dominant factors of natural fractures in lower Silurian marine organic-rich shale reservoirs: A case study of the Longmaxi formation in the Fenggang block, southern China. J. Pet. Sci. Eng. 2020, 192, 107277. [Google Scholar] [CrossRef]
  44. Fassel, V.A. International Union of Pure and Applied Chemistry. Analytical Chemistry Division. Commission on Spectrochemical and Other Optical Procedures for Analysis. Nomenclature, symbols, units and their usage in spectrochemical analysis. II. Data interpretation. (Rules approved 1975). Anal. Chem. 1976, 48, 2294–2296. [Google Scholar] [CrossRef]
  45. Yang, C.; Zhang, J.; Han, S.; Wang, X.; Wang, L.; Yu, W.; Wang, Z. Compositional controls on pore-size distribution by nitrogen adsorption technique in the Lower Permian Shanxi Shales, Ordos Basin. J. Nat. Gas Sci. Eng. 2016, 34, 1369–1381. [Google Scholar] [CrossRef]
  46. Yang, F.; Ning, Z.; Zhang, S.; Hu, C.; Du, L.; Liu, H. Characterization of pore structures in shales through nitrogen adsorption experiment. Nat. Gas Ind. 2013, 33, 135–140. [Google Scholar]
  47. Zhang, X.; Lu, X.; Zhang, L.; Liu, Q. Occurrences of Shale Gas and Their Petroleum Geological Significance. Adv. Earth Sci. 2010, 25, 597. [Google Scholar]
  48. Yang, R.; He, S.; Hu, Q.; Hu, D.; Zhang, S.; Yi, J. Pore characterization and methane sorption capacity of over-mature organic-rich Wufeng and Longmaxi shales in the southeast Sichuan Basin, China. Mar. Pet. Geol. 2016, 77, 247–261. [Google Scholar] [CrossRef]
  49. Fu, H.; Wang, X.; Zhang, L.; Gao, R.; Li, Z.; Xu, T.; Zhu, X.; Xu, W.; Li, Q. Investigation of the factors that control the development of pore structure in lacustrine shale: A case study of block X in the Ordos Basin, China. J. Nat. Gas Sci. Eng. 2015, 26, 1422–1432. [Google Scholar] [CrossRef]
  50. Yang, F.; Ning, Z.; Wang, Q.; Zhang, R.; Krooss, B. Pore structure characteristics of lower Silurian shales in the southern Sichuan Basin, China: Insights to pore development and gas storage mechanism. Int. J. Coal Geol. 2016, 156, 12–24. [Google Scholar] [CrossRef]
  51. Cao, Y.; Yuan, G.; Li, X.; Wang, Y.; Xi, K.; Wang, X.; Jia, Z.; Yang, T. Characteristics and origin of abnormally high porosity zones in buried Paleogene clastic reservoirs in the Shengtuo area, Dongying Sag, East China. Pet. Sci. 2014, 11, 346–362. [Google Scholar] [CrossRef] [Green Version]
  52. Zhou, Y.; Littke, R. Numerical simulation of the thermal maturation, oil generation and migration in the Songliao Basin, Northeastern China. Mar. Pet. Geol. 1999, 16, 771–792. [Google Scholar] [CrossRef]
  53. Xie, X.; Jiao, J.J.; Tang, Z.; Zheng, C. Evolution of abnormally low pressure and its implications for the hydrocarbon system in the southeast uplift zone of Songliao basin, China. AAPG Bull. 2003, 87, 99–119. [Google Scholar]
  54. Morad, S.; Al-Ramadan, K.; Ketzer, J.M.; De Ros, L.F. The impact of diagenesis on the heterogeneity of sandstone reservoirs: A review of the role of depositional facies and sequence stratigraphy. AAPG Bull. 2010, 94, 1267–1309. [Google Scholar] [CrossRef]
  55. Kordi, M.; Turner, B.; Salem, A.M. Linking diagenesis to sequence stratigraphy in fluvial and shallow marine sandstones: Evidence from the Cambrian–Ordovician lower sandstone unit in southwestern Sinai, Egypt. Mar. Pet. Geol. 2011, 28, 1554–1571. [Google Scholar] [CrossRef]
  56. Morad, S.; Ketzer, J.; De Ros, L. Linking Diagenesis to Sequence Stratigraphy; John Wiley & Sons: Hoboken, NJ, USA, 2012; pp. 1–36. [Google Scholar]
  57. Worden, R.; Griffiths, J.; Wooldridge, L.; Utley, J.; Lawan, A.; Muhammed, D.; Simon, N.; Armitage, P. Chlorite in sandstones. Earth-Sci. Rev. 2020, 204, 103105. [Google Scholar] [CrossRef]
Figure 1. (a) Location of Songliao Basin; (b) Six tectonic units in the Songliao Basin; (c) The study area and depositional settings of K2qn in the Songliao Basin [9]. (d) Stratigraphic column and lithology of the Qingshankou Formation in Songliao Basin [10].
Energies 15 02269 g001
Figure 2. Logging interpretation and sampling positions in Well A of Da’an area, southern Songliao Basin.
Energies 15 02269 g002
Figure 3. Mineral analysis results of samples from Da’an area, southern Songliao Basin (a) Triangular plot of whole rock mineral composition of samples from K2qn1 member. (b) Bar graph of contents of clay minerals. QFM: Brittle minerals such as quartz, feldspar, and mica; CLA: Clay minerals; CAR: Carbonate minerals.
Energies 15 02269 g003
Figure 4. Types of reservoir space in K2qn1 Member of Da’an area, southern Songliao Basin (a) 2044.95 m, pores inside organic matter particle, (marked by blue arrows); (b) 2044.95 m, pores at the edge of organic matter, (marked by blue arrows) SEM; (c) 2050 m, intergranular pores,(marked by blue arrows); (d) 2041 m, pores inside clay particles(marked by blue circles), dissolution pores inside feldspar particles(marked by blue arrows); (e) 2041 m, dissolution pores inside feldspar particles(marked by blue arrows); (f) 1981 m, intercrystalline pores in pyrite(marked by blue arrows); (g) 1981m, intercrystalline pores between clay particles(marked by blue circles); (h) 1981 m, fissures formed by compaction(marked by blue arrows); (i) 1999 m, tectonic micro-fissures(marked by blue arrows). OM: Organic matter, Qz: Quartz, cl: Clay, Fd: Feldspar, Py: Pyrite.
Energies 15 02269 g004
Figure 5. Pore diameter distribution of typical shale samples from K2qn1 Member, Da’an area, Songliao Basin.
Energies 15 02269 g005
Figure 6. Total pore size distribution of typical marine shale samples and lacustrine shale samples (a) Pore diameter distribution of typical lacustrine shale samples from K2qn1 Member, Da’an area, Songliao Basin; (b) Pore diameter distribution of typical marine shale samples from Longmaxi Formation, Changning area, Sichuan Basin [14].
Energies 15 02269 g006
Figure 7. Relationships between mineral components and total porosity of shale samples from Da’an area, southern Songliao Basin (a) Relationship between quartz content and total porosity; (b) Relationship between clay mineral content and total porosity; (c) Relationship between carbonate mineral content and total porosity; (d) Relationship between feldspar content and total porosity.
Energies 15 02269 g007
Figure 8. Relationships between TOC and organic matter pore features of shale reservoirs in Da’an area, southern Songliao Basin (a) Relationship between TOC and organic matter porosity; (b) Relationship between TOC and average size of organic matter pores.
Energies 15 02269 g008
Figure 9. Relationships between total porosity and depth of different types of reservoirs in Da’an area, southern Songliao Basin.
Energies 15 02269 g009
Table 1. TOC and XRD results of the samples from K2qn1 Member.
NumberDepth
(m)
TOC
(%)
Total Porosity
(%)
Whole Rock Mineralogy (%)Clay (Phyllosilicate) Mineralogy (%)Class of Sweet Spot Section
QuartzK-FeldsparPlagioClaseCalciteSideriteFe-DolomiteDolo-
Mite
PyriteTotal Non-ClayKaoliniteChloriteIllite/SMectite (I/S)Illite
11970.190.763.0120.3010.75.22.90.00.02.041.1115742Class-III
21981.060.562.9121.5012.31.51.01.31.81.941.3255836
31988.171.803.5222.7112.60.01.10.20.01.839.4245936Class-II
41999.751.633.8822.7013.43.91.00.20.01.342.5256033
52006.021.764.9025.6011.56.60.50.00.01.946.1136333
62024.852.105.5725.3011.91.20.70.00.01.440.5236234Class-I
72031.972.237.4031.3016.111.80.00.00.01.060.24105829
82036.932.005.0525.2019.011.40.00.60.01.757.9336331
92041.492.095.1721.3010.219.90.00.50.01.453.3246430
102044.952.426.2730.809.9018.70.01.01.71.463.5746524
112050.321.986.1229.807.805.90.00.20.02.245.9856027
Table 2. Parameters of organic matter pores in shale samples from K2qn1 Member of Da’an area, southern Songliao Basin.
Class of Sweet Spot SectionDepth (m)TOC (%)Rock Density
(g/cm3)
Organic Matter Density (g/cm3)Organic Matter Fraction
(%)
Organic Matter Porosity
(%)
Total Porosity (%)Ratio of Organic Matter
Pore (%)
Average Ratio of Organic Porosity (%)
Class-III1970.190.762.5681.20.0580.0952.433.905.03
1981.060.562.6621.20.1180.1462.376.17
Class-II1988.171.802.6411.20.0310.1223.883.153.43
1999.751.632.7621.20.0350.1293.523.68
2006.021.762.7841.20.0420.1704.903.46
Class-I2024.852.102.5211.20.0420.1865.573.353.36
2031.972.232.4121.20.0460.2067.402.79
2036.932.002.6571.20.0460.2235.054.02
2041.492.092.5941.20.0450.2045.173.95
2044.952.422.5841.20.0350.1846.272.93
2050.321.982.5971.20.0450.1916.123.12
Table 3. Description of different types of reservoir space in shale reservoirs of Da’an area, southern Songliao Basin.
Pore TypeShape of Pore (Fissure)Features of Pore Diameter or Fissure WidthOrigin
Organic matter poreMigrated organic matter poreIn circle, triangle, and polygon shapes20–200 nm in generalFormed when liquid hydrocarbon generated by kerogen during gas generation stage migrated, and filled in residual intergranular pores, and intragranular pores
Primary organic matter poreIn narrow slit shapeLess than 10 nmFormed as the primary solid organic matter (kerogen) left during shale deposition expelled hydrocarbon under thermal effect
Inorganic matter pore intergranular poreLargely in narrow slit and polygon shapesLess than 62 μmThese pores are residual primary pores after compaction of mineral particles in certain arrangement, and are commonly seen in between quartz, feldspar, and clay mineral particles
Intragranular poreIn sheet and irregular shapes200–2000 nmFormed by dissolution of quartz, feldspar, calcite, and dolomite
Intercrystalline poreIn sheet, narrow slit or triangle polygon shapes100–300 μmThey are residual pores formed due to loose packing and compaction resistance of particles during crystal growth, and are commonly seen in pyrite, and dolomite crystals
Micro-fissureDiagenetic micro-fissureIn long strip, saw teeth, and irregular shapesMore than 1nm long, and 50–200 μm wideFormed along edges of brittle minerals and clay minerals as rock shrinks in volume during diagenesis
Tectonic micro-fissureIn network and polygonal line shapes More than 5nm long, and 20–500 μm wideFormed dure to tectonic disruption, they are tensional micro-fissures and often filled by calcite and quartz
Table 4. Pore structure parameters of shale samples from different sweet spot sections of Da’an area, southern Songliao Basin obtained from N2GA experiment.
Class of Sweet Spot SectionBET Surface Area (m2/g)Total Pore Volume (10−3cm3/g)Average Pore Diameter (nm)Percentage of Pores in Different Diameter Ranges (%)
Micro-PoresSmall PoresMedium Pores
Class-I3.8974–7.2049
(4.5645)
7.45–16.78
(11.26)
4.22–13.45
(8.01)
30.65–40.54
(32.26)
40.45–50.65
(45.28)
10.45–30.57
(22.46)
Class-II3.8933–6.1624
(4.0424)
6.48–13.54
(10.36)
4.00–12.55
(6.68)
28.45–58.63
(40.32)
29.04-57.24
(43.44)
5.74–31.21
(16.24)
Class-III1.0372–1.2668
(1.2514)
5.46–6.86
(5.82)
2.16–7.86
(4.21)
29.65–84.21
(55.42)
16.87–48.68
(28.60)
5.29–36.12
(15.98)
① Minimum value, maximum value, and average valu.
Publisher’s Note: MDPI stays neutral with regard to jurisdictional claims in published maps and institutional affiliations.

