Abstract
Recent findings suggest the need for optimal condition monitoring due to increasing counter-productive issues ranging from threats to life, malware, and hardware failures. Several prognostic schemes have been reported across many disciplines; however, the issues of sensor data discrepancy emanating from varying loading and operating conditions of cyber-physical system (CPS) components still remain a challenging factor. Nonetheless, a significant part of these prognostic schemes comprises a sensor/feature fusion module for comprehensive health indicator (HI) construction. This study investigates the prowess of unsupervised fusion algorithms for constructing optimal HI construction on two publicly available datasets—a simulated turbofan engine degradation experiment and an actual production plant condition monitoring dataset. The fusion efficiencies of the algorithms were evaluated using standard metrics for prognostic parameter assessments. The results show that the autoencoder is more reliable for real-life applications, including cases with uniform degradation patterns and the more complex scenarios with irregular degradation paths in the sensor measurements/features, and is expected to direct continued research for improved multi-sensor-based prognostics and health management of industrial equipment.
1. Introduction
The emerging concept of reliability engineering has recently taken a disparaging path against traditional routine-based, condition-based maintenance (CBM) methods towards the more reliable artificial intelligence (AI)-based methods [1]. Apparently, intelligent AI methods for safety control and the plant-wide monitoring of industrial CPS (and components) is currently faced with factors such as the adaptive control of highly dynamic systems, online fault localization and isolation, optimum data analytics/manipulation techniques, and feature engineering for optimum monitoring. With the increasing availability, accessibility, and process-ability of large-volume complex data across industrial and academic domains, the need for efficient and/or effective data processing approaches cannot be overemphasized. Thanks to the emerging Industry 4.0 revolution, supercomputers are now available for achieving feats which were earlier believed to be impossible [2]. On the downside, such technological advancements have also heightened counter-productive concepts to development, safety, productivity, reliability, and profitability across diverse disciplines.
The ethical and economic impacts of unexpected equipment failure can be intense. More often than not, such failures lead to unplanned repair at the expense of production activities and/or profitability [3]. For instance, the growing number of Internet of Things (IoT) devices, although characterised with existing benefits and prospects, are faced with diverse security issues, including, but not limited to, distributed denial of service (DDoS) attacks, hacking, and hardware degradation/failure [4]. In early 2019, just six minutes after take-off, the Ethiopian Airlines Flight ET302 (Boeing 737 MAX 8) crashed just outside Addis Ababa, Ethiopia, claiming the lives of all 157 passengers and crew on board [3]. The need to avoid such catastrophic accidents has been a major motivation for on-going research on accurate sensor-based monitoring with a high priority on safety-critical equipment. Particularly for hardware components including engines, capacitors, pumps, and IoT devices, though they are not commonly faced with remotely-induced threats, as is the case in wireless networks, over time, these components are faced with complex degradation failure patterns and have resulted in several catastrophic incidents. Although deliberate efforts are being made to prevent such counter-productive outcomes, absolute failure prevention and control seems unachievable with the major causes springing from uncertainties, human errors, environmental factors, and equipment fatigue; however, by monitoring the condition of a piece of equipment or a component, necessary preventive actions could be taken to extend the usage life or initiate scheduled repairs/replacements [5,6].
Empirically, the use of sensors for condition monitoring has gained a wide admiration (and patronage) from both industries and academia across diverse disciplines; however, the challenges faced with sensor selection, calibration, and localization have motivated the use of fusion (and selection) algorithms for a more comprehensive (unified) condition monitoring [7]. Because every sensor (or sensor-extracted feature) is unique in representing a targeted system(s), using a single sensor may not be optimal for accurate health monitoring, whereas multiple (homogenic and/or heterogenic) sensors provide abundant information for use; nonetheless, the abundance of unsupervised fusion algorithms such as principal component analysis (PCA), self-organizing maps (SOM), independent component analysis (ICA), locally linear embedding (LLE), Non-Negative Matrix Factorization (NMF), Latent Dirichlet allocation (LaDA), single value decomposition (SVD), etc., have raised questions on which is most appropriate (based on efficiencies and/or effectiveness for condition monitoring/prognostics) for reliable HI construction [2]. While investigating for possible solutions, this paper makes the following contributions:
- A comparative assessment of popularly employed unsupervised fusion algorithms for optimal condition monitoring is presented. We propose a comparative assessment framework which houses a trend detection module for eliminating redundant sensors measurements/features, smoothing the useful sensor measurements/features, and the use of prognosibility, monotonicity, and trendability scores for evaluating the respective fusion algorithms’ efficiencies for accurate condition monitoring and prognostics.
- We leverage publicly available condition monitoring datasets for the proposed investigation and their efficiencies compared based on standard evaluation metrics for prognostics/condition monitoring.
- In addition to providing a reliable framework for choosing a reliable fusion algorithm for accurate condition monitoring for prognostics, our work offers a paradigm for directing continued research and practice across real-time industrial prognostic applications, especially in the presence of unlabelled data.
The remainder of this paper is structured as follows: Section 2 discusses previous (and on-going) research on sensor fusion and HI construction for prognostics, while Section 3 provides a brief review on data-driven prognostics in industries, a survey of traditional sensor fusion algorithms, and the theoretical background of the state-of-the-art methods for HI construction. Section 4 presents the proposed investigation framework while Section 5 presents an experimental validation of the proposed method on two publicly available condition monitoring datasets. Section 6 concludes the paper.
2. Motivation and Related Works
Several fusion algorithms abound for exploring dimensionality reduction solutions and HI construction for failure prognostics. These algorithms have evolved from the fundamental statistical techniques to the more sophisticated AI-based methods. Although few studies validate the use of AI-based methods such as the self-organising maps [8] and autoencoders (AEs) [9], on-going research studies are still faced with challenges ranging from labeling, interpretability, optimization problems, and their magical defiance to statistical learning theory from which they were fundamentally designed [2]; nevertheless, these fusion algorithms, in their respective strengths and weaknesses, are fundamentally designed to accept multiple inputs and returns a new comprehensive output (with a fewer dimension) that preserves the original information [7].
The linear discriminant analysis (LDA)—another effective supervised fusion algorithm whose prowess has been remarkably applauded for collaborative learning as shown in [10]—relies hugely on the inter-dependency of the input variables. Although it provides a good solution to recommendation/summarizing tasks [10,11], its effectiveness for our intended problem statement remains limited to homogeneous sensor fusion tasks and supervised fusion cases. On the other hand, AEs—intelligent (supervised) dimensionality reduction algorithms—offer a solution for deep feature representations from multiple inputs [12] and have been reported in many cases, including rotating machinery prognostics [13], hydraulic equipment prognostics [9], epileptic seizure detection [14], etc. Its architecture features an encoder (input layer), a bottleneck (hidden layer), and a decoder (output layer), whereby the encoder accepts, processes, and compresses the multiple inputs (sensor measurements and/or features) to a single-dimensional internal representation defined by the bottleneck, while the decoder attempts to recreate the original input by accepting the single dimensional internal representation provided by the bottleneck [9,13,14].
In contrast to supervised methods, unsupervised fusion algorithms serve better purposes since most real-life applications involve the use of unlabeled data. Among them is the popular PCA. This easy-to-use algorithm has been widely used in several studies for many classification problems [15,16]; however, its use for feature fusion purposes although efficient, may be prone to abuse since its architecture is designed for non-Gaussian inputs [7,17]. Nevertheless, its capability for Gaussian inputs has been explored in [18] owing to its kernel-compatible architecture. Because the PCA is an orthogonal linear transformation tool that functions basically on the assumption that the principal components with the highest variance will be the most useful, inputs with varying distributions when fed into the PCA may confuse the algorithm, hence a considerable limitation to its use for sensor fusion problems. Against the limitations of the traditional PCA and its variants, the LLE maps inputs more accurately for cluster validation, classification, noise evaluation, and, emphatically, dimensionality reduction/fusion problems [19]; however, the LLE’s performance for HI construction is highly affected by the choice of nearest neighbours—k. Furthermore, another intelligent unsupervised fusion algorithm—SOM—offers a clustering solution to uncovering categories in large data sets. Being a ’special breed’ of unsupervised neural networks designed mostly for continuous variables, they can be used for dimensionality reduction purposes, especially for condition monitoring and prognostic purposes; however, their iterative nature (like AEs) makes them computationally expensive, and with the random weight initialization process forming the foundation of their architecture, they are prone to potentially inconsistent solutions [8]. On the other hand, the ICA offers a traditional solution to blind source separation problems by extracting statistically independent components from the observed signal; however, its use has been extended for dimensionality reduction purposes. Often times, the mutual information between multiple variables hides in the high-order characteristics, and these are easily captured by the ICA variant—FastICA—which basically reduces the high-order correlation amongst the variables while maintaining the mutual independence between them. This makes them more robust for multi-sensor fusion problems, whereby the sensor outputs are independent, continuous, and non-Gaussian (as is the case in most real-life applications) [20,21] .
Emphatically, the efficiency and/or efficacy of any condition monitoring framework (for prognostics) relies hugely on input variable characteristics, of which monotonically increasing and/or monotonically decreasing measurements should be strategically sought for. This is an indispensable assessment necessary for optimal HI selection and has motivated our study. While a host of many novel and customized unsupervised methods abound for consideration, it would be futile to discuss them in all in this study.
3. Background of Study
In this section, we summarize the background of the concepts necessary to grasp the content of the paper and the rationale behind their use.
3.1. Data-Driven Prognostics in Industries
For the past few decades, predictive maintenance (PdM) solutions have witnessed a global patronage (and revolution) in industries. These solutions were initially dependent on traditional physics-based models. Unfortunately, these traditional models are limited by expensive assumptions and trade-offs, limited generality, and several unquantifiable complexities (uncertainties) [2]. Interestingly, the imminent quest for the Industry 4.0 revolution has welcomed numerous technological advancements on a global scale, and these advancements have also ushered in the superior efficiencies of data-driven PdM methods for industrial applications [6].
In industries, especially in safety-critical sectors such as aviation, medicine, etc., the need for optimal condition monitoring has motivated the development of diverse sensors and numerous methodologies (processing, manipulation, selection, fusion, etc.) for exploiting their outputs for optimum condition monitoring. Not only do these methodologies offer a wider range of information for decision making, but the information gathered from them also inspires PdM decisions for extending the life of equipment, minimizing costs, ensuring safety, and increasing productivity [22]. On the other hand, state-of-the-art condition monitoring methodologies basically depend on the use of bio-inspired mathematical models that automatically map complex inputs by learning linear and nonlinear relationships/dependencies to a target variable (usually the remaining useful life) [9]. With the right architecture and data-processing modules from established models, these artificial neural networks have shown in several applications to be more effective for diverse applications, including, but not limited to, condition monitoring and forecasting, and more importantly, they do not require any expensive modeling assumptions. This makes them highly reliable for offline and real-time data-driven condition monitoring since they are capable of learning the complex (stationary and non-stationary) spectral and transient dynamics from sensor measurements. Although proven effective against traditional models across several applications, on-going research studies are still faced with challenges ranging from interpretability, optimization problems, and their “magical” defiance to Bayesian learning theory from which they were fundamentally designed [2]. More particularly (as it concerns the proposed study), issues with sensors (discrepancy, placement, number of sensors, etc.) play a vital role in the effectiveness of these data-driven PdM methods [23]. Therefore, the optimal performance of data-driven PdM frameworks relies significantly on the nature and reflectability of the sensor measurements for capturing the overall degradation behavior of target equipment at different operating/health conditions.
Generally, most data-driven monitoring frameworks rely on physical variables such as vibration, temperature, humidity, etc., and may further require some level of advanced feature engineering techniques to extract underlying features (using signal processing techniques) for optimal condition monitoring. However, in some cases, sensor measurements may not require a feature extraction procedure; the raw sensor measurements may directly reflect the various operating conditions of the target equipment. For instance, pressure and temperature measurements often exhibit this behavior and can be used directly as inputs for a condition monitoring model [9]. In most high-end industrial settings, a single sensor type (for instance, vibration) cannot comprehensively provide reliable measurements for optimum representation and condition monitoring. This is because while a sensor may reflect a particular equipment behavior based on a particular mechanism/principle, another sensor also reflects a different behavior of the same equipment following a different mechanism/principle. This hints at the need for employing multiple sensors (of different types) and at different locations for optimal equipment monitoring. Integrating multiple sensors to establish a comprehensive data-driven condition monitoring framework is more reliable (and trustworthy); however, underlying issues such as sensor redundancy, discrepancy, costs, and failures have motivated the need for sensor selection and fusion for optimal (and cost effective) condition monitoring.
3.2. Review of Traditional Sensor Fusion Algorithms for Comprehensive HI Construction
Recently, industrial cyber-physical systems are characterized by multiple complex systems with an overall goal of improving reliability, cost efficiency, ensuring optimum, safety/ease-of-use, and increasing profit. Particularly, reliable data-driven condition monitoring frameworks/technologies often rely on several/multiple sensors types and/or features (from the sensor measurements). These abundance of data sources create a comprehensive avenue for accurate condition monitoring since the different representations of the target systems are exploited. While an individual sensor may provide useful information on its own, one could only imagine the usefulness of information that could be harnessed from combining data from multiple sensors at once [20].
Sensor fusion has shown in recent times to improve functionality of sensor-based systems especially in intelligent systems such as autonomous driving and robotics, where simultaneous localization and mapping (SLAM) integrates (with advanced techniques) cameras, radars, and/or global positioning system (GPS) for safe (and error-free) autonomous navigation and path planning [24]. In other scenarios such as vibration monitoring, multiple features (from different domains) have been shown in several studies for improved diagnosis of rotating components [2,7], hydraulic components [6,19,20], and etc. Amidst these efficiencies, issues such as sensor (or feature) redundancy may arise, which renders some data sources insignificant. This invariably creates the need for selecting the important/usable data sources (sensors/features) for optimal conditional monitoring. Although there is need for feature/sensor selection on one hand, on the other hand, feature/sensor fusion plays yet another important role for comprehensive condition monitoring using a single comprehensive and representative HI [7]. In practice, the insignificance of a sensor/feature for purposes such as diagnosis does not also imply absolute insignificance since such features may exhibit some dynamic responses suitable for prognosis. This further validates the need for employing appropriate selection methods for different tasks whereby trendability, prognosibility, and monotonicity collectively provide a reliable paradigm for sensor/feature evaluation for condition monitoring and/or prognosis.
Interestingly, numerous fusion algorithms such as PCA, SOM, ICA, etc., abound for exploration, whereby the fundamental goal of these algorithms is to combine the underlying partial information contained in different data sources to generate a single representative vector (or fewer dimensional feature set) in an unsupervised manner. Just as their principles vary, each of the numerous fusion algorithms vary in their individual pros and cons. Most often, the choice of one over the others are motivated by preference and/or familiarity, whereby such a biased selection process may result in sub-optimal condition monitoring. Considering that most condition monitoring via a single HI (by combining multiple sensor/feature sources) are often unsupervised, it becomes necessary to also evaluate the prognosibility of the generated HI from the various fusion methods to ensure optimal condition monitoring for prognosis [20]. For instance, PCA has flaws when provided with normally distributed variables, while the LLE is limited by the number of nearest neighbors. The static learning rules of the SOM limits its performance for cases where the input distribution changes. Because the original neuronal weights are initialized randomly, completely different maps are generated every time the fusion process is generated (given the same inputs), and this is practically unreliable for real-life (and safety-critical) applications [8]. On the other hand, the ICA is interestingly effective for capturing latent variables as new representation of inputs in comparison with most traditional unsupervised fusion techniques [25]. It is also particularly robust for non–Gaussian independent variables and is backed up by several results across different domains, including human brain diagnosis [26], pump fault diagnostics [27], solenoid pump prognostics [20], etc. However, recent technological advancements amidst the increasing sensor-based condition monitoring challenges and the need for efficiency suggest the need for intelligent methods out of which the AEs offer a more reliable, easy-to-use, and less complicated alternative to sensor data fusion. Interestingly, there has not been a paradigm for choosing amongst the numerous fusion techniques for optimal prognostics (or diagnosis), and this is a major motivation for this study.
3.3. State-of-the-Art Methods for HI Construction
Amidst the recent developments in computational resources and the increasing need for optimal condition monitoring, there has been a shift from the traditional (statistical-based) fusion methods—among which the ICA retains its robustness and superiority over other traditional methods [9]—towards the AI-based methods [20], among which the AEs are the most reliable considering the SOM’s major limitation—original neuronal weights are initialized randomly without a reliable cost function evaluation paradigm. Consequently, the choice of a fusion algorithm (considering costs and robustness) seems to fall between taking the traditional route—ICA (and its variants)—and employing intelligent methods—AEs.
Although traditionally developed for solving blind source separation problems for audio and image processing, the ICA is now being used to solve dimensionality reduction/feature fusion problems. This eventually motivated the FastICA’s development—a remarkable improvement on the traditional ICA algorithm by Hyvarinen [21] in 1999. In practice, the mutual information between multiple sensor measurements is often hidden in the high-order statistical characteristics; interestingly, in addition to reducing high-order correlations, FastICA preserves high-order mutual independence via the minimization of mutual information, maximization of entropy, negentropy, and so on [28]. Figure 1 shows the linear model of the FastICA.
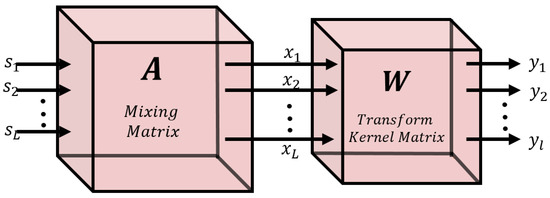
Figure 1.
Linear model of FastICA. Adapted from Ref [20].
As illustrated in Figure 1, the main goal of the FatICA is to find a mixing matrix——that separates the observed signal X into a set of statistically independent sources via a transform kernel matrix (weights)—.
Given an observed input composed of linear combinations of independent non-Gaussian sources——the matrix created by the FastICA shows the mixed mode of mutually independent such that:
The independent signals extracted from x by the FastICA are , where . FastICA’s primary goal is to discover a linear mapping , such that the output signal approximates the independent sources with the minimum reconstruction error. Assuming and weight matrix , we have that:
For HI construction, the goal is to generate a single comprehensive HI—y (where )—by fusing multiple sensor/feature inputs.
Against conventional methods, recent solutions for sensor fusion feature intelligent self-learning methods such as the AEs [9]. Like other artificial neural networks (ANNs), the architecture of AEs typically consist of three layers: input, hidden, and output; the hidden layer is the encoder, while the output layer is the decoder and is illustrated in Figure 2.
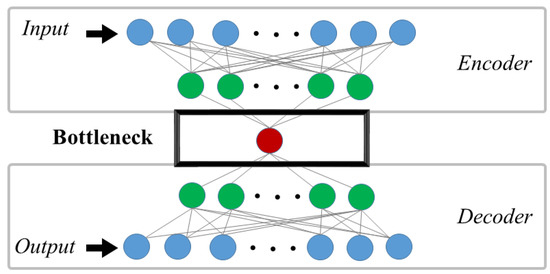
Figure 2.
An illustration of a typical Autoencoder architecture.
The encoder learns how to interpret the input and compresses it into a bottleneck layer internal representation, while the decoder examines the bottleneck layer (the output of the encoder) and attempts to recreate the input [9]. Given an observed input , the encoding of the AE is obtained by a nonlinear transformation function using Equation (3), while the output at the layer for M hidden layers in the encoder is obtained using Equation (4) below:
where is a nonlinear activation function, is the input-to-hidden layer weights, b is bias, and is the input , while is the output of the last encoding layer—the bottleneck.
During the decoding process, the output of the first decoding layer becomes the input of the second decoding layer. In the nth layer, these decoder outputs are computed by using the activated output shown in Equation (5) below:
where the input of the first decoding layer constitutes the output of the last encoding layer, which, in turn, constitutes the reconstructed input—.
Ideally, the choice of activation function plays a major role in the performance of AEs, whereby each activation function has their respective strengths for different problem sets. For instance, while the softmax function is particularly effective for classification problems, the rectified linear units (ReLU) and its variants, the Tanh and Sigmoid functions, are particularly effective for regression problems, with the ReLU showing better convergence performance, thereby avoiding vanishing gradient problems [7,9,20]. As the bottleneck’s dimension is set to unity, the HI can be constructed from a single vector from which different health states can be monitored.
4. Investigation Framework
4.1. Sensor Selection and Fusion
Fundamentally, not all sensor measurements provide prognosible information. While sensor(s) that are insignificant for conditions monitoring do not necessarily imply their insignificance for other purposes, it is crucial to eliminate redundant sensor measurements to ensure accurate and cost-effective condition monitoring [7]. The proposed investigation framework is presented in Figure 3.
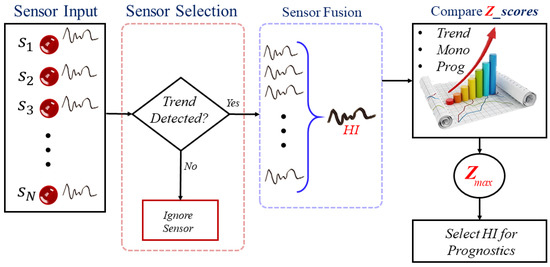
Figure 3.
The proposed system model.
As shown in Figure 3, given N sensor measurements from a target system(s), the respective measurements (signals) are first checked for prognostics capabilities from which, the redundant sensor measurements are ignored while monotonically increasing/decreasing measurements are retained.
Using the various fusion algorithms summarized in Table 1, the selected features are fused to generate respective single comprehensive HIs for condition monitoring such that the abundant partial information contained in them can be captured by the newly constructed HIs for a comprehensive representation.

Table 1.
Fusion Algorithms and their Architecture.
Subsequently, the respective outputs from these algorithms (and their variants) are assessed for prognostics suitability using the earlier listed evaluation metrics [29,30].
4.2. Performance Evaluation Criteria
Traditionally, a visual inspection may provide intuition for choosing an HI; however, such a biased approach can be hectic, if not catastrophic. Characteristics such as trendability (), monotonicity (), and prognosibility () provide reliable paradigms for selecting prognosible measurements [2,31]. Ideally, measures the level to which the parameters/features have a similar underlying shape and can be modeled by the same function by computing the smallest absolute linear correlation across the inputs, while Monotonicity is a straightforward measure which is given by the average absolute difference of the fraction of positive and negative derivatives for each parameter’s (sensor measurement’s) path. is the variance of the final failure values for each parameter’s path divided by the mean range of the path. By computing and assessing fusion outputs based on these metrics, computational costs and downtime can be mitigated while enhancing the prognostics process. These metrics are defined below:
where # and # are the positive and negative derivatives for each path, respectively, and n is the number of observations in a particular history.
More importantly, to give a more accurate estimate of derivatives, smoothing these parameters should be applied when using real-world data. These metrics each return values between 0 and 1. A value of 1 implies very high , , and/or scores, while a value of 0 implies otherwise. Automating the selection process can be achieved by defining a fitness function—Z—as their weighted sum using Equation (9):
The constants(weights)—, and —determine how important each metric is in the fitness function computation. Depending on the specific application, these constants may give unequal weighting to more important sensors, while, in others, they may give equal weighting to each sensor [20,32]. Under ideal conditions, an equal weighting for all sensor measurements (after the sensor selection process) offers a more unbiased avenue for investigative purposes as the study proposes. Nonetheless, the quest for optimal weighting for application-specific prognostic problems are often geared towards the use of gradient descent and meta-heuristic search algorithms such as genetic algorithms, particle swarm optimizations, ant colony optimizations, etc. [32]. On the flip side, due to the additional computational costs associated with the use of metaheuristic algorithms amidst their random initialization problems, the need for these supporting algorithms remain minimal especially in real-life applications.
Theoretically, having the same sign of the first and second derivatives is beneficial to reducing uncertainty in the RUL prediction, that is, increasing functions are convex and decreasing functions are concave. Fitness can be improved by simply adding a penalty for a mismatch between first- and second-order derivatives [32]. In addition, other features that apply to the parameter optimization may also be included. In reality, achieving purely concave and/or convex sensor measurements may not suffice due to sensor discrepancies and other sources of irregular parameter paths. Such cases (as the case studies presented herein reveals) would require an equal weighting of the metrics.
5. Experimental Validation
This section presents the experimental validation of the proposed HI construction and assessment framework on three case studies: a run-to-failure data provided by the Prognostics CoE at The National Aeronautics and Space Administration (NASA) Ames [33] and a Kaggle open-source production plant dataset where sensors provide information about the condition of a machine component [34]
5.1. C-MAPSS: Dataset Description
Saxena et al. [33] simulated a turbofan engine degradation process using a Modular Aero-Propulsion System Simulator—C-MAPSS. The data obtained from the experiment were employed in this study. Four different sets were simulated under different combinations of operational conditions and fault modes, and from them, several sensor measurements were recorded to characterize fault evolution. The data are assumed to be from a fleet of engines of the same type and run with different degrees of normal initial wear and manufacturing variation which are unknown to the user. The sensor measurements are shown in Figure 4, and as shown, some sensors reflected no degradation behavior.
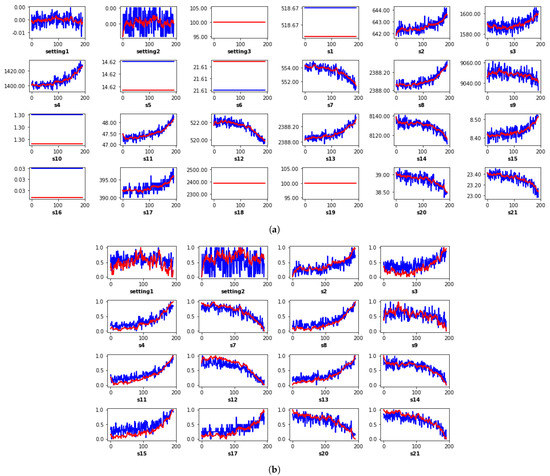
Figure 4.
Time series visualization of (a) all 24 sensor measurements from the fourth experiment, (b) 16 selected sensors with monotonic trends.
The engine operation was considered normal until it starts to degrade. The degradation grows until a pre-defined threshold is reached, beyond which engine failure is witnessed. These sensor measurements are ignored following a trend-detection test, while the smoothed monotonic measurements shown in Figure 4 are prepared for fusion and HI construction by the respective fusion algorithms.
C-MAPSS: Analysis
The sensor measurements are shown in Figure 4, and as shown, some sensors reflected no degradation behavior. As a pre-processing step, smoothing sensor measurements is recommended, not only because a more monotonic trend is achieved in the newly constructed HI but because it also eliminates bias and uncertainties due to noise and high-frequency components. In this study, smoothing was performed using a five-window exponential moving average algorithm based on its superior capabilities against other popular counterpart methods. Following the smoothing process, the smoothed sensor data shown in Figure 4b were normalized to mitigate the effects of the variation input scale. Subsequently, they were respectively fused by the fusion algorithms summarized in Table 1.
Figure 5 presents the fusion outputs—HIs—of the algorithms summarized in Table 1. As shown, the LaDA produced the worst fusion output with a unity index value throughout the time-series. On the other hand, a visual inspection of the SVD, LLE, and the NMF shows that the returns of their respective fused indices have monotonically decreasing trends and vice versa for the rest of the algorithms. Although an HI with either an increasing or decreasing monotonic direction possess reliable prognostics capabilities, there is a need for choosing the optimal HI for condition monitoring. This can be ascertained by employing the metrics defined in Section 4.2. Following an assessment of the 13 fusion outputs presented in Figure 5 based on their Z scores using Equation (9), Figure 6 presents their prognostics capacity evaluation based on an equal weighting of one to three for the , , and metrics, respectively.
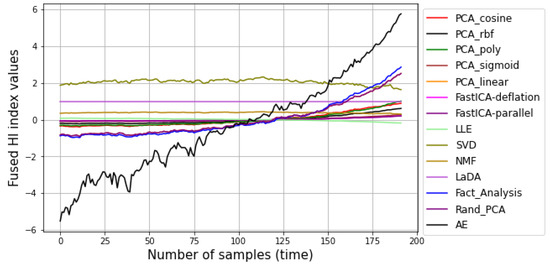
Figure 5.
HI construction output of Fusion Algorithms.
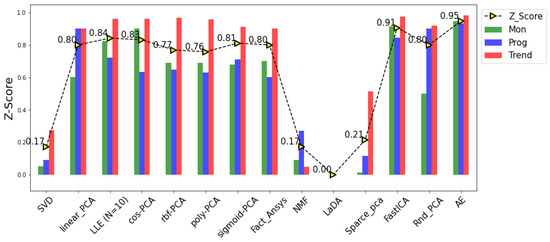
Figure 6.
Comparison between prognostics capability of fusion algorithms.
Although the results reveal that most of the fusion algorithms (including FastICA (purple line) and Fact_Analysis (blue line), it can be clearly observed that the AE (black line) better generates a more sensitive (as observed in the relatively higher variance) and reliable (monotonic, trendy, and prognosible) HI with a Z score of 0.95 followed by the FastICA with a Z score of 0.91, as shown in Figure 6.
Unfortunately, the commonly employed PCA (and its variants) rank amongst the average with a Z score of 0.80, which verifies its functional limitations to normally distributed inputs. As proposed by [31], an HI with implies a poor prognostic capability of the HI, so valid conclusions can be drawn against the SVD, NMF, and Sparse PCA with Z scores of 0.17, 0.17, and 0.21, respectively. In the same light, the LaDA’s zero Z score verifies its abysmal fusion capability for non-Gaussian inputs.
5.2. Production Plant Dataset: Description
In addition to the above simulated study, further investigation was conducted on a more complicated dataset—the Kaggle open-source production plant dataset, which provides information regarding the condition of machine components. There were 8 run-to-failure experiments, ranging from 15,803 to 51,671 samples. In total, there are 10 files, each containing 25 features. Sequential time series analyses are possible because the data are timestamped. Figure 7 shows the raw (in blue) and the smoothed (in red) features for the whole 10 files. Similar to the previous case, smoothing was performed using a 500 sample-window exponential moving average algorithm.
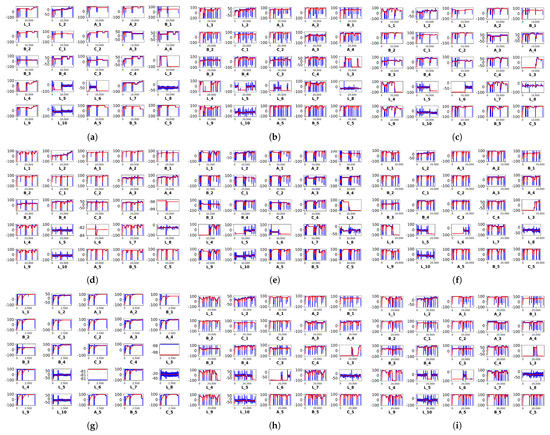
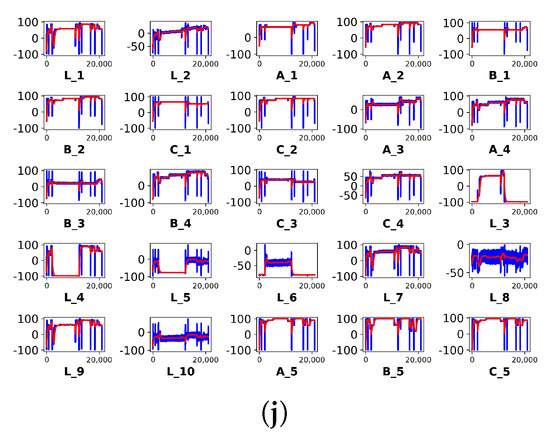
Figure 7.
Time series visualization of (a) C17-1, (b) C17-2, (c) C8, (d) C9, (e) C11, (f) C13-1, (g) C13-2, (h) C14, (i) C15, and (j) C16.
It can be observed that some sensors are non-responsive. For instance, variables and in Figure 7d,g were dropped after the trend detection test. Next, each of the 10 different cases were respectively normalized and fused using the fusion algorithms for comparative assessment. Figure 8 shows the constructed HIs from the respective fusion algorithms for the 10 different datasets.
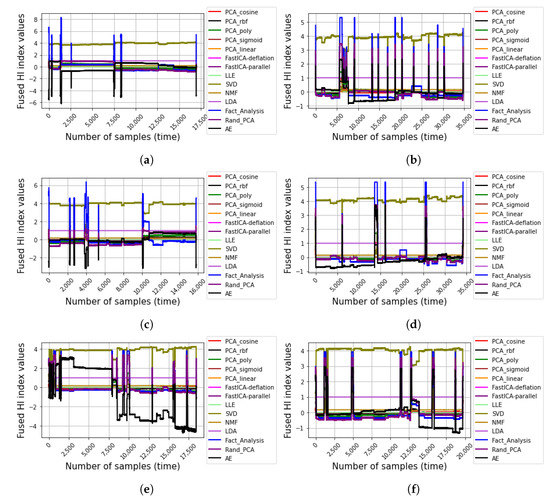
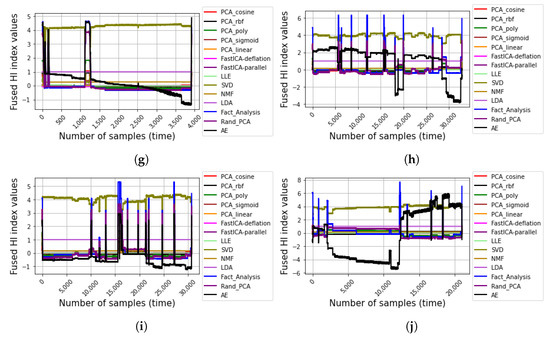
Figure 8.
Constructed HIs from the respective fusion algorithms for (a) C17-1, (b) C17-2, (c) C8, (d) C9, (e) C11, (f) C13-1, (g) C13-2, (h) C14, (i) C15, and (j) C16.
As shown in Figure 8, it can be generally observed in the figures (especially Figure 8a,b,d–j, that the AE produces more monotonically increasing and/or decreasing degradation paths when compared with the other traditional fusion algorithms. Unlike the C-MAPSS dataset, which revealed a more monotonic degradation path in the respective sensor measurements, most real-life cases, such as the production plant dataset, are often more complex due to uncertainties, environmental factors, accidental impacts, abrupt changes in operating condition, and irregular degradation patterns. This presents a need for a sensitive (and reliable) fusion algorithm to comprehensively capture the overall sensor measurements and/or features without losing relevant information while retaining real-time efficiencies for prognostics. Interestingly, unlike the purely statistical methods, which, by the way, retain their conventional efficiencies, the AE offers an intelligent solution and with the option of modifying its architecture by deepening the encoder/decoder layers for a deeper feature learning, even more complex real-life fusion problems can be effectively solved. To fully assess the fusion algorithms’ prognostic abilities, their respective Z scores were computed for each of the 10 datasets using an equal weighting of 1/3 (0.33) for the , , and metrics, respectively. Figure 9 presents the Z scores for the HIs generated by the respective fusion algorithms on the 10 datasets.
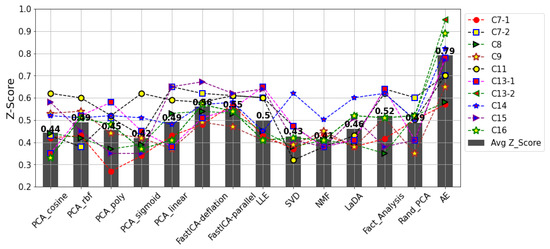
Figure 9.
Z scores for the HIs generated by the respective fusion algorithms on the 10 datasets. The black bars ( is the mean value of the Z scores for the 10 datasets per fusion algorithm.
The AE’s superior fusion efficiencies over the traditional methods are shown by a clear difference in the Z scores for each of the datasets (C7-1–C16). Although for some datasets, such as C7-1 and C8, the Z scores by the AE and FastICA were similar with a marginal difference, the overall comparative superiority is revealed in the average Z scores for the 10 datasets per fusion algorithm (black bars). On average, the AE returned an of 0.79—a better performance than the FastICA, whose of 0.56 and 0.55, respectively, were the highest scores returned by the traditional fusion algorithms. Notwithstanding the high irregular degradation patterns in the datasets as shown in Figure 7, unlike the other traditional fusion algorithms, even more complex fusion problems can be solved with the AE due to its intelligent solution and the option of deepening the encoder and decoder layers for even deeper feature learning. This, in turn, presents the AE as a more efficient (and reliable) alternative to the other HI construction methods; some of which (like the LLE) are relatively more computationally expensive than a simple AE architecture—one encoder layer and one decoder layer.
6. Discussions, Insights, and Open Issues
In addition to improved productivity and profitability, recent technological advancements have heightened counter-productive concepts to development, safety, productivity, reliability and profitability across diverse disciplines. The growing number of IoT devices, although characterized by vast benefits and prospects, are faced with diverse security issues, including, but not limited to, hardware degradation/failure. The use of sensors for condition monitoring has gained wide admiration (and patronage) from both industries and academia across diverse disciplines; however, the challenges of selecting, combining, and localizing sensors have motivated the use of diverse sensor management/utility modules, including the use of unsupervised fusion algorithms for unlabeled sensor data in cases of multi-sensor condition monitoring. The challenge of choosing the right fusion tool remains a challenge, nonetheless.
In reality, sensor outputs (especially in heterogeneous cases) are non-linear with unique distributions, and with the absence of labeled data (as it is always the case), the need for unsupervised fusion tools with the robustness to model these nonlinear inputs becomes heightened. Ideally, one expects uniform degradation patterns from sensors to aid easy condition monitoring and prognostics, but the reality is that every sensor (or feature) reflects system behavior uniquely and may produce irregular degradation patterns. The occurrence of such undesirable outcomes are even further heightened by uncertainties, environmental factors, accidental impacts, abrupt changes in operating conditions, and irregular degradation patterns—factors which contribute significantly to the challenge. This presents a need for reliable fusion algorithms for comprehensively capturing the overall sensor measurements and/or features without losing relevant information while retaining real-time efficiencies for prognostics. As our study shows, the AE—an AI-based solution offers a more reliable solution for sensor fusion and with its adjustable architecture, even more complex problems can be solved. On the flip side, its efficiencies are dependent on hyper parameters—number of decoder and encoder layers, number of neurons in each layer, the activation function, and the cost function optimization algorithm of choice. Although the deeper the AE architecture, the better the efficiencies, the computational costs also becomes yet another concern and this may pose a challenge for real-time cost-aware prognostic systems. Nonetheless, a basic AE architecture—one encoder and decoder layers respectively with the number of neurons equal to the dimension of the input feature set, a ReLU activation function, and an Adam optimizer provides a comparatively better solution than most of the other traditional unsupervised fusion algorithms.
From a different perspective, one may prefer choosing the traditional algorithms, which, by the way, reserve their respective efficiencies. It is worth noting that some of these traditional methods require a significant level of domain knowledge for full utility. For instance, finding an optimal number of nearest neighbors for exploiting the LLE may be as hectic as choosing the right PCA kernel. In addition, the nature of input data contributes to their efficiencies. These concerns (and more) provide valid rationale for exploring the intelligent AE which requires minimal domain knowledge and comes with ease-of-use and versatility. Amidst these AE efficiencies, it is important to take into account the stochastic learning process (founded on random weight initialization) as it occurs in virtually all ANNs, and since the learning is unsupervised, one has to rely only on the loss convergence of the training process to ascertain the fusion performance of the model. Interestingly, the , , and offer a reliable avenue for comprehensively evaluating the AE’s fusion output(s) for prognostics.
On a grand scale, the uncertainties and complexities in PdM still leave much room for continued research beyond the scope of this study—the choice of sensors and fusion techniques and the choice of optimal prognostics parameters. Most of these open issues are geared towards the design, control, and trustworthiness of big-data-compatible diagnostic and/or prognostic frameworks, which are fundamentally dependent on intelligent AI-based algorithms. For instance, due to the random initialization of most intelligent methods, the risk of inconsistent solutions amidst minimal explainability still poses a threat to ensuring trustworthiness for these models, especially for safety-critical applications. The lack of established standard parameterization techniques further limits their global acceptance. Nonetheless, the efficiency of these intelligent predictors often rely on the data characteristics; therefore, it is necessary to ensure that the right inputs for these intelligent models are optimal for improved learning and predictive efficiencies. With our findings and strong empirical support, the study provides a resourceful paradigm for ensuring accurate multi-sensor equipment monitoring using a single HI. Ensuring that the comprehensive HI reflects the mutual information between multiple variables is advised to ensure optimum condition monitoring; especially for multi-sensor fusion problems, whereby the sensor outputs are independent, continuous, and non-Gaussian (as is the case in most real-life applications). Although the results validate the AEs’ superior efficiencies on two offline condition monitoring datasets, it is uncertain how reliable the model would perform in real-time situations and for different sensor measurements such as temperature, pressure, etc.; however, the study provides a superior motivation for exploring and choosing an appropriate fusion algorithm(s) for a comprehensive HI condition monitoring. With the trend-detection test module for redundant senor data elimination and the AEs’ intelligence both in place, the authors believe the framework would flourish just as much (if not better) for other real-life problems.
7. Conclusions
This study presented a comparative study on popular unsupervised fusion techniques and assessed their respective abilities for generating optimal health indicators for prognostics. Using monotonicity, prognosibility, and trendability assessments, their performances were assessed using a comprehensive scoring function—the Z score—for evaluation. The assessment presented empirically verifies the robustness of the AE for HI construction for condition monitoring. The results reveal the AE’s robustness against other presented traditional fusion methods was validated on two publicly available datasets—the C-MAPSS Turbofan Engine data set provided by Prognostics CoE at The National Aeronautics and Space Administration (NASA) Ames and the Kaggle’s open source production plant dataset.
In addition to the investigation process, the study accounts for sensor redundancy by eliminating their influence in the fusion process. Interestingly, the AE results on the case studies reveal its superior fusion advantages over the most reliable traditional fusion algorithm—the FastICA, whose fusion efficiencies are also comparatively superior to most of the other traditional methods such as the PCA. However, this advantage cannot be generalized for all problem sets considering that it, too, has its limitations and may be limited in cases where other competing fusion algorithms may be more resourceful and/or where empirical knowledge/accountability is prioritized over fusion efficiency. Based on this rationale, this study serves to bring data analysts and engineers to the needed awareness and an opportunity to explore fusion algorithms for optimum condition monitoring without relying solely on preference and/or familiarity in a chosen technique.
Author Contributions
Conceptualization, U.E.A.; methodology, U.E.A.; software, U.E.A.; formal analysis, U.E.A.; investigation, U.E.A.; resources, U.E.A. and J.-W.H.; data curation, U.E.A.; writing—original draft, U.E.A.; writing—review and editing, U.E.A. and J.-W.H.; visualization, U.E.A.; supervision, J.-W.H.; project administration, J.-W.H.; funding acquisition, J.-W.H. All authors have read and agreed to the published version of the manuscript.
Funding
This research was supported by the MSIT(Ministry of Science and ICT), Korea, under the Grand Information Technology Research Center support program (IITP-2022-2020-0-01612) supervised by the IITP(Institute for Information & communications Technology Planning & Evaluation).
Institutional Review Board Statement
Not applicable.
Informed Consent Statement
Not applicable.
Data Availability Statement
The data used in this study are publicly available and can be found here: http://ti.arc.nasa.gov/project/prognostic-data-repository and https://www.kaggle.com/inIT-OWL/production-plant-data-for-condition-monitoring (accessed on 16 February 2022).
Conflicts of Interest
The authors declare no conflict of interest.
References
- Yin, S.; Rodríguez-Andina, J.; Jiang, Y. Real-Time Monitoring and Control of Industrial Cyberphysical Systems: With Integrated Plant-Wide Monitoring and Control Framework. IEEE Ind. Electron. Mag. 2019, 13, 38–47. [Google Scholar] [CrossRef]
- Akpudo, U.E.; Hur, J.W. Towards bearing failure prognostics: A practical comparison between data-driven methods for industrial applications. J. Mech. Sci. Technol. 2020, 34, 4161–4172. [Google Scholar] [CrossRef]
- BBC. Ethiopian Airlines: ‘No Survivors’ on Crashed Boeing 737. 10 March 2019. Available online: https://www.bbc.com/news/av/embed/p07345q4/47513508 (accessed on 13 January 2022).
- Siqi, M.; Lo, D.; Xi, N. Collaborative ‘many to many’ DDoS detection in cloud. Int. J. Hoc Ubiquitous Comput. 2016, 23, 3–4. [Google Scholar]
- Feng, W.C. Making a Case for Efficient Supercomputing: It is Time for the Computing Community to Use Alternative Metrics for Evaluating Performance. Queue 2003, 1, 54–64. [Google Scholar] [CrossRef] [Green Version]
- Akpudo, U.; Jang-Wook, H. A Multi-Domain Diagnostics Approach for Solenoid Pumps Based on Discriminative Features. IEEE Access 2020, 8, 175020–175034. [Google Scholar] [CrossRef]
- Akpudo, U.E.; Hur, J. A Feature Fusion-Based Prognostics Approach for Rolling Element Bearings. J. Mech. Sci. Technol. 2020, 34, 4025–4035. [Google Scholar] [CrossRef]
- Kohonen, T. The self-organizing map. Neurocomputing 1998, 21, 1–6. [Google Scholar] [CrossRef]
- Akpudo, U.E.; Hur, J.-W. A CEEMDAN-Assisted Deep Learning Model for the RUL Estimation of Solenoid Pumps. Electronics 2021, 10, 2054. [Google Scholar] [CrossRef]
- Tang, Z.; Zhang, X.; Niu, J. LDA Model and Network Embedding-Based Collaborative Filtering Recommendation. In Proceedings of the 2019 6th International Conference on Dependable Systems and Their Applications (DSA), Harbin, China, 3–6 January 2020; pp. 283–289. [Google Scholar] [CrossRef]
- Wang, X.; Wang, C. Recommendation system of e-commerce based on improved collaborative filtering algorithm. In Proceedings of the 2017 8th IEEE International Conference on Software Engineering and Service Science (ICSESS), Beijing, China, 24–26 November 2017; pp. 332–335. [Google Scholar] [CrossRef]
- Shi, Z.; Cao, L.; Guan, C.; Zheng, H.; Gu, Z.; Yu, Z.; Zheng, B. Learning Attention-Enhanced Spatiotemporal Representation for Action Recognition. IEEE Access 2020, 8, 16785–16794. [Google Scholar] [CrossRef]
- Lee, N.; Azarian, M.H.; Pecht, M.G. An Explainable Deep Learning-based Prognostic Model for Rotating Machinery. arXiv 2020, arXiv:abs/2004.13608. [Google Scholar]
- Supratak, A.; Li, L.; Guo, Y. Feature extraction with stacked autoencoders for epileptic seizure detection. In Proceedings of the 2014 36th Annual International Conference of the IEEE Engineering in Medicine and Biology Society, Chicago, IL, USA, 26–30 August 2014; pp. 4184–4187. [Google Scholar] [CrossRef]
- Salaria, S.; Arora, S.; Goyal, N.; Goyal, P.; Sharma, S. Implementation and Analysis of an Improved PCA technique for DDoS Detection. In Proceedings of the 2020 IEEE 5th International Conference on Computing Communication and Automation (ICCCA), Greater Noida, India, 30–31 October 2020; pp. 280–285. [Google Scholar] [CrossRef]
- Rehman, A.; Khan, A.; Ali, M.A.; Khan, M.U.; Khan, S.U.; Ali, L. Performance Analysis of PCA, Sparse PCA, Kernel PCA and Incremental PCA Algorithms for Heart Failure Prediction. In Proceedings of the 2020 International Conference on Electrical, Communication, and Computer Engineering (ICECCE), Istanbul, Turkey, 12–13 June 2020; pp. 1–5. [Google Scholar] [CrossRef]
- Vempala, S.S. Learning Convex Concepts from Gaussian Distributions with PCA. In Proceedings of the 2010 IEEE 51st Annual Symposium on Foundations of Computer Science, Las Vegas, NV, USA, 23–26 October 2010; pp. 124–130. [Google Scholar] [CrossRef] [Green Version]
- Ren, M.F.; Liang, Y.; Gong, M.Y. An Improved PCA-based Fault Detection Method for non-Gaussian Systems Using SIP Criterion. In Proceedings of the 2019 IEEE 15th International Conference on Control and Automation (ICCA), Edinburgh, Scotland, 16–19 July 2019; pp. 905–910. [Google Scholar] [CrossRef]
- Akpudo, U.E.; Hur, J.W. Intelligent Solenoid Pump Fault Detection based on MFCC Features, LLE and SVM. In Proceedings of the International Conference on AI in Information and Communication (ICAIIC 2020), Fukuoka, Japan, 19–21 February 2020; pp. 404–408. [Google Scholar] [CrossRef]
- Akpudo, U.E.; Hur, J. An Automated Sensor Fusion Approach for the RUL Prediction of Electromagnetic Pumps. IEEE Access 2021, 9, 38920–38933. [Google Scholar] [CrossRef]
- Hyvärinen, A.; Oja, E. Independent component analysis: Algorithms and applications. Neural Netw. Off. J. Int. Neural Netw. Soc. 2000, 13, 411–430. [Google Scholar] [CrossRef] [Green Version]
- Fox, H.; Pillai, A.C.; Friedrich, D.; Collu, M.; Dawood, T.; Johanning, L. A Review of Predictive and Prescriptive Offshore Wind Farm Operation and Maintenance. Energies 2022, 15, 504. [Google Scholar] [CrossRef]
- Ercan, T.; Papadimitriou, C. Optimal Sensor Placement for Reliable Virtual Sensing Using Modal Expansion and Information Theory. Sensors 2021, 21, 3400. [Google Scholar] [CrossRef] [PubMed]
- Dang, X.; Rong, Z.; Liang, X. Sensor Fusion-Based Approach to Eliminating Moving Objects for SLAM in Dynamic Environments. Sensors 2021, 21, 230. [Google Scholar] [CrossRef] [PubMed]
- Bagheriye, L.; Ali, G.; Kerkhoff, H.G. Life-Time Prognostics of Dependable VLSI-SoCs using Machine-learning. In Proceedings of the 2020 IEEE 26th International Symposium on On-Line Testing and Robust System Design (IOLTS), Napoli, Italy, 13–15 July 2020; pp. 1–4. [Google Scholar] [CrossRef]
- Calhoun, V.D.; Tülay, A. Feature-based fusion of medical imaging data. IEEE Trans. Inf. Technol. Biomed. 2009, 13, 711–720. [Google Scholar] [CrossRef] [PubMed] [Green Version]
- Weidong, J. Fault diagnosis of gearbox by FastICA and residual mutual information based feature extraction. In Proceedings of the 2009 International Conference on Information and Automation, Zhuhai, Macau, 22–25 June 2009; pp. 928–932. [Google Scholar] [CrossRef]
- Lee, T.W.; Girolami, M.; Sejnowski, T.J. Independent Component Analysis Using an Extended Infomax Algorithm for Mixed Subgaussian and Supergaussian Sources. Neural Comput. 1999, 11, 417–441. [Google Scholar] [CrossRef] [PubMed]
- Sun, C.; He, Z.; Cao, H.; Zhang, Z.; Chen, X.; Zuo, M.J. A Non-Probabilistic Metric Derived From Condition Information for Operational Reliability Assessment of Aero-Engines. IEEE Trans. Reliab. 2015, 64, 167–181. [Google Scholar] [CrossRef]
- Duan, L.; Zhao, F.; Wang, J.; Wang, W.; Zhang, J. An Integrated Cumulative Transformation and Feature Fusion Approach for Bearing Degradation Prognostics. Shock Vib. 2018, 2018, 9067184. [Google Scholar] [CrossRef] [Green Version]
- Coble, J.B. Merging Data Sources to Predict Remaining Useful Life—An Automated Method to Identify Prognostic Parameters. Ph.D. Thesis, Department of Nuclear Engineering, University of Tennessee, Knoxville, TN, USA, 2010. Available online: https://trace.tennessee.edu/utk_graddiss/683/ (accessed on 13 January 2022).
- Coble, J.; Hines, J. Identifying Optimal Prognostic Parameters from Data: A Genetic Algorithms Approach. In Proceedings of the Annual Conference of the Prognostics and Health Management Society, San Diego, CA, USA, 27 September–1 October 2009. [Google Scholar]
- Saxena, A.; Goebel, K. NASA Ames Research Center, Moffett Field, CA. Turbofan Engine Degradation Simulation Data Set. Nasa Ames Prognostics. Data Repository. Available online: http://ti.arc.nasa.gov/project/prognostic-data-repository (accessed on 20 September 2021).
- von Birgelen, A.; Buratti, D.; Mager, J.; Niggemann, O. Self-Organizing Maps for Anomaly Localization and Predictive Maintenance in Cyber-Physical Production Systems. Procedia CIRP 2018, 72, 480–485. [Google Scholar] [CrossRef]
Publisher’s Note: MDPI stays neutral with regard to jurisdictional claims in published maps and institutional affiliations. |
© 2022 by the authors. Licensee MDPI, Basel, Switzerland. This article is an open access article distributed under the terms and conditions of the Creative Commons Attribution (CC BY) license (https://creativecommons.org/licenses/by/4.0/).