Article

Laminar Burning Speed of Aviation Kerosene at Low Pressures

1
School of Aerospace Engineering, Tsinghua University, Beijing 100084, China
2
School of Aeronautics and Astronautics, Sun Yat-sen University, Shenzhen 518107, China
3
Key Laboratory of Light Duty Gas Turbine, Institute of Engineering Thermophysics, Chinese Academy of Sciences, Beijing 100190, China
*
Author to whom correspondence should be addressed.
Energies 2022, 15(6), 2191; https://doi.org/10.3390/en15062191
Submission received: 1 March 2022 / Revised: 11 March 2022 / Accepted: 14 March 2022 / Published: 17 March 2022
(This article belongs to the Special Issue Fuel Technology in Aviation and Aerospace)

Abstract

:
Aero-engine combustors may experience extreme low pressures in the case of an in-flight shutdown, which makes the study of aviation kerosene flame propagation characteristics at low pressures important. The present work examined flame propagation during the combustion of aviation kerosene over the pressure range from 25 to 100 kPa using a constant-volume bomb apparatus. The laminar burning speeds at different initial pressures, temperatures and equivalence ratios were measured and compared. In addition, numerical simulations were used to examine the reaction sensitivity of the laminar burning speed at low pressure. In trials at the lean flammability limit, the data indicated that it was more difficult to ignite the fuel under a lower pressure condition of 25 kPa and a lower temperature condition of 420 K. The experimental results of laminar burning speed were fitted to an equation providing the laminar burning speeds expected at different pressures (25–100 kPa), temperatures (400–480 K) and equivalence ratios (0.8–1.5). The temperature index ( α = 1.76 ) and pressure index ( β = 0.15 ) of the fitting equation were obtained. Both hydrodynamic and diffusional thermal flame instabilities were found to be suppressed at low pressures. The negative effects of two specific reactions on laminar burning speed were greatly reduced at these same low pressures of 25 kPa.

1. Introduction

Aero-engines function under extreme conditions involving high temperatures and pressures, fast flow rates and rapid rotation, all of which result in frequent in-flight shutdown incidents. The ignition and combustion characteristics of aviation kerosene are one of the most important factors determining the chances of the successful high-altitude relight of an aero-engine after an in-flight shutdown [1,2]. In the case of a shutdown, power transfer from the turbine to the compressor ceases, such that the compressor speed drops rapidly and the unit eventually enters a windmill state. As an example, after an aero-engine has been stopped for just 30 s, the pressure ratio of the compressor will have fallen to only 20% of the design value [3], such that both the inlet temperature and the pressure in the combustor will also rapidly decrease. As a consequence of this low temperature and pressure, the evaporation and ignition of aviation kerosene as well as flame propagation become more difficult. Therefore, the flame propagation characteristics of aviation kerosene at low pressures are a vital consideration.
Many previous studies have focused on the burning speed obtained using aviation kerosene and various model fuels. Liu et al. [4] developed a surrogate for kerosene comprising n-dodecane, n-decane, iso-cetane, methylcyclohexane and toluene at molar percentages of 10%, 14%, 30%, 36% and 10%, respectively, and measured laminar burning speeds S u 0 in a constant volume bomb at initial pressures P of 100 and 300 kPa with initial temperatures T of 390, 400 and 420 K. Zheng et al. [5] also developed a model kerosene substitute based on n-decane, n-dodecane, ethylcyclohexane and p-xylene with molar percentages of 40%, 42%, 13% and 5%, respectively. Counterflow twin-flame experiments were carried out using this fuel to determine the S u 0 of both actual kerosene and the surrogate fuel at 100 kPa. Fu et al. [6] measured the S u 0 of both actual kerosene and a surrogate fuel (n-decane, n-dodecane, isohexadecane, methylcyclohexane and toluene at molar percentages of 14%, 10%, 30%, 36% and 10%, respectively) at initial T of 390 and 420 K and initial P of 100 and 300 kPa. Vukadinovic et al. [7] studied the influences of pressure and temperature on S u 0 and the Markstein number of kerosene Jet A-1 at initial temperatures of 373, 423 and 473 K and initial pressures from 100 to 800 kPa. Several other works [8,9,10], in all of which the initial pressure condition was no less than 100 kPa, also focused on the S u 0 of kerosene and its surrogate fuels.
The S u 0 of different fuels will exhibit different responses to pressure changes. Metghalchi et al. [11,12,13] conducted many measurements of the S u 0 of different fuels and analyzed the effects of pressure and temperature on S u 0 . In the review of Konnov et al. [14], the relationship between pressure and S u 0 of various fuels is mentioned, while most studies have not focused on low pressure. Xie et al. [15] studied the effect of pressure variations on methane combustion characteristics in a constant volume bomb. This prior work found that S u 0 initially decreased and then increased as the P was increased over the range of 40 to 160 kPa. This trend was attributed to changes in the combustion reaction order as the pressure was raised. Wang et al. [16] experimentally studied the effects of T, P and other factors on the S u 0 of propane and reported that, within the range of 50–450 kPa, S u 0 decreased exponentially with increases in P.
Previous studies have primarily employed model fuels as surrogates for aviation kerosene and assessed the S u 0 of these substances at P above 100 kPa. In contrast, there has been relatively little research concerning flame propagation and ignition probability at low pressures. The main goal of the present study was therefore to systematically investigate S u 0 and the ignition probability of aviation kerosene under low-pressure conditions. In this work, S u 0 were assessed over the pressure range of 25 to 100 kPa and correlations were developed via regression calculations. Finally, the reaction sensitivity of aviation kerosene was investigated at the same low pressures.

2. Materials and Methods

2.1. Experimental Method

The spherical flame method is a commonly used method for S u 0 measurements [14,17]. In this work, experiments were carried out using a newly developed, fan-stirred, constant-volume bomb apparatus. A diagram of the experimental setup is provided in Figure 1. The apparatus consisted of a cylindrical, stainless-steel combustion chamber with an inner diameter of 220 mm and a length of 400 mm that allowed ignition experiments to be performed at an initial P of up to 2.0 MPa. Band heaters with a total power of 6.5 KW were installed on the side walls of this chamber to heat the combustible mixture to a temperature as high as 573 K. The unburnt gas temperature was measured before ignition using two thermal couples, which were set at radius of 5 cm in the chamber. The temperature difference between the two thermal couples was within 1 K, representing a good temperature uniformity in the chamber. All trials under the same initial temperatures were conducted with differences within 3 K, showing a good experimental repeatability. A 100 mm diameter quartz window was mounted at either end of the chamber, allowing the optical assessment of the combustion process. Prior to each experiment, the combustion chamber was electrically heated to a preset temperature and evacuated using a vacuum pump. A pre-calculated volume of fuel (the amount necessary for the desired equivalence ratio, Φ) was subsequently injected into the chamber using a highly accurate syringe. After the liquid fuel was completely evaporated, high-purity compressed air was introduced into the chamber to provide both the desired Φ and initial pressure. The fans were then activated to homogenize the gas phase mixture in the chamber. During laminar flame experiments, the fans were turned off after 2 min and the combustible mixture was allowed to stand for 5 min to become fully quiescent, after which the mixture was ignited at its center by an electrode. A signal was simultaneously generated by the ignitor to trigger a high-speed camera (Photron Fastcam SA-Z) operating at a frequency of 10,000 frames per second to capture schlieren images of the flame evolution.

2.2. Laminar Burning Speed

Typical schlieren images obtained from the above experimental device are shown in Figure 2. During the early stage of flame propagation, when the flame was still relatively small, the pressure change in the constant-volume bomb was minimal and had little effect on S u 0 . In this study, the range of radius data that were taken for flame speed S b was 1.5–3.0 cm. Consequently, combustion under these conditions could be considered to be a constant pressure process. According to the expected behavior of a constant pressure combustion process, the combustion of the premixed gas in the constant-volume bomb gradually propagated outward as a spherical flame, and the high-speed camera was used to obtain schlieren images of this flame propagation. The post-processing of images of the expanding spherical flame was used to determine the propagation speed of the flame surface, S b , based on the equation
S b = d R / d t ,
where R is the flame radius and t is elapsed time. A non-linear extrapolation method [18] was employed to calculate the un-stretched propagation speed, S b 0 , using the equation
ln ( S b ) = ln ( S b 0 ) 2 S b 0 L b / ( R S b ) ,
where L b   is the Markstein length. Finally, S u 0 , could be obtained as
S u 0 = S b 0 / σ ,
where σ is the ratio of the density of the unburned gas to that of the burned gas.

3. Results

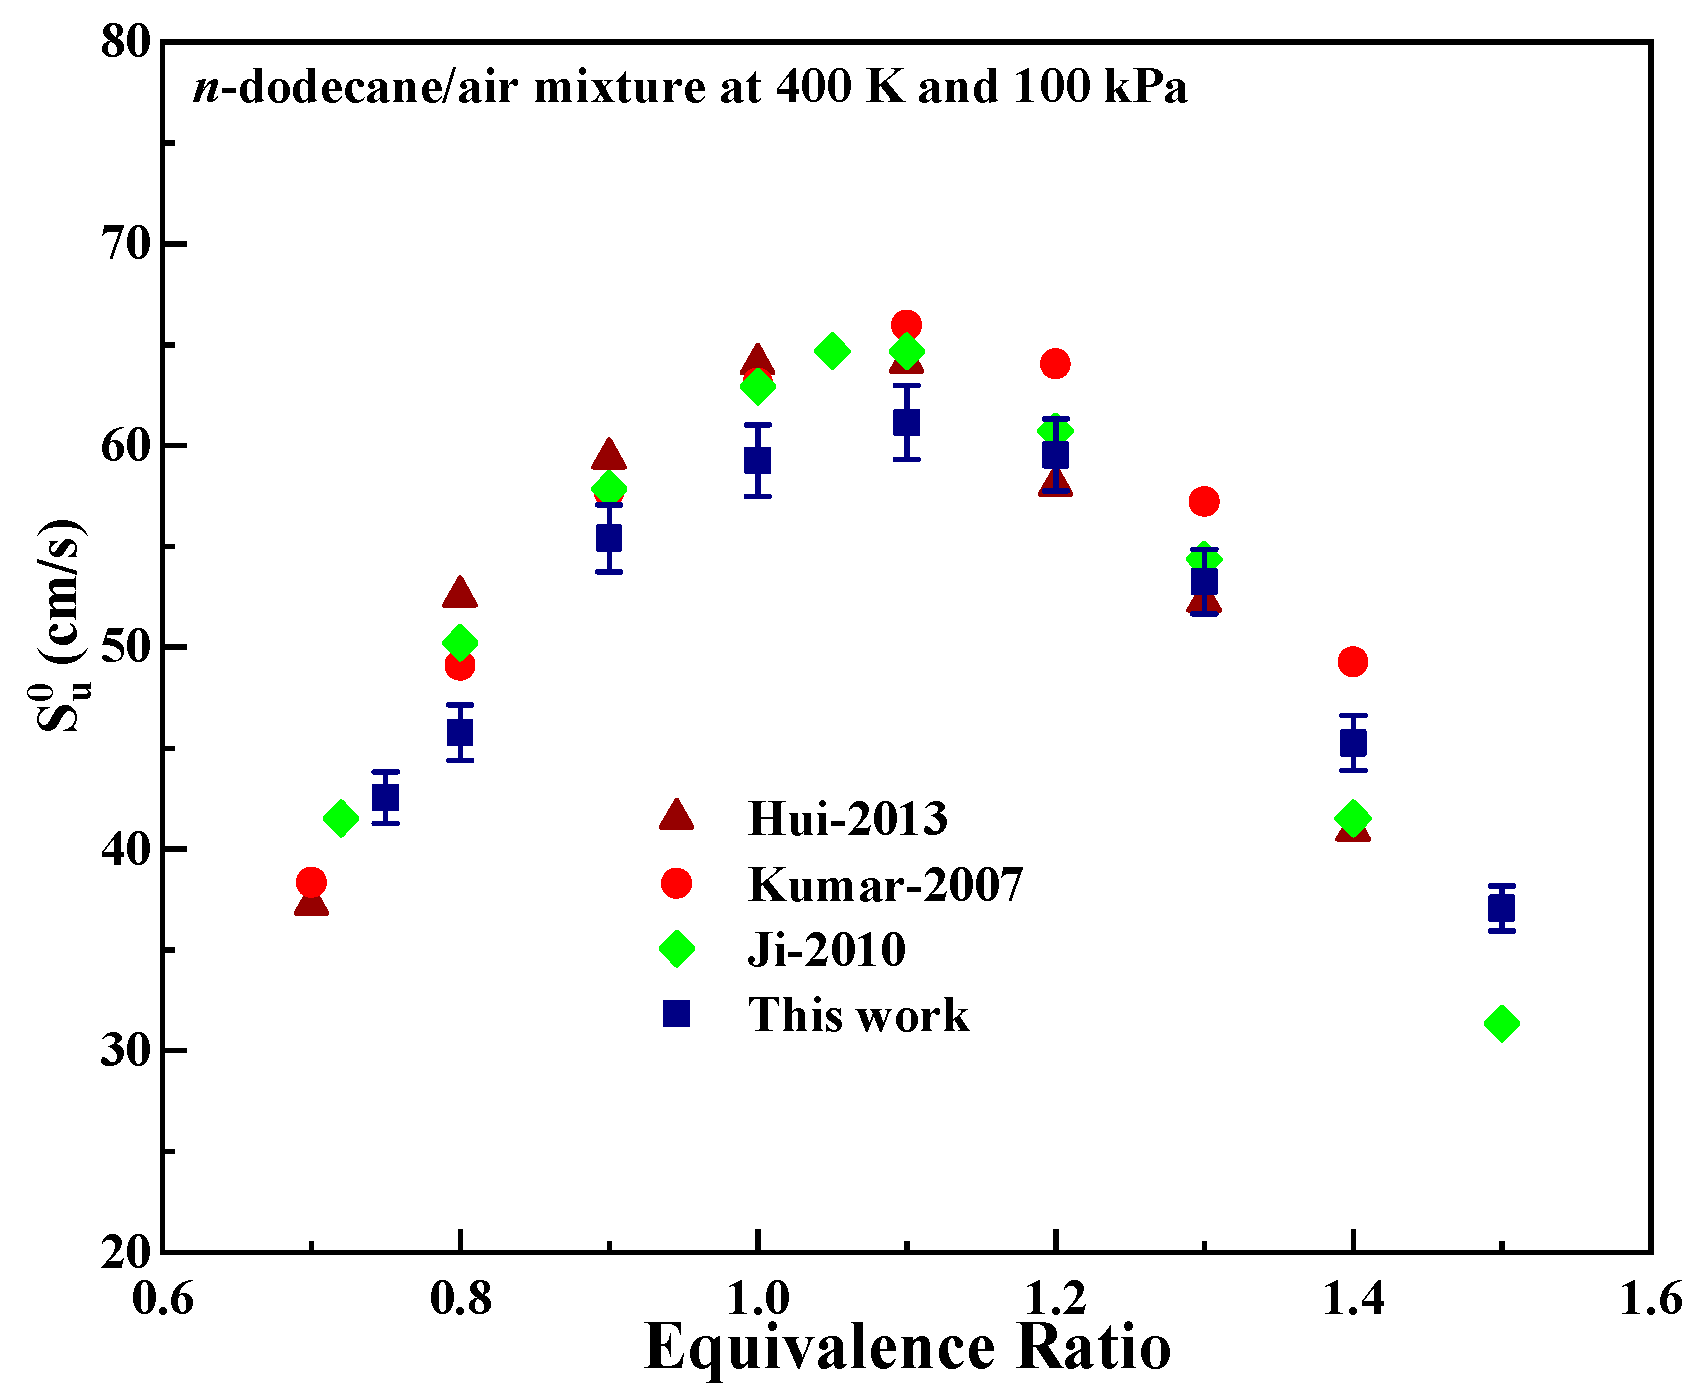
3.1. Validation Experiment Results

N-dodecane is one of the most common hydrocarbon fuels, and therefore its S u 0 has been studied extensively. For this reason, the S u 0 of n-dodecane was determined using the present experimental setup to verify the proper functioning of this apparatus. Figure 3 compares the S u 0 obtained for n-dodecane in the present work with values reported in the literature based on experimental trials [19,20,21]. The data from the apparatus used in the present research can be seen to be in good agreement with those of previous work, confirming the adequate performance of the constant-volume bomb.

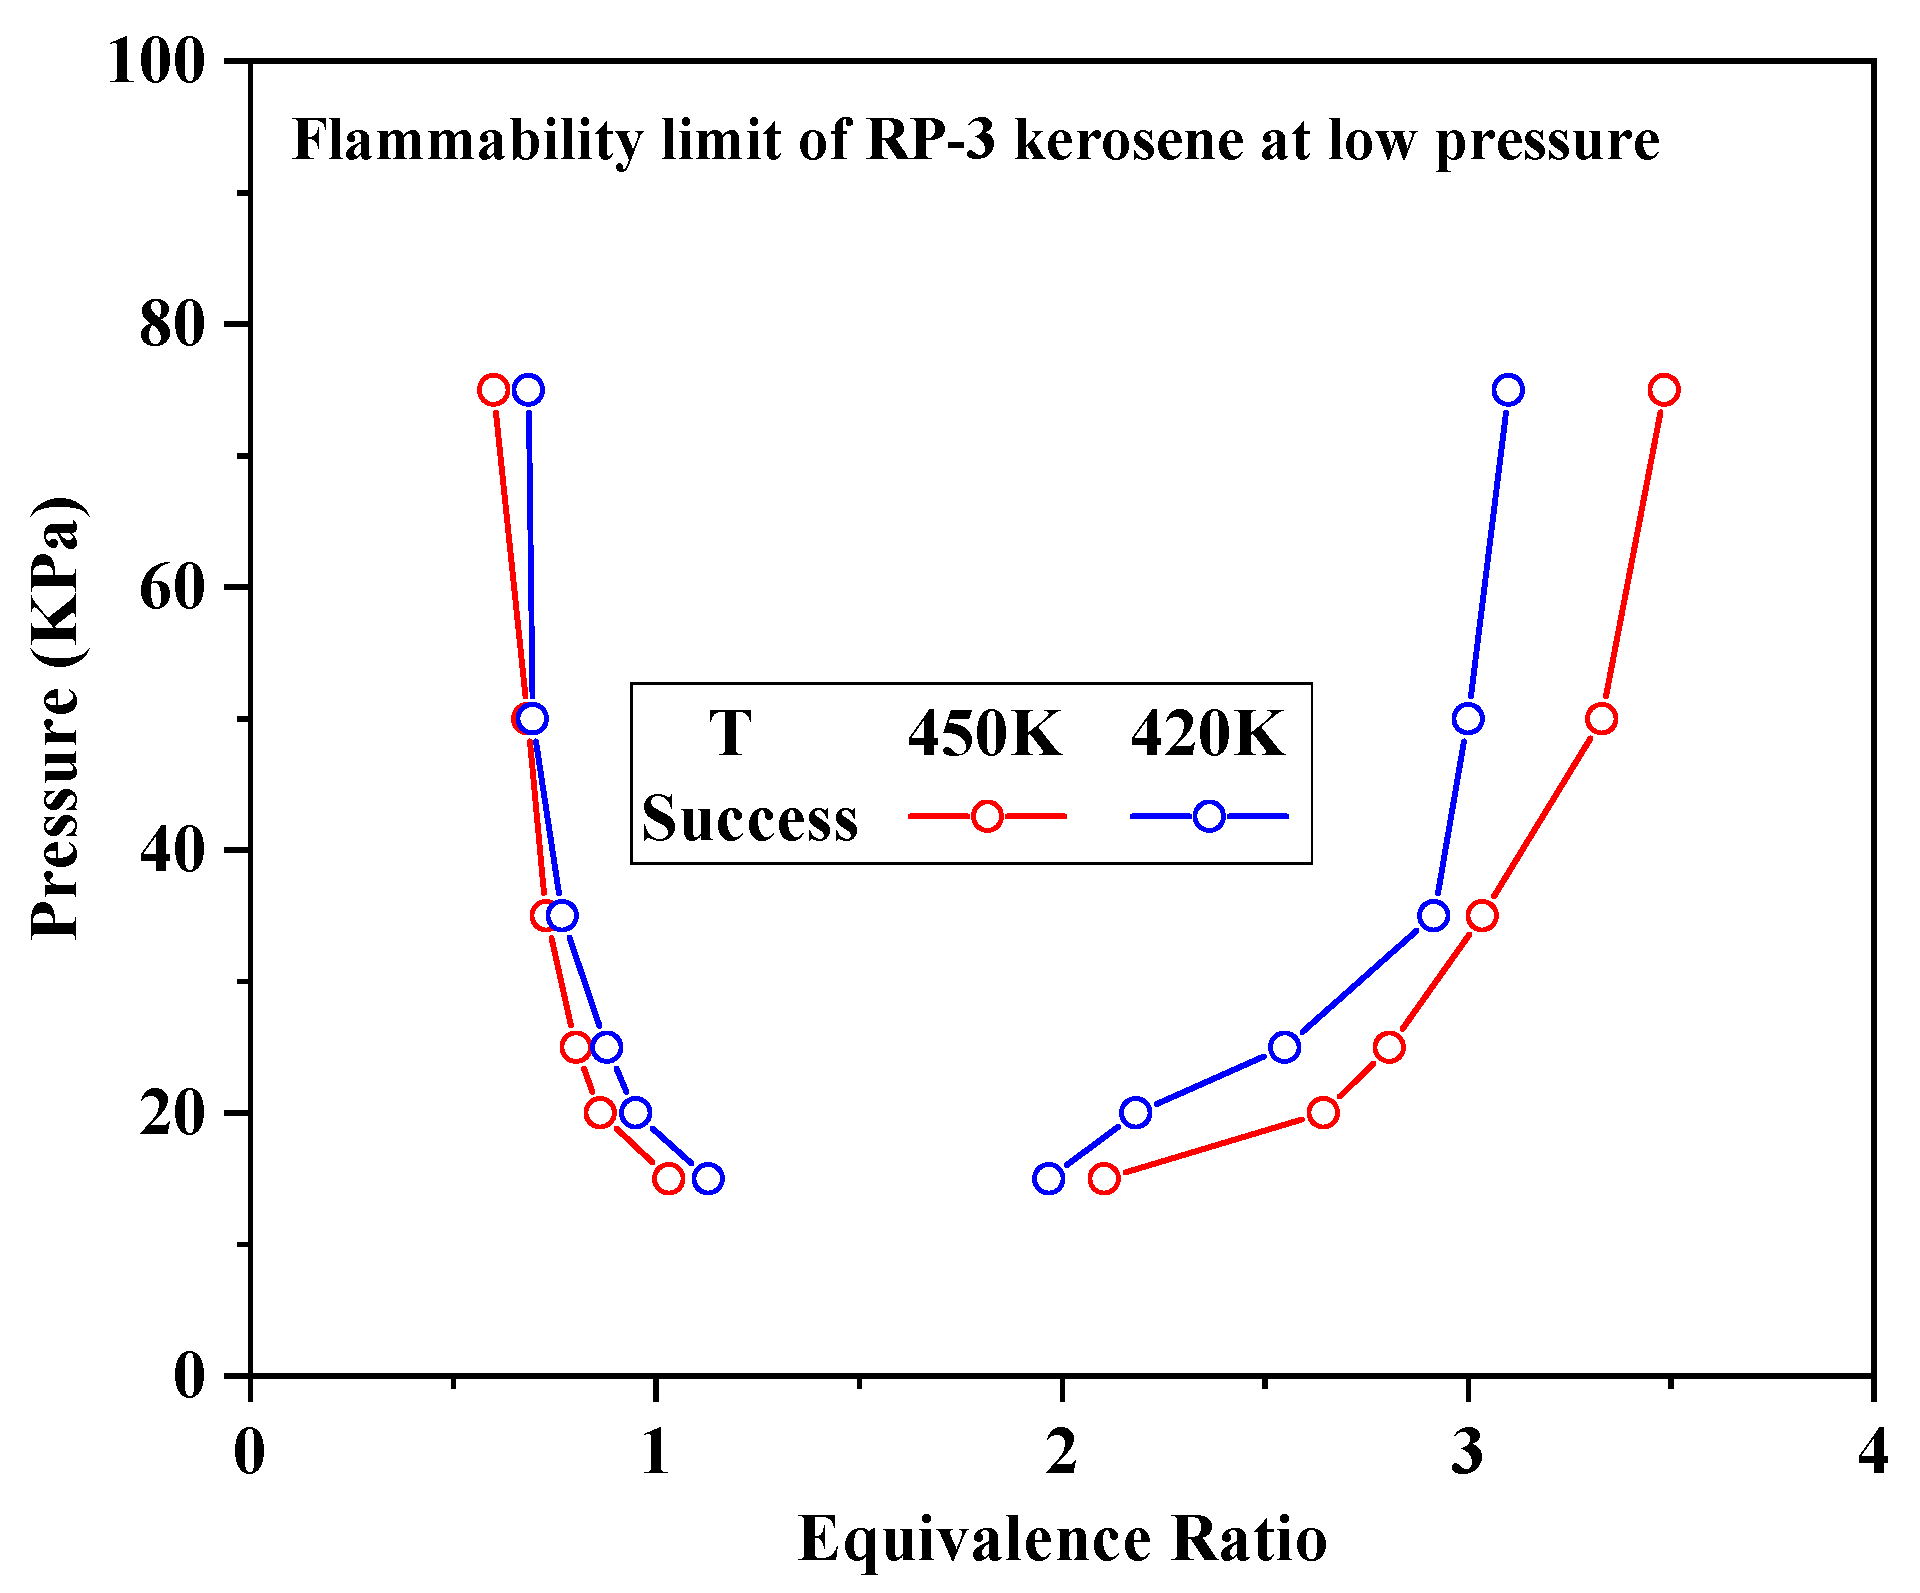
3.2. Determination of Initial T, P and Φ Ranges of Experiments

Using standard procedures for calculating engine performance [22], the temperature and pressure of the flow field in the combustion chamber of an aero-engine at an altitude of 10–20 km and a flight speed of 0.4–2.0 Ma were estimated. Under these conditions, the temperature and pressure at the combustion chamber inlet were predicted to be in the ranges of 322–578 K and 17–586 kPa, respectively. The flammability limit of the kerosene in the present apparatus was determined based on the use of schlieren images to assess whether or not successful ignition was achieved in various trials. During these trials, flame propagation was assumed to indicate ignition. Figure 4 plots the flammability limit data acquired at initial temperatures of 420 and 450 K and the relatively low pressure in the range of 15–75 kPa as functions of Φ. During these experiments, the equivalence ratio was reduced gradually in intervals of approximately 0.01, working near the lean flammability limit. If three successive ignition failures occurred in a given set of conditions, the equivalence ratio under those conditions was taken to equal the flammability limit. These plots demonstrate that decreasing the pressure gradually increased and decreased the lean and rich flammability limit equivalence ratios, respectively. Therefore, a lower pressure inhibited the ignition of the fuel. Comparing the flammability limits associated with the two initial temperatures, it is apparent that ignition was achieved more readily at the higher temperature. This effect occurred because the higher temperature increased the proportion of reactants that reached the activation energy required for the reaction.
Because pressure and temperature were estimated during the flammability limit experiments, it was important to assess the actual environment within the constant-volume combustion bomb used in this work. The bomb was able to vaporize the liquid fuel and to heat the gas phase to temperatures as high as 573 K, although the premixed combinations of kerosene and air would undergo automatic self-ignition at 500 K. Conversely, at temperatures lower than 390 K, the liquid aviation kerosene did not readily evaporate at high pressures and high equivalence ratios, potentially leading to large experimental errors. For these reasons, the optimal temperature range for the present study was determined to be 400–480 K. In addition, at P lower than 25 kPa, ignition was inhibited and the range of Φ over which ignition was possible was greatly reduced. Therefore, the appropriate pressure range for this study was determined to be 25–100 kPa.
The S u 0 of aviation kerosene was determined at various T and P, as shown in Table 1. Although the rich flammability limit at all P and T was greater than Φ = 1.5, unstable flame propagation had a significant effect on S u 0 measurements at higher ratios [23]; thus, the highest equivalence ratio used in the present work was 1.5. The lean flammability limit changed with variations in pressure and temperature; thus, the equivalence ratio used in this work was changed from the lean flammability limit to 1.5 accordingly.

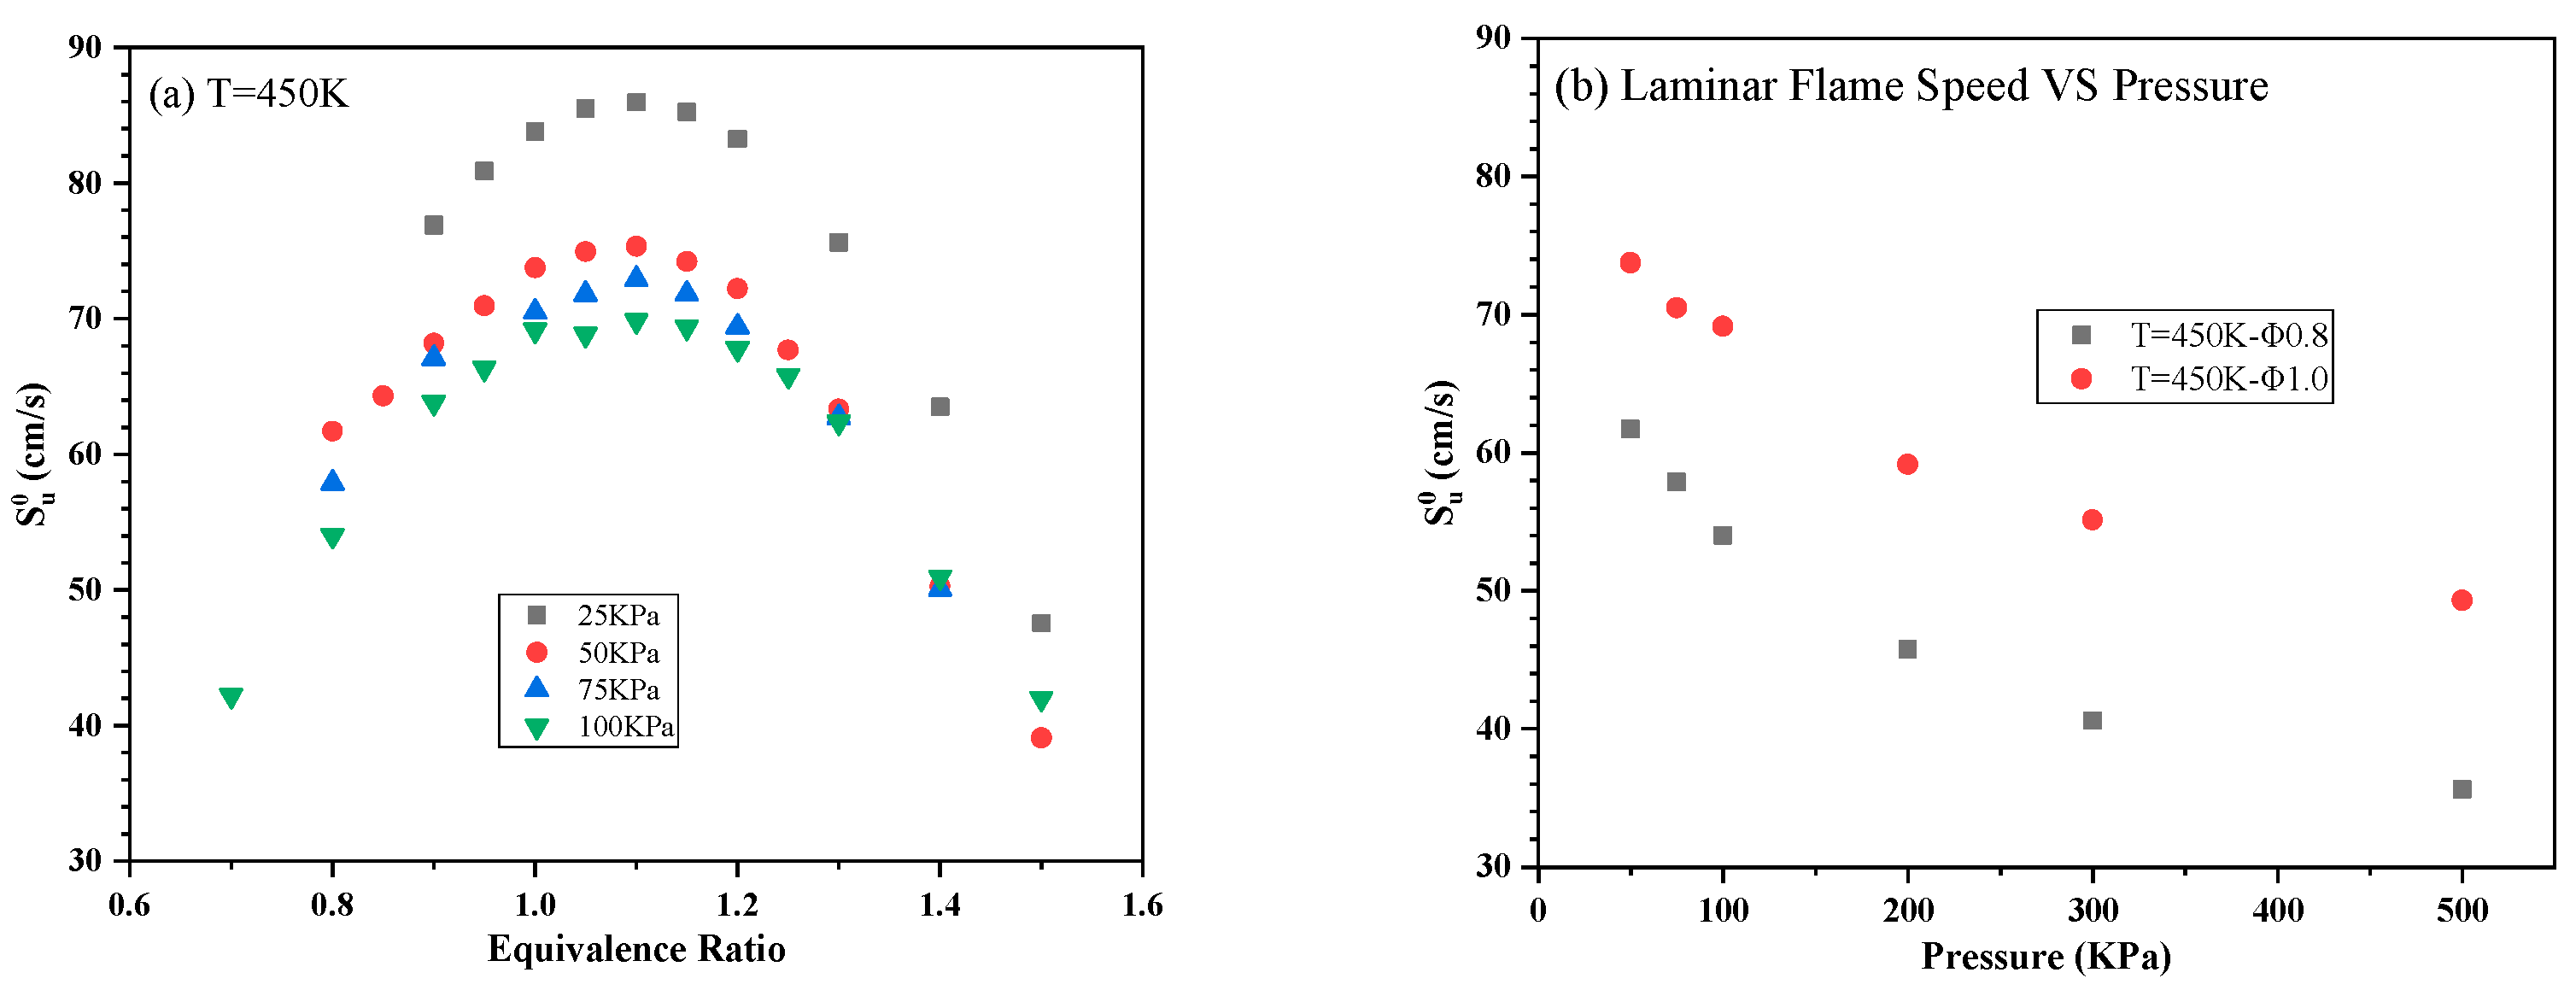
3.3. Laminar Burning Speed of Aviation Kerosene

Figure 5 presents schlieren images of laminar flames acquired using different P and Φ at a T of 450 K. The off-center flame in the first image (Φ = 0.8 and P = 25 kPa) is attributed to a buoyancy effect, because flame propagation in this trial was very slow. It is evident that Φ of 0.8 and 1.0 gave very smooth flame surfaces, while the flame surface was broken into cells at P = 100 kPa and Φ = 1.4. Decreasing the pressure at Φ = 1.4 caused the flame surface to gradually become smooth again, indicating that the extent of flame instability was reduced.
The S u 0 obtained in trials with aviation kerosene at different initial T, P and Φ are summarized in Figure 6 and Figure 7. The same maximum S u 0 value was obtained at a Φ of 1.1 at all pressures and temperatures. An increase in S u 0 can be observed as the initial temperature rises and the initial pressure decreases.

4. Discussion

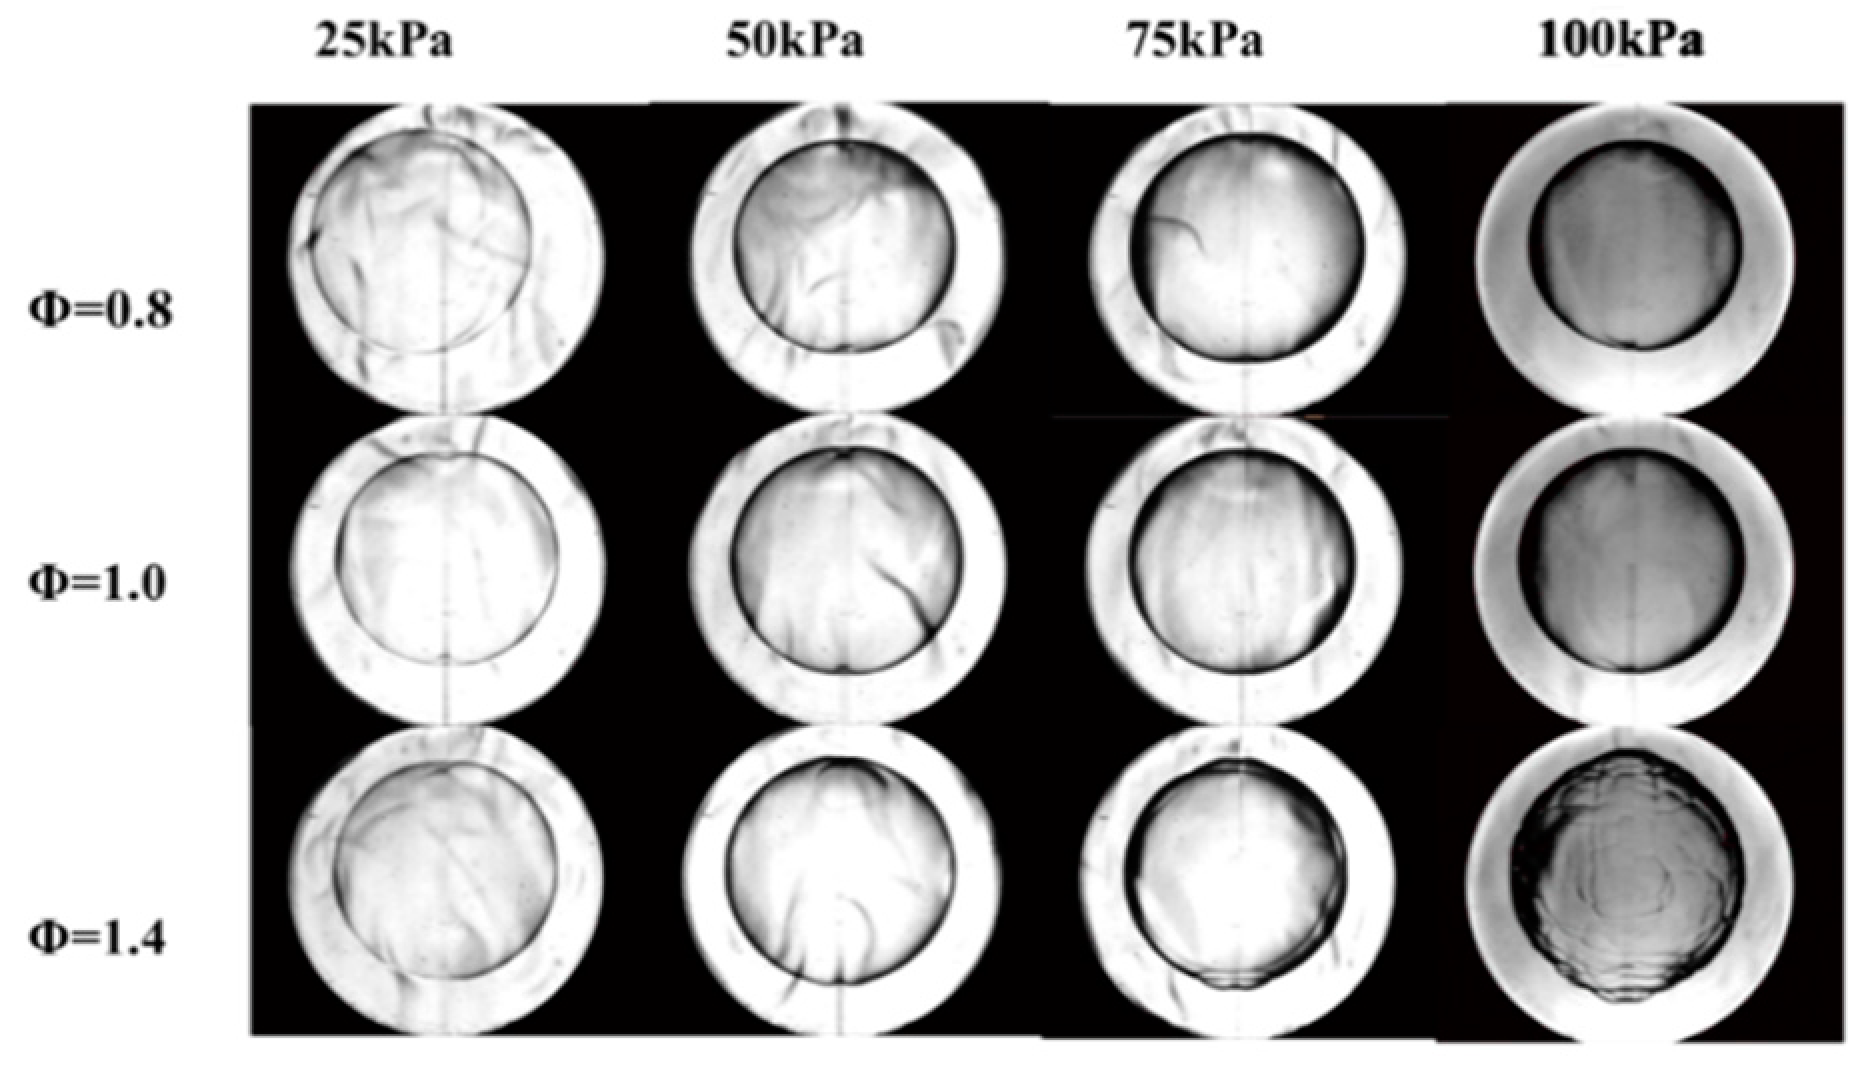
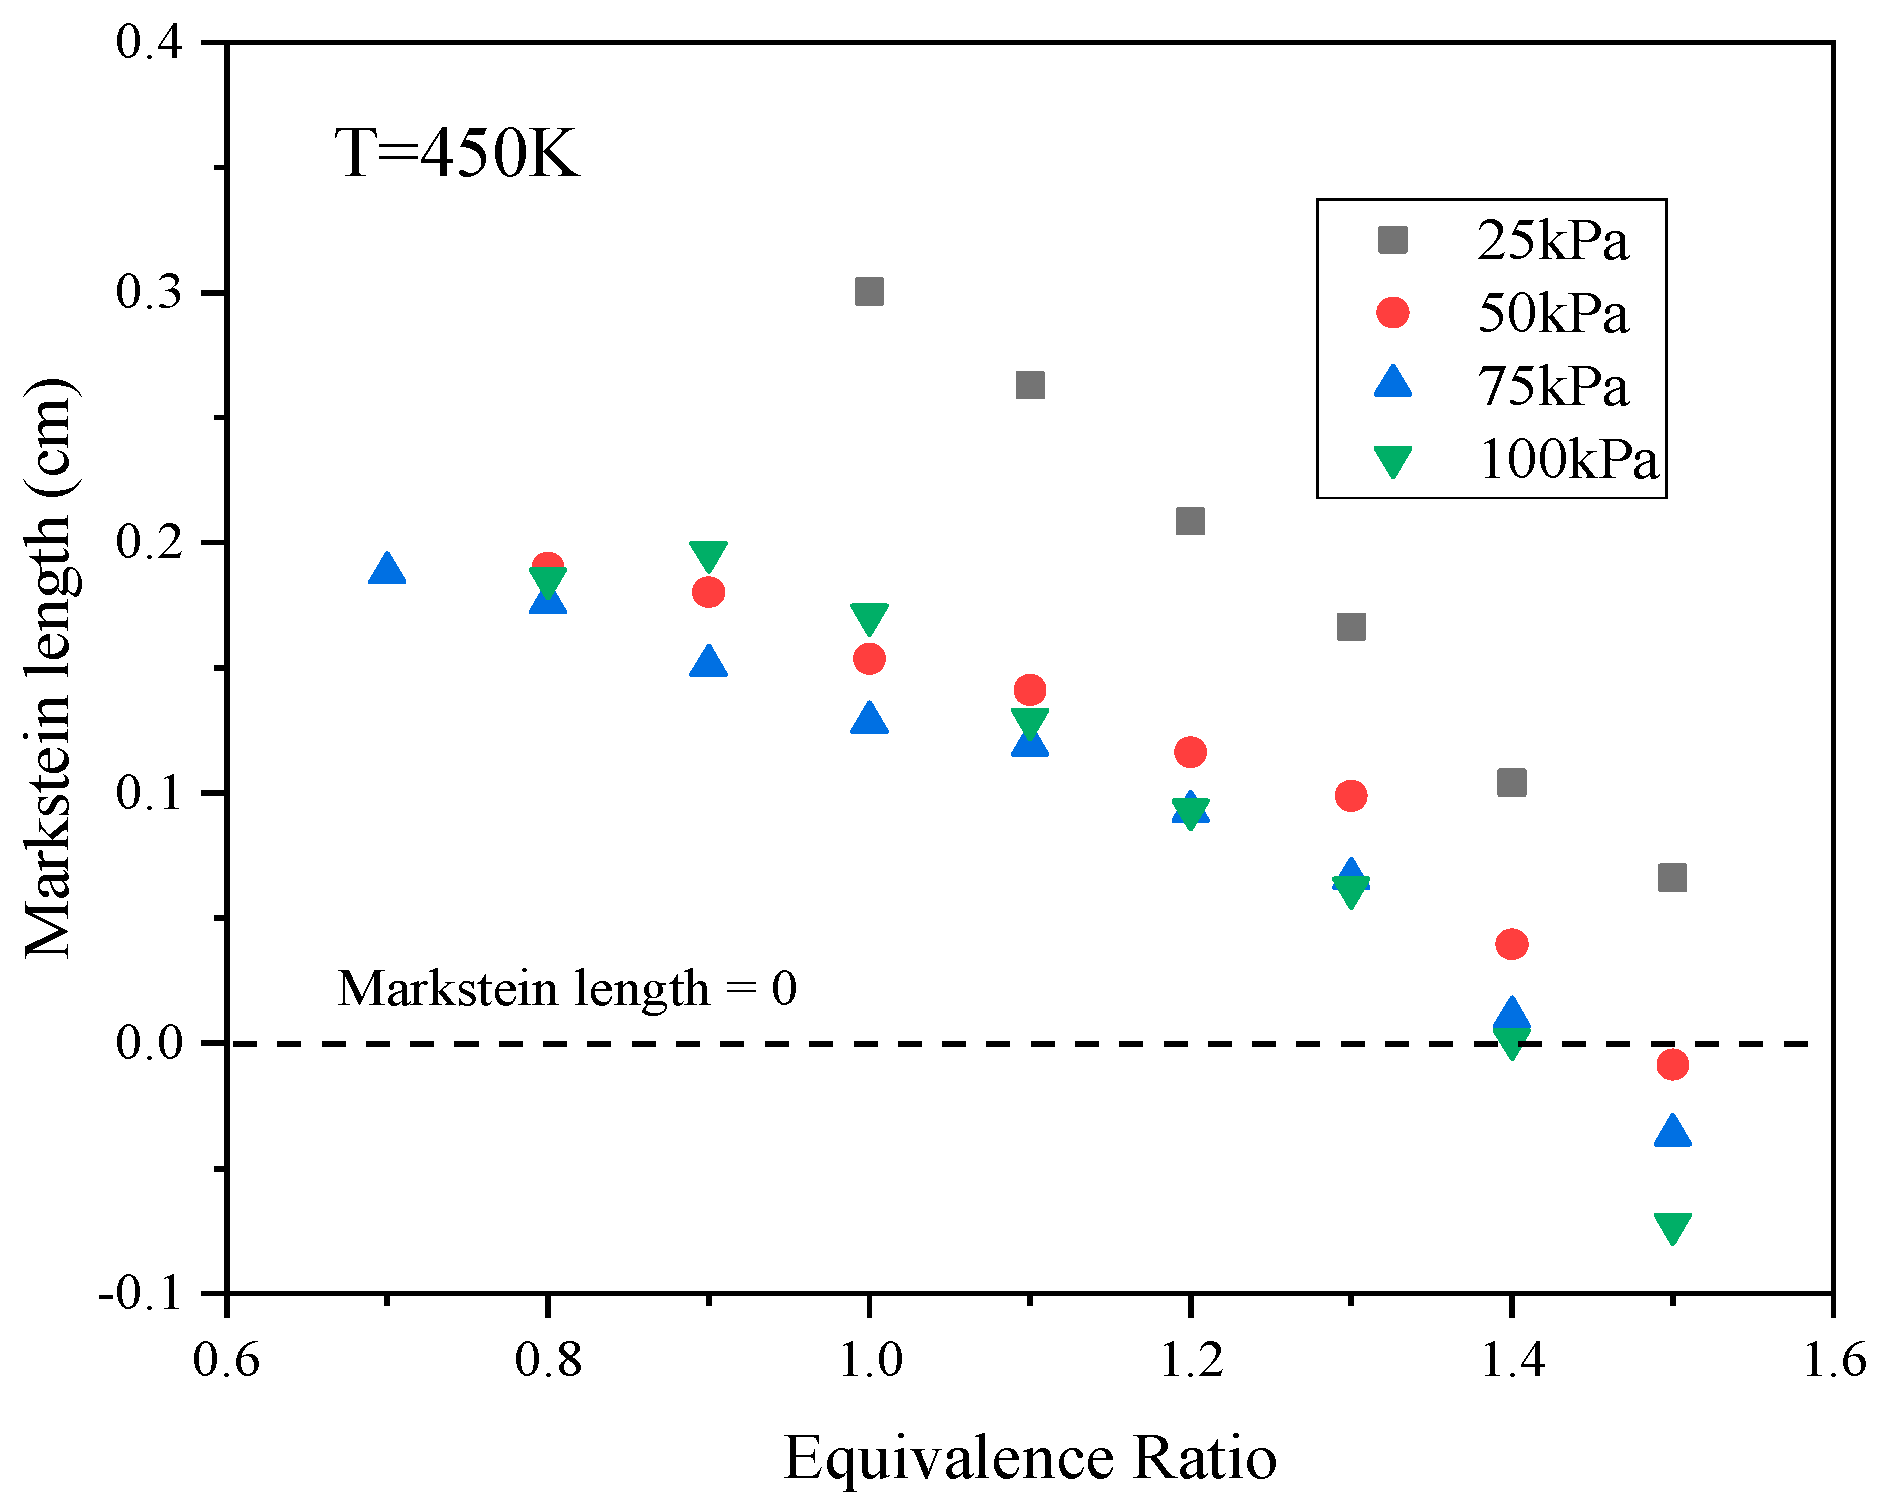
4.1. Flame Instabilities at Low Pressure

At high pressures and high equivalence ratios, flame propagation was evidently unstable, for which two causes can be proposed [23]. One possible reason is the occurrence of hydrodynamic instability, also known as Darieus–Landau (DL) instability, which usually appears above 100 kPa. DL instability is a consequence of a large difference in absolute density between the front and back of the flame, such that the flame surface is very thin. These conditions increase the degree of fluid discontinuity at the flame surface. The other possible reason is diffusional thermal (DT) instability, which is typically observed at Φ values above 1.4. This effect appears in cases where the Markstein length L b of the flame is less than 0. Under such conditions, S u 0 will be positively correlated with the stretch rate, such that the flame response to small disturbances becomes greater and cellular instability occurs at the flame surface.
As shown in Figure 5, at low pressures, the effects of these two instability mechanisms will be significantly different from those at high pressures. In the case of a laminar flame, the density difference between the flame’s front and back will be minimal at low pressures, and a thick flame will be obtained. This scenario results in a high degree of flow continuity, as a consequence of which DL instability is suppressed. Figure 5 demonstrates that DT instability appeared at P = 100 kPa with Φ = 1.4, but was inhibited at P = 25 kPa. Figure 8 shows the variations in L b values at different P with changes in Φ. It can be seen that L b decreased significantly with increases in Φ at higher pressures and was much lower than 0 when Φ was equal to or greater than 1.4. The DT instability would be expected to remain strong in this range. At the lowest pressure, L b changed more slowly with increases in Φ. As such, within the range in which Φ was equal to or greater than 1.4, L b was slightly greater than 0 and, accordingly, the degree of DT instability was greatly reduced.

4.2. Corelation Equation of S u 0

Figure 6a demonstrates that decreasing the initial T from 480 to 420 K at a constant P of 50 kPa increased the lean flammability limit from 0.8 to 0.9. As shown in Figure 7a, decreasing the pressure from 100 to 25 kPa at a constant T of 450 K also increased the lean flammability limit from 0.8 to 0.9. These results indicate that ignition difficulties could occur under low-pressure and low-temperature conditions. These data also confirm that S u 0 of aviation kerosene increases along with the initial temperature. Specifically, combustion is promoted by the more rapid chemical reactions and enhanced mass diffusion at higher temperatures, which in turn accelerate flame propagation. Figure 6b and Figure 7b show the relationships between S u 0   and T or P more directly. It is apparent that S u 0 increased exponentially with temperatures between 400 and 480 K but decreased according to a negative power growth law with increases in P.
It is helpful to be able to predict the S u 0 of fuels in order to perform simulations in conjunction with hybrid computational fluid dynamics calculations [24]. The most widely used equation for this purpose [25] is the power law
S u 0 ( T , P , ) = S u 0 0 ( ) · ( T T 0 ) α · ( P P 0 ) β ,
where S u 0 is a function of T , P and Φ. S u 0 0 is the laminar burning speed under reference conditions consisting of T 0   and P 0 and can be expressed as
S u 0 0 ( ) = a 4 + b 3 + c 2 2 + d + e .
In the present study, the reference conditions were T 0 = 450   K and P 0 = 100 kPa. The coefficients in Equations (4) and (5) were obtained by fitting the experimental results obtained using Φ ranging from 0.7 to 1.5, employing a least squares estimation process. This gave the equation
S u 0 = ( 199 4 878 3 + 1242 2 613 + 117 ) · ( T T 0 ) 1.76 · ( P P 0 ) 0.15 .
A comparison between the predicted and experimental values for S u 0 is shown in Figure 9. This plot demonstrates good agreement (errors within 5%), with the exception of some data acquired under fuel-rich conditions. Under these conditions, the uncertainty in the data was much larger as a consequence of the flame propagation instabilities described above.

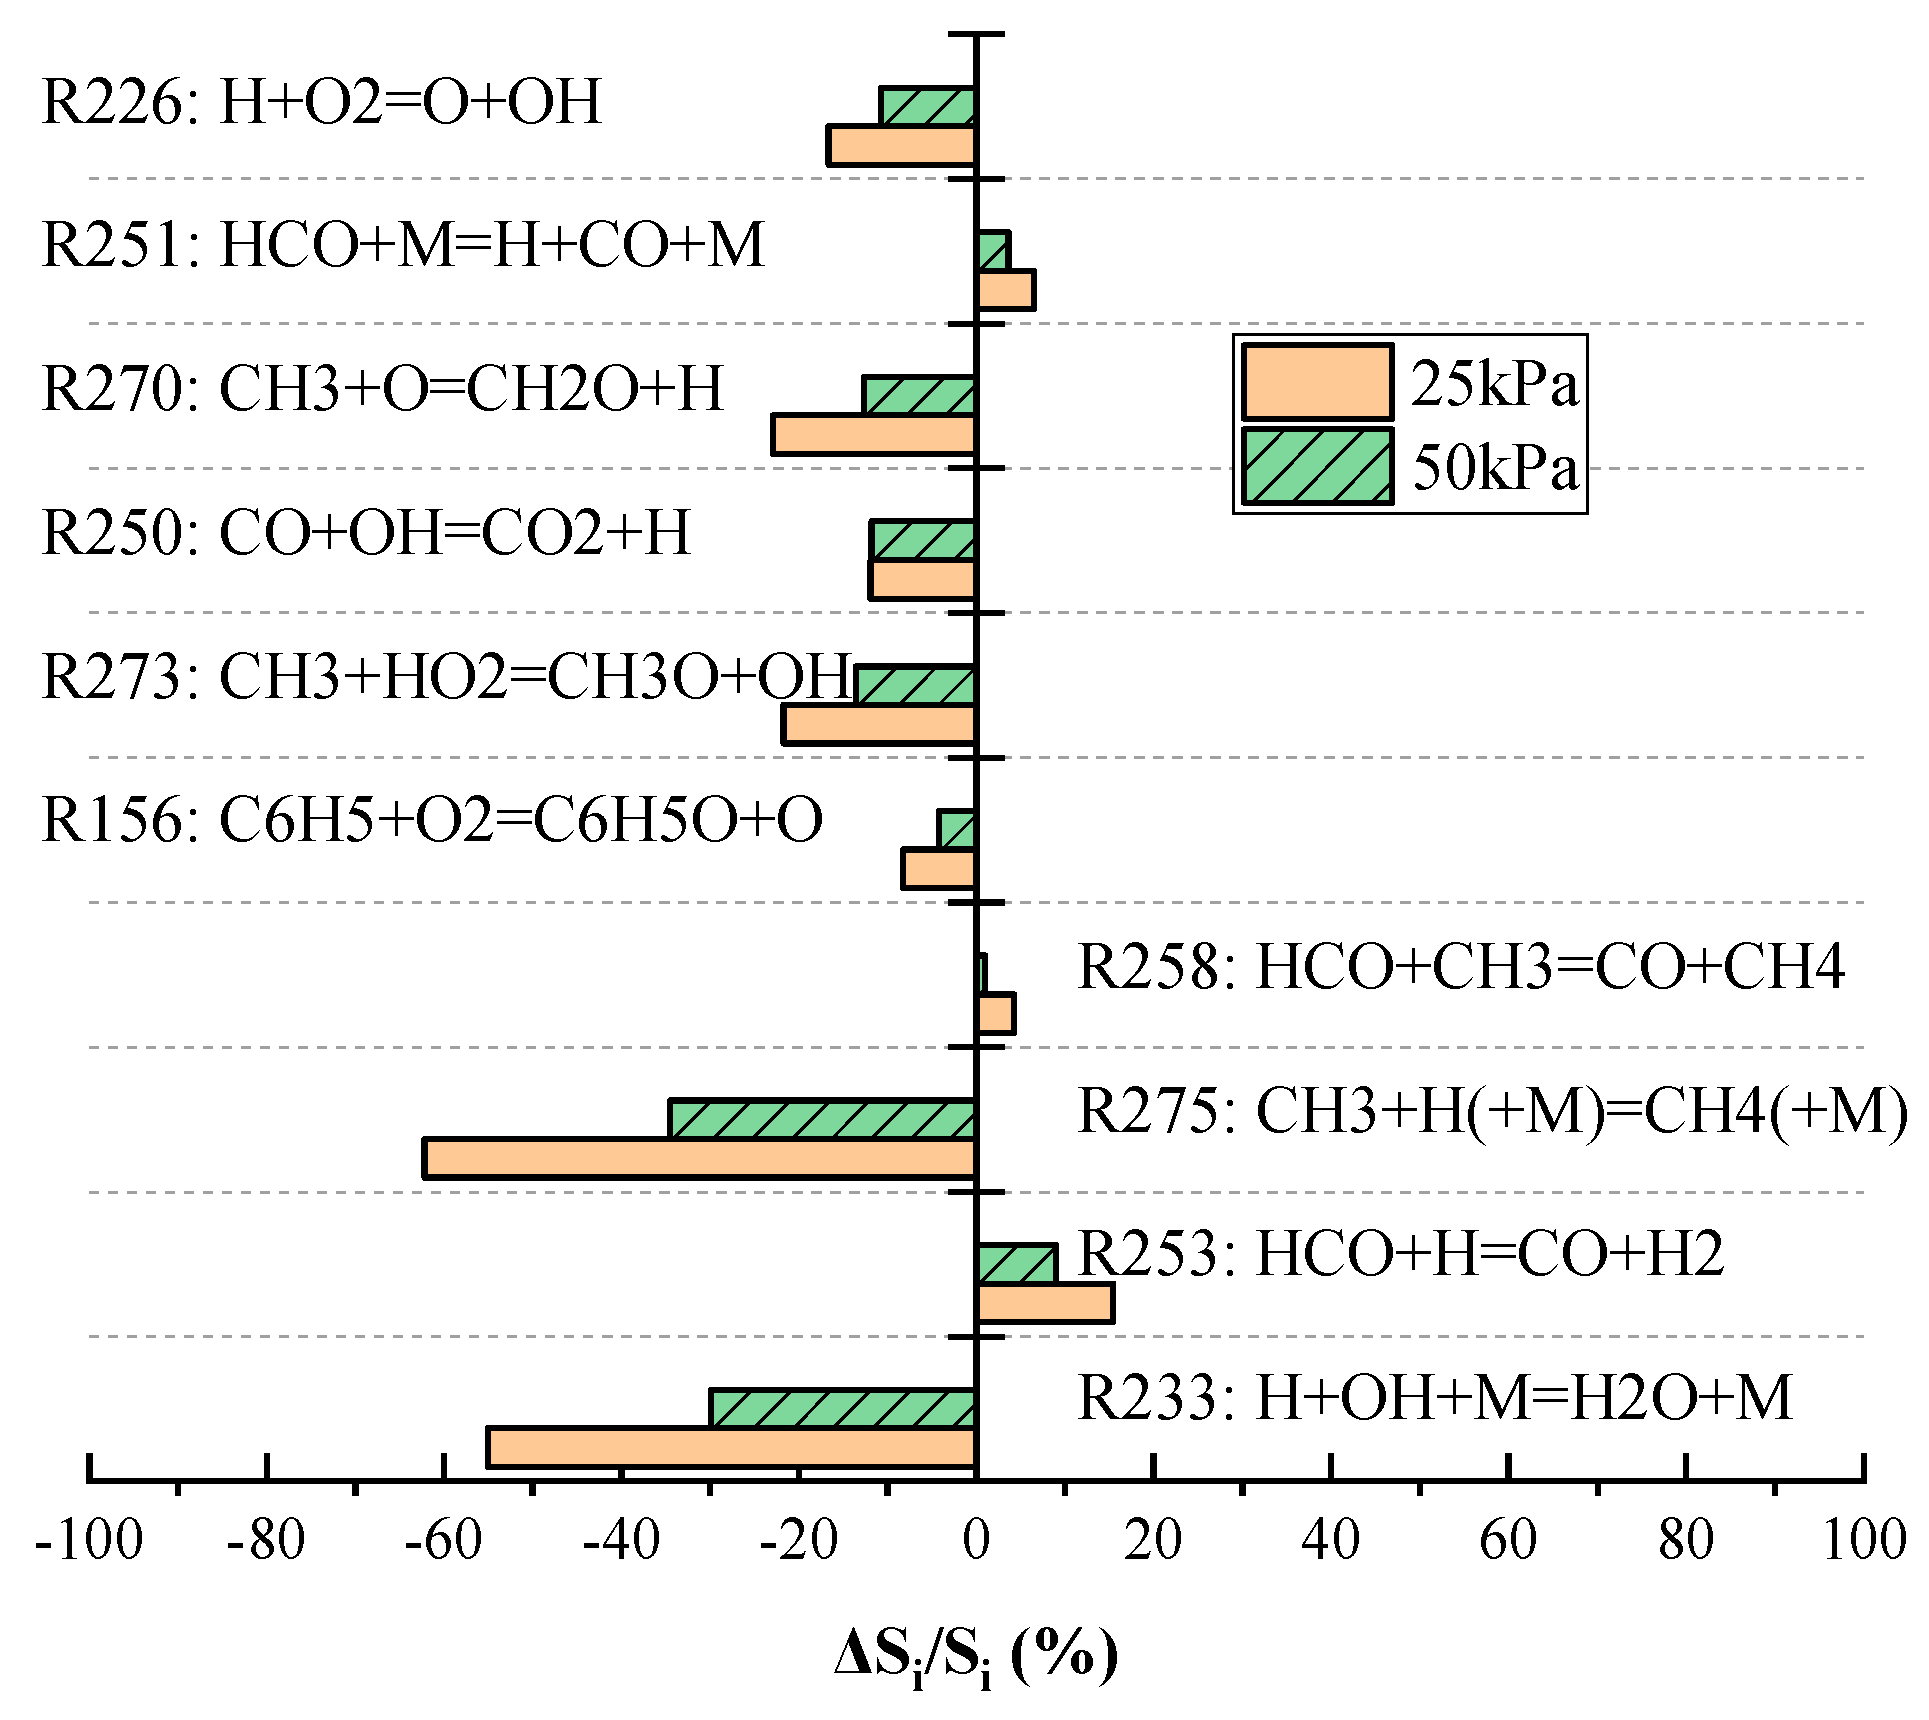
4.3. Reaction Sensitivity at Low Pressure

Simulations were carried out using the CHEMKIN program to further explore the relationship between S u 0 and P. In these calculations, a mixture of 15.26% n-butylcyclohexane, 11.37% n-dodecane, 31.08% n-tetradecane, 21.34% butylbenzene and 20.95% decalin (all percentages on a molar basis) was used as a surrogate for aviation kerosene. These simulations also employed a skeletal oxidation mechanism for aviation kerosene based on the work of Zhang et al. [26], comprising 88 chemical species and 290 reactions. A comparison of S u 0 between the simulation and experimental results is shown in Figure 10. The simulation results are in good agreement with the experimental results. The PREMIX reactor program was used to calculate S u 0 and to determine the reaction sensitivity coefficients of mass flow rate at different initial P [27].
As shown in Figure 11, the chain branching reaction R226 (H + O2 → O + OH) was found to be dominant at all the initial pressure conditions. As the initial pressure decreased, the sensitivity coefficient of this reaction gradually decreased. In addition, the sensitivity coefficients of the chain termination reactions R275 and R233 decreased with decreases in the initial pressure, and the relative changes in these coefficients were much greater than those of reaction R226. Figure 12 summarizes the changes in normalized sensitivity coefficients, Δ S i = ( S i S i , 0 ) / S i , 0 , where S i is the sensitivity coefficient of the i t h reaction and S i , 0 is the sensitivity coefficient of the i t h reaction at an initial pressure of 100 kPa. These results show that decreases in pressure reduced the sensitivity coefficients of the majority of these reactions, which in turn limited the effects of such reactions on S u 0 . Among all the reactions, R275 and R233 exhibited the largest weakening range. This finding indicates that the negative effect of these two reactions on S u 0 was greatly decreased at low pressures and that this phenomenon caused S u 0 to increase with decreases in pressure.

5. Conclusions

An experimental study was conducted to investigate the S u 0 of aviation kerosene at low pressures. The following conclusions can be drawn:
(1)
The lean flammability limit of aviation kerosene increases as the pressure decreases from 75 to 15 kPa and the temperature decreases from 450 to 420 K, indicating that this fuel is more difficult to ignite at low pressures and temperatures;
(2)
The present data could be fitted with a formula describing S u 0 over the pressure range of 25–100 kPa, the temperature range of 400–480 K and the Φ range of 0.7–1.5;
(3)
DL instability is suppressed at lower pressures because the difference in density between the flame front and back is reduced and because a thicker flame is generated. DT instability is also suppressed at lower pressures and at Φ above 1.3 as a result of the higher Ma under these conditions.
(4)
As the initial pressure decreases, reactions that decrease S u 0 (R275 and R233) have a reduced effect, resulting in an increase in S u 0 at lower initial pressures.

Author Contributions

Conceptualization, J.L. and L.H.; methodology, J.L. and L.H.; validation, J.L. and D.Z.; formal analysis, J.L.; investigation, J.L. and D.Z.; data curation, J.L.; writing—original draft preparation, J.L.; writing—review and editing, J.L. and L.H.; supervision, L.H.; project administration, J.Y. and G.X.; funding acquisition, L.H. All authors have read and agreed to the published version of the manuscript.

Funding

This research was funded by National Science and Techn ology Major Project (2017-III-0007-0032).

Institutional Review Board Statement

Not applicable.

Informed Consent Statement

Not applicable.

Data Availability Statement

Not applicable.

Conflicts of Interest

The authors declare no conflict of interest.

References

  1. Colket, M.; Heyne, J.; Rumizen, M. Overview of the national jet fuels combustion program. AIAA J. 2017, 55, 1087–1104. [Google Scholar] [CrossRef]
  2. Tang, Y.; Hassanaly, M.; Raman, V.; Sforzo, B.; Seitzman, J. Probabilistic modeling of forced ignition of alternative jet fuels. Proc. Combust. Inst. 2021, 38, 2589–2596. [Google Scholar] [CrossRef]
  3. Xiao, W.; Shen, X.; Lin, T. Experimental study on parameter changes of a turbofan engine during inflight shutdown processes. Eng. Test 2014, 54, 35–38. [Google Scholar]
  4. Liu, J.; Hu, E.; Zeng, W.; Zheng, W. A new surrogate fuel for emulating the physical and chemical properties of RP-3 kerosene. Fuel 2020, 259, 116210. [Google Scholar] [CrossRef]
  5. Zheng, D.; Yu, W.M.; Zhong, B.J. RP-3 aviation kerosene surrogate fuel and the chemical reaction kinetic model. Acta Phys.-Chim. Sin. 2015, 31, 636–642. [Google Scholar]
  6. Fu, Y.; Luo, R.; Shi, P.; Xia, W.; Fan, W. Laminar combustion characteristics of a five-component surrogate fuel of RP-3 kerosene. J. Propuls. Technol. 2020, 1–8. [Google Scholar] [CrossRef]
  7. Vukadinovic, V.; Habisreuther, P.; Zarzalis, N. Influence of pressure and temperature on laminar burning velocity and Markstein number of kerosene Jet A-1: Experimental and numerical study. Fuel 2013, 111, 401–410. [Google Scholar] [CrossRef]
  8. Liu, Y.; Gu, W.; Wang, J.; Rao, D.; Chen, X.; Ma, H.; Zeng, W. Study on the laminar burning velocity of ethanol/RP-3 aviation kerosene premixed flame. Combust. Flame 2022, 238, 111921. [Google Scholar] [CrossRef]
  9. Le Dortz, R.; Strozzi, C.; Sotton, J.; Bellenoue, M. Evaluation of the surrogates capacity to reproduce the laminar burning velocities and the sensitivity to stretching of a commercial kerosene under constant volume combustion conditions. Fuel 2021, 287, 119426. [Google Scholar] [CrossRef]
  10. Liu, Y.; Gu, W.; Wang, J.; Ma, H.; Dong, N.; Zeng, W. Laminar burning velocity of microalgae oil/RP-3 premixed flame at elevated initial temperature and pressure. Fuel 2022, 309, 122081. [Google Scholar] [CrossRef]
  11. Wang, Z.; Alswat, M.; Guangying Yu, G.; Allehaibi, M.; Metghalchi, H. Flame structure and laminar burning speed of gas to liquid fuel air mixtures at moderate pressures and high temperatures. Fuel 2017, 209, 529–537. [Google Scholar] [CrossRef]
  12. Wang, Z.; Lu, Z.; Yelishala, S.; Metghalchi, H.; Levendis, Y. Laminar burning speeds and flame instabilities of isobutane carbon dioxide air mixtures at high pressures and temperatures. Fuel 2020, 268, 117410. [Google Scholar] [CrossRef]
  13. Wang, Z.; Bai, Z.; Yelishala, S.; Yu, G.; Metghalchi, H. Effects of diluent on laminar burning speed and flame structure of gas to liquid fuel air mixtures at high temperatures and moderate pressures. Fuel 2018, 231, 204–214. [Google Scholar] [CrossRef]
  14. Konnov, A.; Mohammad, A.; Kishore, V.; Kim, N.; Prathap, C.; Kumar, S. A comprehensive review of measurements and data analysis of laminar burning velocities for various fuel+air mixtures. Prog. Energy Combust. Sci. 2018, 68, 197–267. [Google Scholar] [CrossRef]
  15. Xie, F.; Guo, J.; Hu, K.; Wu, R. Effect of initial pressure on combustion characteristics of methane-air mixtures. Renew. Energy Resour. 2015, 33, 1398–1402. [Google Scholar]
  16. Wang, Z.; Lu, Z.; Yelishala, S.; Metghalchi, H.; Levendis, Y. Flame characteristics of propane-air-carbon dioxide blends at elevated temperatures and pressures. Energy 2021, 228, 120624. [Google Scholar] [CrossRef]
  17. Egolfopoulos, F.; Hansen, N.; Ju, Y.; Kohse-Höinghaus, K.; Law, C.K.; Qi, F. Advances and challenges in laminar flame experiments and implications for combustion chemistry. Prog. Energy Combust. Sci. 2014, 43, 36–67. [Google Scholar] [CrossRef]
  18. Huo, J.L.; Yang, S.; Ren, Z.Y.; Zhu, D.L.; Law, C.K. Uncertainty reduction in laminar flame speed extrapolation for expanding spherical flames. Combust. Flame 2018, 189, 155–162. [Google Scholar] [CrossRef]
  19. Park, O.; Veloo, P.S.; Egolfopoulos, F.N. Flame studies of C2 hydrocarbons. Proc. Combust. Inst. 2013, 34, 711–718. [Google Scholar] [CrossRef]
  20. Liu, W.; Kelley, A.P.; Law, C.K. Flame propagation and counterflow nonpremixed ignition of mixtures of methane and ethylene. Combust. Flame 2010, 157, 1027–1036. [Google Scholar] [CrossRef]
  21. Kumar, K.; Mittal, G.; Sung, C.J.; Law, C.K. An experimental investigation of ethylene/O2/diluent mixtures: Laminar flame speeds with preheat and ignition delays at high pressures. Combust. Flame 2008, 153, 343–354. [Google Scholar] [CrossRef]
  22. Lian, X. Aero-Engine Principle; Northwestern Polytechnical University Press: Xi’an, China, 2005. [Google Scholar]
  23. Creta, F.; Lapenna, P.; Lamioni, R.; Fogla, N.; Matalon, M. Propagation of premixed flames in the presence of Darrieus–Landau and thermal diffusive instabilities. Combust. Flame 2020, 216, 256–270. [Google Scholar] [CrossRef]
  24. Yue, Z.; Som, S. Fuel property effects on knock propensity and thermal efficiency in a direct-injection spark-ignition engine. Appl. Energy 2021, 281, 114221. [Google Scholar] [CrossRef]
  25. Ferguson, C.; Keck, J. On laminar flame quenching and its application to spark ignition engines. Combust. Flame 1977, 28, 197–205. [Google Scholar] [CrossRef]
  26. Zhang, D.R.; Hou, L.Y. Surrogate Model and Skeletal Oxidation Mechaism of Aviation Kerosene. In Proceedings of the 12th Asia-Pacific Conference on Combustion, Fukuoka, Japan, 1–5 July 2019. [Google Scholar]
  27. Chemkin-Pro 15101. In Reaction Design; Chemkin-Pro: San Diego, CA, USA, 2010.
Figure 1. Diagram of the fan-stirred, constant-volume bomb apparatus.
Energies 15 02191 g001
Figure 2. Typical schlieren images of the flame propagation process.
Energies 15 02191 g002
Figure 3. Comparisons of S u 0 of n-dodecane obtained from prior experimental trials and from the present work.
Energies 15 02191 g003
Figure 4. Flammability limit values for aviation kerosene at low pressures as functions of the equivalence ratio.
Energies 15 02191 g004
Figure 5. Schlieren images of flames acquired at different pressures and equivalence ratios at 450 K.
Energies 15 02191 g005
Figure 6. S u 0 of aviation kerosene (a) at 50 kPa and different initial temperatures as functions of the equivalence ratio and (b) at various initial pressures and Φ as functions of temperature.
Energies 15 02191 g006
Figure 7. S u 0 of aviation kerosene (a) at 450 K and different initial pressures as functions of the equivalence ratio and (b) at different initial Φ as functions of the initial pressure.
Energies 15 02191 g007
Figure 8. Markstein lengths at different pressures as functions of the equivalence ratio.
Energies 15 02191 g008
Figure 9. Comparison of the predicted and experimental S u 0 values.
Energies 15 02191 g009
Figure 10. Comparison of S u 0 between the simulation and experimental results.
Energies 15 02191 g010
Figure 11. Variations in the sensitivity coefficients of key reactions with pressure.
Energies 15 02191 g011
Figure 12. Variations in normalized sensitivity coefficients with pressure.
Energies 15 02191 g012
Table 1. Temperature and pressure conditions applied during experimental trials.
T/KP/KPa
40050
42025, 50, 75, 100
45025, 50, 75, 100
48050, 100
Publisher’s Note: MDPI stays neutral with regard to jurisdictional claims in published maps and institutional affiliations.

