Article

Modeling Residential Electricity Consumption from Public Demographic Data for Sustainable Cities

1
School of Engineering and Information Technology, University of New South Wales, Canberra 2612, Australia
2
Department of Computing and Mathematics, Manchester Metropolitan University, Manchester M15 6BH, UK
3
Department of Computing, Macquarie University, Sydney 2113, Australia
4
Sustainable Process Integration Laboratory—SPIL, NETME Centre, Faculty of Mechanical Engineering, Brno University of Technology—VUT Brno, Technická 2896/2, 61669 Brno, Czech Republic
*
Authors to whom correspondence should be addressed.
Energies 2022, 15(6), 2163; https://doi.org/10.3390/en15062163
Submission received: 4 January 2022 / Revised: 28 February 2022 / Accepted: 11 March 2022 / Published: 16 March 2022
(This article belongs to the Special Issue Planning and Operation of Microgrids)

Abstract

:
Demographic factors, statistical information, and technological innovation are prominent factors shaping energy transitions in the residential sector. Explaining these energy transitions requires combining insights from the disciplines investigating these factors. The existing literature is not consistent in identifying these factors, nor in proposing how they can be combined. In this paper, three contributions are made by combining the key demographic factors of households to estimate household energy consumption. Firstly, a mathematical formula is developed by considering the demographic determinants that influence energy consumption, such as the number of persons per household, median age, occupancy rate, households with children, and number of bedrooms per household. Secondly, a geographical position algorithm is proposed to identify the geographical locations of households. Thirdly, the derived formula is validated by collecting demographic factors of five statistical regions from local government databases, and then compared with the electricity consumption benchmarks provided by the energy regulators. The practical feasibility of the method is demonstrated by comparing the estimated energy consumption values with the electricity consumption benchmarks provided by energy regulators. The comparison results indicate that the error between the benchmark and estimated values for the five different regions is less than 8% (7.37%), proving the efficacy of this method in energy consumption estimation processes.

1. Introduction

Energy is a key driver of our communities. Every society, business, and building relies on energy. Despite all the technological advancements in energy efficiency, by 2040, global energy consumption is projected to be about 60% higher than it was in 2010 [1]. With a share of nearly 35% of the global energy demand [2], buildings are the world’s largest energy consumers. The majority of this global share is used by residential buildings. Nonetheless, we know very little about the demographic processes that drive energy demand in residential buildings. The existing literature has neglected the role of occupants in energy consumption by excessively focusing on the physical and technical characteristics of the buildings [3,4,5]. However, demographic factors, such as the number of persons in a household, family composition, occupancy rate, ages of occupants and urbanization levels, have both direct and indirect influences on household energy consumption. Understanding the key determinants of residential energy consumption is essential for economic development, energy justice, natural resources protection, and climate change policy.
In the existing literature, there are research efforts aimed at estimating and reducing energy consumption in the residential sector. In [6], a queuing-based demand framework was presented for energy consumption management in the residential sector. A centralized algorithm for minimizing the energy cost and operational delays for consumers was proposed. In [7], a support vector regression model for predicting electrical consumption was developed. However, this study examined the residential energy usage without considering the dwellings, occupations and socio-economic status of the people in the households. In [8], a novel prediction model was established to forecast the building electricity levels. A forecasting engine was presented based on the empirical mode decomposition. A customer segmentation methodology for processing the load shapes of residential energy consumers was developed in [9]. The main objective was to derive the features from the household-encoded data to classify the variability in energy consumption. In [10], a novel architecture based on the random behavior of the residential consumers was proposed to predict the energy consumption in residential buildings. In [11], a bound testing procedure for estimating residential electricity consumption was proposed. This study [11] used an autoregressive distributed framework to model residential electricity demand. In [12], the price elasticity of residential electricity consumption in Switzerland was estimated. This study [12] investigated the effect of household appliances in residential energy consumption using household production theory. A recent analysis of residential buildings, considering the size of households, climatic conditions, and locations, is presented in [13]. A two-stage model was explored in [14] to estimate electricity consumption. It considered weather-related electricity factors and implemented an agent-based analytical tool to disaggregate the residual consumption levels of different appliances.
In recent studies, three categories are used for energy consumption modeling in the residential sector: statistically based regression modeling, bottom-up and top-down modeling, and artificial-intelligence-based modeling. Table 1 shows the related studies in energy consumption estimates according to three categories. In terms of regression-based modeling, a multiple linear regression was carried out to consider the effect of climatic conditions in residential energy consumption in [15]. The techniques, including quantile regression, ridge regression, and statistical regressions, were also used to model the household characteristics, such as the effect of heating [16], cooling [17] and technological factors [18]. Bottom-up and top-down models were also employed to estimate residential energy consumption. For instance, an improved bottom-up energy-consumption estimation approach based on energy-consumption-monitoring data and the Bayesian theory was developed in [19]. In [20], a bottom-up model for estimating residential energy demands using datasets available in the United States was proposed. This method used a micro-simulation approach for estimations in metropolitan areas. A bottom-up approach to building a high-resolution energy demand model was proposed in [21]. This study [21] considered the passive energy consumption of each housing unit based on physical factors, such as the weather and floor area. In [22], a bottom-up methodology for projecting the energy demands of residential buildings was presented. It considered climate zones in Algeria to evaluate the space loads for cooling and heating using a degree days method. To address the behavior patterns of occupants, a bottom-up residential simulation approach was developed in [23]. It simulated the behavior of occupants using an unsupervised clustering algorithm. A comparison of the state-of-the-art between top-down and bottom-up methods for residential energy consumption was drawn in [24]. Artificial-intelligence-based models were also used to estimate energy use in the residential sector [25,26]. These models [25,26] considered the impact of buildings’ physical features, including the number of floors, land-use dimensions, and apartments versus detached houses. In [27], a deep learning model was investigated to examine the influence of individual appliances in household energy consumption.
Despite the effective solutions that exist for the residential sector, new challenges and requirements have emerged with the rapid increase in population as well as the evolution of smart cities. To obtain meaningful results, several issues need to be resolved, such as demographic characteristics and the human factor, which are key determinants of energy consumption in the residential sector. To date, most studies have focused on physical features of buildings (e.g., types of air conditioning), climatic (weather) conditions, and individual appliances, as well as the heating and cooling devices used to improve their energy efficiency. An analysis of occupant characteristics, considering their demographic factors, has not been properly investigated. The existing solutions, such as statistical regression analysis and artificial-intelligence-based models, are dependent on the data of smart meters and the data provided by energy companies. The energy companies usually refrain from providing data due to the risk of privacy disclosures [28,29]. This factor, in turn, affects the validity of energy consumption solutions. In this study, investigations are conducted from the publicly available open-data by collecting the real demographics of households from local government databases, such as that of the Australian Bureau of Statistics (ABS) [30]. The scale of data in ABS is vast, presenting unprecedented opportunities to examine complex demographic factors that effect energy consumption in the residential sector. Another important issue is the uncertainty of dwelling characteristics or demographics, making it more difficult to formally model and eventually estimate energy consumption. In the existing literature, the solutions were only validated for a single demographic region or household. However, this aspect might differ across different households, which mainly depend on the number of people living in them, their genders, ages, and employment status, as well as the average number of bedrooms. The research discussed in this paper contributes to the existing literature by studying the key demographic factors of five distinct regions that have major impacts on energy consumption in the domestic sector. The role of human occupancy is also investigated in the current situation of COVID-19, where most people work from home and occupancy has a major impact on overall energy usage [31].
This paper aims to present a new solution for estimating energy consumption in the residential sector by explicitly modeling the human demographic factors. The main contributions are as follows:
  • A mathematical formula is developed by considering social elements, such as statistical information and the demographic factors of households, to estimate energy consumption in the residential sector.
  • A new way of estimating residential energy consumption from publicly available information such as local government databases is proposed. The ability to access these reliable public sources means that there is now a greater level of transparency than ever before, particularly when it comes to information from the government.
  • Occupancy is considered to have impact on energy consumption in the domestic sector. This is particularly important in the current situation of COVID-19, where most people work from home and occupancy has an important impact on overall energy consumption.
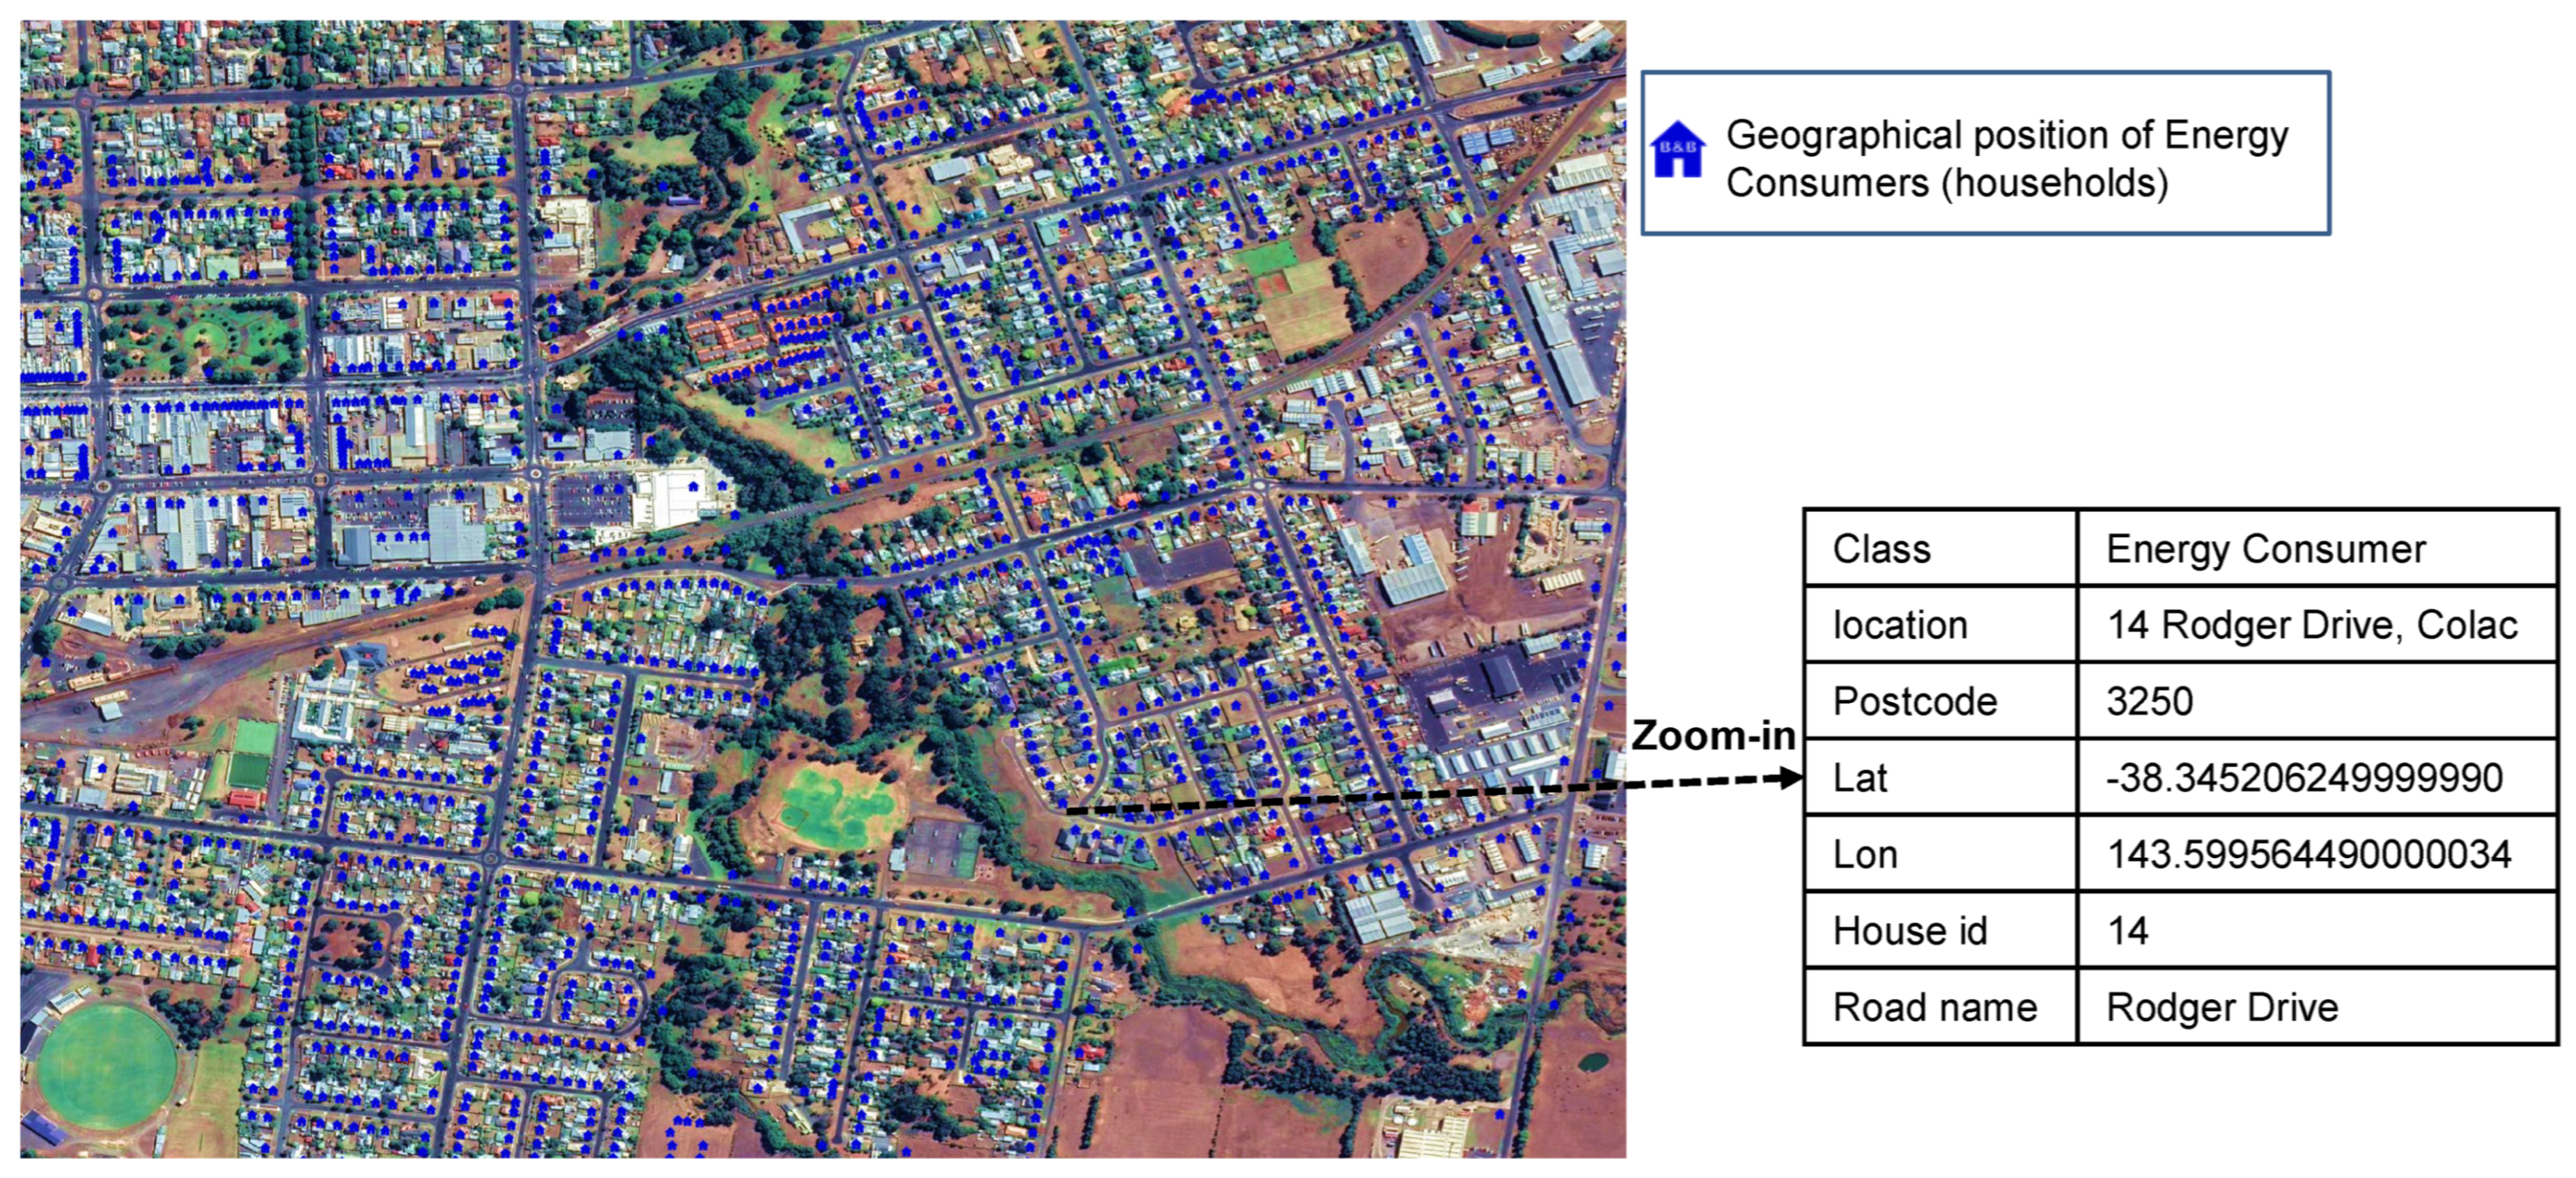
  • A geographical position algorithm (GPH) is proposed to solve the problem of obtaining individual-level longitudinal data for households.
  • The practical application of proposed solutions is validated by collecting real demographics of five regions in Australia. The estimated energy consumption values are then compared with energy consumption benchmarks produced by energy regulators.
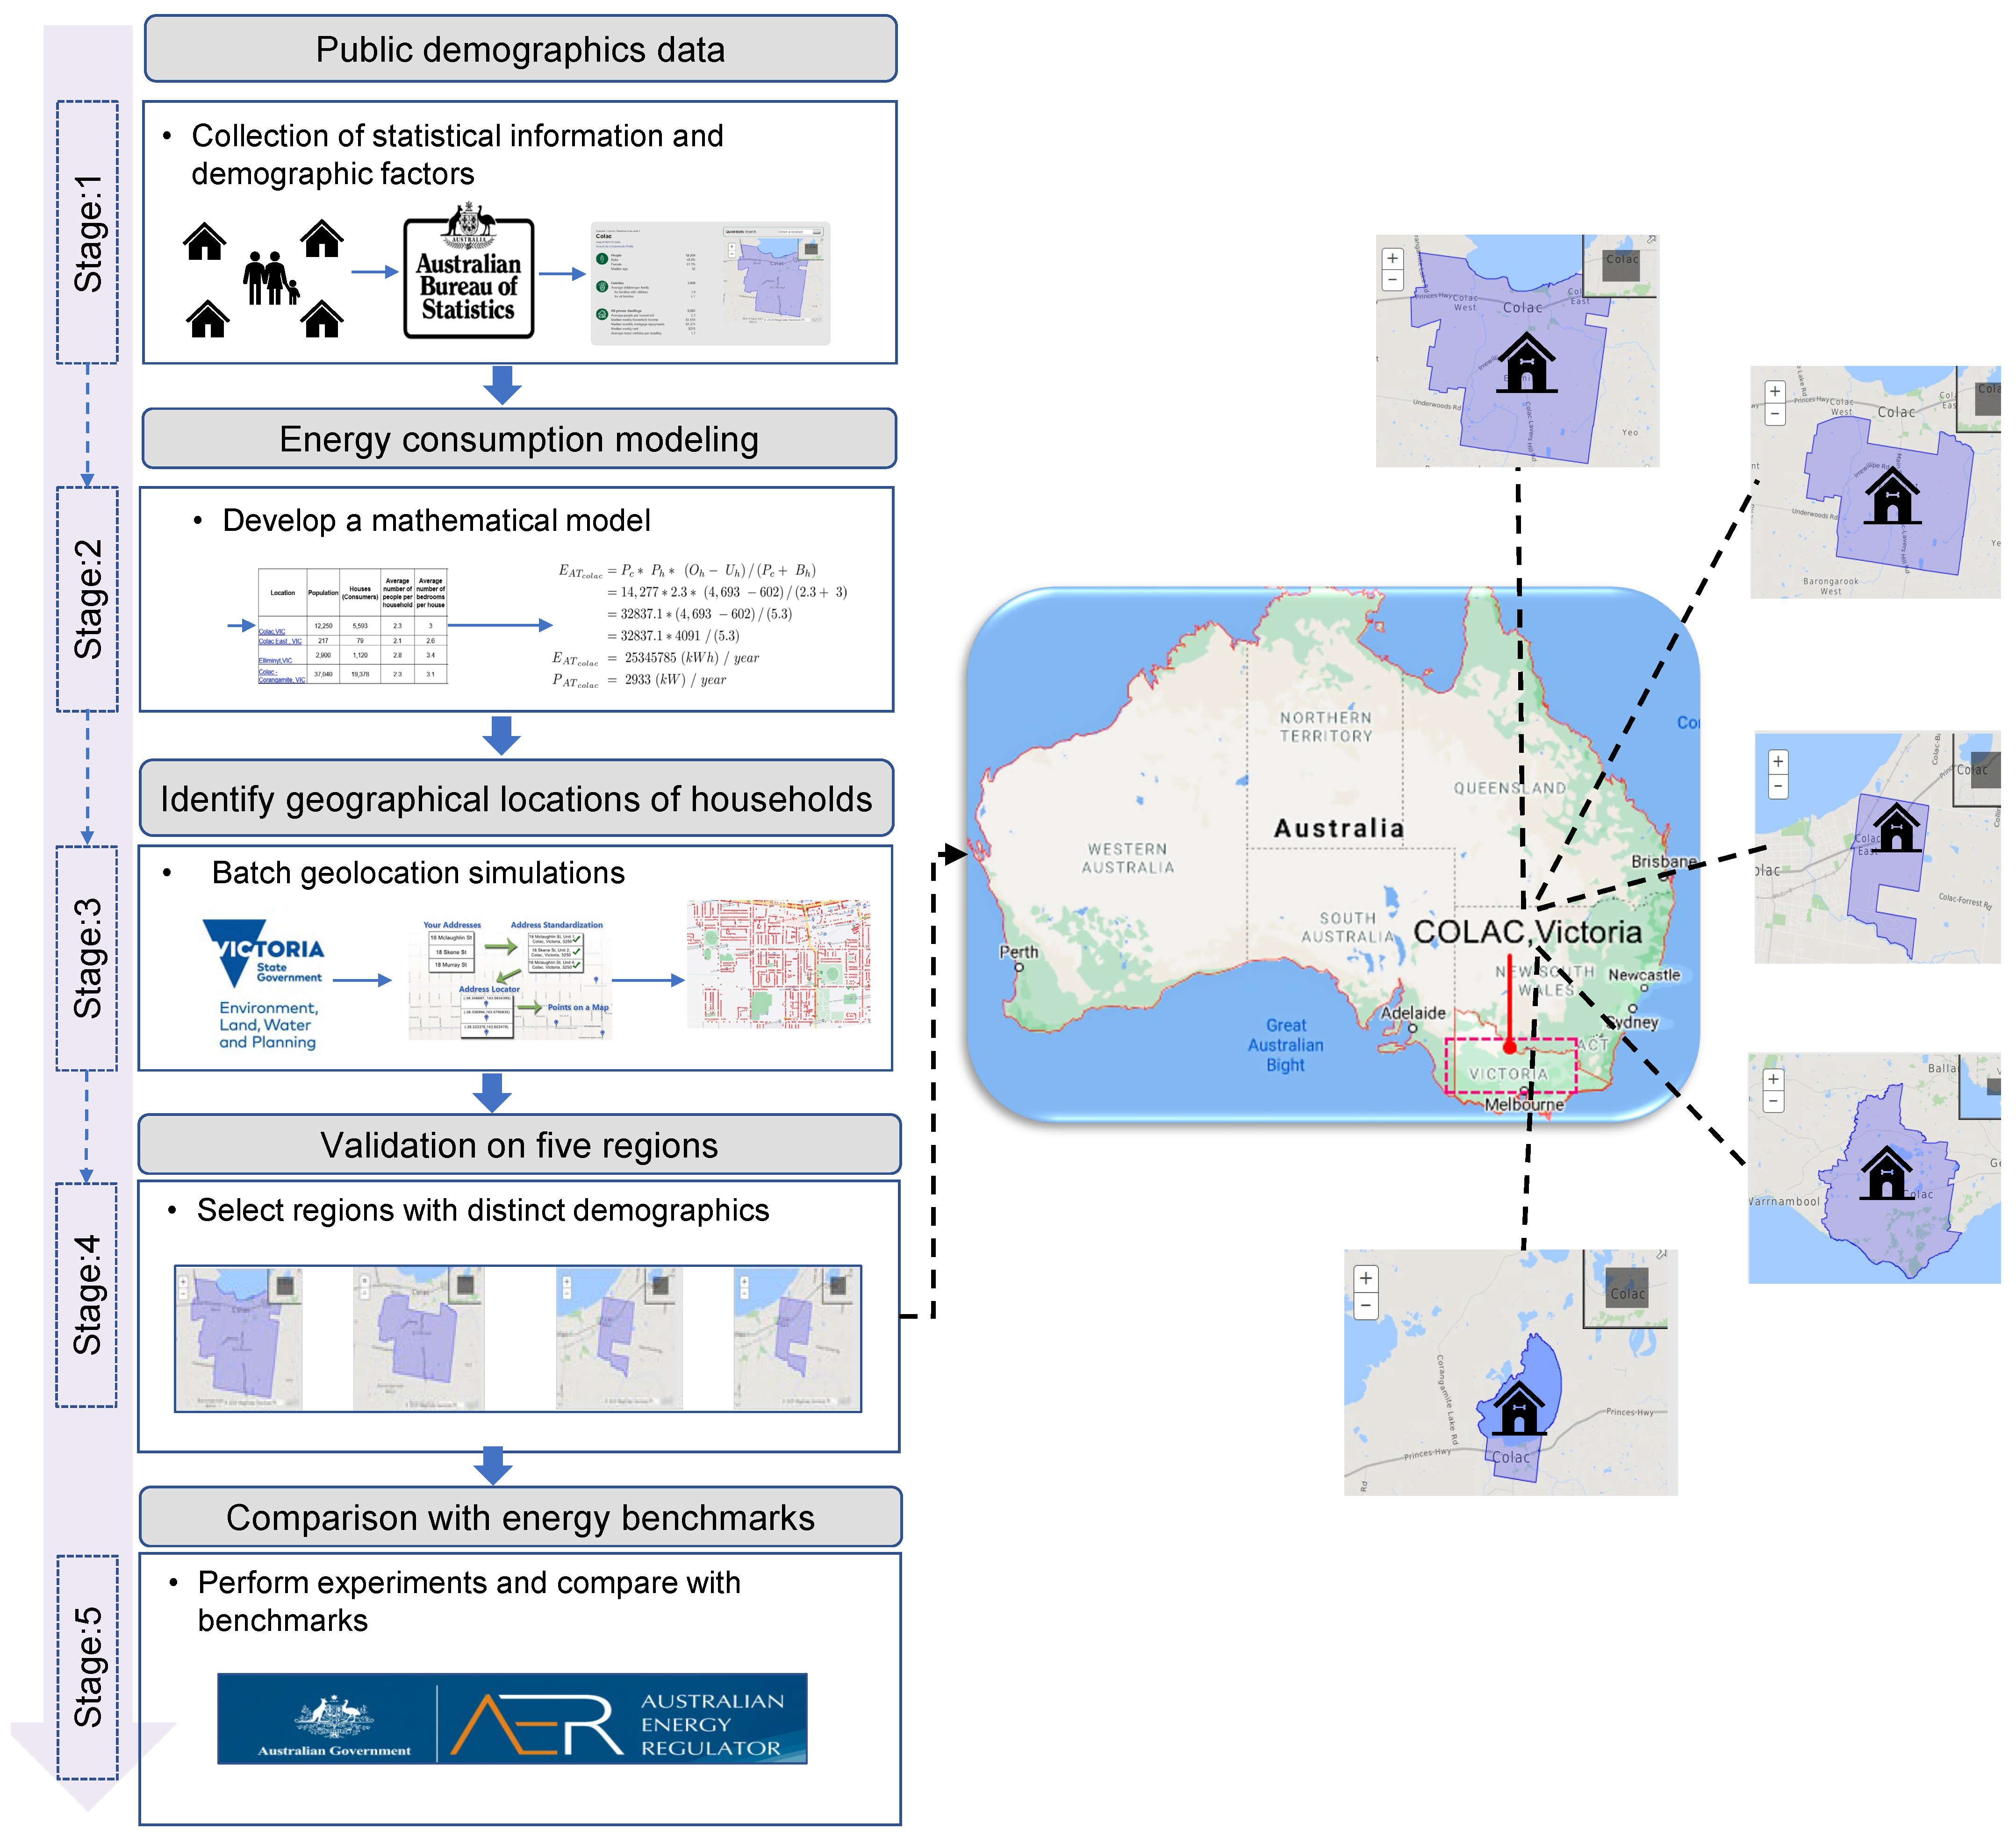
2. Methodology

2.1. Collection of Household Demographics Data

The demographic factors of households were collected from the ABS website [30]. The ABS is Australia’s official and most reliable source of energy statistics, providing open-source data from a variety of different sources including censuses, surveys, and administrative collections for research purposes. This paper focused on publicly available data sources as the availability of data is a typical barrier that has restricted opportunities for researchers to model the key drivers of energy consumption in the residential sector [32,33]. The demographic data were collected for the five regions in Colac, Victoria, Australia, as shown in Table 2. The data provide details of the household characteristics that enable socio-economic and occupant demographic factors to be included in the analysis of household energy usage.

2.2. Research Method

In Figure 1, the research framework of this paper is presented. The key demographic factors, such as population, number of people per household, median age, occupancy rate, households with children, and number of bedrooms per house, were selected for the analysis. Using these demographic factors, a mathematical formula was developed by considering the key determinants of energy consumption. The idea was to estimate the projection of energy consumption by injecting the key demographic variables of households. After establishing the formula, the geographical locations of households were obtained by implementing a GPH algorithm. The GPH process aimed to achieve three tasks: (a) retrieve household addresses; (b) convert them into geographical coordinates (latitude and longitude); and (c) plot these coordinates on online maps, such as Google maps, for the validation of energy consumer (household) locations. In this paper, the households’ addressess were retrieved from the databases of the Australian government land-planning department. The geographical locations were then visualized using the open-source QGIS tool [34], and the data were stored in the required formats. After obtaining the geographical locations, the proposed techniques were tested in the five regions of Australia. For each region, average household energy consumption values were estimated and then validated by comparing them with the energy consumption benchmarks produced by the energy regulator, AER. For fairness, five regions with distinct demographics were selected and compared.

2.3. Mathematical Model for Household Energy Consumption

Equation (1) is the formula developed to estimate residential energy consumption. Several demographic factors that influence energy consumption were considered, such as the number of persons per home, the number of children in the household, the average number of rooms per household, and the median age of households in the given region. Due to the recent effect of COVID-19 in energy transitions, the occupancy factor was also included in the developed model. Based on the combination of these factors, the energy consumption formula is proposed as follows:
E A T = E c / B h × P h × O r × H c × A h
The occupancy percentage O r of households is computed from the information of the occupied O h and unoccupied U h households and is mathematically written as
O r = O h / U h × 100
The average energy consumption of each house in a year is computed by
E I = E A T / T h
The average daily, weekly, and monthly energy consumption of household in each region is calculated as
E m = E I / T m
E w = E m / T w
E d = E w / T d
The notations in Equations (1)–(6) are explained in Table 3.
A unique feature of the proposed mathematical formulation is that it calculates the energy consumption of the entire region, as well as that of an individual house. In practice, as energy consumption estimates vary from region to region, the formula is tested on different demographic regions. In total, five areas in the Colac region, that is, the Colac Statistical Area 2 (SA 2), Colac East, Colac Elliminyt, Colac State Suburbs and Colac-Corangamite, are considered. All these regions have different demographic characteristics, as shown in Table 4. The number of households, population, median age, and occupancy rate varies according to the region. A variety of demographic factors were used as inputs in the formula, as shown in Algorithm 1 to address the uncertainties of energy consumption due to different dwelling characteristics.
Algorithm 1: Modeling residential energy consumption.
Energies 15 02163 i001

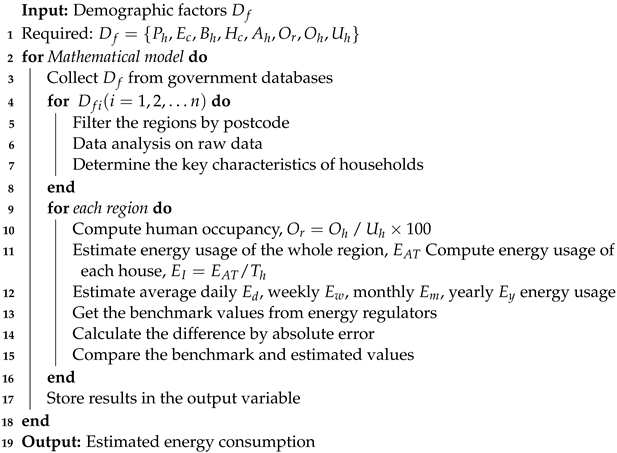
2.4. Algorithm for Geographical Positions of Households

A key research gap in the existing literature is longitudinal (geographical) individual-level data for households, as indicated in [35,36]. The longitudinal data are a pivotal factor when examining the energy consumption patterns of individual households. To address this issue, a GPH algorithm is proposed in this paper. The GPH steps are provided in Algorithm 2 and the results are shown in Figure 2. In the first step, the household addresses or position address points P a are retrieved from the local government database [37], provided by the Victorian government environment, land, and planning department. The required data are accessed from the geocoded spatial database. The address identifiers of each house in the selected region are extracted. Then, in the second stage, the household addresses are converted into geographical coordinates (latitude and longitude). A bulk geolocation process is performed to move large batches of addresses into their geographical locations. It parses each address to return a set of geocoded locations. The output contains the full address, location, and attributes such as the postcodes. As geolocation services are usually not free for bulk addresses, the ’add geometry’ function [38] in the QGIS tool [34] is used, which provides free-of-cost bulk geocoding services. In the final stage, the obtained results are plotted in online maps, such as Google maps, to validate energy consumers (household) locations.
Algorithm 2: Geographical positions of households.
Energies 15 02163 i002
Although geographical locations may not be explicitly related to the energy usage of individual buildings, their spatial position specifically defines energy usage within groups of buildings and may be used to identify high-consumption areas.

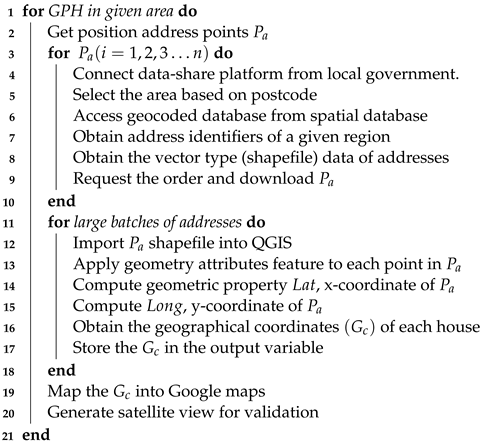
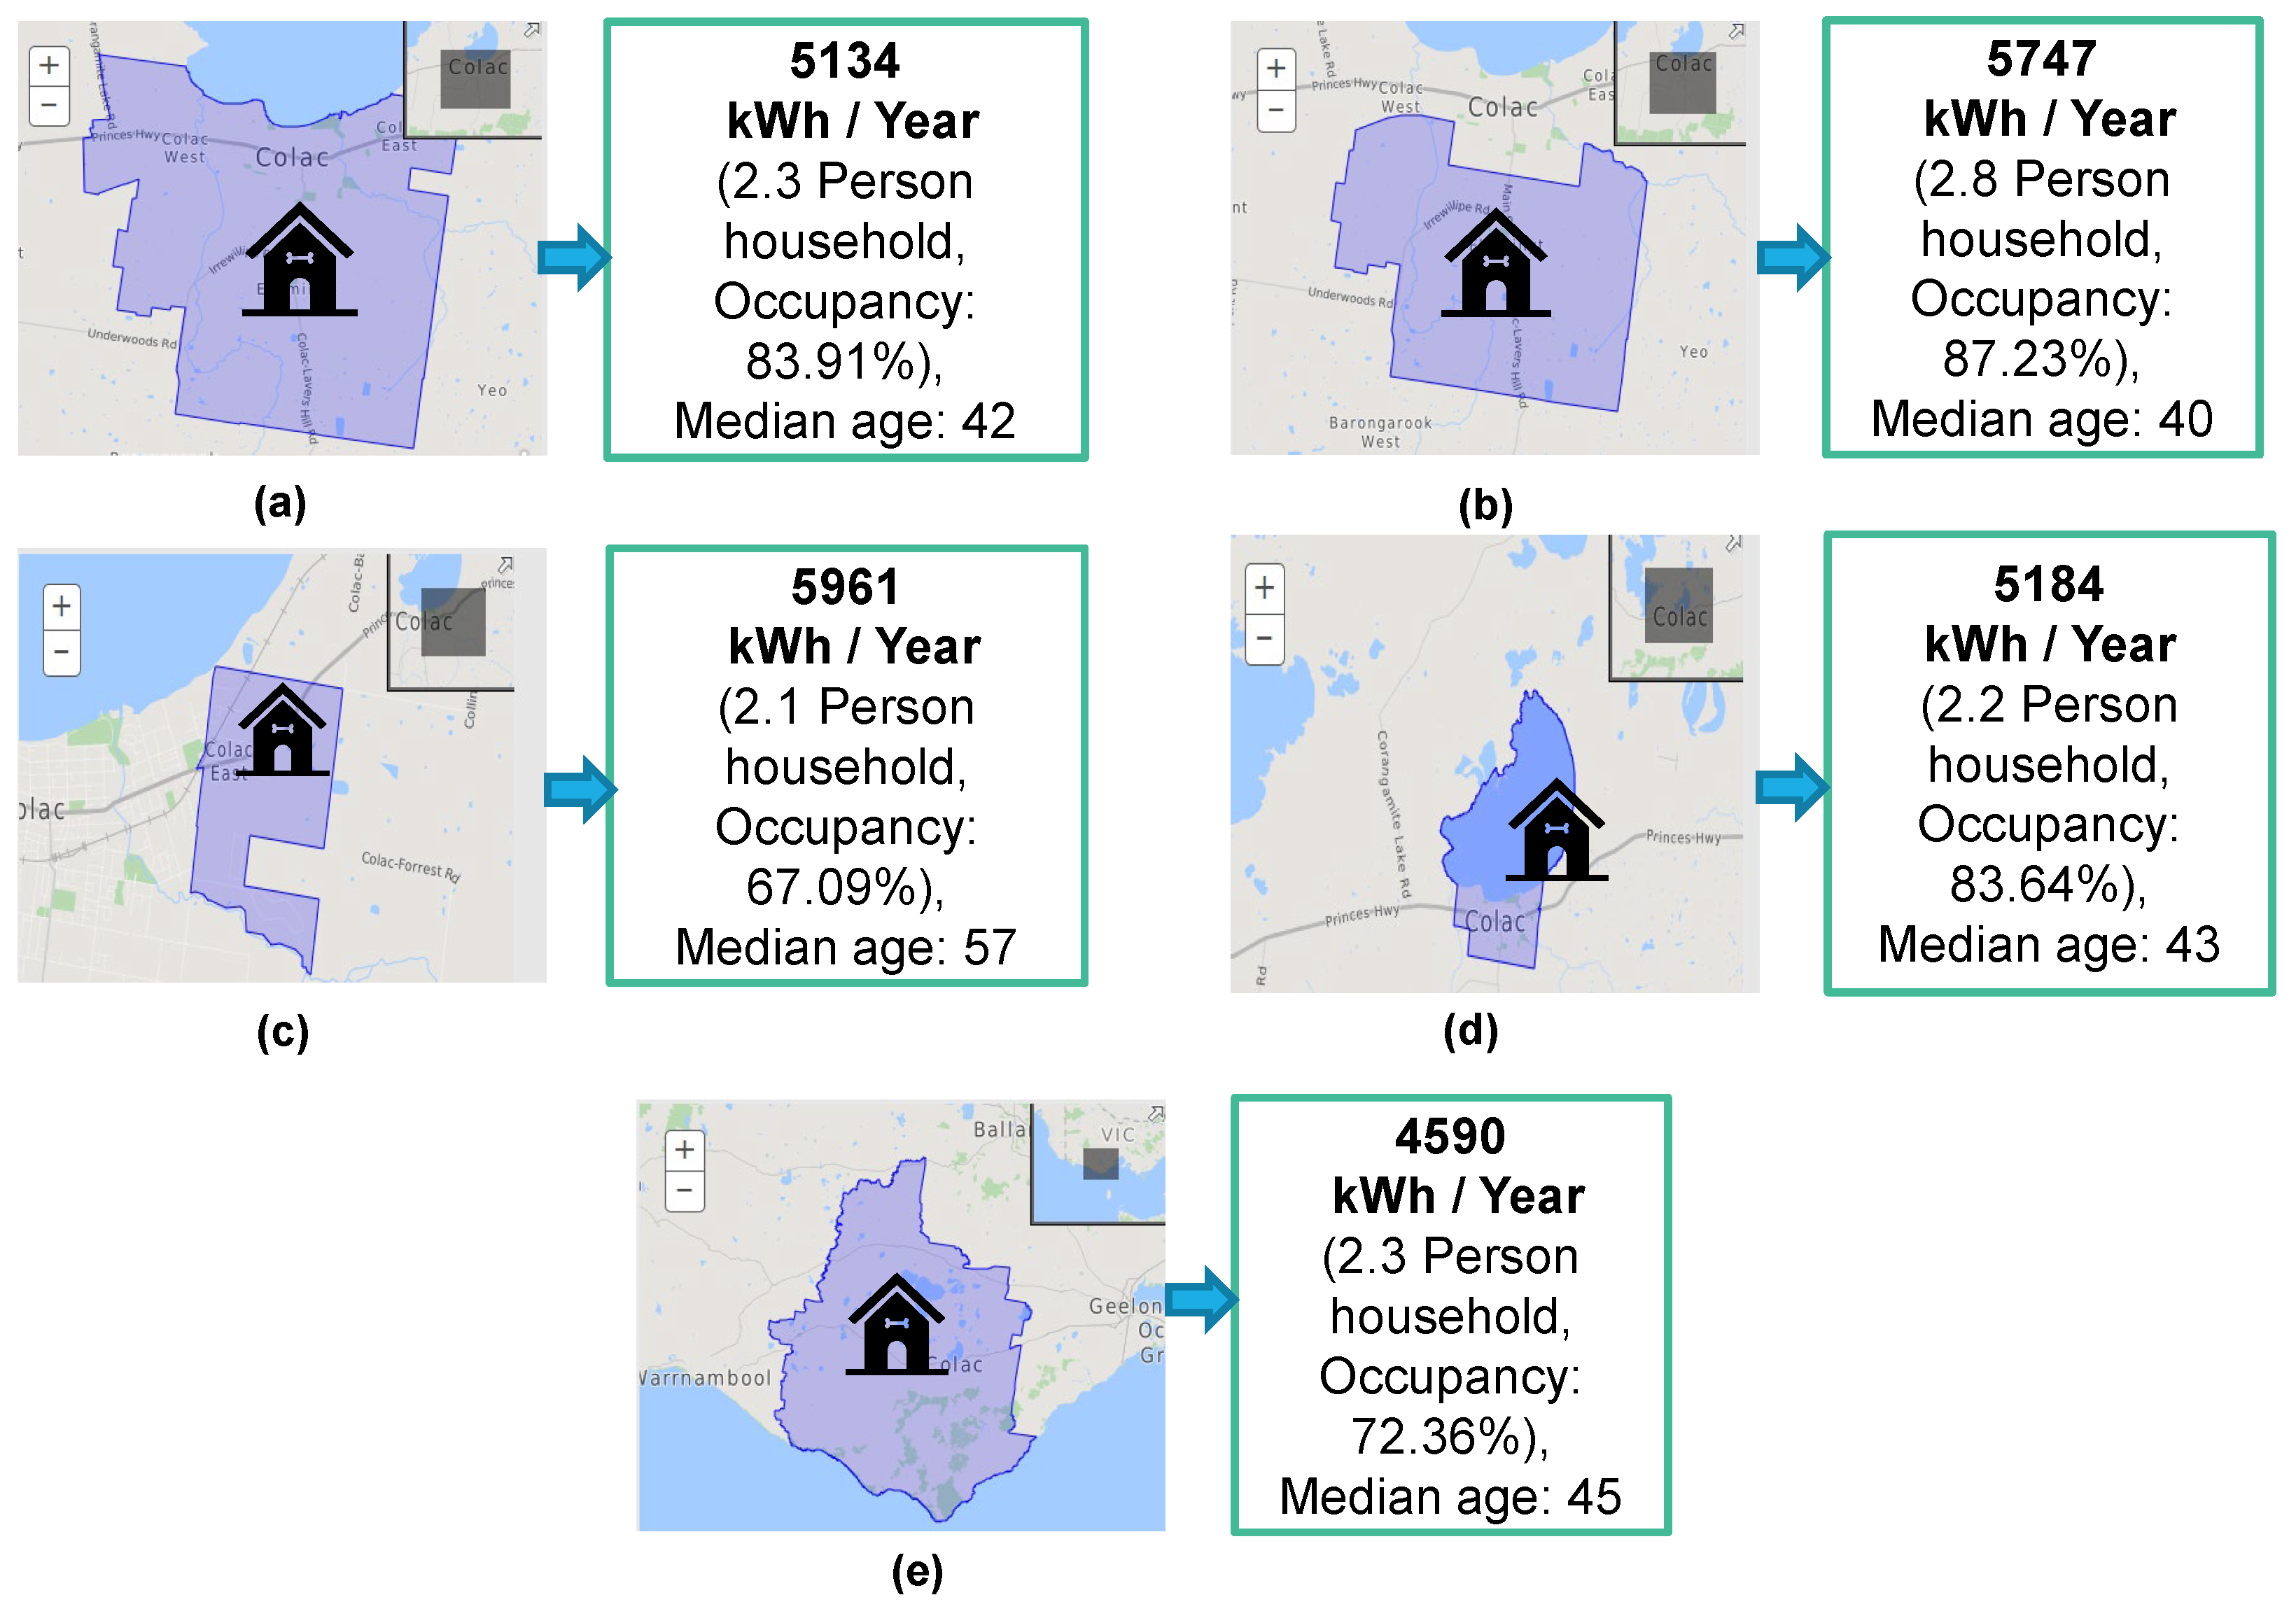
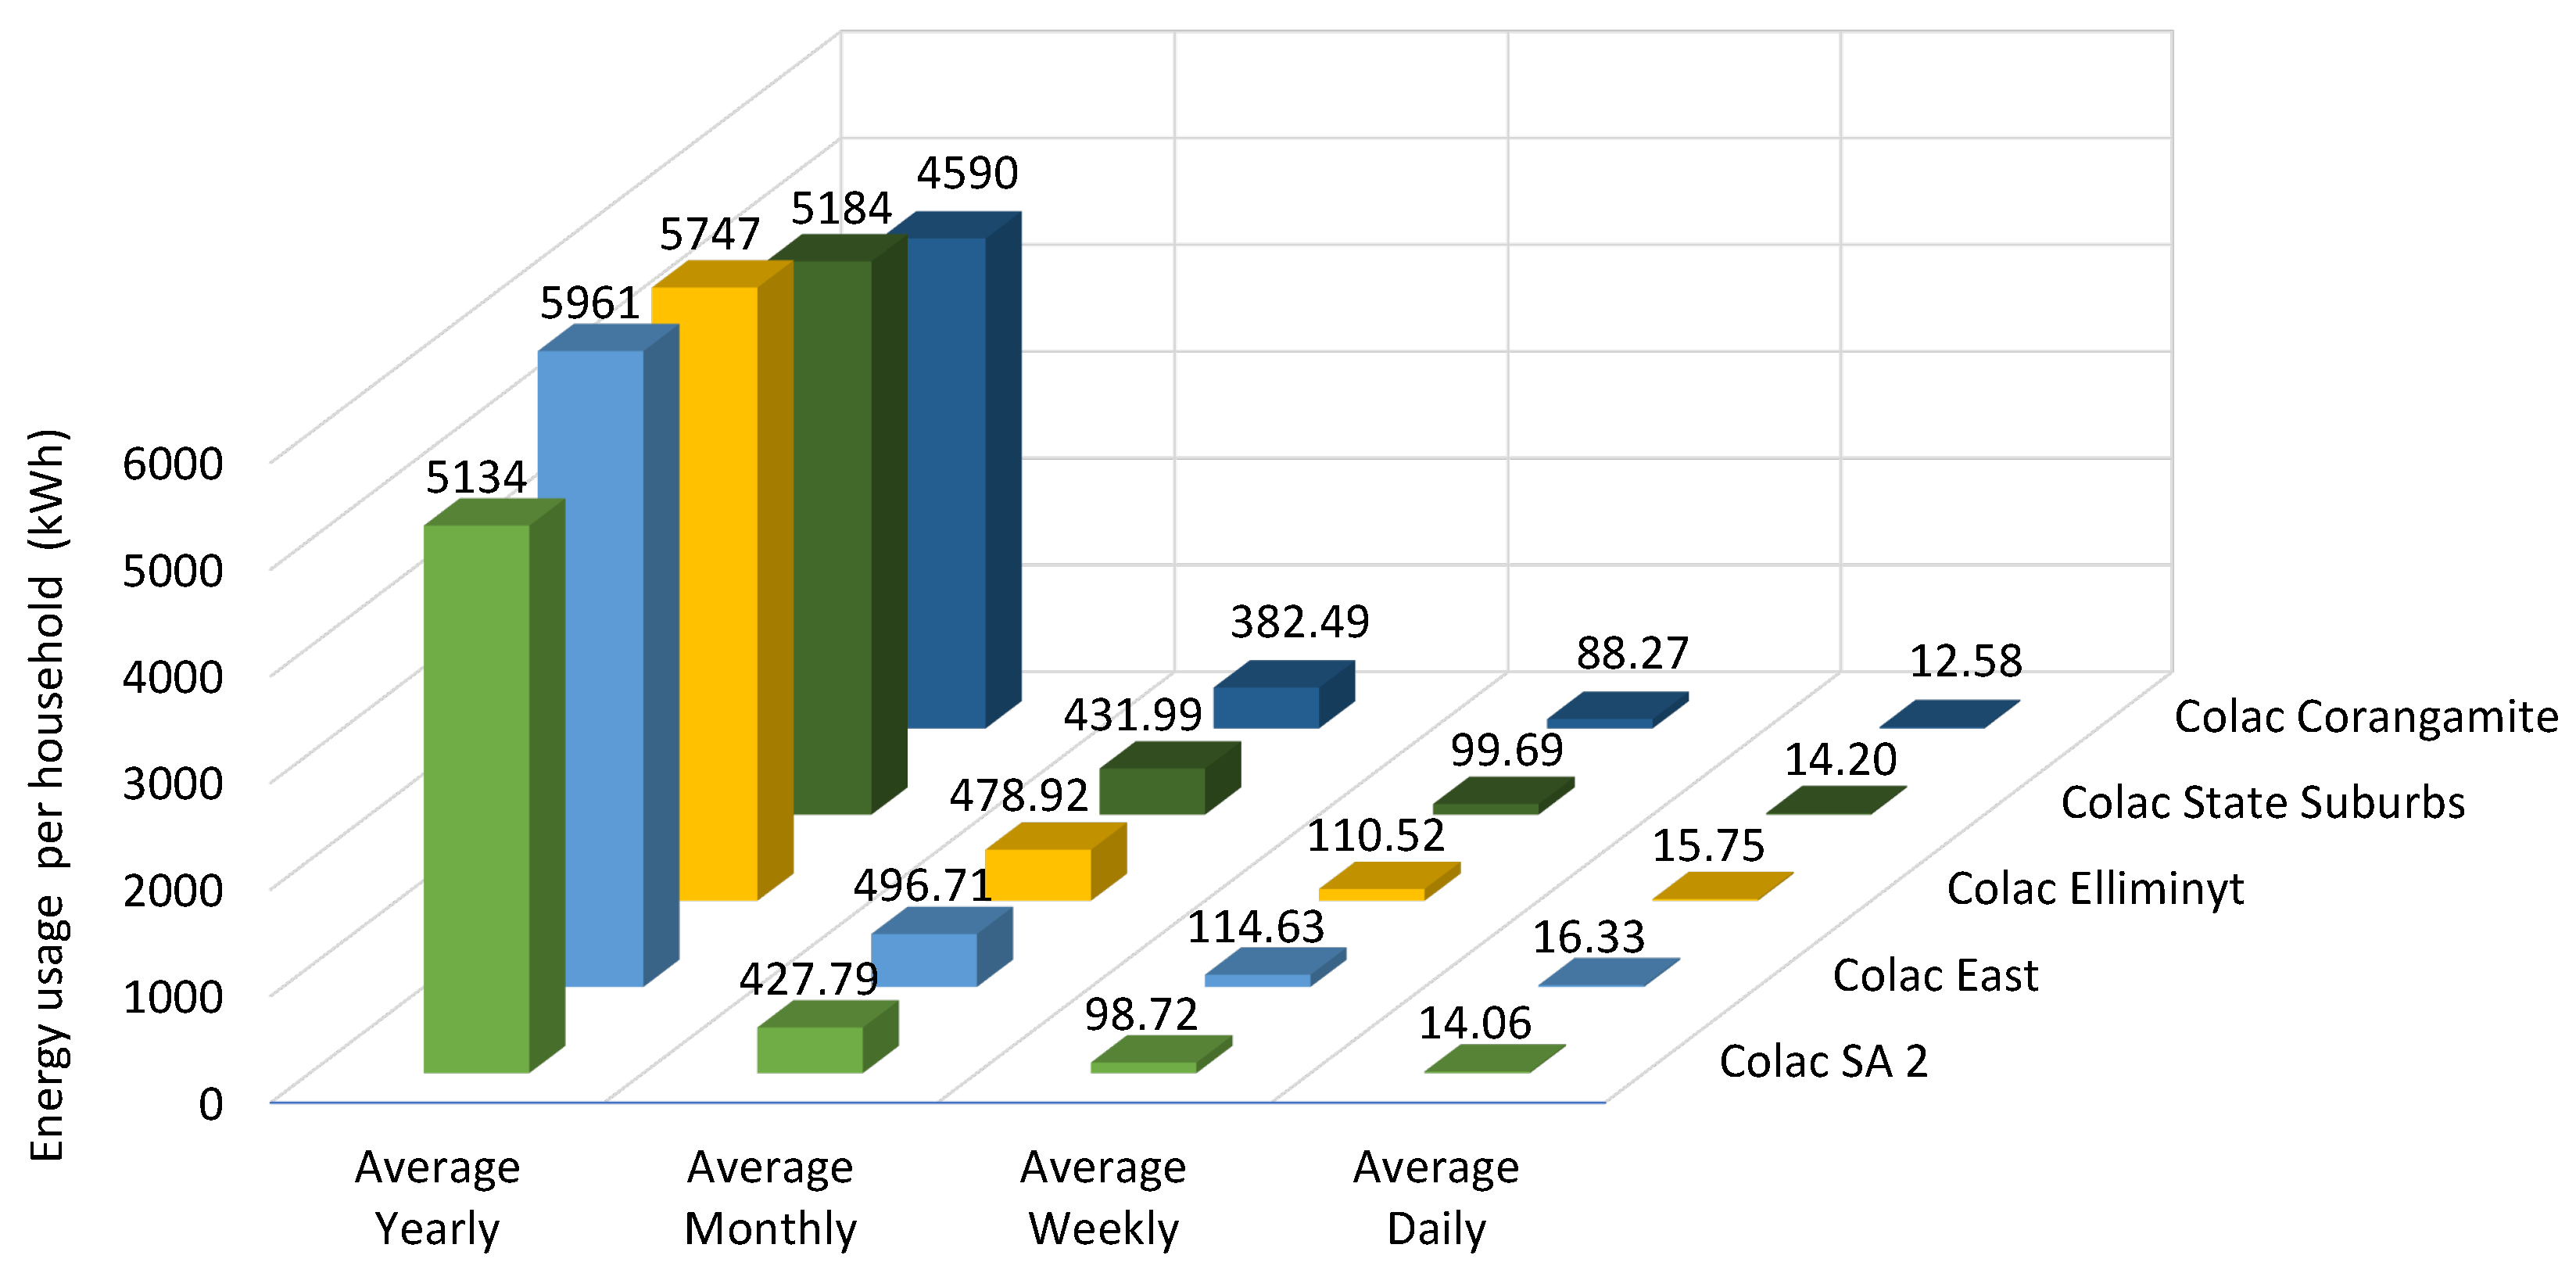
3. Experiments on Five Regions

In this section, the results obtained from the proposed techniques are described. Detailed results are shown for region 1, i.e., Colac SA 2, which covers various demographic factors in the residential sector. The calculated results for other regions are also briefly described. Considering Equation (1), the energy consumption estimation for Colac SA 2 region is calculated, with a total population of 12,250 as shown in Table 4. The total number of houses (energy consumers) in this area are 5593 with, on average, 2.3 persons per household. The average number of bedrooms per dwelling in this area is three, with a median age of 42. Another important factor is the occupancy of dwellings. The 83.9% of the dwellings were occupied, and 16.1% were unoccupied. Considering all these factors, the average energy consumption by a household in Colac SA 2 is calculated by applying Equation (1)
E A T colac = ( 5593 3 ) × 2.3 × 83.91 × 1.90 × 42 = 1864.33 × 2.3 × 83.91 × 1.90 × 42 = 28 , 711 , 774   ( kWh ) / year
where E A T colac is the aggregated energy consumption per year for the whole region. The term E c is the total number of energy consumers (households) in the Colac SA 2 region and the variables P h , O r , H c and A h are explained in Table 3. To calculate the average energy consumption of an individual house, the aggregated energy usage is divided by the total number of households in that area. This is calculated by applying Equation (3)
E y   Colac SA 2 = 28 , 711 , 774 / 5593 = 5134   ( kWh ) / year
where E y   Colac SA 2 is the yearly average energy consumption of an individual house in the Colac SA 2 region. This value can vary across different demographic regions. To analyze the impact of demographic determinants across different groups, the energy consumption for households in other areas in the Colac region are estimated, and their values are presented in Table 4 (last column).
These results indicate that every region has different energy consumption levels throughout the year based on their demographic characteristics. The occupancy rate and median age have greater impacts on overall energy consumption. A graphical illustration of all these energy levels in different regions is presented in Figure 3.
The average monthly energy consumption per household is calculated by applying Equation (4).
E m   Colac SA 2 = 5134 / 12 = 427.79   ( kWh ) / month
where E m   Colac SA 2 is the average monthly energy consumption in Colac SA 2 region. The term T m is total number of months in a year. Similarly, the weekly energy consumption is computed by Equation (5).
E w   Colac SA 2 = 5134 / 52 = 98.72   ( kWh ) / week
where E w   Colac SA 2 denotes the average weekly energy consumption in Colac SA 2 region and T w is total weeks in a year. The daily energy consumption is calculated by applying Equation (6).
E d   Colac SA 2 = 5134 / 365 = 14.06   ( kWh ) / day
where E d   Colac SA 2 represents the average daily energy consumption in Colac SA 2 region and T d represents the total number of days in a year. The same process is repeated for the other four regions and estimated energy consumption results are summarized in Figure 4. The estimates shown in Figure 4 illustrate that the average yearly, monthly, weekly, and daily energy consumption differs from region to region. This is due to the unique demographic characteristics of each region. For instance, the average energy consumption of households in Colac east is 5961 kWh/year, owing to the region’s highest median age and elderly people’s preference to stay at home [39]. This region has the highest average number of families with children, which has an impact on overall energy consumption [40]. It is worth noting that the number of people per household influences energy consumption. For example, the region of Colac Elliminyt has an average of 2.8 people per household and an average energy usage of 5747 kWh/year, compared to 2.3 people per household in Colac SA 2 and 5134 kWh/year. The occupancy rate and the average number of bedrooms both have an impact on the overall energy transition. For example, Colac Elliminyt’s energy consumption of 5747 kWh/year is greater than Colac State Suburbs 5184 kWh/year, due to the higher occupancy rate of 87.3 % and higher number of bedrooms ( 2.8 ). From the results, it can be concluded that different factors contribute to energy consumption in households, and this study finds that there may be variances in energy consumption due to the different demographic characteristics between regions.

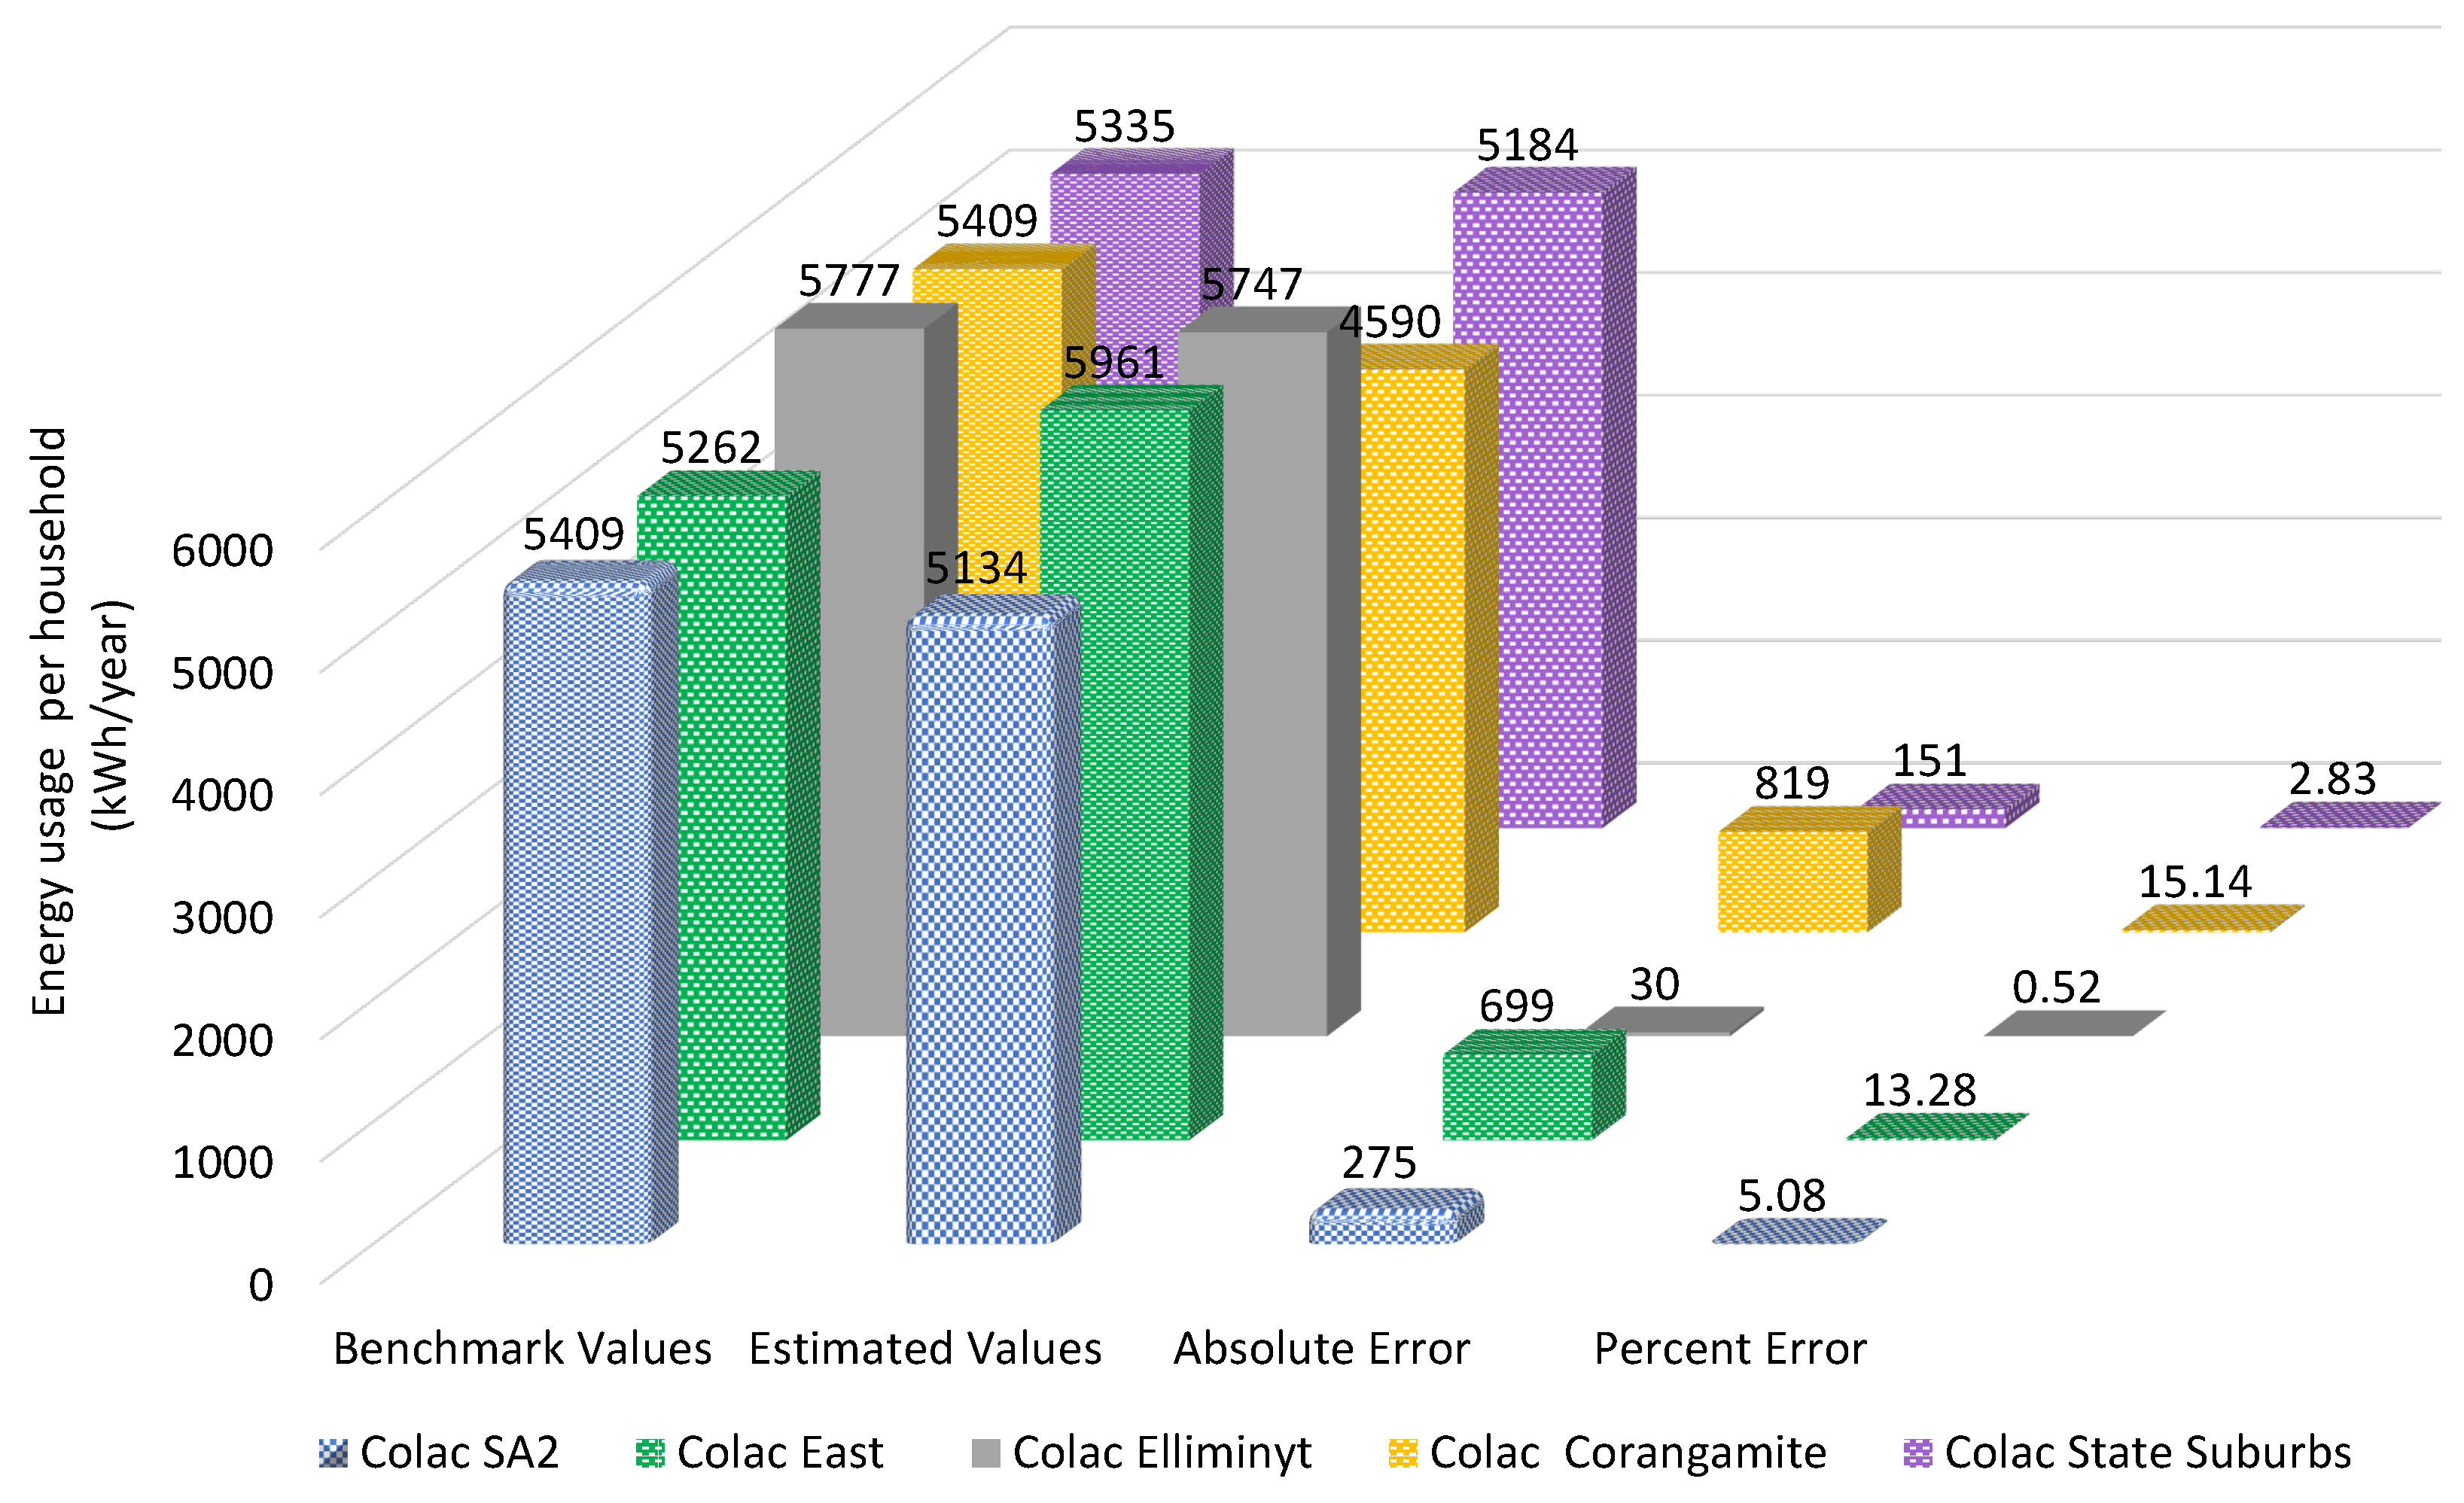
4. Comparison with Energy Benchmarks

After obtaining the energy consumption estimates and geographical locations of households, the calculated values are compared with the energy consumption benchmarks published by the AER [41]. The benchmark document contains electricity consumption estimates for residential customers in Australia. The benchmarks are based on climatic zone and household size, as the climate has a substantial impact on the way in which energy is used and, therefore, on the benchmarks’ levels of usage. For the region in this study, the climate zone is 6 in Victoria, Australia, as shown in Table 5. The aim is to compare the estimates of energy consumption obtained by the developed formula with the benchmark statistics and identify any differences between them.
Table 6 summarizes the results of the evaluation. The comparisons were made according to the demographic variables. For instance, a household with 2.3 persons per household in climate zone six consumes 5409 kWh energy per year. This benchmark value is compared with the estimated value 5134 kWh energy per year. The comparison results indicate that the estimates produced by the proposed scheme are reasonable comparable to the benchmarks, demonstrating its effectiveness in energy consumption processes. Errors between the benchmarks and estimated values are calculated by computing the absolute and percentage errors, as in Equations (7) and (8). For a better understanding of this, the energy consumption estimates for each region are also presented in Figure 5. This graph shows the errors for the five different regions and it can be seen that the minimum error was observed in Colac Elliminyt region, with a percent error of 0.52 %, while the maximum error was observed for the Colac Corangamite, with a percent error of 15.14 %. The average error for the five regions was less than 8% ( 7.37 %). The percent error varied from 0.52 to 15.14 across the five regions, with three main reasons for this variation: differences in demographic characteristics, as varying demographic factors contribute to energy consumption in households, high heterogeneity in human behaviors, and the unique characteristics of society and social groups to which households belong [42].
Absolute Error = Benchmark Estimated
Percent error = Benchmark Estimated Benchmark × 100 %

5. Conclusions

This paper developed a framework for estimating residential energy consumption by combining the human demographic characteristics that have an inherent effect on residential energy consumption. Three novel strategies were proposed by collecting the real demographic data of households from government databases, where a wide range of statistical information is available. The first stage involved developing a mathematical formula to estimate energy consumption while considering the primary determinants of energy consumption. The second stage consistsed of the development of a GPH algorithm to determine the geographical locations of households. In the third stage, the solutions were evaluated according to the real demographic factors of five regions in Australia. For a practical demonstration, the techniques were tested on different demographic characteristics. Estimated and energy consumption benchmarks were compared in terms of absolute and percent error. The comparison results indicate that the estimated energy consumption values reflect their similarity to the original energy consumption benchmarks that were produced by energy regulators. For the five regions, the average error between the estimated and benchmark values was less than 8% (7.37%).
The benefit of the proposed method is that, instead of solely depending on the data from the operational and planning systems of electrical network operators, energy usage was estimated from the public statistical data, which are usually available from local government databases. In this way, the problem of data availability is addressed, assisting researchers, government entities, and decision-makers in contributing to sustainable futures and resilient communities.
This study is based on data samples derived from the Australian regions. As a result, this conclusion may only apply to Australian residents. Differences may exist in results based on samples from various countries or regions. There may be some other demographic characteristics, which are not included. For instance, the economic factors and lifestyle of households, such as income, are correlated with higher electricity consumption, as was concluded in recent research [42]. Future studies should include more demographic characteristics. Comparative research in different nations or areas could systematically investigate the influence of demographic characteristics on residential energy consumption. It would be interesting to explore how seasonal variations affect energy consumption modeling by clustering the results into urban and rural communities. An exploration of the differences in energy consumption according to season and climate zone can assist energy planners in making informed decisions when planning future energy and electricity development, as well as developing climate and energy policies. In addition, the emerging concept of electric vehicles (EVs) in modeling electricity consumption trends would be advantageous in terms of saving energy and lowering carbon emissions [43]. Modeling occupant behaviors using publicly accessible data, as well as the incorporation of energy feedback systems, would provide significant future work for sustainable smart cities.

Author Contributions

Conceptualization, methodology, formal analysis, writing, M.A.; formal analysis, validation, K.P.; data curation, C.M.; investigation, review, and editing, A.K.B., A.J., A.B.; review, and editing, J.J.K.; and supervision, review, and editing, H.P. All authors have read and agreed to the published version of the manuscript.

Funding

The authors gratefully acknowledge the support provided by the University of New South Wales (UNSW), Canberra, Australia, as part of the University International Postgraduate Award (UIPA) scholarship. We are also grateful to the industry partner (Zeppelin Bend Pty Ltd., ACT, Canberra, Australia) for the development of this study. The authors would also like to thank the “Sustainable Process Integration Laboratory—SPIL” in Brno, Czech Republic for reviewing and strengthening the capacity of this work as a part of EU-CZ Operational Programme Research and Development, Education with Grant No. CZ.02.1.01/0.0/0.0/15_003/0000456.

Institutional Review Board Statement

Not applicable.

Informed Consent Statement

Not applicable.

Data Availability Statement

Not applicable.

Acknowledgments

A special thanks to Denise Russell (native English speaker) for proofreading the manuscript.

Conflicts of Interest

The authors declare no conflict of interest.

References

  1. Newell, R.; Raimi, D.; Villanueva, S.; Prest, B. Global Energy Outlook 2021: Pathways from Paris. Resources for the Future, 8 June 2021. [Google Scholar]
  2. Milić, V.; Rohdin, P.; Moshfegh, B. Further development of the change-point model–Differentiating thermal power characteristics for a residential district in a cold climate. Energy Build. 2021, 231, 110639. [Google Scholar] [CrossRef]
  3. Mugnini, A.; Coccia, G.; Polonara, F.; Arteconi, A. Performance assessment of data-driven and physical-based models to predict building energy demand in model predictive controls. Energies 2020, 13, 3125. [Google Scholar] [CrossRef]
  4. Attoue, N.; Shahrour, I.; Younes, R. Smart building: Use of the artificial neural network approach for indoor temperature forecasting. Energies 2018, 11, 395. [Google Scholar] [CrossRef] [Green Version]
  5. Li, X.; Yao, R. Modelling heating and cooling energy demand for building stock using a hybrid approach. Energy Build. 2021, 235, 110740. [Google Scholar] [CrossRef]
  6. Liu, Y.; Yuen, C.; Yu, R.; Zhang, Y.; Xie, S. Queuing-Based Energy Consumption Management for Heterogeneous Residential Demands in Smart Grid. IEEE Trans. Smart Grid 2016, 7, 1650–1659. [Google Scholar] [CrossRef]
  7. Zhang, X.M.; Grolinger, K.; Capretz, M.A.M.; Seewald, L. Forecasting Residential Energy Consumption: Single Household Perspective. In Proceedings of the 2018 17th IEEE International Conference on Machine Learning and Applications (ICMLA), Orlando, FL, USA, 17–20 December 2018; pp. 110–117. [Google Scholar]
  8. Liu, Y.; Wang, W.; Ghadimi, N. Electricity load forecasting by an improved forecast engine for building level consumers. Energy 2017, 139, 18–30. [Google Scholar] [CrossRef]
  9. Kwac, J.; Flora, J.; Rajagopal, R. Household Energy Consumption Segmentation Using Hourly Data. IEEE Trans. Smart Grid 2014, 5, 420–430. [Google Scholar] [CrossRef]
  10. Sepehr, M.; Eghtedaei, R.; Toolabimoghadam, A.; Noorollahi, Y.; Mohammadi, M. Modeling the electrical energy consumption profile for residential buildings in Iran. Sustain. Cities Soc. 2018, 41, 481–489. [Google Scholar] [CrossRef]
  11. Narayan, P.K.; Smyth, R. The residential demand for electricity in Australia: An application of the bounds testing approach to cointegration. Energy Policy 2005, 33, 467–474. [Google Scholar] [CrossRef]
  12. Boogen, N.; Datta, S.; Filippini, M. Estimating residential electricity demand: New empirical evidence. Energy Policy 2021, 158, 112561. [Google Scholar] [CrossRef]
  13. Krarti, M.; Aldubyan, M. Review analysis of COVID-19 impact on electricity demand for residential buildings. Renew. Sustain. Energy Rev. 2021, 143, 110888. [Google Scholar] [CrossRef]
  14. Hobby, J.D.; Shoshitaishvili, A.; Tucci, G.H. Analysis and Methodology to Segregate Residential Electricity Consumption in Different Taxonomies. IEEE Trans. Smart Grid 2012, 3, 217–224. [Google Scholar] [CrossRef]
  15. Fumo, N.; Biswas, M.R. Regression analysis for prediction of residential energy consumption. Renew. Sustain. Energy Rev. 2015, 47, 332–343. [Google Scholar] [CrossRef]
  16. Niemierko, R.; Töppel, J.; Tränkler, T. A D-vine copula quantile regression approach for the prediction of residential heating energy consumption based on historical data. Appl. Energy 2019, 233, 691–708. [Google Scholar] [CrossRef]
  17. Bourdeau, M.; Zhai, X.q.; Nefzaoui, E.; Guo, X.; Chatellier, P. Modeling and forecasting building energy consumption: A review of data-driven techniques. Sustain. Cities Soc. 2019, 48, 101533. [Google Scholar] [CrossRef]
  18. Xu, G.; Wang, W. China’s energy consumption in construction and building sectors: An outlook to 2100. Energy 2020, 195, 117045. [Google Scholar] [CrossRef]
  19. Zhao, T.; Xu, J.; Zhang, C.; Wang, P. A monitoring data based bottom-up modeling method and its application for energy consumption prediction of campus building. J. Build. Eng. 2021, 35, 101962. [Google Scholar] [CrossRef]
  20. Zhang, W.; Robinson, C.; Guhathakurta, S.; Garikapati, V.M.; Dilkina, B.; Brown, M.A.; Pendyala, R.M. Estimating residential energy consumption in metropolitan areas: A microsimulation approach. Energy 2018, 155, 162–173. [Google Scholar] [CrossRef] [Green Version]
  21. Subbiah, R.; Pal, A.; Nordberg, E.K.; Marathe, A.; Marathe, M.V. Energy Demand Model for Residential Sector: A First Principles Approach. IEEE Trans. Sustain. Energy 2017, 8, 1215–1224. [Google Scholar] [CrossRef]
  22. Ghedamsi, R.; Settou, N.; Gouareh, A.; Khamouli, A.; Saifi, N.; Recioui, B. Estimating the energy consumption in building sector in Algeria using bottom-up mode. In Proceedings of the IREC2015 The Sixth International Renewable Energy Congress, Sousse, Tunisia, 24–26 March 2015; pp. 1–6. [Google Scholar]
  23. Diao, L.; Sun, Y.; Chen, Z.; Chen, J. Modeling energy consumption in residential buildings: A bottom-up analysis based on occupant behavior pattern clustering and stochastic simulation. Energy Build. 2017, 147, 47–66. [Google Scholar] [CrossRef]
  24. Deb, C.; Schlueter, A. Review of data-driven energy modelling techniques for building retrofit. Renew. Sustain. Energy Rev. 2021, 144, 110990. [Google Scholar] [CrossRef]
  25. Aguilar, J.; Garces-Jimenez, A.; R-Moreno, M.; García, R. A systematic literature review on the use of artificial intelligence in energy self-management in smart buildings. Renew. Sustain. Energy Rev. 2021, 151, 111530. [Google Scholar] [CrossRef]
  26. Haque, H.; Chowdhury, A.K.; Khan, M.N.R.; Razzak, M.A. Demand Analysis of Energy Consumption in a Residential Apartment using Machine Learning. In Proceedings of the 2021 IEEE International IoT, Electronics and Mechatronics Conference (IEMTRONICS), Toronto, ON, Canada, 1–4 June 2021; pp. 1–6. [Google Scholar]
  27. Kim, T.Y.; Cho, S.B. Predicting residential energy consumption using CNN-LSTM neural networks. Energy 2019, 182, 72–81. [Google Scholar] [CrossRef]
  28. Ali, M.; Macana, C.A.; Prakash, K.; Islam, R.; Colak, I.; Pota, H. Generating Open-Source Datasets for Power Distribution Network Using OpenStreetMaps. In Proceedings of the 2020 9th International Conference on Renewable Energy Research and Application (ICRERA), Glasgow, UK, 27–30 September 2020; pp. 301–308. [Google Scholar]
  29. Keshk, M.; Turnbull, B.; Sitnikova, E.; Vatsalan, D.; Moustafa, N. Privacy-Preserving Schemes for Safeguarding Heterogeneous Data Sources in Cyber-Physical Systems. IEEE Access 2021, 9, 55077–55097. [Google Scholar] [CrossRef]
  30. Australian Bureau of Statistics (ABS), Australian Government. Available online: https://www.abs.gov.au/ (accessed on 29 July 2021).
  31. Klemeš, J.J.; Van Fan, Y.; Jiang, P. COVID-19 pandemic facilitating energy transition opportunities. Int. J. Energy Res. 2020. [Google Scholar] [CrossRef]
  32. Muñoz, I.; Hernández, P.; Pérez-Iribarren, E.; Pedrero, J.; Arrizabalaga, E.; Hermoso, N. Methodology for integrated modelling and impact assessment of city energy system scenarios. Energy Strat. Rev. 2020, 32, 100553. [Google Scholar] [CrossRef]
  33. Ali, M.; Prakash, K.; Hossain, M.A.; Pota, H.R. Intelligent energy management: Evolving developments, current challenges, and research directions for sustainable future. J. Clean. Prod. 2021, 314, 127904. [Google Scholar] [CrossRef]
  34. QGIS Development Team. QGIS Geographic Information System; Open Source Geospatial Foundation: Chicago, IL, USA, 2021. [Google Scholar]
  35. Gui, X.; Gou, Z. Regional differences in household water technology adoption: A longitudinal study of Building Sustainability Index-certified dwelling units in New South Wales, Australia. J. Clean. Prod. 2021, 307, 127338. [Google Scholar] [CrossRef]
  36. Langevin, J. Longitudinal dataset of human-building interactions in US offices. Nat. Sci. Data 2019, 6, 1–10. [Google Scholar]
  37. Department of Environment, Land, Water and Planning, Victoria, Australia. Available online: http://services.land.vic.gov.au/SpatialDatamart/index.jsp# (accessed on 1 August 2021).
  38. Vector Geometry-QGIS Documentation 23.1.15. Available online: https://docs.qgis.org/3.10/en/docs/user_manual/processing_algs/qgis/vectorgeometry.html#add-geometry-attribute (accessed on 1 August 2021).
  39. Serrano-Jiménez, A.; Barrios-Padura, Á.; Molina-Huelva, M. Sustainable building renovation for an ageing population: Decision support system through an integral assessment method of architectural interventions. Sustain. Cities Soc. 2018, 39, 144–154. [Google Scholar] [CrossRef]
  40. Sakah, M.; du Can, S.d.l.R.; Diawuo, F.A.; Sedzro, M.D.; Kuhn, C. A study of appliance ownership and electricity consumption determinants in urban Ghanaian households. Sustain. Cities Soc. 2019, 44, 559–581. [Google Scholar] [CrossRef]
  41. Australian Energy Regulator, Electricity Bill Benchmarks for Residential Customers. Available online: http://www.aer.gov.au/system/files/ACIL%20Allen%20Energy%20benchmarks%20report%202017%20-%20updated%205%20June%202018.pdf (accessed on 1 October 2021).
  42. Bogin, D.; Kissinger, M.; Erell, E. Comparison of domestic lifestyle energy consumption clustering approaches. Energy Build. 2021, 253, 111537. [Google Scholar] [CrossRef]
  43. Iqbal, M.N.; Kütt, L.; Lehtonen, M.; Millar, R.J.; Püvi, V.; Rassõlkin, A.; Demidova, G.L. Travel activity based stochastic modelling of load and charging state of electric vehicles. Sustainability 2021, 13, 1550. [Google Scholar] [CrossRef]
Figure 1. Framework of the proposed methodology.
Energies 15 02163 g001
Figure 2. Satellite view of GPH algorithm showing the geographical positions of households.
Energies 15 02163 g002
Figure 3. Variations in household energy usage among different demographic regions (a) Colac SA2, (b) Colac Elliminyt, (c) Colac East, (d) Colac State Suburbs, (e) Colac Corangamite.
Energies 15 02163 g003
Figure 4. Daily, weekly, monthly, and yearly energy consumption at five demographic regions.
Energies 15 02163 g004
Figure 5. Comparison of benchmark and estimated values for five regions.
Energies 15 02163 g005
Table 1. Summary of relevant studies in the literature and enhancements in this paper.
Recent StudiesYearMethodCommon LimitationsEnhancements in This Paper
Nelson, F. [15]2015Linear regression
  • Existing studies mainly focused on the physical features of residential buildings (e.g., building structure, including attached, semi-attached, detached houses and apartments), climatic (weather) conditions, and heating and cooling devices, to improve their energy efficiency. The social demographic factors influencing the energy transitions were not properly investigated.
  • The commonly used statistical regression and artificial intelligence models rely on data from smart meters or the data provided by energy companies. Energy companies usually refrain from providing data due to the risk of privacy disclosures. This factor, in turn, affects the validity of energy consumption solutions. The data restrictions have limited the opportunities to undertake energy consumption modeling, which enables the projection of future scenarios.
  • These solutions are only validated for a single demographic region or household. However, this aspect might differ across different households, depending on the demographic characteristics and locations.
  • The geographical locations of household are not explicitly defined. The spatial information defines energy usage within groups of buildings and can be used to identify high-consumption areas.
  • A comparison of energy estimates with the electricity benchmarks produced by energy regulators is seldom provided.
  • This paper proposes a new way of estimating residential energy consumption by collecting the real demographics of household from local government databases. A mathematical formula is developed, considering the social elements, such as the statistical information and demographic factors of households, to examine the key determinants of energy consumption.
  • A geographical position algorithm (GPH) is proposed to identify the geographical positions of households. Its objective is to solve the problem of obtaining longitudinal data for households.
  • As energy consumption varies from region to region, the issue of uncertainty in energy usage at different demographic regions is addressed by calculating households’ energy usage in different locations.
  • The practical application of the proposed solutions is validated in five regions in Australia. For fairness, five regions, with distinct demographics, are selected and compared.
  • Comparisons are made between estimated and energy consumption benchmarks produced by energy regulators. The comparison results support our findings in validating the crucial role that demographic factors play in overall energy consumption
Rochus, N. [16]2019Quantile regression
Mathieu, B. [17]2019Statistical regression
Xu, G. [18]2020Ridge regression
Zhao, T. [19]2019Bottom-up modeling
Zhang, W. [20]2019Bottom-up model
Subbiah, R. [21]2017Bottom-up approach
Ghedamsi, R. [22]2015Bottom-up method
Diao, L. [23]2017Clustering analysis
Deb, C. [24]2021Review of energy modelling techniques
Aguilar, J. [25]2021Artificial intelligence techniques
Table 2. Demographic factors of households collected from local government databases.
DemographicsRegion
Colac-SA 2Colac-EastColac-ElliminytColac-State SuburbsColac-Corangamite
Population12,2502172900904837,040
Male48.9%55.2%49.9%48.4%50.2%
Female51.1%44.8%50.1%51.6%49.8%
Median age4257404345
Families30083679121559389
Avg families with children1.92.221.91.9
Total Houses (Consumers)5593791120435819,378
Average people per household2.32.12.82.22.3
Average bedrooms per household32.63.42.93.1
Weekly household income (AUD)$1055$875$1463$964$1051
Median monthly mortgage payments$1270$1400$1517$1170$1200
Median weekly rent$215$190$245$215$200
Average motor vehicles per dwellings1.71.62.21.62
Occupied Houses469353977364514,021
Un-occupied houses602161064714222
Table 3. Notations summary.
VariablesDescription
E A T Total energy consumption of households in the whole region
E c Number of energy consumers (households)
B h The average number of bedrooms per household
P h The average number of people per household
H c Households with children
A h The median age of households in the given region
O r Human occupancy in households
O h Occupied houses
U h Un-occupied houses
E I Average energy consumption of an individual house
T h Total number of houses in the selected area
E m Monthly energy consumption of household
T m Total months in a year
E w Weekly energy consumption of household
T w Total number of weeks in a year
E d Daily energy consumption of household
T d Total number of days in a year
Table 4. Energy consumption calculations based on public demographic data.
DemographicsRegion
Colac
SA 2
Colac
East
Colac
Elliminyt
Colac
State Suburbs
Colac
Corangamite
Population12,2502172900904837,040
Houses (Energy Consumers)5593791120435819,378
Average people per household2.32.12.82.22.4
Average bedrooms per household32.63.42.93.1
Occupied Houses469353977364514,021
Un-occupied houses602161064714222
Occupancy rate (%)83.9167.0987.2383.6472.36
Average families with children1.902.202.001.901.90
Median age4250404345
Energy consumption per region (kWh/year)28,711,7744,70,8856,436,70622,591,45988,942,892
Energy consumption per household (kWh/year)51345961574751844590
Table 5. Energy consumption benchmarks published by the Australian energy regulator.
Location: Victoria
(Climate Zone: 6, Region: COLAC, 3250)
AutumnSummerWinterSpringTotal
kWh/SeasonkWh/SeasonkWh/SeasonkWh/SeasonkWh/Year
1 Person Household7376719587203086
2 Person Household10771031134010784526
3 Person Household12531176161512185262
4 Person Household14021304173813385782
5+ Person Household15081421191114656305
Table 6. Comparison of results using energy benchmarks.
MethodDemographicsTotal kWh/Year
Electricity Benchmarks2.3 Person Household5409
Estimated2.3 Person Household5134
Publisher’s Note: MDPI stays neutral with regard to jurisdictional claims in published maps and institutional affiliations.

