
Solidified-Air Energy Storage: Conceptualization and Thermodynamic Analysis


Abstract
:1. Introduction
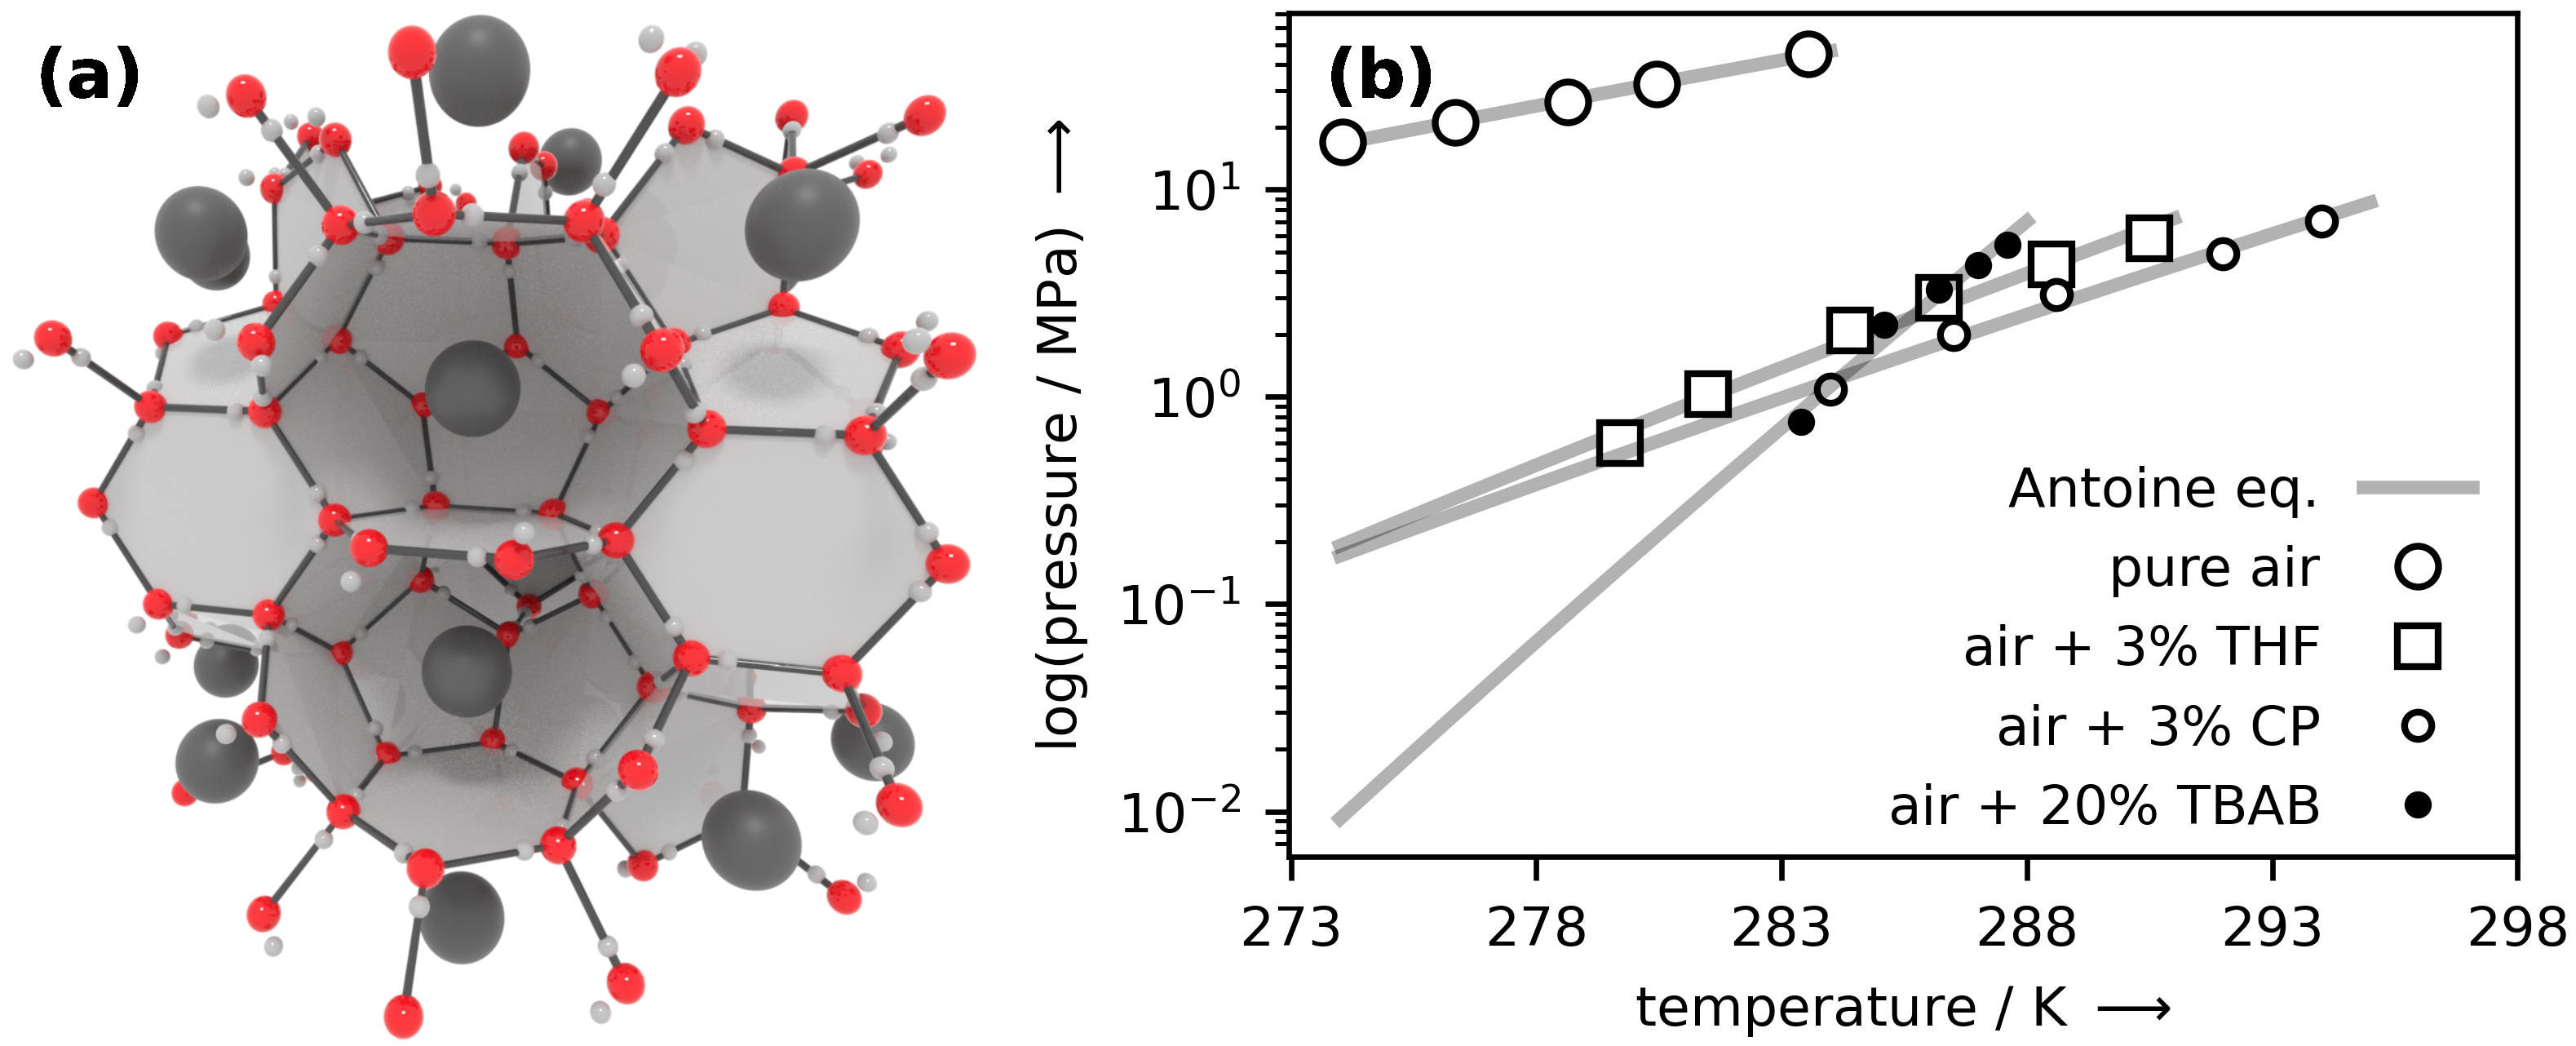
2. Conception
3. Materials and Methods
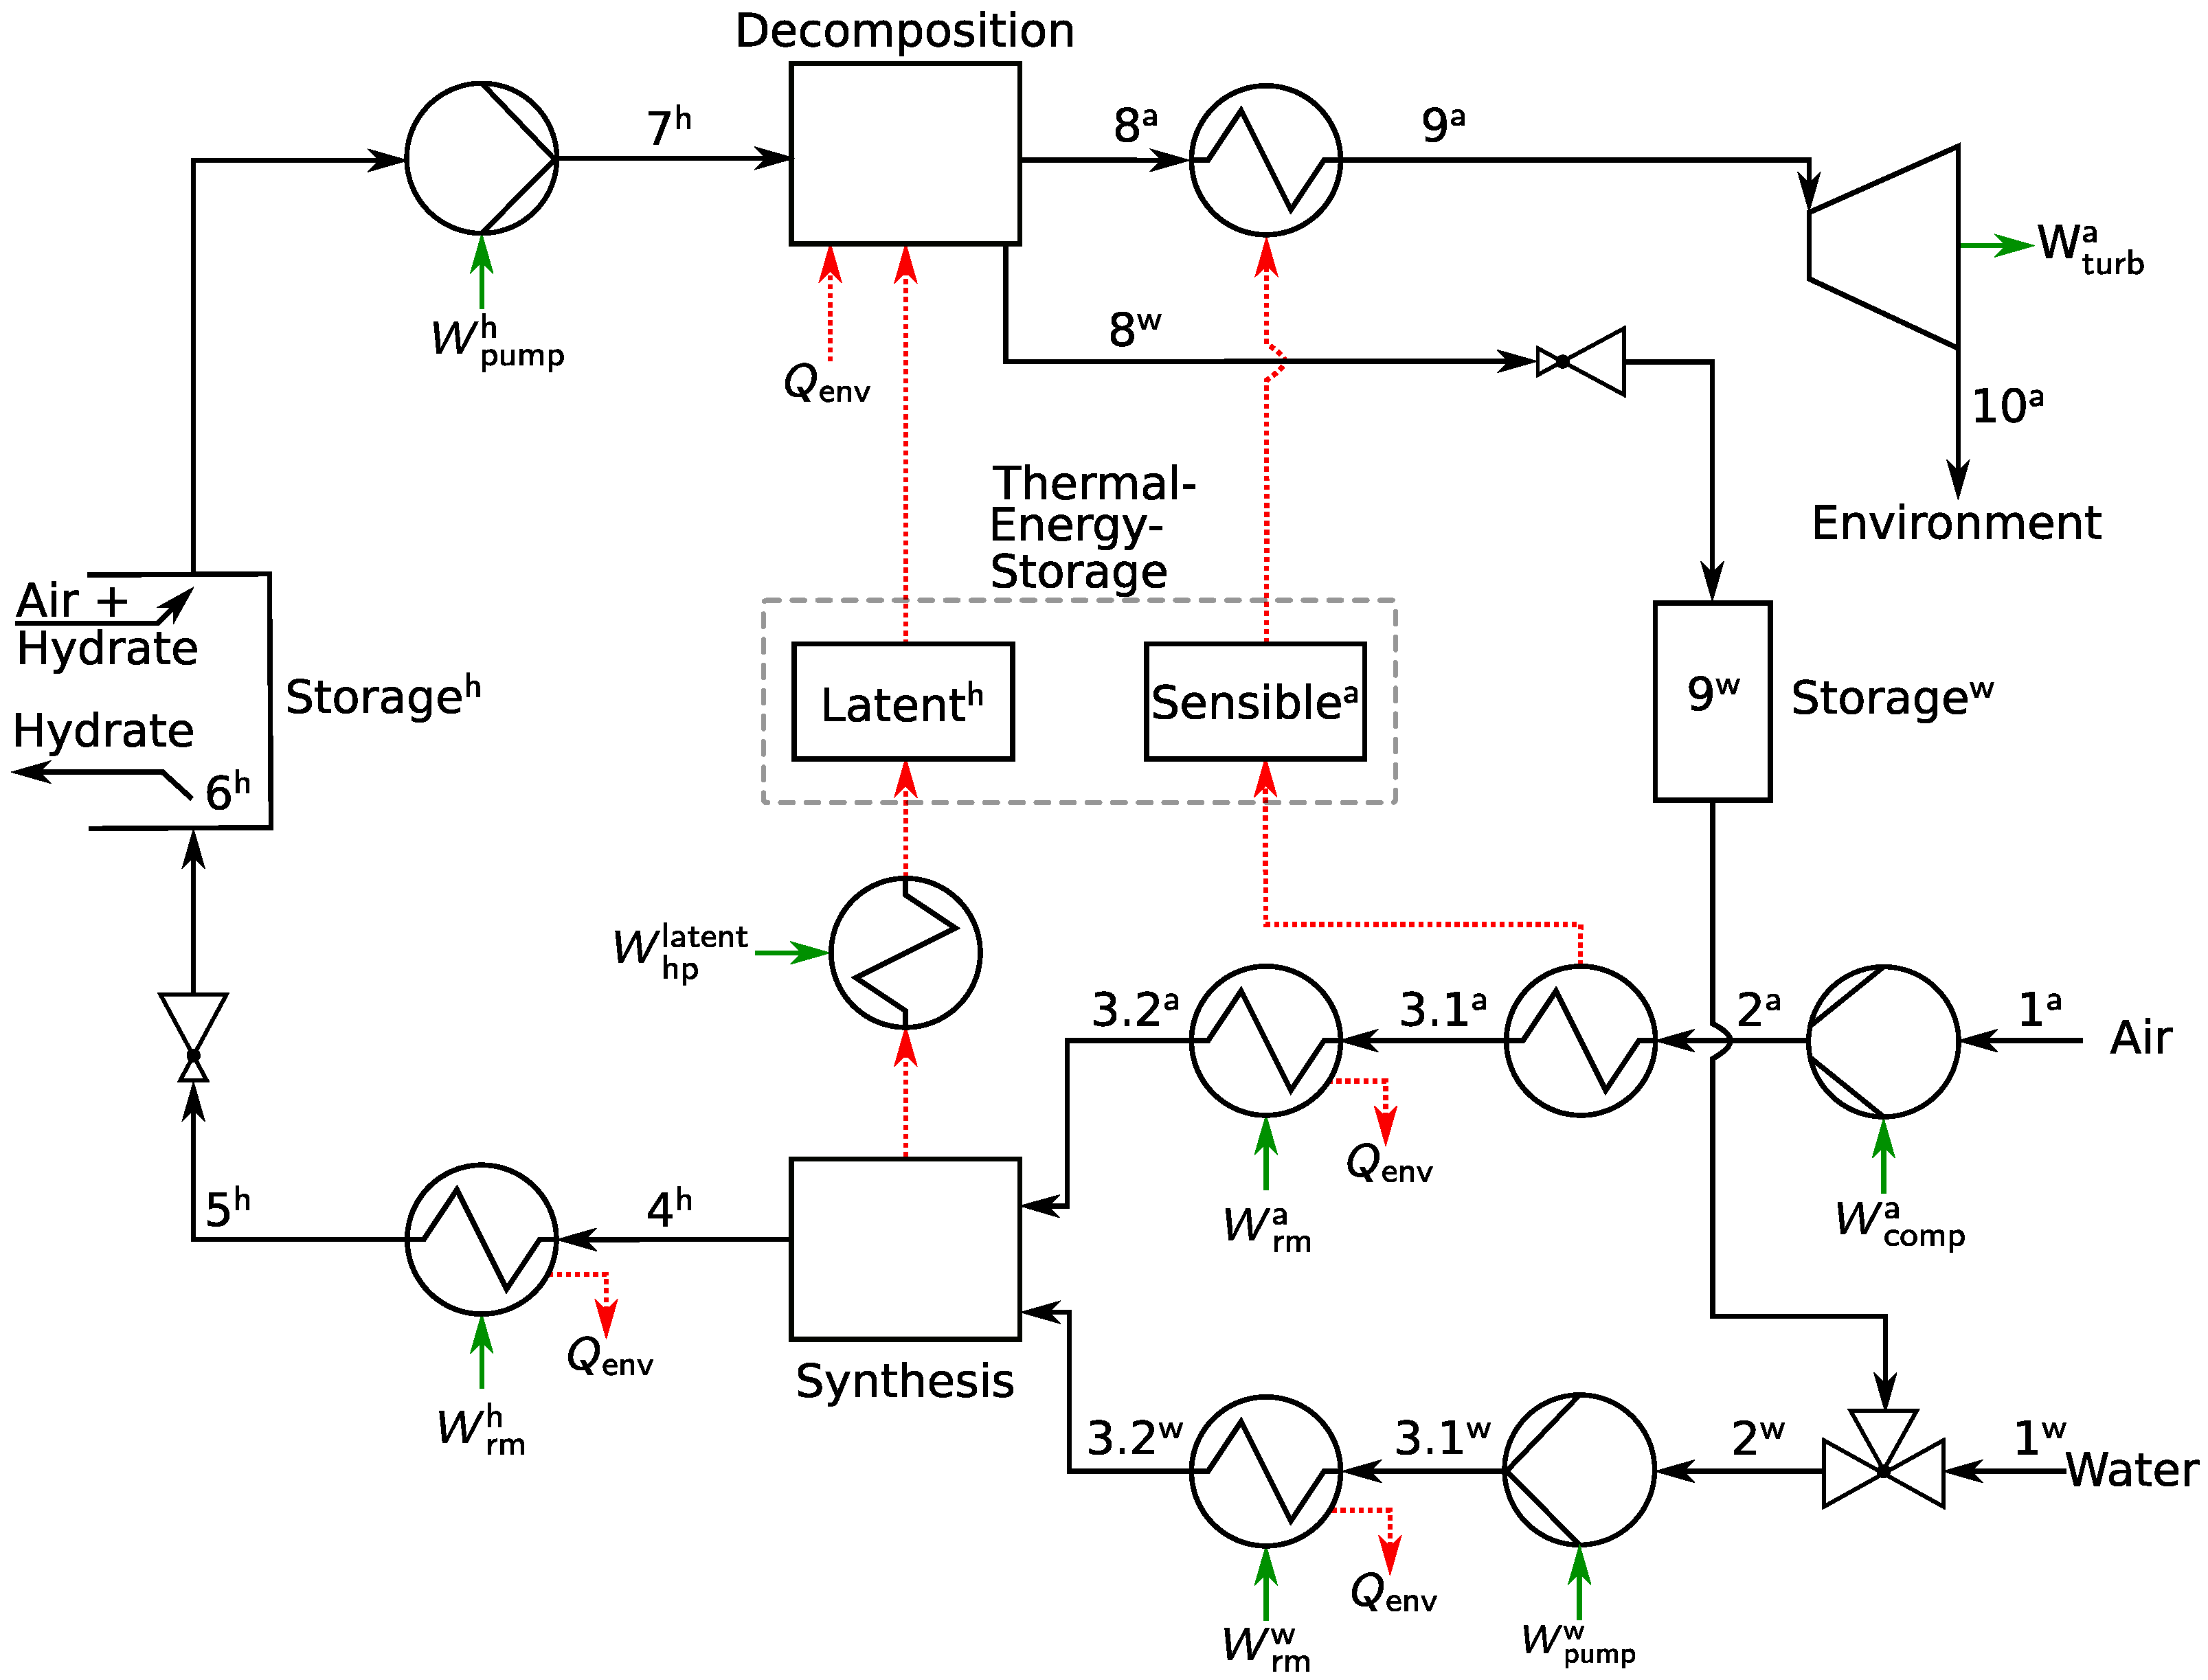
3.1. Plant Description
3.2. Plant Modeling
3.3. Key Indicators
4. Results and Discussion
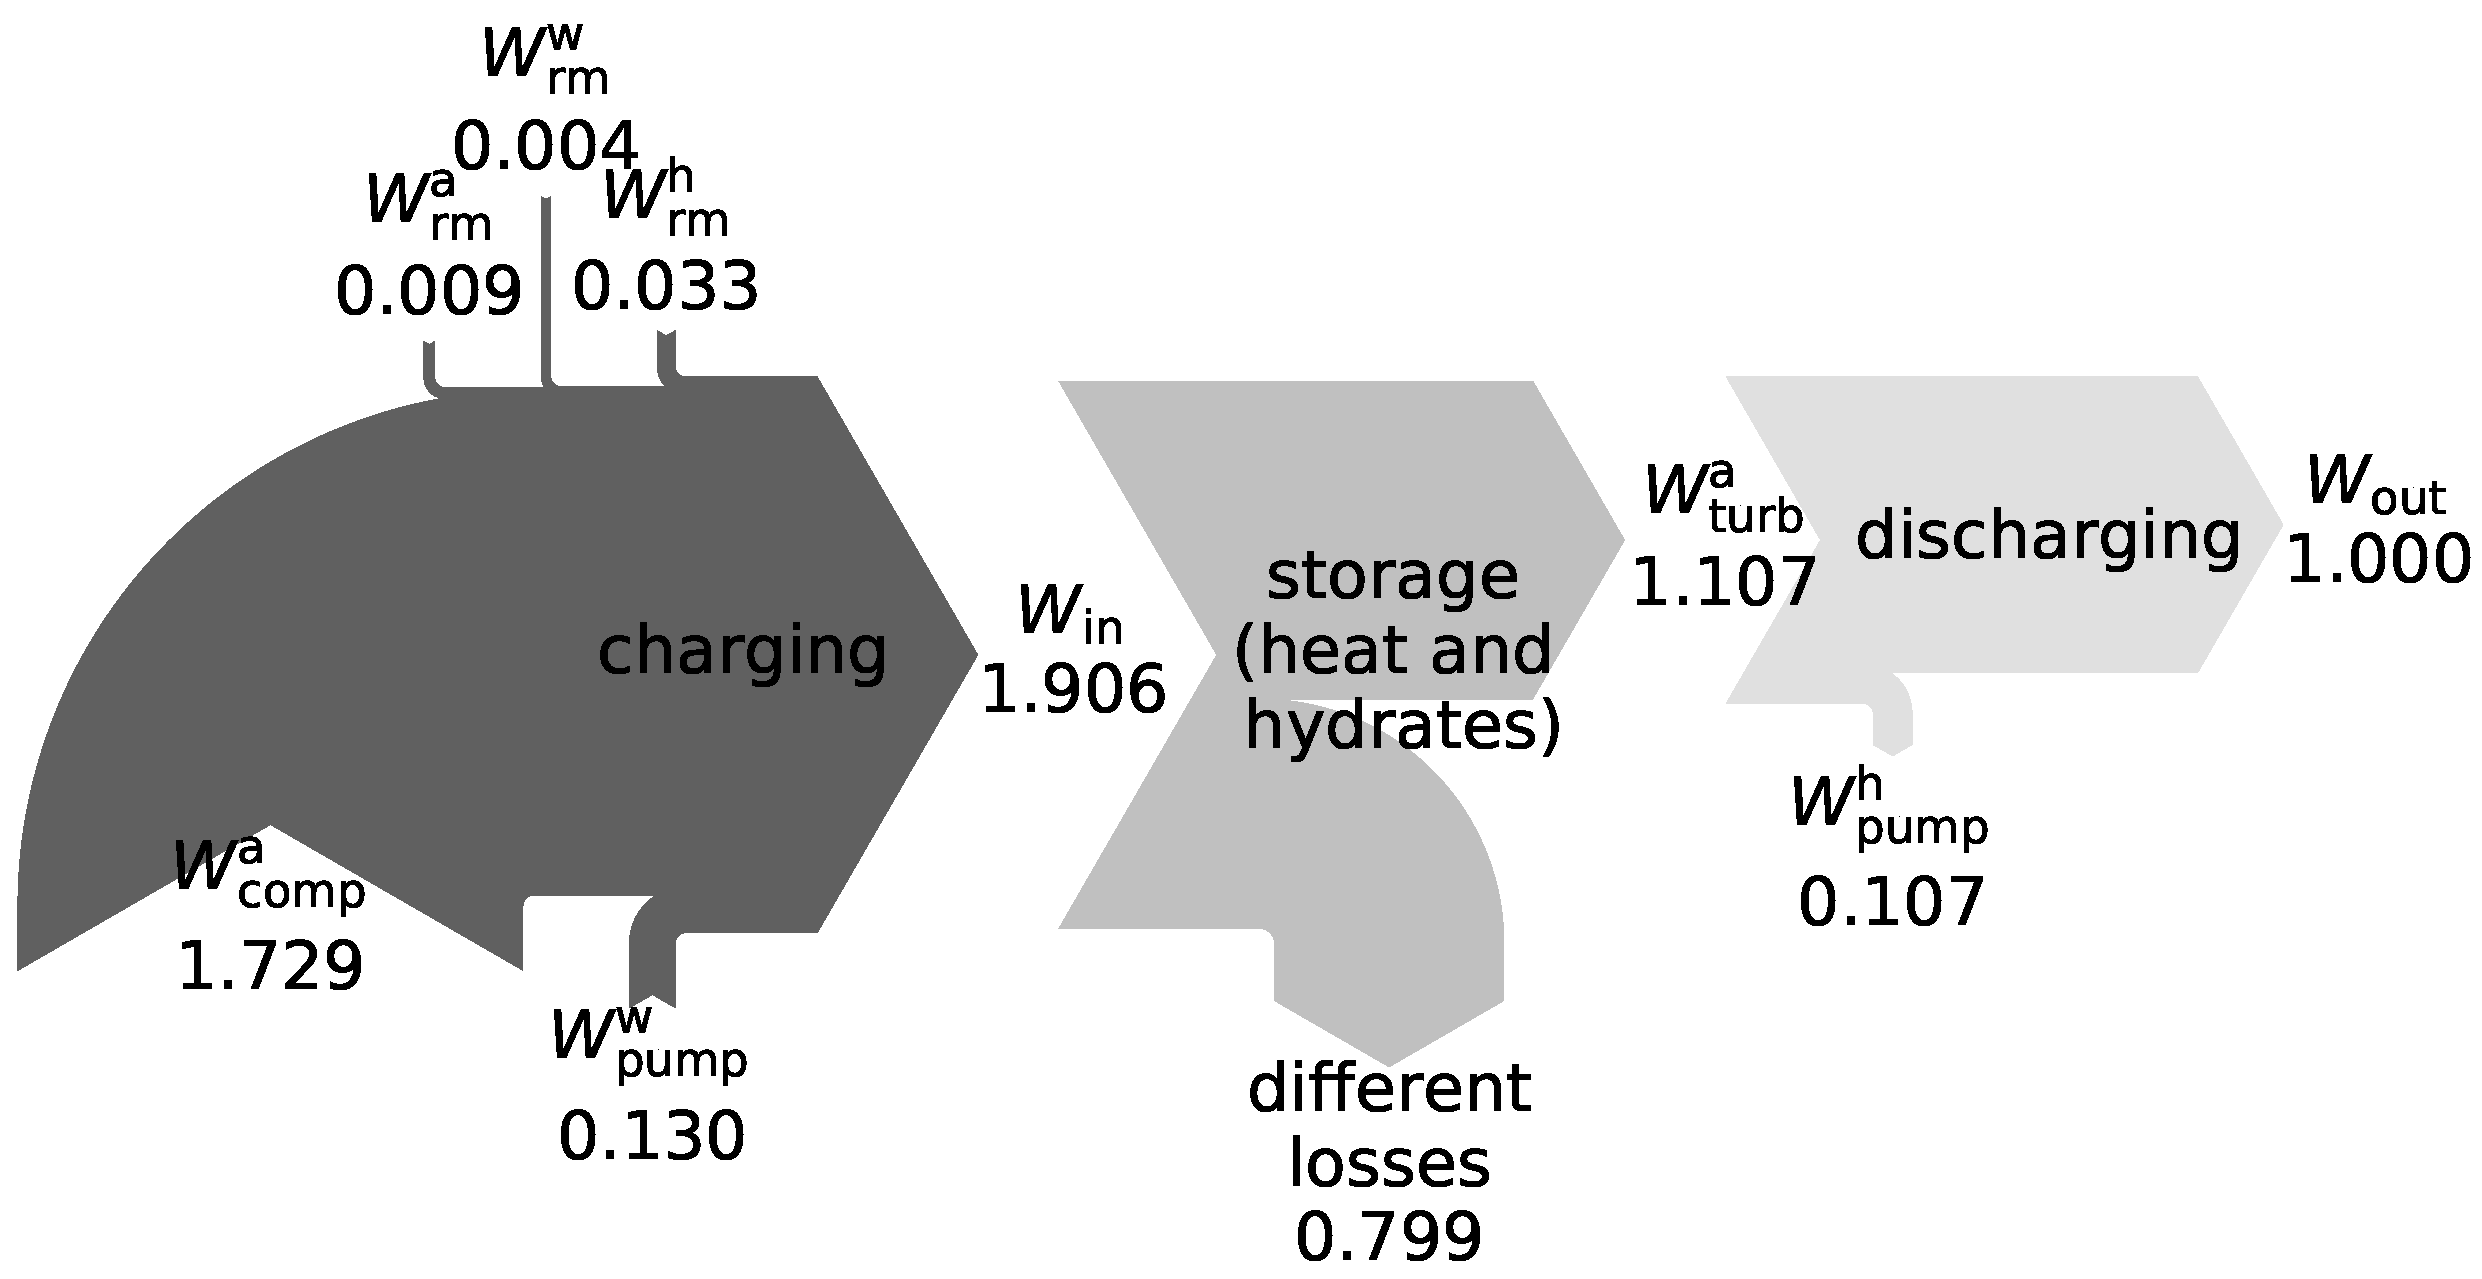
4.1. Thermodynamic Analysis
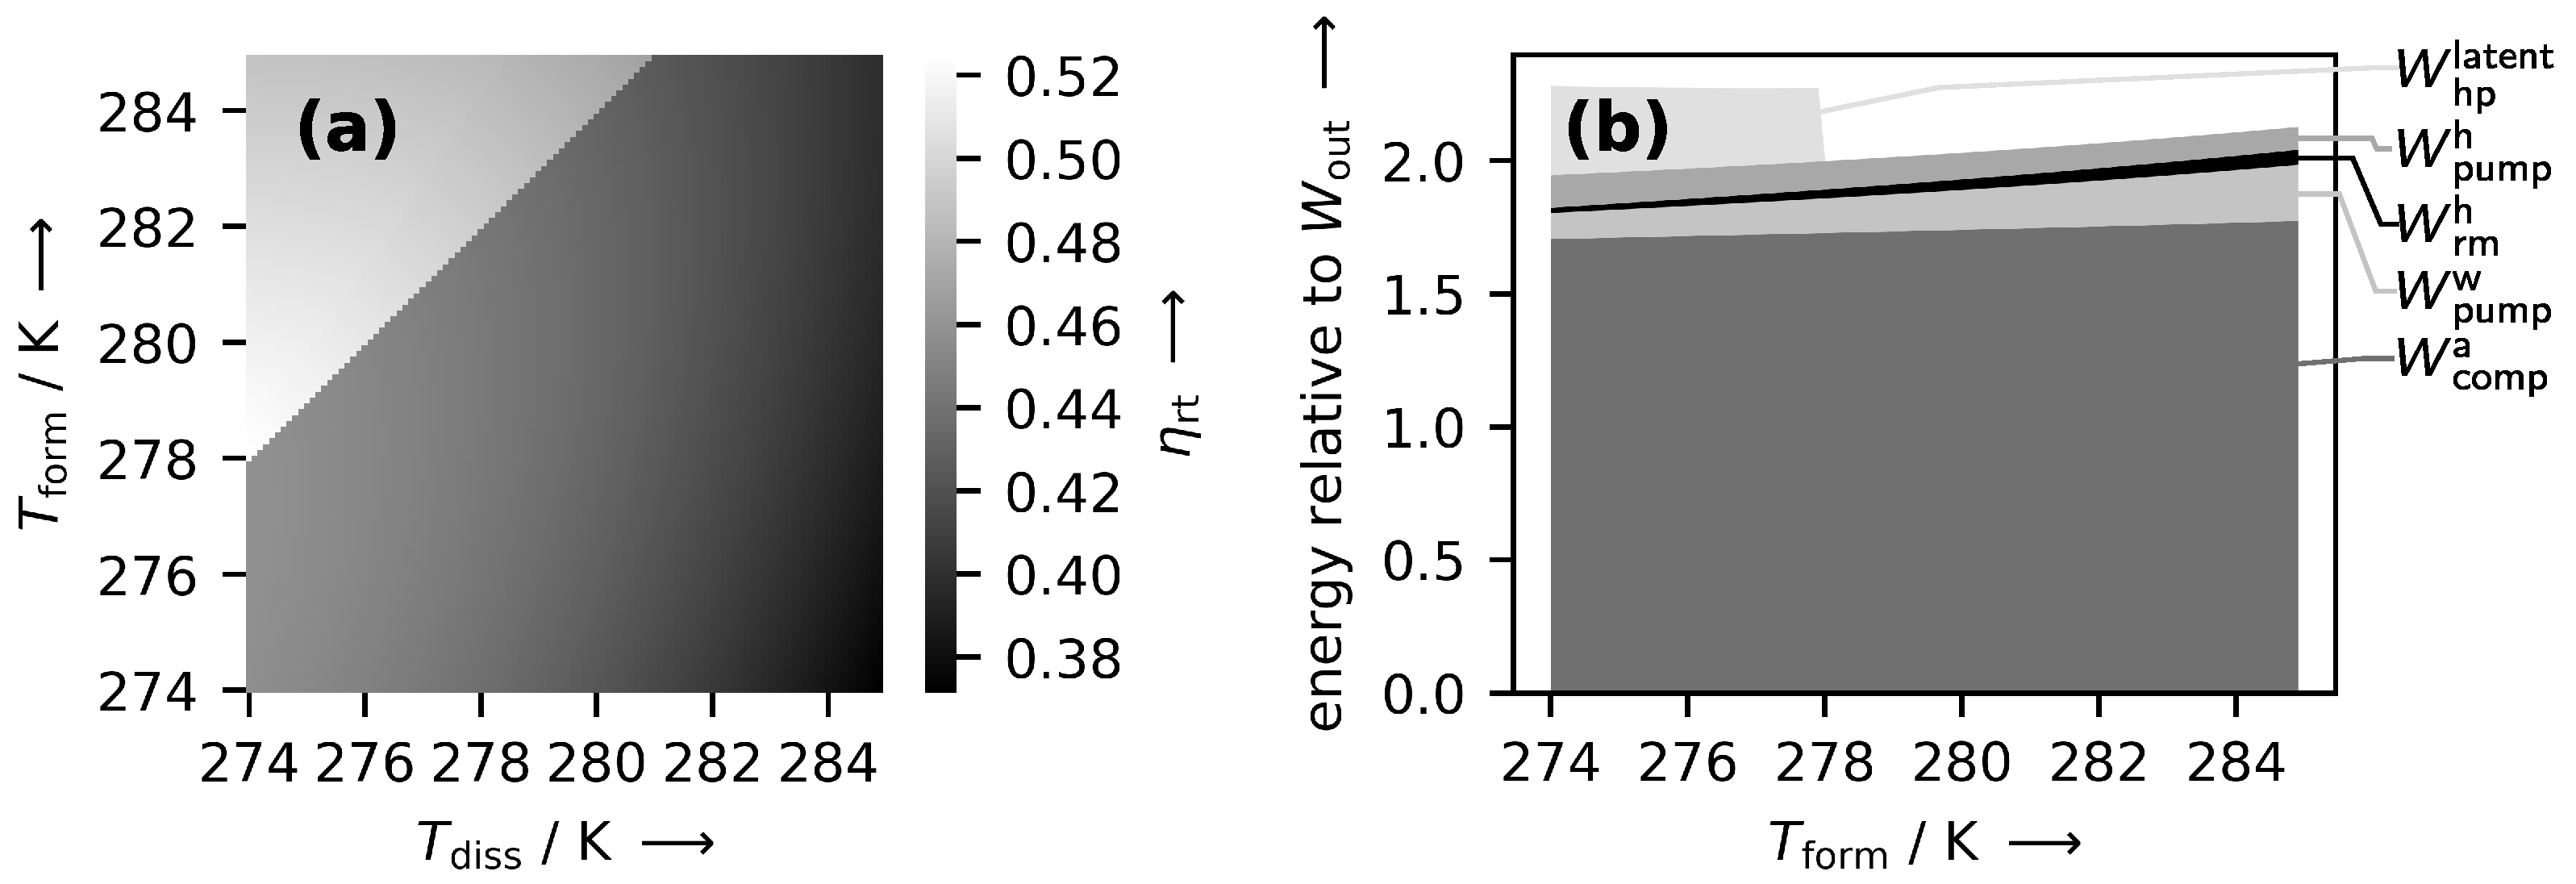
4.2. Optimum Operating Conditions
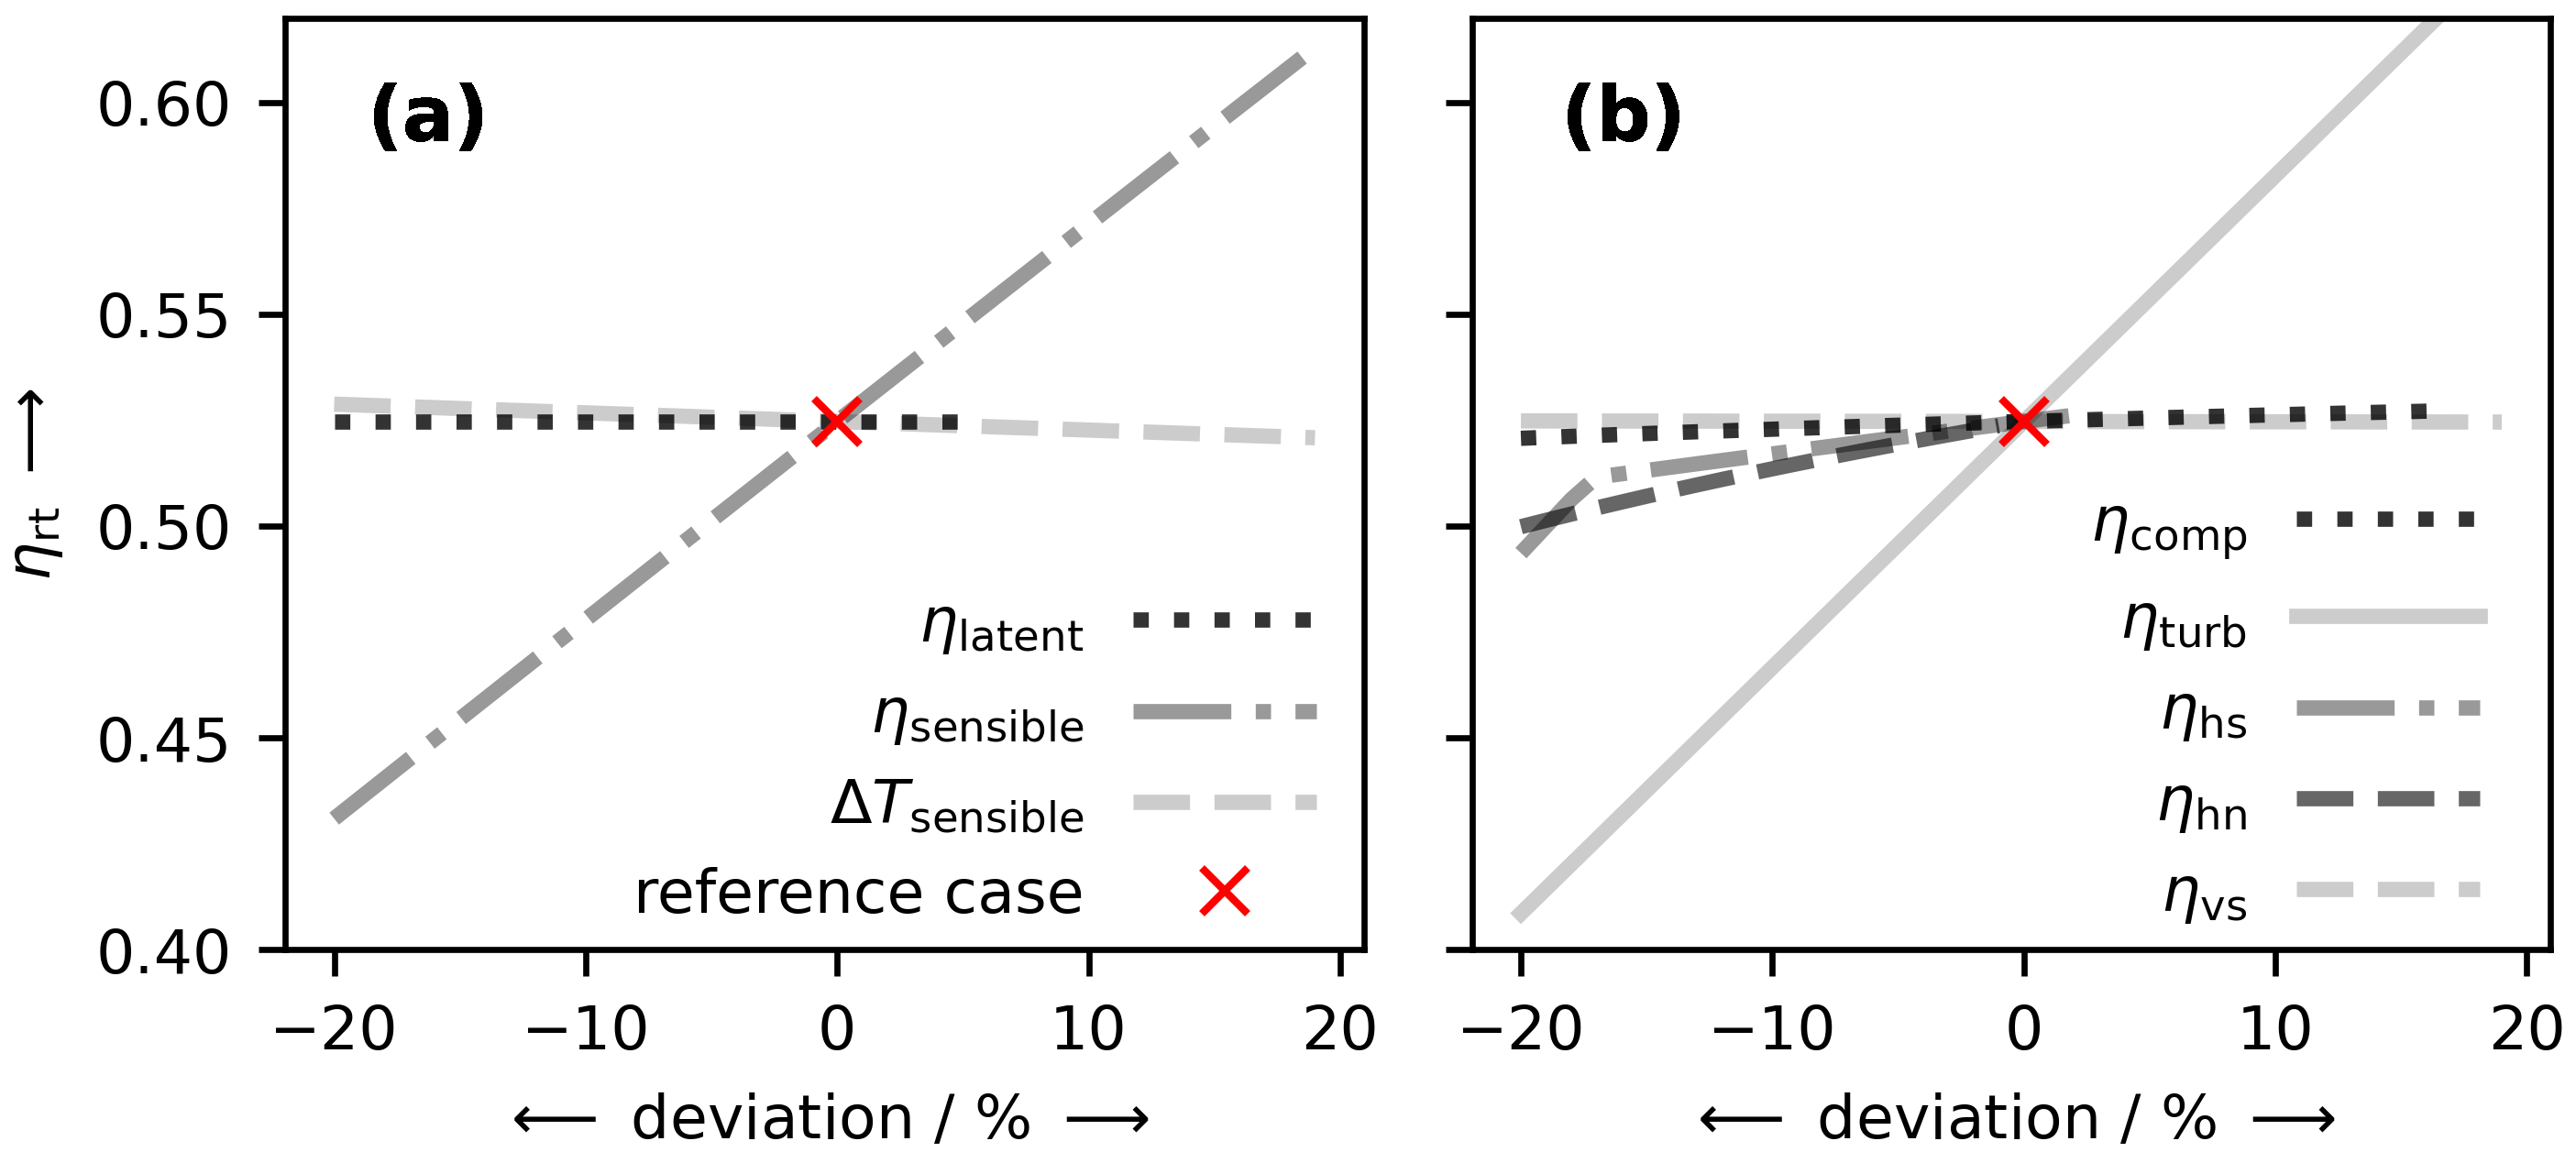
4.3. Sensitivity Analysis
5. Conclusions
Author Contributions
Funding
Institutional Review Board Statement
Informed Consent Statement
Conflicts of Interest
Abbreviations
| CAES | Compressed-air energy storage |
| CES | Cryogenic energy storage |
| CP | Cyclopentane |
| EES | Electrical energy storage |
| LAES | Liquid-air energy storage |
| PSH | Pumped-storage hydroelectricity |
| RTE | Round-trip efficiency |
| SA | Solidified air |
| SAES | Solidified-air energy storage |
| SNG | Solidified natural gas |
| SP | Self-preservation |
| STP | Standard temperature and pressure |
| TBAB | Tetrabutylammonium bromide |
| THF | Tetrahydrofuran |
References
- Zerrahn, A.; Schill, W.P. Long-run power storage requirements for high shares of renewables: Review and a new model. Renew. Sustain. Energy Rev. 2017, 79, 1518–1534. [Google Scholar] [CrossRef]
- Sterner, M.; Stadler, I. (Eds.) Handbook of Energy Storage: Demand, Technologies, Integration; Springer: Berlin/Heidelberg, Germany, 2019. [Google Scholar] [CrossRef]
- Child, M.; Kemfert, C.; Bogdanov, D.; Breyer, C. Flexible electricity generation, grid exchange and storage for the transition to a 100% renewable energy system in Europe. Renew. Energy 2019, 139, 80–101. [Google Scholar] [CrossRef]
- Schill, W.P.; Zerrahn, A. Long-run power storage requirements for high shares of renewables: Results and sensitivities. Renew. Sustain. Energy Rev. 2018, 83, 156–171. [Google Scholar] [CrossRef]
- Chen, H.; Cong, T.N.; Yang, W.; Tan, C.; Li, Y.; Ding, Y. Progress in Electrical Energy Storage System: A Critical Review. Prog. Nat. Sci. 2009, 19, 291–312. [Google Scholar] [CrossRef]
- Gür, T.M. Review of Electrical Energy Storage Technologies, Materials and Systems: Challenges and Prospects for Large-Scale Grid Storage. Energy Environ. Sci. 2018, 11, 2696–2767. [Google Scholar] [CrossRef]
- Hameer, S.; van Niekerk, J.L. A Review of Large-Scale Electrical Energy Storage. Int. J. Energy Res. 2015, 39, 1179–1195. [Google Scholar] [CrossRef]
- Rehman, S.; Al-Hadhrami, L.M.; Alam, M.M. Pumped Hydro Energy Storage System: A Technological Review. Renew. Sustain. Energy Rev. 2015, 44, 586–598. [Google Scholar] [CrossRef]
- Kucukali, S. Finding the Most Suitable Existing Hydropower Reservoirs for the Development of Pumped-Storage Schemes: An Integrated Approach. Renew. Sustain. Energy Rev. 2014, 37, 502–508. [Google Scholar] [CrossRef]
- Lu, B.; Stocks, M.; Blakers, A.; Anderson, K. Geographic Information System Algorithms to Locate Prospective Sites for Pumped Hydro Energy Storage. Appl. Energy 2018, 222, 300–312. [Google Scholar] [CrossRef]
- Budt, M.; Wolf, D.; Span, R.; Yan, J. A Review on Compressed Air Energy Storage: Basic Principles, Past Milestones and Recent Developments. Appl. Energy 2016, 170, 250–268. [Google Scholar] [CrossRef]
- Chen, L.; Zheng, T.; Mei, S.; Xue, X.; Liu, B.; Lu, Q. Review and Prospect of Compressed Air Energy Storage System. J. Mod. Power Syst. Clean Energy 2016, 4, 529–541. [Google Scholar] [CrossRef] [Green Version]
- Morgan, R.; Nelmes, S.; Gibson, E.; Brett, G. Liquid Air Energy Storage–Analysis and First Results from a Pilot Scale Demonstration Plant. Appl. Energy 2015, 137, 845–853. [Google Scholar] [CrossRef]
- Ameel, B.; T’Joen, C.; De Kerpel, K.; De Jaeger, P.; Huisseune, H.; Van Belleghem, M.; De Paepe, M. Thermodynamic Analysis of Energy Storage with a Liquid Air Rankine Cycle. Appl. Therm. Eng. 2013, 52, 130–140. [Google Scholar] [CrossRef]
- Guizzi, G.L.; Manno, M.; Tolomei, L.I.; Vitali, R.I. Thermodynamic Analysis of a Liquid Air Energy Storage System. Energy 2015, 93, 1639–1647. [Google Scholar] [CrossRef] [Green Version]
- Sciacovelli, A.; Vecchi, A.; Ding, Y. Liquid Air Energy Storage (LAES) with Packed Bed Cold Thermal Storage – From Component to System Level Performance through Dynamic Modelling. Appl. Energy 2017, 190, 84–98. [Google Scholar] [CrossRef] [Green Version]
- Borri, E.; Tafone, A.; Romagnoli, A.; Comodi, G. A Review on Liquid Air Energy Storage: History, State of the Art and Recent Developments. Renew. Sustain. Energy Rev. 2021, 137, 110572. [Google Scholar] [CrossRef]
- Koh, C.A.; Sloan, E.D.; Sum, A.K.; Wu, D.T. Fundamentals and Applications of Gas Hydrates. Annu. Rev. Chem. Biomol. Eng. 2011, 2, 237–257. [Google Scholar] [CrossRef] [PubMed]
- Miller, S.L. Clathrate Hydrates of Air in Antarctic Ice. Science 1969, 165, 489–490. [Google Scholar] [CrossRef]
- Pauer, F.; Kipfstuhl, S.; Kuhs, W.F.; Shoji, H. Air Clathrate Crystals from the GRIP Deep Ice Core, Greenland: A Number-, Size- and Shape-Distribution Study. J. Glaciol. 1999, 45, 22–30. [Google Scholar] [CrossRef]
- Shoji, H.; Langway, C.C. Air Hydrate Inclusions in Fresh Ice Core. Nature 1982, 298, 548–550. [Google Scholar] [CrossRef]
- Veluswamy, H.P.; Kumar, S.; Kumar, R.; Rangsunvigit, P.; Linga, P. Enhanced Clathrate Hydrate Formation Kinetics at near Ambient Temperatures and Moderate Pressures: Application to Natural Gas Storage. Fuel 2016, 182, 907–919. [Google Scholar] [CrossRef]
- Veluswamy, H.P.; Kumar, A.; Kumar, R.; Linga, P. An Innovative Approach to Enhance Methane Hydrate Formation Kinetics with Leucine for Energy Storage Application. Appl. Energy 2017, 188, 190–199. [Google Scholar] [CrossRef]
- Veluswamy, H.P.; Kumar, A.; Seo, Y.; Lee, J.D.; Linga, P. A Review of Solidified Natural Gas (SNG) Technology for Gas Storage via Clathrate Hydrates. Appl. Energy 2018, 216, 262–285. [Google Scholar] [CrossRef]
- Mohammadi, A.H.; Tohidi, B.; Burgass, R.W. Equilibrium Data and Thermodynamic Modeling of Nitrogen, Oxygen, and Air Clathrate Hydrates. J. Chem. Eng. Data 2003, 48, 612–616. [Google Scholar] [CrossRef]
- Yang, H.; Fan, S.; Lang, X.; Wang, Y.; Sun, X. Hydrate Dissociation Conditions for Mixtures of Air + Tetrahydrofuran, Air + Cyclopentane, and Air + Tetra- N -Butyl Ammonium Bromide. J. Chem. Eng. Data 2012, 57, 1226–1230. [Google Scholar] [CrossRef]
- Lipenkov, V.Y.; Istomin, V. On the stability of air clathrate-hydrate crystals in subglacial Lake Vostok, Antarctica. Mater. Glyatsiol. Issled 2001, 91, 2001. [Google Scholar]
- Mohammadi, A.H.; Richon, D. Ice-Clathrate Hydrate-Gas Phase Equilibria for Air, Oxygen, Nitrogen, Carbon Monoxide, Methane, or Ethane + Water System. Ind. Eng. Chem. Res. 2010, 49, 3976–3979. [Google Scholar] [CrossRef]
- Sloan, E.D.; Koh, C.A. Clathrate Hydrates of Natural Gases, 3rd ed.; CRC Press: Boca Raton, FL, USA, 2007. [Google Scholar]
- Hobbs, P.V. Ice Physics; Oxford Classic Texts in the Physical Sciences; Oxford University Press: New York, NY, USA, 2010. [Google Scholar]
- Saito, A. Recent Advances in Research on Cold Thermal Energy Storage. Int. J. Refrig. 2002, 25, 177–189. [Google Scholar] [CrossRef]
- Wang, X.; Zhang, F.; Lipiński, W. Carbon Dioxide Hydrates for Cold Thermal Energy Storage: A Review. Sol. Energy 2020, 211, 11–30. [Google Scholar] [CrossRef]
- Yakushev, V.S.; Istomin, V. Gas Hydrates Self-Preservation Effect. In Physics and Chemistry of Ice; Maeno, N., Hondoh, T., Eds.; Hokkaido Univ. Press.: Sapporo, Japan, 1992; pp. 136–140. [Google Scholar]
- Stern, L.A.; Circone, S.; Kirby, S.H.; Durham, W.B. Anomalous Preservation of Pure Methane Hydrate at 1 Atm. J. Phys. Chem. B 2001, 105, 1756–1762. [Google Scholar] [CrossRef]
- Falenty, A.; Kuhs, W.F.; Glockzin, M.; Rehder, G. ‘Self-Preservation’ of CH4 Hydrates for Gas Transport Technology: Pressure–Temperature Dependence and Ice Microstructures. Energy Fuels 2014, 28, 6275–6283. [Google Scholar] [CrossRef]
- Falenty, A.; Kuhs, W.F. ‘Self-Preservation’ of CO2 Gas Hydrates—Surface Microstructure and Ice Perfection. J. Phys. Chem. B 2009, 113, 15975–15988. [Google Scholar] [CrossRef] [PubMed]
- Circone, S.; Stern, L.A.; Kirby, S.H.; Durham, W.B.; Chakoumakos, B.C.; Rawn, C.J.; Rondinone, A.J.; Ishii, Y. CO2 Hydrate: Synthesis, Composition, Structure, Dissociation Behavior, and a Comparison to Structure I CH4 Hydrate. J. Phys. Chem. B 2003, 107, 5529–5539. [Google Scholar] [CrossRef]
- Takeya, S.; Ripmeester, J.A. Dissociation Behavior of Clathrate Hydrates to Ice and Dependence on Guest Molecules. Angew. Chem. Int. Ed. 2008, 120, 1296–1299. [Google Scholar] [CrossRef]
- Hallbrucker, A.; Mayer, E. Unexpectedly Stable Nitrogen, Oxygen, Carbon Monoxide and Argon Clathrate Hydrates from Vapour-Deposited Amorphous Solid Water: An X-Ray and Two-Step Differential Scanning Calorimetry Study. J. Chem. Soc. Faraday Trans. 1990, 86, 3785–3792. [Google Scholar] [CrossRef]
- Mayer, E.; Hallbrucker, A. Unexpectedly Stable Nitrogen and Oxygen Clathrate Hydrates from Vapour Deposited Amorphous Solid Water. J. Chem. Soc. Chem. Commun. 1989, 12, 749–751. [Google Scholar] [CrossRef]
- Zhang, G.; Rogers, R.E. Ultra-Stability of Gas Hydrates at 1atm and 268.2K. Chem. Eng. Sci. 2008, 63, 2066–2074. [Google Scholar] [CrossRef]
- Rehder, G.; Eckl, R.; Elfgen, M.; Falenty, A.; Hamann, R.; Kähler, N.; Kuhs, W.F.; Osterkamp, H.; Windmeier, C. Methane Hydrate Pellet Transport Using the Self-Preservation Effect: A Techno-Economic Analysis. Energies 2012, 5, 2499–2523. [Google Scholar] [CrossRef]
- Melnikov, V.P.; Podenko, L.S.; Nesterov, A.N.; Drachuk, A.O.; Molokitina, N.S.; Reshetnikov, A.M. Self-Preservation of Methane Hydrates Produced in ‘dry Water’. Dokl. Chem. 2016, 466, 53–56. [Google Scholar] [CrossRef]
- Khan, M.N.; Warrier, P.; Peters, C.J.; Koh, C.A. Advancements in Hydrate Phase Equilibria and Modeling of Gas Hydrates Systems. Fluid Phase Equilibria 2018, 463, 48–61. [Google Scholar] [CrossRef]
- Anderson, G.K. Enthalpy of Dissociation and Hydration Number of Carbon Dioxide Hydrate from the Clapeyron Equation. J. Chem. Thermodyn. 2003, 35, 1171–1183. [Google Scholar] [CrossRef]
- Anderson, G.K. Enthalpy of Dissociation and Hydration Number of Methane Hydrate from the Clapeyron Equation. J. Chem. Thermodyn. 2004, 36, 1119–1127. [Google Scholar] [CrossRef]
- Hester, K.C.; Huo, Z.; Ballard, A.L.; Koh, C.A.; Miller, K.T.; Sloan, E.D. Thermal Expansivity for sI and sII Clathrate Hydrates. J. Phys. Chem. B 2007, 111, 8830–8835. [Google Scholar] [CrossRef] [PubMed]
- Kuhs, W.; Chazallon, B.; Radaelli, P.; Pauer, F. Cage Occupancy and Compressibility of Deuterated N2-Clathrate Hydrate by Neutron Diffraction. J. Incl. Phenom. Mol. Recognit. Chem. 1997, 29, 65–77. [Google Scholar] [CrossRef]
- Takeya, S.; Honda, K.; Yoneyama, A.; Hirai, Y.; Okuyama, i.; Hondoh, T.; Hyodo, K.; Takeda, T. Observation of Low-Temperature Object by Phase-Contrast x-Ray Imaging: Nondestructive Imaging of Air Clathrate Hydrates at 233 K. Rev. Sci. Instrum. 2006, 77, 053705. [Google Scholar] [CrossRef] [Green Version]
- Bell, I.H.; Wronski, J.; Quoilin, S.; Lemort, V. Pure and Pseudo-pure Fluid Thermophysical Property Evaluation and the Open-Source Thermophysical Property Library CoolProp. Ind. Eng. Chem. Res. 2014, 53, 2498–2508. [Google Scholar] [CrossRef] [PubMed] [Green Version]


| Parameter | Value | Parameter | Value | Parameter | Value |
|---|---|---|---|---|---|
| 298 | 278 | 274 | |||
| 273 | 20 | 2 | |||
| 0.1 MPa | 25.3 MPa | 16.6 MPa | |||
| 0.1 MPa | |||||
| 0.85 | 0.90 | 0.85 | |||
| 0.975 | 1.0 | 0.2 | |||
| 0.80 | 0.95 | 7 | |||
| 6 | 6 | 8 | |||
| 154 / | // |
| State | 1 | 2 | 3.1 | 3.2 | 4 | 5 | 6 | 7 | 8 | 9 | 10 |
|---|---|---|---|---|---|---|---|---|---|---|---|
| / | 298 | 1474 | 314 | 278 | - | - | - | - | 274 | 1243 | 468 |
| /MPa | 0.1 | 25.3 | 25.3 | 25.3 | - | - | - | - | 16.6 | 16.6 | 0.1 |
| / | 298 | 278 | 278 | 278 | - | - | - | - | 274 | 278 | 278 |
| /MPa | 0.1 | 0.1 | 25.3 | 25.3 | - | - | - | - | 16.6 | 0.1 | 0.1 |
| / | - | - | - | - | 278 | 261 | 273 | 273 | - | - | - |
| /MPa | - | - | - | - | 25.3 | 25.3 | 0.1 | 16.6 | - | - | - |
| Indicator | SAES | LAES [15] |
|---|---|---|
| Round trip efficiency | 52 % | 54 % |
| Energy density | kWh | kWh |
| Air-based energy density | 47 kWh | 104 kWh |
| Total energy density | 19 kWh | - |
Publisher’s Note: MDPI stays neutral with regard to jurisdictional claims in published maps and institutional affiliations. |
© 2022 by the authors. Licensee MDPI, Basel, Switzerland. This article is an open access article distributed under the terms and conditions of the Creative Commons Attribution (CC BY) license (https://creativecommons.org/licenses/by/4.0/).
Share and Cite
Hiller, S.; Hartmann, C.; Hebenstreit, B.; Arzbacher, S. Solidified-Air Energy Storage: Conceptualization and Thermodynamic Analysis. Energies 2022, 15, 2159. https://doi.org/10.3390/en15062159
Hiller S, Hartmann C, Hebenstreit B, Arzbacher S. Solidified-Air Energy Storage: Conceptualization and Thermodynamic Analysis. Energies. 2022; 15(6):2159. https://doi.org/10.3390/en15062159
Chicago/Turabian StyleHiller, Sandro, Christian Hartmann, Babette Hebenstreit, and Stefan Arzbacher. 2022. "Solidified-Air Energy Storage: Conceptualization and Thermodynamic Analysis" Energies 15, no. 6: 2159. https://doi.org/10.3390/en15062159
APA StyleHiller, S., Hartmann, C., Hebenstreit, B., & Arzbacher, S. (2022). Solidified-Air Energy Storage: Conceptualization and Thermodynamic Analysis. Energies, 15(6), 2159. https://doi.org/10.3390/en15062159