
Analysis of a Wind-Driven Air Compression System Utilising Underwater Compressed Air Energy Storage


Abstract
:1. Introduction
2. Constituent Technologies
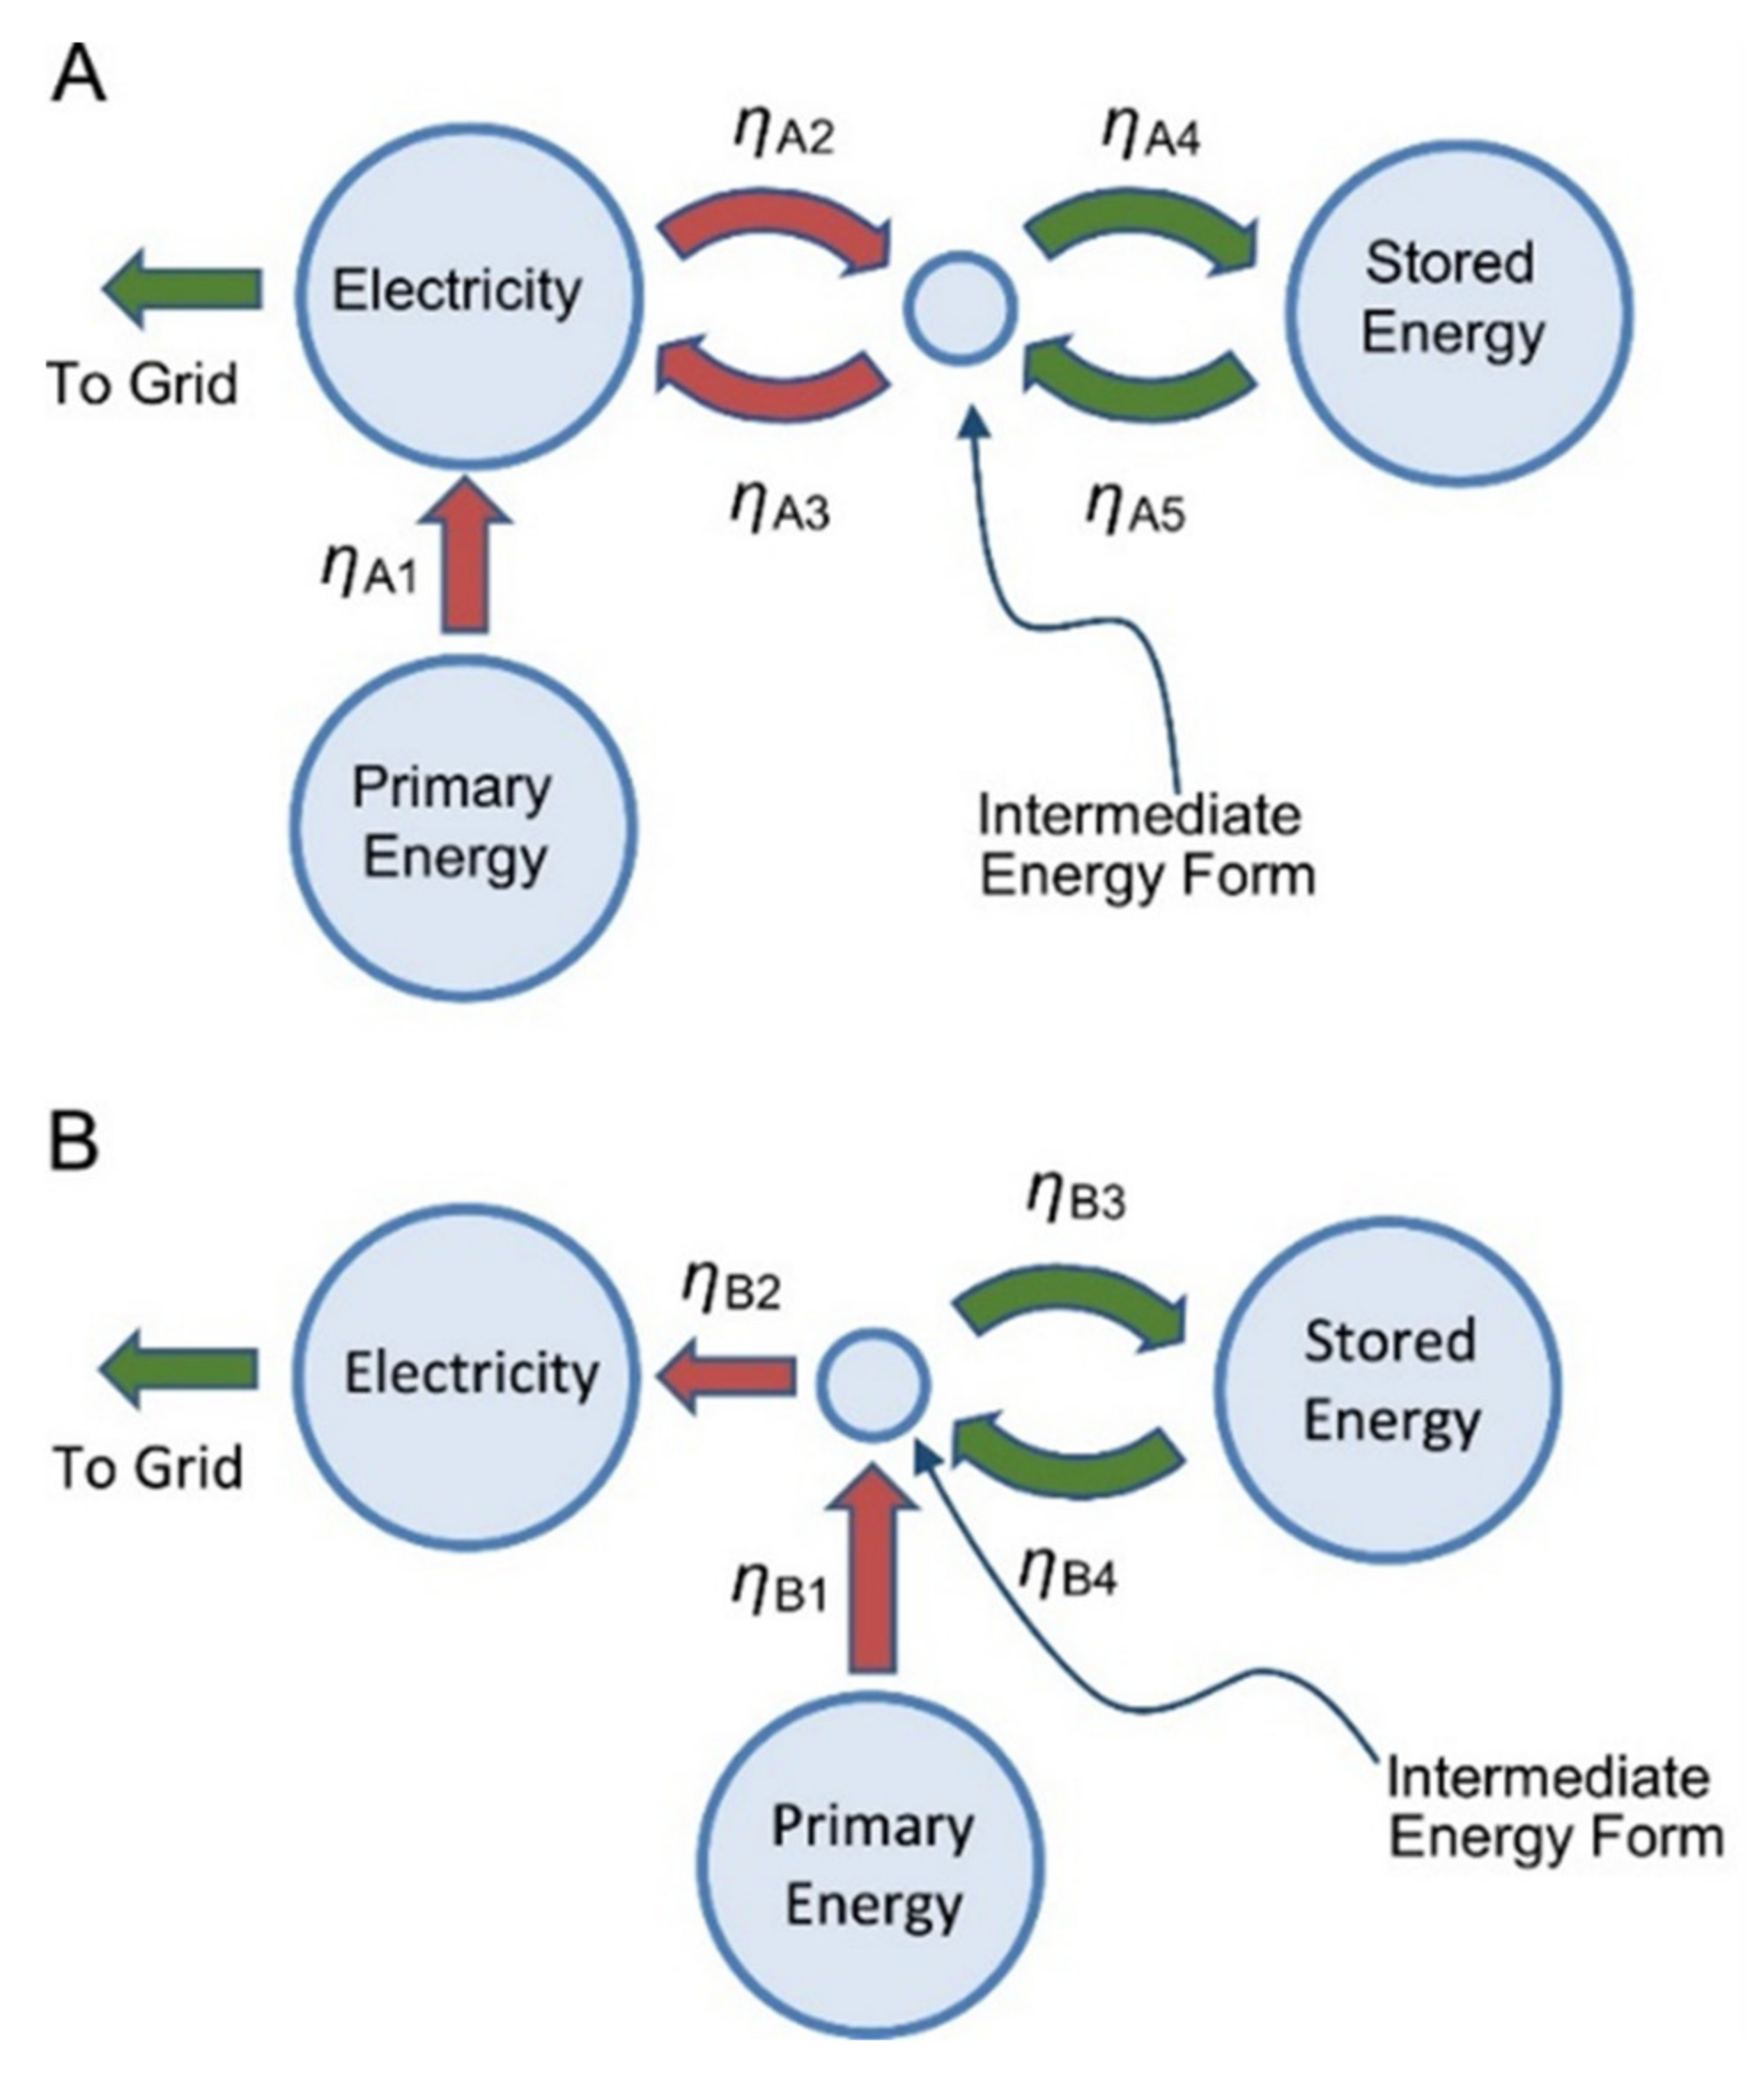
2.1. Isothermal and Adiabatic Compressed Air Energy Storage
2.2. Wind-Driven Energy Storage
2.3. Direct Drive Air Compression and the Problem of Intake Swept Volumes
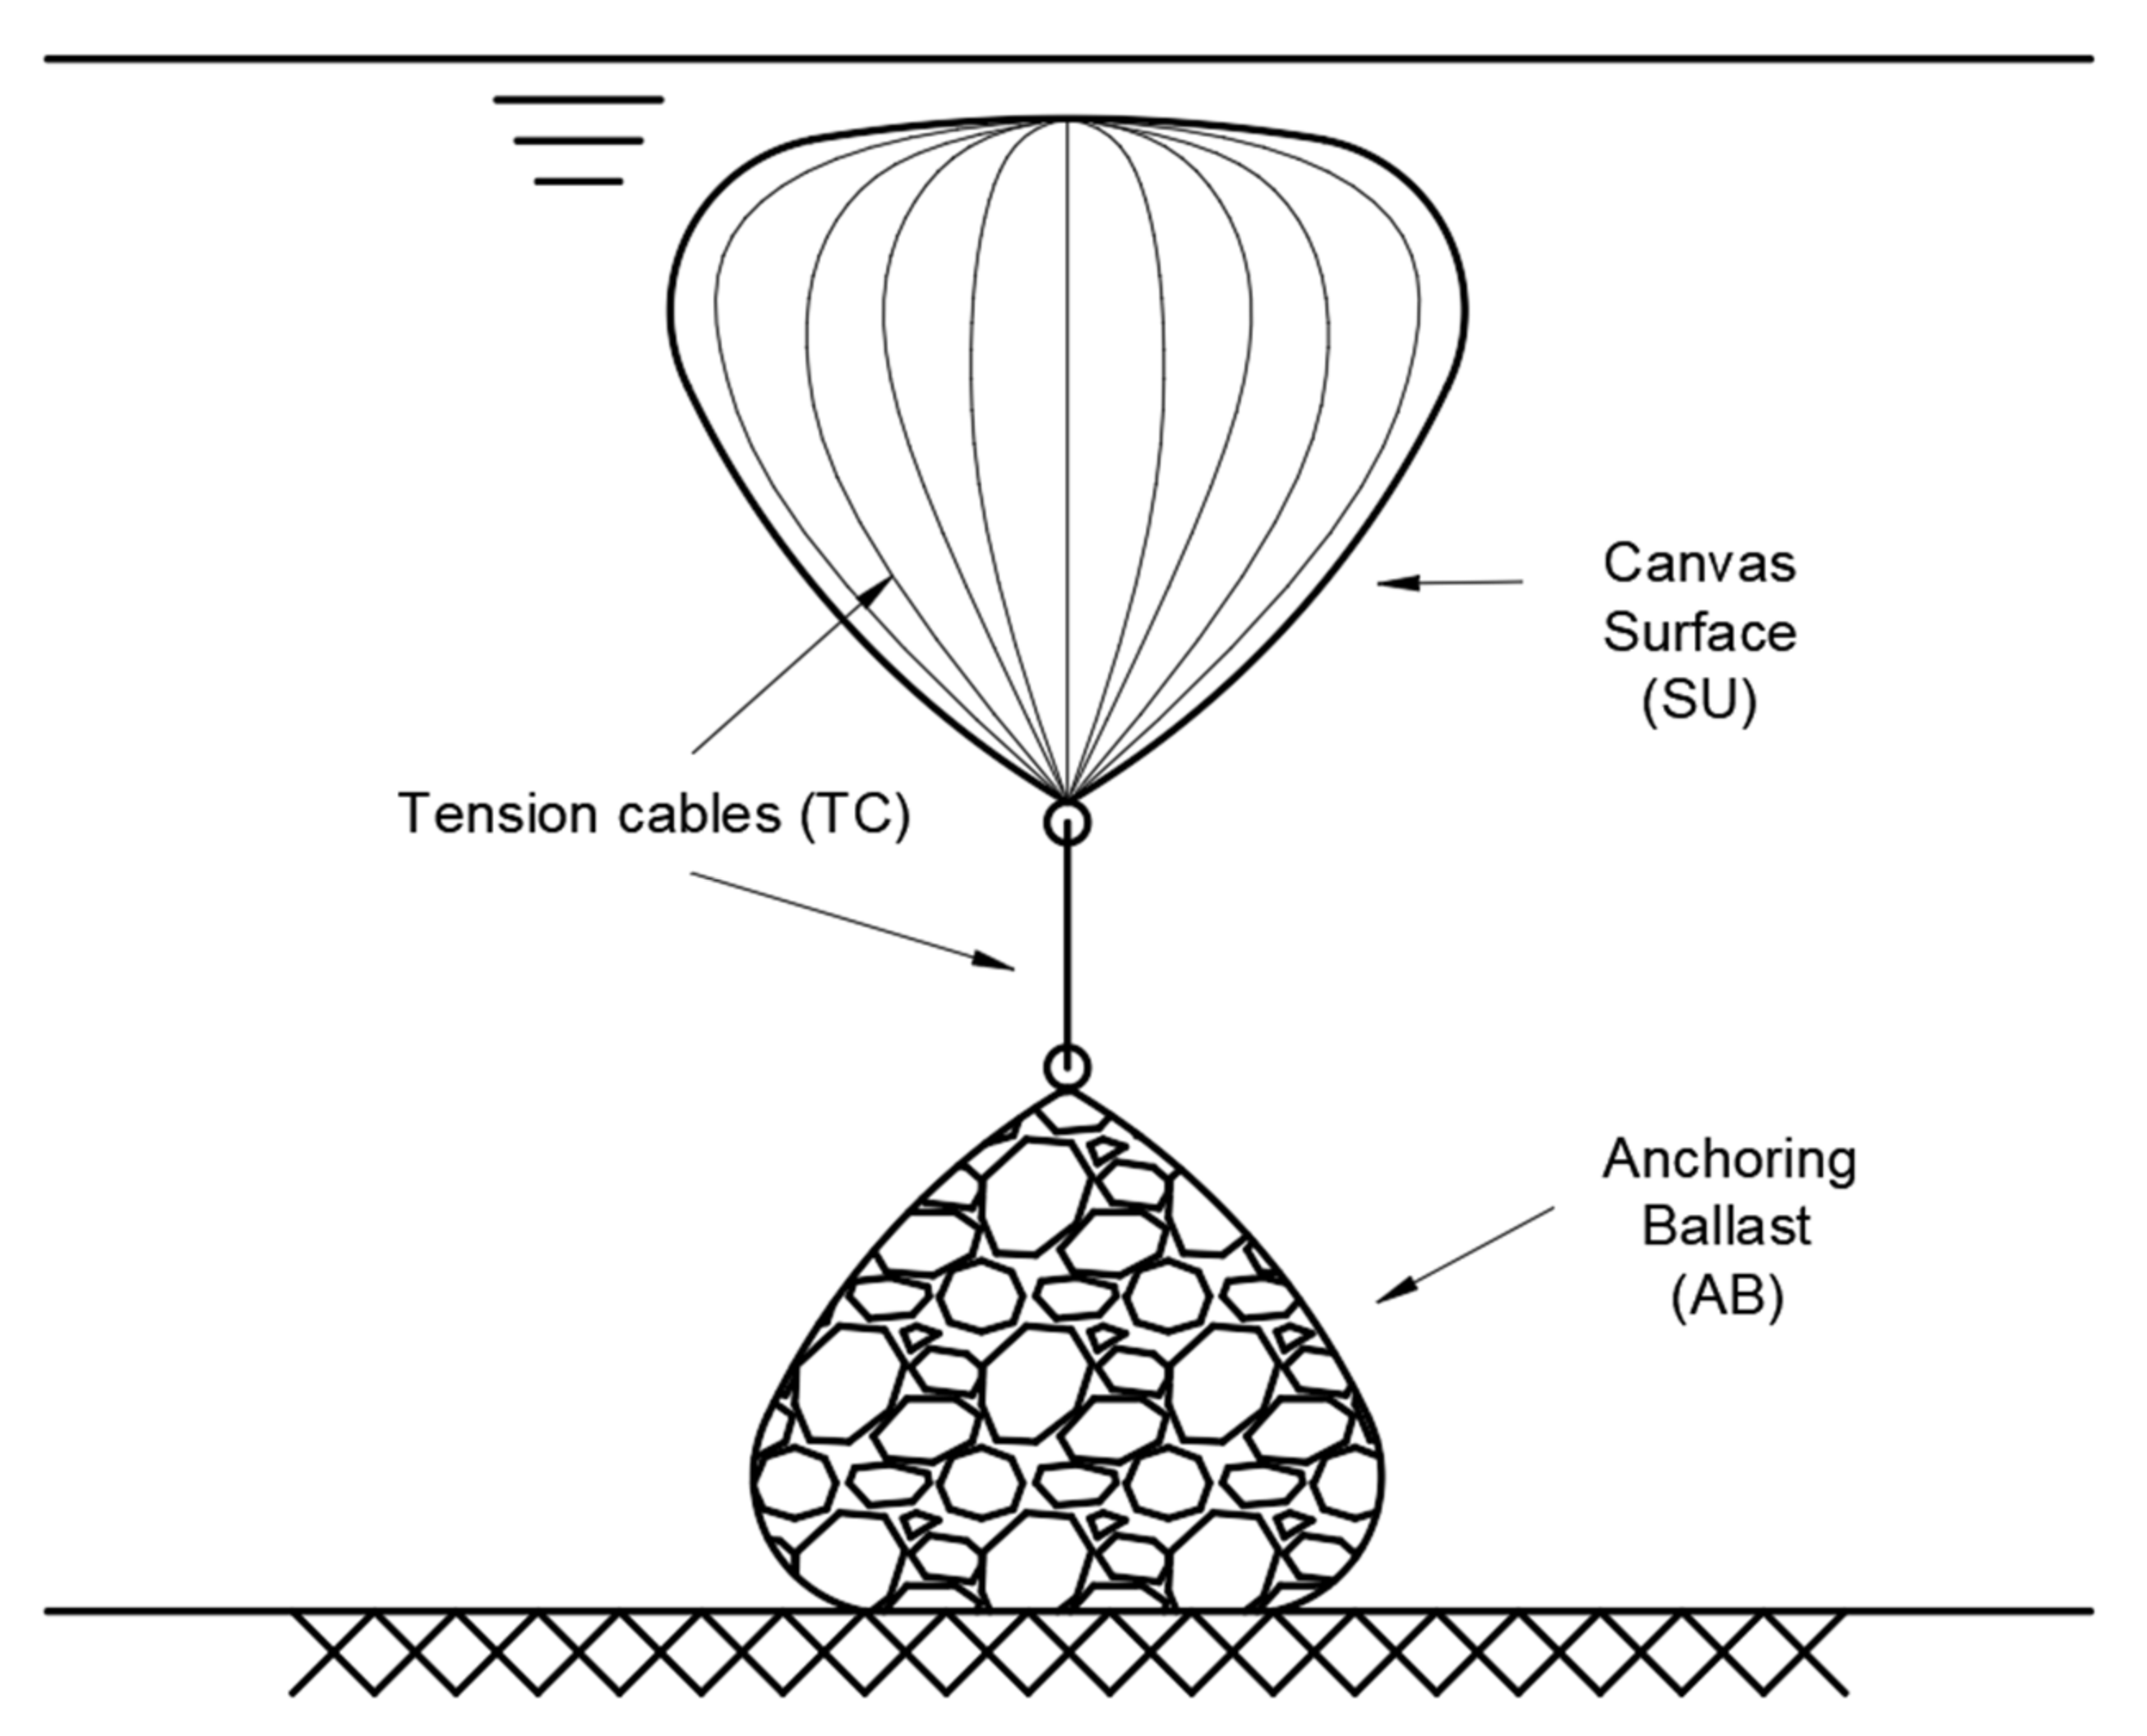
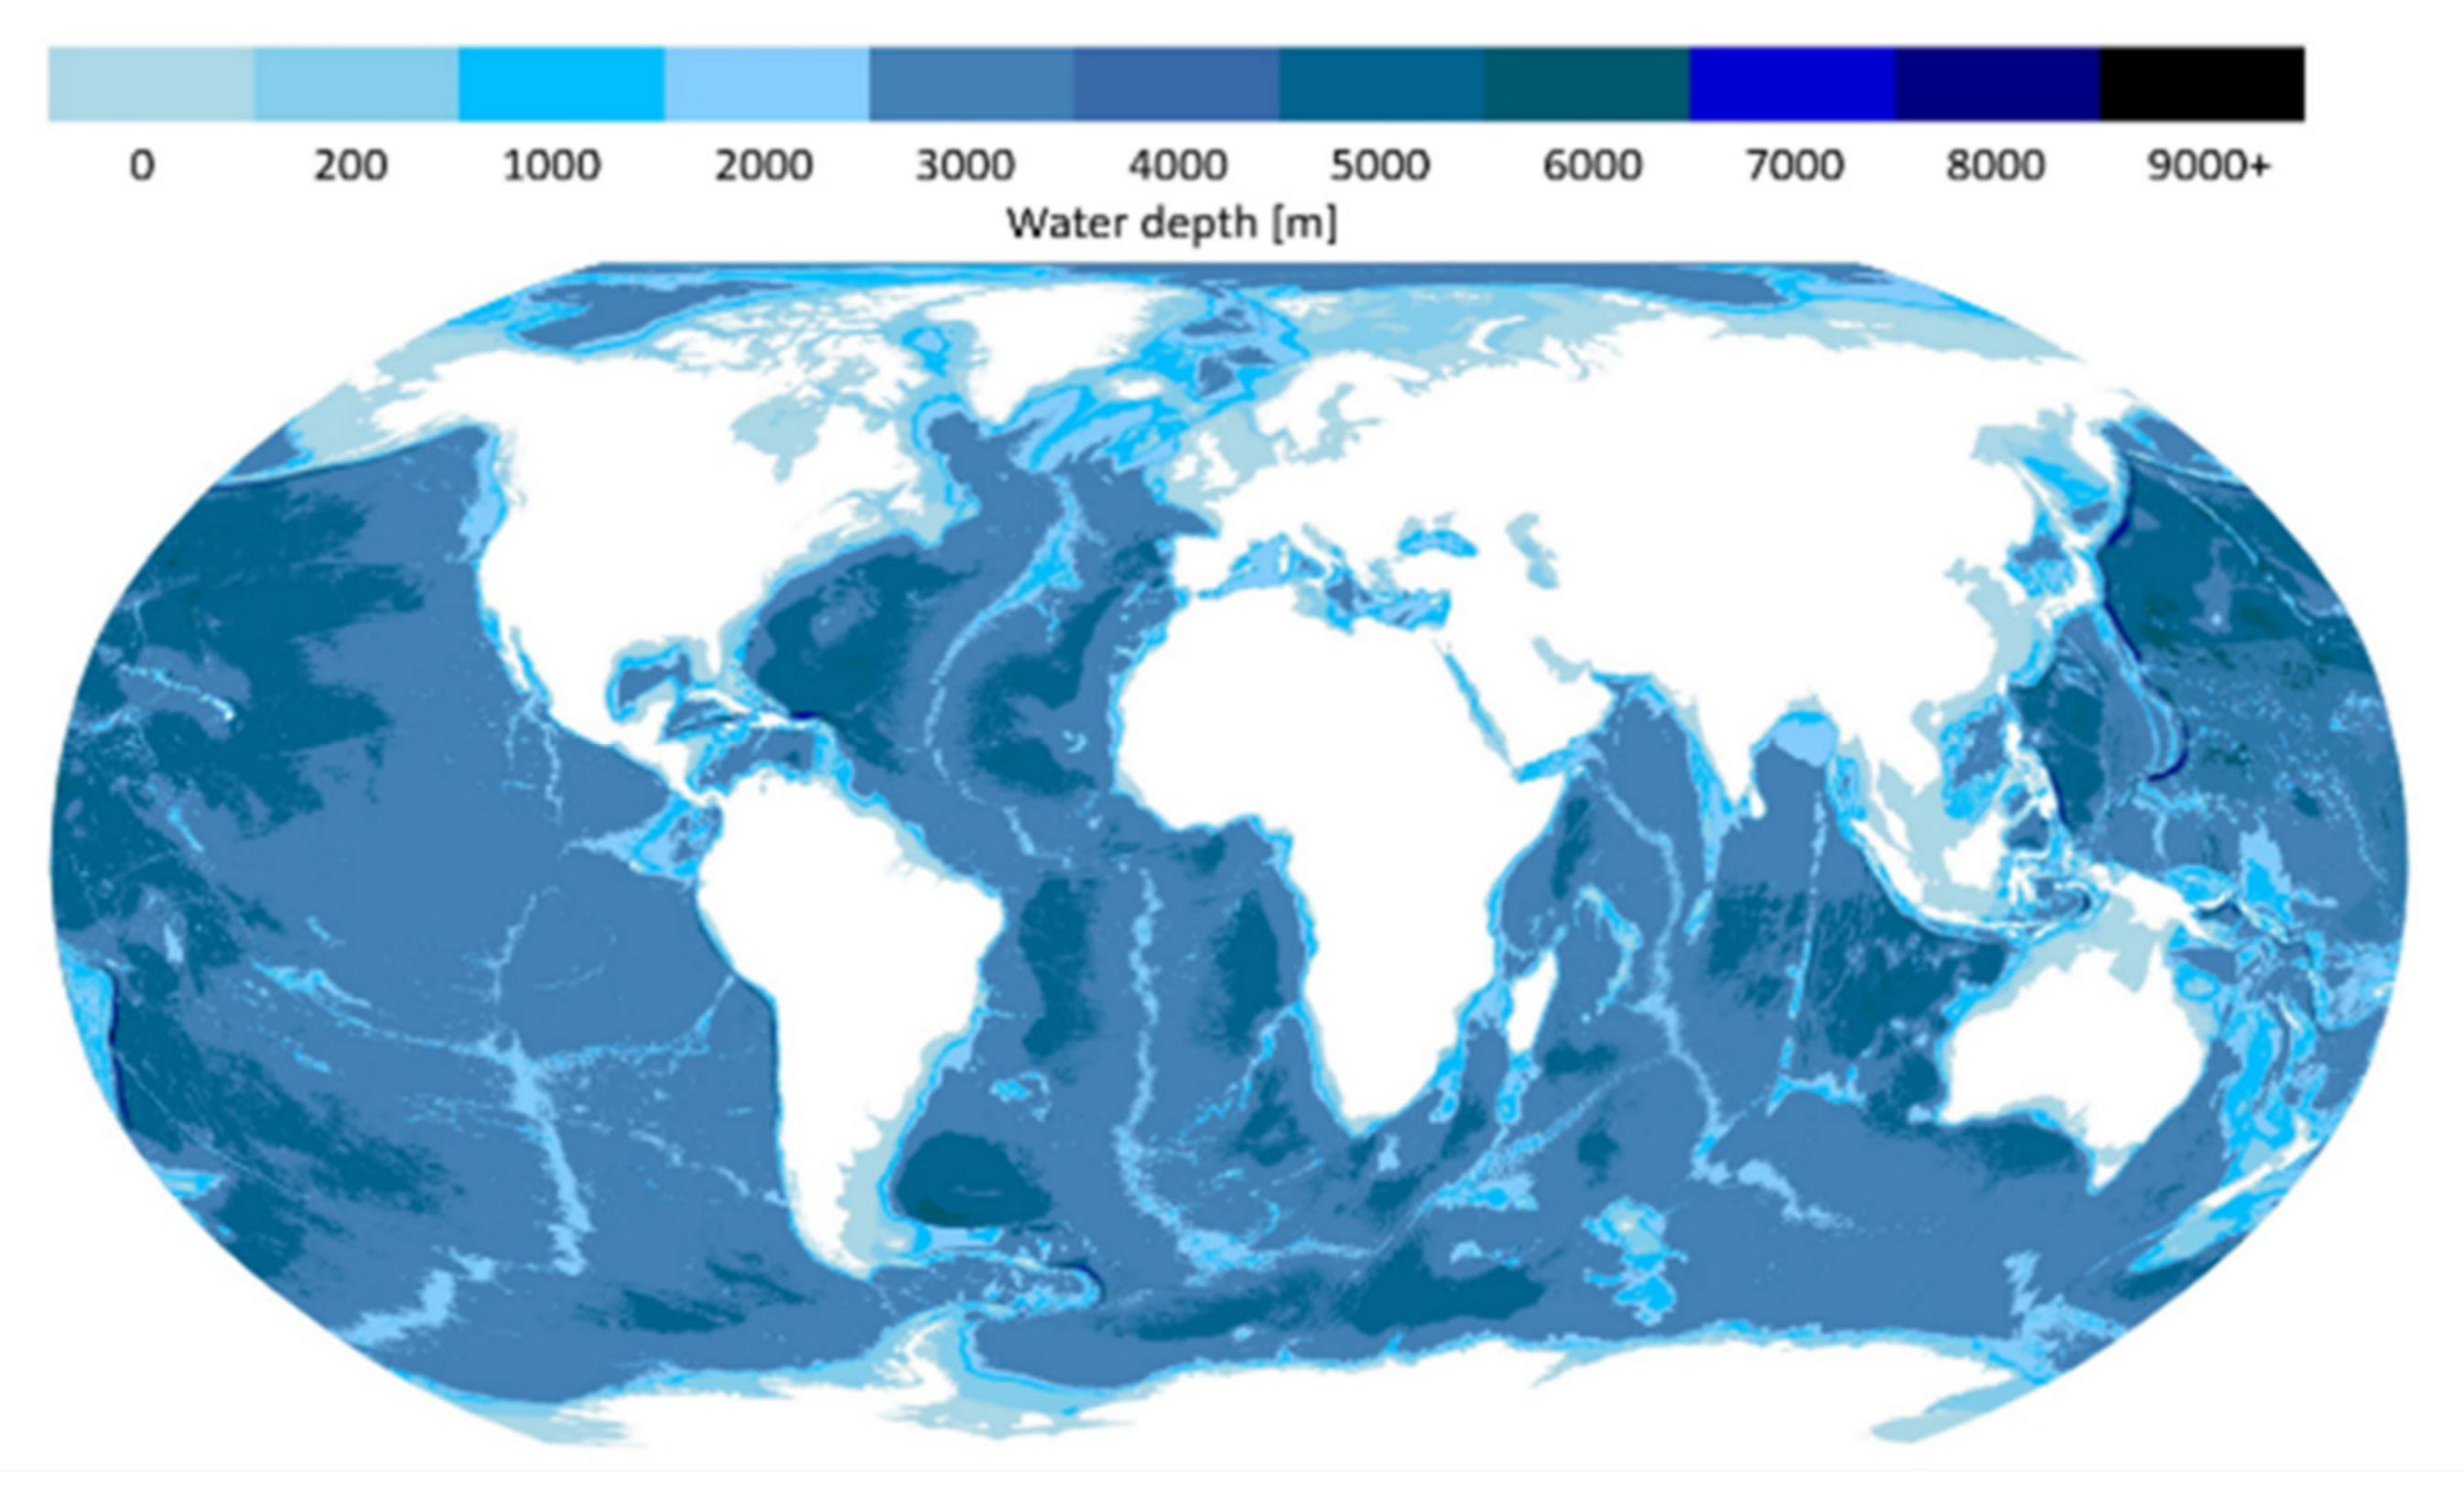
2.4. Underwater Compressed Air Energy Storage
3. System Overview
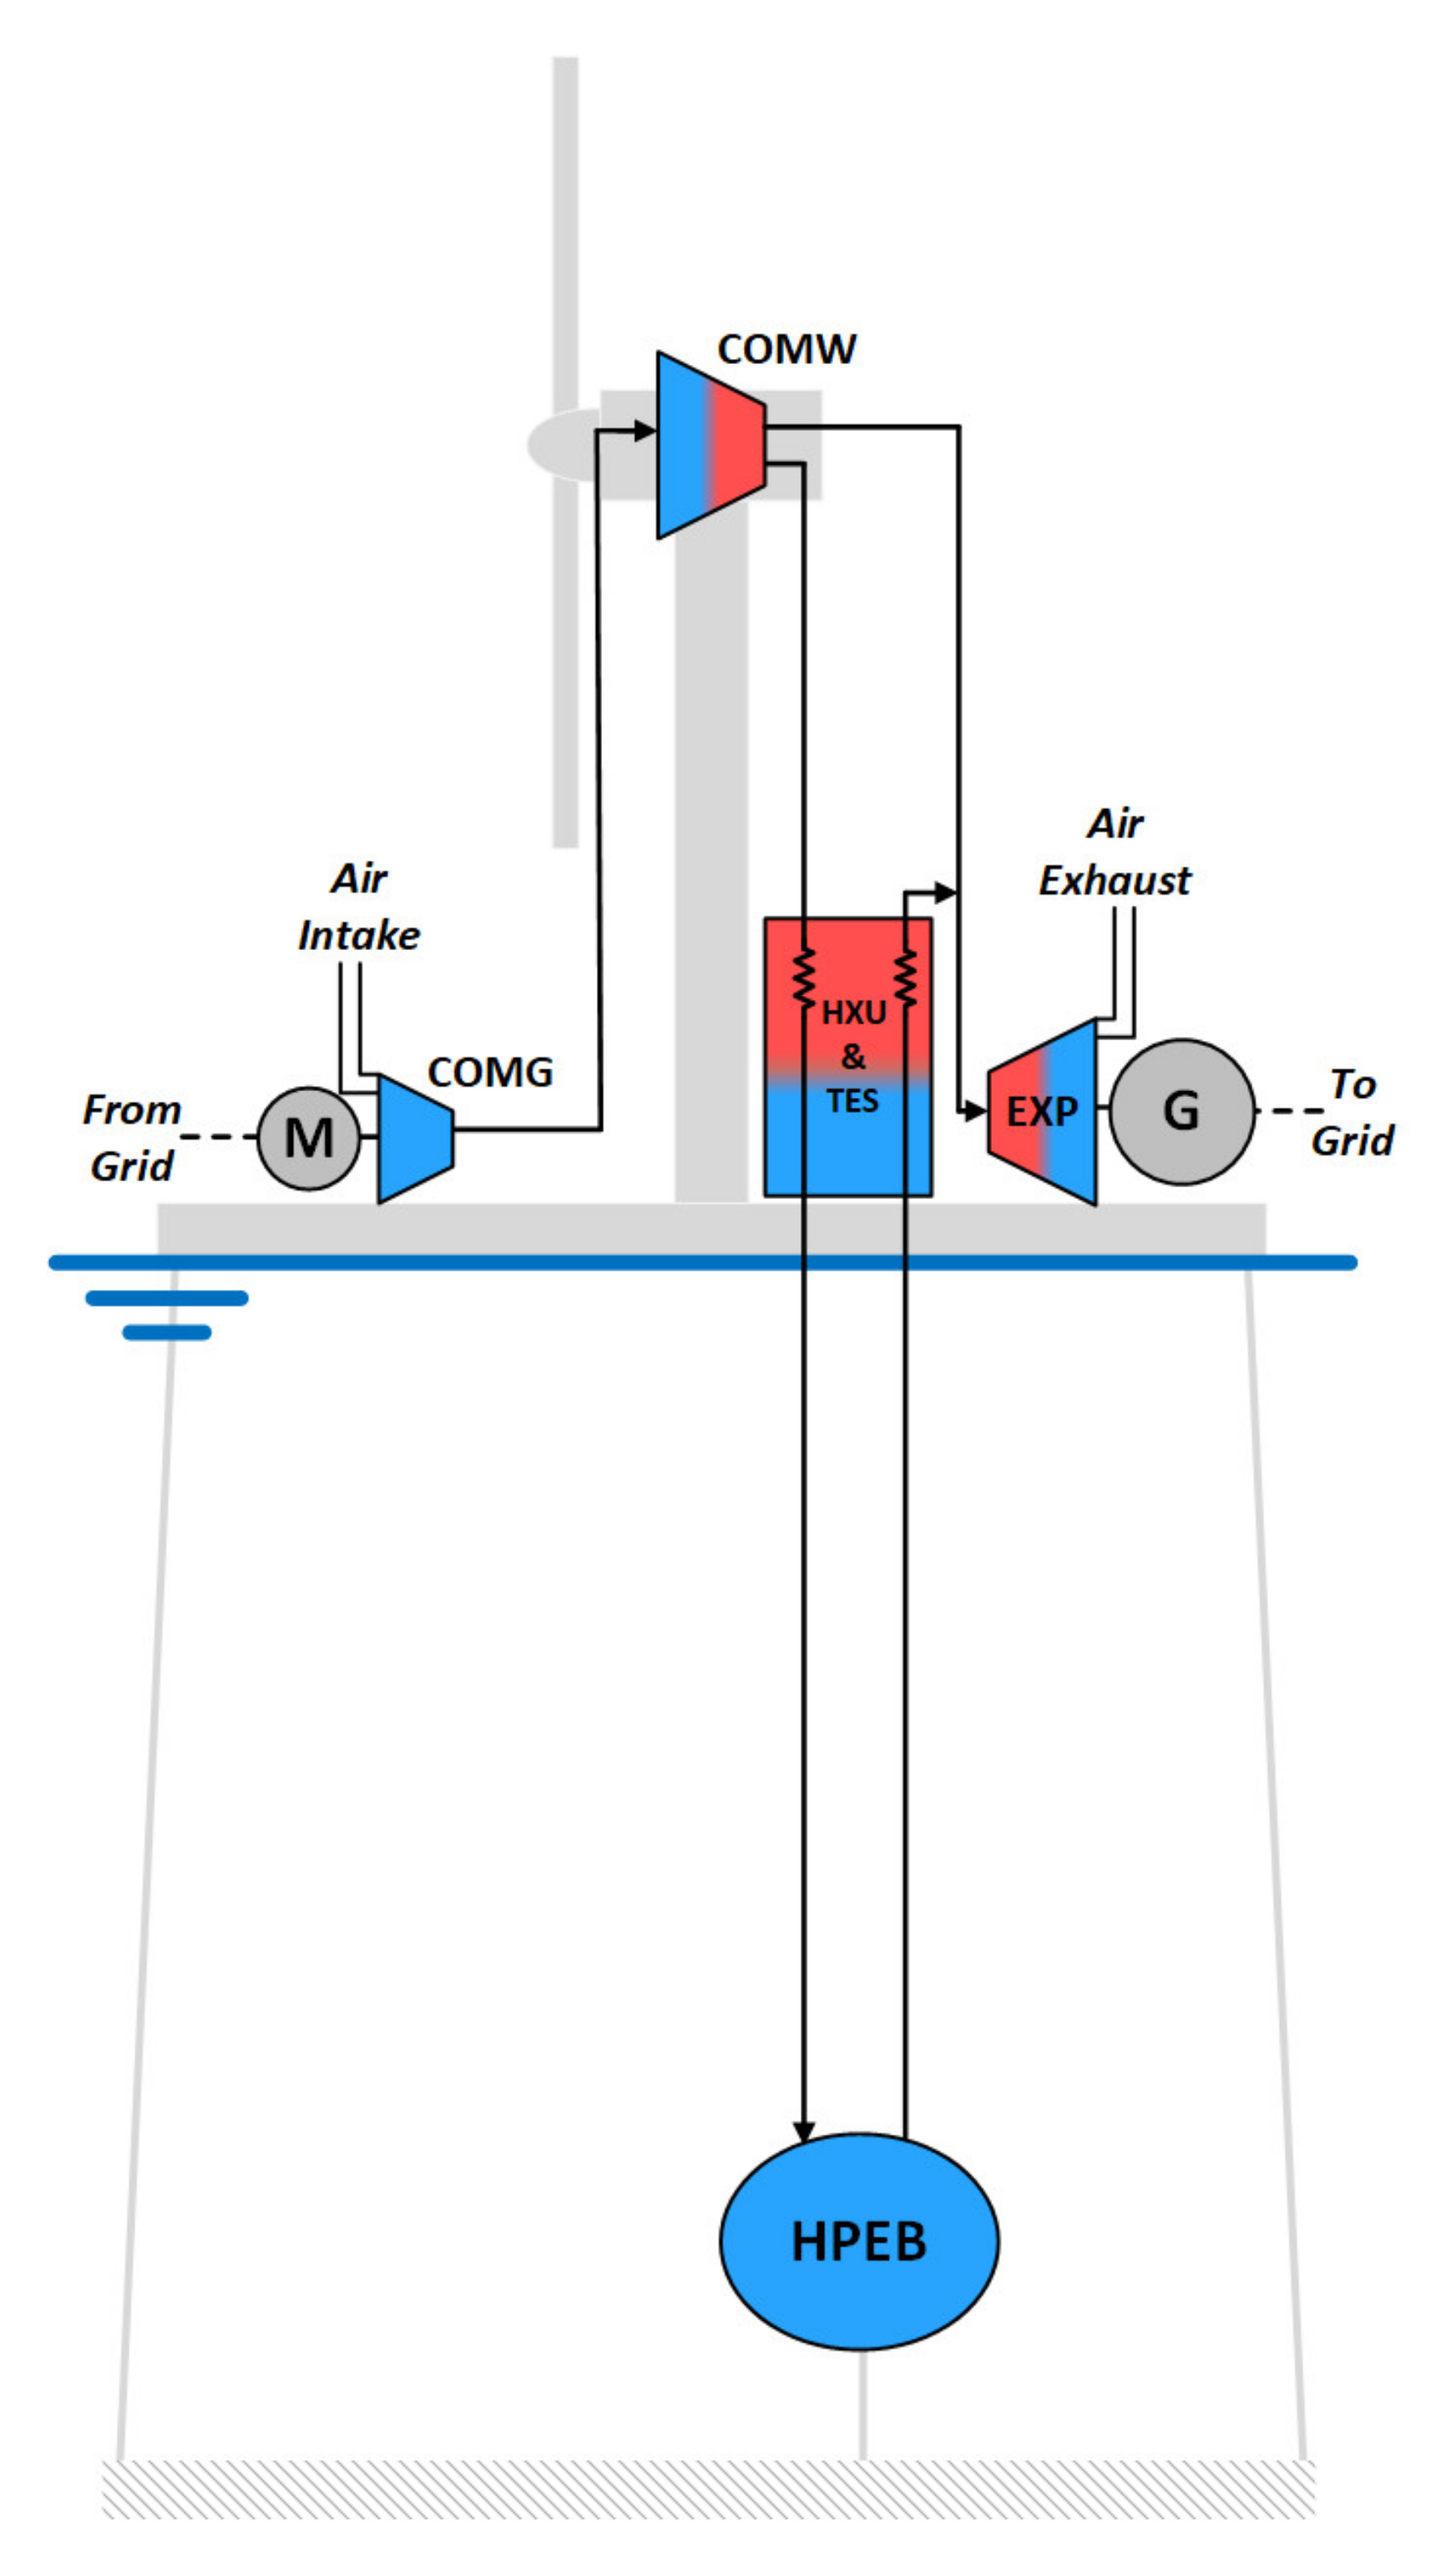
3.1. Description
- COMG—the grid-connected first stage of compression.
- COMW—the main stage, wind-driven compressor, which can be either isothermal or adiabatic (discussed in Section 3.2).
- HPEB—the high-pressure energy bag system (shown as a single bag for simplicity).
- EXP—the expander/generator set.
- HXU/TES—the heat-exchanger unit and thermal energy stores, relevant only if the main stage compressor is adiabatic.
- r1 and r2—the pressure ratios of COMG and COMW. The pressure of the high-pressure store is r1r2.
- PG and PW—the powers of COMG and COMW. PEXP is the expander power.
- V1, V2, V3—the volumetric flowrate into COMG, out of COMG/into COMW and out of COMW/into EXP. p1, p2, p3 are the respective pressures.
3.2. Possible Configurations
4. System Analysis
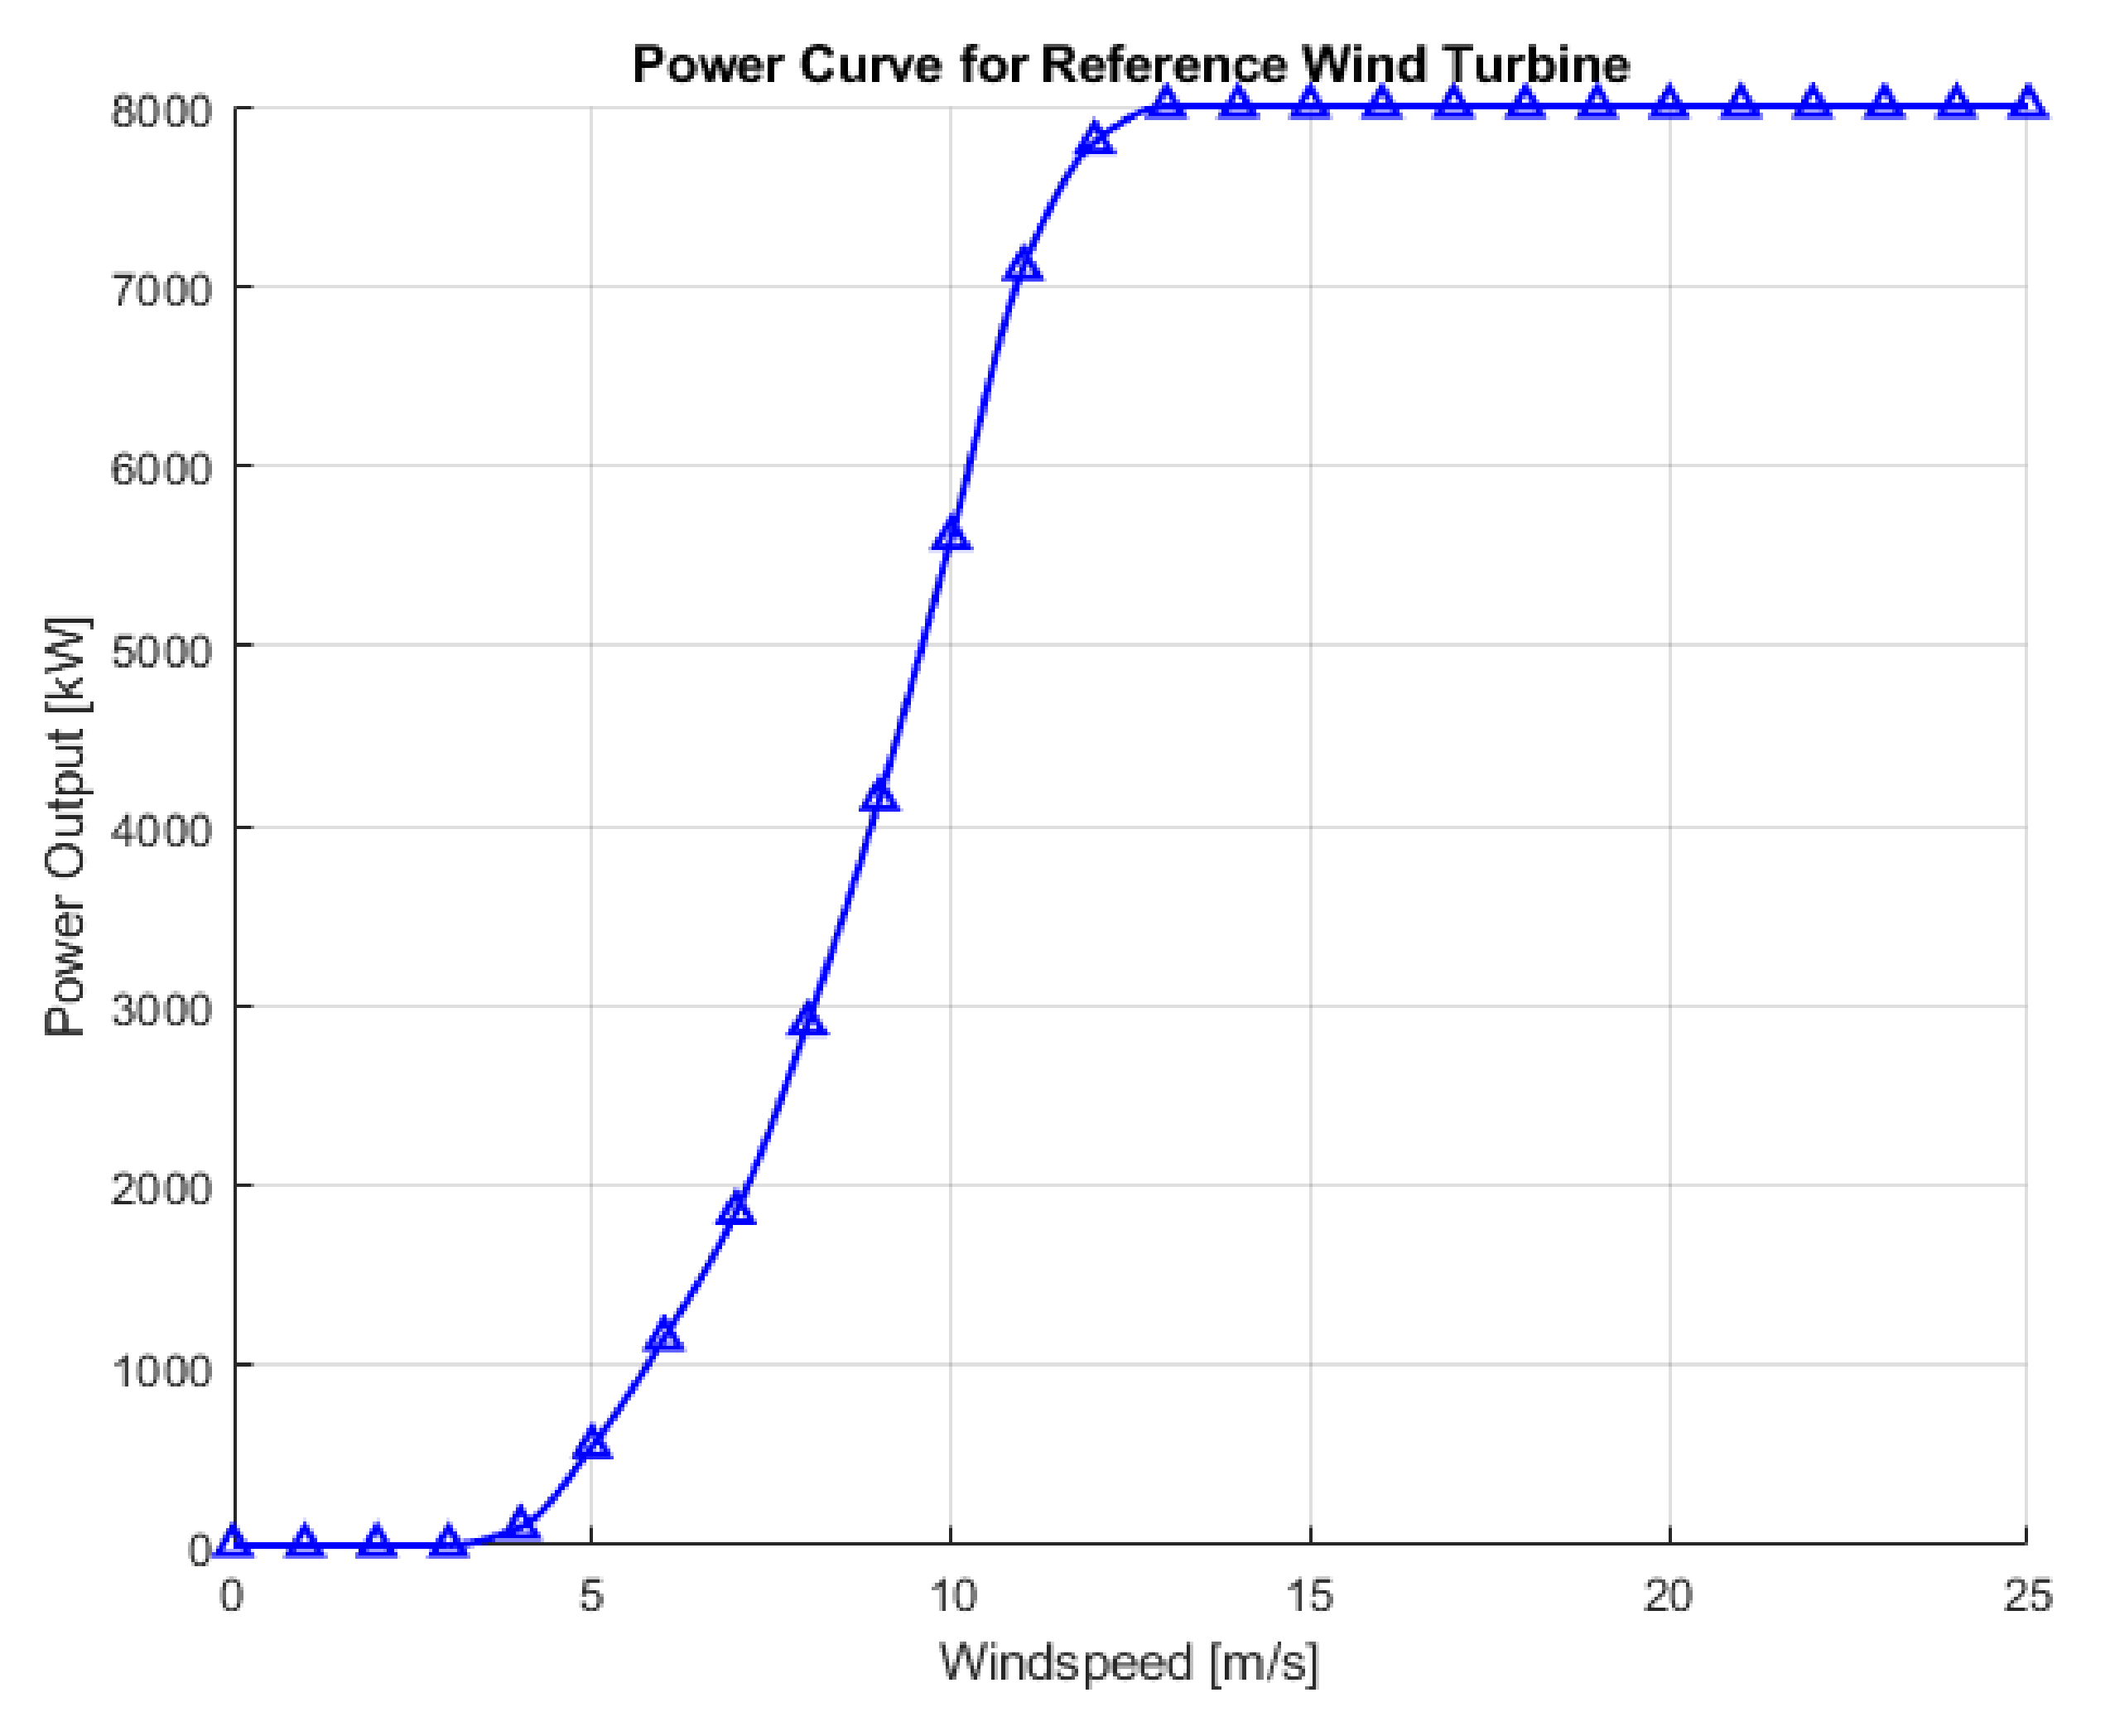
4.1. Simulation Data and Assumptions
4.2. Methodology
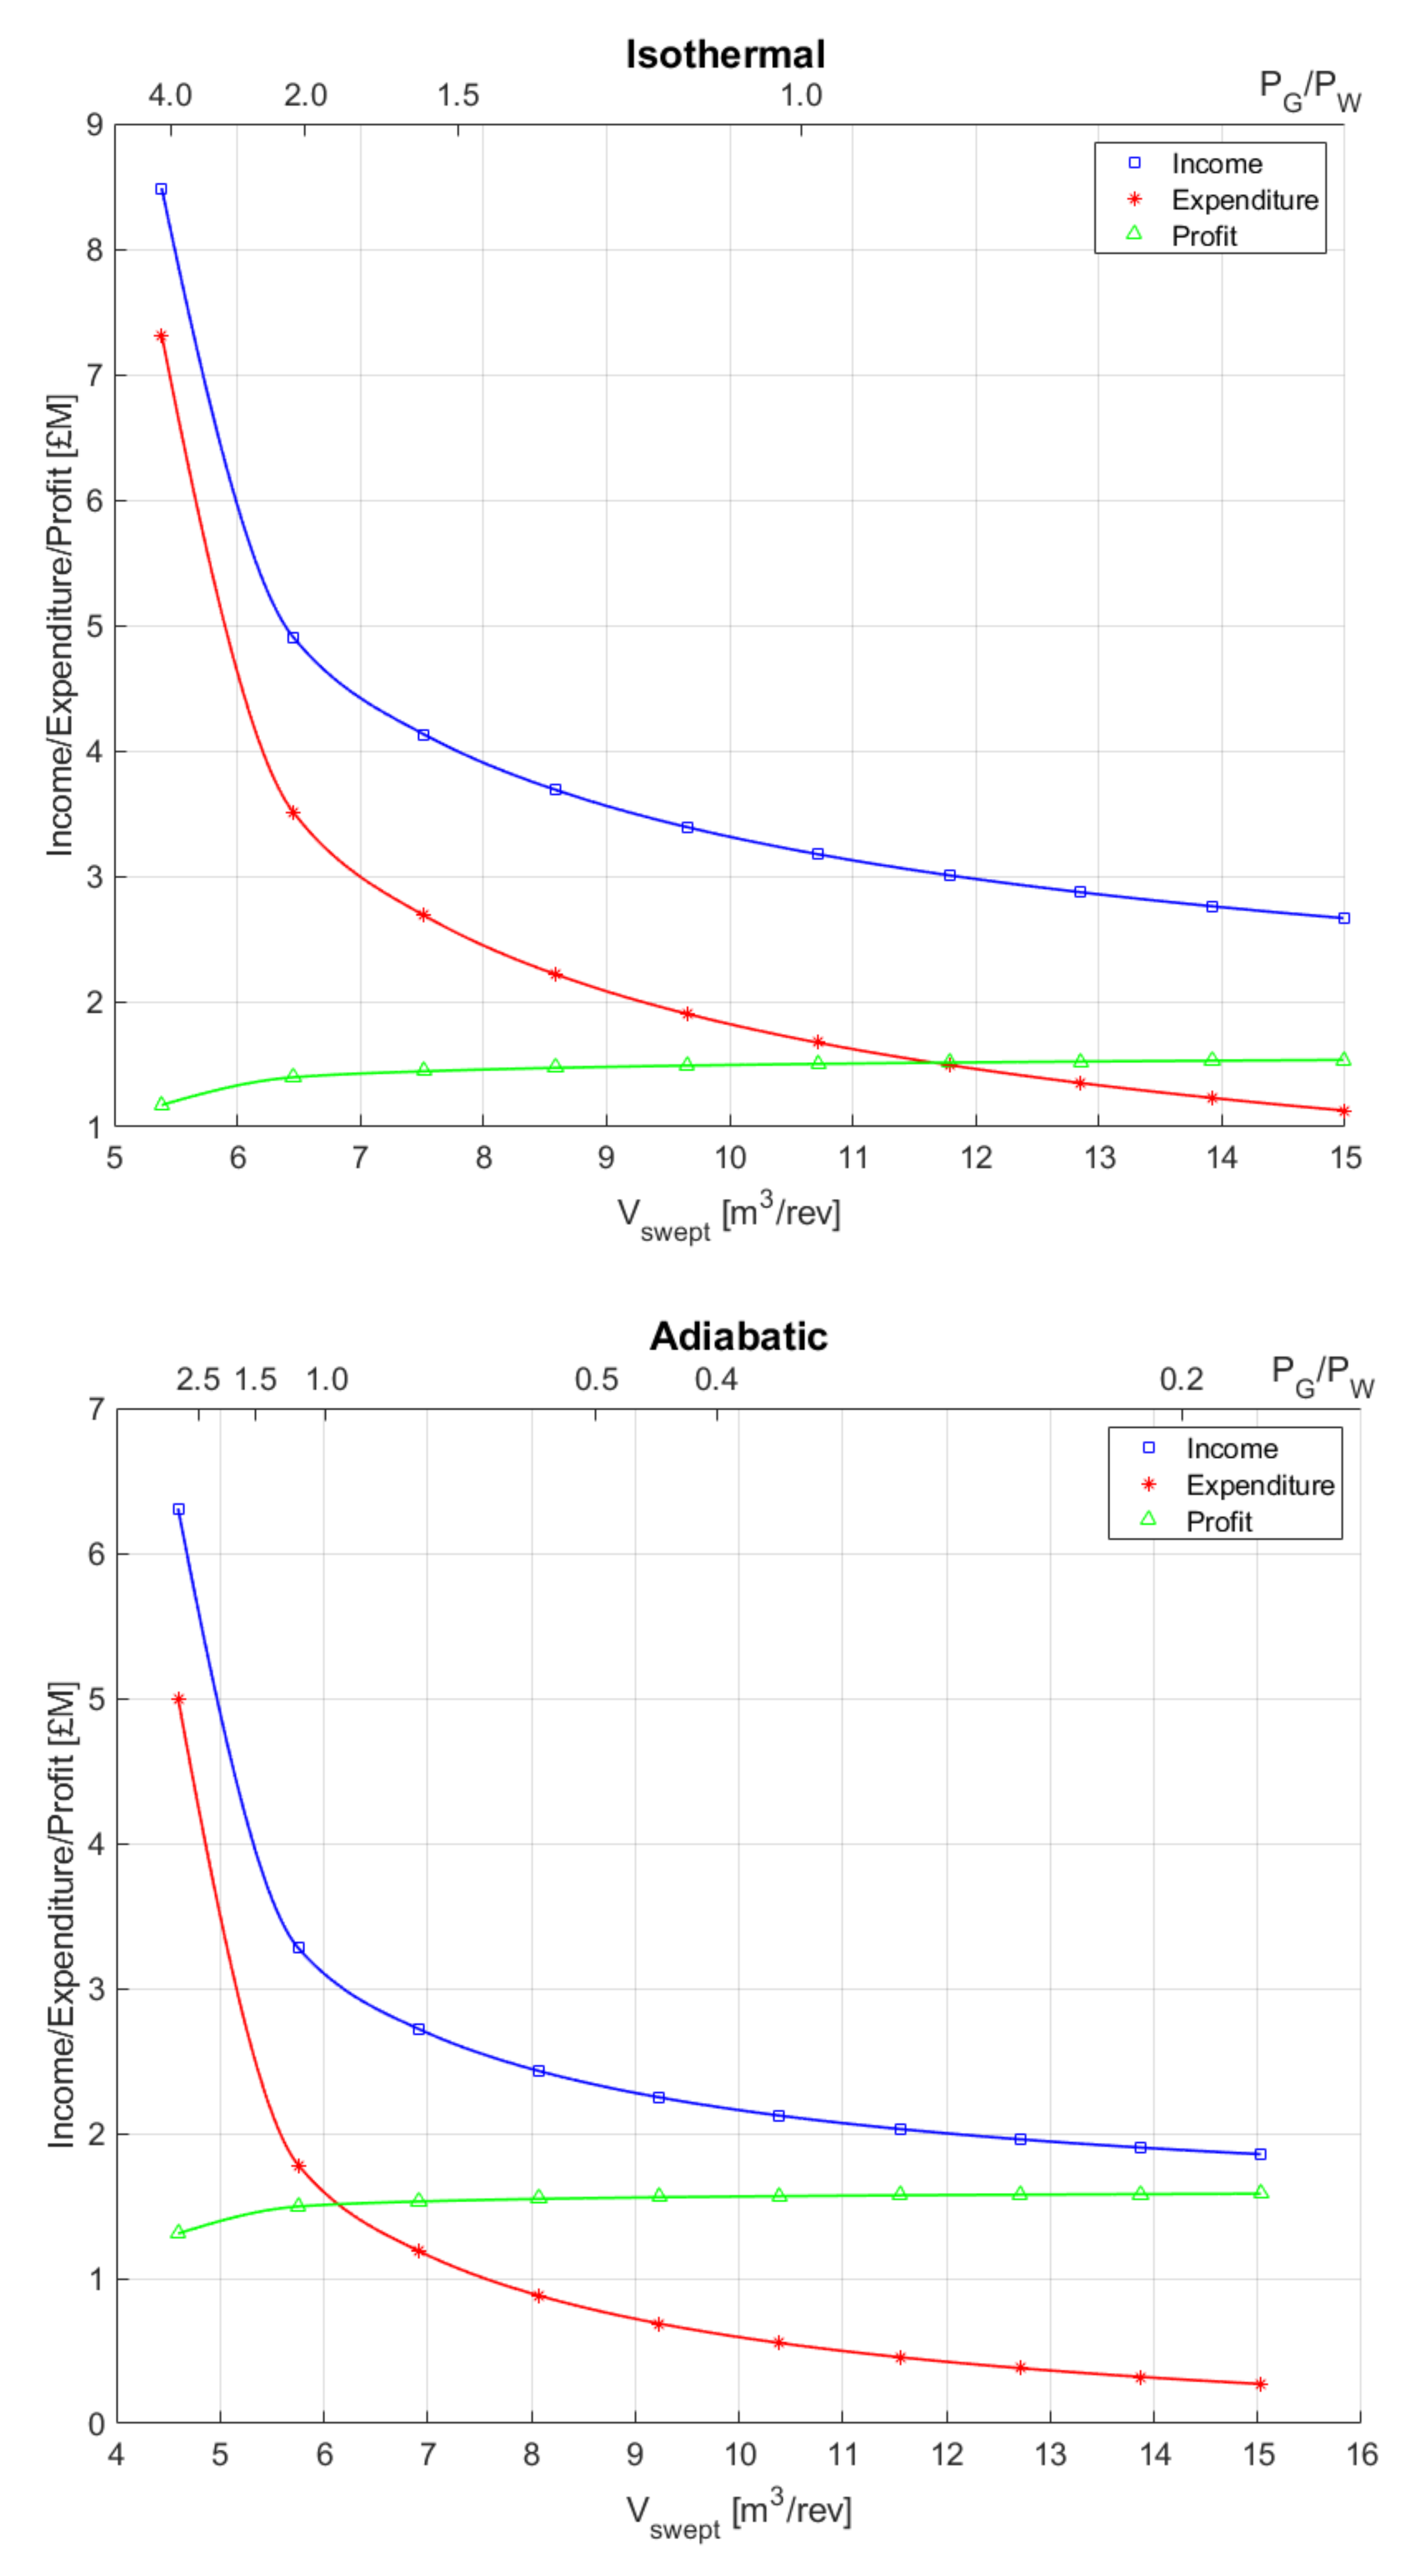
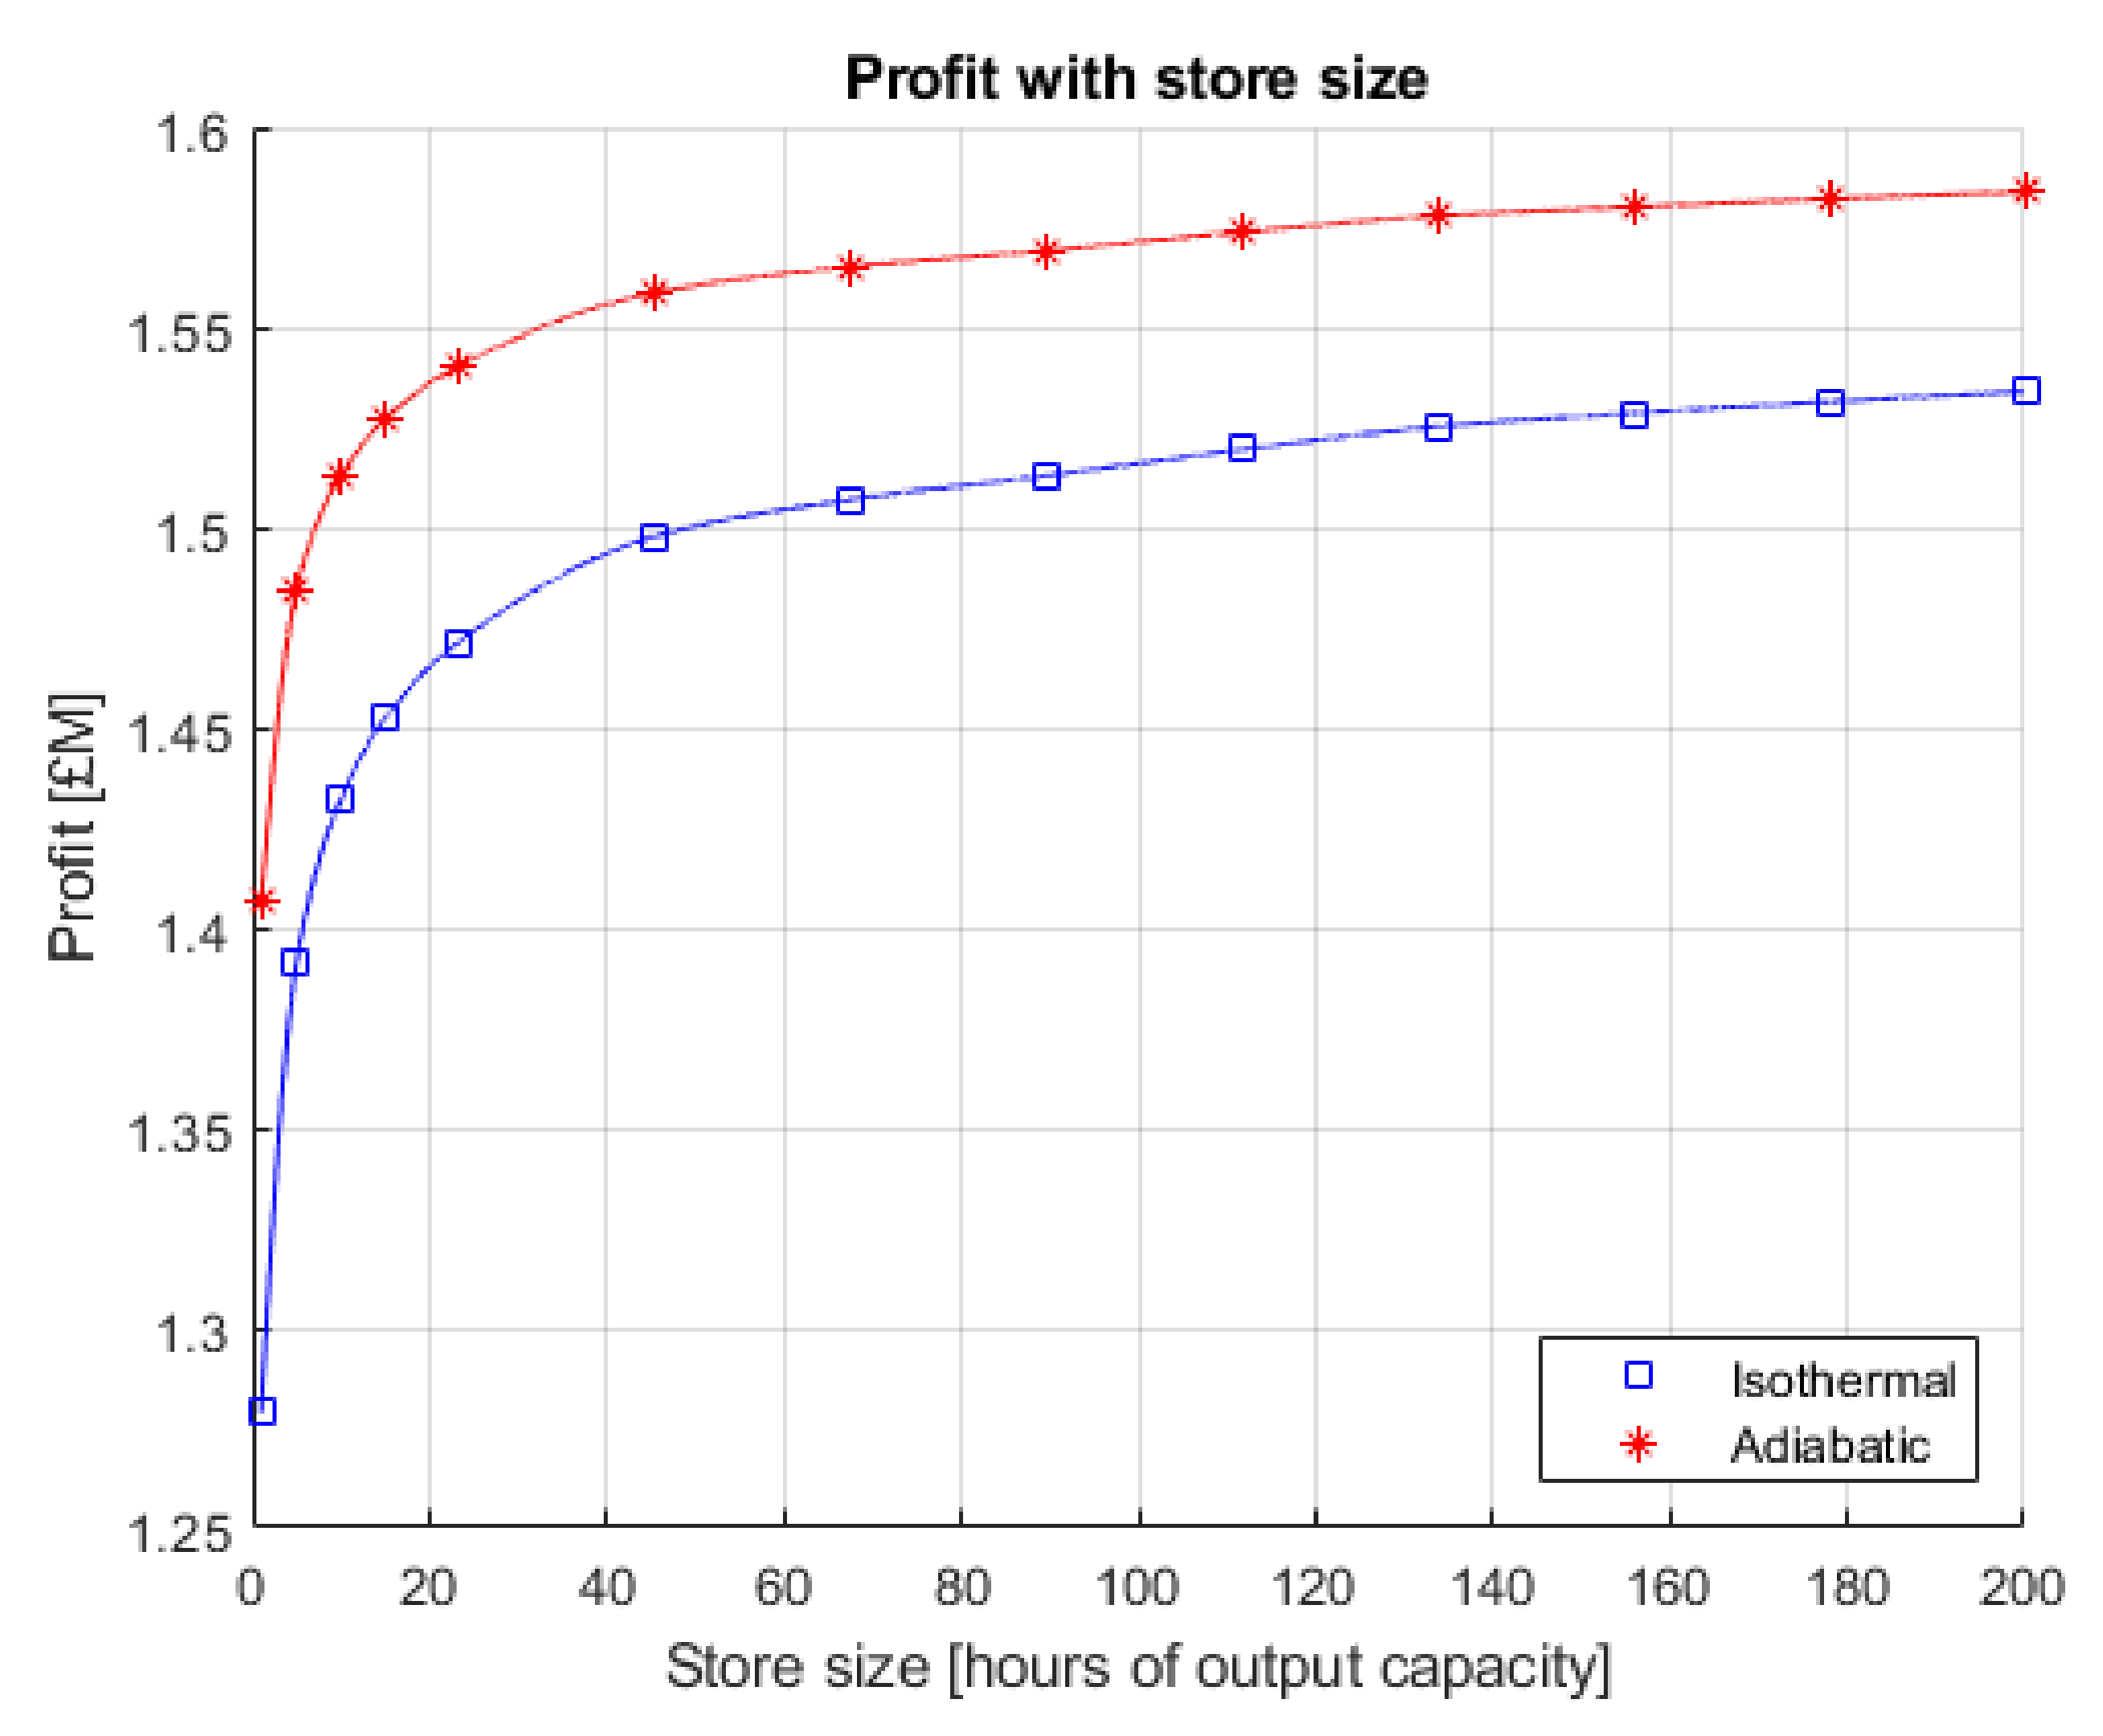
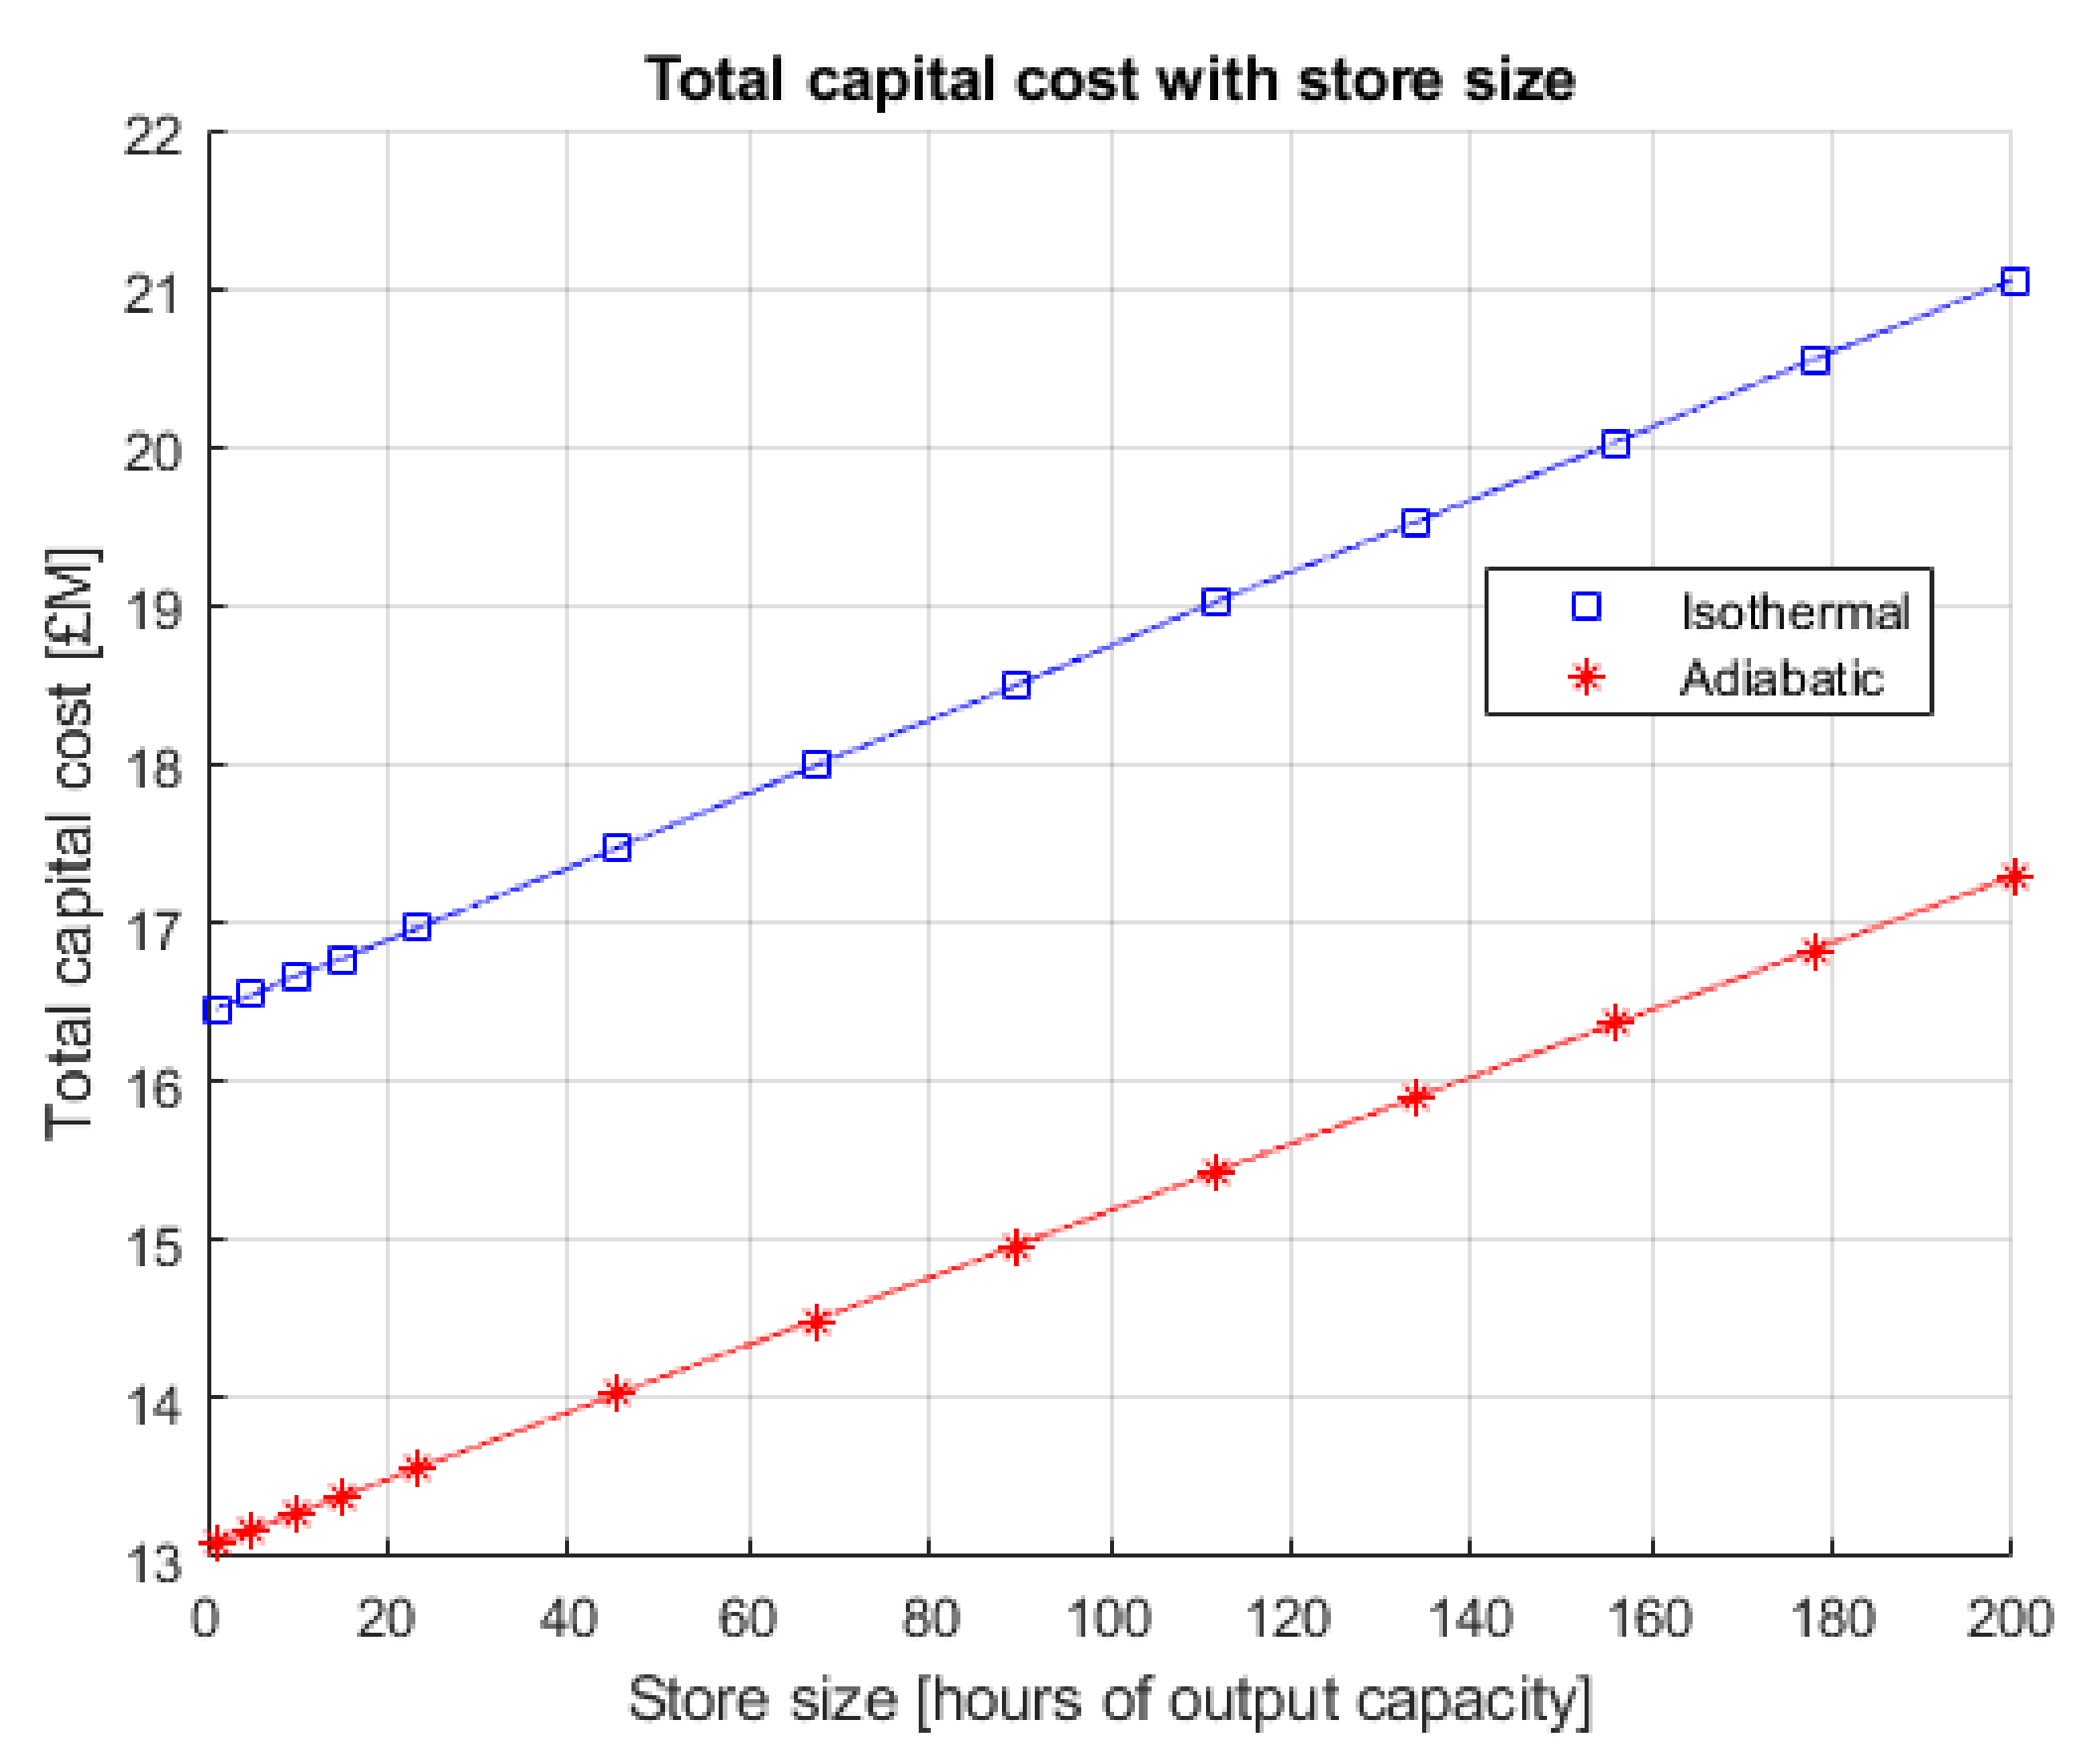
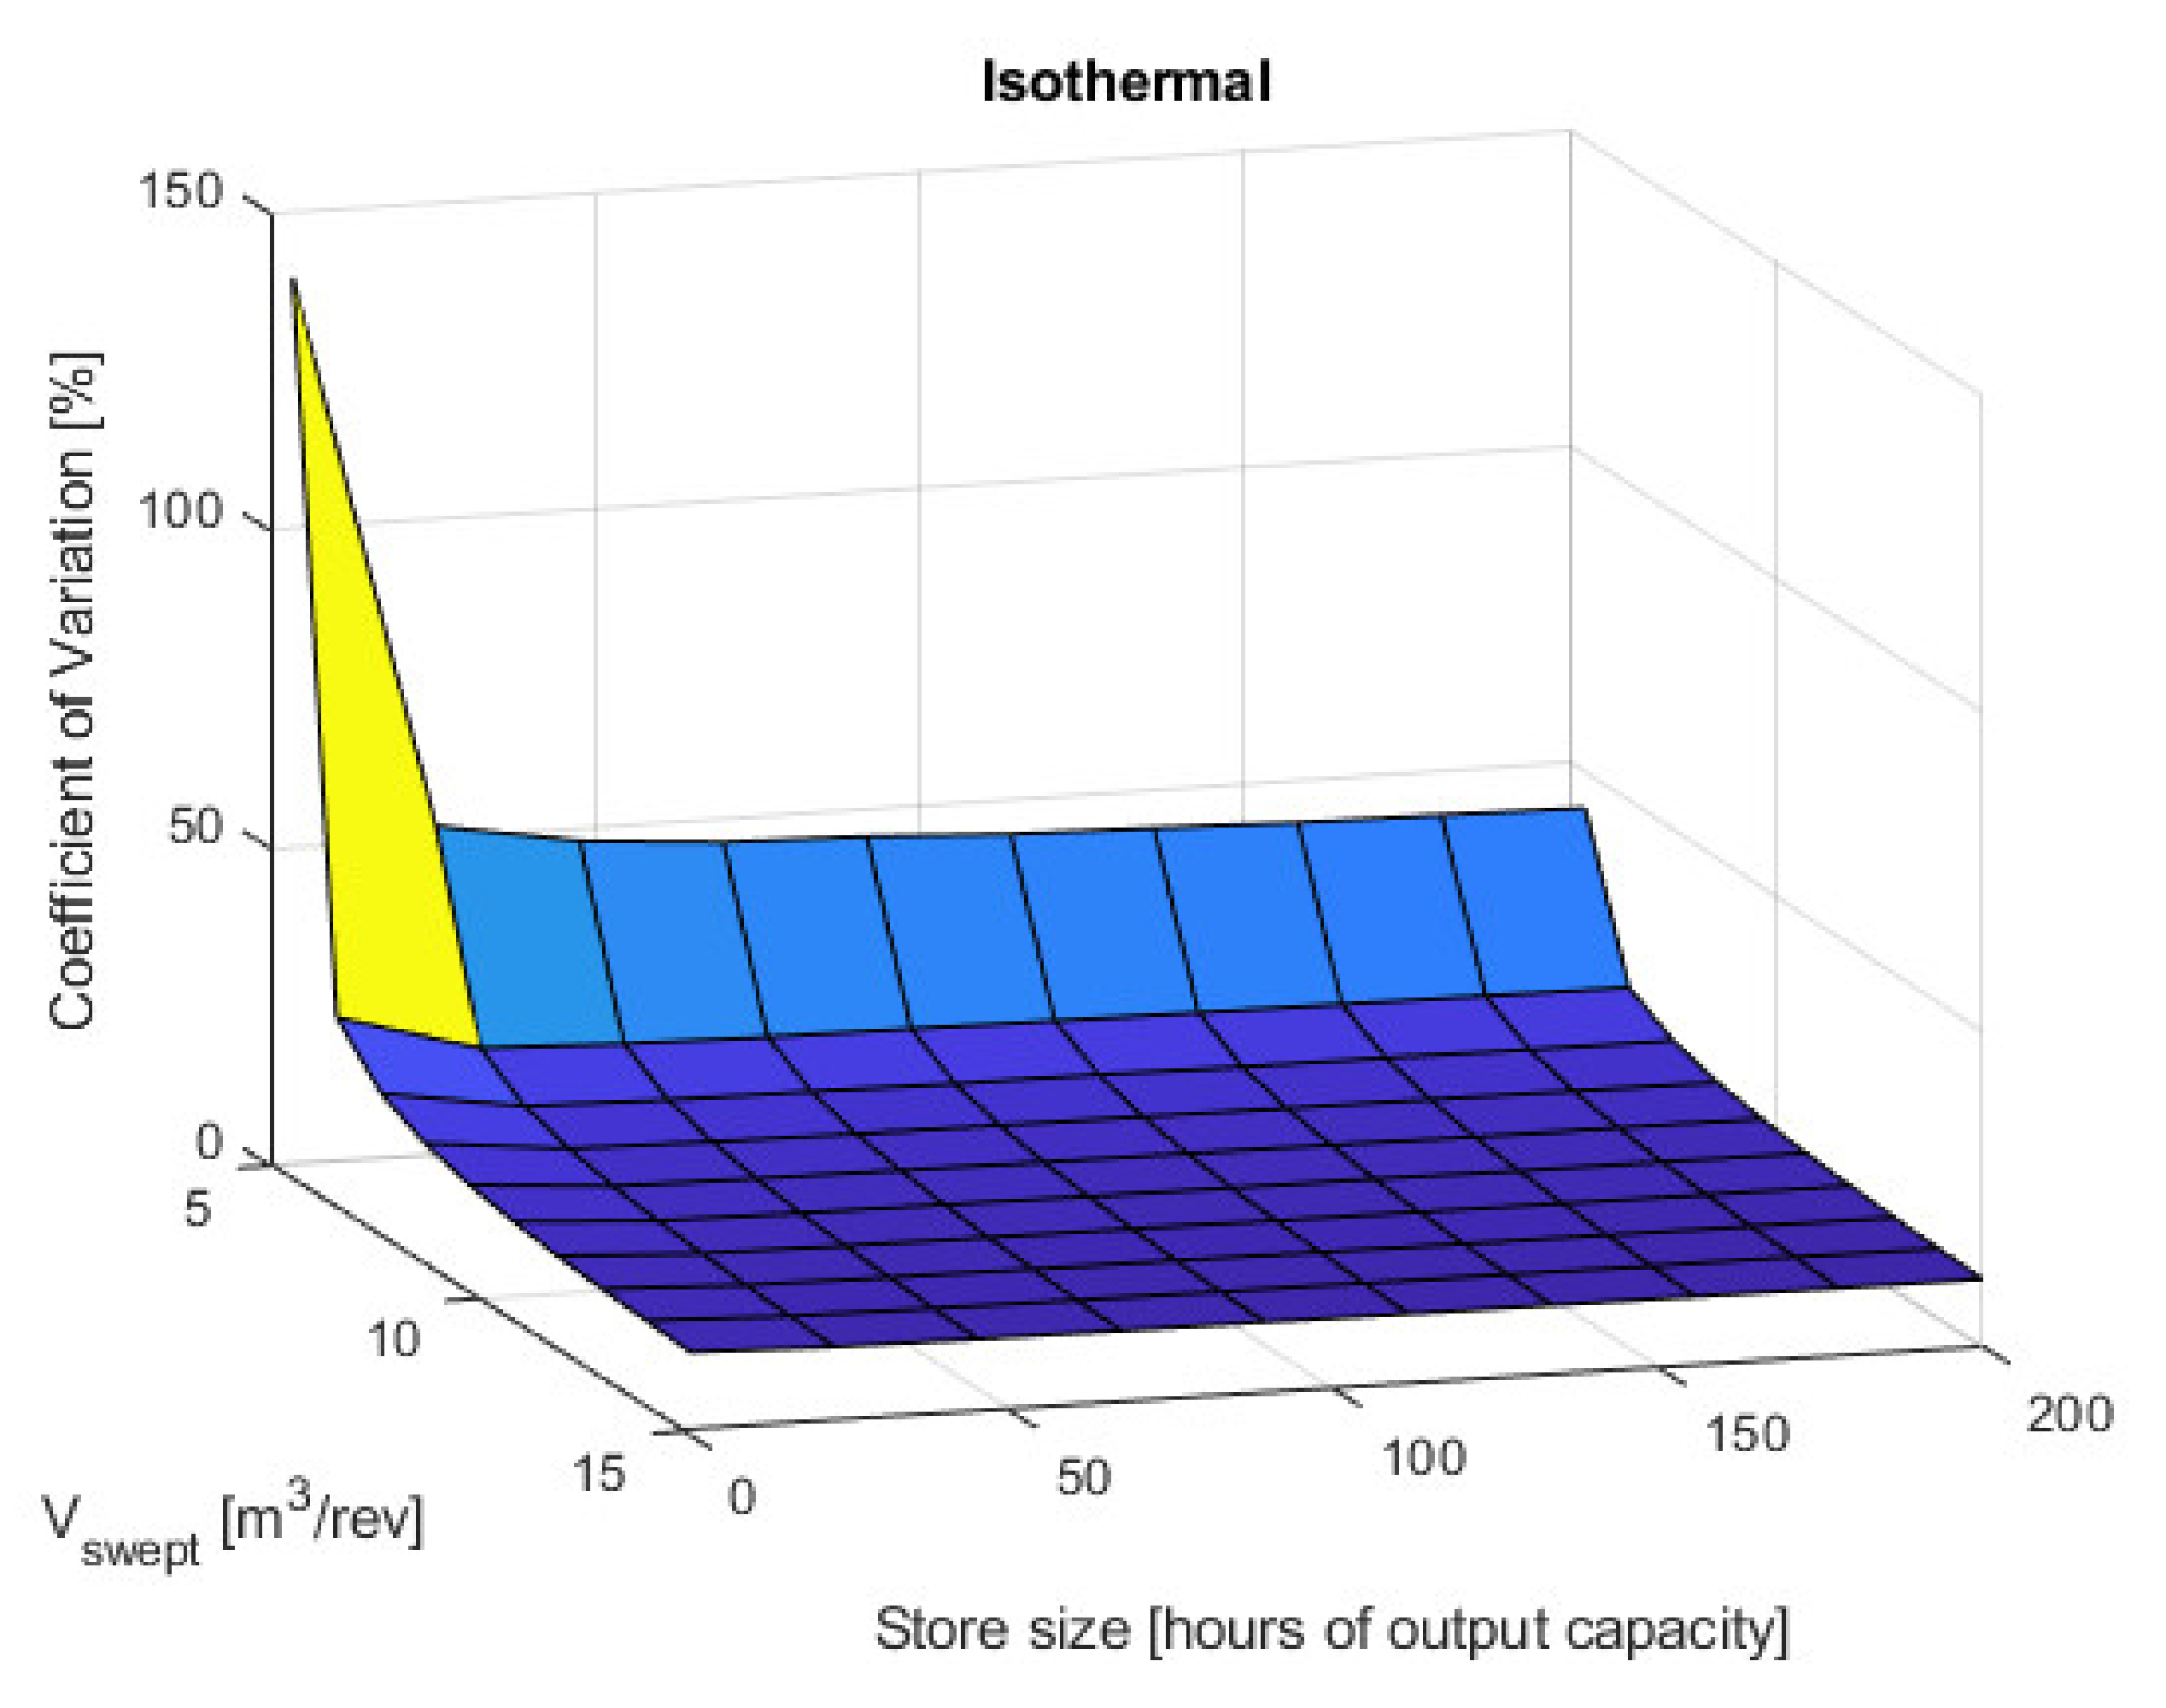
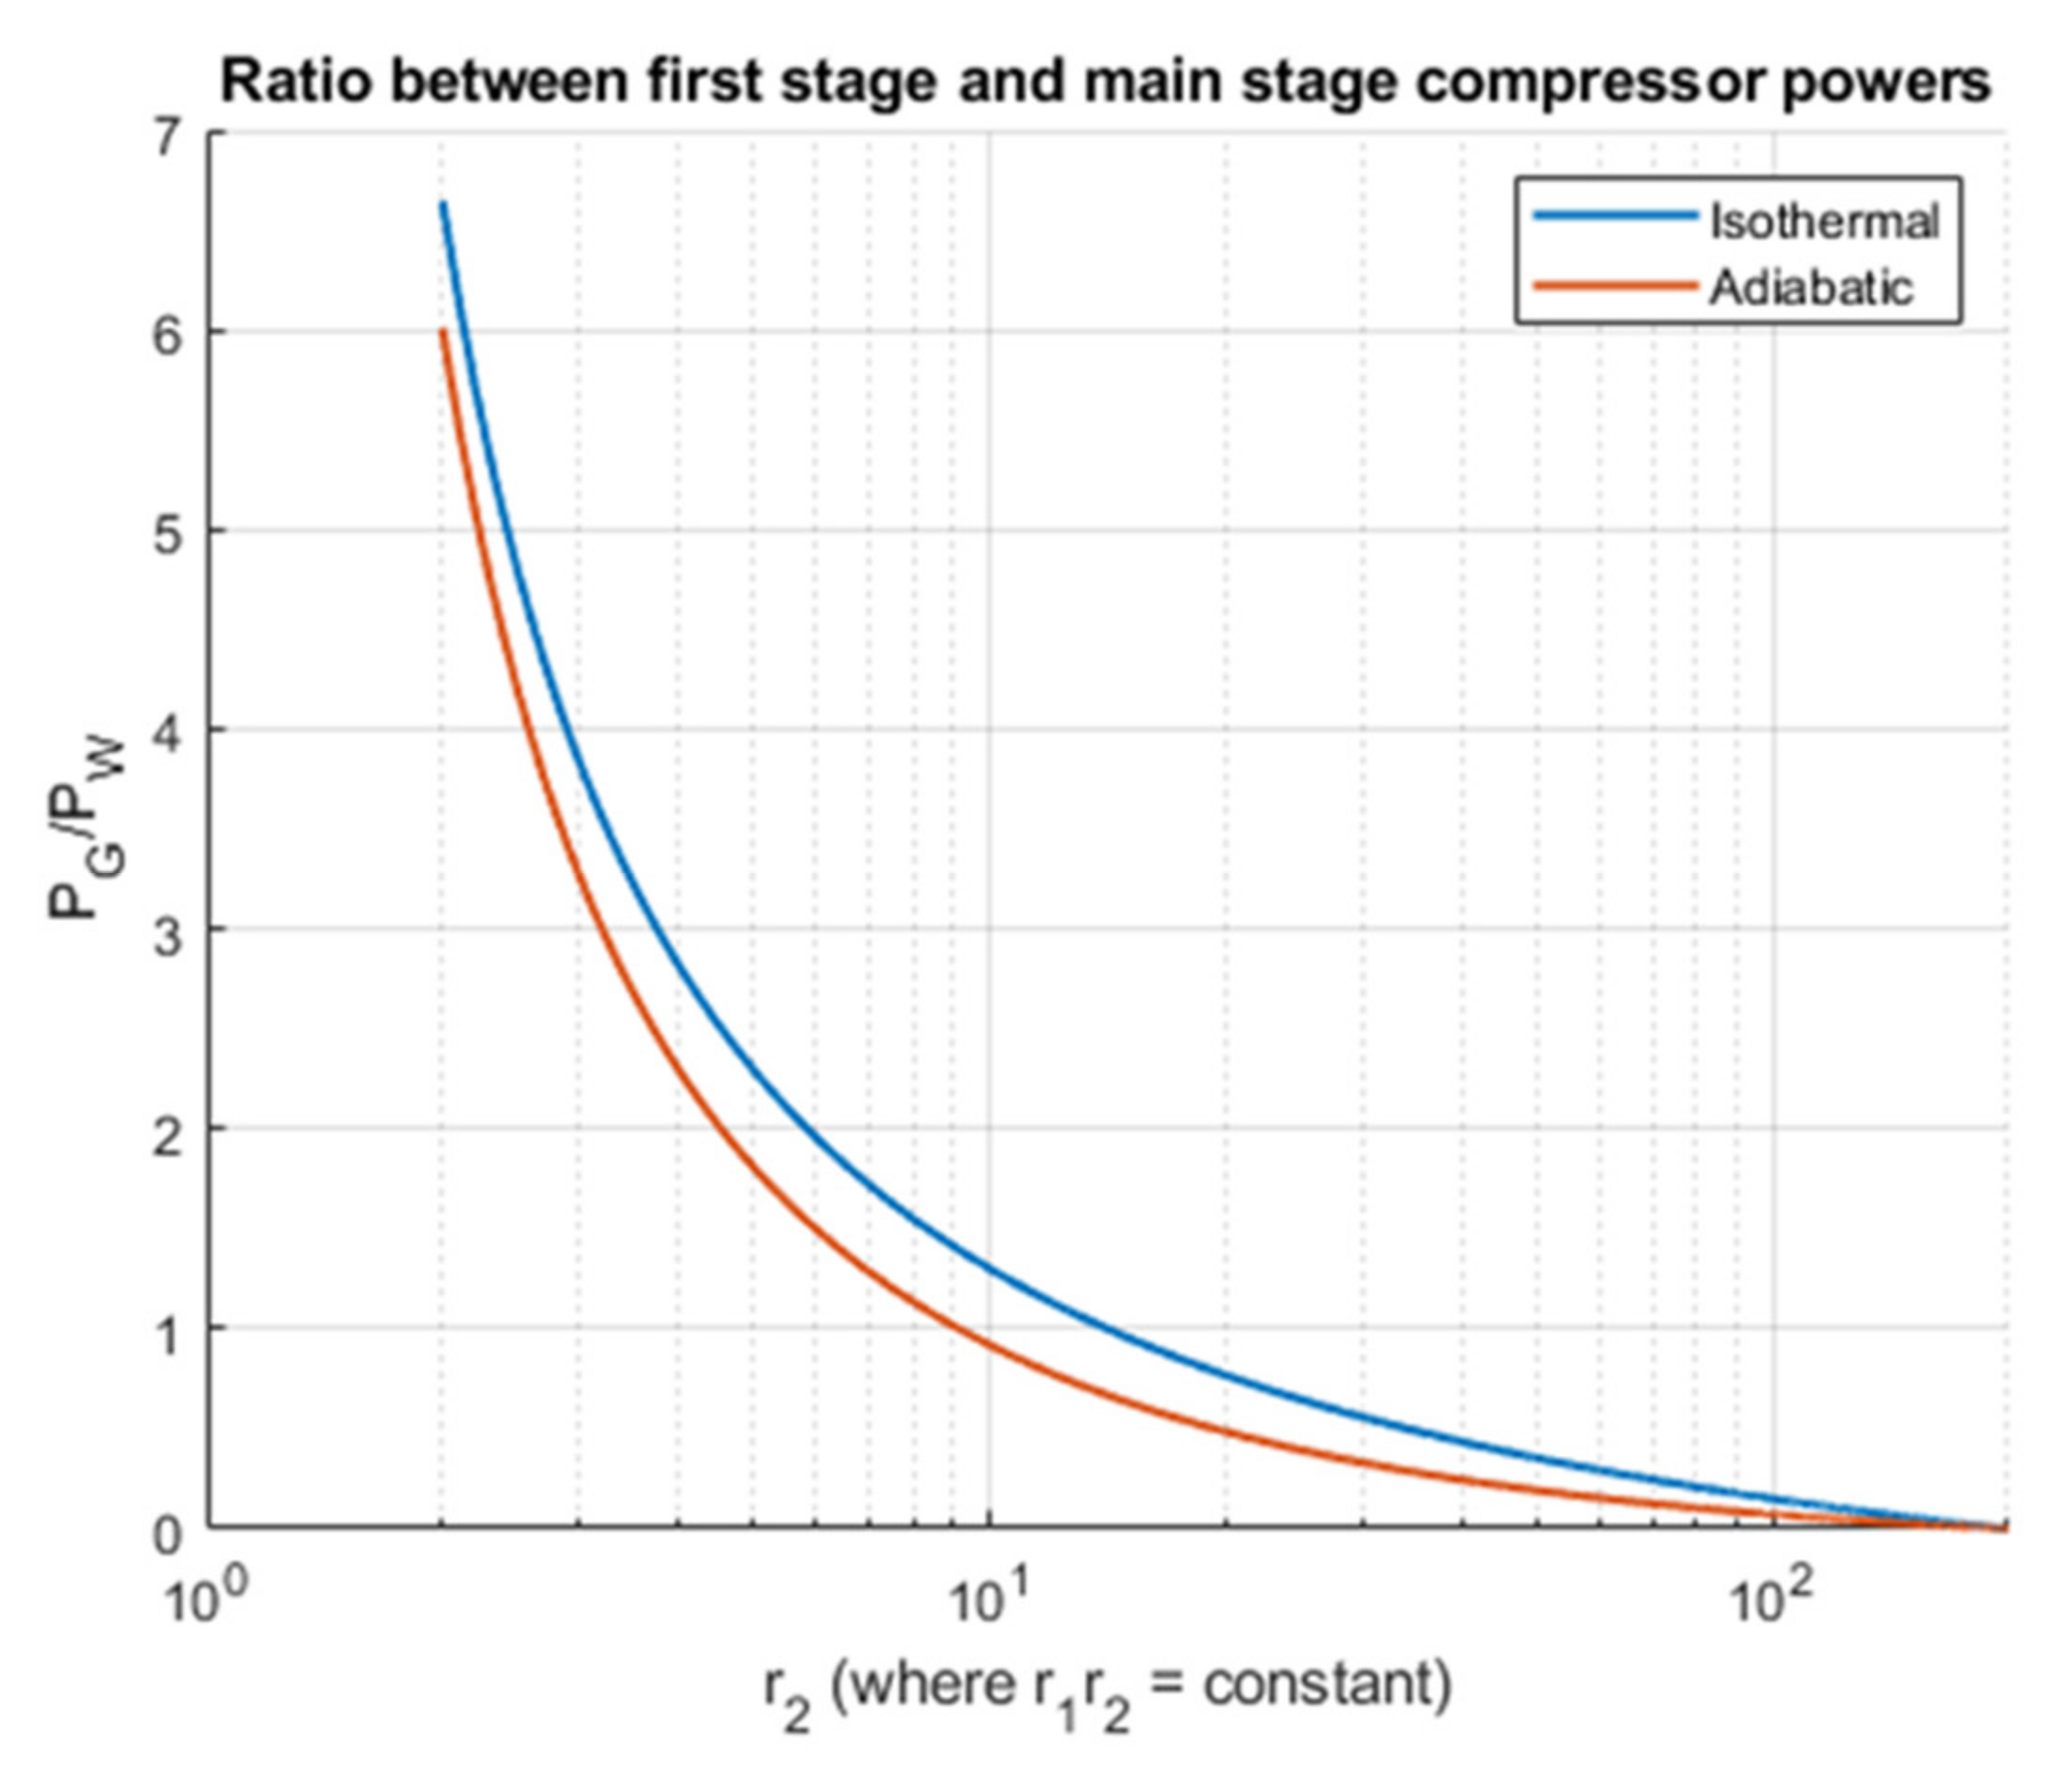
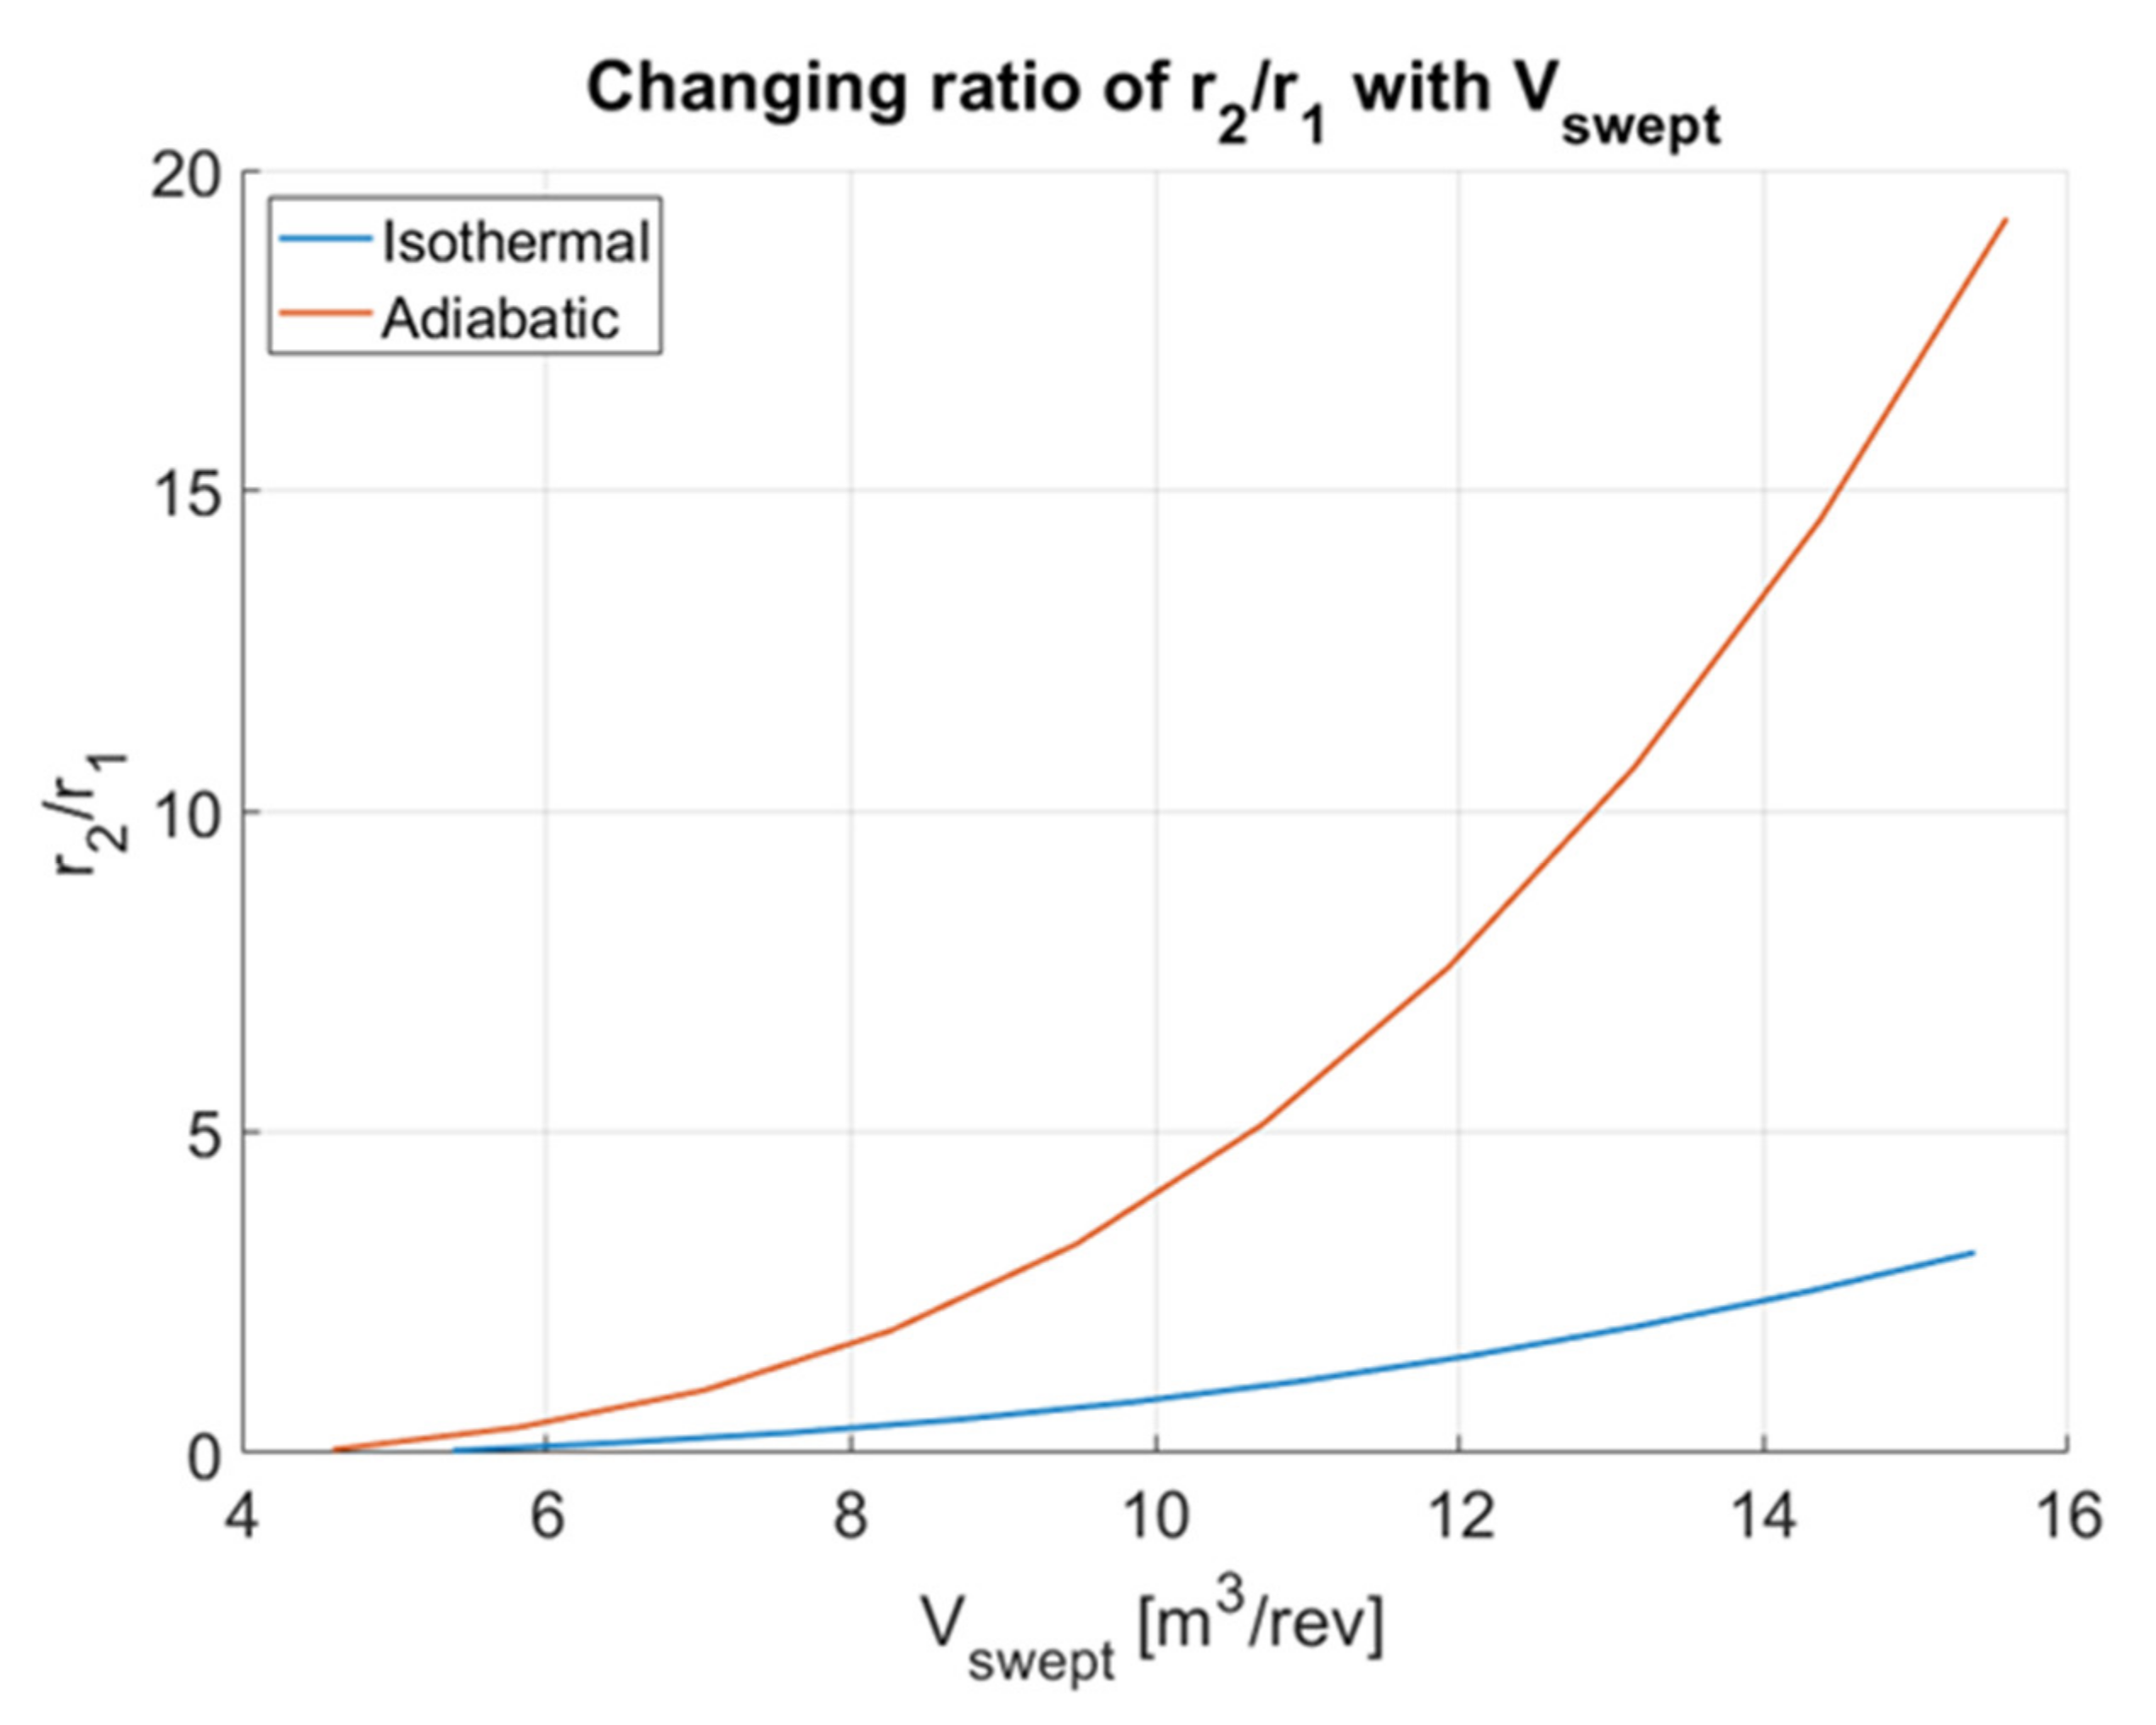
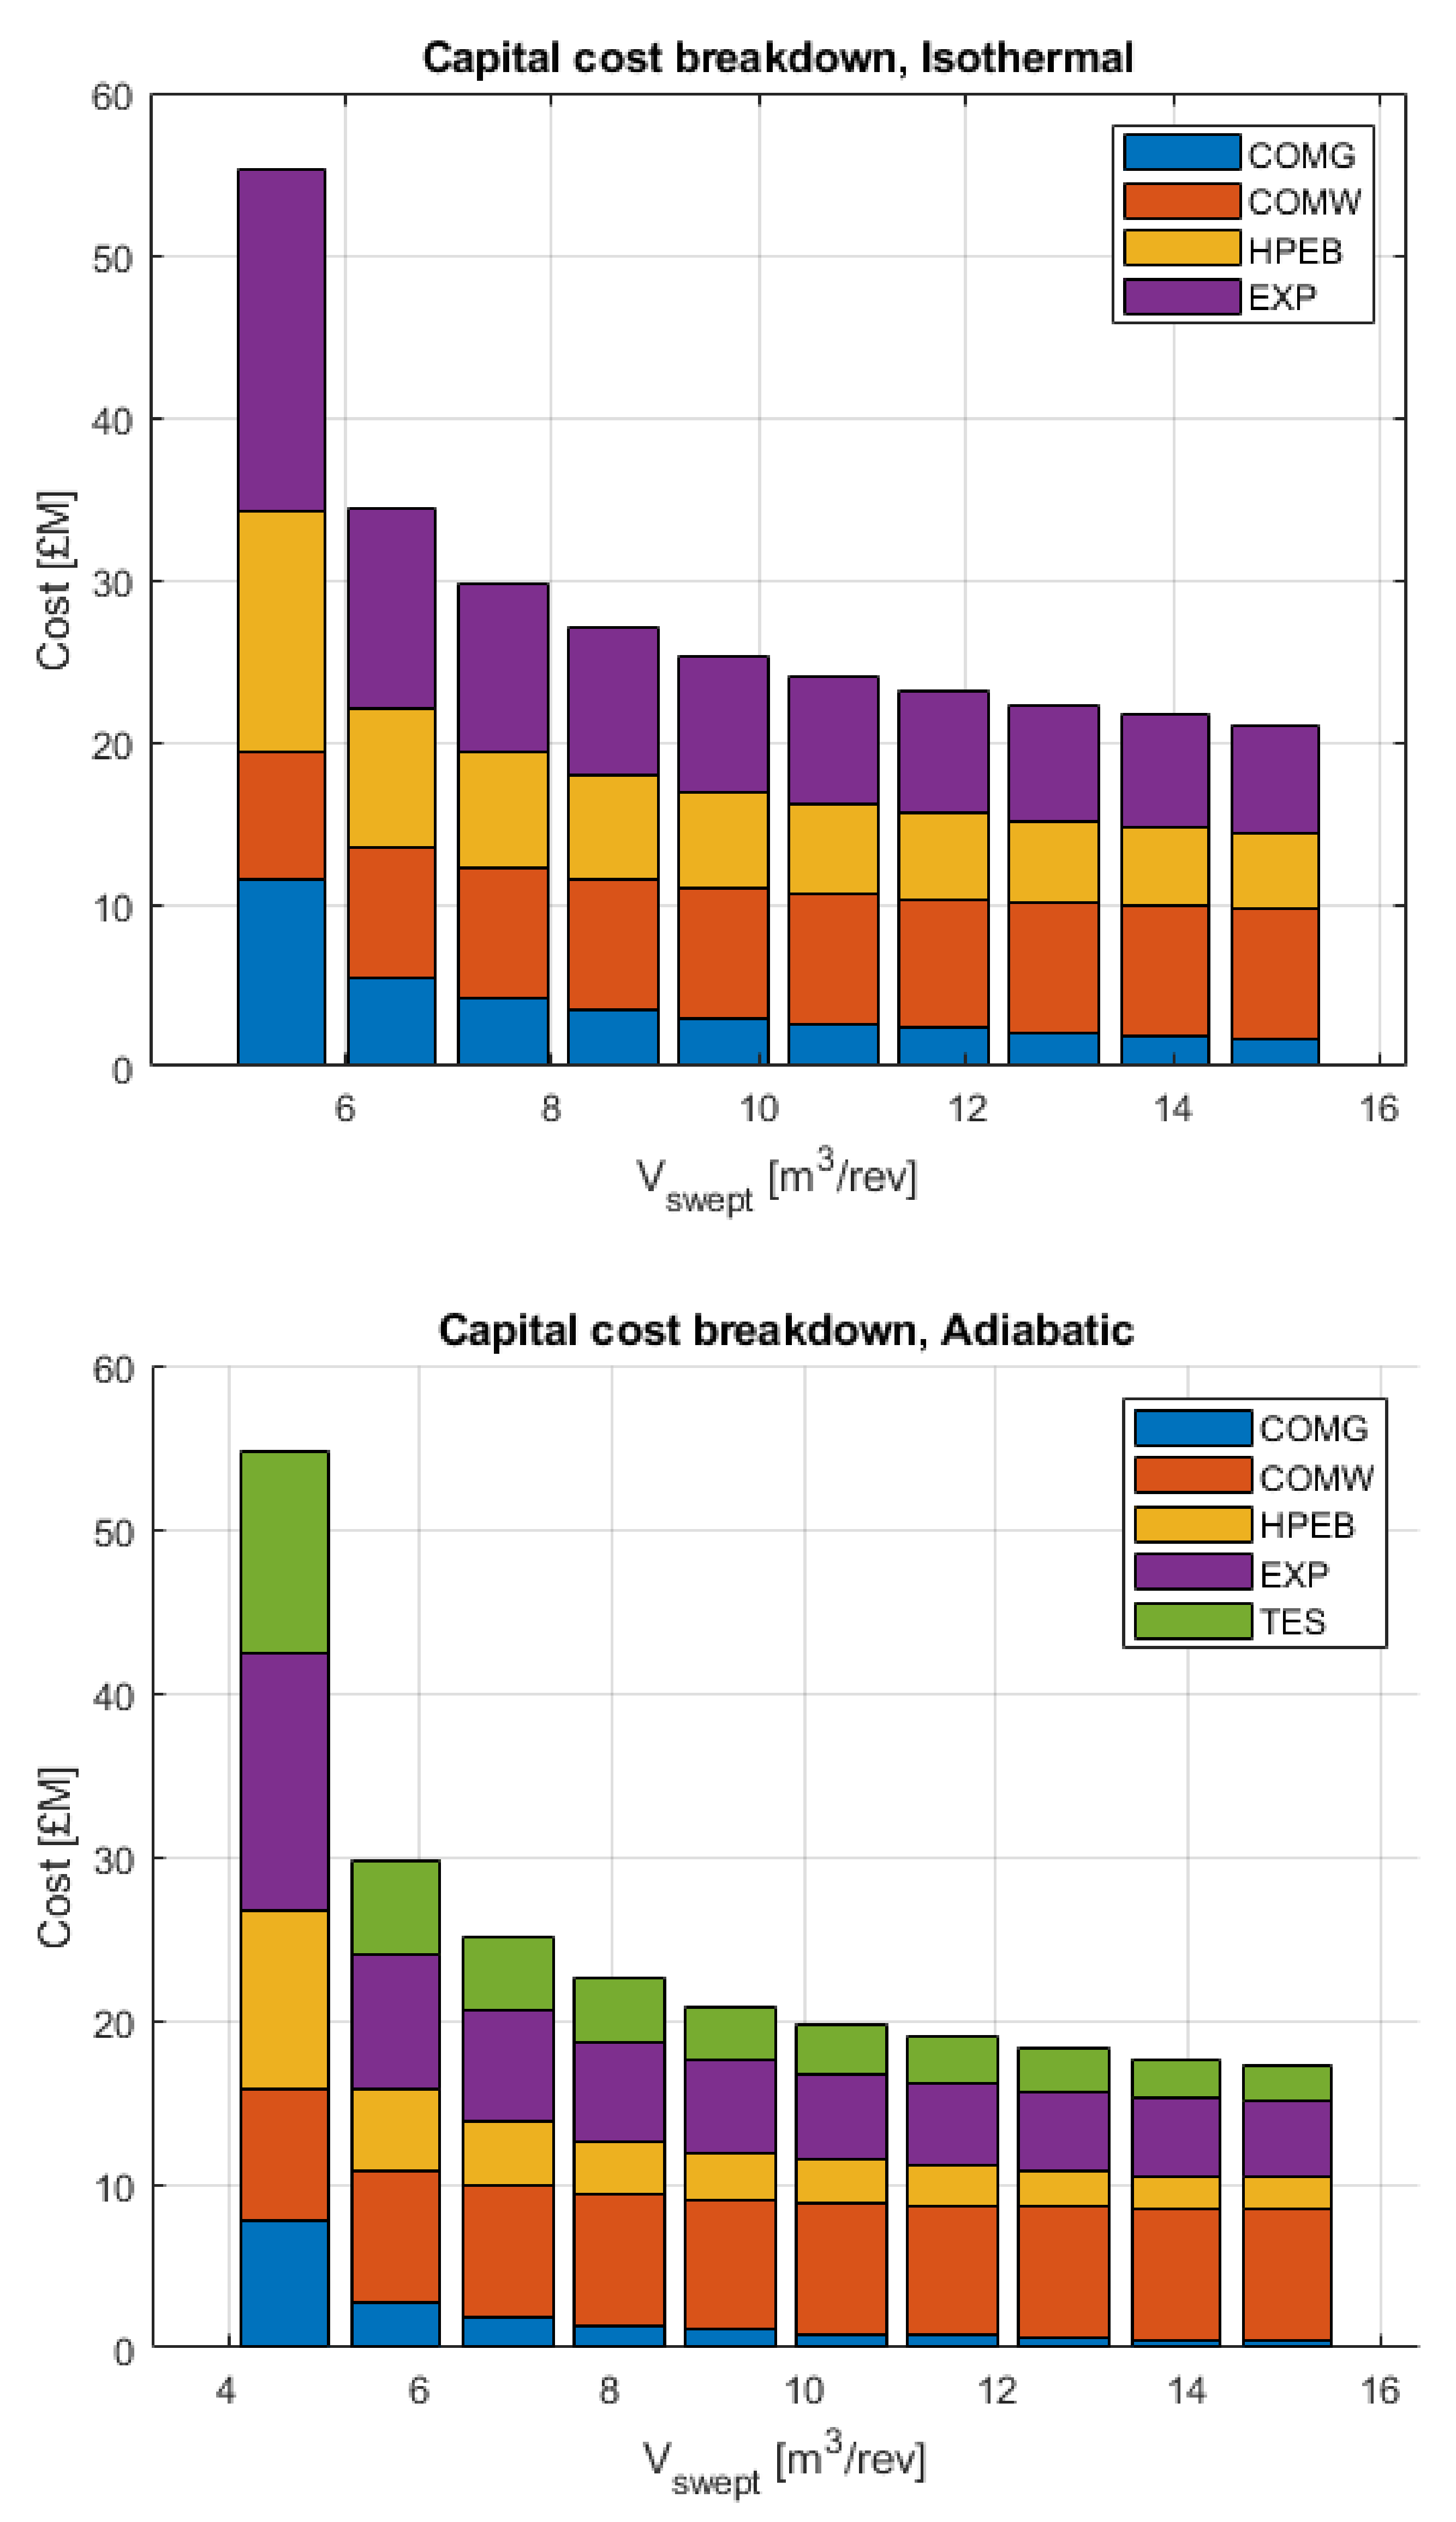
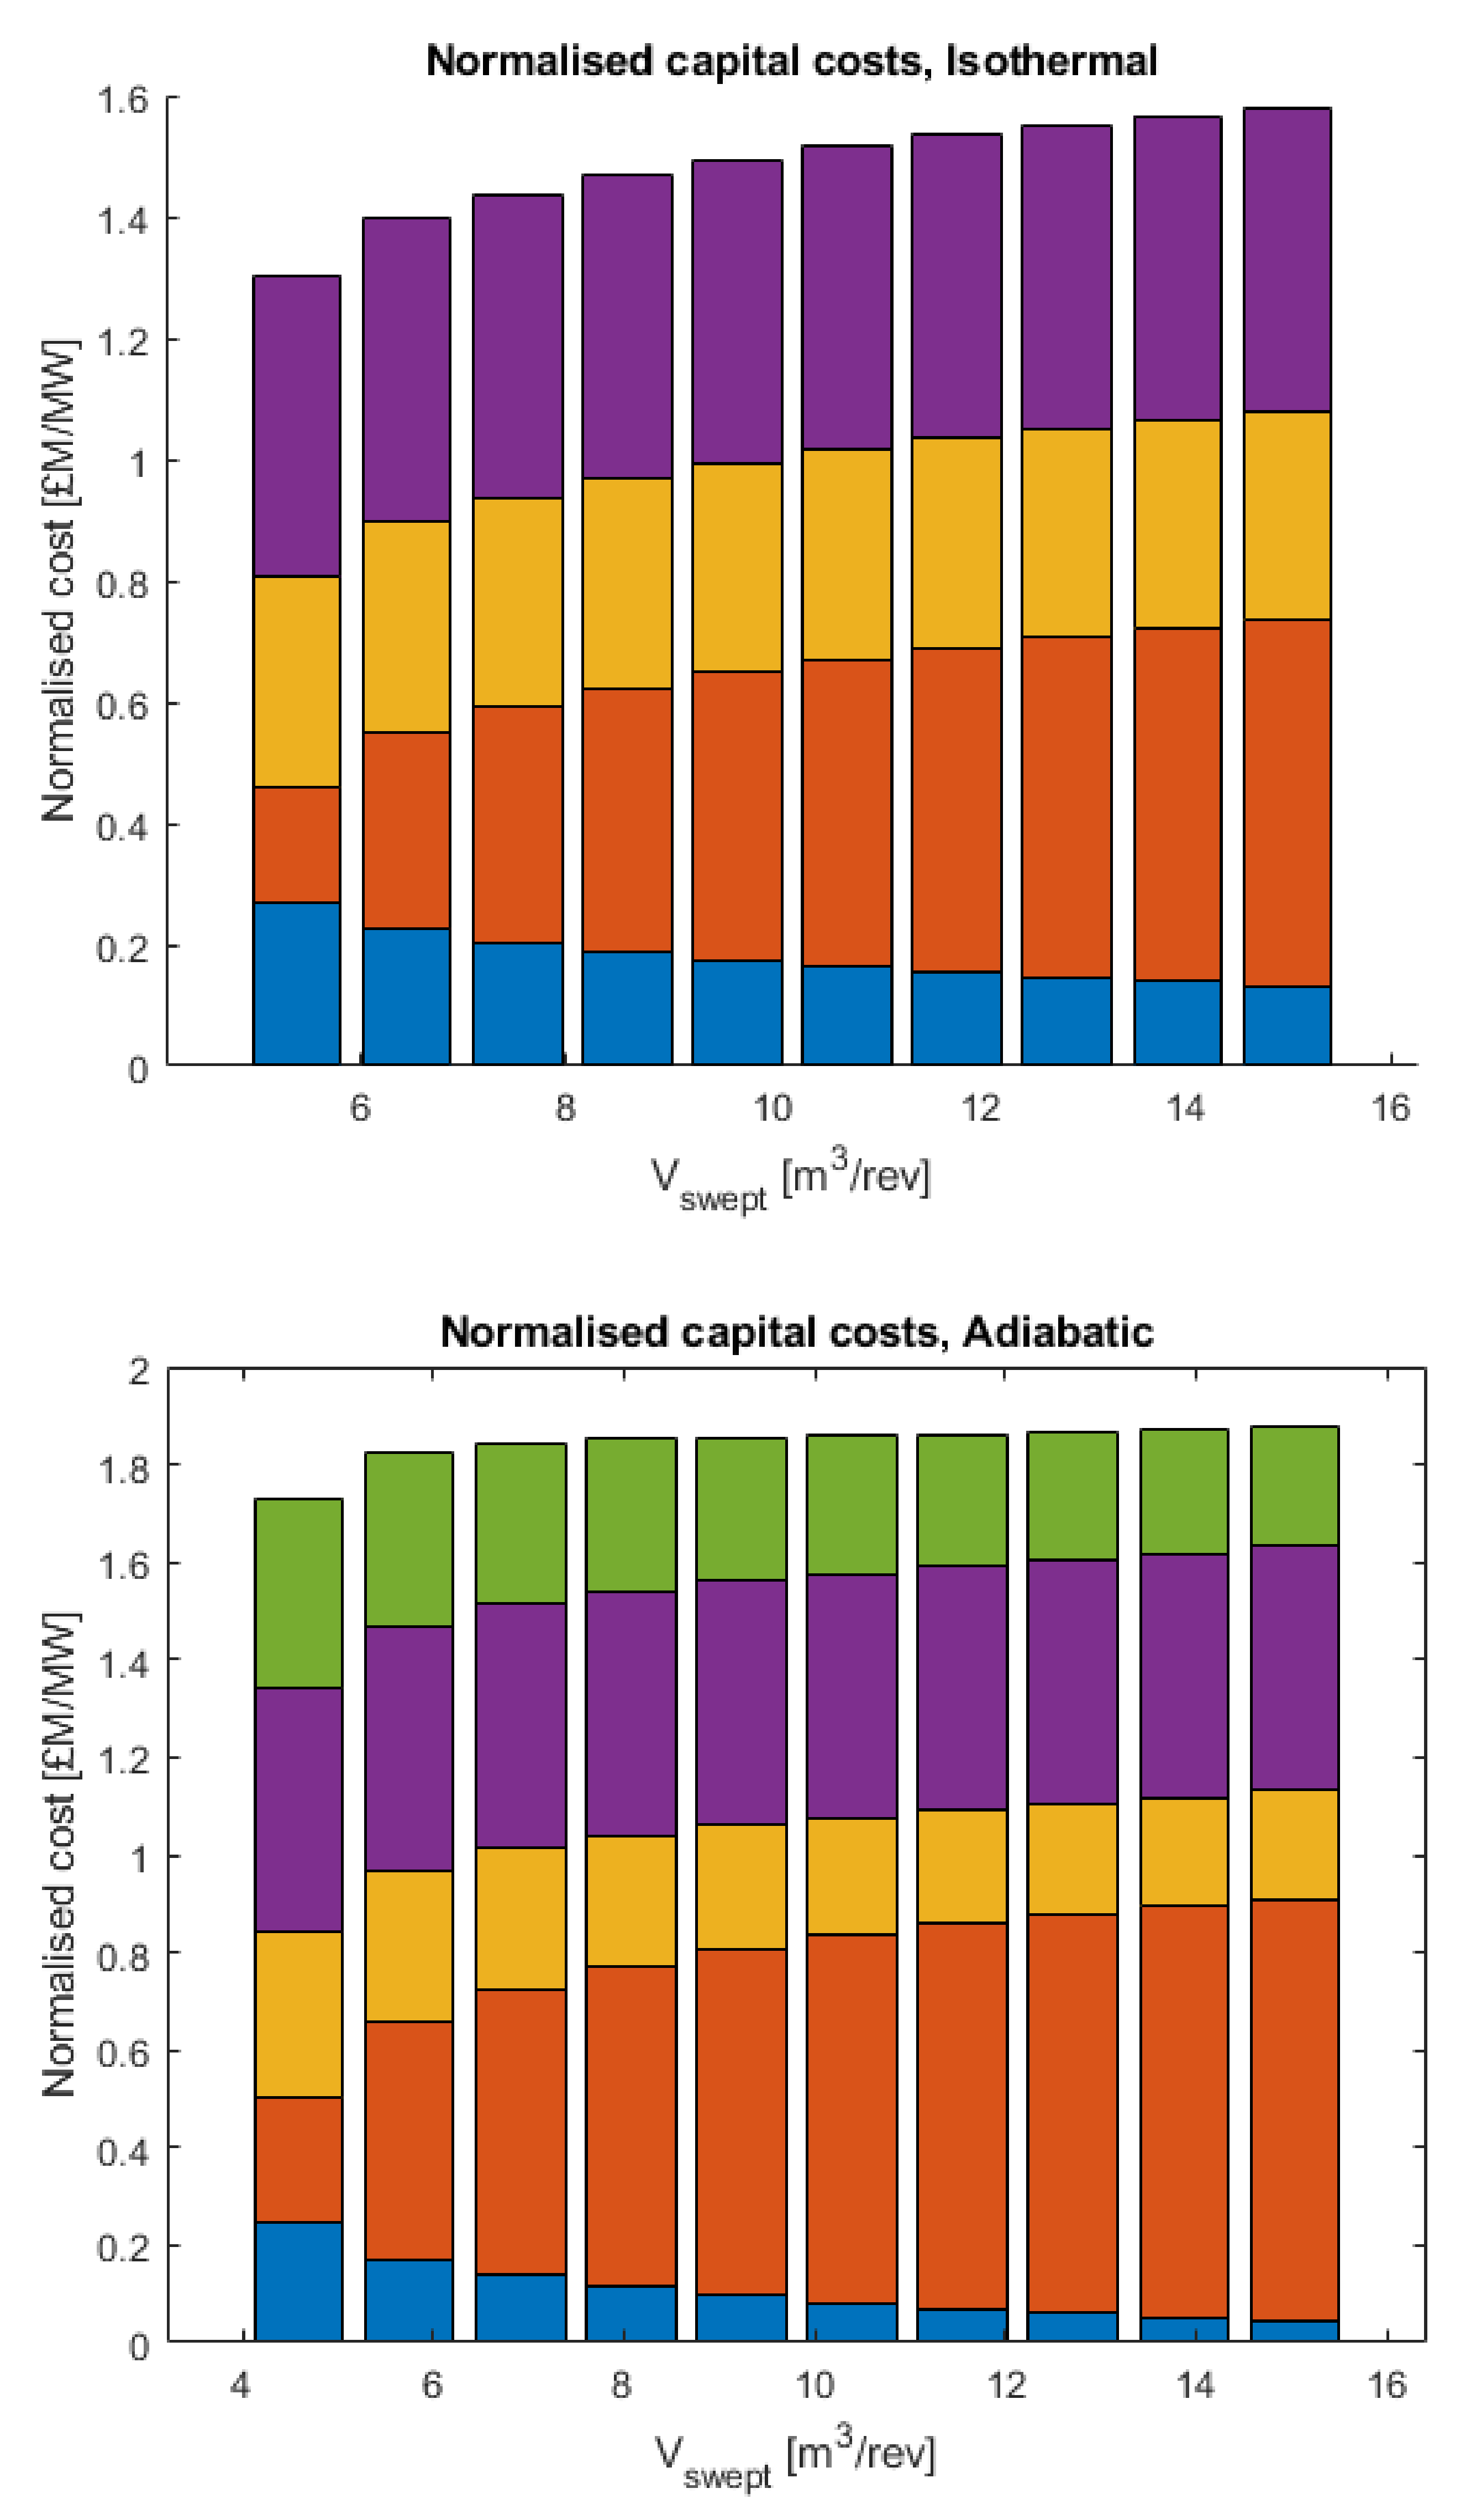
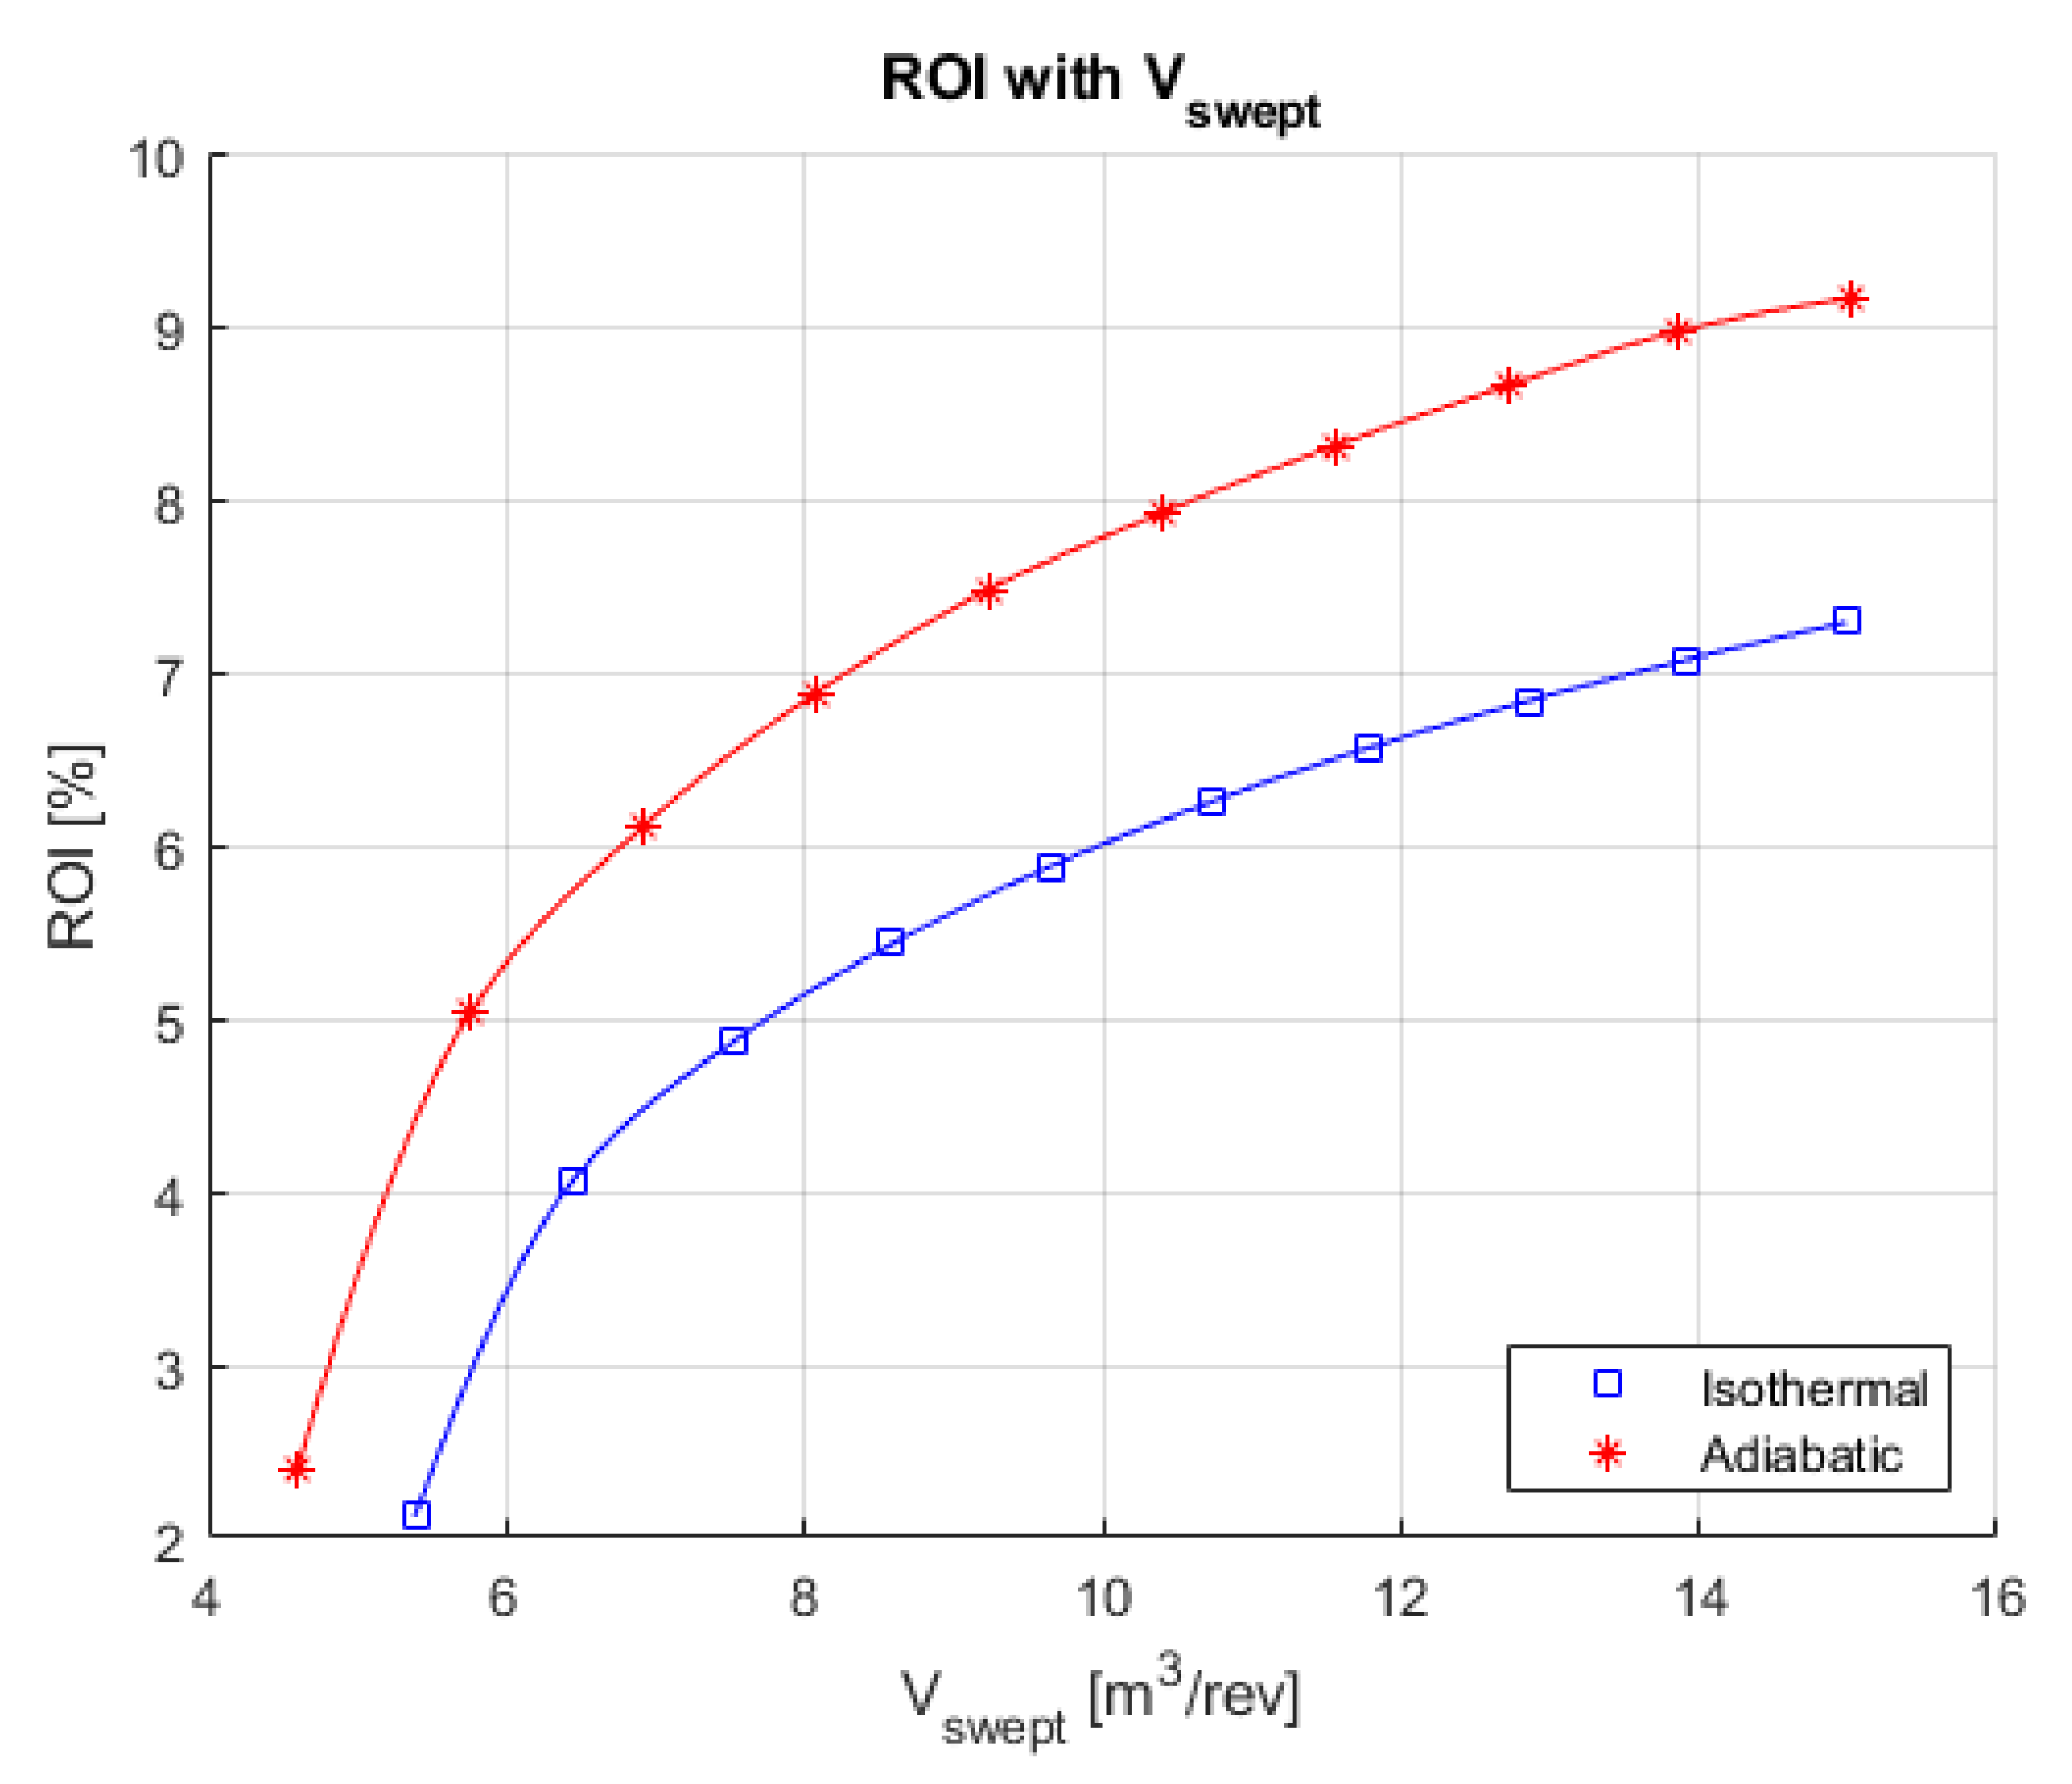
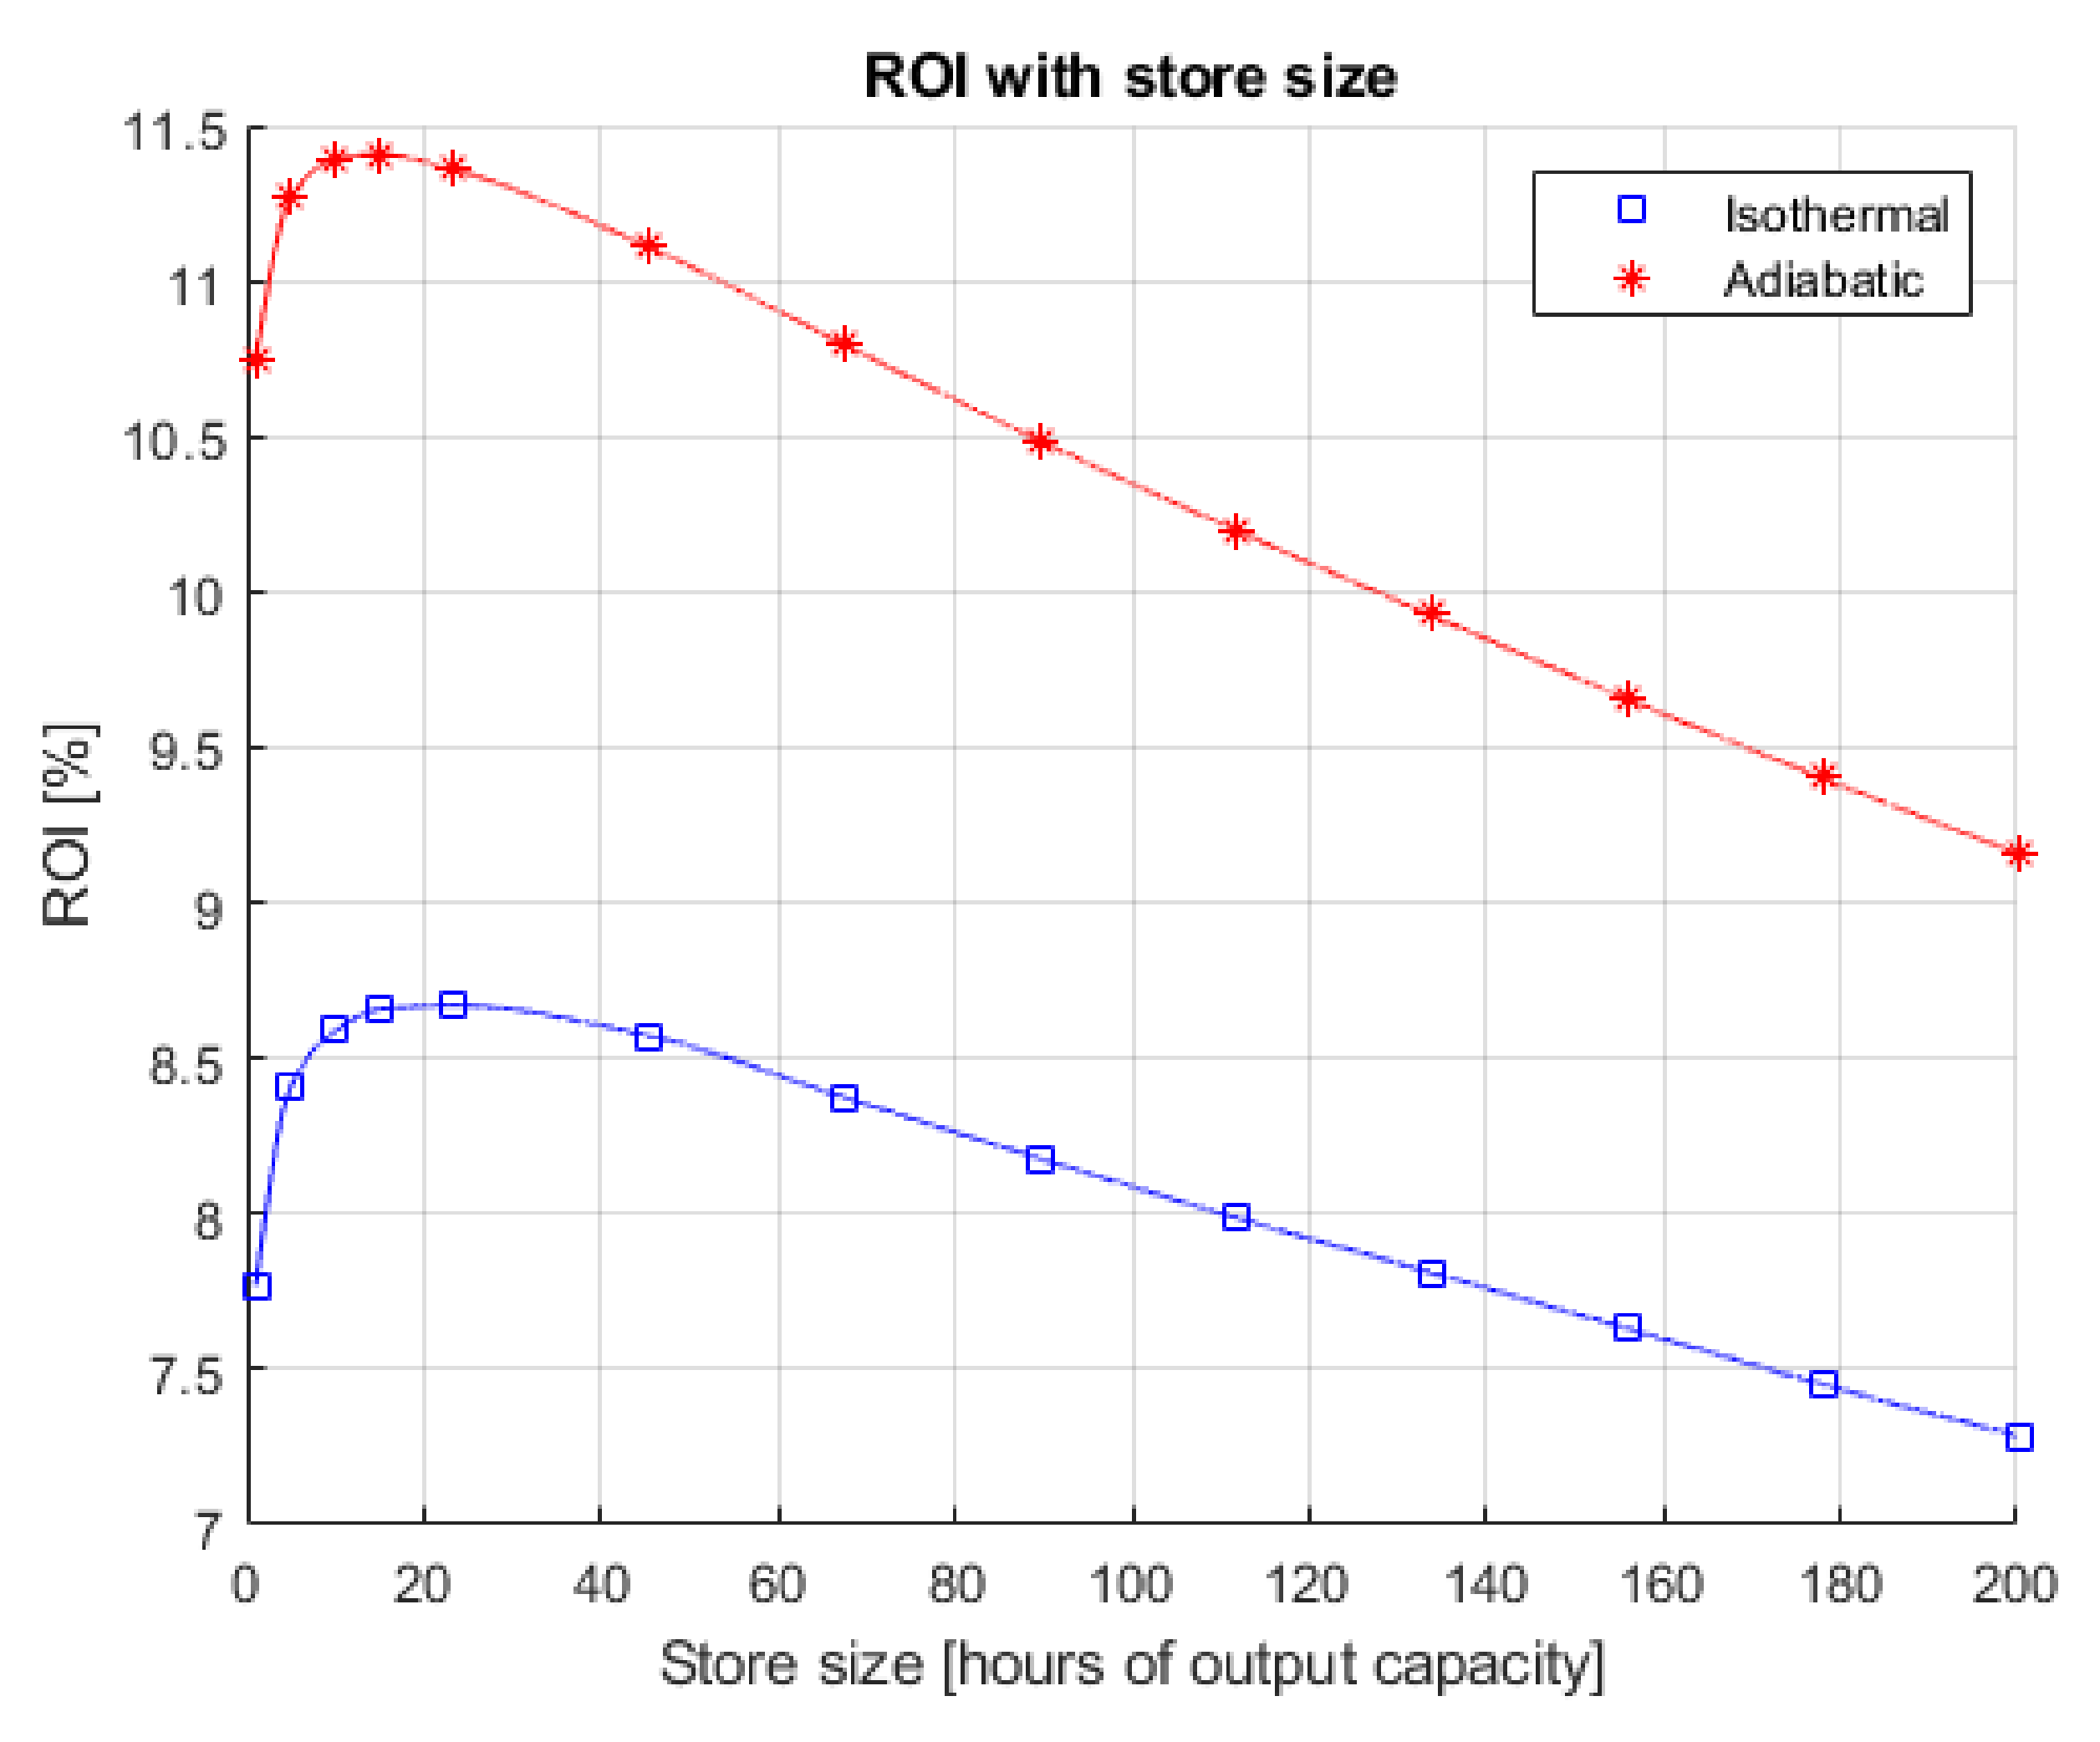
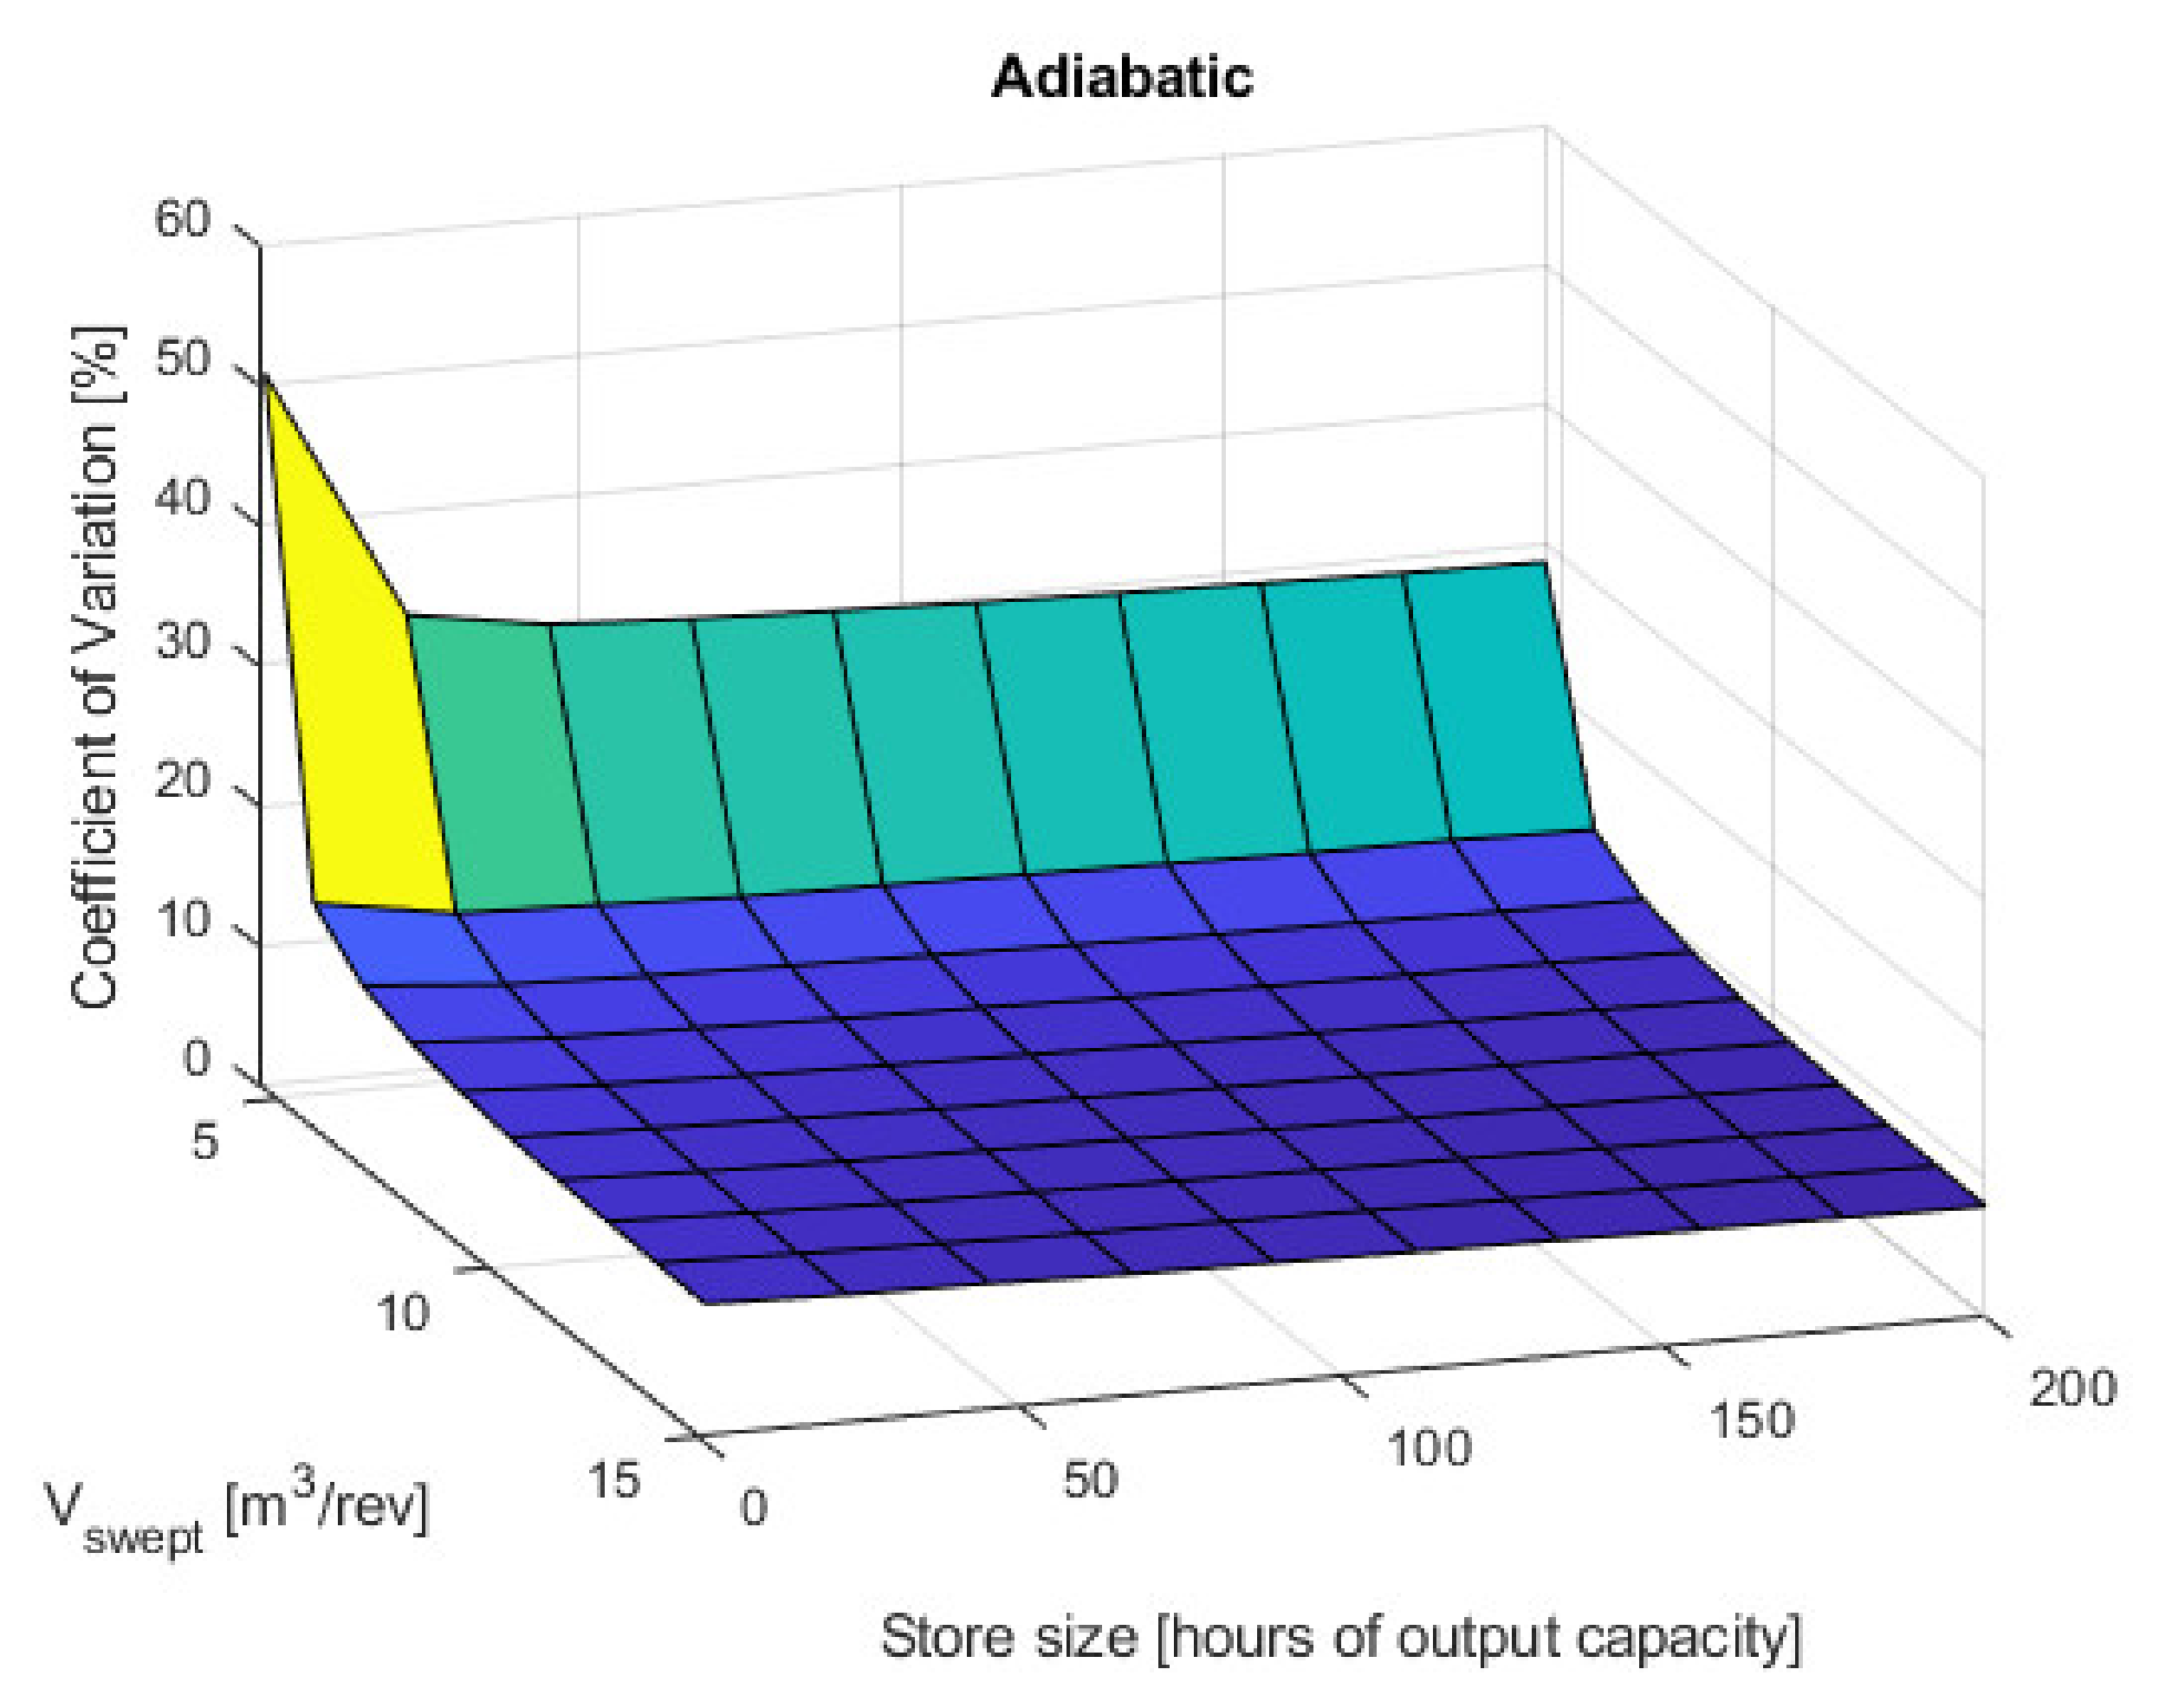
4.3. Results and Discussion
4.4. Validation
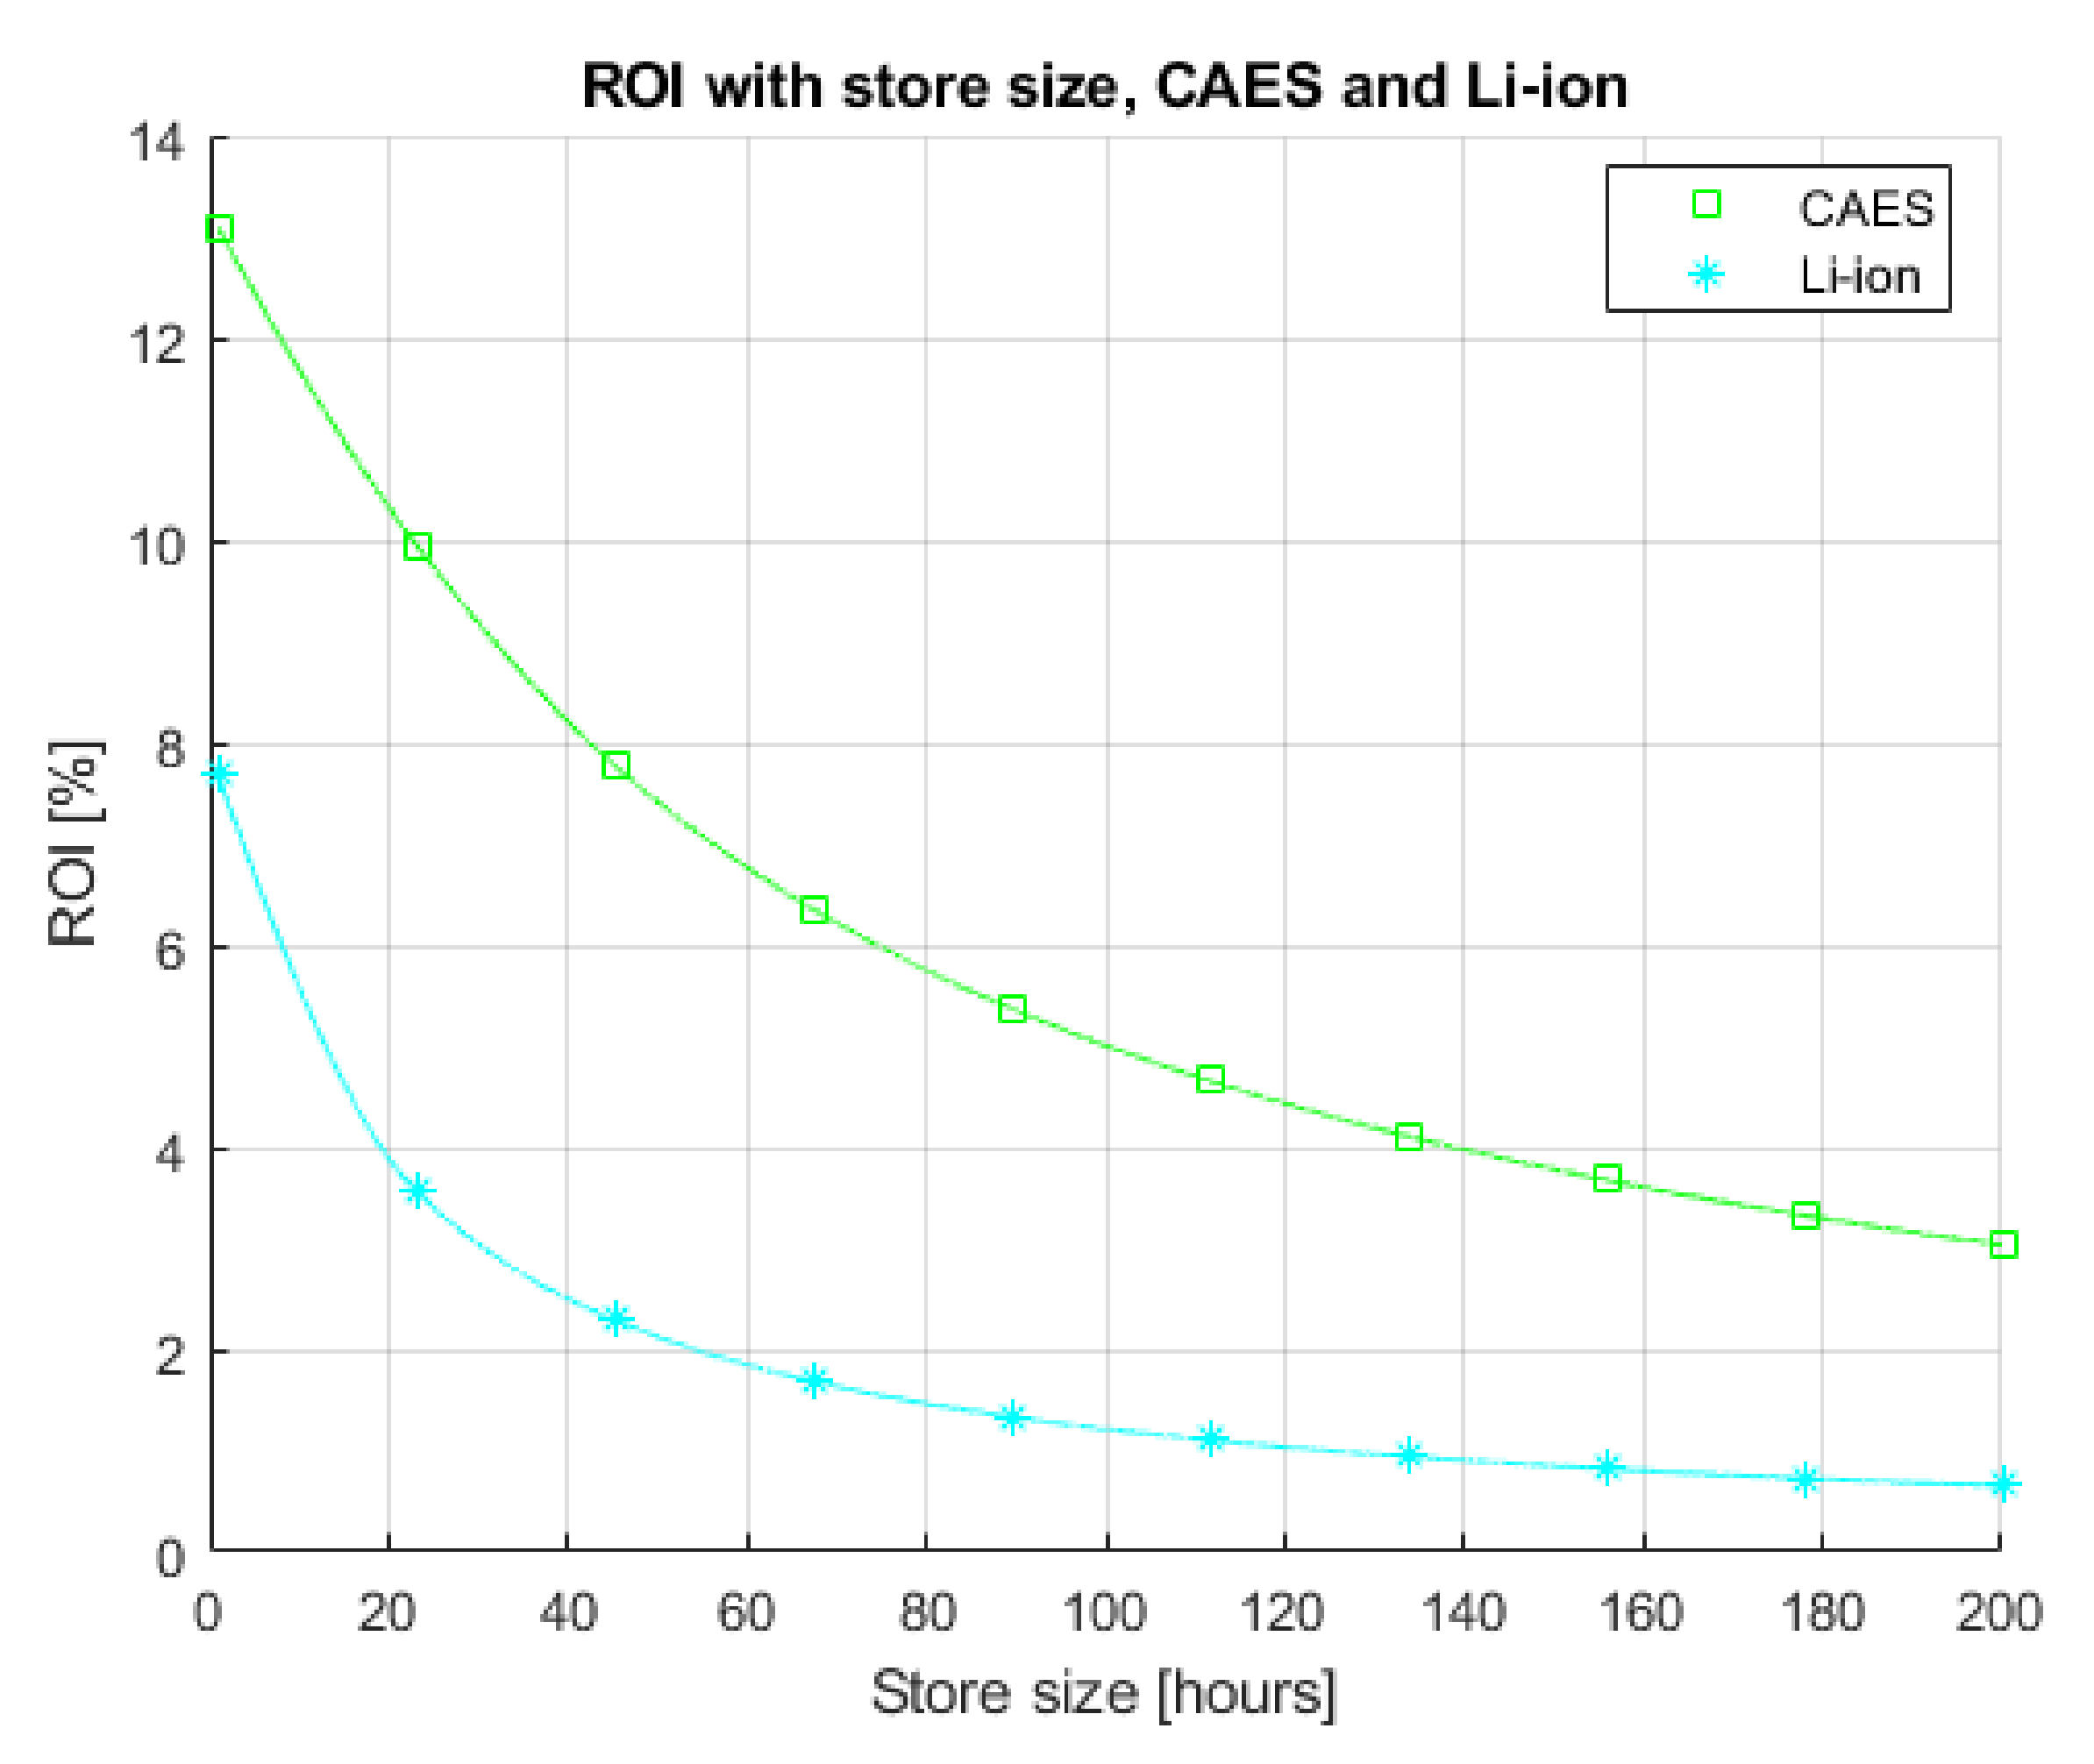
4.5. Comparison with Other Systems
4.6. Capture Value
5. Summary
- The pressure ratio of the grid-powered compressor reduces and the pressure ratio of the wind-driven compressor increases;
- The power ratio between the wind-driven and grid-powered compressors increases; and
- The one-year return on investment of the system increases.
Author Contributions
Funding
Data Availability Statement
Conflicts of Interest
Nomenclature
| C | cost [GBP] |
| D | diameter [m] |
| E | energy [J] |
| f | frequency [1/s] |
| F | force [N] |
| L | length [m] |
| m | mass [kg] |
| p | pressure [bar] |
| P | power [W] |
| r | ratio of pressures |
| T | temperature [K] |
| u | (wind) speed [m/s] |
| V | volume [m3] |
| W | work [J] |
| z | altitude [m] |
| γ | ratio of specific heats |
| η | efficiency |
| κ | Von Kármán constant |
| ω | rotational speed [rad/s] |
| Subscripts and Superscripts | |
| 0 | roughness length |
| 1 | inlet stage 1 (pressure, volume) |
| 2 | outlet stage 1/inlet stage 2 (pressure, volume) |
| 3 | outlet stage 2 (pressure, volume) |
| ADIA | adiabatic |
| G | grid (pressure ratio) |
| Heat | heat (energy) |
| ISO | isothermal |
| opt | optimal (volume) |
| quartz | quartz (mass) |
| ref | reference (temperature) |
| steel | steel (mass) |
| store | thermal store (temperature, volume) |
| swept | swept (volume) per rev |
| T | tension (force) |
| TIP | wind turbine blade tip (speed) |
| turbine | turbine (power) |
| W | wind (pressure ratio) |
| * | friction velocity |
| Abbreviations | |
| AB | anchoring ballast |
| A-CAES | adiabatic compressed air energy storage |
| CAES | compressed air energy storage |
| CfD | contracts for difference |
| COMG | compressor (grid-driven) |
| COMW | compressor (wind-driven) |
| CV | capture value |
| D-CAES | diabatic compressed air energy storage |
| EXP | expander |
| GIES | generation-integrated energy storage |
| HPEB | high-pressure energy bag |
| HXU | heat exchanger unit |
| I-CAES | isothermal compressed air energy storage |
| MIDAS | Met Office Integrated Data Archive System |
| ROI | return on investment |
| SoC | state of charge |
| SU | canvas surface |
| TC | tension cables |
| TES | thermal energy storage |
| TSR | tip-speed ratio |
| UWCAES | underwater compressed air energy storage |
| Wi-DACIS | wind-driven air compression and isobaric storage |
References
- Cárdenas, B.; Swinfen-Styles, L.; Rouse, J.; Garvey, S.D. Short-, Medium-, and Long-Duration Energy Storage in a 100% Renewable Electricity Grid: A UK Case Study. Energies 2021, 14, 8524. [Google Scholar] [CrossRef]
- Garvey, S.D.; Eames, P.C.; Wang, J.H.; Pimm, A.J.; Waterson, M.; MacKay, R.S.; Giulietti, M.; Flatley, L.C.; Thomson, M.; Barton, J.; et al. On Generation-Integrated Energy Storage. Energy Policy 2015, 86, 544–551. [Google Scholar] [CrossRef] [Green Version]
- Dunn, R. A global review of concentrated solar power storage. In Proceedings of the Solar2010, the 48th AuSES Annual Conference, 1–3 December 2010; p. 10. [Google Scholar]
- Bergan, P.G.; Greiner, C.J. A New Type of Large Scale Thermal Energy Storage. Energy Proc. 2014, 58, 152–159. [Google Scholar] [CrossRef] [Green Version]
- Ingersoll, E.; Marcus, D.R. Wind Turbine System. U.S. Patent Application 11/804,704, 28 February 2008. [Google Scholar]
- Garvey, S.D.; Pimm, A.J.; Buck, J.A.; Woolhead, S.; Liew, K.W.; Kantharaj, B.; Garvey, J.E.; Brewster, B.D. Analysis of a Wind Turbine Power Transmission System with Intrinsic Energy Storage Capability. Wind. Eng. 2015, 39, 149–173. [Google Scholar] [CrossRef]
- Salter, S.H.; Rea, M. Hydraulics for Wind. In Proceedings of the European Wind Energy Conference, Hamburg, Germany, 22–26 October 198; pp. 534–541.
- Lee, J.L. On-Demand Generation of Electricity from Stored Wind Energy. U.S. Patent 8,664,793, 4 March 2014. [Google Scholar]
- Ren, Z.; Wang, H.; Chen, G.; Li, X.; Esfarjani, K. Metallic Composite Phase-Change Materials and Methods of Using the Same. U.S. Patent US2014109895A1, 24 April 2014. [Google Scholar]
- Denholm, P.; King, J.C.; Kutcher, C.F.; Wilson, P.P.H. Decarbonizing the Electric Sector: Combining Renewable and Nuclear Energy Using Thermal Storage. Energy Policy 2012, 44, 301–311. [Google Scholar] [CrossRef]
- Swinfen-Styles, L.; Garvey, S.D.; Giddings, D. Combining Wind-Driven Air Compression with Underwater Compressed Air Energy Storage. In Proceedings of the Offshore Energy and Storage Summit (OSES), Brest, France, 10–12 July 2019. [Google Scholar] [CrossRef]
- Wang, J.; Lu, K.; Ma, L.; Wang, J.; Dooner, M.; Miao, S.; Li, J.; Wang, D. Overview of Compressed Air Energy Storage and Technology Development. Energies 2017, 10, 991. [Google Scholar] [CrossRef] [Green Version]
- Rogers, A.; Henderson, A.; Wang, X.; Negnevitsky, M. Compressed Air Energy Storage: Thermodynamic and Economic Review. In Proceedings of the IEEE PES General Meeting|Conference & Exposition, National Harbor, MD, USA, 27–31 July 2014. [Google Scholar] [CrossRef]
- Safaei, H.; Aziz, M.J. Thermodynamic Analysis of Three Compressed Air Energy Storage Systems: Conventional, Adiabatic, and Hydrogen-Fueled. Energies 2017, 10, 1020. [Google Scholar] [CrossRef] [Green Version]
- Dufo-López, R.; Bernal-Agustín, J.L.; Domínguez-Navarro, J.A. Generation Management Using Batteries in Wind Farms: Economical and Technical Analysis for Spain. Energy Policy 2009, 37, 126–139. [Google Scholar] [CrossRef]
- Cavallo, A. Controllable and Affordable Utility-Scale Electricity from Intermittent Wind Resources and Compressed Air Energy Storage (CAES). Energy 2007, 32, 120–127. [Google Scholar] [CrossRef]
- Bennett, J.A.; Simpson, J.G.; Qin, C.; Fittro, R.; Koenig, G.M.; Clarens, A.F.; Loth, E. Techno-Economic Analysis of Offshore Isothermal Compressed Air Energy Storage in Saline Aquifers Co-Located with Wind Power. Appl. Energy 2021, 303, 117587. [Google Scholar] [CrossRef]
- Matsuo, T.; Okazaki, T. A Basic Theory of Induction Heating for a Wind-Powered Thermal Energy System. IEEE Trans. Magn. 2017, 53, 1–5. [Google Scholar] [CrossRef]
- Li, P.Y.; Loth, E.; Simon, T.W.; Van de Ven, J.D.; Crane, S.E. Compressed air energy storage for offshore wind turbines. In Proceedings of the International Fluid Power Exhibition (IFPE), Las Vegas, NV, USA, 23–25 March 2011. [Google Scholar]
- Ribrant, J.; Bertling, L. Survey of Failures in Wind Power Systems with Focus on Swedish Wind Power Plants during 1997–2005. In Proceedings of the IEEE Power Engineering Society General Meeting, Tampa, FL, USA, 24–28 June 2007. [Google Scholar] [CrossRef]
- Ragheb, A.; Ragheb, M. Wind Turbine Gearbox Technologies. In Proceedings of the 1st International Nuclear & Renewable Energy Conference (INREC), Amman, Jordan, 21–24 March 2010. [Google Scholar] [CrossRef] [Green Version]
- Daneshi-Far, Z.; Capolino, G.A.; Henao, H. Review of Failures and Condition Monitoring in Wind Turbine Generators. In Proceedings of the XIX International Conference on Electrical Machines—ICEM, Rome, Italy, 6–8 September 2010. [Google Scholar] [CrossRef]
- Bauer, L.; Matysik, S. Wind-Turbine-Models. Available online: https://en.wind-turbine-models.com/turbines/1419-mhi-vestas-offshore-v164-8.0-mw (accessed on 10 February 2022).
- Smallbone, A.; Jülch, V.; Wardle, R.; Roskilly, A.P. Levelised Cost of Storage for Pumped Heat Energy Storage in Comparison with Other Energy Storage Technologies. Energy Convers. Manag. 2017, 152, 221–228. [Google Scholar] [CrossRef]
- Kim, Y.M.; Shin, D.G.; Favrat, D. Operating Characteristics of Constant-Pressure Compressed Air Energy Storage (CAES) System Combined with Pumped Hydro Storage Based on Energy and Exergy Analysis. Energy 2011, 36, 6220–6233. [Google Scholar] [CrossRef]
- Pimm, A.J.; Garvey, S.D.; Drew, R.J. Shape and Cost Analysis of Pressurized Fabric Structures for Subsea Compressed Air Energy Storage. Proc. Inst. Mech. Eng. Part C J. Mech. Eng. Sci. 2011, 225, 1027–1043. [Google Scholar] [CrossRef]
- Pimm, A.J.; Garvey, S.D.; de Jong, M. Design and Testing of Energy Bags for Underwater Compressed Air Energy Storage. Energy 2014, 66, 496–508. [Google Scholar] [CrossRef]
- Moradi, J.; Shahinzadeh, H.; Khandan, A.; Moazzami, M. A Profitability Investigation into the Collaborative Operation of Wind and Underwater Compressed Air Energy Storage Units in the Spot Market. Energy 2017, 141, 1779–1794. [Google Scholar] [CrossRef]
- Astolfi, M.; Guandalini, G.; Belloli, M.; Hirn, A.; Silva, P.; Campanari, S. Preliminary Design and Performance Assessment of an Underwater CAES System (UW-CAES) for Wind Power Balancing. In Proceedings of the Volume 3: Coal, Biomass, Hydrogen, and Alternative Fuels; Cycle Innovations; Electric Power; Industrial and Cogeneration, Organic Rankine Cycle Power Systems, Phoenix, AZ, USA, 17–21 June 2019. [Google Scholar] [CrossRef]
- Met Office (2012): Met Office Integrated Data Archive System (MIDAS) Land and Marine Surface Stations Data (1853-Current; 2015 Used); NCAS British Atmospheric Data Centre. Available online: https://catalogue.ceda.ac.uk/uuid/dbd451271eb04662beade68da43546e1 (accessed on 20 March 2018).
- Holmes, J.D.; Paton, C.; Kerwin, R. Wind Loading of Structures; CRC Press: Boca Raton, FL, USA, 2007. [Google Scholar] [CrossRef]
- Wieringa, J. Updating the Davenport Roughness Classification. J. Wind. Eng. Ind. Aerodyn. 1992, 41, 357–368. [Google Scholar] [CrossRef]
- Google. Google Maps. Available online: https://www.google.com/maps (accessed on 20 March 2018).
- Databayou. World Ocean Depth Map. 2021. Available online: https://databayou.com/ocean/depth.html (accessed on 25 November 2021).
- ENTSO-E Transparency Platform. UK Day-Ahead Electricity Prices. Online Dataset. Available online: https://transparency.entsoe.eu/dashboard/show (accessed on 20 June 2020).
- Connolly, D.; Lund, H.; Finn, P.; Mathiesen, B.V.; Leahy, M. Practical Operation Strategies for Pumped Hydroelectric Energy Storage (PHES) Utilising Electricity Price Arbitrage. Energy Policy 2011, 39, 4189–4196. [Google Scholar] [CrossRef] [Green Version]
- Pelay, U.; Luo, L.; Fan, Y.; Stitou, D.; Rood, M. Thermal Energy Storage Systems for Concentrated Solar Power Plants. Renew. Sustain. Energy Rev. 2017, 79, 82–100. [Google Scholar] [CrossRef]
- Safaei, H.; Keith, D.W.; Hugo, R.J. Compressed Air Energy Storage (CAES) with Compressors Distributed at Heat Loads to Enable Waste Heat Utilization. Appl. Energy 2013, 103, 165–179. [Google Scholar] [CrossRef]
- Arsalis, A. Thermoeconomic Modeling and Parametric Study of Hybrid SOFC–Gas Turbine–Steam Turbine Power Plants Ranging from 1.5 to 10MWe. J. Power Sources 2008, 181, 313–326. [Google Scholar] [CrossRef]
- Akrami, E.; Chitsaz, A.; Nami, H.; Mahmoudi, S.M.S. Energetic and Exergoeconomic Assessment of a Multi-Generation Energy System Based on Indirect Use of Geothermal Energy. Energy 2017, 124, 625–639. [Google Scholar] [CrossRef]
- Luyben, W.L. Capital Cost of Compressors for Conceptual Design. Chem. Eng. Processing Process Intensif. 2018, 126, 206–209. [Google Scholar] [CrossRef]
- Mashimo, T.; Ariga, I.; Sakai, T.; Watanabe, I. On the Performance Prediction of a Centrifugal Compressor Scaled Up. In Proceedings of the Volume 1: Turbomachinery, London, UK, 18–22 April 1982. [Google Scholar] [CrossRef] [Green Version]
- Chen, H. Size and Reynolds Number Effects on Compressor Performance and Scaling. In Proceedings of the Volume 2E: Turbomachinery, Virtual, Online, 21–25 September 2020. [Google Scholar] [CrossRef]
- Ebadollahi, M.; Rostamzadeh, H.; Ghaebi, H.; Amidpour, M. Exergoeconomic Analysis and Optimization of Innovative Cascade Bi-Evaporator Electricity/Cooling Cycles with Two Adjustable Cooling Temperatures. Appl. Therm. Eng. 2019, 152, 890–906. [Google Scholar] [CrossRef]
- Aali, A.; Pourmahmoud, N.; Zare, V. Exergoeconomic Analysis and Multi-Objective Optimization of a Novel Combined Flash-Binary Cycle for Sabalan Geothermal Power Plant in Iran. Energy Convers. Manag. 2017, 143, 377–390. [Google Scholar] [CrossRef]
- Weiner, D.; Shnaid, I. Second-Law Analysis of a Compressed Air Energy Storage (CAES) System. In Proceedings of the Volume 4: Heat Transfer; Electric Power; Industrial and Cogeneration, Cologne, Germany, 1–4 June 1992. [Google Scholar] [CrossRef]
- Courtois, N.; Najafiyazdi, M.; Lotfalian, R.; Boudreault, R.; Picard, M. Analytical Expression for the Evaluation of Multi-Stage Adiabatic-Compressed Air Energy Storage (A-CAES) Systems Cycle Efficiency. Appl. Energy 2021, 288, 116592. [Google Scholar] [CrossRef]
- Houssainy, S.; Janbozorgi, M.; Kavehpour, P. Thermodynamic Performance and Cost Optimization of a Novel Hybrid Thermal-Compressed Air Energy Storage System Design. J. Energy Storage 2018, 18, 206–217. [Google Scholar] [CrossRef]
- Steward, D.; Saur, G.; Penev, M.; Ramsden, T. Lifecycle Cost Analysis of Hydrogen Versus Other Technologies for Electrical Energy Storage; Technical Report; NREL: Golden, CO, USA, 2009. [Google Scholar]
- Argyrou, M.C.; Christodoulides, P.; Kalogirou, S.A. Energy Storage for Electricity Generation and Related Processes: Technologies Appraisal and Grid Scale Applications. Renew. Sustain. Energy Rev. 2018, 94, 804–821. [Google Scholar] [CrossRef]
- Jansen, M.; Staffell, I.; Kitzing, L.; Quoilin, S.; Wiggelinkhuizen, E.; Bulder, B.; Riepin, I.; Müsgens, F. Offshore Wind Competitiveness in Mature Markets without Subsidy. Nat. Energy 2020, 5, 614–622. [Google Scholar] [CrossRef]
- Impacts of Inter-Annual Wind and Solar Variations on the European Power System. Joule 2018, 2, 2076–2090. [CrossRef] [Green Version]


| MHI Vestas V164-8.0 MW Turbine | |||
|---|---|---|---|
| Name of Parameter | Parameter | Value | Units |
| Swept Diameter | D | 164 | m |
| Tip-speed | - | 104 | m/s |
| Rated windspeed | uR | 13 | m/s |
| Cut-in speed | - | 4 | m/s |
| Cut-out speed | - | 25 | m/s |
| Tip-speed ratio | TSR | 8 | - |
| Rotational speed | ω | 1.27 | rad/s |
| Rotational frequency | f | 0.20 | rotations/s |
| Name of Parameter | Parameter | Value(s) | Units |
|---|---|---|---|
| Main compressor swept volume | Vswept | ~5–15 | m3/rev |
| Maximum pressure | p2 | 200 | bar |
| High-pressure store size | - | 1–200 | hours |
| Machine | Cost Range (Nominal Value) (GBP/kW) |
|---|---|
| COMG | 200–400 (300) |
| COMW | 800–1200 (1000) |
| EXP | 300–700 (500) |
| Machine | Efficiency Range, η (Nominal Value) |
|---|---|
| COMG | 0.8–1.0 (0.9) |
| COMW | 1 * |
| EXP | 0.8–1.0 (0.9) |
| HPEB | 0.98 |
Publisher’s Note: MDPI stays neutral with regard to jurisdictional claims in published maps and institutional affiliations. |
© 2022 by the authors. Licensee MDPI, Basel, Switzerland. This article is an open access article distributed under the terms and conditions of the Creative Commons Attribution (CC BY) license (https://creativecommons.org/licenses/by/4.0/).
Share and Cite
Swinfen-Styles, L.; Garvey, S.D.; Giddings, D.; Cárdenas, B.; Rouse, J.P. Analysis of a Wind-Driven Air Compression System Utilising Underwater Compressed Air Energy Storage. Energies 2022, 15, 2142. https://doi.org/10.3390/en15062142
Swinfen-Styles L, Garvey SD, Giddings D, Cárdenas B, Rouse JP. Analysis of a Wind-Driven Air Compression System Utilising Underwater Compressed Air Energy Storage. Energies. 2022; 15(6):2142. https://doi.org/10.3390/en15062142
Chicago/Turabian StyleSwinfen-Styles, Lawrie, Seamus D. Garvey, Donald Giddings, Bruno Cárdenas, and James P. Rouse. 2022. "Analysis of a Wind-Driven Air Compression System Utilising Underwater Compressed Air Energy Storage" Energies 15, no. 6: 2142. https://doi.org/10.3390/en15062142
APA StyleSwinfen-Styles, L., Garvey, S. D., Giddings, D., Cárdenas, B., & Rouse, J. P. (2022). Analysis of a Wind-Driven Air Compression System Utilising Underwater Compressed Air Energy Storage. Energies, 15(6), 2142. https://doi.org/10.3390/en15062142