Article

Analysis of Fluid-Structure Coupling Dynamic Characteristics of Centrifugal Pump Rotor System

1
National Research Center of Pumps, Jiangsu University, Zhenjiang 212013, China
2
Institute of Fluid Engineering Equipment, Jiangsu Industrial Technology Research Institute, Jiangsu University, Zhenjiang 212013, China
*
Author to whom correspondence should be addressed.
Energies 2022, 15(6), 2133; https://doi.org/10.3390/en15062133
Submission received: 10 February 2022 / Revised: 7 March 2022 / Accepted: 10 March 2022 / Published: 15 March 2022

Abstract

:
Safety and reliable operation is one of the most important research areas for centrifugal pump systems, due to the interaction of complex flow, large structural load, and vibration caused by the operation of the impeller. To analyze the internal flow and impeller deformation of the centrifugal pump, the single-stage single-suction centrifugal pump titled IS100-80-160 was selected as the research object. Under the principle of single variable, the turbulent flow and structural response of three impellers designed by different parameters were calculated by CFX and ANSYS Workbench. A numerical simulation of steady flow at different flow rates of the centrifugal pump was carried out, and its hydraulic performance is consistent with the corresponding experimental results. By comparing the deformation of the impeller rotor system, it was found that the closed impeller has the worst stability with the best hydraulic performance; the impeller with split blades has the worst stability with the best hydraulic performance. This study could enhance the understanding of impeller FSI on centrifugal pump stability and provide a reference for improving the operational stability of centrifugal pumps.

1. Introduction

As important liquid transporting equipment in hydraulic systems, centrifugal pumps have been widely used in national economic fields such as agricultural irrigation, water transfer projects, petroleum, and chemical engineering [1,2]. There is a high standard for safety and reliable operation of centrifugal pumps in these important areas [3]. Meanwhile, the centrifugal pump operates an off-design, where the inner flow inside the pump becomes unstable and complex. At the same time, a variety of unstable factors such as cavitation, stator-rotor interaction, rotating stall, and backflow [4,5], lead to poor pumping, suction performances, wild vibration, and noise.
In particular, when the centrifugal pump runs at low flow rates, the unstable flow will trigger hydraulic excitation, induce vibration and noise in the pump system, and threaten the stable operation of the centrifugal pump, even damaging the centrifugal pump impeller, hydraulic seal, and other equipment. Therefore, it is necessary to study the fluid-structure interaction between the flowing fluid and the flowing components in the centrifugal pump.
With respect to the research into unsteady flow in the centrifugal pump, more and more researchers have given their attention to studying the influence of the impeller on the inner flow characteristics and the pressure pulsation analysis of the vibration [6,7,8,9]. For example, Cui proposed a cutting method for a straight blade trailing edge in order to improve unsteady flow and vibration in centrifugal pumps [10]. Zhang et al. pointed out that rotor–stator interaction is the main cause of high amplitude pressure pulsation and flow-induced vibration in centrifugal pumps [11]. To predict the vibration under certain flow rates, Birajdar et al. proposed a one-way fluid-structure interaction method, and this vibration was significantly correlated with experimental data [12]. Wu et al. explored a numerical study of the unsteady flow field and structural properties of a centrifugal pump by using a two-way coupling fluid-structure interaction simulation method [13]. Zhou et al. applied a two-way coupling method to define the structural response or rotor. The flow field and structural response were calculated by using a joint turbulent flow calculation method. Based on fluid-structure coupling and stress-strain analysis, Zhang et al. conducted pressure pulsation analysis on vertical axial flow pumps. It provided an important theoretical basis for the optimal design and safe operation of vertical axial flow pumps [14,15]. Huang et al. explored the cause of rotor stress-strain on the centrifugal pump [16,17,18]. The deformation and stress distribution in the impeller was calculated by using FSI simulation. The blade deformation and stress were analyzed to determine the critical region of the structure. The results ensure the reliability of the pump device [19]. The impellers were analyzed by static and modal analysis [20]. By analyzing the flow mechanism of the split blade impeller centrifugal pump, Li Guowei revealed the distribution law of the speed and pressure in the centrifugal pump. The results show that the splitter blade is beneficial to improve the uniformity of velocity and pressure distribution in a centrifugal pump [21].
Based on the review on the unsteady flow as reported by the open literature, the previous research focused on the backflow and cavitation of pumps. However, few works have been reported on fluid-structure interaction and vibration characteristics which are induced by backflow in a centrifugal pump. In the present study, the ANSYS Workbench simulation platform was applied to simulate the centrifugal impeller structure. The vibration characteristics of the structural system and the modal analysis of different impeller rotating systems were obtained through with one-way fluid-structure interaction method. In addition, the velocity and pressure distribution were analyzed for the inlet backflow of centrifugal pump, and the inlet flow states of different impellers were obtained. A closed hydraulic test rig was designed and built to test the hydraulic performance, and the performance curve was obtained and compared with the curve obtained by numerical simulation.

2. Numerical Method and Strategy

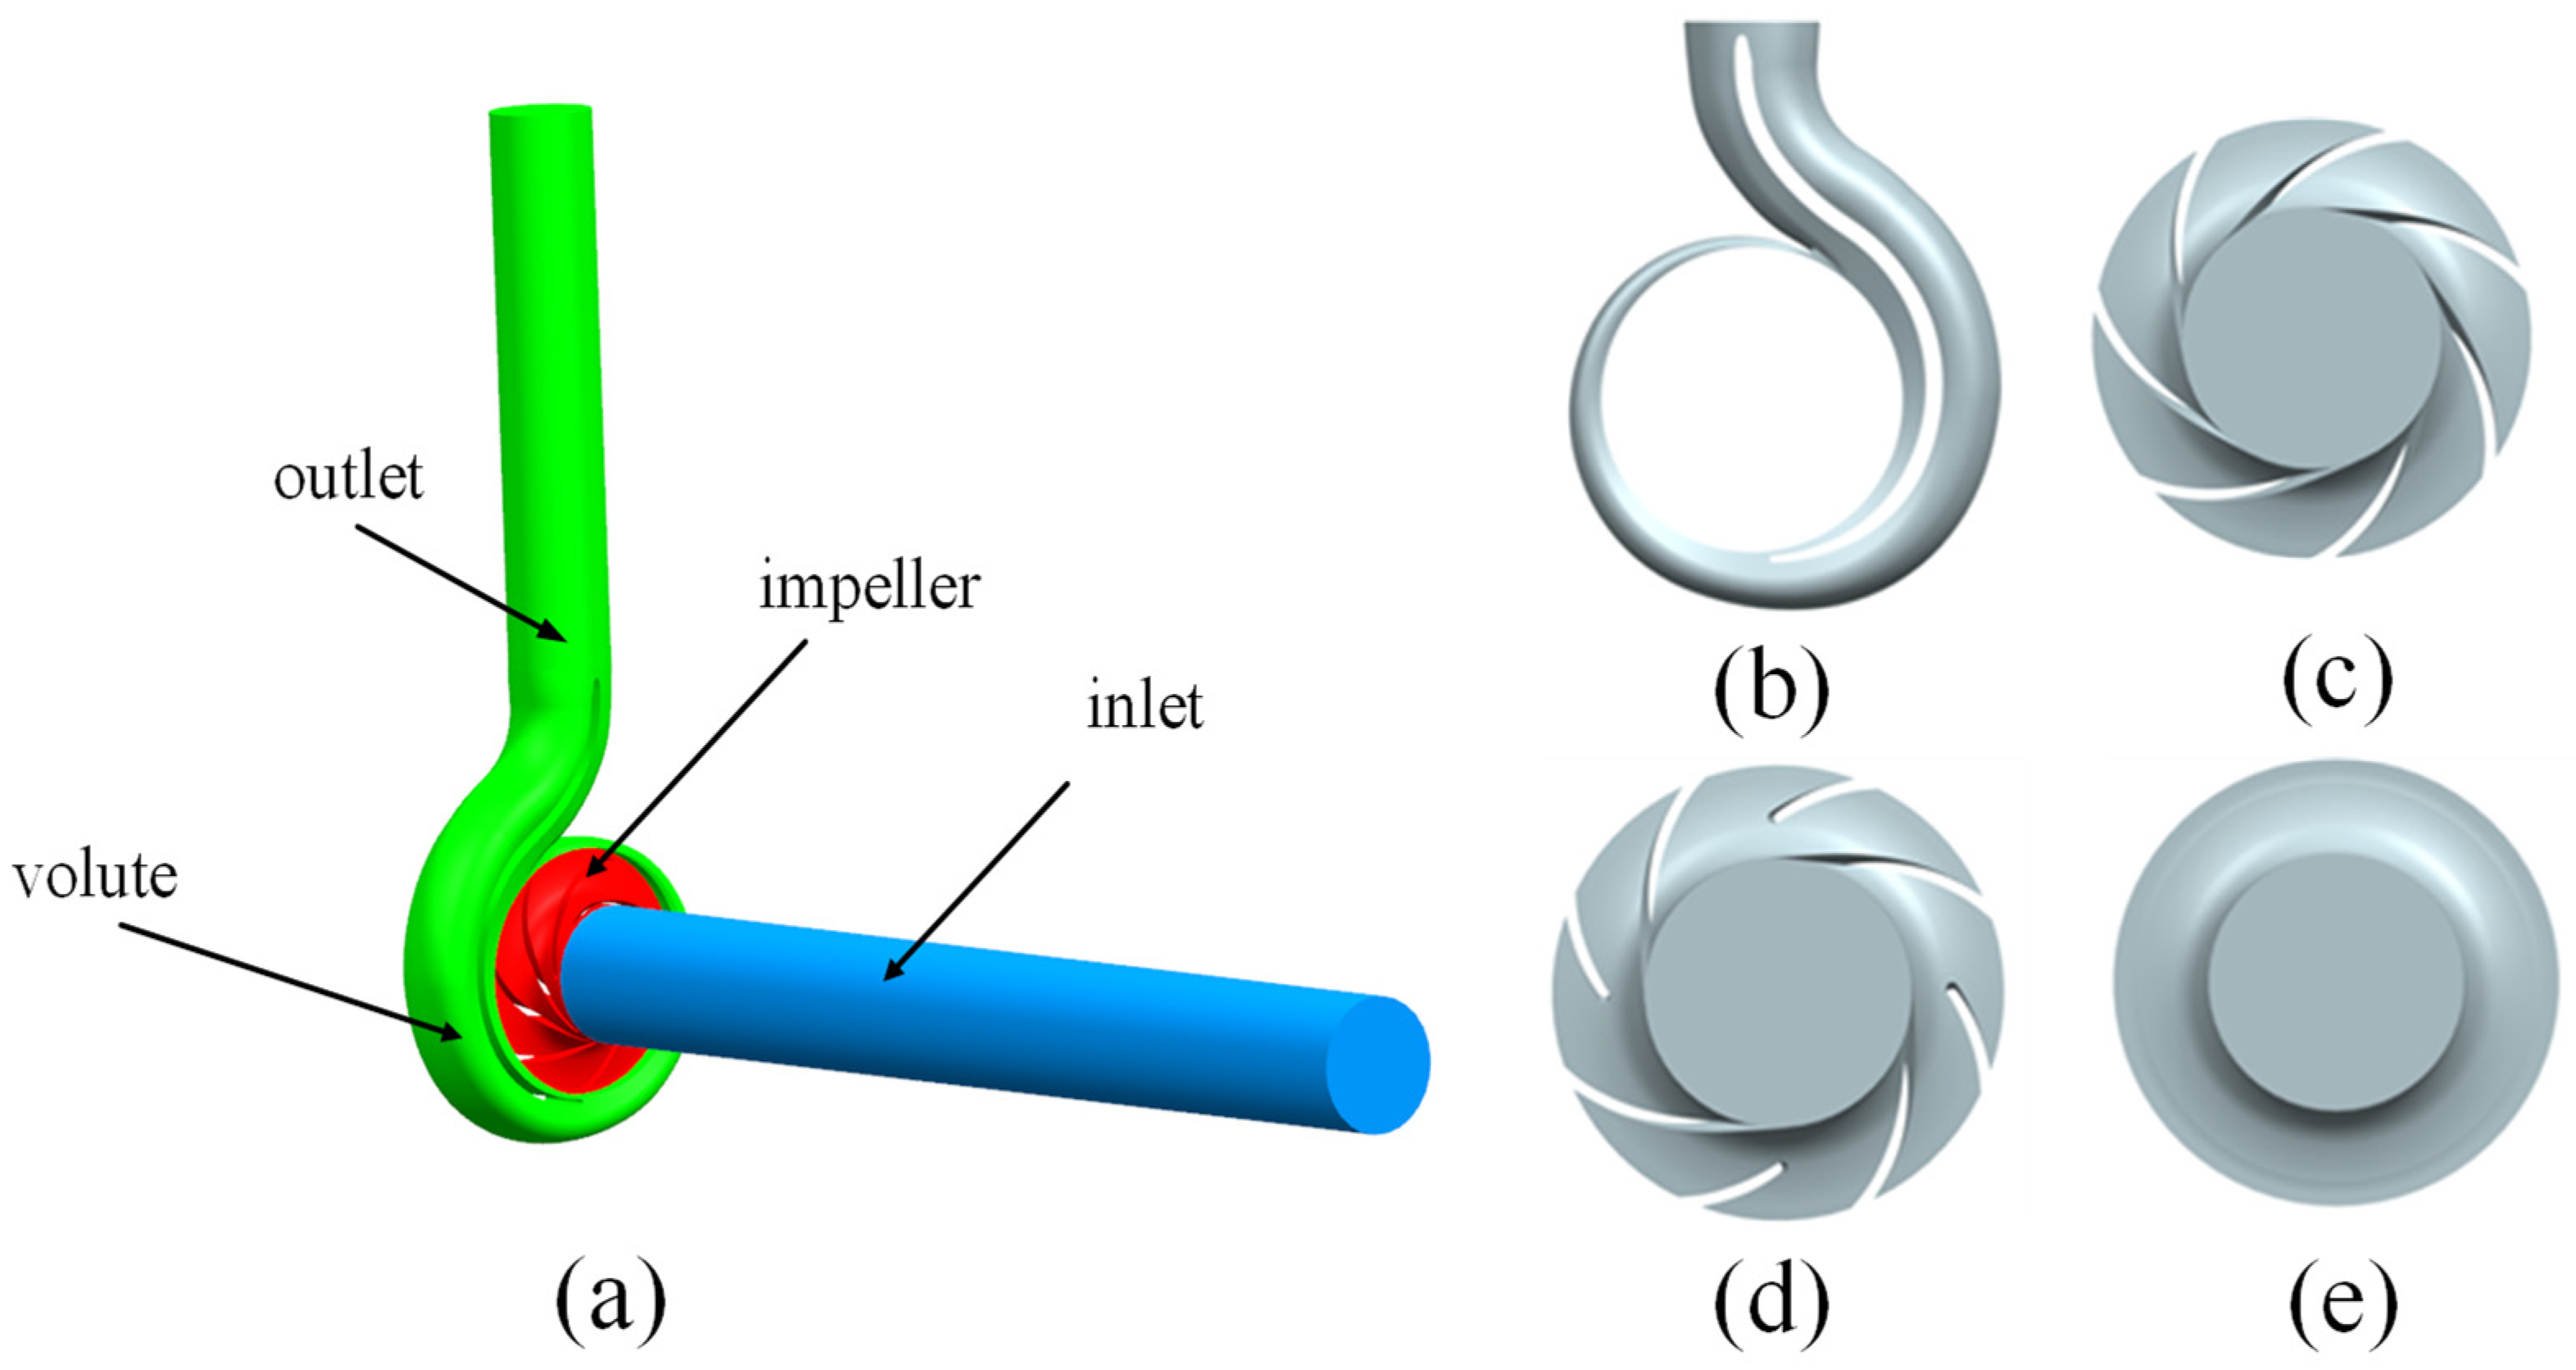
2.1. Parameters of Centrifugal Pump

A single-stage single-suction centrifugal pump was chosen in the present research. Three different impeller structures were designed and classified as Case A, Case B, and Case C.
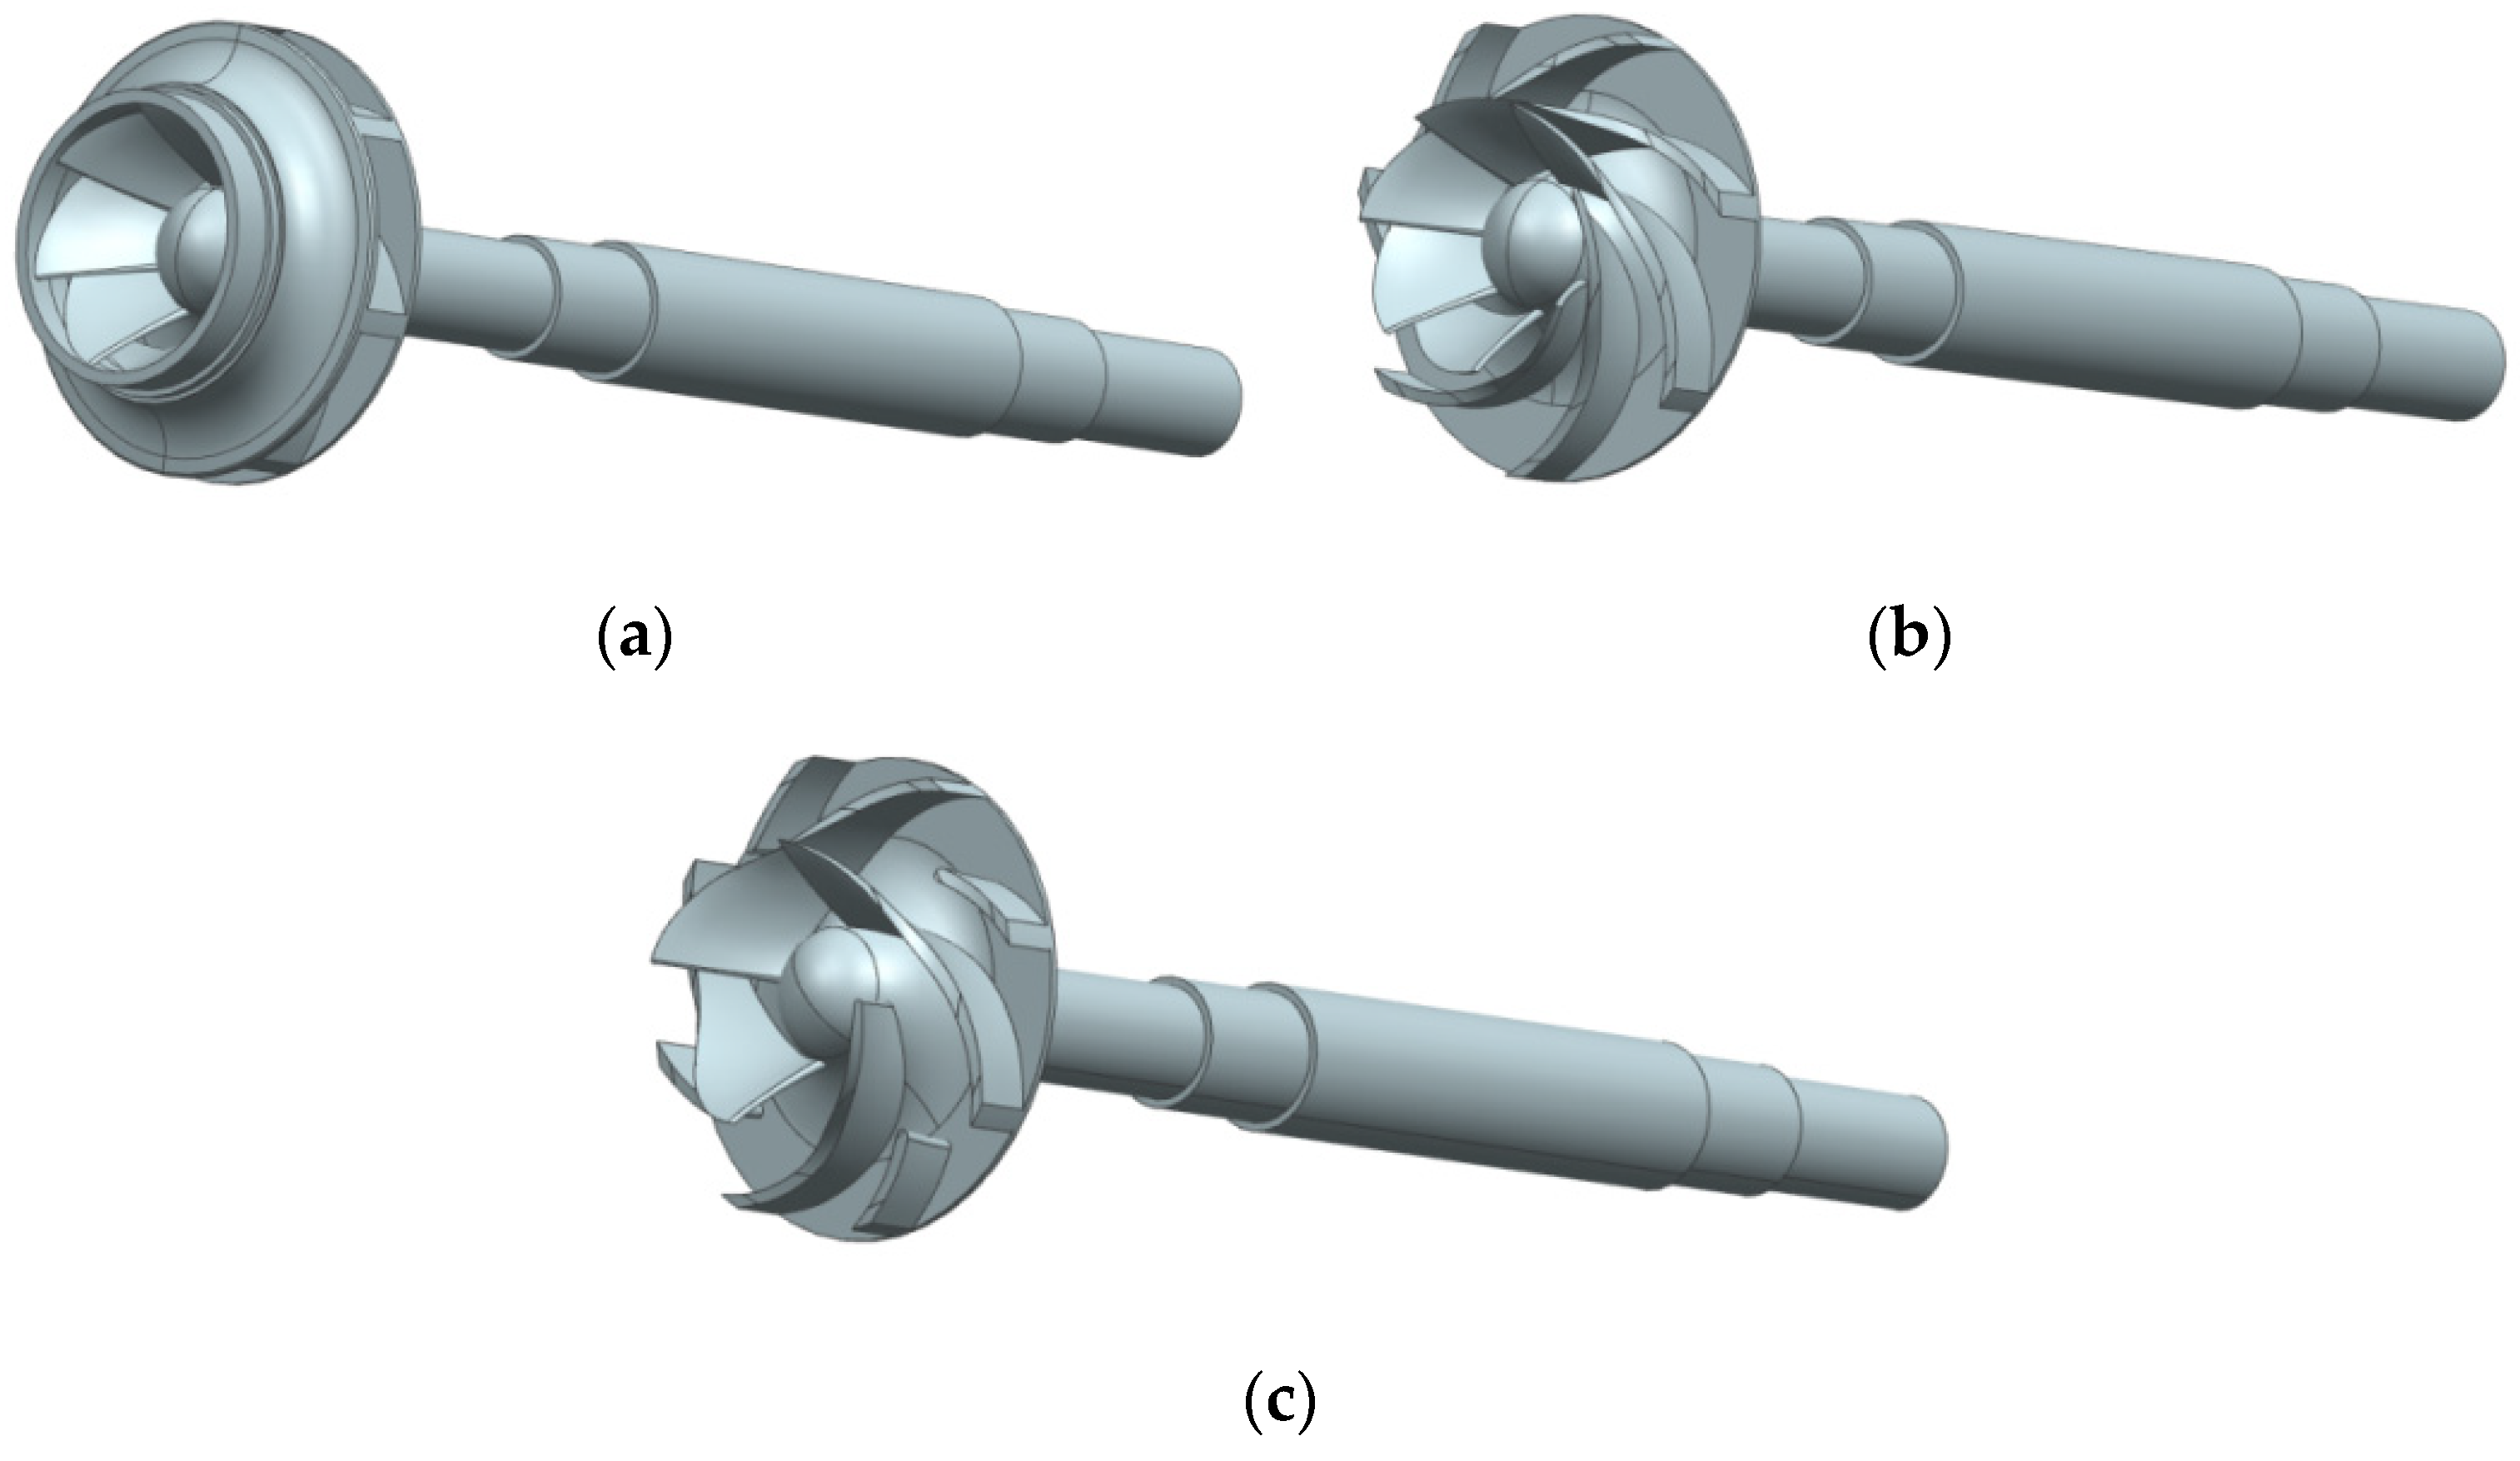
  • Pump Case A: closed impeller.
  • Pump Case B: semi-open impeller.
  • Pump Case C: impeller with split blades.
The main parameters of the centrifugal pump are shown in Table 1.
The whole computational domain included: inlet pipe, pump casing, impeller, volute, outlet pipe. The 3D software Unigraphics NX (UG) was used to model all the flow parts. The inlet and outlet boundaries are extended during modeling to eliminate the interference of the physical model on the numerical calculation. The inlet pipe was extended by 800 m about eight times the inlet diameter, and the outlet pipe is extended by 320 mm, about four times of the inlet diameter. The whole model is shown in Figure 1.

2.2. Division of Computational Grid

The grids used in this study were generated in ICEM CFD. In order to ensure the accuracy of the numerical simulation, six sets of grids with different numbers were applied for the grid-independence check, with the results shown in Table 2. To select the appropriate number of grid cells, the deviation between prediction and experiment heads in six sets of different grid cell numbers was compared. It can be seen that the head deviation corresponding to the fourth set of grids is 2.17%, which is close to the experimental value, and the deviation value is stable as the number of grids continues to increase. Considering the limited computational resources and lower time consumption, the fourth set of grids was selected for subsequent calculations. The head of six computational grids under design conditions is shown in Figure 2.
Numerical calculations were performed by ANSYS-CFX17.0 software. Considering the flow in the centrifugal pump, the renormalization-group (RNG) k-ε turbulence model is chosen as it is concise, reliable, easy to build, has excellent performance, and is widely applicable [22].
In the RNG   k - ε model, the turbulence viscosity coefficient μ t is expressed as follows.
μ t = ρ C μ k 2 ε
where C μ is the empirical coefficient.
Turbulent kinetic energy k and dissipation rate ε are expressed as
k = 1 2 u i u i ¯
ε = μ ρ u i x j u i x j ¯
The dissipation equation of turbulent kinetic energy is:
( ρ U j ε ) x j = x j [ ( μ + μ t σ ε R N G ) ε x j ] + ε k ( C ε 1 R N G P k C ε 2 R N G ρ ε + C ε 1 R N G P ε b )
where: σ ε R N G = 0.7179 , C ε 1 R N G = 1.42 f η , C ε 2 R N G = 1.68 .

2.3. Computational Boundary Conditions

The total pressure and mass flow rate were applied for the inlet and outlet boundary conditions during all the numerical simulations in the present study. The reference pressure was set to 1 atm, and different flow rates were calculated by adjusting the outlet flow rate. The computational impeller domain was set to rotating domain with 2950 rpm. The other computational domains were set to static domains. The RNG   k - ε model was selected as the turbulence model, and a standard wall surface function was used with the convergence accuracy set to 10−5. Table 3 shows the setting of relevant conditions for numerical simulation.

2.4. Fluid-Structure Interaction Calculation of Rotor System

The rotor system mainly includes the impeller, pump shaft and other rotating parts. The rotor system of pump case A mainly includes vanes, the shroud and hub as well as rotating shaft; the case B and case C rotor system includes corresponding vanes, hub, and rotating shaft. The structures of the model pump impeller rotor system are shown in Figure 3.
The rotor system is the key component of centrifugal pump’s internal energy conversion efficiency. In this research, the one-way fluid-structure interaction method was used to calculate the dynamic and static characteristics of rotor systems. The strategy of a one-way fluid-structure interaction solution is shown in Figure 4.
In statics analysis, the impeller-rotor system was constrained and loaded. The load of the rotor system includes the gravity of the rotor, the centrifugal force generated by the rotor rotation and the internal and external pressure load of the fluid on the rotor. The gravity load is realized by setting standard earth gravity, with a value of 9806.6 mm/s2, the direction is vertical and the axis is downward. Centrifugal force load sets the speed of the rotating subsystem, the speed value is 2950 rpm, the direction is consistent with the impeller rotation direction. The flow field pressure load is obtained by loading the flow field calculation results, and transferring to the rotor system structure through the fluid-solid coupling interface. The cylindrical support of two rolling bearings was simplified for the impeller shaft. Cylindrical support was added to the shaft bearings for the axial and radial constraints.
The material of the rotor system is HT250, with a density of 7350 kg/m3, Young’s modulus of 130 GPa, Poisson’s ratio of 0.25, yield strength of 250 MPa. Basic material properties are added to Static Structural by selecting Engineering Data. Constraints and load related settings of the impeller rotor structure are shown in Figure 5.
In the dynamic research, because the fluid medium has a great influence on the vibration characteristics of the rotor, the wet modal analysis of the rotating subsystem was carried out based on the acoustic-structure coupling method. An acoustic (ACT) plug-in was added in ANSYS Workbench software, the surface where the impeller and fluid are in contact with each other was set as a fluid-solid interface, and the pressure load generated by the fluid is applied to the structure. The fluid is an acoustic fluid with a sound speed of 1430 m/s and a fluid density of 1000 kg/m3. The flow chart of the fluid-structure coupling calculation is shown in Figure 6.

2.5. Experimental Verification

To verify the accuracy of the numerical simulation results, a closed hydraulic test rig was set up. Figure 7 shows the test bench site plan. The test system consists of two parts: a water circulation system and the data acquisition system. The closed test rig water circulation system includes a vacuum pump, reservoir, frequency converter, stainless steel pipeline, corrugated pipe, motor, test stand, test pump, inlet valve, and outlet valve. The data acquisition system consists of the data acquisition program, data acquisition card, data transmission line, and data acquisition equipment. The data acquisition card model used in this test is NI USB 6343X, which has 32 built-in analog signal input channels to meet the measurement requirements.
In the experiment, to assess whether it can operate in a good condition, firstly the test pump and the water circulation system were commissioned and operated. Then the inverter was started and the voltage gradually increased until the motor speed reached the rated speed of 2950 rpm. The inlet pressure was controlled by the vacuum pump, and the operating condition point was changed by adjusting the flow control valve. When the operation was stable, data were collected by the LabVIEW data acquisition program on the computer side. Finally, all the experimental procedures for the other pump cases were repeated with different impeller structures.

3. Results and Discussion

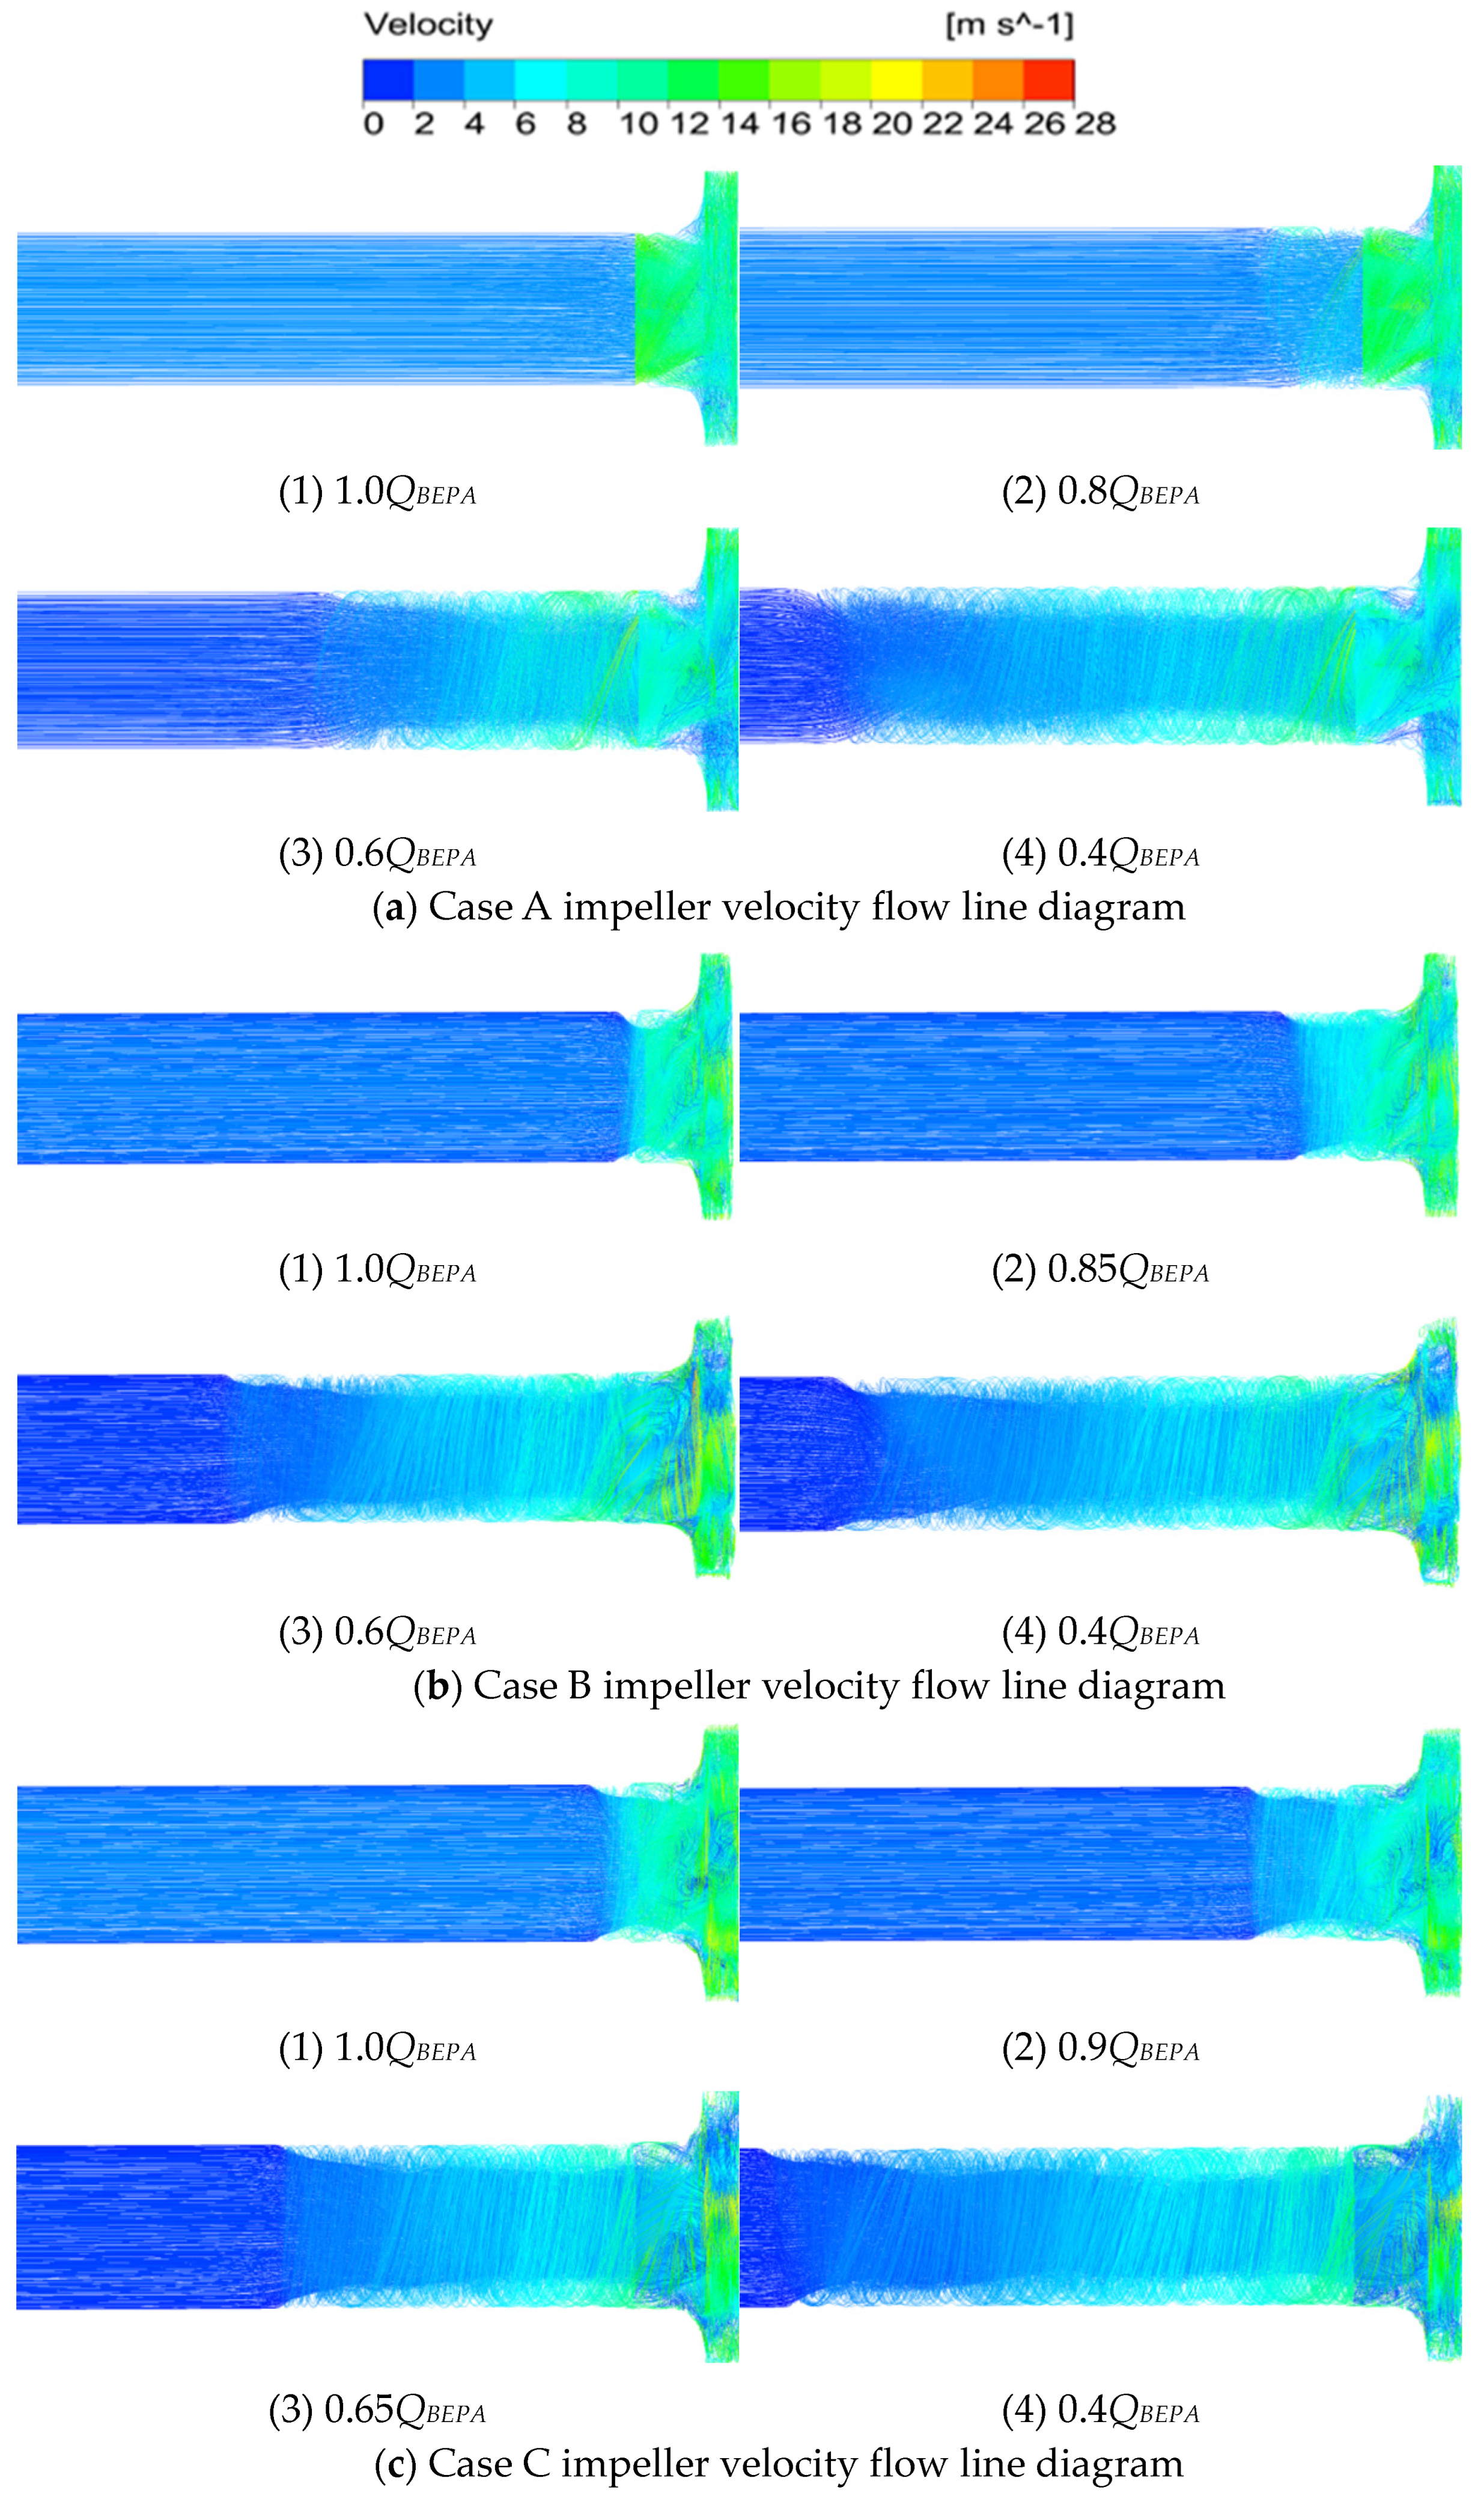
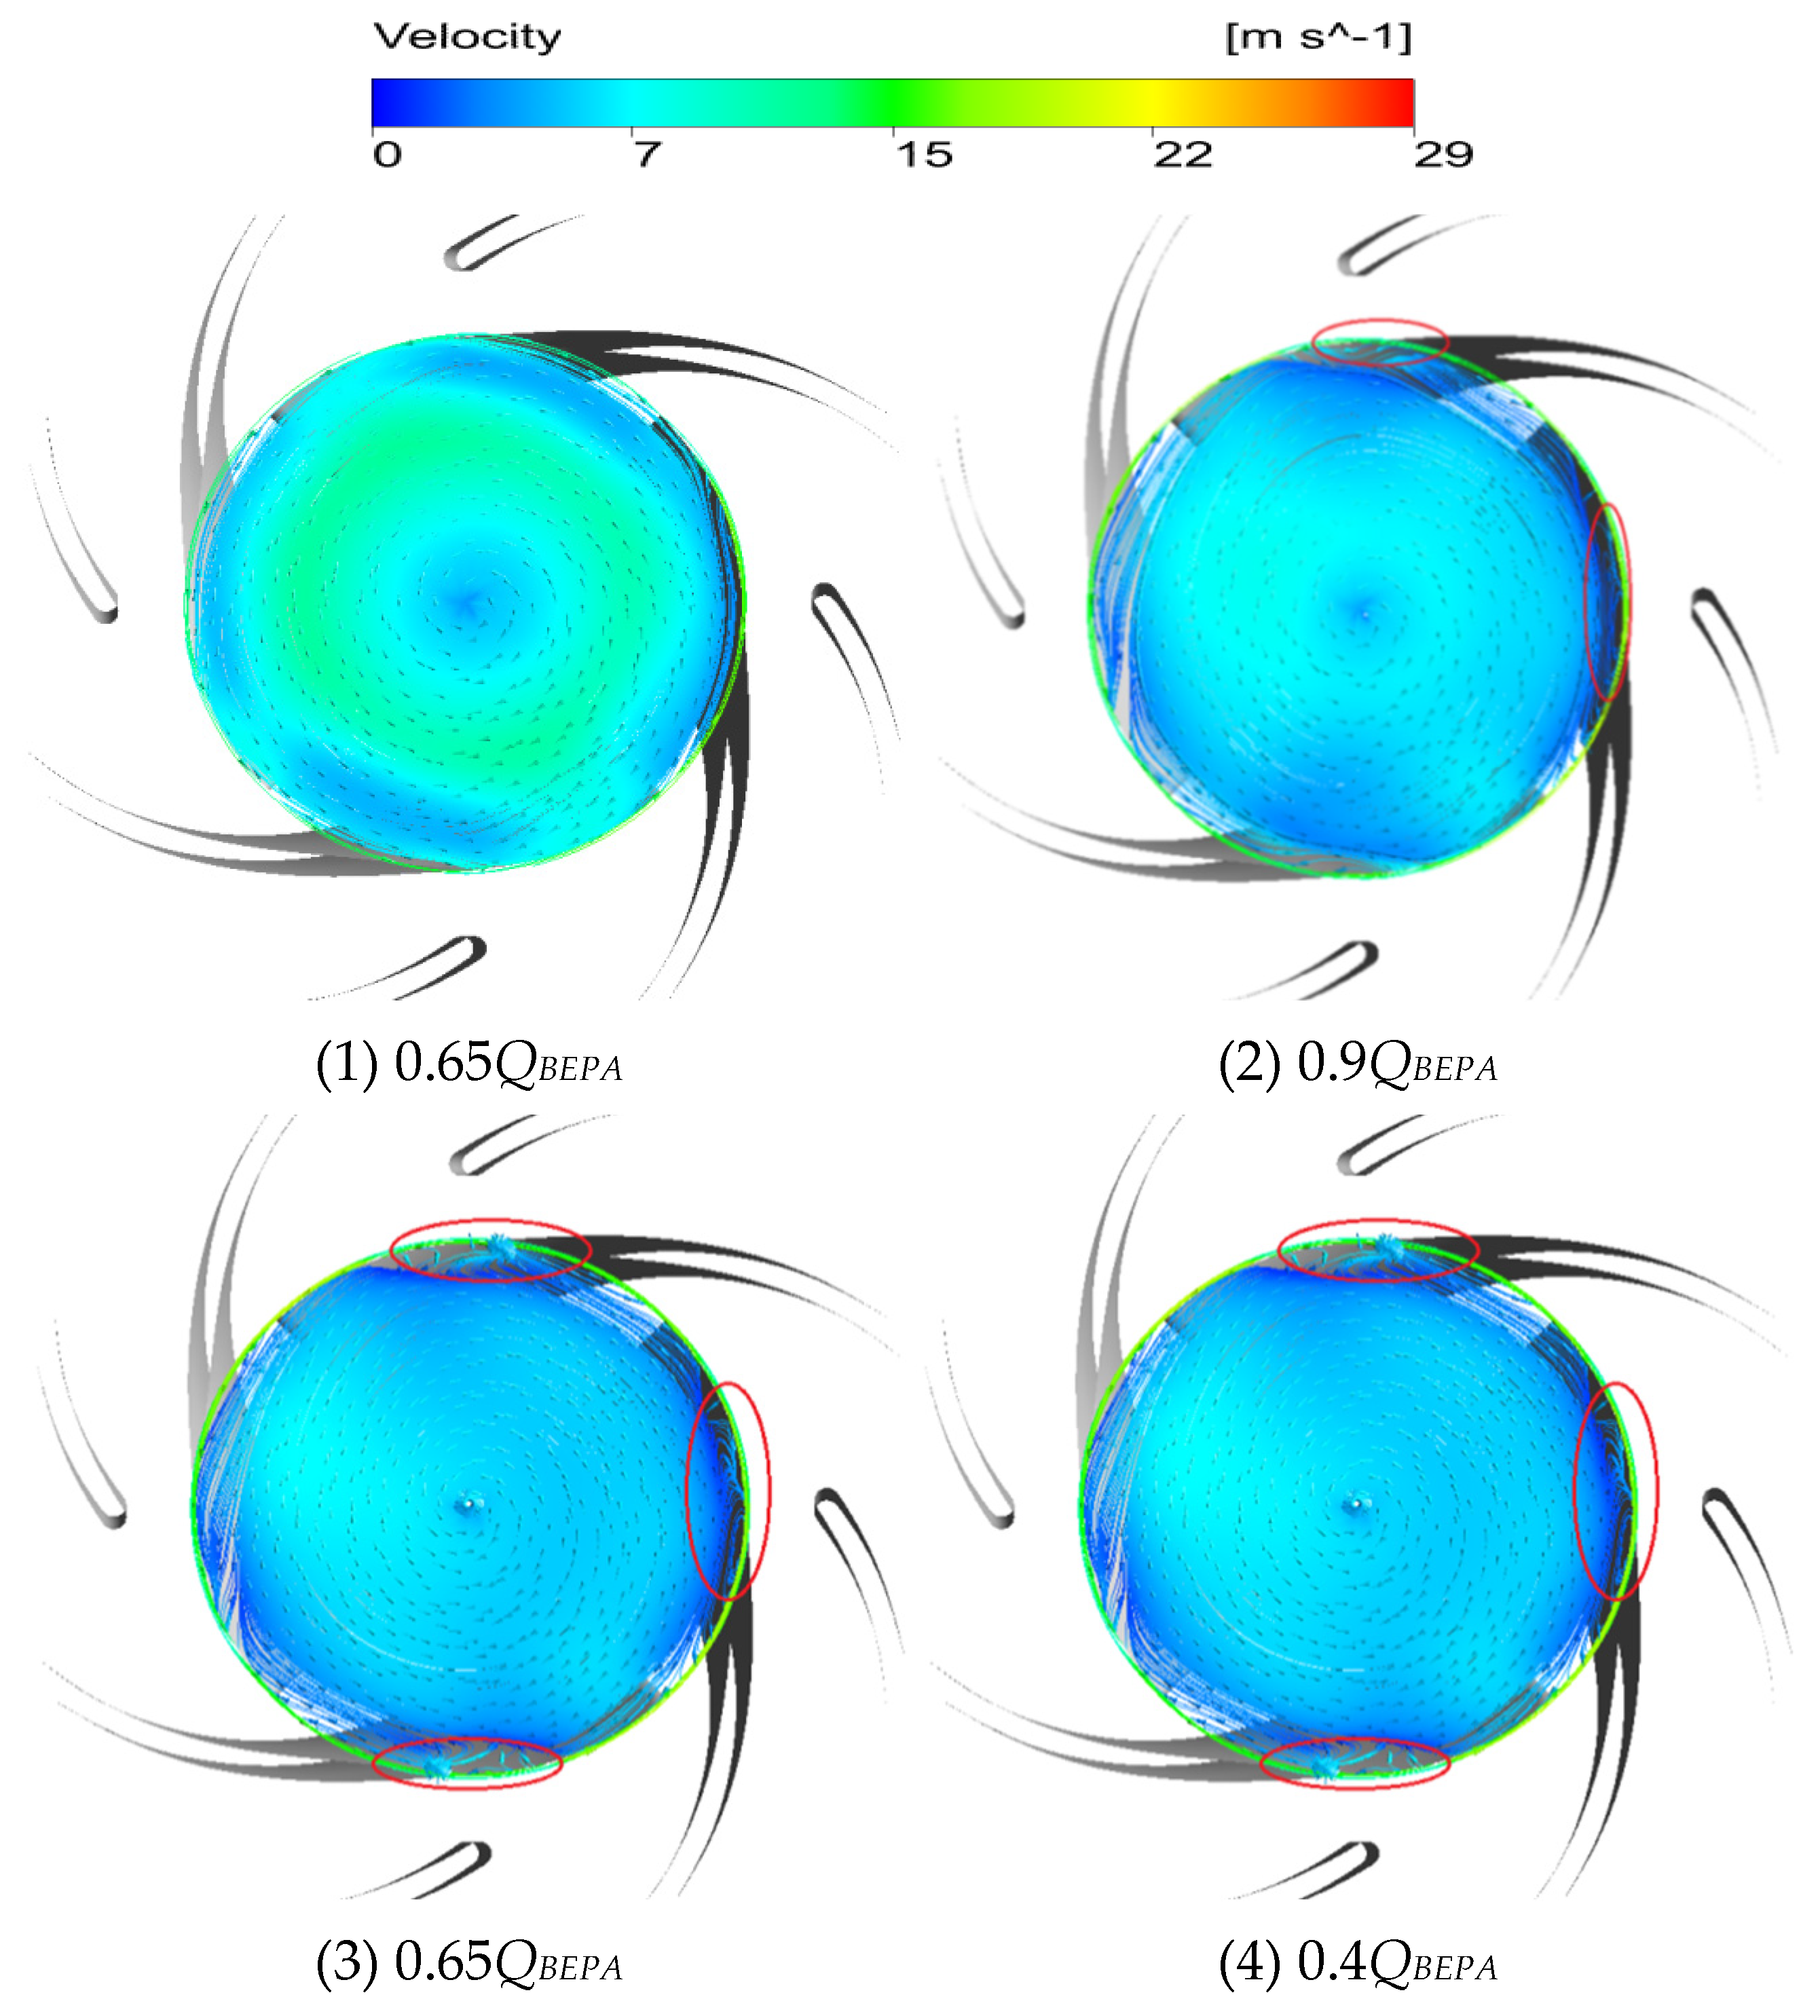
3.1. Velocity Distribution at Different Flow Rates

When the centrifugal pump runs at small flow rates, backflow will occur at the impeller inlet. Not only is the impeller inlet flow complicated, but the flow field characteristics of the impeller will obviously change. The velocity streamlines distribution along the pump inlet and pressure distribution inside the impeller were further studied for the three pump cases, as shown in Figure 8.
Representative flow rates under each case are selected for analysis; in which 1.0 QBEPA represents the best efficiency point of the centrifugal pump. In order to facilitate the analysis, the impeller of pump case A was taken as an example to analyze the change in inlet backflow with flow rate. It can be seen from Figure 8 that uniform flows are distributed at the 1.0 QBEPA flow rate, no backflow occurs, the velocity is distributed throughout the inlet tube area from the inlet of the inlet tube to the impeller inlet. When the flow rate drops to 0.8 QBEPA, the flow line at the inlet of the impeller is disordered. At this time, the inlet backflow starts to grow but with low intensity. When the flow rate drops to 0.6 QBEPA, the inlet distribution flow becomes uniform and more vortex is found. When the flow continues to decrease to 0.4 QBEPA, the backflow strength is further enhanced.
The analysis of the impeller in cases B and C shows that the change in backflow intensity with flow rate is the same as that of the impeller of case A. By comparing the velocity flow diagram of case A and case B under 0.8 QBEPA flow rate, the backflow intensity of case B impeller is significantly stronger than that of case A impeller, and case C has the highest backflow intensity among the three impeller structures.
As the split blade impeller has the highest backflow intensity, pump case C is chosen to analyze the two-dimensional velocity at the blade inlet cross-section. It can be seen from Figure 9 that in 1.0 QBEPA flow rate, the flow line at the blade inlet cross-section is relatively flat; the flow rate drops to 0.9 QBEPA, the blade inlet cross-section outer edge appeared with the blade rotation direction of the same backflow vortex, at this time the backflow vortex only appear in the inlet edge of a very small range. Flow further down to 0.65 QBEPA the influence of the vortex range expanded, while in the section below the edge of the new backflow vortex. When the flow rate continues to drop to 0.4 QBEPA, the influence range of the backflow vortex at the blade inlet is further expanded, and the nucleus of each backflow vortex gradually approaches the centerline of the impeller.

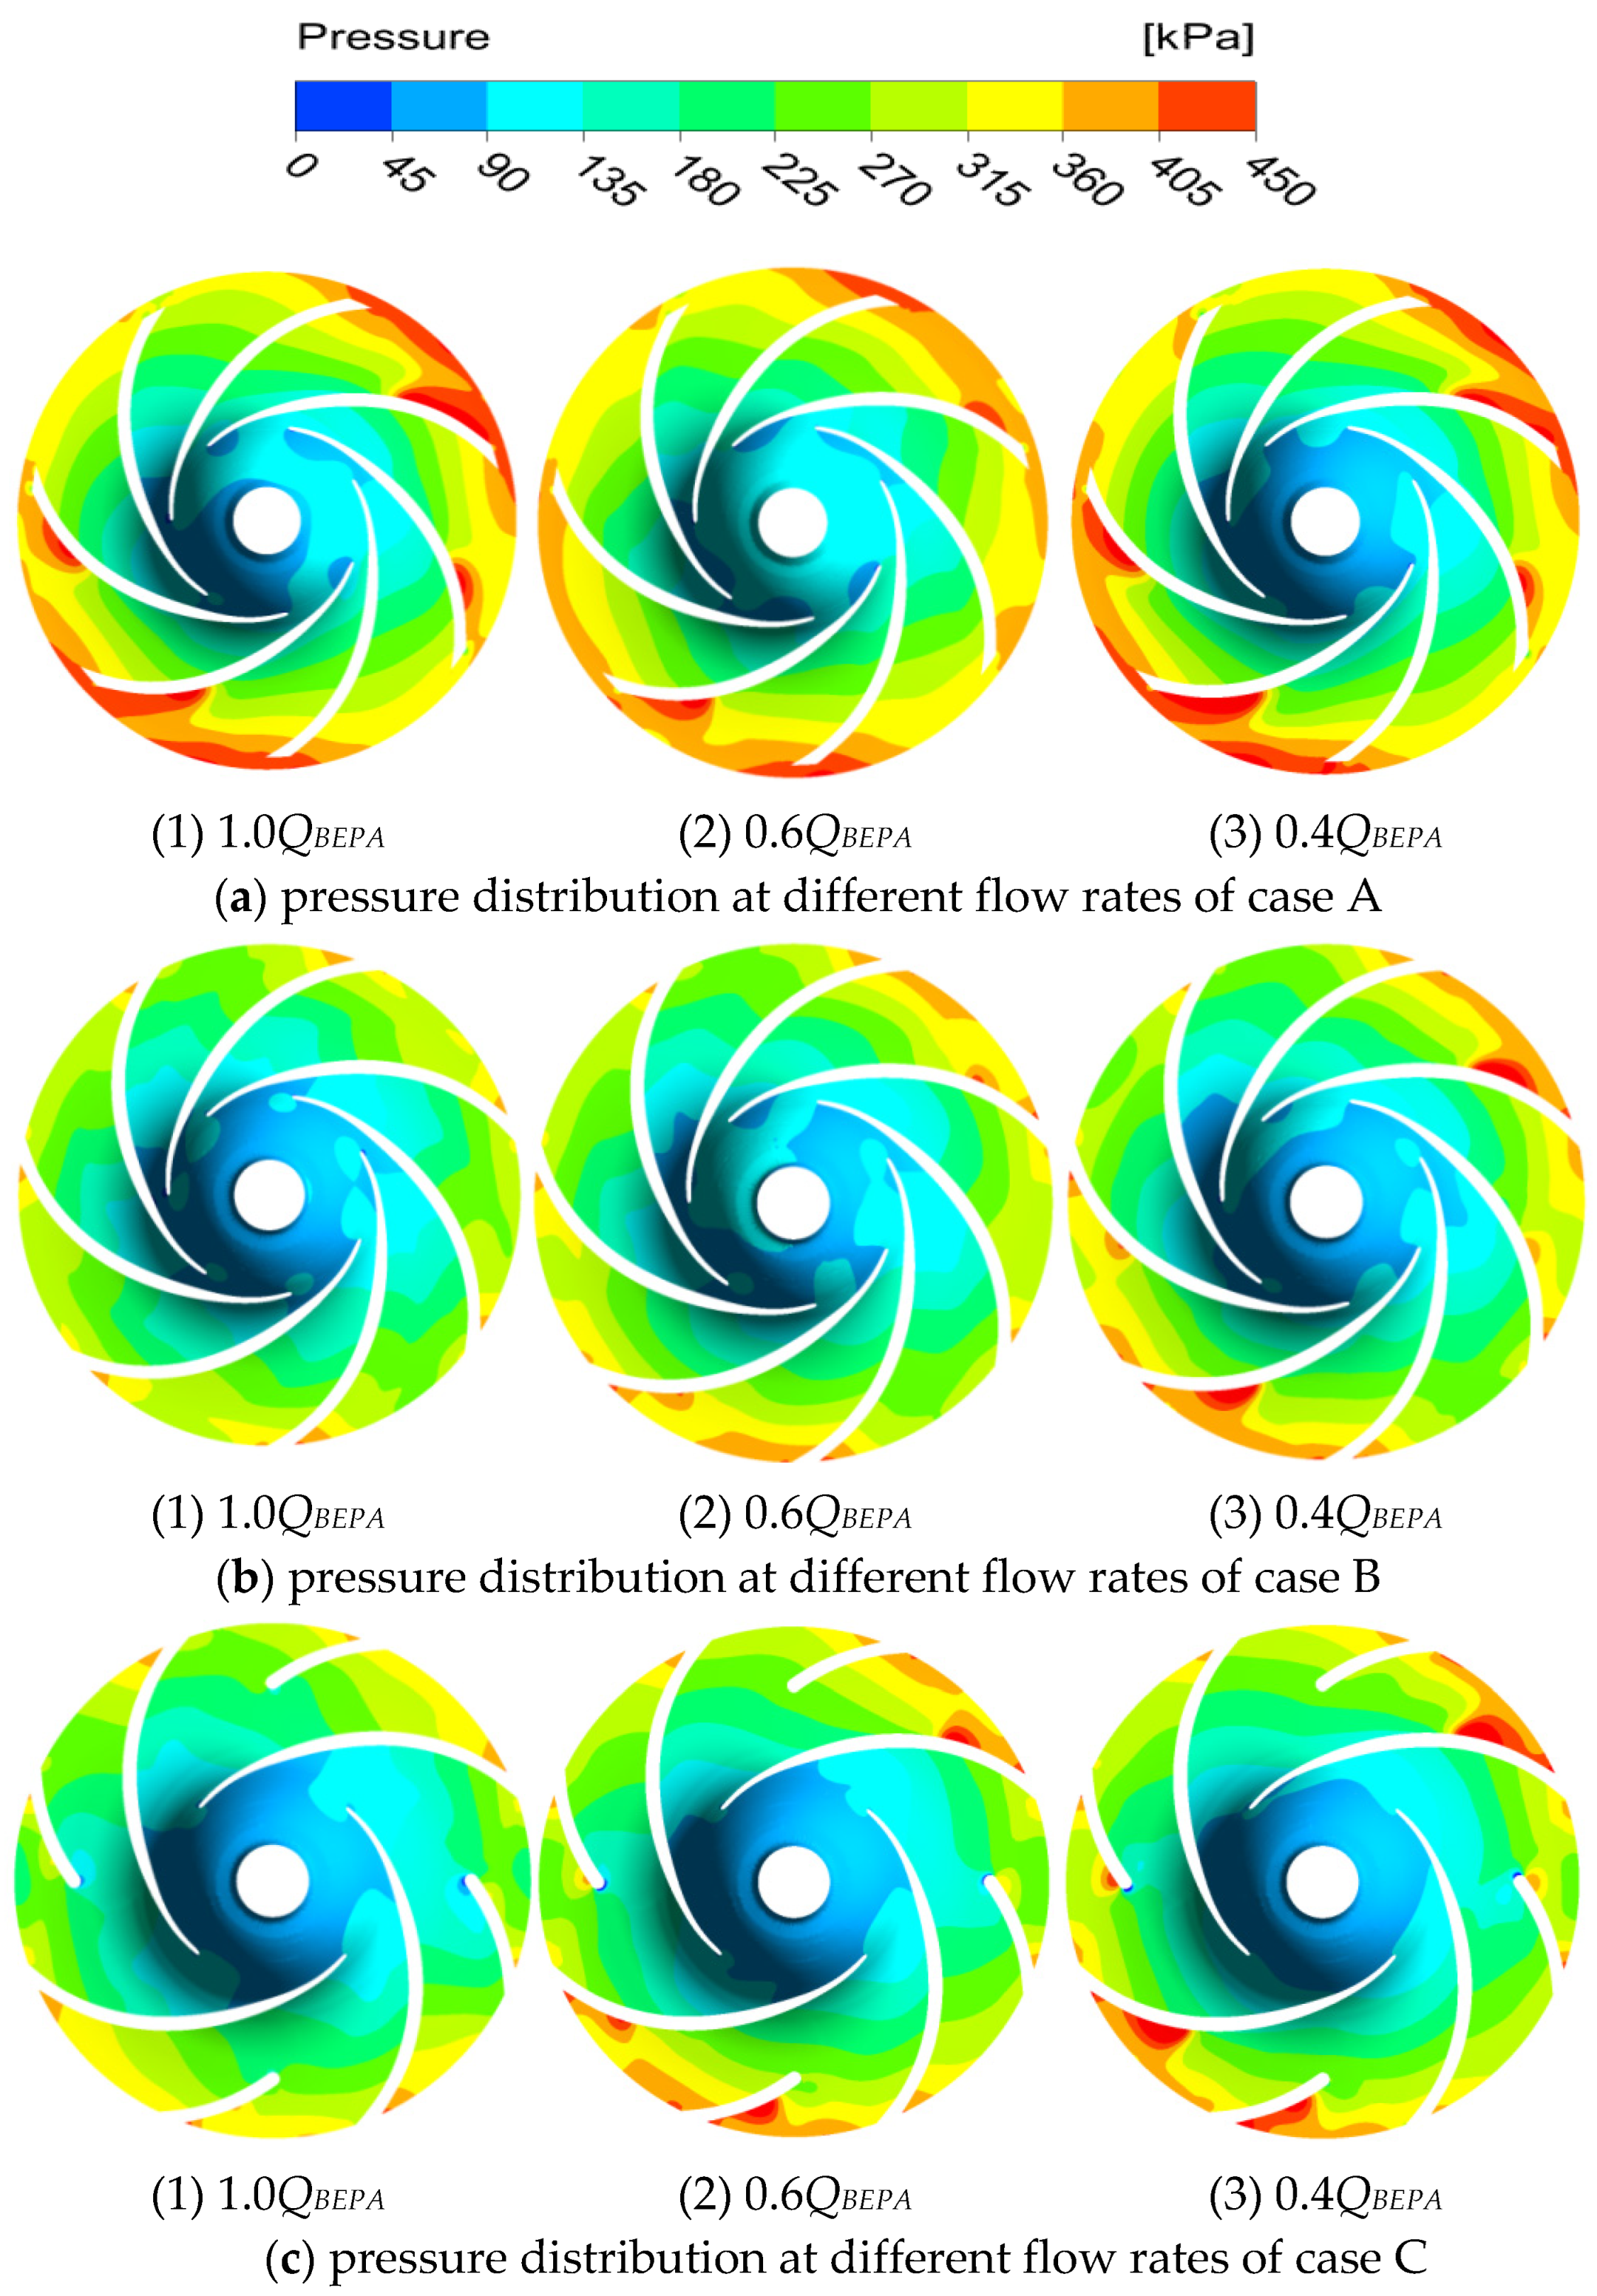
3.2. Pressure Distribution

It can be seen from Figure 10 that the static pressure in the impeller increases gradually from the inlet to the outlet, and the pressure gradient is obvious. The pressure in the impeller is asymmetrical. The lowest pressure is located on the blade suction surface in the center of the impeller. As the flow decreases, the total pressure in the cross section of the impeller increases. The low-pressure areas on the blade suction surface increase downstream. At the small flow rate, the pressure area at the impeller outlet increases. The pressure difference between the impeller center and impeller outlet is more obvious. By comparing the pressure distribution of the three different impeller structures, it can be observed that the overall pressure value of the cross section of the impeller at each flow rate in Case B and Case C is lower than that in Case A.

3.3. Centrifugal Pump Performance Curve

The head coefficient ψ   is used to calculate the hydraulic performance, and the head coefficient can be calculated the equation as follows.
ψ = 2 H g u 2 2
where: u2 is the circumferential velocity of the impeller outlet; g is the acceleration of gravity, and its value is 9.81 m/s2.
Figure 11 shows the comparison of simulated and experimental values of hydraulic characteristics for different impeller cases.
In addition, the predicted hydraulic performances by CFD were further compared with the test results. The performance values obtained by the simulation were compared with the experiment curve. As can be seen from Figure 11, the numerical simulation results are slightly higher than experimental values, they have the same trend. Among them, the efficiency value and head coefficient of impeller case A are the highest, while the efficiency value and head coefficient of impeller case B and case C are close at each flow, and case B is slightly higher than case C.

3.4. Rotor System Calculation Results and Analysis

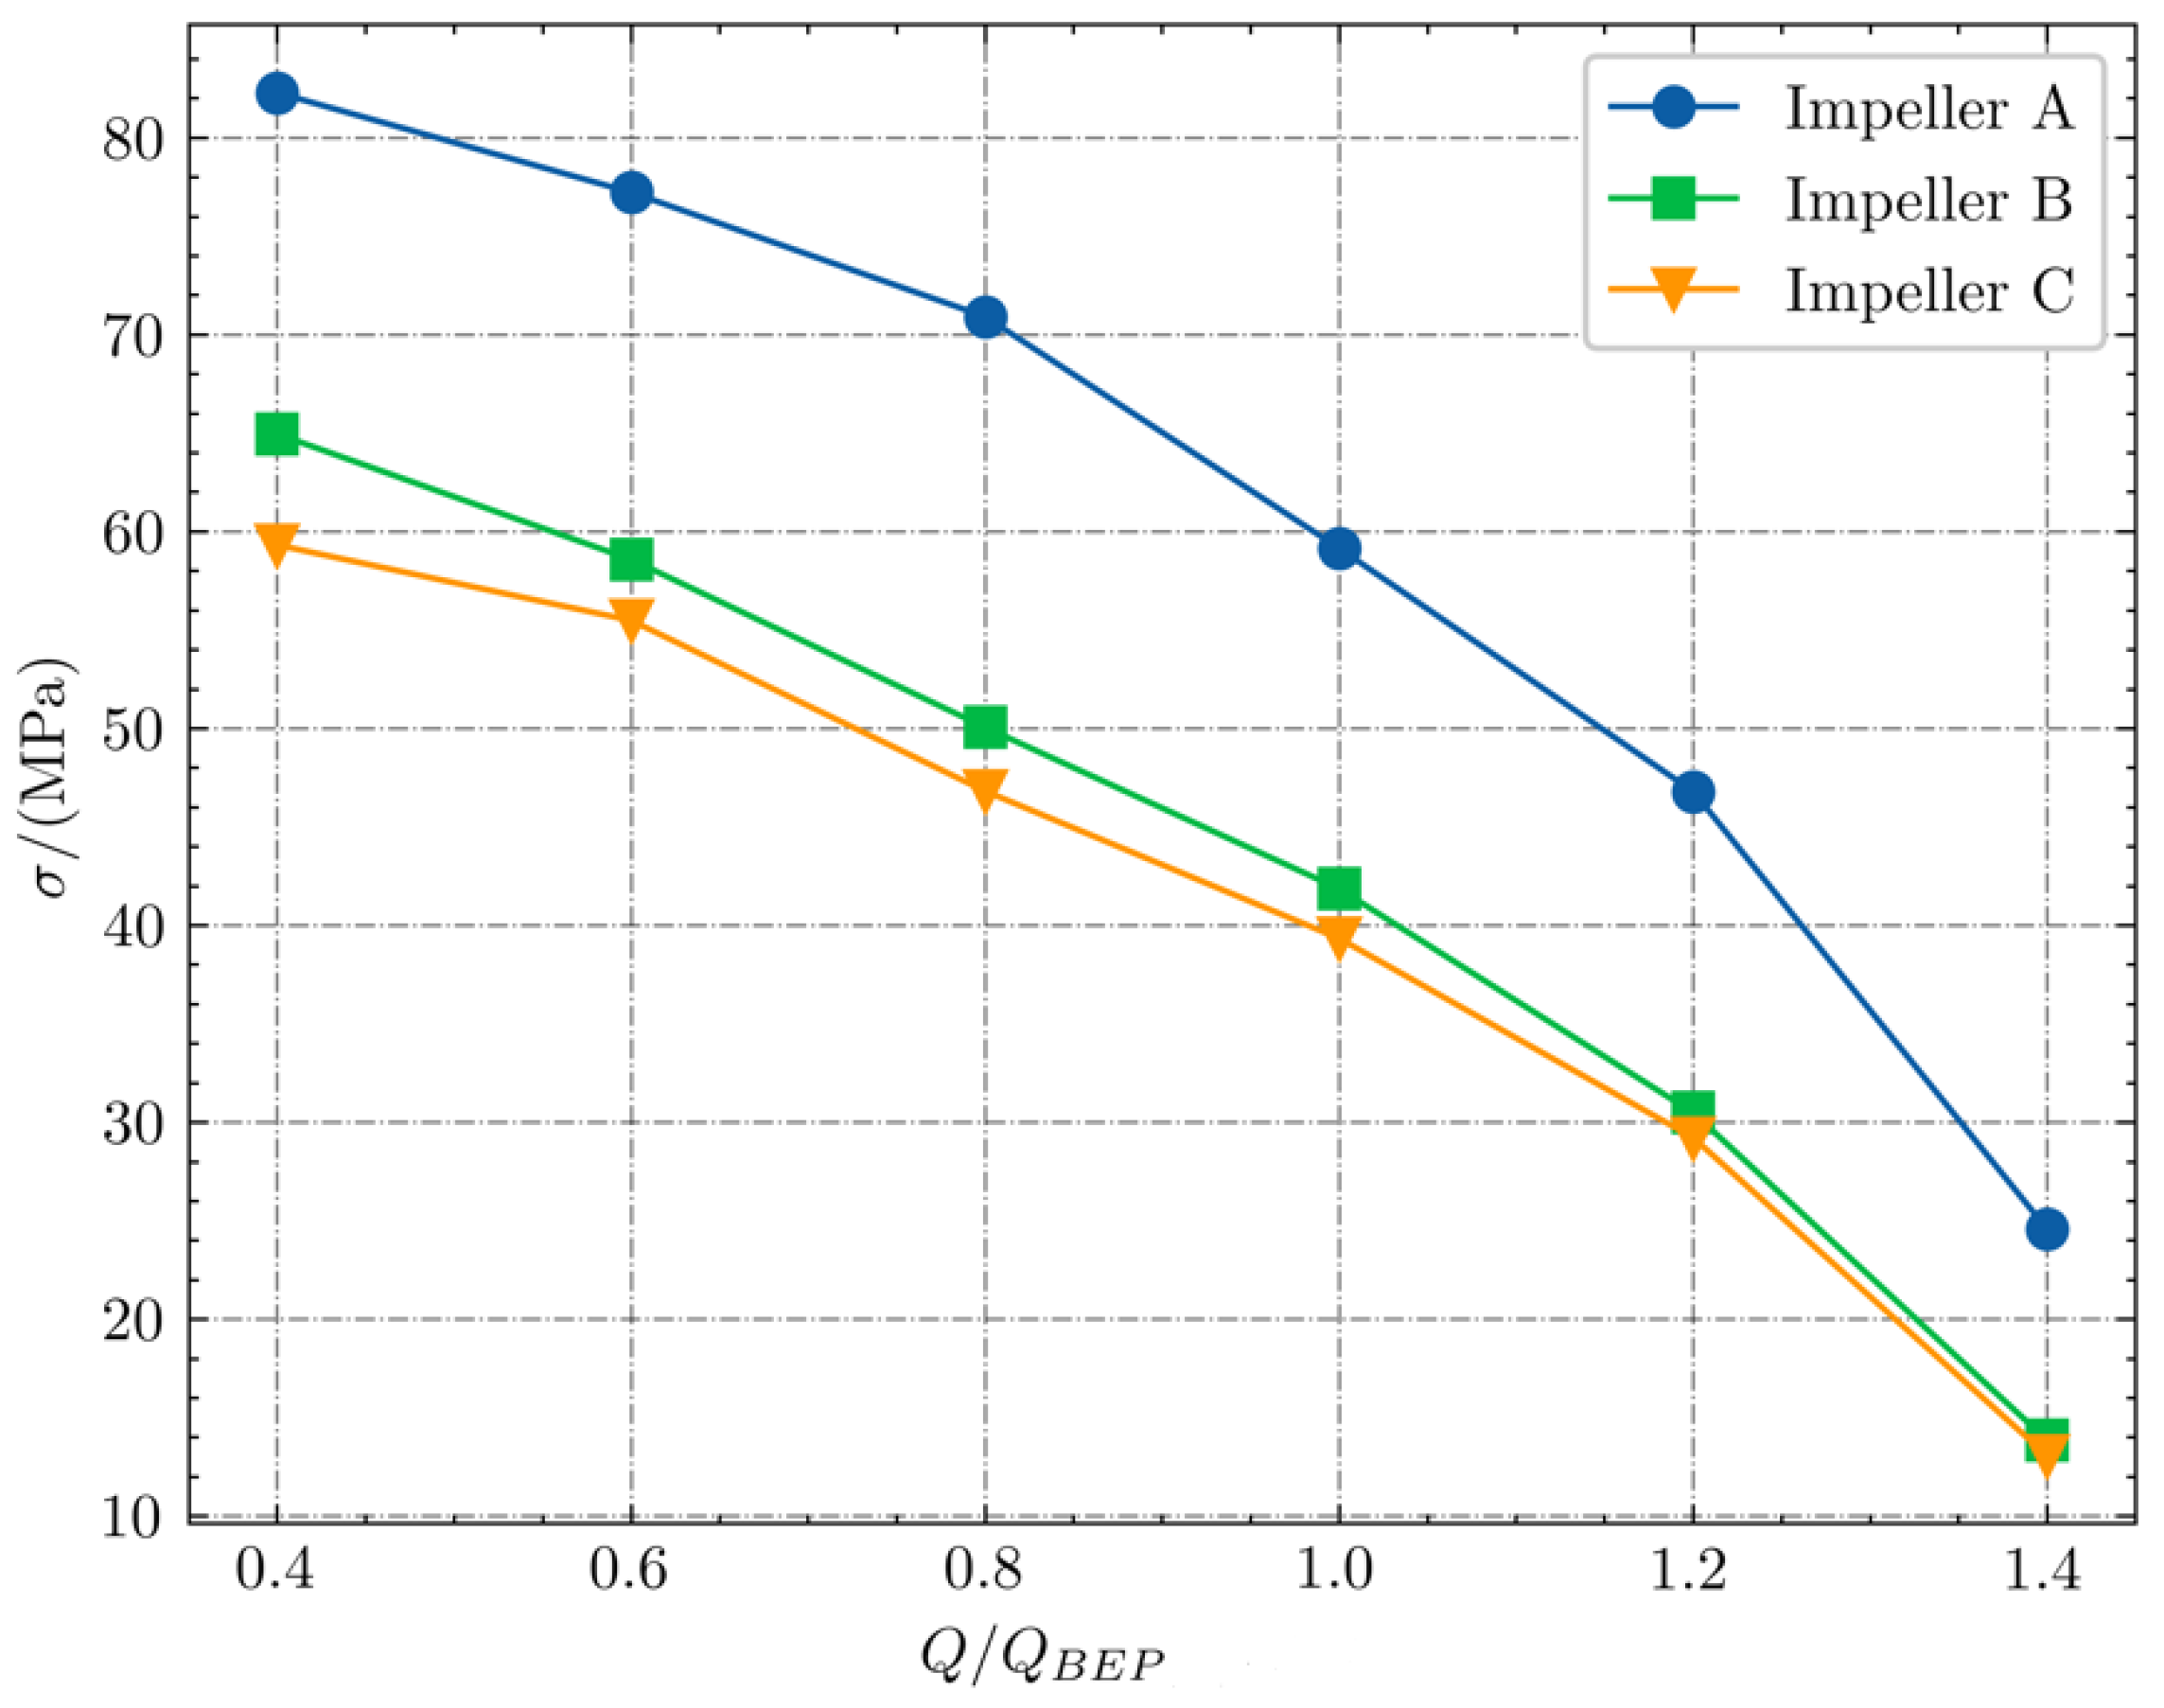
3.4.1. Stress Analysis of Rotor System under Different Flow Rates

Figure 12 shows the curve of the maximum equivalent force of the rotor system with the flow rate for each impeller case. It can be seen that as the flow rate changes, the maximum equivalent force of the impeller rotor varies significantly for each case, and all of them increase as the flow rate decreases.
Comparing three cases, it can be seen that the maximum equivalent force of impeller case A is much larger than that of impeller case B and case C. The maximum equivalent stress of different impeller cases under different flow rates is different while the gap is more obvious in the small flow rate. Compared with case A, the impeller leakage at the inlet of cases B and C is more serious and less prone to stress concentration.
Comparing case B and case C, it can be seen that there is little difference between the maximum equivalent force of case B and case C. Under 0.4 QBEPA flow rate, the maximum difference is 5.64 MPa, and with the increase of flow rate, the difference decreases. The maximum stress values of both cases are the same under large flow rates; the maximum equivalent force of case C under each flow rate is smaller than that of case B, which indicates that the addition of split blades can improve the stress concentration in the impeller. The rotor system structural strength of the three impeller cases was checked. The maximum equivalent stress values of case A were 82.17 MPa, case B was 64.88 MPa, and case C was 59.36 MPa. The yield limit of HT250 impeller material is 250 MPa, which indicates that the impeller rotor system strength of each scheme is enough to meet the operation requirements.

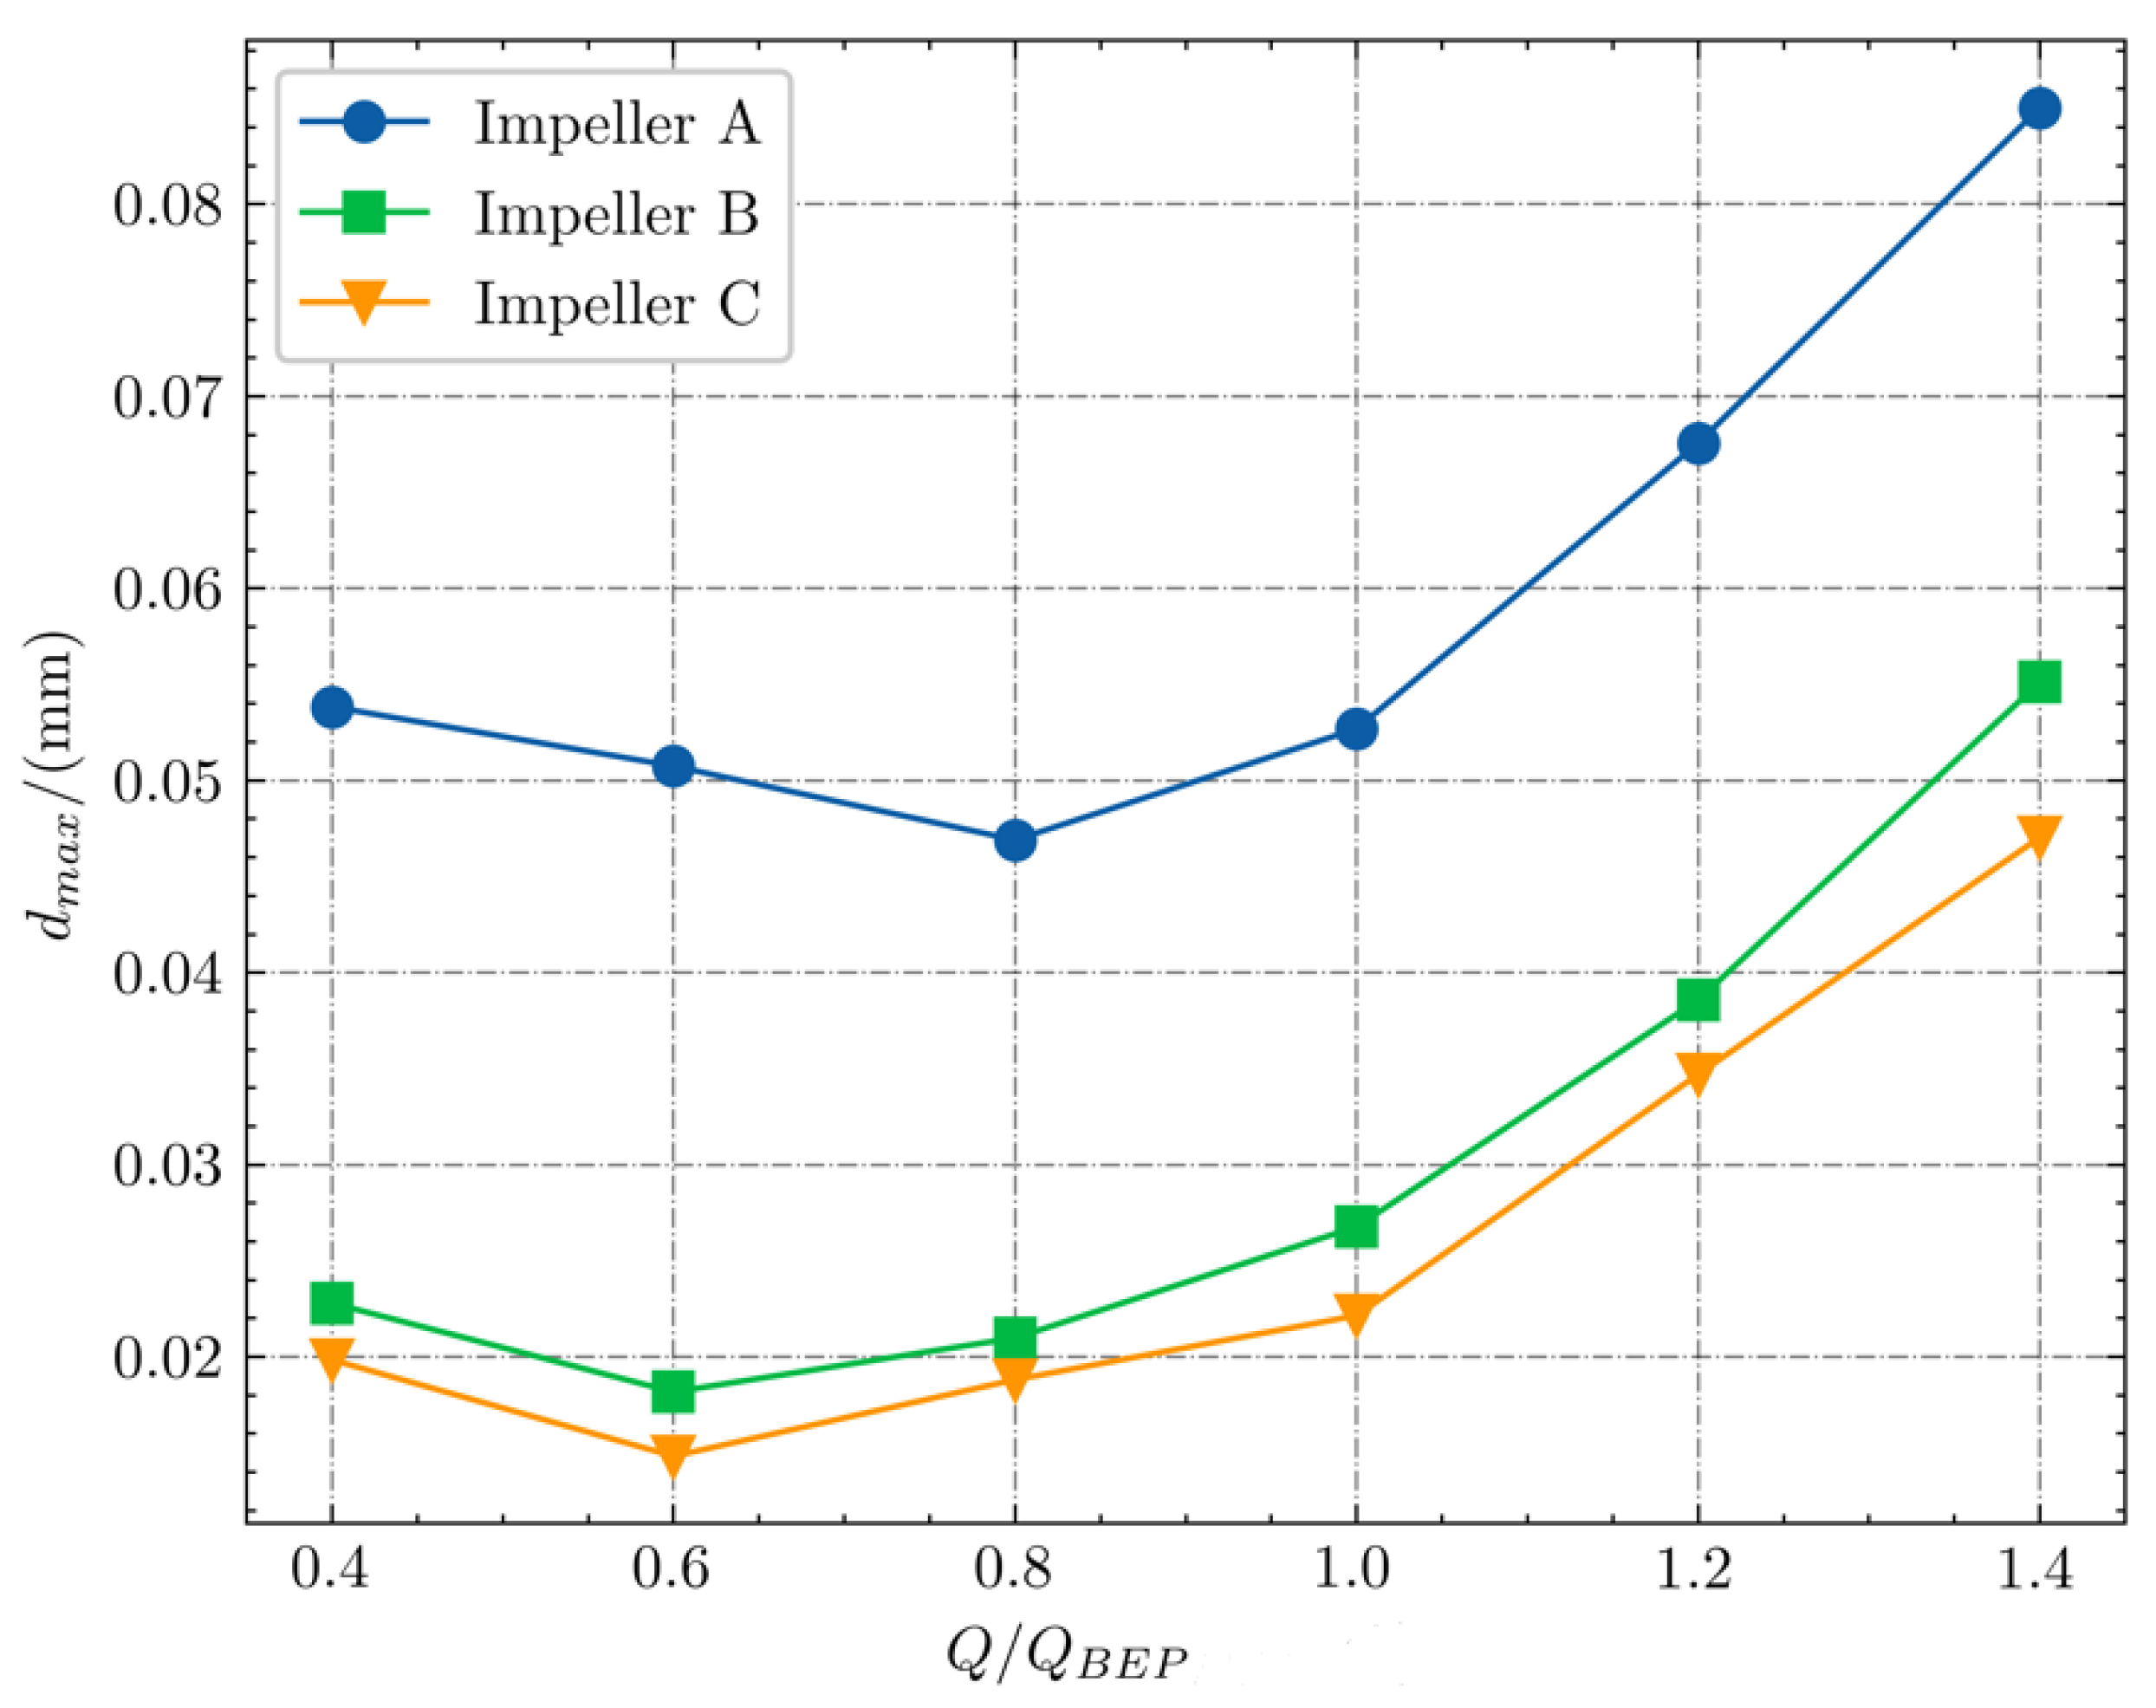
3.4.2. Analysis of Rotor System Deformation under Different Flow Rates

The system deformation of rotor systems with different cases at different flow rates was further analyzed. Figure 13 shows the variation curve of maximum deformation of rotor systems with different impeller cases as a function of flow. As can be seen from the figure, the rotor system deformation varied significantly at different flow rates, the maximum total deformation decreases first and then increases with the increase in flow rate.
As indicated in Figure 13 at the optimal flow rate, the change in deformation amount is minimal because of the stable flow and the minimum radial force at the optimal flow rate. The maximum deformation of each impeller case increases significantly when it deviates from the optimal flow rate. Therefore, to ensure the stiffness requirements of the impeller rotor during operation, deviations from optimum flow rates should be avoided. The maximum deformation varies greatly among different impeller cases. Among the three impeller cases, case A has the largest maximum deformation at each flow rate and the maximum deformation is 0.085 mm, followed by case B and case C.

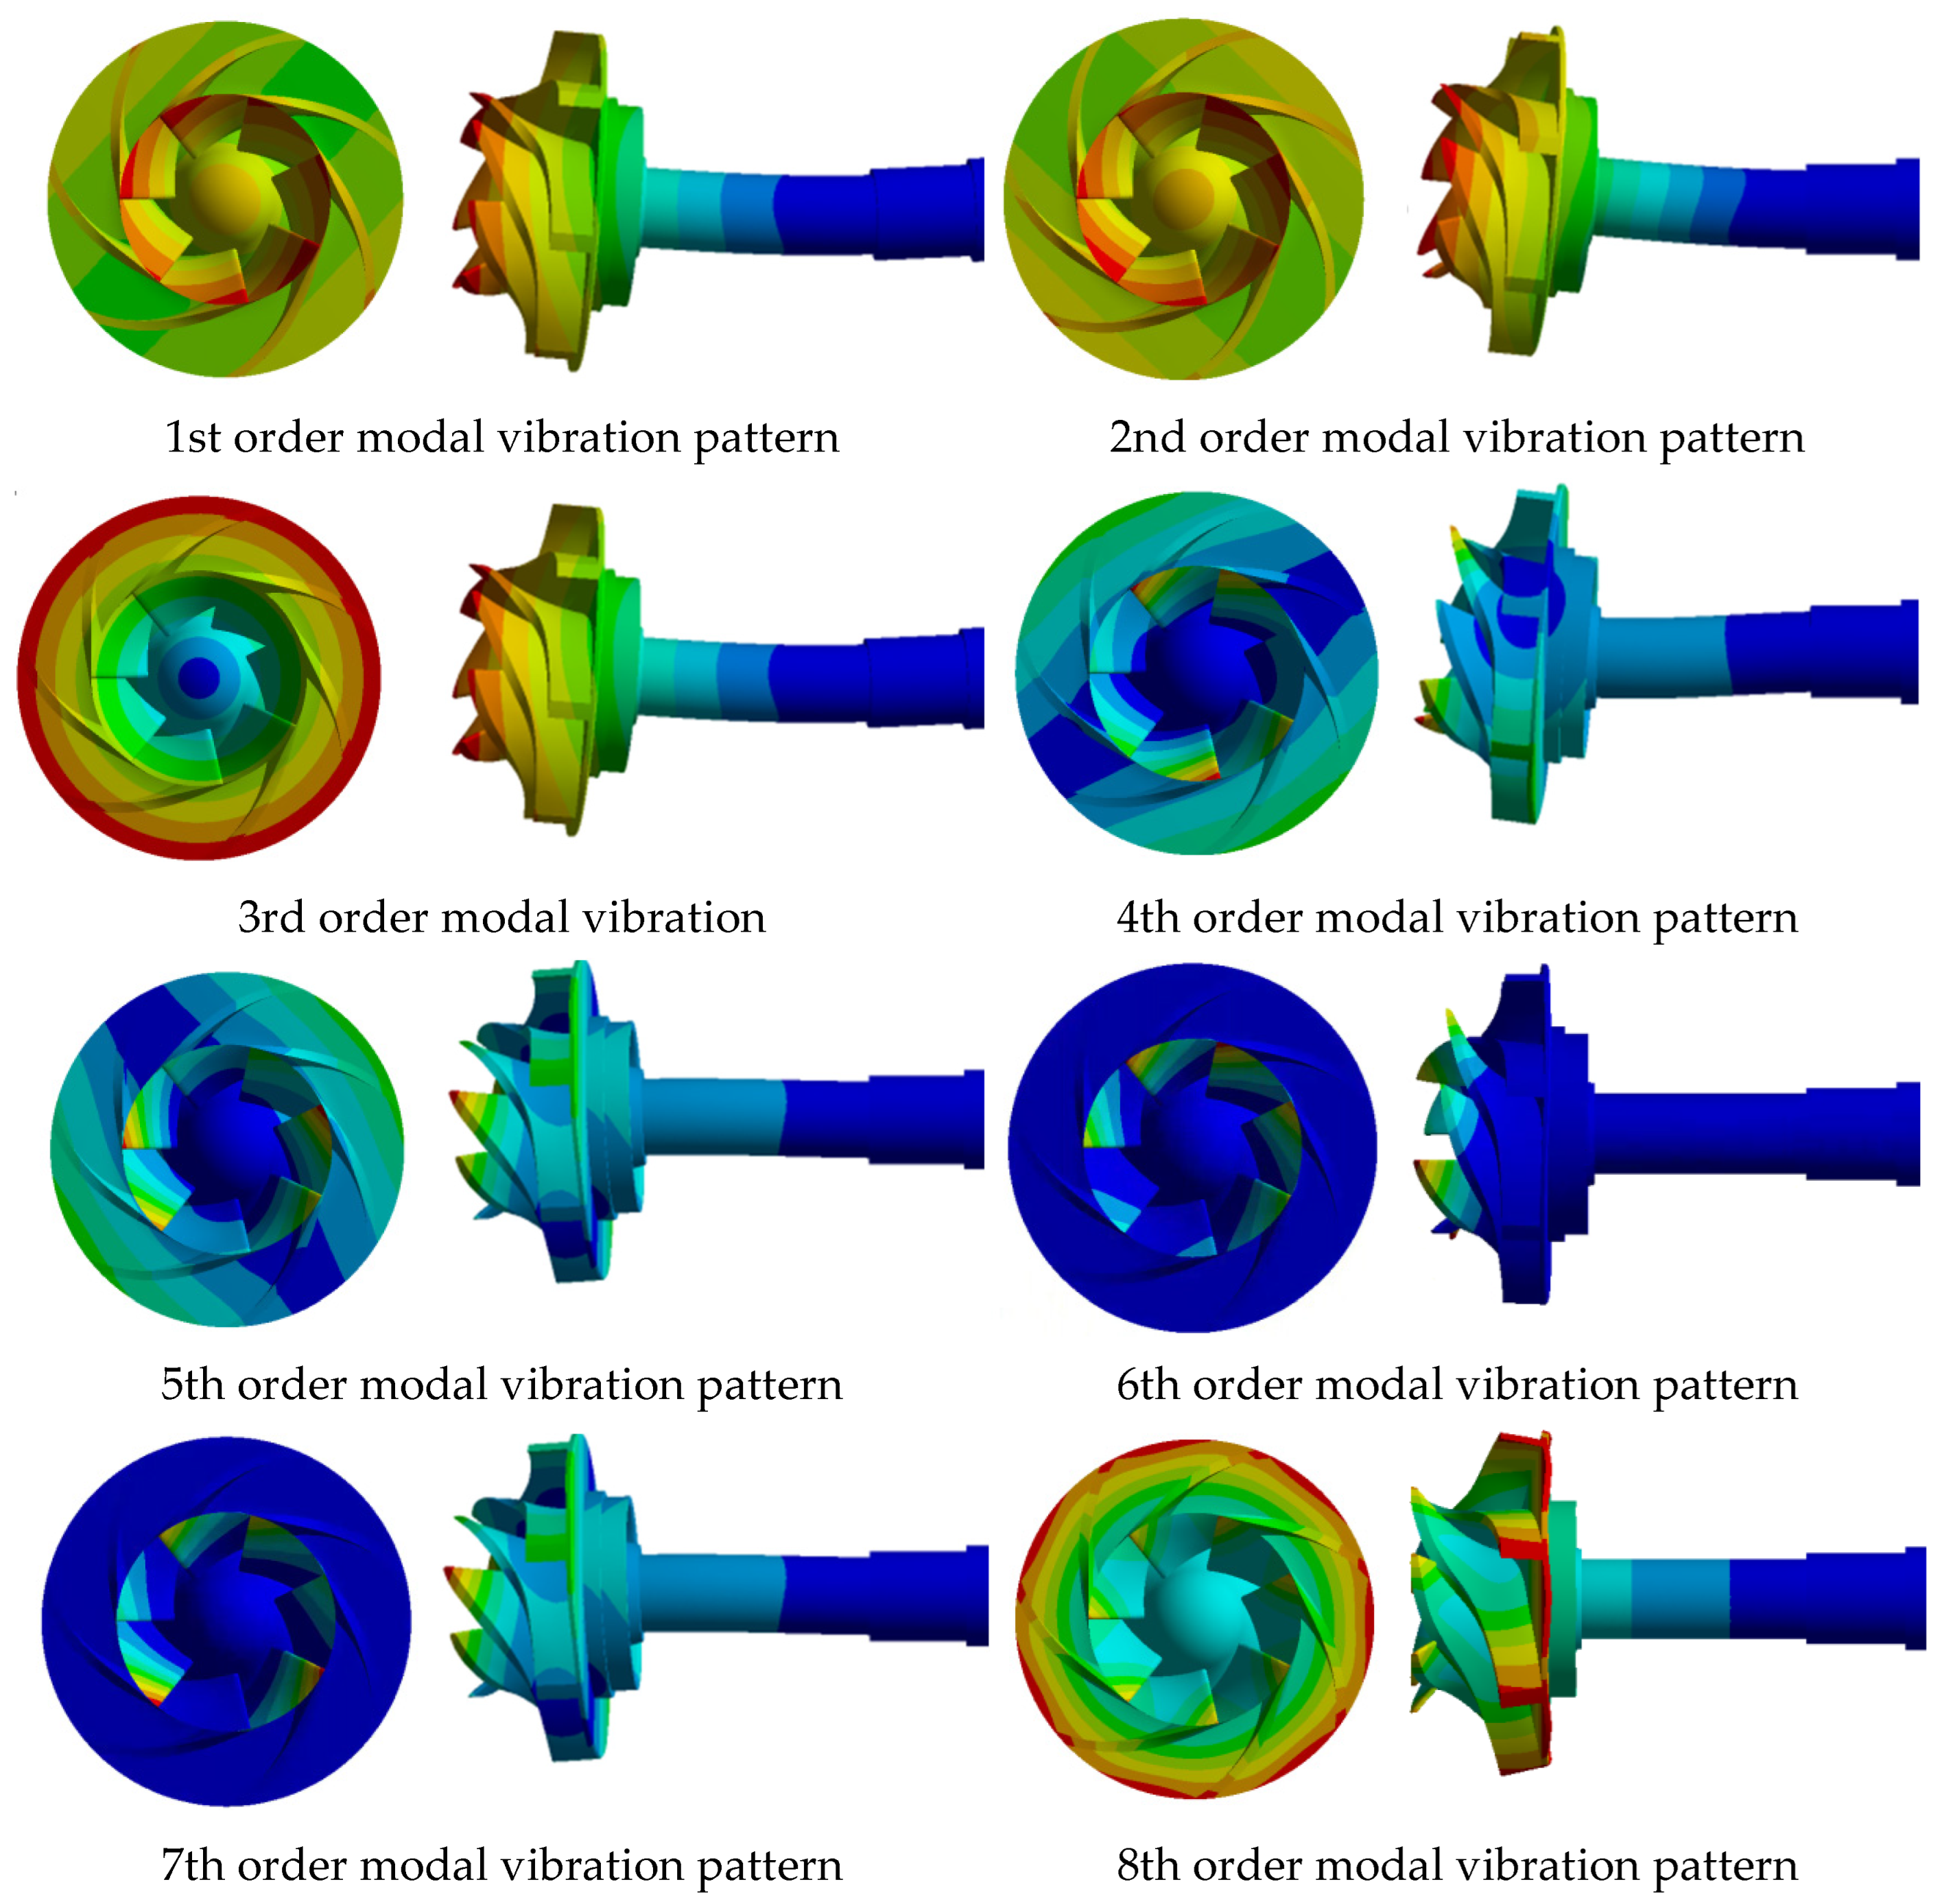
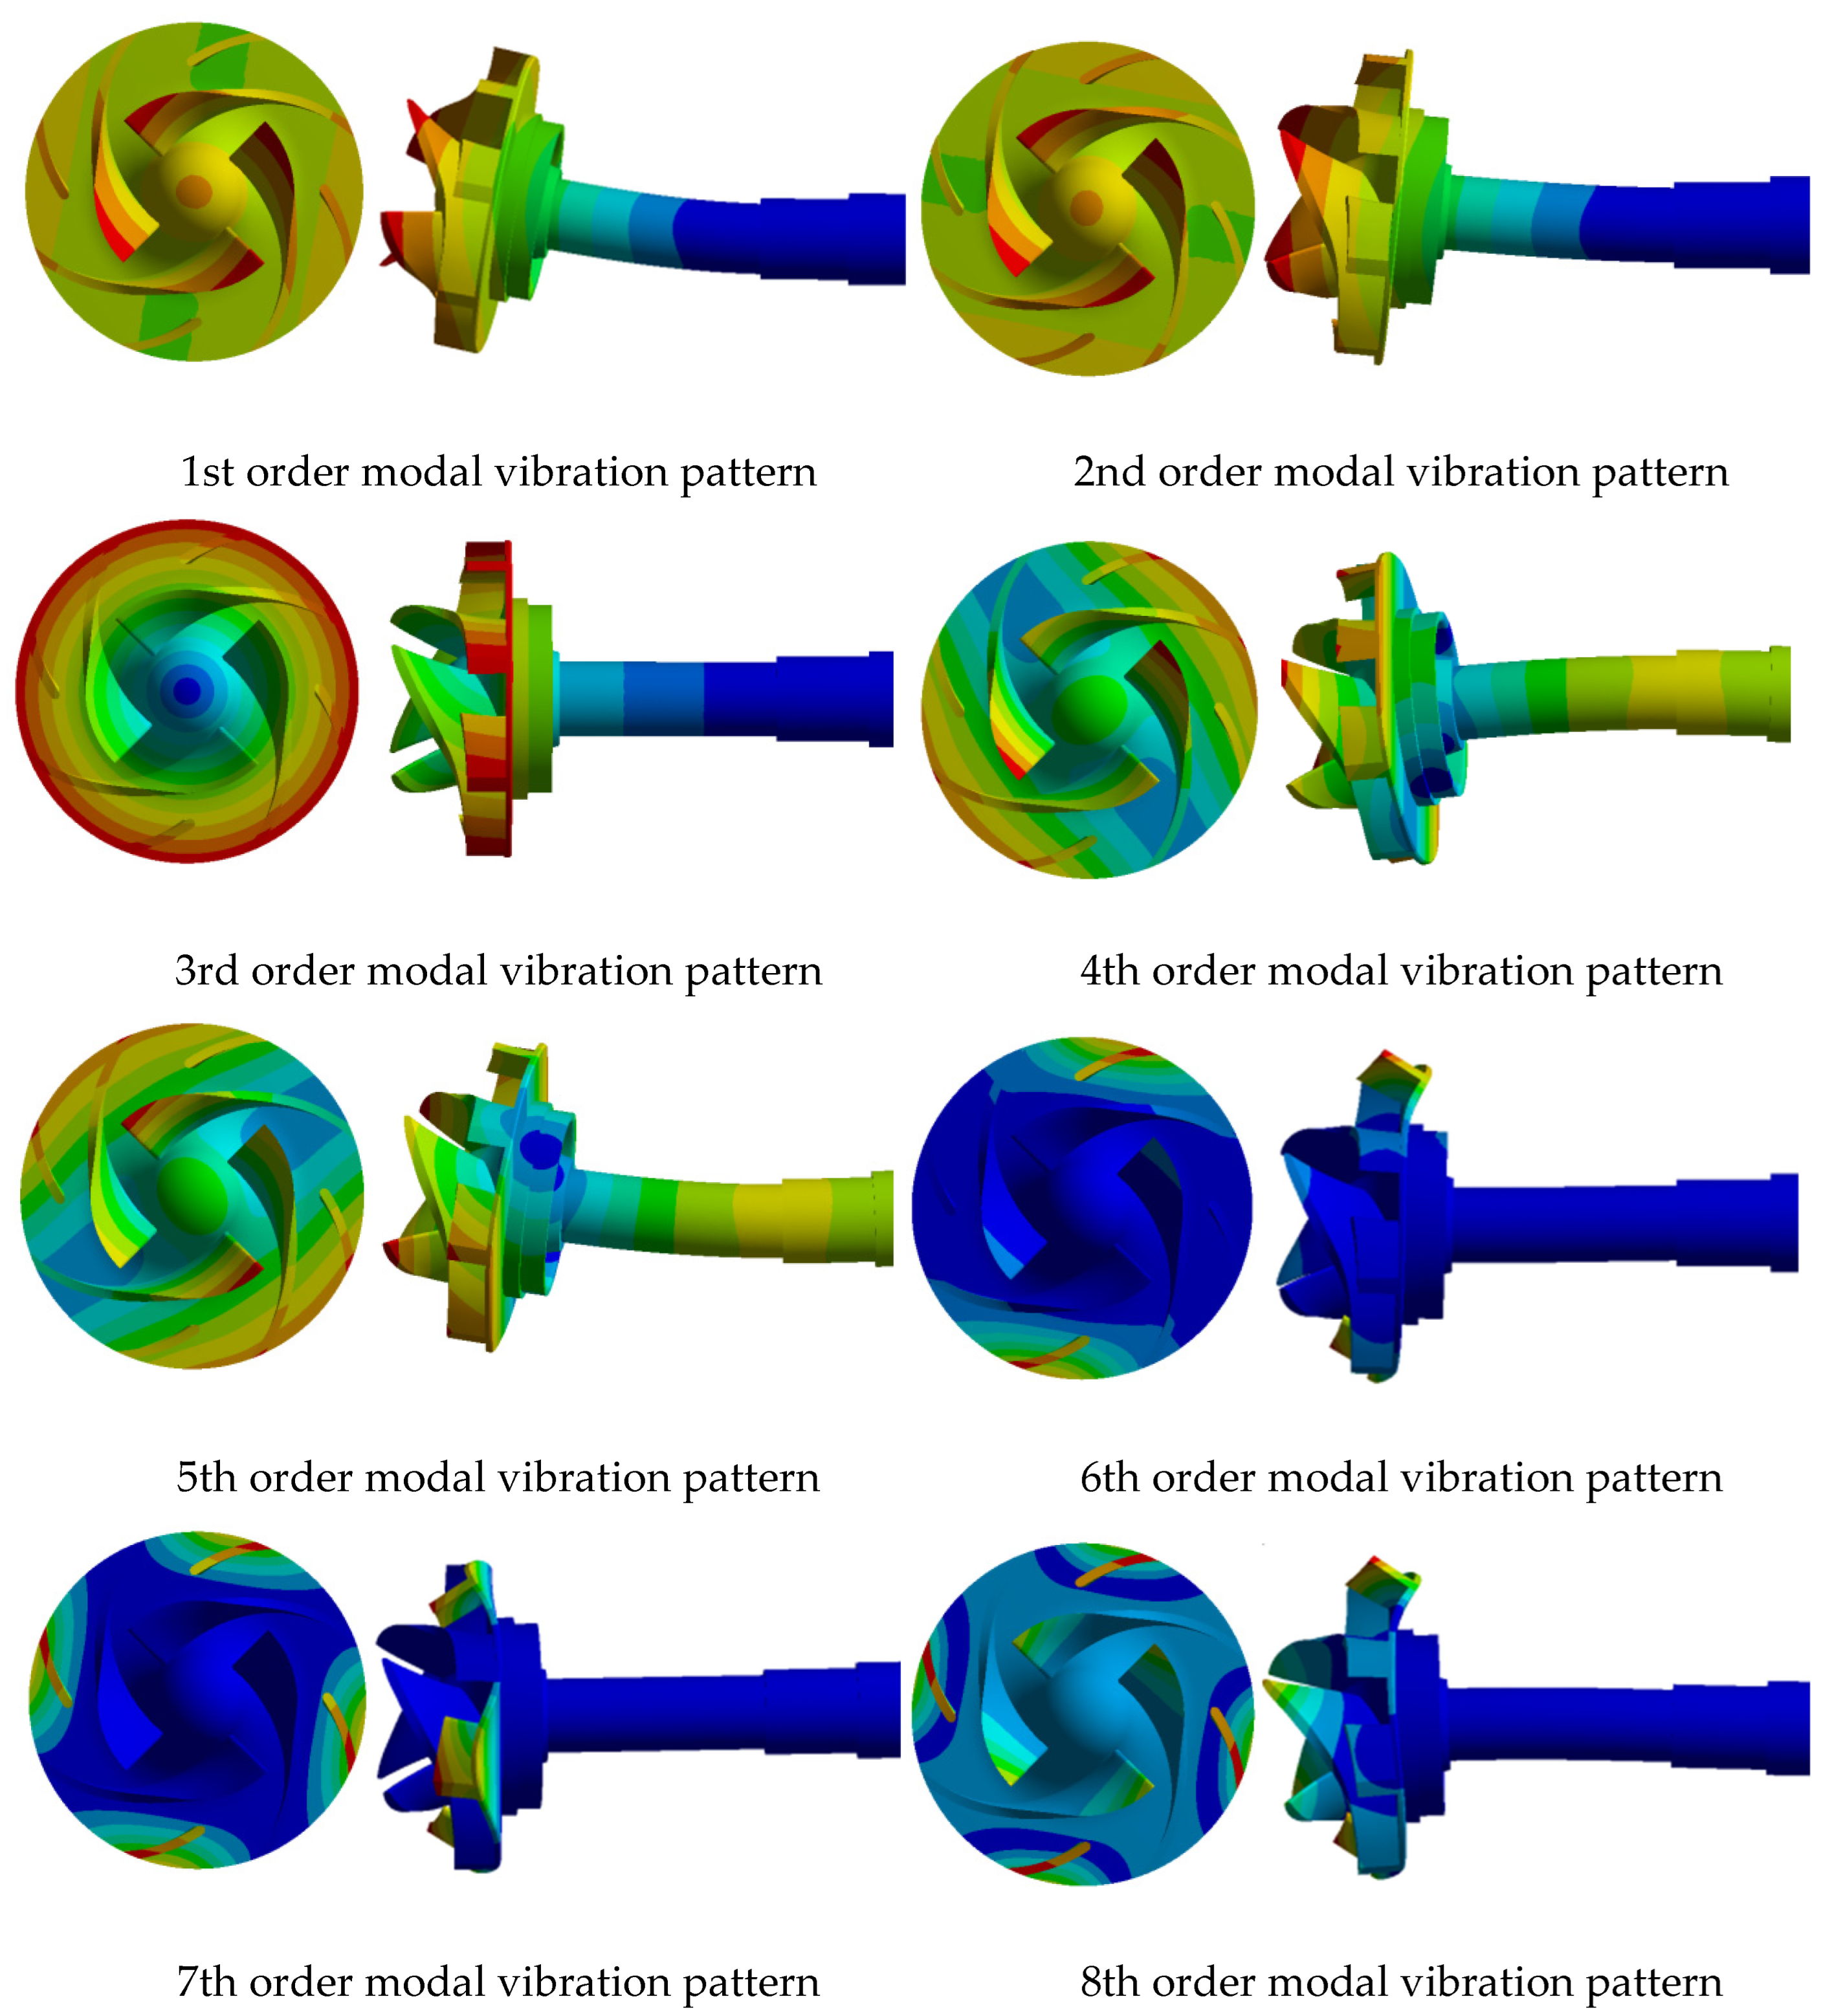
3.4.3. Rotor System Modal Vibration Pattern

The Fore eight modes inherent frequencies of the rotor systems of case A, B, and C are given in Table 4, Table 5 and Table 6. As can be seen from the table, the first two order frequencies of the impeller rotor systems of the three cases are similar. The first-order inherent frequencies of the three impeller cases are far from their corresponding vane passing frequencies. It can be concluded that the three impellers in this study meet the design requirements, which do not easily cause model pump resonance under the flow excitation generated in operation.
The Fore eight modes of case A are given in Figure 14.
In the centrifugal pump rotor system of case A, the first and second modes are similar to the swing around the axis, in which the second order swing amplitude is larger, and the impeller vibration is symmetrically distributed. The torsional deformation of the third mode shape increases gradually along the radial direction. The fourth and fifth steps are oscillatory deformation. The sixth mode shape of the impeller is deformed along the circumferential direction. The 7th and 8th modes of the impeller are distorted, but the distortion direction is different, with a difference of 45°. At this time, the vibration amplitude of the impeller shaft is relatively small.
The Fore eight modes of case B are given in Figure 15.
In the centrifugal pump rotor system of case B, the first and second modes are oscillating. At the same time, the impeller vibration is distributed symmetrically. The third mode is that the impeller twists and deforms along the rotation axis. The vibration at the outlet of the impeller is much larger than that at the inlet. The fourth and fifth modes are oscillating deformation. The two oscillations differ by 90°. The sixth and seventh modes oscillate about the rotation axis. The vibration position mainly concentrates on the impeller inlet blade head position. The eighth mode shape is torsion deformation. The vibration amplitude increases uniformly along the radial direction from the impeller axis to the impeller outlet edge.
The Fore eight modes of case C are given in Figure 16.
In the centrifugal pump rotor system of case C, the first two modes are axial swing and deformation swing. The deformation makes the maximum vibration position of the impeller symmetrical distribution according to the swing axis. The center axis of the two modes is a 90° angle. The third mode is the twist deformation around the rotating axis of the impeller. The fourth and fifth modes are mainly oscillating deformation, and their oscillating directions differ by 90°. The sixth, seventh and eighth modes are the twisting deformation along the rotating axis of the impeller. Large vibration deformation appeared at the exit of the impeller, and there was no strong vibration deformation inside the impeller.

4. Conclusions

In this paper, the hydraulic characteristics of centrifugal pumps with different impeller cases were carried out, and the simulation results were compared with the test values. In addition, the one-way fluid-structure interaction calculation method was adopted in the structural statics and dynamics analysis of the rotor components of the pump based on the ANSYS Workbench platform. The main conclusions are as follows.
(1)
The impeller runs at different flow rates, and the backflow strength is stronger at a small flow rate. Under the same flow rate, the inlet backflow strength of the closed impeller is the minimum, and the backflow strength of the split blade impeller is the maximum. Therefore, the operating stability of split blade impeller is the lowest, and the stability of the closed impeller is the highest.
(2)
By comparing the simulated head coefficient and efficiency with the experimental results, the head error is less than 5%, which verifies the accuracy of the numerical simulation. Comparing the heads and efficiencies of different impeller cases under the optimal flow rates, it can be obtained that the hydraulic performance of the closed impeller is better, and the hydraulic performance of the split blade impeller is worse.
(3)
The maximum equivalent force of the impeller rotor system increases as the flow rate decreases. The maximum equivalent force value of the closed impeller is the largest at the same flow rate, and the maximum equivalent force value of the split blade impeller is the smallest. The maximum total deformation of the impeller rotor system tends to decrease and then increase with the increase of the flow rate. By comparing the maximum deformation of different impellers at the same flow rate, the maximum deformation of the closed impeller is 0.085 mm, followed by that of the semi-open impeller at 0.055 mm, while the maximum deformation of split blade impeller is the smallest at 0.047 mm. This shows that at the same flow rate, the closed impeller is vulnerable to damage, the semi-start impeller is safer, and the split blade impeller is the safest.
(4)
The vibration deformation forms of the first eight orders of the three impeller cases are mainly oscillation deformation around the axis, torsional deformation around the axis, and torsional deformation. The first-order natural frequency of each case is significantly different from the cascade frequency of the centrifugal pump. In three cases, the flow excitation generated during operation will not cause the resonance of the model pump, indicating that it meets the safety requirements.
Due to the limitation of research conditions, this article only uses one-way coupling for simulation. In the subsequent research, it is necessary to adopt the method of two-way fluid-structure coupling to carry out the influence of structural deformation on the flow field, at the same time considering the experimental analysis of vibration characteristics of the centrifugal pump.

Author Contributions

Conceptualization, J.Y. and Y.F.; methodology, J.S.; software, H.C.; validation, J.S., X.H. and R.L.; formal analysis, X.H.; investigation, J.S.; resources, H.C.; data curation, R.L.; writing—original draft preparation, J.S.; writing—review and editing, J.Y.; visualization, Y.F.; supervision, H.C.; project administration, Y.F.; funding acquisition, J.Y. All authors have read and agreed to the published version of the manuscript.

Funding

This investigation was supported by the National Natural Science Foundation of China granted No. 51976078.

Institutional Review Board Statement

Not applicable.

Informed Consent Statement

Not applicable.

Data Availability Statement

Not applicable.

Acknowledgments

This investigation was supported by the National Natural Science Foundation of China granted No. 51976078.

Conflicts of Interest

The authors declare no conflict of interest.

References

  1. Zhao, X.; Xiao, Y.; Wang, Z.; Luo, Y.; Cao, L. Unsteady Flow and Pressure Pulsation Characteristics Analysis of Rotating Stall in Centrifugal Pumps Under Off-Design Conditions. ASME J. Fluids Eng. 2018, 140, 021105. [Google Scholar] [CrossRef] [Green Version]
  2. Shibata, A.; Hiramatsu, H.; Komaki, S.; Miyagawa, K.; Maeda, M.; Kamei, S. Study of flow instability in off design operation of a multistage centrifugal pump. J. Mech. Sci. Technol. 2016, 30, 493–498. [Google Scholar] [CrossRef]
  3. Li, Y.; Li, X.; Zhu, Z.; Li, F. Investigation of unsteady flow in a centrifugal pump at a low flow rate. Adv. Mech. Eng. 2016, 8, 1–8. [Google Scholar] [CrossRef] [Green Version]
  4. Gao, Z.; Zhu, W.; Lu, L.; Deng, J.; Zhang, J.; Wuang, F. Numerical and Experimental Study of Unsteady Flow in a Large Centrifugal Pump With Stay Vanes. ASME J. Fluids Eng. 2014, 136, 071101. [Google Scholar] [CrossRef]
  5. Liu, X.; Hu, Q.; Wang, H.; Jiang, Q.; Shi, G. Characteristics of unsteady excitation induced by cavitation in axial-flow oil–gas multiphase pumps. Adv. Mech. Eng. 2018, 4, 1–9. [Google Scholar] [CrossRef] [Green Version]
  6. Lu, J.; Liu, X.; Zeng, Y.; Zhu, B.; Hu, B.; Yuan, S.; Hua, H. Detection of the Flow State for a Centrifugal Pump Based on Vibration. Energies 2019, 12, 3066. [Google Scholar] [CrossRef] [Green Version]
  7. Cui, B.; Lin, Y.; Jin, Y. Numerical simulation of flow in a centrifugal pump with complex impeller. J. Therm. Sci. 2011, 20, 47–52. [Google Scholar] [CrossRef]
  8. Ye, W.; Luo, X.; Huang, R.; Jiang, Z.; Li, X.; Zhu, Z. Investigation of flow instability characteristics in a low specific speed centrifugal pump using a modified partially averaged Navier–Stokes model. Proc. Inst. Mech. Eng. Part A J. Power Energy 2019, 233, 834–848. [Google Scholar] [CrossRef]
  9. Jia, X.-Q.; Zhu, Z.-C.; Yu, X.-L.; Zhang, Y.-L. Internal unsteady flow characteristics of centrifugal pump based on entropy generation rate and vibration energy. Proc. Inst. Mech. Eng. Part E J. Process Mech. Eng. 2019, 233, 456–473. [Google Scholar] [CrossRef]
  10. Cui, B.; Li, W.; Zhang, C. Effect of Blade Trailing Edge Cutting Angle on Unstable Flow and Vibration in a Centrifugal Pump. ASME J. Fluids Eng. 2020, 142, 101203. [Google Scholar] [CrossRef]
  11. Zhang, N.; Yang, M.; Gao, B.; Li, Z.; Ni, D. Experimental Investigation on Unsteady Pressure Pulsation in a Centrifugal Pump With Special Slope Volute. ASME J. Fluids Eng. 2015, 137, 061103. [Google Scholar] [CrossRef]
  12. Birajdar, R.; Keste, A. Prediction of Flow-Induced Vibrations due to Impeller Hydraulic Unbalance in Vertical Turbine Pumps Using One-Way Fluid−Structure Interaction. J. Vib. Eng. Technol. 2020, 8, 417–430. [Google Scholar] [CrossRef]
  13. Wu, D.; Ren, Y.; Mou, J.; Gu, Y.; Jiang, L. Unsteady Flow and Structural Behaviors of Centrifugal Pump under Cavitation Conditions. Chin. J. Mech. Eng. 2019, 32, 17. [Google Scholar] [CrossRef] [Green Version]
  14. Amromin, E. Estimation of Ventilation Impact on Fluid–Structure Interaction for Partially Cavitating Hydrofoils. ASME J. Fluids Eng. 2020, 142, 111203. [Google Scholar] [CrossRef]
  15. Zhou, B.; Yuan, J.; Fu, Y.; Hong, F.; Lu, J. Investigation of dynamic stress of rotor in residual heat removal pumps based on fluid–structure interaction. Adv. Mech. Eng. 2016, 8, 1–12. [Google Scholar] [CrossRef] [Green Version]
  16. Zhang, L.; Wang, S.; Yin, G.; Guan, C. Fluid–structure interaction analysis of fluid pressure pulsation and structural vibration features in a vertical axial pump. Adv. Mech. Eng. 2019, 11, 1–19. [Google Scholar] [CrossRef] [Green Version]
  17. Birajdar, R.S.; Keste, A.A.; Gawande, S.H. Critical Hydraulic Eccentricity Estimation in Vertical Turbine Pump Impeller to Control Vibration. Int. J. Rotating Mach. 2021, 2021, 6643282. [Google Scholar] [CrossRef]
  18. Huang, H.; Liu, H.; Wang, Y.; Dai, H.; Jiang, L. Stress-strain and modal analysis on rotor of marine centrifugal pump based on fluid-structure interaction. Trans. Chin. Soc. Agric. Eng. 2014, 30, 98–105. [Google Scholar]
  19. Pei, J.; Meng, F.; Li, Y.; Yuan, S.; Chen, J. Fluid–structure coupling analysis of deforSSmation and stress in impeller of an axial-flow pump with two-way passage. Adv. Mech. Eng. 2016, 8, 1–11. [Google Scholar] [CrossRef] [Green Version]
  20. Basawaraj, H.H. A study analysis on centrifugal pump impeller guide vane with fem approach by using different material. IJES 2016, 8, 2303–2308. [Google Scholar]
  21. Li, G.; Wang, Y.; Lv, X.; Li, W. Analysis of flowing mechanism and simulation in impeller with splitting vanes of centrifugal pump. Dongbei Nongye Daxue Xuebao 2011, 42, 68–71. [Google Scholar]
  22. Smith, L.M.; Woodruff, S.L. Renormalization group analysis of turbulence. Phys. Rev. Lett. 1986, 57, 1722–1724. [Google Scholar] [CrossRef] [Green Version]
Figure 1. Fluid domain and 3D model of the centrifugal pump parts: (a) Fluid domains, (b) Volute, (c) Closed, semi-open impeller, (d) Split blade impellers, (e) Pump bonnet.
Energies 15 02133 g001
Figure 2. Grid independence check.
Energies 15 02133 g002
Figure 3. Different impeller rotor structures of the centrifugal pump: (a) Case A impeller, (b) Case B impeller, and (c) Case C impeller.
Energies 15 02133 g003
Figure 4. Solution Strategy of one-way fluid-structure interaction.
Energies 15 02133 g004
Figure 5. The constraint and load of the impeller rotor.
Energies 15 02133 g005
Figure 6. Flow chart of fluid-structure coupling calculation.
Energies 15 02133 g006
Figure 7. Schematic diagram of the test rig.
Energies 15 02133 g007
Figure 8. The velocity streamlines distribution at different flow rates.
Energies 15 02133 g008
Figure 9. The velocity distribution in the impeller C at different flow rates.
Energies 15 02133 g009
Figure 10. Pressure distribution of impeller under different flow rates.
Energies 15 02133 g010
Figure 11. Comparison of predicted and tested hydraulic performance curves of the pumps: (a) Case A impeller, (b) Case B, and (c) Case A impeller.
Energies 15 02133 g011
Figure 12. Curves of maximum equivalent stress of different impeller rotors with flow.
Energies 15 02133 g012
Figure 13. Curves of maximum deformation of different impeller rotors with flow.
Energies 15 02133 g013
Figure 14. Fore eight modes of case A.
Energies 15 02133 g014
Figure 15. Fore eight modes of case B.
Energies 15 02133 g015
Figure 16. Fore eight modes of case C.
Energies 15 02133 g016
Table 1. Primary parameters of the centrifugal pump.
ParametersValueUnit
Rated flow rate, Qd80m3/h
Rated head, Hd30m
rated rotating speed, n2950rpm
blade number, Z7-
Specific speed, ns129-
Inlet diameter of impeller, Dj100mm
Outlet diameter of impeller, D2169mm
Inlet diameter of pump, Ds100mm
Outlet diameter of pump, Dd80mm
Outlet width impeller, b221mm
Table 2. Scheme of the grid-independence check.
Scheme123456
Number of grid cells (million)1.582.242.93.784.525.22
Table 3. Correlating setting of numerical simulation.
Boundary ConditionsSetup
Turbulence model RNG   k - ε
Reference pressure1 atm
ImportTotal pressure
ExportMass flow rate
Dynamic and static interfaceFrozen-rotor
WallNo slip, smooth
Discrete formatUpwind, high resolution
Convergence residual accuracy10−5
Table 4. The first 8 order natural frequencies of impeller rotor in case A.
Number of StepsInherent FrequencyNumber of StepsInherent Frequency
1280.88 Hz5683.98 Hz
2280.89 Hz61838.7 Hz
3533.87 Hz71838.8 Hz
4683.91 Hz81942.6 Hz
Table 5. The first 8 order natural frequencies of impeller rotor in case B.
Number of StepsInherent FrequencyNumber of StepsInherent Frequency
1455.64 Hz5703.2 Hz
2455.68 Hz61750.3 Hz
3611.46 Hz71750.6 Hz
4702.82 Hz81911.4 Hz
Table 6. The first 8 order natural frequencies of impeller rotor in case C.
Number of StepsInherent FrequencyNumber of StepsInherent Frequency
1472.45 Hz5770.93 Hz
2472.45 Hz61850.7 Hz
3651.87 Hz71851.7 Hz
4770.91 Hz81927.9 Hz
Publisher’s Note: MDPI stays neutral with regard to jurisdictional claims in published maps and institutional affiliations.

