Abstract
International maritime transport organizations are proposing regulatory actions and strategies aimed at decarbonizing the sector to reduce its greenhouse gas (GHG) emissions, which currently constitute around 3% of the global total. Hybrid propulsion systems have significant potential in this respect, as a means of power-saving in ships. This paper describes a high-fidelity benchmark for hybrid-electric vessels, combining diesel generators and batteries. The benchmark consists of detailed models, the parameters of which are provided so that the models can be reproduced. The proposed hybrid-electric ship topology and control system was validated using real-time hardware-in-the-loop (HIL) simulations on a Typhoon HIL402 platform. The results provide a detailed analysis of the operation of the different components under varying conditions, which should be useful in prototyping these kinds of systems. In addition, the response of the system was evaluated with regard to potential disturbances resulting from the control system’s operation. The results show the system performed correctly during these transitory events, with no undesirable responses.
1. Introduction
International maritime transport contributed about 2.89% of the total world anthropogenic greenhouse gas (GHG) emissions in 2018, according to the International Maritime Organization (IMO) [1]. To contextualize this data, this means that “if global shipping were a country, it would be the sixth largest producer of greenhouse gas emissions. Only the United States, China, Russia, India and Japan emit more carbon dioxide than the world’s shipping fleet” [2]. Furthermore, if the regulations and agreements on GHG emissions from ships are analyzed, it is found that: “at least until the fall of 2020, the only mandatory regulatory action limiting GHG emissions from ships has been the adoption of the so-called Energy Efficiency Design Index (EEDI) by the IMO, which is an index that measures CO2 emissions per tonne-mile” [3]. An intermediate target (in terms of ambition) proposed in the Initial IMO Strategy [4] is to reduce these emissions by at least 40% by 2030 (i.e., returning to 2008 levels). In this context, it is obvious that developing solutions to reduce the fuel consumption of ships is essential to meet this target.
Road transport is leading the transition to decarbonization. There are many possible pathways to achieving this aim, including strategies such as improvements to aerodynamics, improvements to propulsion efficiency, waste heat recovery, alternative fuels and power sources (hydrogen, biofuels, etc.), hybridization of drive trains and electrification, among many others [5]. In [6], it was shown that electrification of road freight is feasible in developed countries. Although electrification of the transport system undoubtedly faces serious challenges, the technologies currently available are mature (e.g., hybrid vehicles and electric vehicles), and developments in the electrification of road transport are attracting attention in other sectors, such as maritime transport. Hybridization, for example, is regarded as a viable and transitory step toward powertrain electrification [7], with significant potential for power-saving in ships [8]. Hybrid propulsion systems make it possible to operate the combustion engines within high-efficiency operating points (avoiding low-efficiency operating points by using the battery), thus resulting in energy savings, depending on the characteristics of the driving cycle and the kind of ship (e.g., a range of 9–13% of energy consumption reduction in the case of inland transport vessels [9] and 2.91–7.48% fuel consumption reduction in short-haul RORO ferries [10]).
The hybridization of ships requires the appropriate design of integrated electric power systems, which in turn, require the presence of complex control systems. Simulation and hardware-in-the-loop (HIL) testing make it possible to assess how the system responds to perturbations, as well as its functional integration [11]. Since these tools are well-known in the academic field, it should be fruitful to analyze the recent literature (i.e., published within the last five years and providing sufficient methodological information regarding modeling and simulation/experimentation) to look for the advances made in this area of research.
Focusing first on simulation-based approaches, there has been a large number of such studies [12,13,14,15,16,17,18,19], one of the most common objectives of which has been to investigate the performance of hybrid storage systems that can add capabilities to the ship (e.g., mitigating load fluctuations) [12,13,14]. In [12], equivalent circuit models of the hybrid storage systems under study were constructed using specialized libraries of MATLAB/Simulink. The simulation response of these models was compared to that obtained from an experimental setup composed of real lead-acid and lithium-ion batteries, supercapacitors, a power converter to supply the loads and energy-storage system controllers to control the operation modes of each energy-storage unit. The proper interaction between batteries and ultracapacitors for shipboard electric propulsion systems was studied in [13], where the large power and torque fluctuations due to propeller rotational motion and waves were solved using two novel energy management strategies (EMSs) based on model predictive control (MPC). Simulation results show that the coordination within HESS provides substantial benefits in terms of reducing fluctuations and losses. Although the software used for the simulations was not specified in the paper, all the system parameters were provided together with the sensitivity analysis of the parameters of the controllers. The research presented in [13] was continued in [14], where the proposed control was improved using an adaptive MPC with online identification of the parameters of the hybrid energy storage system. Both a simulation and experiments were performed to show its effectiveness, resulting in a power-loss reduction as high as 15% in the experiments compared to the MPC without online parameter identification. Another common objective of the studies in this category is the optimal scheduling of the power generation of the hybrid ship [15,16]. This approach involves complex energy management strategies for optimizing control using different algorithms. However, because their objective is long-term, requiring test periods of several hours, there is a tendency for the models to be simplifications, and consequently, some system variables, such as the duty cycles of the power converters or the current and voltage waveforms of the electrical machines, are not taken into consideration. In [15], the sampling rate the data loggers used to obtain the loading profile used for the simulations was set to 40 s and the durations of the simulations were 12 and 24 h with time-steps too long to consider detailed models, but this allowed the researchers to demonstrate that the ECMS offered notable fuel savings. Instead of fuel savings, the objective of [16] was to minimize the operation cost of a full electric-propulsion ship and the GHG emissions. In this case, a sampling time of 30 min and a load profile of 9 h were considered. The proposed algorithm, based on the particle swarm optimization (PSO) method and fuzzy logic, was validated against the results provided by applying dynamic programming to the minimization problem formulated. When the objective of the study is to evaluate a novel control strategy in detail, or to conduct a comparison between different controls, it becomes necessary to develop detailed models of the system components. These models enable high-fidelity simulations to be carried out that test the performance of the control strategies proposed, and which, in some cases, are also validated by experimental laboratory tests [18]. A meta-heuristic algorithm, specifically a grey-wolf optimization algorithm for power management, was proposed in [10] for a direct current (DC)-based electric-propulsion ship. The performance of the proposed algorithm was assessed through simulations using MATLAB/Simulink software with detailed models that included power converters, diesel gensets and batteries, and simplified models of the loads (represented by variable resistances). Fuel consumption and emission indicators were compared with the results of classical power management via rule-based control for the same DC system, and of a homologous, conventional alternating-current (AC) propulsion system, showing a 7.48% fuel-consumption reduction. Another DC topology was considered in [17], but including a fuel cell and photovoltaic panels, to propose a power-management strategy based on decentralized MPC. The MATLAB/Simulink environment was used to study the proposed system under various operational modes. The modeling of the system included nonlinear average switching models of the converters, simplified models for the energy sources where the parameters were taken from commercial components and simplified electric loads that were proposed to be replaced by electric motors with their dynamics in future works. In [18], a simple and accurate control scheme based on the stabilization of the DC-link was proposed for an electric-propulsion excursion ship with a diesel generator and hybrid energy-storage system composed of batteries and supercapacitors. The model of the system was developed in the MATLAB/Simulink environment using simplified models (e.g., models of power converters based on average behavior) to avoid unnecessary complexity. Despite the simplification, the results provided by an experimental platform supported the satisfactory performance of the proposed control. Finally, inspired by previous automotive research in EMS, two ECMS-based controllers were applied to a ship powered by a hybrid propulsion plant in [19]. The proposed EMSs had the additional challenge of determining the optimal power-split between different power sources in real-time. The real-time EMSs were compared to a rule-based EMS and dynamic programming was used to benchmark the results. The model of the system was based on a modular, hierarchical and causal modeling approach that allowed for investigating fuel consumption estimation, engine thermal loading and maneuverability, among other variables. The complexity of the model could be summarized as follows: the model consisted of five sub-models with a system of differential and algebraic equations and two sub-models of algebraic equations. MATLAB/Simulink software was used to simulate the experiments for the different control strategies. Simulation results demonstrated that fuel savings of 5% to 10% can be achieved with the proposed methods, within 1–2% of the global optimum solution.
Moving on now to HIL testing, because this technology is relatively new, there are fewer, albeit more recent, studies [20,21,22,23,24,25,26,27]. HIL testing is commonly applied in prototyping new components/subsystems to demonstrate their applicability to real environments [11]. In the case of ships, it allows short circuits and other transients to be tested without the dangers and cost involved in testing real high-power hardware. In [20,21], HIL was used to validate the power systems and EMSs of electric ships based on MVDC. In the case of [20], a novel EMS based on fuzzy logic was compared with a classic control system based on PI controllers by real-time HIL simulations along with experimental validation using controller hardware-in-the-loop (CHIL). A different approach was carried out in [21], where the power components were emulated using reduced-scale components (propulsion motor, propeller machine and power converters), and the control algorithm was implemented in a dSPACE HIL platform communicating with them. A different ship topology was studied in [22], in which an AC microgrid was used for the integration of different renewable sources and storage systems in the ship’s power system. HIL simulations using the OPAL RT-Lab platform were carried out to validate the proposed control algorithm (sine cosine algorithm based on wavelet mutation, SCAWM), taking into account that the HIL method provides real-time analysis and considers errors and delays that do not exist in offline simulations. The results showed that the proposed EMS was able to offer an effective trade-off between power generation and load, and thereby maintain the quality of power and frequency deviation within the desired limits. Less detailed models were considered in [23] for a hybrid-electric ship consisting of a diesel engine and a battery on an AC network. Given that the objective of the EMS was to optimize fuel consumption and GHG emissions in the long term (the study analyzed these variables over a year of operation), the power system models needed to be simplified. The HIL experiment used the dSPACE PX10 platform for emulating the ship’s power system (modeled using MATLAB/Simulink), a dSPACE MicroAutobox for running the EMS and a desktop for monitoring the experimental variables. In a similar vein, when the objective of the research is to find an optimal power flow over a long period, the level of detail required of the models for the real-time simulations is reduced [24,25]. In [24], the objective was to demonstrate the operability of an emission-free ferry using a propulsion system based on fuel cells and batteries. In this case, real sailing routes were used to perform the HIL simulations. A similar study for another fuel cell-battery ship was carried out in [25]. Another kind of DC-based full-electric ship supplied by batteries and supercapacitors was considered in [26] for testing a power-distribution strategy in DC networks based on the virtual impedance method. In this case, the HIL experiment was performed in a StarSim HIL platform, in which the power system was emulated with detailed models, and digital signal processors were employed to implement the proposed control. Finally, [27] is given as an example of the power hardware-in-the-loop (PHIL) approach. This approach combines HIL technology with high-power components, and can be considered as the step after HIL testing along the path to prototyping. The laboratory described in [27] was rated as 5 MW at DC voltages from 6 to 24 kV and was used for the development of projects related to naval research such as MVDC systems for all-electric ships.
Following a review of the literature on HIL real-time simulations of electric-propulsion systems for ships, the main contributions of this paper are the following:
- The development of a high-fidelity benchmark for hybrid-electric vessels using diesel generators and batteries. This benchmark consists of detailed models, for which the parameters are provided, thus enabling the models to be reproduced on other platforms.
- The validation of the proposed hybrid-electric ship topology and control system using real-time HIL simulations on a Typhoon HIL402 platform.
- The incorporation of the maximum degree of complexity allowed by the HIL platform. The electrical topology of the proposed benchmark has not been commonly employed in previous studies using HIL technology, probably because the complexity of the models has stretched the computational capacity of commercially available HIL platforms. To circumvent this limitation, previous studies have often simplified parts of the model (e.g., reducing the system from three-phase to one-phase, averaging power converters, etc.), to allow the inclusion of more elements in the system while neglecting some phenomena that can appear in the real world.
- The application of the EMS to maritime transport. Although the proposed system itself is not novel (in that it follows the rule-based strategy used in commercial hybrid-electric vehicles), it has never before been implemented in ships, nor has its performance been validated by HIL technology.
The main aim of this study was to validate the proposed hybrid-electric topology with real-time HIL simulations and high-fidelity models. The results provided by the HIL simulations show the operation of the different components of the system in detail, and will be valuable should these systems reach the prototyping stage. Furthermore, the study also evaluated the response of the system to potential disturbances resulting from whatever EMS is used. The results show that the system performed correctly during these transitory events with no undesirable responses.
The paper is organized as follows. The introduction above locates the research in the context of the current literature on hybrid ships and sets out its main contributions, together with the aim of the study. Section 2 below provides all the information relating to the models developed in this work, including parameters, mathematical expressions and block diagrams, to allow the results to be replicated. In addition, the energy management system (EMS) used for the validation is described in-depth. Section 3 presents the results obtained from the real-time HIL simulations. It describes two case studies, one analyzing the operation of the system under steady-state conditions and the other analyzing the transients resulting from changes in the different modes of operation controlled by the EMS. These results are discussed in Section 4. Finally, the last section presents the conclusions drawn from this work.
2. Materials and Methods
This section gives a detailed description of the benchmark developed to study the performance of hybrid-electric-propulsion systems of ships. It is organized into two parts. First, the system modeling for all components is presented, including all the necessary elements (mathematical formulations, block diagrams, controllers, etc.) and their respective parameters, to allow the results published here to be replicated. In this case, the model is developed using the library provided by the Schematic Editor of Typhoon HIL, but using the information provided, it can also be reproduced on other platforms, such as MATLAB/Simulink. Second, the energy management system (EMS) in control of the power balance and battery charge is described, together with the control parameters and the selected operational limits. The EMS is based on a well-known rule-based strategy used in several commercial hybrid-electric vehicles. Replacing this EMS with novel control strategies and comparing the results would be a good approach to validating it.
2.1. Ship Propulsion System Architecture
The architecture of the propulsion system is shown in Figure 1. The complete architecture of the ship requires at least two generators that facilitate load-sharing. However, since the objective of this work was to study the performance of the hybridization of the system (i.e., the interaction between the generator and the battery), only one generator was considered in the propulsion system. The system consists of a diesel generator, battery storage system, auxiliary load and propulsion system. The diesel generator is the main energy source and is responsible for keeping the voltage and frequency of the grid constant. The battery storage system has two functions: to give support to the main source when demand is high, and to allow the system to recover power through regenerative braking. The auxiliary load represents the hotel loads of the ship, i.e., loads whose purpose is other than propulsion, such as lighting, air conditioning, refrigeration, communications, etc. Finally, the propulsion system is an electrical drive governing the propulsion of the ship. It consists of an induction machine with its power converter and a mechanical model of the propeller.
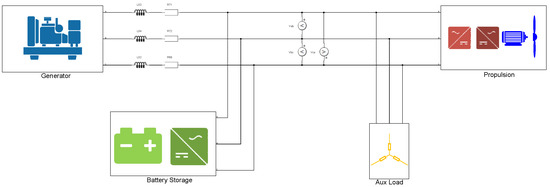
Figure 1.
Architecture of the ship propulsion.
2.2. Modelling the Components of the Electric Power System
In this subsection, each model of the various components comprising the electric power system is described in-depth. All the models were built using components from the Typhoon HIL library [28]. The Typhoon HIL Schematic Editor includes a wide variety of pre-built component models and features, and several commercial toolboxes are also available. The platform is widely used in the development and testing of hybrid and fully electric ship propulsion (cruisers, ferries, container ships, etc.), for a wide range of purposes including power-management system testing, system pre-commissioning, test-driving components from different vendors and exploring different scenarios such as genset load-sharing, emergency power, protection settings and so on.
2.2.1. Diesel Generator
The model of the diesel generator is composed of four components: a controlled three-phase voltage source, power meter, first-order model of the generator and speed regulator. A functional diagram of this model, including the interrelationships of the components, is shown in Figure 2.
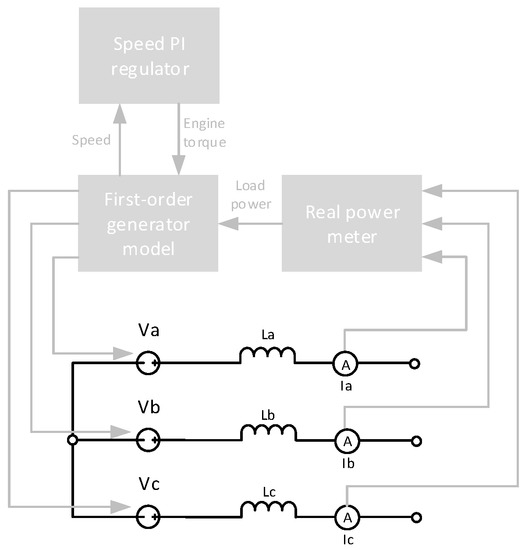
Figure 2.
Block diagram of the diesel generator.
The electrical part of the model consists of a controlled three-phase voltage source, together with three inductors and three current meters. The power meter measures the current to calculate the load power required by the generator.
The first-order model of the diesel generator (Figure 2) corresponds to the “first-order” representation described in [29], the electrical equations of which are based on direct- and quadrature-axis representations of the synchronous machine. The mechanical part of this model is based on two expressions. The first is the swing equation of a synchronous machine with a total system inertia J that is driven by a prime mover:
where Tm and Te are the mechanical and electrical torques and ωm is the mechanical rotor speed. The system damping was not considered in this model. The second expression corresponds to the electromechanical torque expressed in terms of dq variables, calculated as:
where Ψ is the winding flux linkage, i is the winding current (whose subscripts d and q refer to the direct- and quadrature-axis equivalent armature windings, respectively) and Np is the number of magnetic poles of the machine.
The speed controller compares the measured and reference rotor velocities in a PI controller and generates a reference torque for the electric drive.
The parameters of the diesel generator are given in Table 1.

Table 1.
Parameters of the diesel generator.
2.2.2. Battery Storage System
The model of the battery storage system can be divided into four parts: battery, inverter, filter and inverter-controller. The inverter allows the connection of the battery to the three-phase AC grid of the ship. The filter is needed to attenuate the high-frequency harmonics and ensure the quality of the current injected into the grid. The inverter-controller generates the driving signals via the inverter switches according to the measurements taken at the inverter and battery outputs. Further information useful for understanding the construction of the model is provided in Figure 3.
Figure 3.
Block diagram of battery storage system.
The battery is implemented using a generic set of equations that reproduce the behavior of a real battery based on its discharge curve. The remainder of the model is made up of a controlled voltage source and a series of resistance. The voltage of the controlled source depends on the discharge state, according to the following expression:
where it is the discharge state of the battery, A is the voltage drop during the exponential zone of the discharge curve, 3/B is the charge at the end of the exponential zone, Q is the battery capacity, K is the polarization voltage and E0 is a voltage constant. These parameters can be calculated as:
where ibat is the current that flows from the voltage source, Efull is the fully charged voltage of the battery, Eexp is the voltage at the end of the exponential zone of the discharge curve, Enom is the voltage at the end of the nominal zone of the discharge curve, Qnom is the state of discharge (Ah) at the end of the nominal zone of the discharge curve and Rbat is the series resistance of the battery model.
The battery selected for this study was a lead-acid type, with the characteristics outlined in Table 2.
Table 2.
Parameters of the battery.
The inverter was modeled using the three-phase two-level inverter block in the Typhoon Schematic Editor and selecting the internal modulator option. This option allows the IGBT switches to be driven by an internal PWM modulator, the reference signals for which were the reference currents for each phase. A carrier frequency of 10 kHz was selected for the modulation, with a dead period of 0.5 μs. Switching and conduction power losses were not considered in this study.
As mentioned above, the inverter interfaced with the grid through a filter. For this study, an LCL filter was chosen. These can follow different design procedures [30]; in this case, following the findings of [30], the ripple inductance (at the output of the inverter) was set higher than the line inductance, while the capacitance selected was the minimum possible to limit the damping loss. The parameters of the LCL filter are presented in Table 3.
Table 3.
Parameters of the LCL filter at the inverter battery output.
The inverter-controller was implemented using a current-control strategy. As can be seen in Figure 3, the currents at the output of the LCL filter and the phase voltages before the output inductance of the filter were measured. The voltages were used in a phase-locked loop (PLL) algorithm to estimate the supply voltage phase θp needed to transform the measured currents from the abc frame to the dq frame and provide synchronization to the inverter. Once the measured currents were transformed to the dq frame, they were compared with their respective reference values id,ref and iq,ref in two PI controllers (one for each component) that generated the reference voltages used for the PWM of the inverter switches. id,ref was used to control the active power exchange with the ship grid by the battery storage system and iq,ref allowed the reactive power control. These reference currents were generated by the energy management system (EMS) described in the next section. The parameters considered for the inverter-controller are provided in Table 4.
Table 4.
Parameters of the inverter-controller.
2.2.3. Auxiliary Load
The auxiliary load was modeled as a three-phase wye-connected RL load. It was considered a mainly resistive load with a resistance per phase of 300 Ω and an inductance per phase of 0.01 H.
2.2.4. Propulsion System
The propulsion system model consists of four subsystems forming an electrical drive: power converter, induction motor, propeller and converter controller. Since the induction motor must be appropriately supplied by the power source to provide proper torque and speed to the shaft, a power electronic converter is necessary to provide the required adjustable voltage to the electric machine. The converter controller generates the reference voltages that the power converter must provide from electrical and mechanical variables and the user command (which defines the acceleration torque, for example, with a pedal or a lever). Figure 4 is a diagram of the propulsion system model.
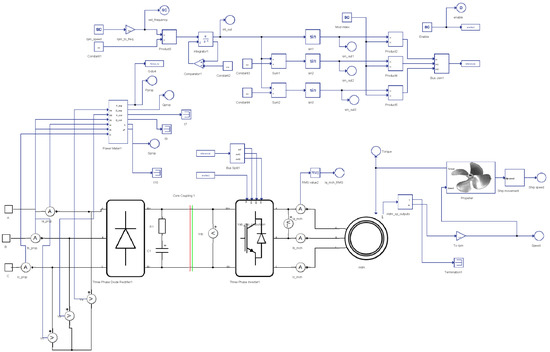
Figure 4.
Propulsion system.
The electric motor is a squirrel cage induction machine modeled as a standard-state space representation in the αβ reference frame, as detailed in [31]. In short, it has an electrical subsystem, which is completely defined by four independent-state variables (the two quadrature components of the rotor and stator fluxes) and a mechanical subsystem defined by two independent-state variables (the angle and angular velocities of the rotor). The variables needed to build the model are provided in Table 5.
Table 5.
Parameters of the induction motor.
The power-converter topology used in this work is a three-phase back-to-back converter (also known as an AC/DC/AC converter). The base model for this kind of converter is a three-phase rectifier connected to a three-phase inverter through an intermediate DC link. In propulsion applications, like the application presented in this work, the use of reversible converters for the rectifier and inverter makes sense since it allows the regenerative power produced during braking events to be recovered. However, if both active converters were considered for this back-to-back converter, together with the battery inverter, the configuration would have exceeded the capacity of the cores in the Typhoon HIL machine used (HIL402) for the simulations. Consequently, the rectifier was modeled as a passive rectifier composed of diodes, thus negating the ability of the model to reproduce regenerative braking. However, a braking resistor was added to the DC link to dissipate the regenerative power generated during the braking events and quantify the regenerative energy. To model the inverter, a three-phase two-level inverter block was used in Typhoon’s Schematic Editor, with the option of internal modulator selected, as in the case of the battery inverter described above. The DC link has a capacitor with a capacity of 50 mF and an internal resistance of 0.1 mΩ.
The inverter has a scalar V/f control with a ratio of 1:50. When the speed command (in rpm) is given, the resulting reference frequency enables the voltage to be calculated so that the PMW generator can send the trigger signals to the inverter switches.
Finally, the propeller was modeled using the following expressions. The main expression calculates the torque applied for the induction motor, Tim (in Nm), as a function of the propeller speed:
where np is the propeller speed in revolutions per second, Gr is the gearbox ratio, kq is the torque coefficient (which is a function of the propeller design), ρ is the seawater density in kg/m3 and D is the propeller diameter in m.
The propeller thrust, Tp (in N), is also calculated as a function of the propeller speed:
where kt is the thrust coefficient (dependent on the propeller design). From the propeller thrust, the ship’s speed, vs. (m/s), can be calculated according to the block diagram shown in Figure 5. This diagram represents a simplified dynamic model of a ship, which considers only straight-ahead movement of the ship in calm water. More complex models can be found in the specialized literature, such as describing the ship’s behavior when maneuvering under strong sea conditions. In this model, M is the ship’s mass (50,000 kg), CT is the total resistance coefficient (295), which depends on the hull form and water properties, and tf is the thrust reduction factor (0.2).
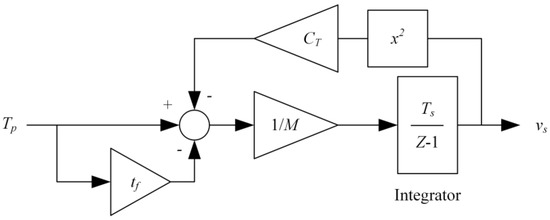
Figure 5.
Propulsion system model diagram.
2.3. Energy Management System
The energy management system (EMS) is an algorithm designed to determine the power balance between the diesel generator and the battery to supply the loads. A well-designed EMS should take into account the following premises: (1) the diesel engine is the main power source and the battery is used to assist it; (2) the power demanded by the loads must be supplied uninterruptedly; (3) the battery state-of-charge (SOC) must be maintained within its operational limits. The EMS implemented in this work is a rule-based strategy similar to the strategies implemented in the hybrid-electric-vehicle industry [32].
The design of the EMS is summarized in Figure 6 and is described below. Firstly, the variables that determine the limits of the EMS are as follows:
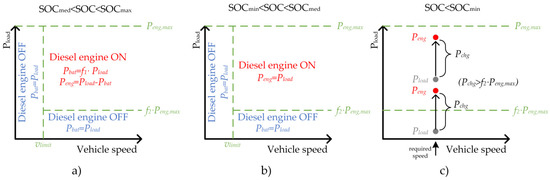
Figure 6.
EMS operation under different SOC conditions: (a) SOC is high; (b) SOC is normal; (c) SOC is low.
- SOCmin is a minimum SOC, set to avoid damaging the battery through excessive discharge. It is common to choose values between 30 and 50% for this parameter.
- SOCmed is a level of SOC, set to keep the battery working within its optimum range of operation.
- SOCmax is the maximum SOC, set to avoid damaging the battery as a result of overcharging.
- Pload is the power required by the ship’s loads, including the auxiliary load and the propulsion load.
- Peng,max is the maximum power that can be delivered by the diesel generator.
- vlimit is the speed at which the diesel engine is turned on. It is common for hybrid vehicles to use batteries for low speeds to prevent the diesel engine from working in its low-efficiency zone.
- f1 is the fraction of the required power supplied by the battery when its SOC is within its operational limits.
- f2 is the fraction of the maximum power of the diesel generator below which the engine should be turned off because its efficiency decreases abruptly.
- Pchg is the charging power supplied to the batteries when its SOC is under SOCmin. This corresponds to a surplus of power generated by the diesel engine versus the required power.
The values of the parameters that define the EMS are outlined in Table 6.
Table 6.
Parameters of the induction motor.
EMS operation depends primarily on the SOC. Three SOC levels can be defined: “high” when it is higher than SOCmed, “normal” when it is between SOCmin and SOCmed and “low” when it is lower than SOCmin.
When the SOC level is high, and the ship’s speed is under vlimit or the power required by the loads is lower than f2∙Peng,max, the diesel engine turns off (see Figure 6a). Under these conditions, the EMS operates in exactly the same way when the SOC level is normal (see Figure 6b). In both cases (high and normal SOC levels), as the SOC is sufficient, the battery is used to start the ship and power it when demand is low, to avoid operating the diesel engine in periods of low efficiency. If the ship’s speed, or the power required by the loads, exceeds the set limits, the diesel engine switches on. Here, however, there is a difference in the operation of the EMS according to whether the SOC level is normal or high: with a normal SOC level the battery is disabled, while with a high SOC level the battery assists the diesel engine, providing a proportion of the power required by the ship (f1∙Pload). As a result, the SOC is reduced to prevent the battery overcharging, and in addition, the fuel consumption of the diesel engine decreases.
When the SOC level is low, additional power is required from the diesel engine to charge the battery. For a specific speed request, if the power required by the load is higher than the diesel engine’s low efficiency threshold, represented by the line f2∙Peng,max (see Figure 6c, top line), the diesel engine generates the required power plus a surplus, Pchg, to charge the battery. If the power demanded by the load is below the diesel engine’s low efficiency threshold, the hypothetical situation could arise where the power of the diesel engine (supplying both the loads and the battery) is less than f2∙Peng,max. In such circumstances, it would make sense to operate the engine at some point between Pload and f2∙Peng,max. However, this situation is avoided by selecting a Pchg higher than f2∙Peng,max (see Figure 6c, lower section).
3. Results
The proposed architecture was validated in real-time tests using a HIL402 real-time device, which implemented the model at a time-step of 1 μs. Different case studies, each featuring a variety of scenarios, are presented in this section to show the operation of the proposed ship architecture under different representative conditions. The first of these shows the behavior of the ship during stationary operation under different EMS modes. The second case study shows the performance of the system during transient events.
3.1. Case Study 1: Stationary Operation
3.1.1. Scenario A: Ship Working at Full Power + Battery with Normal SOC
This scenario represents the performance of the ship when the EMS is operating as shown in Figure 6b. Specifically, the conditions are that the battery has an SOC of 70%, and the power required by the propulsion motor is the maximum allowed. As a result, the EMS commands the diesel engine to provide all the power required by the loads.
The results obtained for this scenario are shown in Figure 7. When the readings were taken, the ship’s speed was 28.86 knots, the propulsion motor was spinning at 1495 rpm, the torque applied to the propeller was 4281 Nm, the diesel generator was generating 0.7 MW and the battery SOC was 70%.
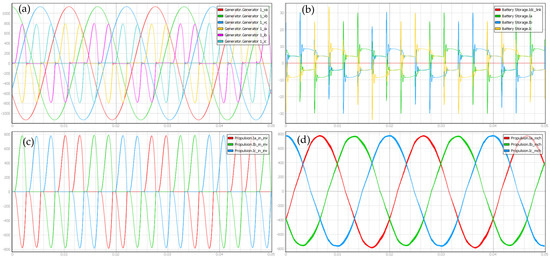
Figure 7.
Results of case study 1/scenario A. From left to right, top to bottom: (a) diesel generator phase voltages and currents; (b) battery currents (at the battery itself and at the output of the filter); (c) input currents to the propulsion system; (d) stator currents of the induction motor.
As can be seen, the generator current is almost the same as the current supplied to the propulsion system. These currents show the harmonic distortion that the propulsion converter produces. However, they are not the same because there is an almost negligible current flowing through the output filter of the battery inverter, as shown in the top right-hand graph in Figure 7. The same graph also indicates that the battery current is null. Finally, in the bottom right-hand graph, it can be noted that the stator currents supplied to the inductor motor by the power converter present a low ripple and a waveform close to a perfect sinusoidal signal.
3.1.2. Scenario B: Ship Working at Full Power + Battery with High SOC
This scenario represents the performance of the ship when the EMS is operating as shown in Figure 6a. Specifically, the conditions are the same as above, with the sole difference that the battery SOC is 85%. As a result, the EMS commands the battery to give support to the diesel engine.
The results obtained for this scenario are shown in Figure 8. When the readings were taken, the ship’s speed was 28.86 knots, the propulsion motor was spinning at 1495 rpm, the torque applied to the propeller was 4281 Nm, the diesel generator was generating 0.4 MW and the battery SOC was 85%.
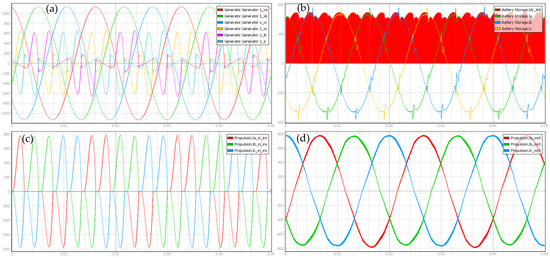
Figure 8.
Results of case study 1/scenario B. From left to right, top to bottom: (a) diesel generator phase voltages and currents; (b) battery currents (at the battery itself and at the output of the filter); (c) input currents to the propulsion system; (d) stator currents of the induction motor.
In this case, unlike the previous one, the battery is enabled. Regarding the battery currents, shown in the top right-hand graph in Figure 8, it can be seen that the current flowing from the battery (in red) is a chopped signal due to the operation of its inverter. The remaining currents are those at the output of the filter. In this case, the current injection from the battery system increases the harmonic distortion of the diesel generator currents. Finally, in the bottom right-hand graph, it can be observed that the stator currents supplied to the inductor motor are not affected by the battery system interaction.
3.1.3. Scenario C: Diesel Engine Supplying the Loads and Charging the Battery
This scenario represents the performance of the ship when the EMS is operating as shown in Figure 6c. Specifically, the battery SOC is 40%. As a result, the EMS commands the diesel engine to generate a surplus of power over that required by the loads to charge the batteries.
The results obtained for this scenario are shown in Figure 9. When the readings were taken, the ship’s speed was 14.45 knots, the propulsion motor was spinning at 749 rpm, the torque applied to the propeller was 1078 Nm, the diesel generator was generating 0.81 MW and the battery SOC was 40%.
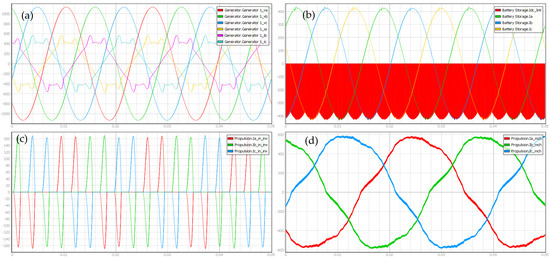
Figure 9.
Results of case study 1/scenario C. From left to right, top to bottom: (a) diesel generator phase voltages and currents; (b) battery currents (at the battery itself and at the output of the filter); (c) input currents to the propulsion system; (d) stator currents of the induction motor.
In this case, regarding the battery currents, as shown in the top right-hand graph in Figure 9, it can be seen that the current flowing from the battery (in red) is a chopped signal due to the operation of its inverter. The remaining currents are those at the output of the filter. In this case, the battery converter is operating in the opposite direction (as a rectifier, from the ship’s grid to the battery) and the currents observed at the battery filter are better in terms of power quality. It should be noted that the power flow from the generator to the battery system and the loads positively affect the harmonic distortion of the diesel generator currents. Finally, in the bottom right-hand graph, it can be observed that the stator currents supplied to the inductor motor present a worsened waveform compared to the previous scenarios due to the reduction in the demand for propulsion power (the ship operating at approximately half the full load).
3.2. Case Study 2: Transient Operation
3.2.1. Scenario A: Speed Step Command
This scenario shows the performance of the ship, operating under a diesel engine with battery support (see Figure 6b), in response to a disturbance characterized by a sudden command for an increase in speed from the propulsion system. Specifically, the conditions are that the battery has a high SOC (around 80%) and the required speed increases from 1000 to 1100 rpm.
Figure 10 shows the results for this scenario. The sudden variation in the speed command requires a proper response from the power sources of the system. The top left-hand graph in Figure 10 shows the rising power demand of the propulsion system during this increase in the speed command, and also the power-sharing between the diesel generator and the battery. Further to this, if the dynamic response of the sources is analyzed, the diesel engine presents a higher dynamic response than the battery. Considering the currents, the waveforms follow the trend observed for the powers, and no spikes or anomalies (resulting from switching events during the transition) can be observed.
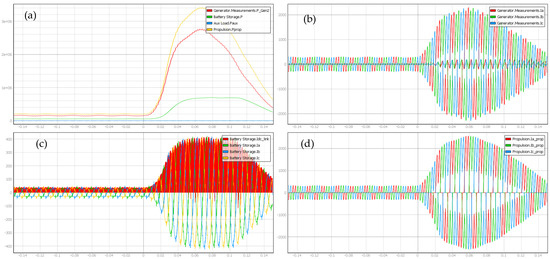
Figure 10.
Results of case study 2/scenario A. From left to right, top to bottom: (a) power associated with diesel generator, battery, auxiliary load and propulsion system; (b) diesel generator currents; (c) battery currents (at the battery itself and at the output of the filter); (d) input currents to the propulsion system.
3.2.2. Scenario B: Switching on the Battery Charging
This scenario shows the transition that happens when the battery reaches a low SOC level (see Figure 6c) while the loads are supplied only by the diesel generator. At this point, additional power, Pchg, is required from the diesel engine to charge the battery. This scenario is studied under the following conditions: the ship is moving at a stable cruising speed of 19 knots, with the propulsion motor running at 995 rpm.
Figure 11 shows the results for this scenario. The top left-hand graph in Figure 10 shows the increase in power from the diesel generator when the EMS commands the batteries to be charged. This increase is smooth and no spikes are produced during the transition. It can also be seen that enabling the battery to charge causes a slight decrease in the propulsion power. This decrease can be observed even more clearly in the propulsion system currents in the bottom right-hand graph. The duration of this power drop is 0.1 s, after which the system returns to steady-state operation. Regarding the battery currents shown in the bottom left-hand graph, it can be observed that before enabling the battery to charge, the currents observed in the graph correspond to the currents supplied to the output filter (see case study 1/scenario A).
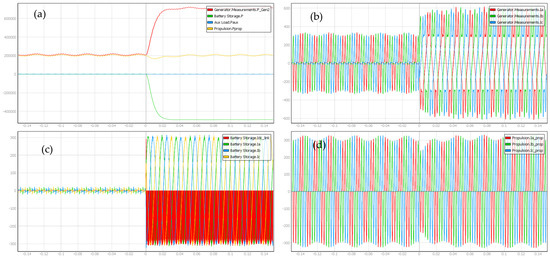
Figure 11.
Results of case study 2/Scenario B. From left to right, top to bottom: (a) power associated with diesel generator, battery, auxiliary load and propulsion system; (b) diesel generator currents; (c) battery currents (at the battery itself and at the output of the filter); (d) input currents to the propulsion system.
3.2.3. Scenario C: From Battery Supply to Diesel Generator Supply
This scenario represents the performance of the ship when the EMS goes from a battery- to a diesel-powered operating state, which occurs when the ship exceeds a set speed limit (in Figure 6b, this transition is represented by the transition from left to right of the vertical line vlimit). Specifically, the battery SOC is 60% and the ship is initially cruising at a speed of approximately 5 knots, then the speed command of the propeller is increased such that the ship’s speed exceeds the threshold (6 knots) where the diesel engine must be engaged.
The results obtained for this scenario are shown in Figure 12. The top left-hand graph shows the sudden increase in power from the diesel generator when the ship exceeds 6 knots. As can be seen, the battery does not disconnect suddenly but remains working in the voltage-sustaining mode for 0.05 s—note that in this interval of time, the battery goes from discharging to charging, to smooth the connection of the diesel engine. The increase is relatively smooth and no spikes are produced during the transition. It can be observed that the currents of the different elements tend to the steady-state presented in case study 1/scenario A (see Figure 7).
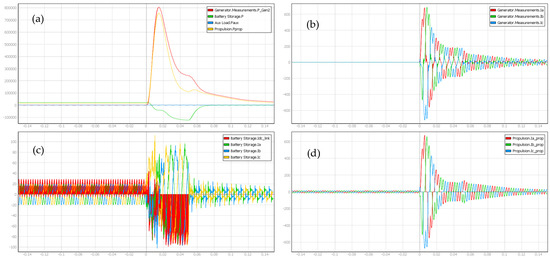
Figure 12.
Results of case study 2/scenario C. From left to right, top to bottom: (a) power associated with diesel generator, battery, auxiliary load and propulsion system; (b) diesel generator currents; (c) battery currents (at the battery itself and at the output of the filter); (d) input currents to the propulsion system.
3.3. Experimental Setup
The experimental study presented in this work was carried out on a Typhoon HIL402 platform as shown in Figure 13. This allowed the different scenarios to be executed in real-time (in this case, with a time-step of 1 μs). Figure 13 depicts the HIL device where the model is executed in real-time, with the laptop as a user-interface to configure the experiments, and the oscilloscope showing different variables of the system.
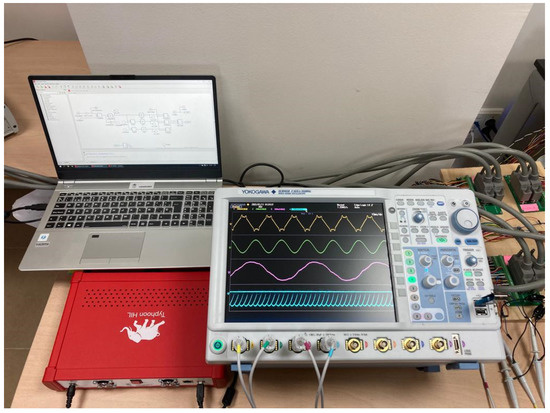
Figure 13.
Experimental setup.
The following figures show the oscilloscope results from some of the case studies above. Figure 14 corresponds to case study 1/scenario A (see Figure 7); Figure 15 corresponds to case study 1/scenario B (see Figure 8); Figure 16 corresponds to case study 1/scenario C (see Figure 9).
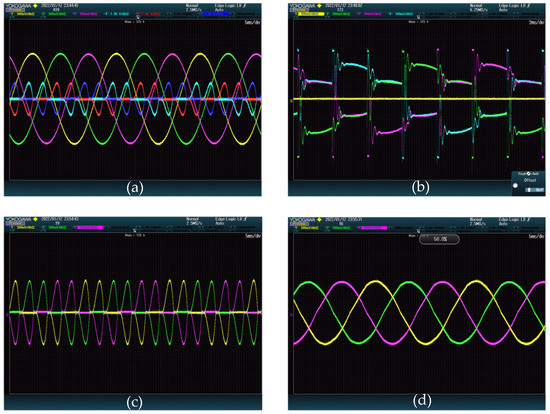
Figure 14.
Oscilloscope image of the results of case study 1/scenario A. From left to right, top to bottom: (a) diesel generator phase voltages and currents; (b) battery currents (at the battery itself and at the output of the filter); (c) input currents to the propulsion system; (d) stator currents of the induction motor.
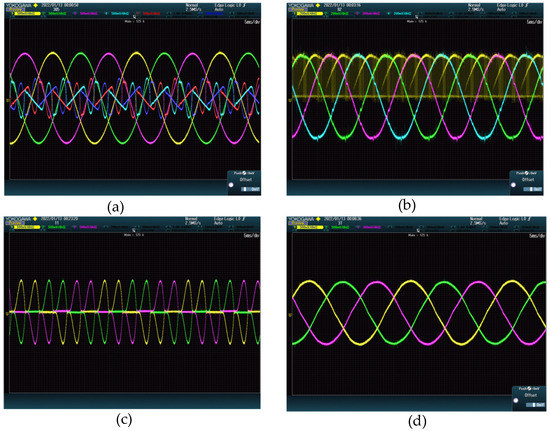
Figure 15.
Oscilloscope image of the results of case study 1/scenario B. From left to right, top to bottom: (a) diesel generator phase voltages and currents; (b) battery currents (at the battery itself and at the output of the filter); (c) input currents to the propulsion system; (d) stator currents of the induction motor.
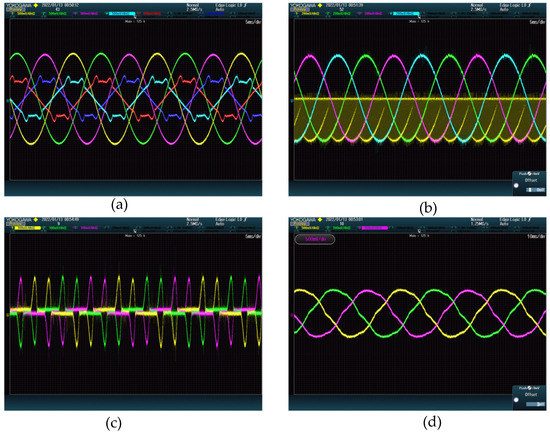
Figure 16.
Oscilloscope image of the results of case study 1/scenario C. From left to right, top to bottom: (a) diesel generator phase voltages and currents; (b) battery currents (at the battery itself and at the output of the filter); (c) input currents to the propulsion system; (d) stator currents of the induction motor.
4. Discussion
Here, analysis of the results follows the same pattern as in the last section, taking the stationary operation first and then transient.
Concerning stability, it can be seen that operation of the battery system for both load support and power recovery affected the harmonic distortion of the currents supplied by the generator. However, the system was able to supply the required torque to the propulsion system under all circumstances. Regarding the harmonics observed in the generator currents, since this is the main power source of the system when the battery system is disabled, the harmonic components that appear, in order of importance, are the 5th, 7th, 11th and 13th. They are injected by the electrical drive of the propulsion system. The same harmonic components appear when the battery provides support to the diesel system, but as magnitudes increase, so too does the harmonic distortion. This is an effect that must be taken into account when hybrid systems are proposed. Conversely, when the battery is being charged, the same harmonic components appear, but with a reduction in magnitude. Nonetheless, in all cases, these harmonic currents can be reduced by increasing the switching frequency. In this study, the switching frequency was set to 10 kHz, but it may be increased up to 16 kHz without incurring increased switching losses.
The results of the scenarios studied for transient operation showed that the electrical power system performed appropriately when the EMS commands changed the mode of operation of the system components. Before the development of the model and its EMS, it might have been hypothesized that sudden disturbances—such as connection/disconnection of the battery system, or a sudden propulsion power increment—could have resulted in undesirable spikes, power drops or power unbalances, among others. However, after a review of the results for each of the scenarios studied (sudden increments of speed command, connection of the battery system for charging, and transition from a battery as the main power source to a diesel generator), it can be concluded that the behavior of the system did not show an anomaly. The increments of the current magnitudes during these transitions were within adequate limits, the duration of the transients short and no oscillations observed.
In future studies, the parallelization of HIL devices will be considered to increase the real-time simulation capacity and increase the switching converters in the model. This will enable the passive rectifier of the propulsion system to be replaced by an active rectifier, and regenerative braking could also be studied in detail. Furthermore, once the model has been validated, we intend to develop more complex EMSs and test them using control hardware-in-the-loop (C HIL), then implementing the EMSs in external controllers interacting with the HIL device.
5. Conclusions
This study described the development of a detailed model of a hybrid-electric ship. The operation of this model was validated in real-time HIL simulations using the Typhoon HIL402 platform. The complexity of the model was determined by the maximum computational capacity of the platform and set to provide detailed results that could be of use to designers of such propulsion systems. The results show that the system can provide a power balance and voltage support to the ship’s power system. In addition, the system response to transient events was correct, without undesirable effects. The approach taken in this study could be used to further research in this area from different perspectives: the development of novel EMSs, incorporation of renewable energies into maritime transport, integration of new power-converter/electric-drive topologies, testing permanent magnet synchronous machines for propulsion, and so on. Such studies can help to improve the power systems of electric-propulsion ships and provide solutions for their development.
Author Contributions
Conceptualization, J.P.T.; methodology, J.P.T.; literature review, J.P.T., P.G.-T., E.G.-R. and D.V.; HIL simulations, J.P.T., P.G.-T., E.G.-R. and D.V.; data analysis and discussion, J.P.T.; writing—original draft preparation, J.P.T.; writing—review and editing, J.P.T., P.G.-T., E.G.-R. and D.V.; funding acquisition, J.P.T. All authors have read and agreed to the published version of the manuscript.
Funding
This research was cofunded by “Programa Operativo FEDER 2014-2020” and “Consejería de Transformación Económica, Industria, Conocimiento, y Universidades de la Junta de Andalucía”. Reference number of the Project: UHU-202051.
Institutional Review Board Statement
Not applicable.
Informed Consent Statement
Not applicable.
Conflicts of Interest
The authors declare no conflict of interest.
References
- International Maritime Organization. Fourth IMO Greenhouse Gas Study: Executive Summary; International Maritime Organization: London, UK, 2020. [Google Scholar]
- Oceana Europe Shipping Pollution. Available online: https://europe.oceana.org/en/shipping-pollution-1 (accessed on 22 December 2021).
- Psaraftis, H.N.; Kontovas, C.A. Decarbonization of Maritime Transport: Is There Light at the End of the Tunnel? Sustainability 2021, 13, 237. [Google Scholar] [CrossRef]
- International Maritime Organization. Initial IMO Strategy on Reduction of GHG Emission from Ships—Resolution MEPC.304(72); International Maritime Organization: London, UK, 2018. [Google Scholar]
- Balcombe, P.; Brierley, J.; Lewis, C.; Skatvedt, L.; Speirs, J.; Hawkes, A.; Staffell, I. How to decarbonise international shipping: Options for fuels, technologies and policies. Energy Convers. Manag. 2019, 182, 72–88. [Google Scholar] [CrossRef]
- Nicolaides, D.; Cebon, D.; Miles, J. Prospects for Electrification of Road Freight. IEEE Syst. J. 2018, 12, 1838–1849. [Google Scholar] [CrossRef] [Green Version]
- Zhuang, W.; Li, S.E.; Zhang, X.; Kum, D.; Song, Z.; Yin, G.; Ju, F. A survey of powertrain configuration studies on hybrid electric vehicles. Appl. Energy 2020, 262, 114553. [Google Scholar] [CrossRef]
- Xing, H.; Spence, S.; Chen, H. A comprehensive review on countermeasures for CO2 emissions from ships. Renew. Sustain. Energy Rev. 2020, 134, 110222. [Google Scholar] [CrossRef]
- Łebkowski, A. Reduction of Fuel Consumption and Pollution Emissions in Inland Water Transport by Application of Hybrid Powertrain. Energies 2018, 11, 1981. [Google Scholar] [CrossRef] [Green Version]
- Al-Falahi, M.D.A.; Nimma, K.S.; Jayasinghe, S.D.G.; Enshaei, H.; Guerrero, J.M. Power management optimization of hybrid power systems in electric ferries. Energy Convers. Manag. 2018, 172, 50–66. [Google Scholar] [CrossRef] [Green Version]
- Sulligoi, G.; Member, S.; Vicenzutti, A.; Member, S.; Menis, R. All-Electric Ship Design: From Electrical Propulsion to Integrated Electrical and Electronic Power Systems. IEEE Trans. Transp. Electrif. 2016, 2, 507–521. [Google Scholar] [CrossRef]
- Lashway, C.R.; Elsayed, A.T.; Mohammed, O.A. Hybrid energy storage management in ship power systems with multiple pulsed loads. Electr. Power Syst. Res. 2016, 141, 50–62. [Google Scholar] [CrossRef] [Green Version]
- Hou, J.; Sun, J.; Hofmann, H.F. Mitigating Power Fluctuations in Electric Ship Propulsion With Hybrid Energy Storage System: Design and Analysis. IEEE J. Ocean. Eng. 2018, 43, 93–107. [Google Scholar] [CrossRef]
- Hou, J.; Song, Z.; Hofmann, H.; Sun, J. Adaptive model predictive control for hybrid energy storage energy management in all-electric ship microgrids. Energy Convers. Manag. 2019, 198, 111929. [Google Scholar] [CrossRef]
- Dedes, E.K.; Hudson, D.A.; Turnock, S.R. Investigation of Diesel Hybrid systems for fuel oil reduction in slow speed ocean going ships. Energy 2016, 114, 444–456. [Google Scholar] [CrossRef] [Green Version]
- Kanellos, F.D.; Anvari-Moghaddam, A.; Guerrero, J.M. A cost-effective and emission-aware power management system for ships with integrated full electric propulsion. Electr. Power Syst. Res. 2017, 150, 63–75. [Google Scholar] [CrossRef] [Green Version]
- Banaei, M.R.; Alizadeh, R. Simulation-Based Modeling and Power Management of All-Electric Ships Based on Renewable Energy Generation Using Model Predictive Control Strategy. IEEE Intell. Transp. Syst. Mag. 2016, 8, 90–103. [Google Scholar] [CrossRef]
- Trovão, J.P.; Machado, F.; Pereirinha, P.G. Hybrid electric excursion ships power supply system based on a multiple energy storage system. IET Electr. Syst. Transp. 2016, 6, 190–201. [Google Scholar] [CrossRef]
- Kalikatzarakis, M.; Geertsma, R.D.; Boonen, E.J.; Visser, K.; Negenborn, R.R. Ship energy management for hybrid propulsion and power supply with shore charging. Control Eng. Pract. 2018, 76, 133–154. [Google Scholar] [CrossRef]
- Khan, M.M.S.; Faruque, M.O.; Newaz, A. Fuzzy Logic Based Energy Storage Management System for MVDC Power System of All Electric Ship. IEEE Trans. Energy Convers. 2017, 32, 798–809. [Google Scholar] [CrossRef] [Green Version]
- Nounou, K.; Charpentier, J.F.; Marouani, K.; Benbouzid, M.; Kheloui, A. Emulation of an Electric Naval Propulsion System Based on a Multiphase Machine Under Healthy and Faulty Operating Conditions. IEEE Trans. Veh. Technol. 2018, 67, 6895–6905. [Google Scholar] [CrossRef]
- Khooban, M.H.; Gheisarnejad, M.; Vafamand, N.; Jafari, M.; Mobayen, S.; Dragicevic, T.; Boudjadar, J. Robust frequency regulation in mobile microgrids: HIL implementation. IEEE Syst. J. 2019, 13, 4281–4291. [Google Scholar] [CrossRef]
- Jianyun, Z.; Li, C.; Lijuan, X.; Bin, W. Bi-objective optimal design of plug-in hybrid electric propulsion system for ships. Energy 2019, 177, 247–261. [Google Scholar] [CrossRef]
- Banaei, M.; Rafiei, M.; Boudjadar, J.; Khooban, M. A Comparative Analysis of Optimal Operation Scenarios in Hybrid Emission-Free Ferry Ships. IEEE Trans. Transp. Electrif. 2020, 6, 318–333. [Google Scholar] [CrossRef]
- Hasanvand, S.; Rafiei, M.; Gheisarnejad, M.; Khooban, M. Reliable Power Scheduling of an Emission-Free Ship: Multiobjective Deep Reinforcement Learning. IEEE Trans. Transp. Electrif. 2020, 6, 832–843. [Google Scholar] [CrossRef]
- Liu, Y.; Wang, H.; Zhang, Q.; Wen, Y.; Hu, W.; Zhang, H. Power distribution strategy based on state of charge balance for hybrid energy storage systems in all-electric ships. J. Power Electron. 2021, 21, 1213–1224. [Google Scholar] [CrossRef]
- Steurer, M.M.; Schoder, K.; Faruque, O.; Soto, D.; Bosworth, M.; Sloderbeck, M.; Bogdan, F.; Hauer, J.; Winkelnkemper, M.; Schwager, L.; et al. Multifunctional Megawatt-Scale Medium Voltage DC Test Bed Based on Modular Multilevel Converter Technology. IEEE Trans. Transp. Electrif. 2016, 2, 597–606. [Google Scholar] [CrossRef]
- Typhoon HIL Typhoon HIL Documentation. Available online: https://www.typhoon-hil.com/documentation/ (accessed on 23 December 2021).
- IEEE Guide for Synchronous Generator Modeling Practices and Parameter Verification with Applications in Power System Stability Analyses. In IEEE Std 1110-2019 (Revision IEEE Std 1110-2002); The Institute of Electrical and Electronics Engineers: New York, NY, USA, 2020; pp. 1–92.
- Beres, R.N.; Wang, X.; Liserre, M.; Blaabjerg, F.; Bak, C.L. A Review of Passive Power Filters for Three-Phase Grid-Connected Voltage-Source Converters. IEEE J. Emerg. Sel. Top. Power Electron. 2016, 4, 54–69. [Google Scholar] [CrossRef] [Green Version]
- Krause, P.C.; Wasynczuk, O.; Sudhoff, S.D. Analysis of Electric Machinery and Drive Systems; Wiley-IEEE Press: Piscataway, NJ, USA, 2002; ISBN 9780471143260. [Google Scholar]
- Torreglosa, J.P.; Garcia-triviño, P.; Vera, D. Analyzing the Improvements of Energy Management Systems for Hybrid Electric Vehicles Using a Systematic Literature Review: How Far Are These Controls from Rule-Based Controls Used in Commercial Vehicles? Appl. Sci. 2020, 10, 8744. [Google Scholar] [CrossRef]
Publisher’s Note: MDPI stays neutral with regard to jurisdictional claims in published maps and institutional affiliations. |
© 2022 by the authors. Licensee MDPI, Basel, Switzerland. This article is an open access article distributed under the terms and conditions of the Creative Commons Attribution (CC BY) license (https://creativecommons.org/licenses/by/4.0/).