Article

Numerical Simulation of Heat Removal from a Window Slab Partition of a Radiative Coil Coating Oven

by
Rodrigo J. F. Neno
,
Beatriz S. Dias
,
Jorge E. P. Navalho
* and
José C. F. Pereira
IDMEC, Instituto Superior Técnico, Universidade de Lisboa, 1649-004 Lisboa, Portugal
*
Author to whom correspondence should be addressed.
Energies 2022, 15(6), 2080; https://doi.org/10.3390/en15062080
Submission received: 4 January 2022 / Revised: 28 February 2022 / Accepted: 4 March 2022 / Published: 12 March 2022

Abstract

:
In this work, fluid flow and heat transfer performance of a radiative coil coating oven is numerically investigated. In the coil coating oven concept under consideration, porous radiant burners provide the required energy to evaporate the volatile species (solvents) from the applied coating and to promote curing reactions. To avoid the mixing between burners flue gas (with a non-negligible oxygen content) and evaporated (combustible) solvents in the oven (which could lead to a catastrophic oven failure), a semi-transparent window in between both atmospheres is applied. To ensure the window thermal stability during the oven operation, window cooling by wall jets is considered. Different turbulence models were compared against available wall jet heat transfer correlations to select the most suitable for three-dimensional (3D) numerical simulations. Convective heat transfer correlations purposefully developed were embedded in a one-dimensional (1D) window energy model for fast performance characterization, analysing the most influencing parameters—window radiative properties, thickness, inlet temperature and velocity of wall jets, and cooling strategy. The 1D window thermal performance is compared with literature and 3D results considering the full coil coating oven, providing satisfactory confidence on the developed strategy. The 1D model is used for an optimisation study to find the minimum energy consumption while ensuring the safety requirements (maximum window temperature and thermal gradient) are met.

1. Introduction

The drying/curing process of pre-paint organic coatings applied onto the surfaces of a continuously moving metal sheet is an essential process in the coil coating industry, which aims to provide anti-corrosion protection to bare metal substrates—most commonly, aluminum and steel–, enhance its appearance (aesthetics), and improve optical properties for energy saving concerns on final costumer applications [1,2,3]. The coated (final) metal coils find applications in a large variety of fields, particularly, in the sectors of construction (external building structures) and transportation (automotive), and in the manufacturing of appliances and furniture [3]. The attractiveness of coated metal sheets strongly relies on cost reduction issues since painting/coating final metal sheet applications—having irregular and complex shapes and inaccessible regions—becomes irrelevant [4,5]. In conventional coil coating ovens applying thermally-cured solvent-borne paints, the energy required for liquid film drying (solvent evaporation) and curing is supported by the injection of hot air—convective air drying technology [6]. In addition to providing the required energy, the hot air stream carries away the evaporated solvent species from the oven. The solvent-loaded gas stream exiting such conventional ovens must be treated before discharge to the external environment. Solvents (volatile organic compounds) incineration requires additional equipment and energy consumption. Recently, interest has been observed in applying infrared (IR) radiant heating to replace the convective air drying technology in the coil coating industry in order to improve the process energy efficiency, increase line velocities, reduce metal strip residence time in the oven, and reduce oven dimensions [6,7,8]. IR radiant heat can be conveniently provided by suitable lamps [6,7] or through the operation of radiant burners [9,10].
In this work, the innovative radiative coil coating oven developed in the project ECCO [11] is considered. According to the current radiative coil coating oven concept, IR radiant energy for coating drying and curing is generated by radiant porous burners burning the evaporated solvents from the liquid coating. (This innovative oven concept allows simultaneously to treat volatile organic compounds and utilize its energetic content for IR radiant energy generation.) In order to separate the atmosphere comprising the evaporated solvents from the burners exhaust gas environment, a thin semi-transparent glass window partition slab is applied. Due to the high burners flue gas temperature impinging onto the window surface and window radiation absorption, window thermal performance can exceed critical limits to ensure a reliable window thermal and structural stability. The window thermal control and analysis is of paramount importance to assure the safety requirements of the process are met. Many experiments, simulations, and optimisation studies have focused on enhancing the cooling thermal performance of hot surfaces by jet impingement or film cooling, particularly for gas turbine components [12,13,14]. The oven geometry and present flow configurations preclude the application of impinging jet cooling techniques because the glass window cannot be obstructed by nozzles blocking the infrared radiation from the burner surfaces (located near the oven ceiling) to the moving coil (located near the oven bottom surface). In alternative, wall jet cooling is a suitable option to extract thermal energy from the glass window in order to keep the window temperatures below critical values.
Wall jets started to be studied experimentally by Förthmann [15] and theoretically in mid 1950’s by Glauert [16] who derived an analytical solution for laminar and turbulent jets. The experimental investigations of wall jets, carried out prior to 1980, have been compiled and critically reviewed by Launder and Rodi [17]. In this work, the authors also reviewed and discussed the ability of various Reynolds-Averaged Navier-Stokes (RANS) models to accurately predict the flow field. The turbulence structure of wall jets has been investigated by detailed experiments and direct numerical simulation (DNS) and large eddy simulation (LES) models by George et al. [18], Eriksson et al. [19], Dejoan and Leschziner [20], Ahlman et al. [21], and Banyassady and Piomelli [22]. In particular, George et al. [18] demonstrates that neither inner scaling nor outer scaling can be used exclusively to collapse the profiles in near-wall and outer shear layer, respectively, except in the limit of infinite Reynolds number. To this date, a vast number of studies have been devoted to turbulent wall jets but heat transfer studies on this topic have received much less attention than isothermal conditions. Dakos et al. [23] measured temperature and heat fluxes for plane and curved wall jets and AbdulNour et al. [24] experimentally investigated the convective heat transfer coefficients on the developing region up to x / b = 20 . Godi et al. [25,26] reported the results of an experimental study to determine the heat transfer coefficient and to select RANS turbulence model for three-dimensional (3D) plane jets. They showed that the width of the slot influences the Nusselt number only in the developing region. Naqavi et al. [27] completed a recent DNS study focused on the heat transfer of a wall jet up to x / b = 40 .
The current work is focused on modeling, simulation, analysis, and optimisation of the glass window oven partition. Relatively little attention has been given in the literature to the cooling optimisation of a semi-transparent plate under IR radiation to avoid thermal damage or failure in such a hot environment of more than 750 °C. Accordingly, the objective of the present study is the design of a wall jet cooling system to keep the maximum glass window plate temperature in the safe operation regime. Design parameters for the wall jets are evaluated to minimize glass window temperatures and thermal gradients.
The high computational effort of an optimisation procedure resorting to 3D numerical simulations of the entire oven is unreasonable; therefore, the strategy was based on the development of a simpler but yet sufficiently accurate one-dimensional (1D) model. The 1D model of the window was developed and integrated with convective heat transfer correlations obtained by detailed numerical simulations associated to wall jets on a reduced 3D geometrical model of the entire oven. The 1D model was successfully validated with benchmark conduction-radiation model results and with full 3D simulations. The 1D model was used for analysis purposes and for an energetic optimisation of the cooling conditions.
This paper is organized as follows. In the next section, the innovative drying and curing (coil coating) oven is presented as well as the different wall jet cooling schemes studied. The mathematical and numerical models exhibit, in the following section, the principles and equations according to which the full oven and window were modeled, and the last two sections are devoted to the presentation of the main results and ensuing discussion, and conclusions.

2. Physical Model

2.1. Oven Geometry

Figure 1a,b show the geometrical configurations of the full radiative coil coating oven and a representative volume of the full oven, respectively.
According to Figure 1a, the oven is composed by two coupled modules—the radiant burner section (RBS) and the curing oven section (COS). The RBS corresponds to the oven upper module at the ceiling of which four rectangular radiant porous burner arrays (batteries of burners) are placed in order to provide the necessary radiative power to drive the coating drying and curing processes that take place at the lower module (COS). The COS is continuously fed with a wet coated metal strip.
The two modules are separated by a glass window—see the purple region in Figure 1a—which avoids the mixing between the burners flue gas present in the RBS (with a non-negligible oxygen content) with the solvent-loaded atmosphere inside the COS. Mixing of both atmospheres would lead to the contamination of the COS gas mixture (evaporated solvents)—that is continuously extracted and directed to the burners fuel feed system—and, ultimately, to a catastrophic failure of the oven due to the promotion of an explosive environment.
Simultaneously, the glass window allows radiative heat exchange between the burners porous surface and the coated metal strip. Therefore, the glass window is exposed to very harsh conditions, particularly, due to: (i) the existence of a significant temperature gradient between the upper and lower oven modules (RBS and COS, respectively); (ii) the absorption of a relevant fraction of thermal radiation emitted from the very hot surfaces of the porous burners; and (iii) the low momentum impingement exhaust burners jets at high temperatures. The application of a glass window cooling strategy becomes of supreme importance to maintain window temperatures below material critical values and, consequently, to avoid the development of thermally-induced mechanical stresses that can lead to the window material structural fatal failure.
The geometric model presented in Figure 1b embraces a complete set of batteries of burners. This model is considered to obtain a representative performance of window wall jet cooling and, consequently, to derive convective heat transfer correlations for accurate 1D window thermal modeling.

2.2. Window Wall Jet Cooling Schemes

Different window wall jet cooling schemes are possible to apply with the current oven hydrodynamic and geometric features. The heat transfer enhancement for glass window cooling is certainly affected by the wall jet injection directional characteristics, injection locations, and interaction between wall jets. Figure 2 presents three wall jet flow configurations—denoted as cooling Schemes A, B, and C—herein applied to investigate the corresponding effect on the window cooling performance. The difference between the three cooling schemes is the injection location of wall jets. Cooling Scheme A is a scheme where the wall jet is injected only from one side. Cooling Scheme B makes use of injection from both sides and cooling Scheme C is a different strategy where the injection changes the side at the middle of the window plate.
For the three cooling schemes, wall jets are injected parallel to the glass window—below and above the lower and upper window surfaces, respectively—and in a transverse direction to the metal strip movement. In Figure 2, the red solid arrows and the black dashed arrows indicate that the wall jets are injected above and below the window top and bottom surfaces, respectively. The inlet wall jets aspect ratio, i.e., the wall jet slot width to height ratio ( L / b ) is equal to 120. The injected cooling gas in the RBS (COS) corresponds to a fraction of the extracted flue gas (extracted COS mixture) from the RBS (COS) that is cooled down externally by a heat exchanger prior to its injection.

3. Mathematical and Numerical Models

3.1. 3D Oven Model

The RANS governing equations for mass, momentum, and energy are presented in Equations (1)–(3).
( ρ v i ) x i = 0
( ρ v i v j ) x j = p x i + x j μ v i x j + v j x i 2 3 δ ij v i x j + x j ρ v i v j ¯
( ρ C p v i T ) x i = x i ( k t T x i ) + S e
The Reynolds stresses ( ρ v i v j ¯ ) are modeled by Boussinesq’s turbulent viscosity hypothesis and the selected turbulence model. The transport equation for the scalar variables is given by Equation (4).
ρ u j ¯ ϕ ¯ x j x j Γ ϕ , eff ϕ ¯ x j = S ϕ
In Equation (4), ϕ represents the dependent variables of the turbulence model or the species mass fractions, Γ ϕ , eff is the corresponding effective diffusion coefficient, and S ϕ corresponds to the source term. Finite volume based ANSYS Fluent 17.2 [28] has been chosen for solving the governing equations since it has proven to provide consistent results for similar cases [29,30]. The gas in the RBS is composed on a molar basis by different species, such as N 2 (70%), CO 2 (7%), H 2 O (12%), and O 2 (3.6%). The gas composition in the COS is mainly dominated by N 2 (70%) and H 2 O (12%)—also containing solvent species (2%) and O 2 (less than 3.6%). Sutherland’s law provided the viscosity and thermal conductivity values. Species specific heat values are obtained from thermochemical tables in ANSYS Fluent [31].
The cooling system relies on wall jets to extract heat from the glass plate. Consequently, several turbulence models were considered and tested against available wall jet data with heat transfer in order to select the most appropriate turbulence model and the appropriated mesh distribution. The following turbulence models available within the ANSYS Fluent package [28] were considered for comparison and analysis:
  • standard κ ε model with (i) standard wall function (WF), (ii) scalable WF, and (iii) non-equilibrium WF;
  • realizable κ ε model with standard WF;
  • κ ε low-Reynolds (i) Yang and Shih model, and (ii) AKN model;
  • κ ω SST model; and
  • Spalart-Allmaras (SA) model.
The radiative heat transfer contribution to the energy balance equations of gas and solid regions was considered through the application of the discrete ordinates method (DOM) [32] with S6 angular discretisation due to its characteristics and benchmark results [33]. The gas is considered as non-participating to radiative heat transfer but the glass material that separates both oven regions (RBS and COS) is considered as a participating medium—the glass material simultaneously absorbs and emits radiation.

3.2. 1D Window Thermal Energy and Radiation Models

3.2.1. Thermal Model

A 1D window thermal model was developed to carry out parametric studies on the thermal performance of the glass window. The 1D steady-state energy equation for the glass window is given by Equation (5), where k t and q r are the thermal conductivity and the radiative flux, respectively. According to this model, the resolved spatial dimension corresponds to the dimension aligned with the thickness of the window.
d d x k t d T d x = d q r d x
The divergence of the radiative flux was computed base on the solution for the radiative transfer equation (RTE)—an iterative procedure was used to achieve convergence between the RTE and the energy equation (see Section 3.2.2). Equation (5) is subjected to convective boundary conditions applied at x = 0 and x = L which are given by Equations (6) and (7), respectively. In these equations, h RBS and h COS are the convective heat transfer coefficients at the top and bottom window surfaces—window interfaces with the RBS and COS, respectively—and T RBS and T COS are the corresponding fluid temperatures.
k t d T d x x = 0 = h COS T COS T ( 0 )
k t d T d x x = L = h RBS T ( L ) T RBS
The suitability of this model for the prediction of window temperatures strongly relies on the fact that heat transfer in the window (conduction heat transfer) occurs mainly along the thickness of the window.
The window thermal energy model was solved applying second-order finite differences with a spatial discretisation of about 50 nodes per millimetre of glass.

3.2.2. Radiation Model

The divergence of the radiative flux is directly related with the radiation intensity inside the medium and is computed according to the RTE. The local divergence of the radiative heat flux is given by a balance between the emitted intensity and incoming radiation (irradiation)—see Equation (8).
d q r d x λ = k λ ( 4 π × I λ , b ( x ) G λ ( x ) )
The RTE can be rewritten in a simple form as shown in Equation (9).
d I λ d τ + I λ = I λ , b
The RTE (Equation (9)) can be divided and solved using an integrative factor. Equations (10) and (11) describe the spectral radiation intensity inside the medium to the case studied, using the usual nomenclature of positive (upwards) and negative (downwards). The DOM with the S4 angular discretisation was used to discretize the RTE.
I λ + ( τ , μ ) = I λ , b ( τ , μ ) + I λ + ( 0 , μ ) I λ , b ( τ , μ ) e τ μ i
I λ ( τ , μ ) = I λ , b ( τ , μ ) + I λ ( L , μ ) I λ , b ( τ , μ ) e τ L τ μ i
Boundary conditions are required to solve the RTE ( I + ( 0 ) and I ( L ) in Equations (10) and (11), respectively). Figure 3 sketches with arrows the three different contributions of boundary radiation to the medium (transmission, emission, and reflection) on the boundary x = L —an analogous procedure is considered for the boundary x = 0 .
The enclosure surfaces are not opaque and therefore are considered as semi-participating which allow the penetration of the outside radiation (G), emission (E) and reflection of radiation (H). The radiation of the boundary conditions is computed based on the radiosity (J) that represents the sum of the total radiant flux leaving the surface into the medium. The total radiosity can be computed with the three different contributions.
J λ = τ λ G λ + ϵ λ E λ + ρ λ H λ
The first term of Equation (12) ( τ λ G λ ) is related with the penetration of the radiation from the surrounding surfaces (burners and coil to x = L and x = 0 , respectively), equal to the emitted surface radiation since the gases inside RBS ans COS are considered as non-participating. The second term of Equation (12) is related with the emitted surface radiative power and the third term of Equation (12) is related with the radiation from the medium, reflected again into the medium. This term is not initially known since the radiation coming from the medium is an unknown, however is possible to incorporate on a renewed calculus. The radiative surface properties (reflectivity— ρ λ ; and transmissivity— τ λ ) are obtained based on Beer’s law and Fresnel equation, using absorption coefficient ( k λ ) and index of refraction ( n λ ) as a basis.
The IR porous burners have a radiative contribution (surface temperature and emissivity) and an advective output (output hot gas expelled). The burners surface temperature is unknown in opposite to the radiative efficiency/flux of the burner ( Y rad ), which depends on several factors, but it was assumed equal to 0.3 in full accordance with Fidalgo et al. [34]. An iterative procedure is added to the model to update the temperature of the burners surface according with the radiative flux balance—see outer iterative process in flow chart of Figure 4a and an example of the surface burner temperature along iterations in Figure 4b.

4. Results

4.1. RANS Turbulence Model Selection—Comparison with Benchmark Results

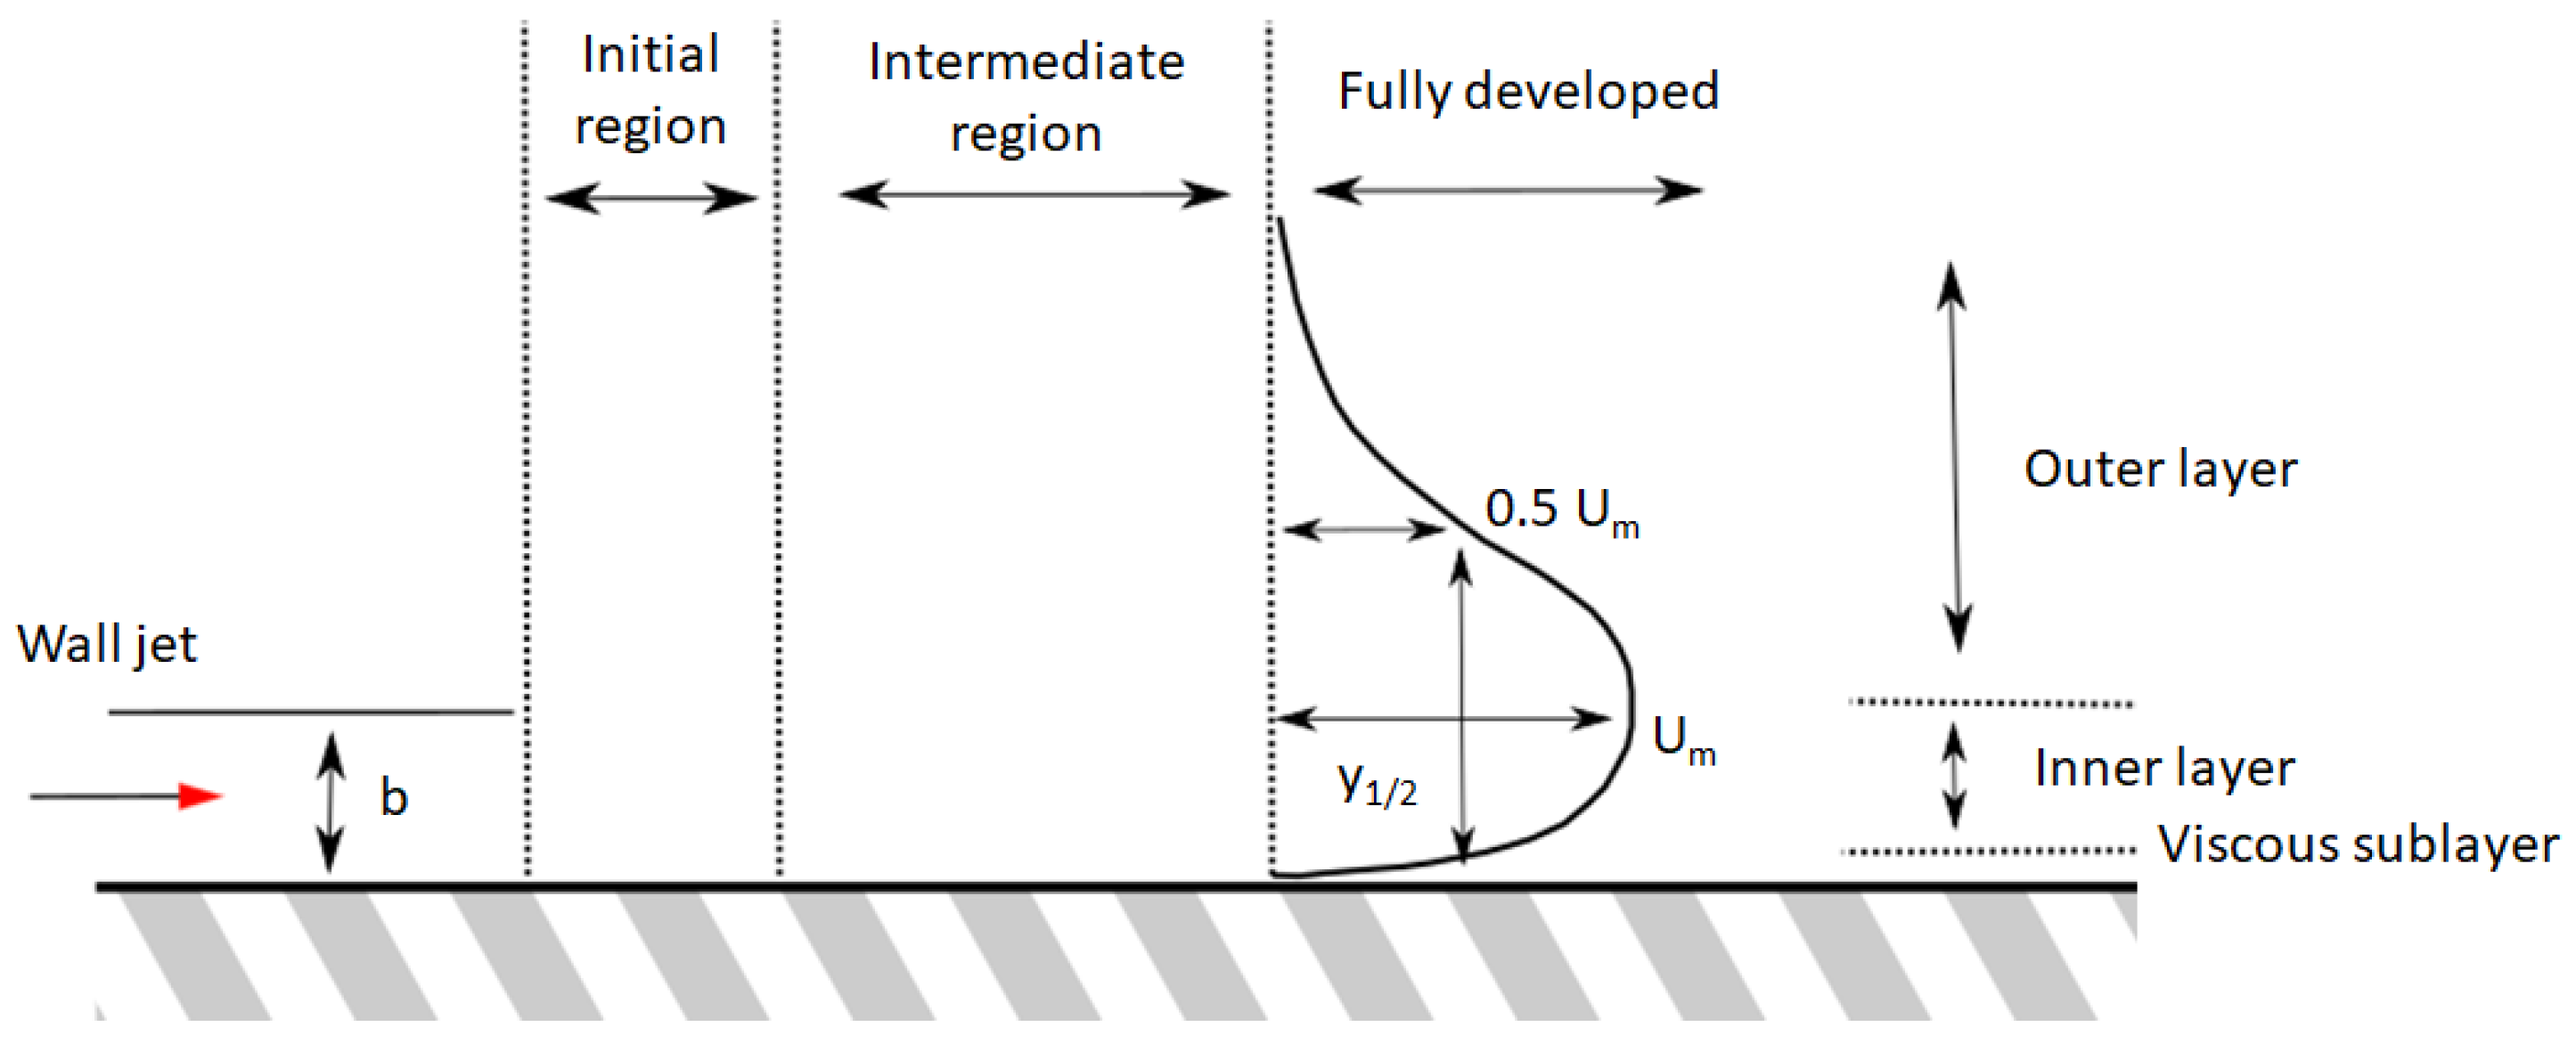
Figure 5 shows a schematic of a plane turbulent wall jet developing along x coordinate direction. The Reynolds number is defined as R e j = U j b / ν , where U j is the jet exit velocity, b is the smaller dimension of the rectangular jet, and ν is the kinematic viscosity. The wall jet development consists in three regions, the potential core zone at the jet exit, followed by the intermediate region, and the fully developed region where the mean velocity and turbulent intensity show self-similar characteristics. From the wall to the free stream the turbulent wall jet flow is usually categorized into three different zones. First, the viscous sublayer is the region of turbulent flow closest to the surface where viscous effects are dominant in the transport phenomena. This is followed by the inner-layer that presents characteristics of a boundary layer, from the wall to the point of maximum stream-wise velocity, and the third region is the outer-layer with characteristics of a free shear layer. The interaction of large turbulence scales in the outer-layer with smaller scales in the inner-layer creates a complicated flow and determines the development of the wall jet.
The direct numerical simulation results of a non-isothermal wall jet reported by Naqavi et al. [27] were the benchmark case used to select the RANS model. The computational domain has the dimensions of 50 b and 40 b in x and y directions, respectively. The jet enters the domain at R e j = 7500 from an inlet with height equal to 20 mm . An inlet co-flow provides the jet entrainment with a uniform flow at 0.06 U j . The jet inlet temperature is constant and equal to 295 K and develops stream-wise along a no-slip isothermal wall at 317 K . The upper boundary ( y = 40 b ) has a free-slip boundary condition. The mesh grid varies in x and y direction with an applied ratio (different than 1) since the refinement near the injection and near the bottom surface is more relevant to simulate the behavior of the jet.
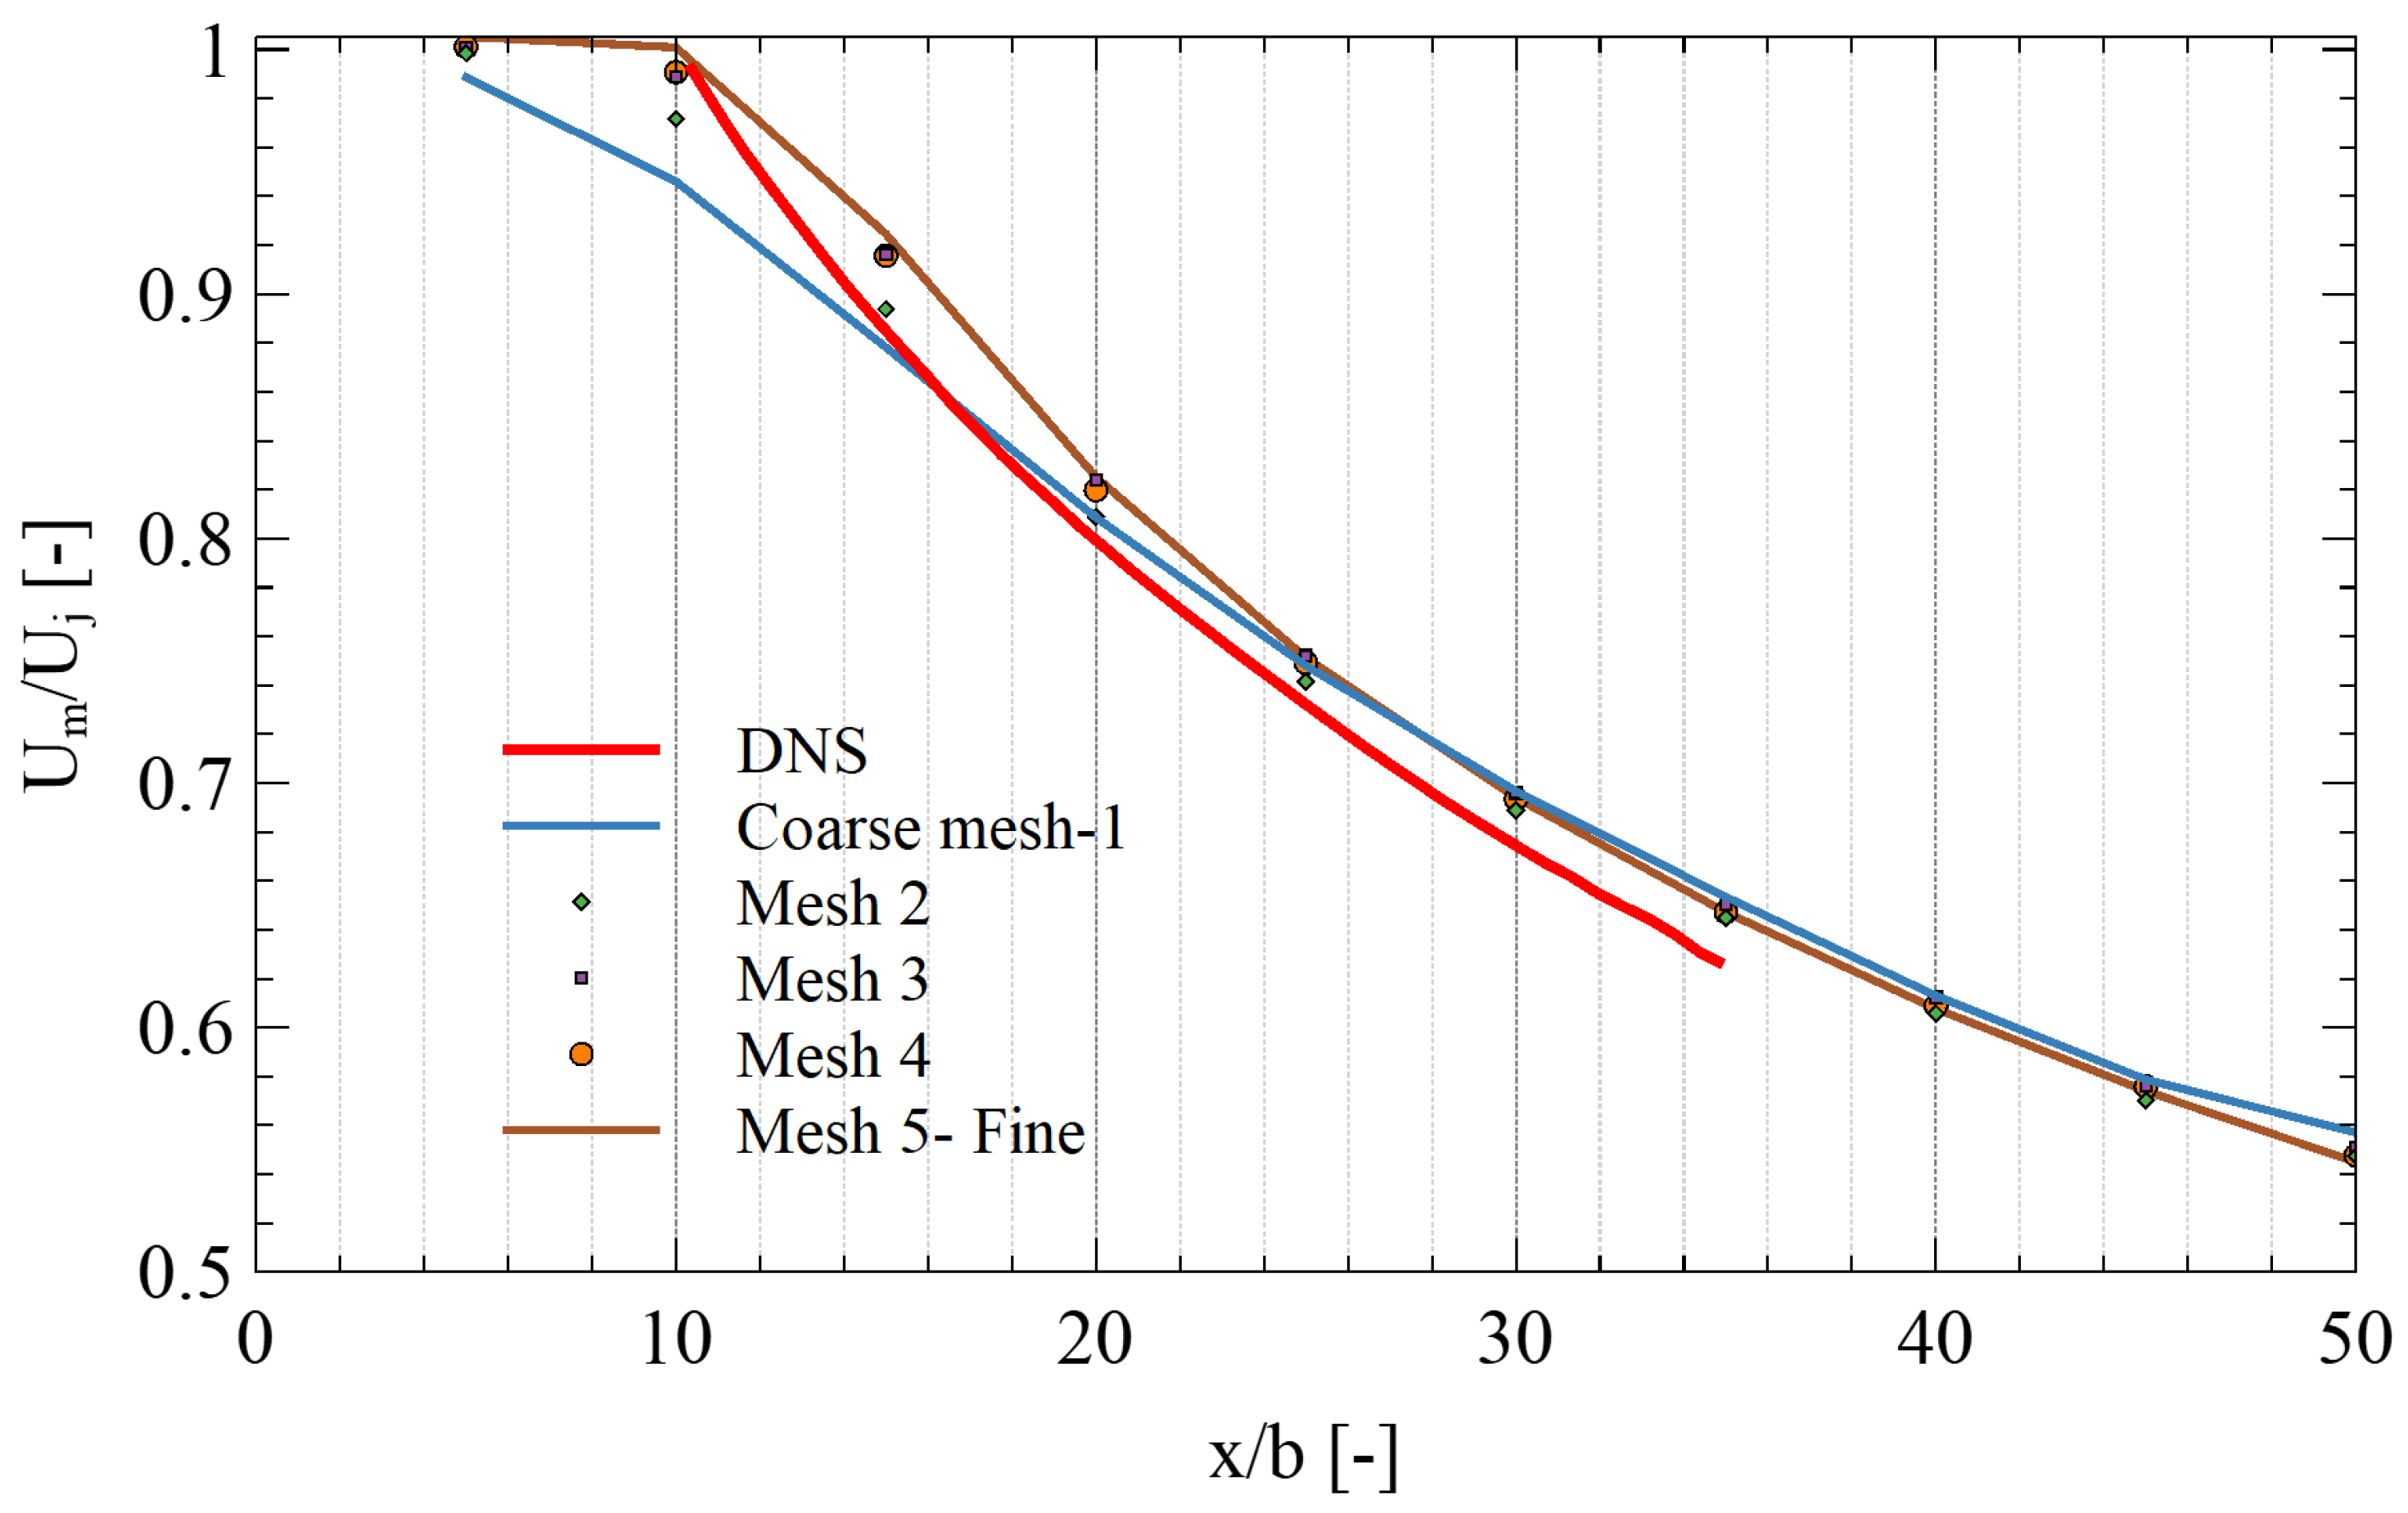
The standard high-Re turbulence models with WF require the first grid at 20 < y + < 200 while for low-Re modeling there must be enough first grid points and layers on the viscous sublayer to log-law region. For that reason, two different meshes were considered. The numerical error associated to the grid size was inspected by a convergence study demonstrating the reliability of the results herein presented. The computational grids for low-Re model consisted of 15 × 15, 25 × 20, 50 × 50, 100 × 100, and 200 × 200 cells—Meshes 1 to 5 and Figure 6 shows the grid convergence study conducted for κ ω SST model.
The velocity decay of a fine mesh (brown line in Figure 6) is closer to a DNS simulation than the coarse (blue line) mesh. The average Nusselt number (considering 10 < x / b < 40 ) was also evaluated and the numerical error for the coarser mesh is 11.3% while the refined mesh 200 × 200 presents a lower error of 4%. The coarser meshes evidence higher differences, especially inside the initial region. The mesh was doubled refined in both directions and almost no differences are observed in terms of skin friction coefficient and velocity decay (Mesh 4 and Mesh 5) in Figure 6. Increasing the mesh base size near the wall and considering less points inside the viscous sublayer results in a different prediction (Mesh 3). Despite the differences and the highest numerical error inside the initial region, Mesh 3 presents similar results to a refined mesh at the fully turbulent region, therefore was adopted for the study of turbulence low-Re models.
The experimental studies show that at fully developed downstream locations, the correlation for the Nusselt number given by Equation (13) can be applied. In this correlation, C is an empirical constant varying from 0.071 [35] to 0.115 according to Nguyen and Souad [36].
N u = C × R e 0.8 × x b 0.6
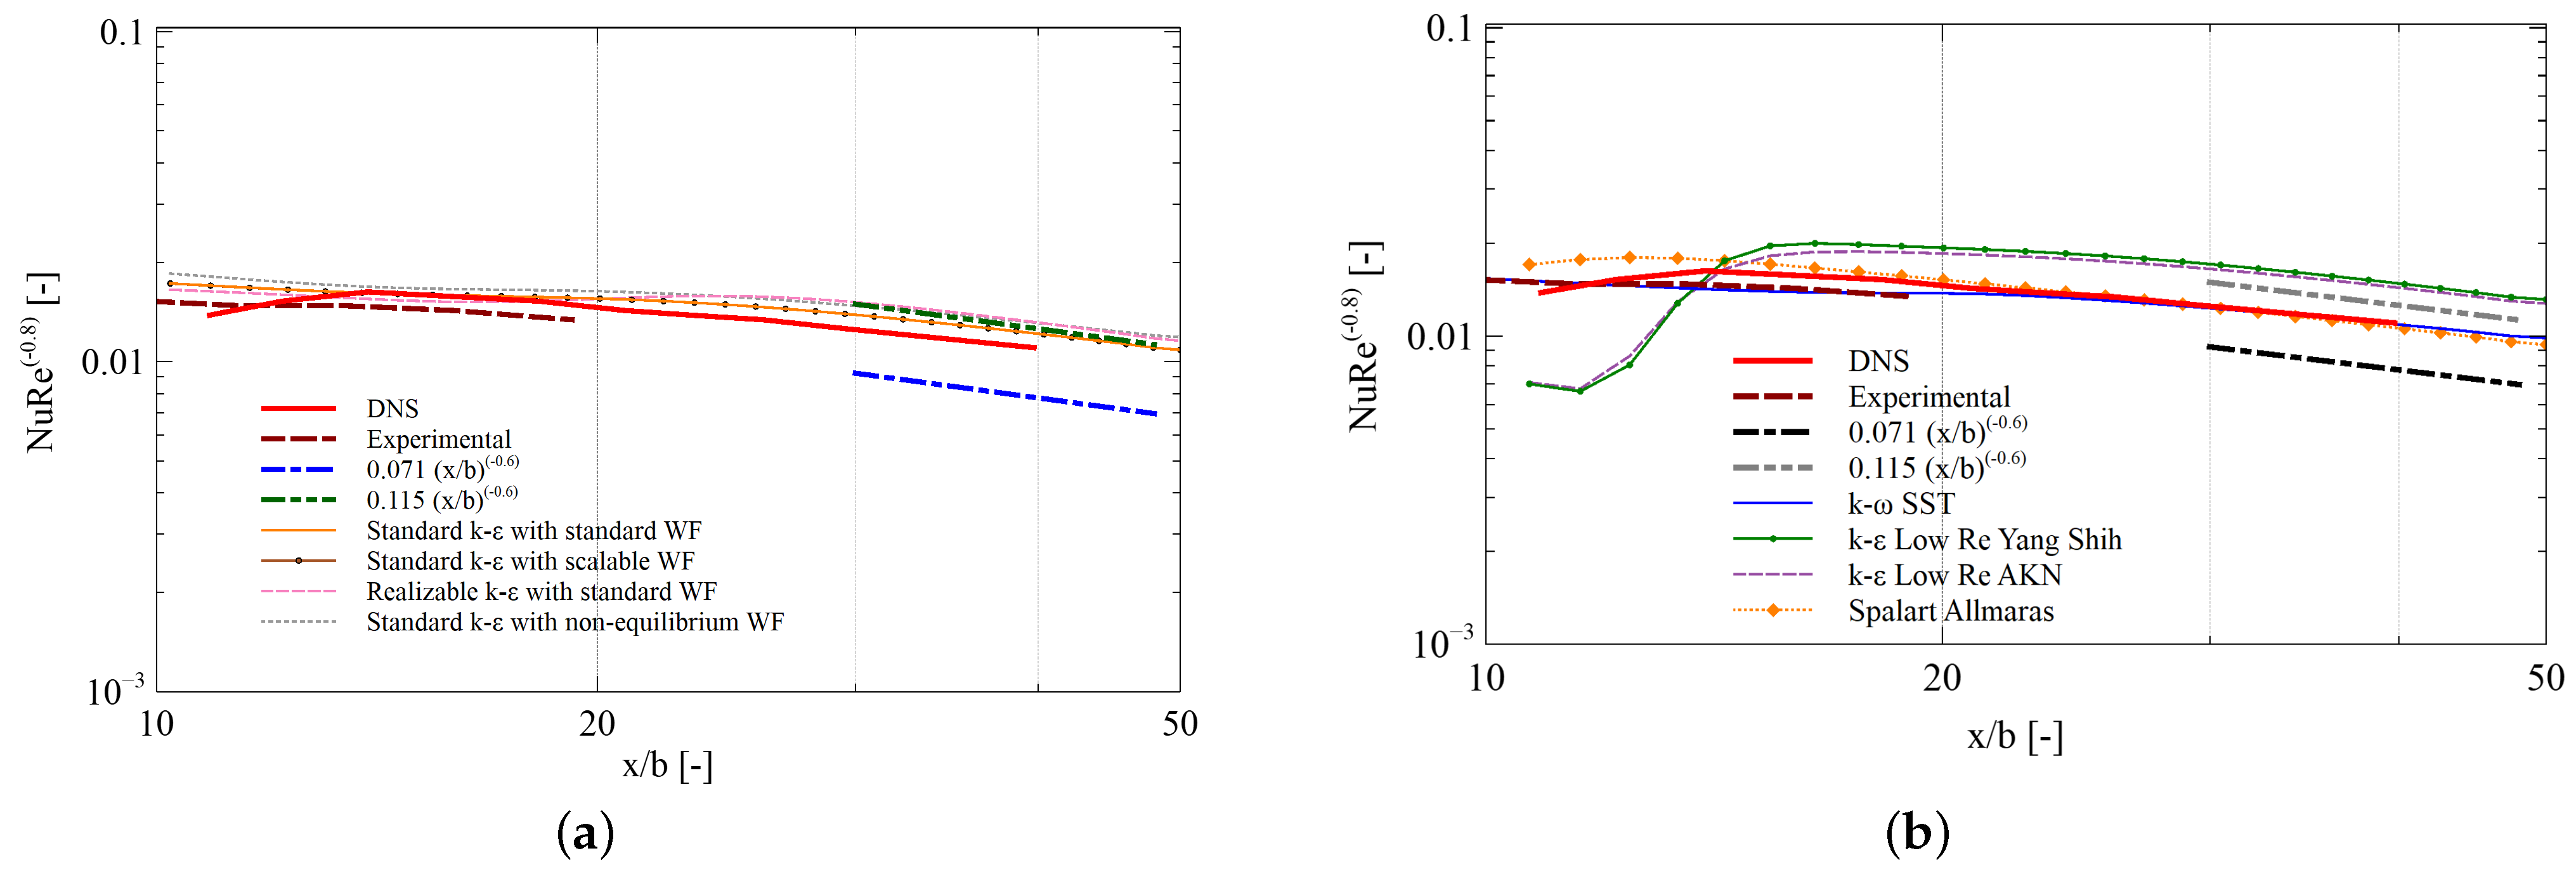
The 2D study was conducted and the plane wall jet becomes self-similar at a stream-wise distance of order greater than 20 discharge-nozzle heights, the mean velocity develops in a self-similar manner, the half-width growth is linear, and the maximum velocity decay is inversely proportional to the square root of the downstream distance. The Nusselt number along the plate with the results, the reference DNS [27], and experimental studies, is shown in Figure 7a,b considering high-Re and low-Re turbulence models, respectively. Large differences on the initial region are expected since RANS models do not capture well the transitional state of the flow (peak at x / b = 15 ). High-Re turbulence models over predicts by 17% for ( x / b > 15 ) the DNS results, while the low-Re turbulence models have higher accuracy, specially κ ω SST and SA models by displaying an error of 6.8% and 1%, respectively.
The full-scale geometry of Figure 1a presents additional fluid flow complexities to the classical wall jet configuration. The first concern is that the wall jet cannot be injected perfectly adjacent to the window wall due to construction constraints of the glass wall frame—a non-negligible step height (s) value is considered. The ratio s / b is equal to 3 and originates a turbulent wall jet over a backward-facing step. The recirculating region attached to the step modifies the inlet wall jet region and redeveloping flow zone—see e.g., Nguyen and Souad [36] and Bouda et al. [37]. The numerical calculations using κ ω SST turbulence model predict the attachment of the recirculation region extending up to x / b = 7 , which represents a small fraction (around 5%) when compared with the glass plate region of interest of this study up to x / b = 120 . The wall jet in the radiant burner section (RBS) also deviates from a standard wall jet layout because the outer-layer is subject to a complex external 3D flow originated by the confinement and by the cross-flow interaction of the wall jet with the low momentum burner exhaust jet. The interaction results in the modifications of the velocity profile as well as the turbulent structure—see Tsai et al. [38]. Both influences dictate that heat transfer correlations should be derived from 3D numerical calculations for the window glass cooling using κ ω SST or SA turbulence model and fine meshes.

4.2. 1D Window Models Verification

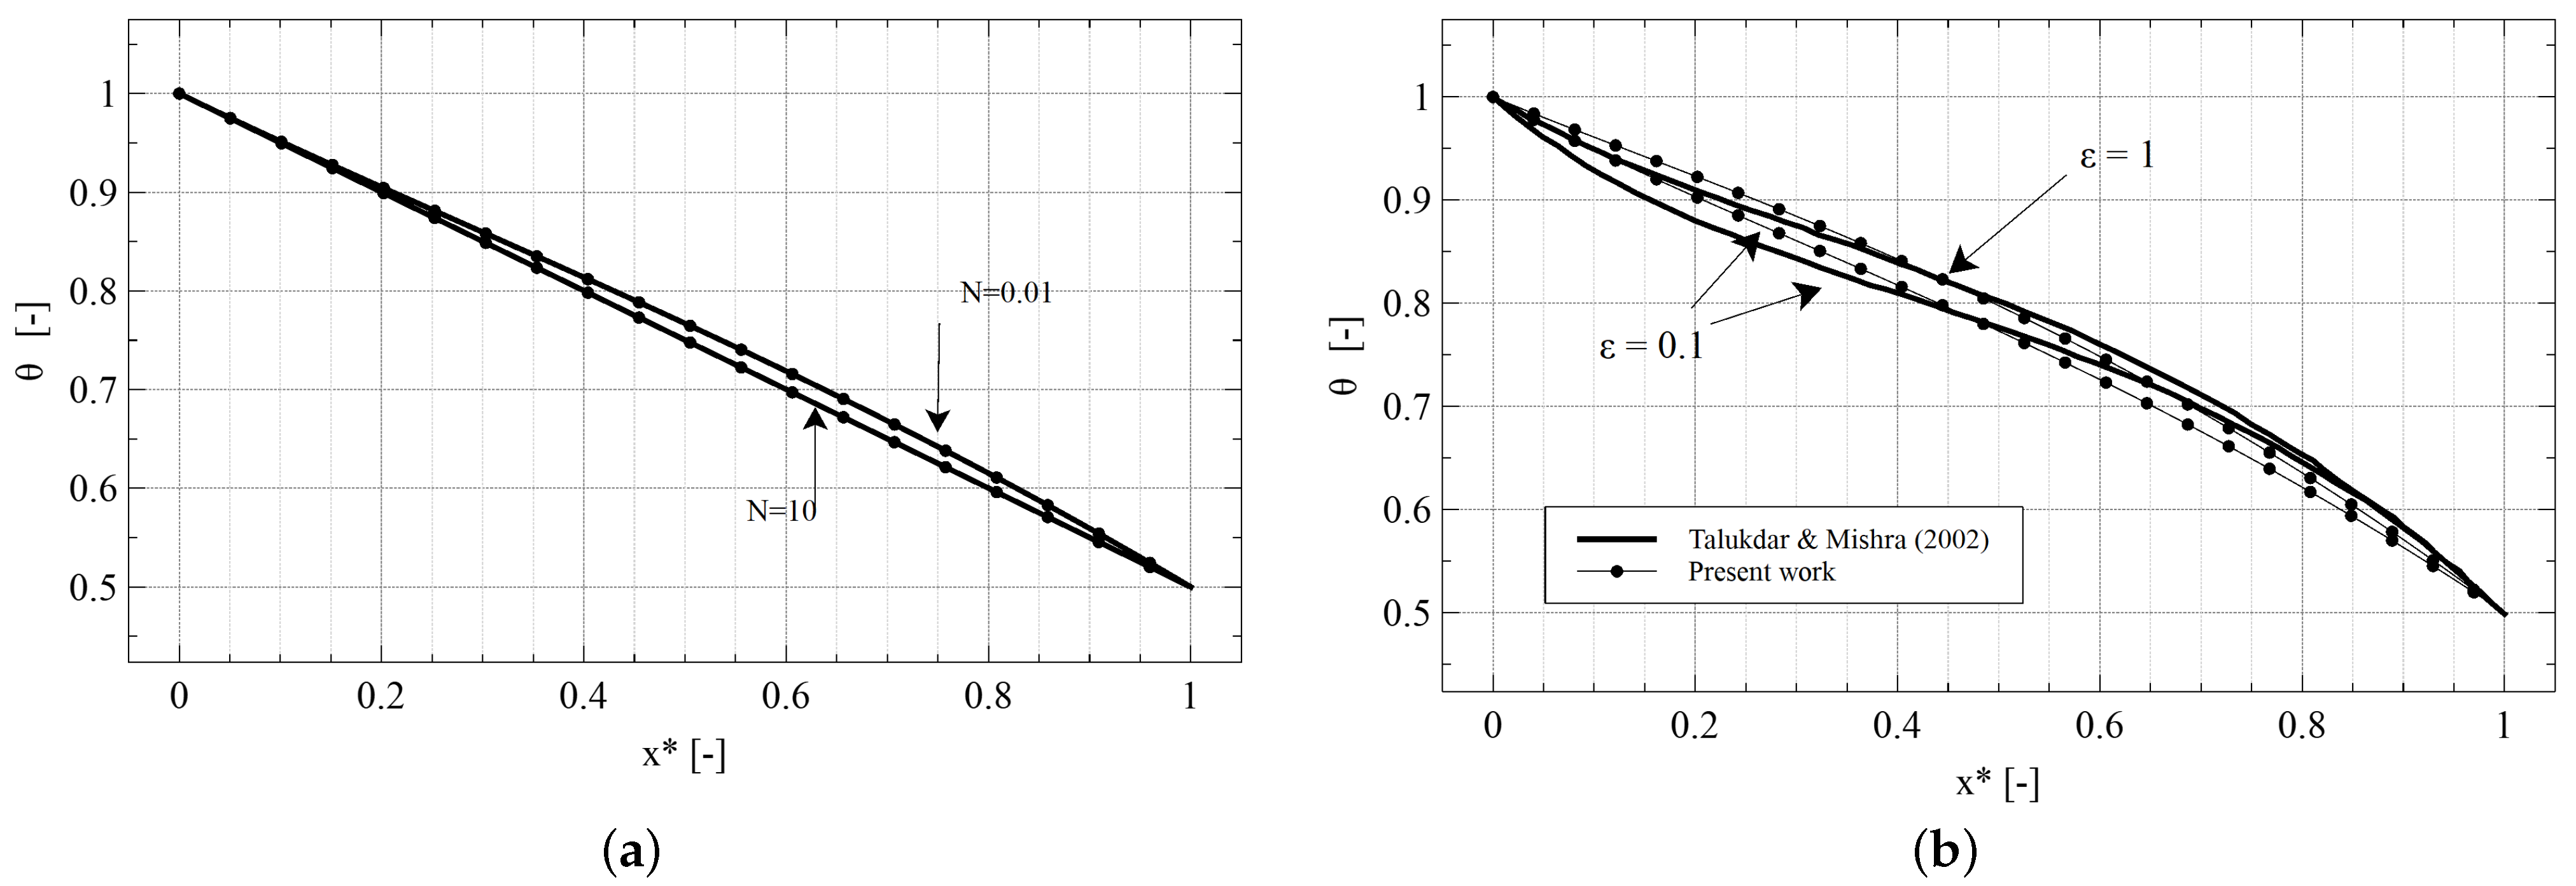
The developed 1D window (thermal energy and radiation) model was validated by comparison with benchmark solutions for one-dimensional gray planar absorbing and emitting medium reported by Talukdar and Mishra [39]. Figure 8a shows the comparison of the dimensionless temperature ( θ = T / T max ) profile inside the medium for the conduction-radiation parameter (N) values equal to 0.01 and 10.
Figure 8b shows the results for two emissivity values with N equal to 0.1 and τ L = 0.1 . Figure 8a,b show a good agreement between the results of the developed model and the benchmark results. The iterative coupling and DOM application results show the expected behaviours for the conduction-radiation problem and, consequently, the 1D model validation provides confidence to perform the study.

4.3. Convective Heat Transfer Correlations

Convective heat transfer coefficients at the window top and bottom surfaces are needed in Equations (6) and (7). There are two completely different conditions corresponding to the presence or absence of wall jets cooling. Without cooling in the RBS, the burners exhaust flow impinges on the glass window and heat transfer correlations for both local and average Nusselt numbers are available—see References [40,41]. The lower glass surface in the COS without wall jet cooling is subjected to natural convection conditions. In such conditions, the heat transfer convection coefficient ( h COS ) is estimated to be equal to 10 W/m2·K and the average fluid temperature ( T COS ) is equal to 700 K .
The wall jet cooling in the RBS section avoids the burner exhaust low momentum jet to impinge on the glass surface. The step expansion originates a turbulent wall jet over a backward-facing step and there is high free stream turbulence and confinement to the wall jet development. Consequently, the correlations for the specific situations were obtained by 3D simulations of the simplified RBS geometry, see Figure 1b. Different cooling strategies were simulated according to the jet direction and location above and below the glass plate—see Figure 2 for the three jet arrangements considered. The lateral walls parallel to plane YZ are considered with symmetric boundary conditions and only half domain could be considered for Scheme A and B. The coefficient of heat transfer over the target surface was normalized by:
h = q c T w T COS / RBS
According to literature reports for wall jet cooling, the Nusselt number correlation is given by:
N u ¯ = C 1 × R e C 2
The gas properties are considered at an average temperature between inlet cooling gas temperature and window temperature. The wall jet height ( b = 5 mm) is the characteristic length for the Nusselt and Reynolds numbers. Table 1 lists the calculated coefficients for Equation (15) on both window surfaces and for the three cooling schemes. The coefficient C 2 is almost constant and approximately equal to 0.8 in all numerical simulation results as should be from literature—see Equation (13).

4.4. Parametric Studies on the Window Thermal Performance

The calculations are obtained for a wide range of cooling conditions and Table 2 displays the input parameters considered as the reference case of the study, without cooling in RBS or COS.

4.4.1. Glass Material—Radiative Properties

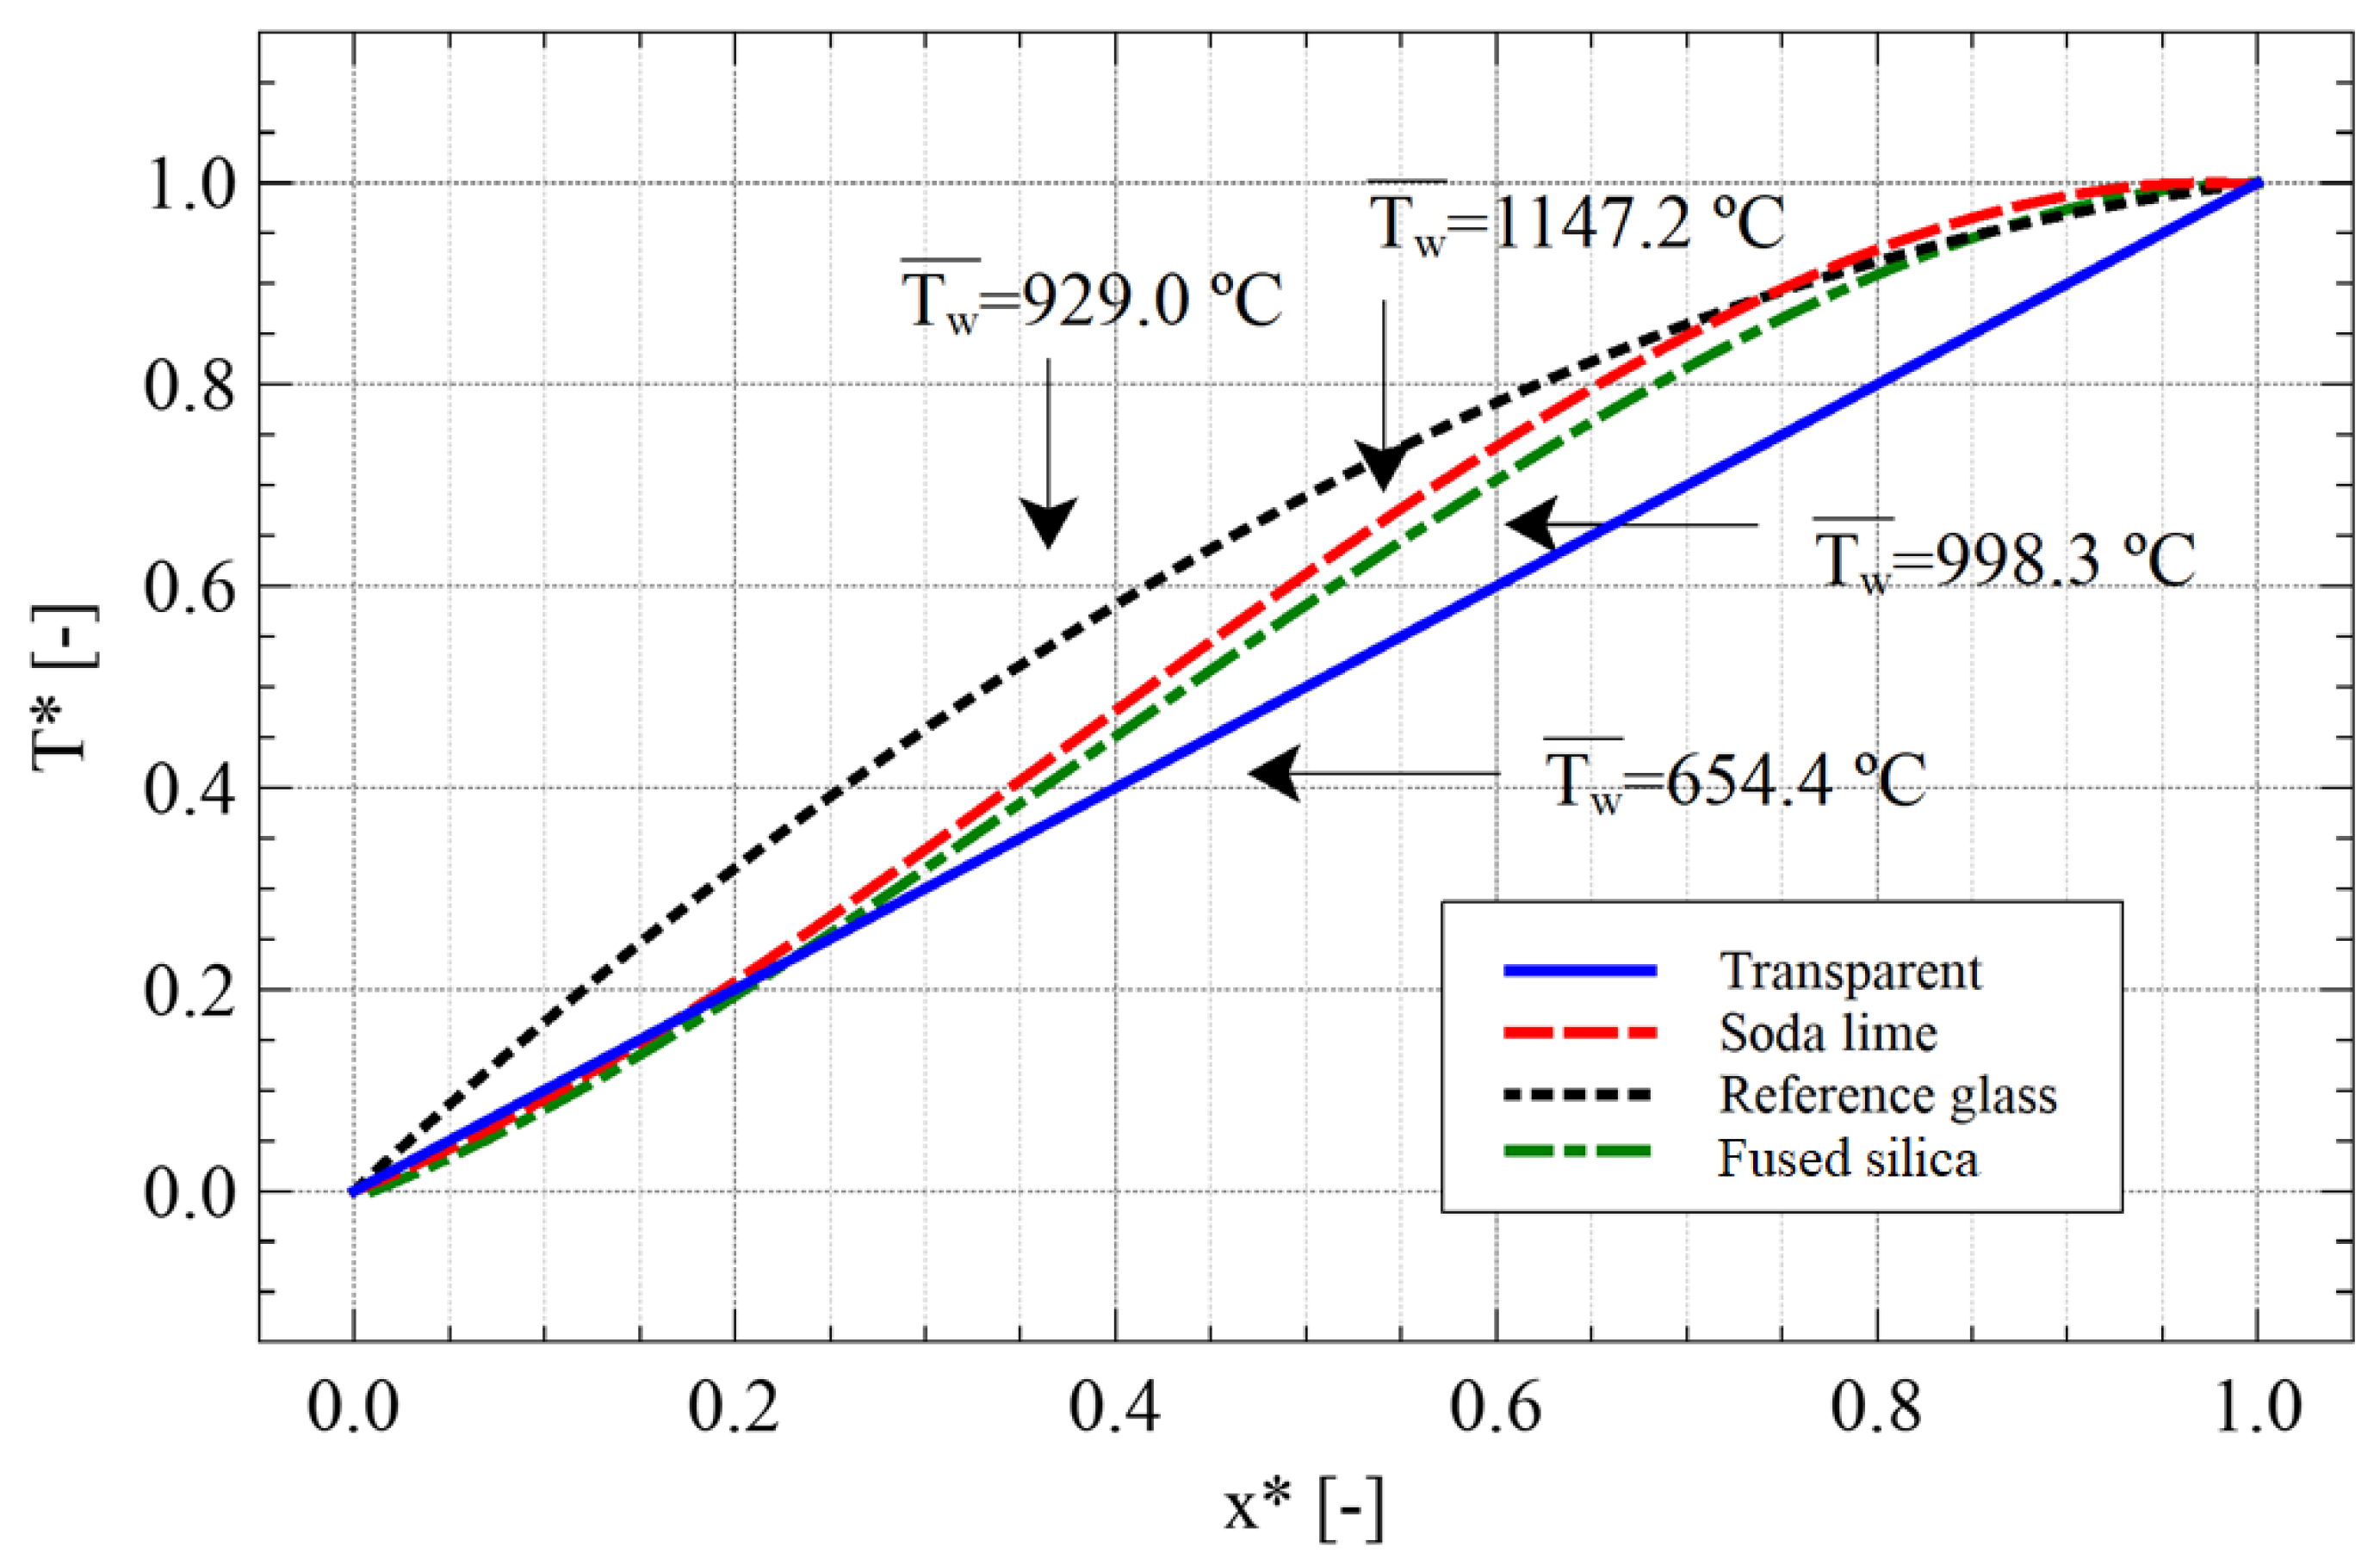
Four different glass window materials have been considered. The reference material, listed in Table 2, is compared with a transparent glass ( k = 0 ), with soda lime silica glass [42] and fused silica glass [43]. The radiative properties ( k λ ) were obtained based on data from transmittance graphs and due to profile characteristics of soda lime and fused glass, two wavelengths bands were considered (0–3.5 μ m and 3.5–5 μ m ). Figure 9 shows the dimensionless temperature difference profiles ( T * = ( T T min ) / ( T max T min ) ) for the four glass window materials and the average temperature ( T ¯ w ).
The highly absorbent material (soda lime silica glass) registers the highest temperature inside the window—the average temperature is about 1147 °C. As expected, the transparent material presents a linear profile and registers the lowest temperature since it does not participate in radiation. The absorbent material has a higher optical thickness while the reference glass with lower optical thickness follows the curve of Figure 8b. The magnitude of the curves is related with the conduction-radiation parameter (N) and since soda lime glass has a high absorption coefficient, displays a high N and therefore the profile is close to linear when compared with the reference glass.
The spectral variance of materials radiative properties needs to be accounted and studied. Increasing the number of wavelength bands leads to higher accuracy of the solution but also to higher computational effort. The transformation of a grey model into non-grey accounts for the spectral discretisation of the radiative spectrum. Table 3 lists the average glass window temperature obtained with different number of wavelength bands considered for the reference case. The accuracy is evaluated by the average window temperature and the more reliable choice corresponds to 3 wavelengths bands.

4.4.2. Window Thickness

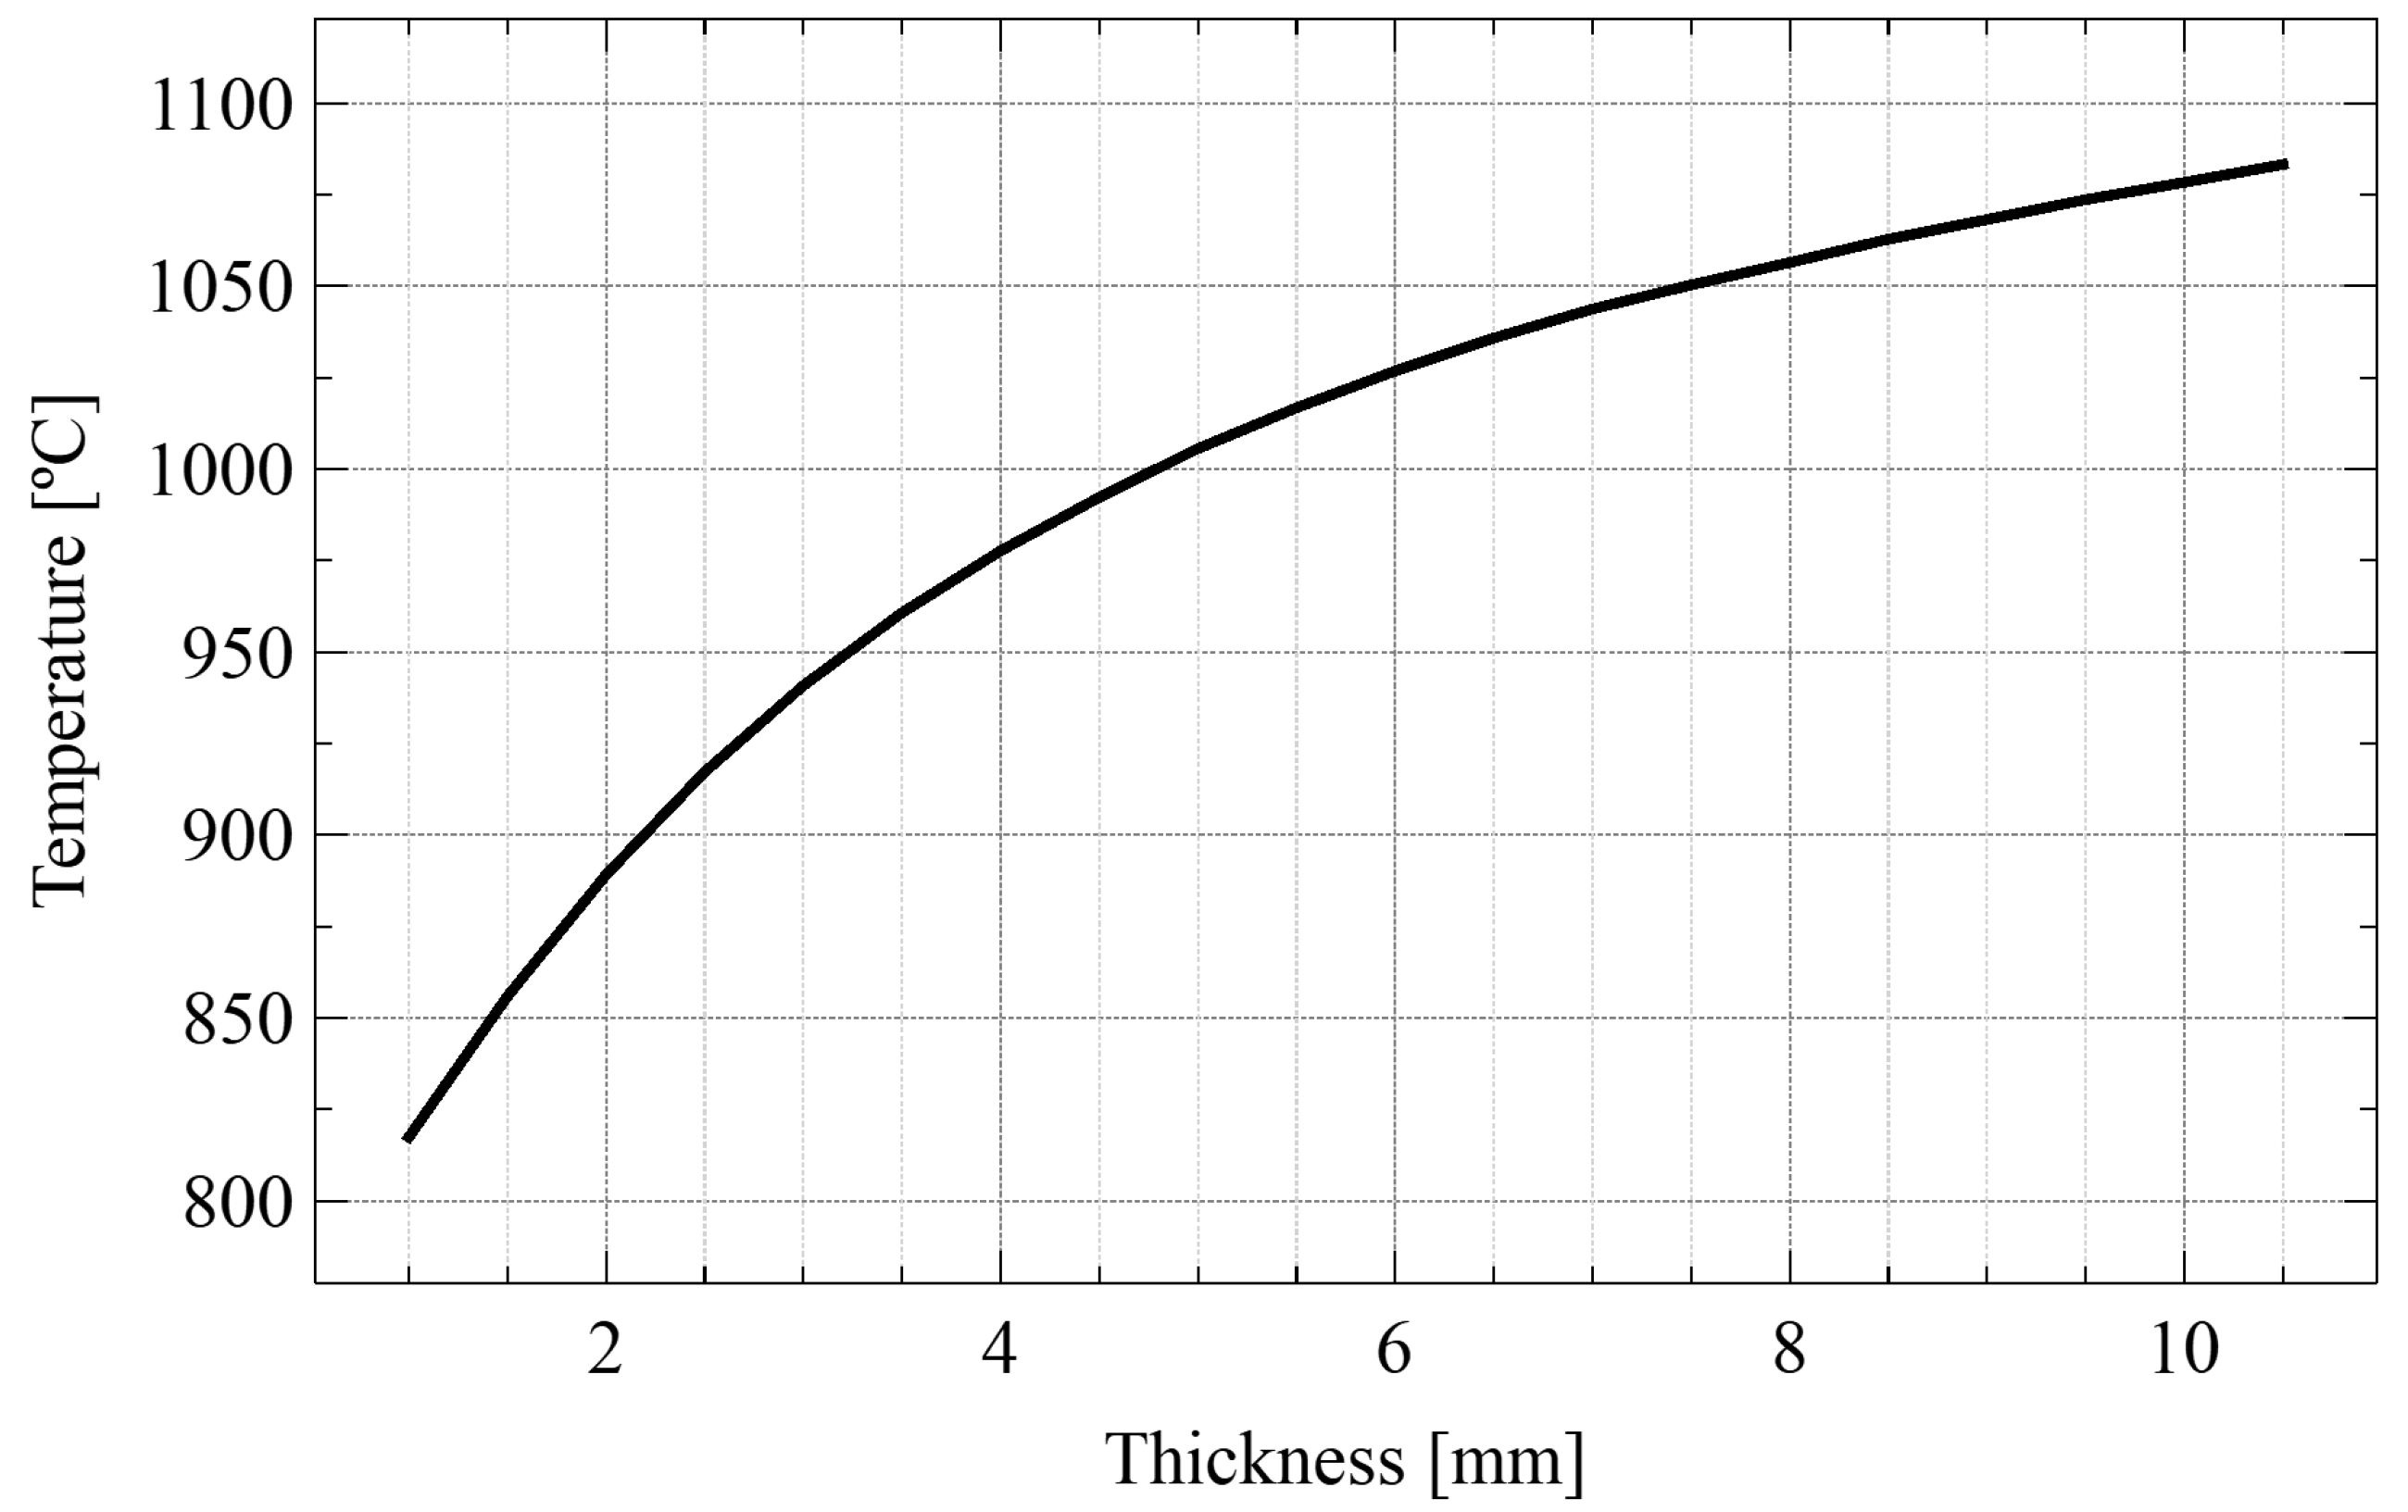
The thickness of the glass window is a design parameter with strong influence on the temperature of the medium because the glass window absorbs radiative energy. The higher the thickness, the higher the absorption of energy will be. Consequently, thicker windows will register higher window temperatures. Figure 10 shows the average window temperature with the increase of the window thickness. A logarithmic temperature increase is observed as the window thickness increases. Varying the thickness from 1 to 10 mm leads to an increase from about 850 °C to 1050 °C.

4.4.3. Burner Radiation Efficiency

The radiative efficiency represents the fraction of radiative power compared with the total power of burners output and depends on diverse factors, such as material, porous arrangement, and others. Three different values of radiative efficiency are considered (0.3, 0.4 and 0.5) and Table 4 shows the resulting burners surface temperature, calculated using the procedure described in Figure 4a. Increasing the radiative efficiency leads to higher burner surface temperature and therefore to higher temperatures inside the window since the absorbed energy increases. This parameter has a high influence on the window temperature since changing from an efficiency of 0.3 to 0.5 leads to a difference of 209 °C on the burners surface temperature, which results in an increase of 137 °C inside the window.

4.4.4. Cooling Gas Temperature and Velocity

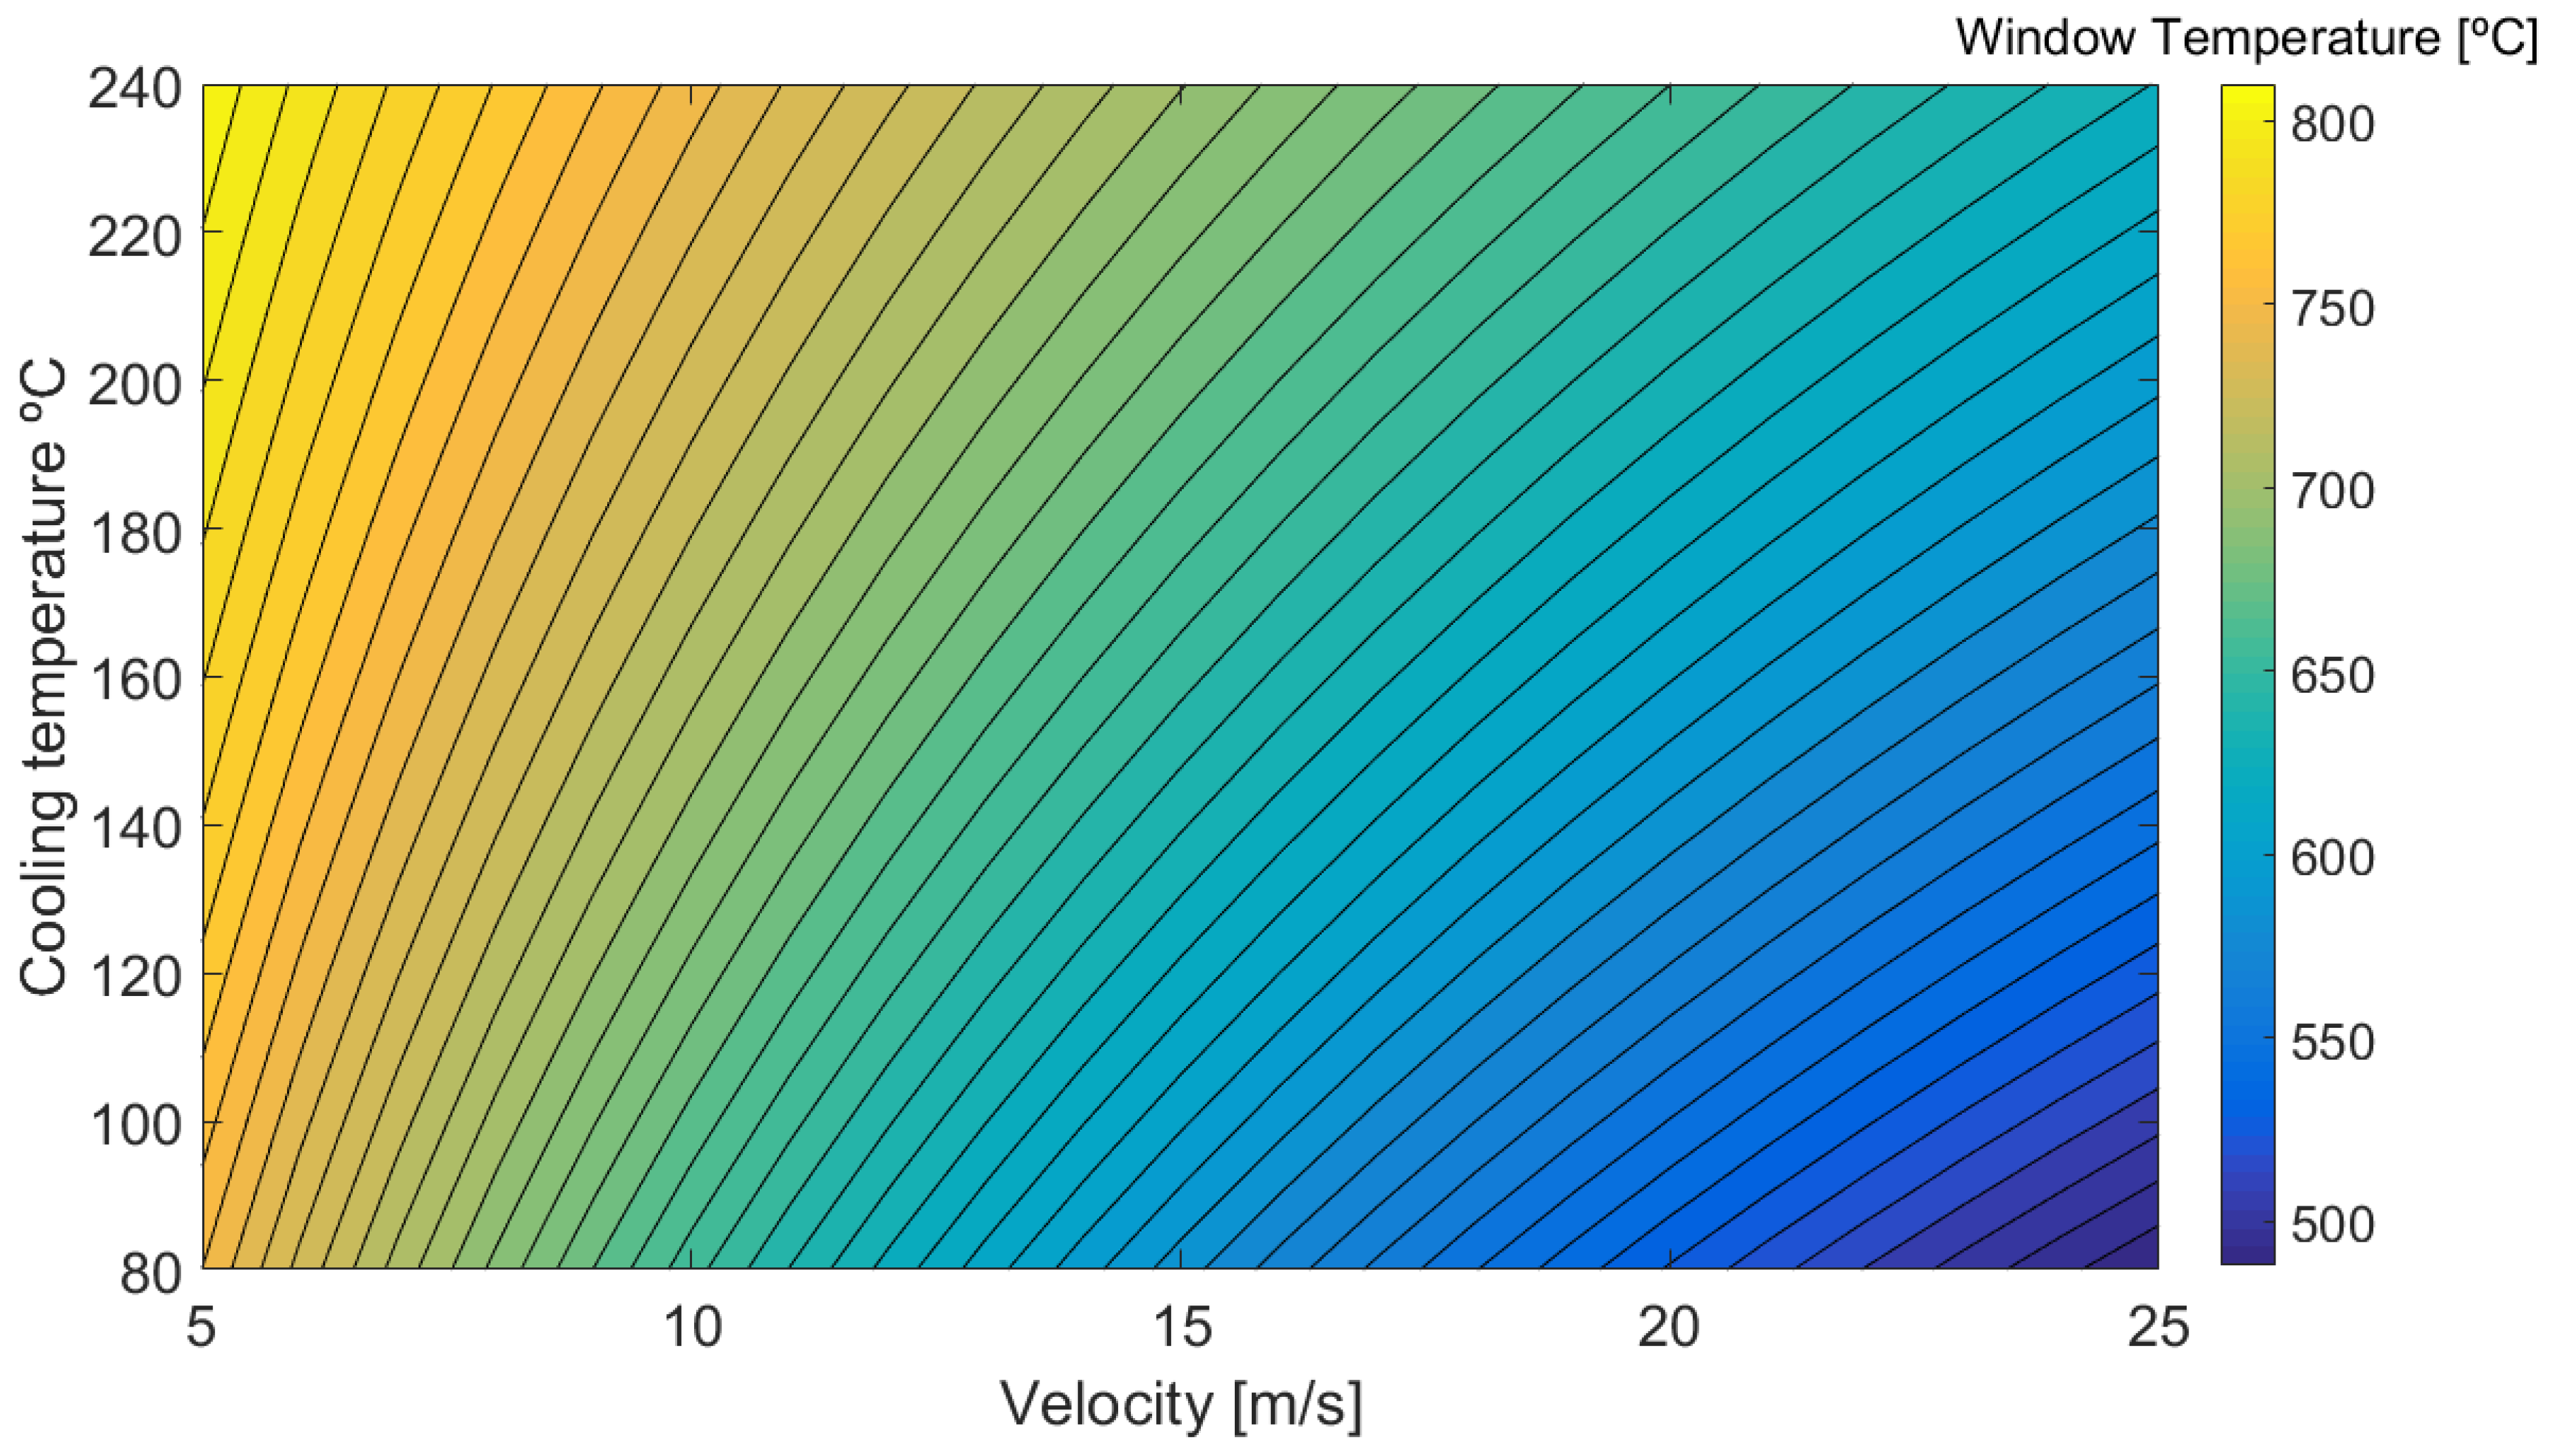
Figure 11 shows the window temperature resulting from the application of cooling Scheme C, only at RBS—red arrows in Figure 2—as function of cooling temperature (y axis) and velocity (x axis). The results demonstrate the high temperature reduction from 889 °C without cooling to 501 °C by a wall jet cooling with 25 m/s and temperature of 80 °C.
The same study was conducted for the other cooling strategies and there are no significant differences between cooling Scheme A and C, with the cooling Scheme B predicting a slight higher window temperature.
The 1D model predicted the average glass window temperature by considering the average heat transfer coefficient. However, that could not analyse local regions or temperature gradients along x and y. For that reason and due to the reduced thermal conductivity of the material, the 1D model was applied to different regions, allowing to generate 3D window model results.
Figure 12 shows the distribution of the heat transfer convection coefficient for the different cooling strategies inside RBS (considering the same Reynolds number) predicted with the simplified 3D geometry of Figure 1b. The regions with higher heat transfer convection coefficients match the zones near the injection due to the wall jet attachment. In Figure 12a, Scheme A features lower heat transfer coefficients near the opposite wall of gas injection—as expected due to the reduced gas velocity values in this region. Scheme C registers a region at the middle of the window with low heat transfer coefficients because of the effect of tangential interaction between opposite jet (see Figure 12c). A direct collision between wall jets is registered for Scheme B, and at the stagnation zone an upward fountain jet flow starts to develop on the normal direction in accordance with literature [44,45]. Scheme B offers less spatial variability (root mean square) of the convection coefficient for all the Reynolds numbers considered.
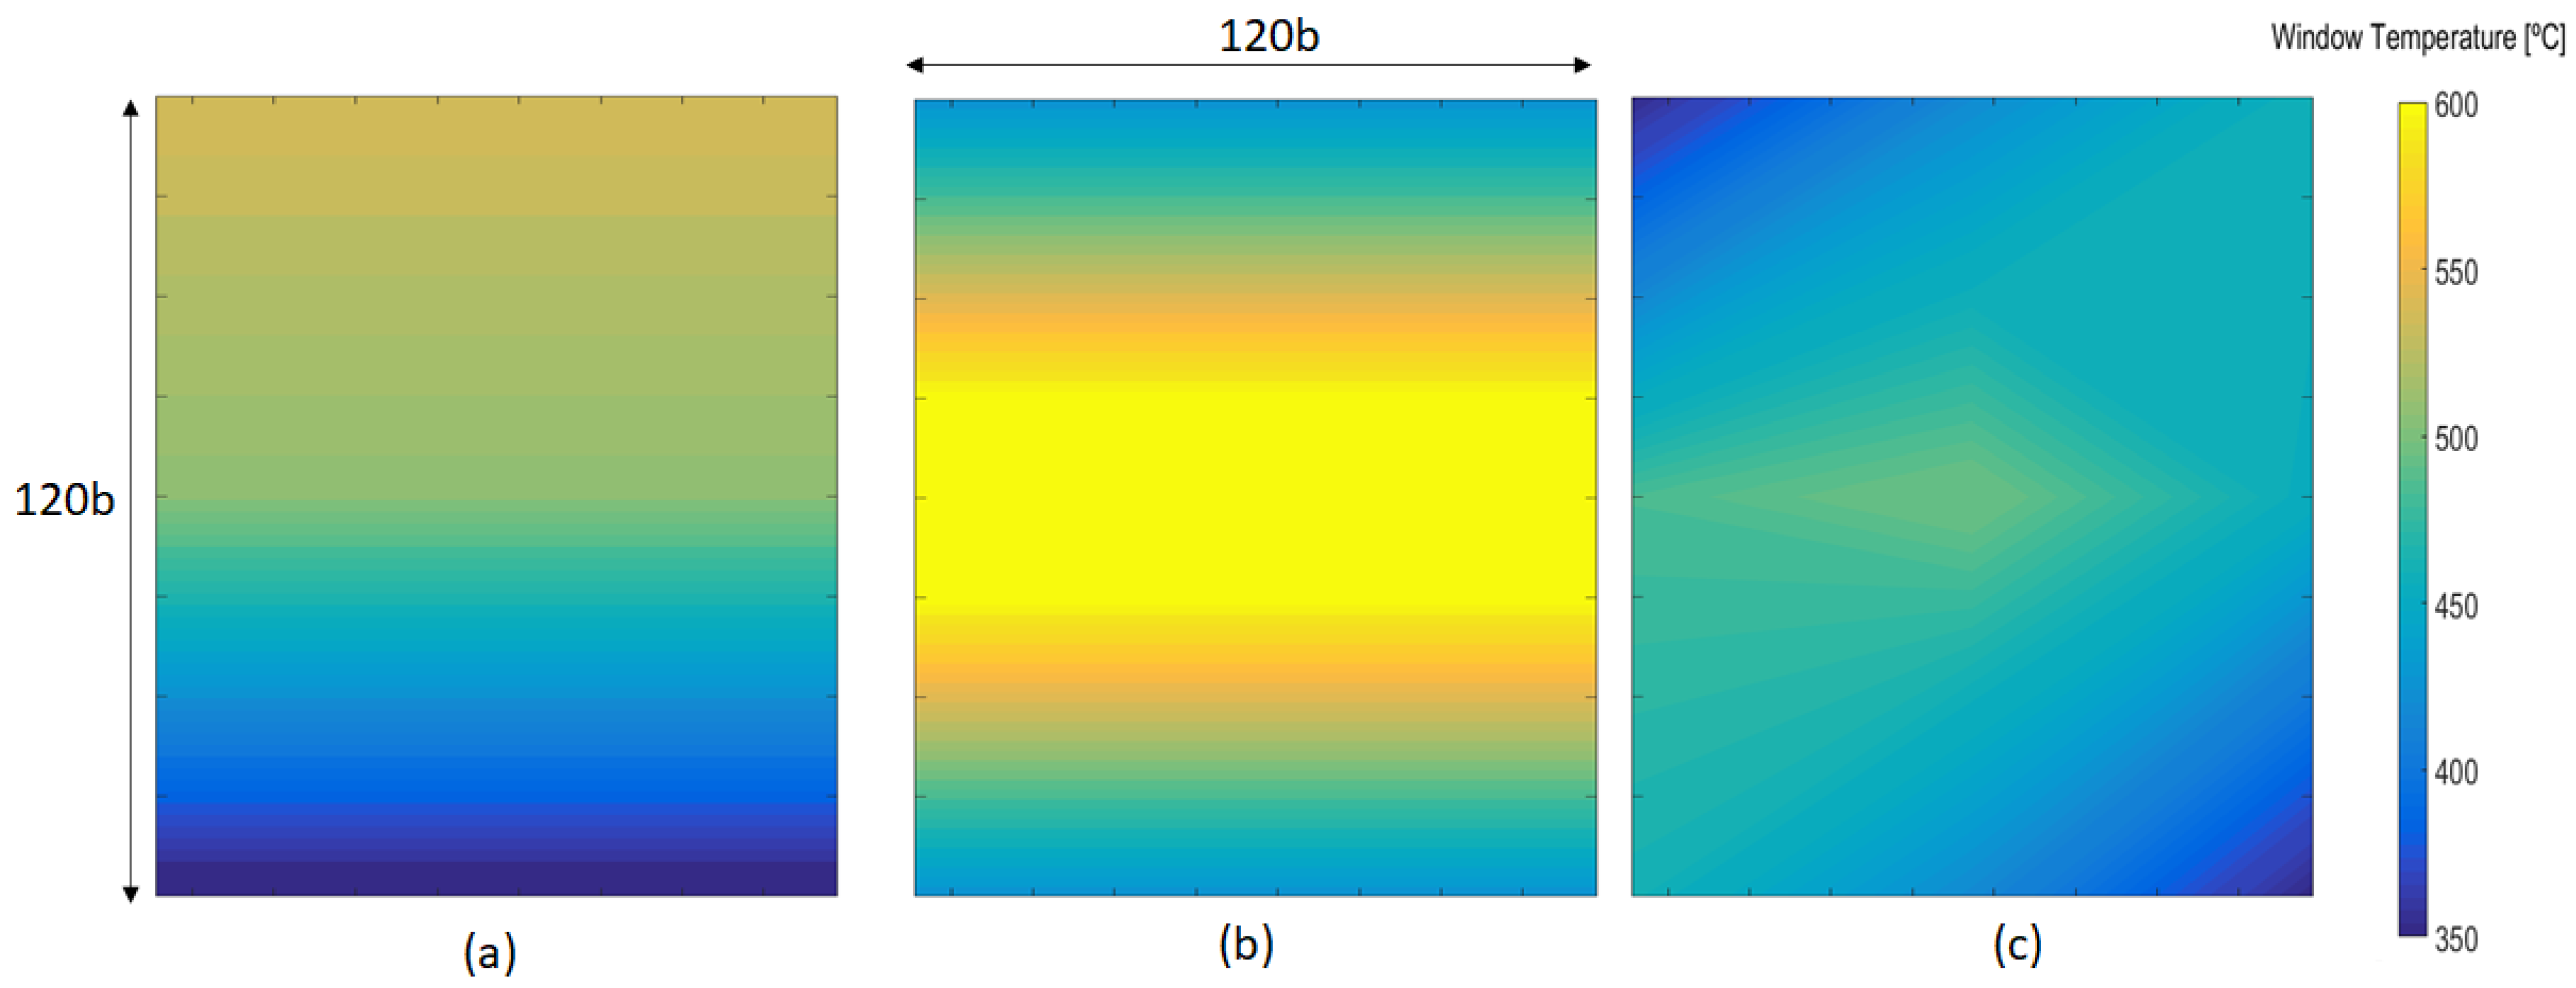
Figure 13 shows the corresponding window temperature along the x and y axes for a nominal cooling condition—RBS and COS cooling with 25 m/s and 80 °C and with 12.5 m/s and 250 °C, respectively—considering the different cooling strategies. The maximum window temperatures for cooling Schemes B and C are at the middle of the plate since the stagnation/collision region inside RBS is the same as COS. Scheme A combines the lowest heat removal from COS with the highest heat removal from RBS. Cooling Scheme C registers lower temperatures and lower temperature gradients than the other strategies for the nominal operating condition.

4.5. 3D Full Oven

4.5.1. Operating Conditions

The numerical simulations are conducted for a nominal operating condition of 600 kW with the three first batteries of burners active. At the burners outlet section, temperature and velocity values are prescribed for the flue gas stream (2 m/s at 1067 °C) and an iteratively estimated surface temperature from the imposed radiative flux is applied on the corresponding surface area. The metal strip temperature is prescribed with a linear increase inside the COS from 23 °C to 250 °C. The enclosure walls were defined as adiabatic, opaque surfaces with an emissivity equal to 0.8—value consistent with the constituent materials. The considered material for the glass is the reference material referred in Section 4.4. The cooling jet injection of the flue gas in RBS and COS was simulated with nominal condition—see previous Section 4.4.4. A pressure-outlet boundary condition stating atmospheric pressure conditions was applied at the flue gas extraction sections.
The 3D computational domain of Figure 1a was discretized considering hexahedron cells and resulted in a mesh of 6.18 million cells and the high Reynolds Realizable κ ε model was used with standard WF. Further mesh refinement for the low-Re modeling near the window was not possible because of the affordable computational cost, but it was considered for the simplified configuration of geometry of Figure 1b.

4.5.2. Hydrothermal Performance Characterization

No Active Cooling

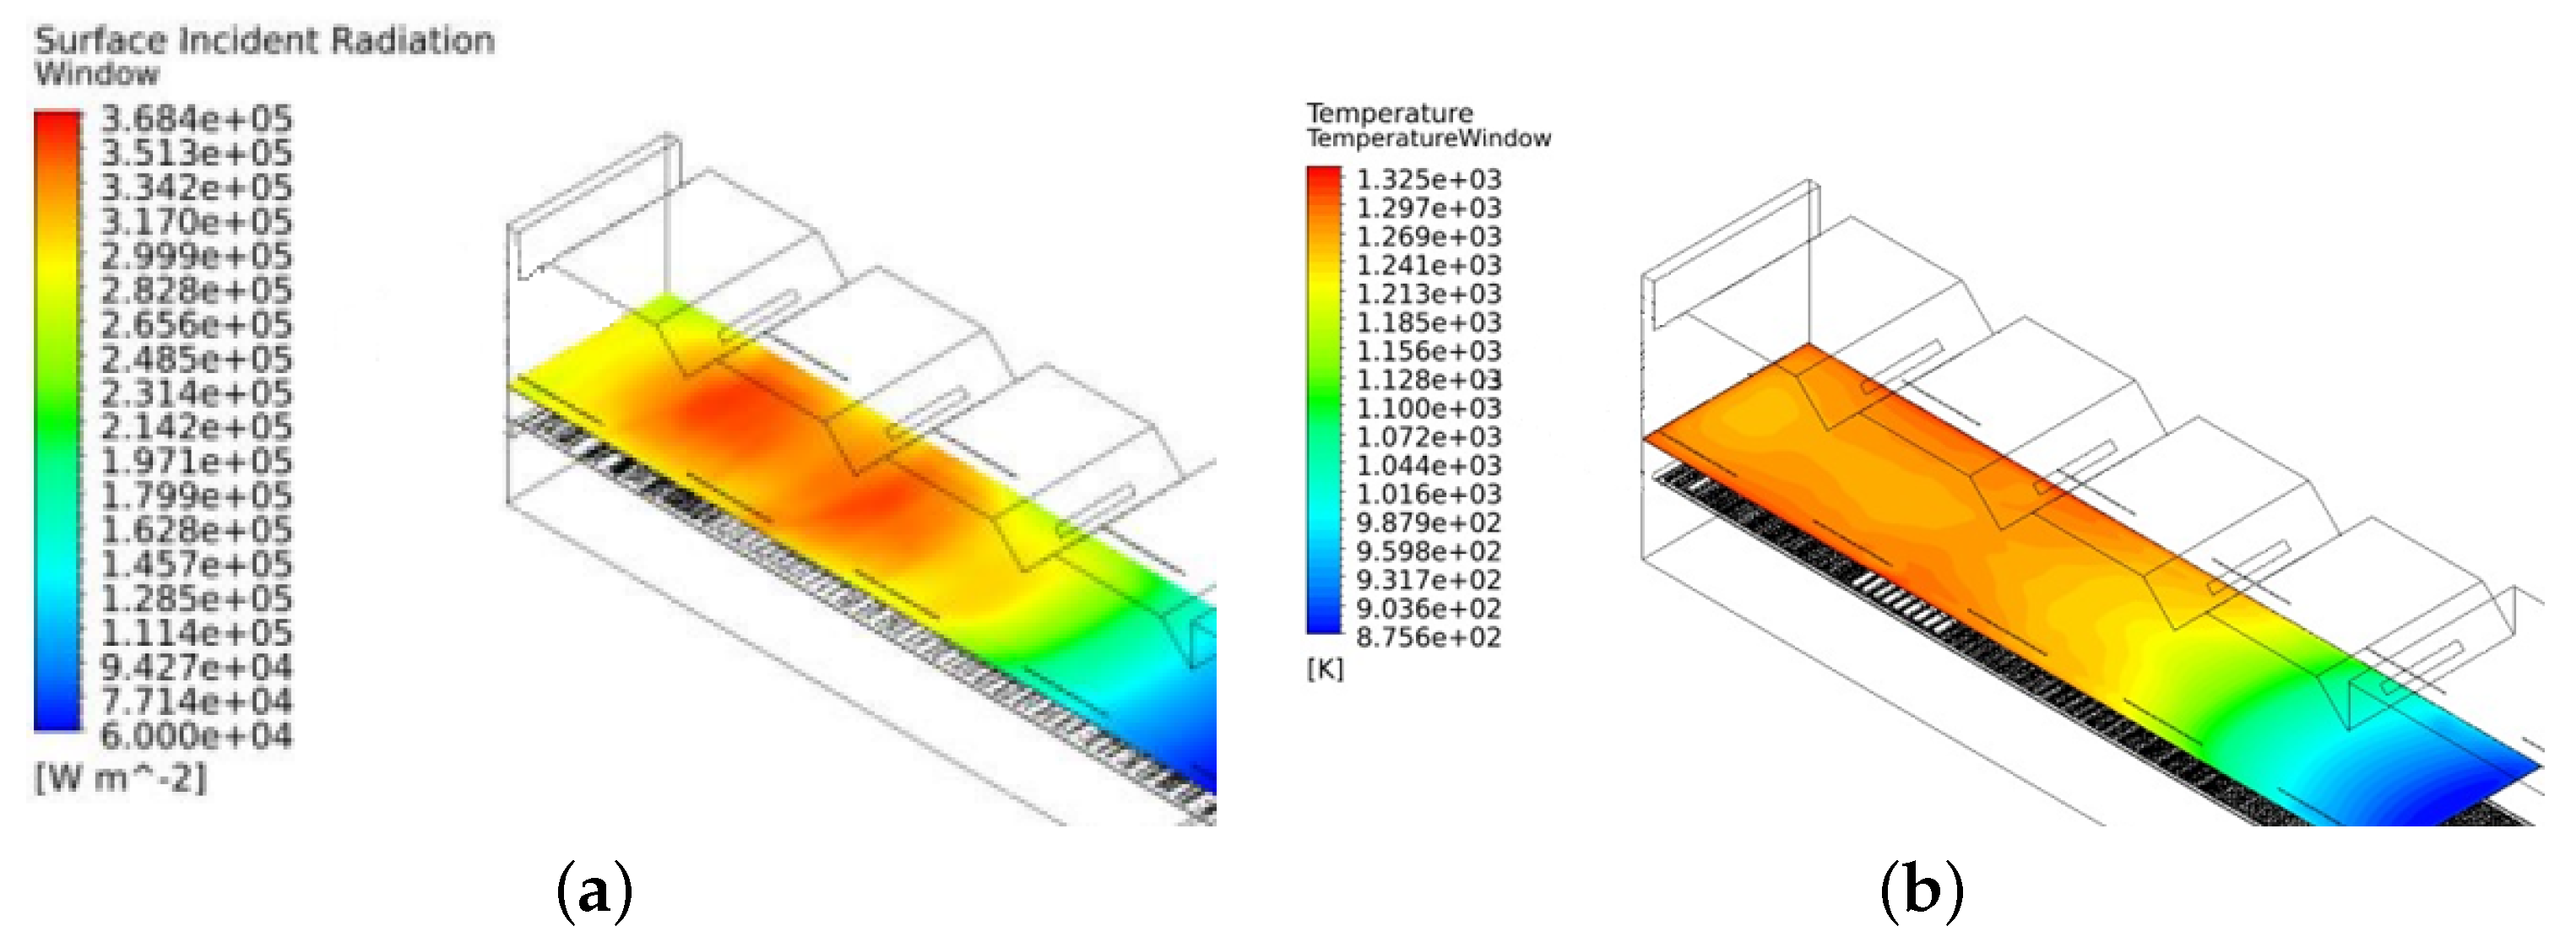
Figure 14a,b show the predicted incident radiation (irradiation) and temperature, respectively, on the upper surface of the glass. As expected, higher irradiation and temperature values are observed at the centre and underneath the first and second rows of batteries. An average window temperature equal to 925 °C is calculated which is very similar to the value obtained with the 1D window model (approximately equal to 889 °C).

Cooling—COS

This case is conducted with the cooling system applied below the burner in an alternated cooling scheme (cooling Scheme C—black arrows in Figure 2). Figure 15a,b depicts the velocity streamlines and the window temperature distribution respectively. The hotter regions are at the opposite side of the injection and at the centre, where collision between jets occurs, agreeing with expected and previous results for the convective heat transfer coefficient (see Figure 12). The flow pattern footprint on the window temperature distribution is clearly observed and the window registers an average temperature of about 830 °C. The 1D glass window model with similar simulation conditions computed an average window temperature of about 758 °C.

Cooling—RBS

Figure 16a,b show the window temperature for cooling Scheme A (see red arrows in Figure 2) and C, respectively. For the alternated cooling Scheme C, the hotter zones are registered on the opposite side of the cooling jets and in the middle zones between them (see Figure 16a).
The opposite jets of Scheme C have an impact on each other, reducing the velocity and, consequently, the heat removed from the window. This effect is increased by the distance between the cooling inlets and is denoted by the blue dashed lines in Figure 16a. The results show a negligible difference between both cases in terms of average window temperature, which agrees with the results of the 1D study.

4.5.3. Active Cooling Process Optimisation

Global Energy Budget

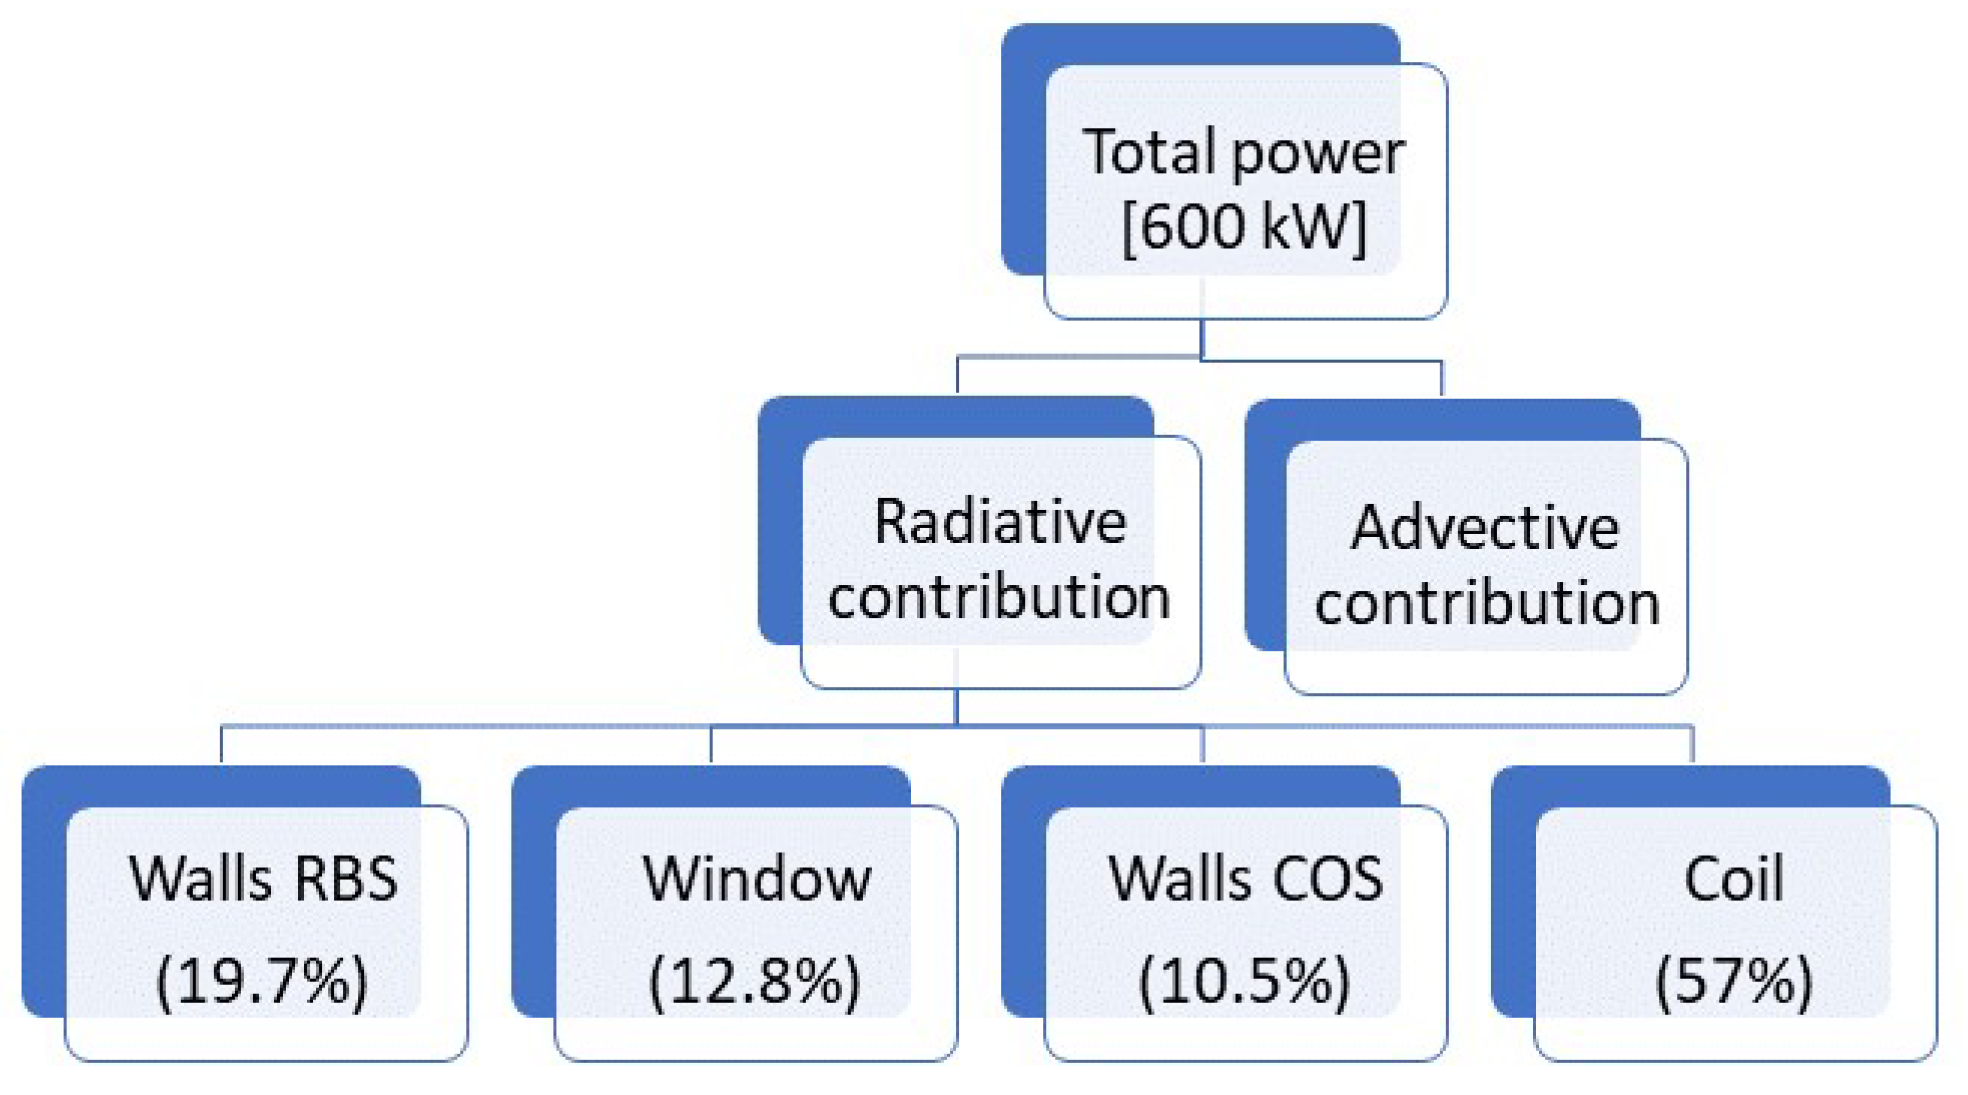
The diagram of Figure 17 summarises the energy budget. The nominal operating condition corresponds to a total power output of 600 kW, with a radiative efficiency equal to 0.3—radiative contribution of 181.6 kW. The radiative flux from burners output is not entirely directed towards the coil since the walls and the window absorb part of that energy, however the amount comply with the requirements to drive the coating process—103.6 kW (57%). The radiative gains of the walls are considerable, specially on RBS, due to higher temperatures. Another energy budgets were performed to the fluid inside both regions and the enthalpy of the inlet and outlet flows matched the heat exchange from the walls and window.
The objective of the optimisation is not minimizing the temperature of the medium but to find the minimum cost of energy to comply with a stable and safe operation. The lowest cost possible is observed when there is no need for an additional strategy for reducing the window temperature (cooling) since the system is already in full compliance with the objective. However, there are operating conditions for which the system performance (window thermal performance) does not comply with the requirements—the window temperature becomes higher than a critical value—and an optimised window cooling conditions should be evaluated and applied. The energetic cost is dictated by the cooling operation of the heat exchangers to extract Q HX ; RBS and Q HX ; COS —see Equations (16) and (17).
Q HX ; RBS = m ˙ coolRBS × h out ; RBS h in ; coolRBS
Q HX ; COS = m ˙ coolCOS × h out ; COS h in ; coolCOS
The fluid extracted from the furnace internal environment (RBS or COS) passes through an heat exchanger and is injected again into the same environment, therefore the objective function is based on this device. The heat exchanger removes part of the extracted fluid heat, according with a mass flow rate ( m ˙ coolRBS and m ˙ coolCOS ) and a cooling inlet temperature. The minimization of this function leads to minimize the mass flow rate and minimize the difference of specific enthalpy between extracted and injected ( h out and h in ; cool ). The total enthalpy extracted ( H outRBS and H outCOS ) is dependent on the energy balance performed to the system. The difference of total enthalpy is equal to the heat removed from the window and gained by the system:
H outRBS H in ; coolRBS H in ; burner = Q w ; RBS
H outCOS H in ; coolCOS = Q w ; COS
The thermal power removed from the window by convection is computed based on the 1D model, and the variables are dependent on cooling conditions:
Q w ; RBS = A w × h RBS × ( T w T RBS )
Q w ; COS = A w × h COS × ( T w T COS )

Optimised Variables and Constraints

The variables to optimise correspond to the cooling gas conditions: injection velocity and temperature for the RBS ( V RBS and T RBS ) and COS ( V COS and T COS ), and the cooling scheme (discrete variable considering the three different schemes). The optimised continuous variables are constrained in a domain with the following lower and upper bounds:
250 °C < T COS < 450 °C
5 m/s < V COS < 25 m/s
80 °C < T RBS < 450 °C
5 m/s < V RBS < 25 m/s
The optimal solution is also constrained by a maximum temperature and a maximum temperature gradient ( T max ; w < T crit and Δ T w < Δ T crit ). These safety requirements are evaluated according with the 1D/3D model since the study along x and y is under consideration.
The genetic algorithm of MATLAB optimisation toolbox (version R2020b) [46] was used to solve the optimisation formulation. The initial-point algorithm is used and a search with multiple initial points (10) is used to dissipate the errors. The main results are listed in Table 5 and show that decreasing the critical temperature (first column) the demand for more cooling power increases (last column). The increase of this value is not entirely linear.
The optimisation dictates as the reduction of the critical temperatures starts, to use the cooling inside COS by initially increasing its velocity ( T crit —800 to 700 °C) and after achieving the maximum, reducing the inlet cooling temperature ( T crit —700 to 600 °C). When there is a need of a maximum temperature below 600 °C, the maximum limits of cooling inside COS are achieved and then the system demands the cooling power inside RBS. The optimal response dictates, in opposite to COS, a reduction of cooling inlet temperature ( T crit —600 to 550 °C) and only afterwards, an increase of velocity in order to meet the requirements ( T crit —550 to 450 °C).
Since the extracted gas from the RBS has higher enthalpy, the system optimisation dictates more energetic consumption. The injected cooling gas at the RBS is mixed with the burners flue gas leading to an increased energy cost of the heat exchanger.
The optimal cooling strategy changes from Scheme A to C since increasing the cooling power inside COS leads initially to maximum temperatures on the opposite edge for Scheme A and change to the middle of the plate. This effect is not registered in cooling Scheme C, for which the maximum temperatures keep at the middle of the window. There is an increase of the temperature gradient as the critical temperature is reduced, until the cooling inside RBS starts to act. The gradient of temperature starts to reduce since the cooling power on the upper window surface reduces the temperature where the maximum temperature was being registered. Scheme B does not become an optimal choice in any condition due to the stagnation region at the middle of the window (above and underneath the window) which causes high local temperature values and high temperature gradients.

5. Conclusions

The flow and heat transfer processes inherent to a curing furnace by IR radiative energy exchange were investigated numerically. The configuration uses a glass plate partition inside the oven and registers high temperatures due to its absorption of radiation. The thermal control of the window was achieved based on several cold wall jets with different arrangements to guarantee the safety of the operation. Detailed validation and comparisons with 1D/3D conduction-radiation models give confidence to the parametric studies and to the optimisation of the window thermal control. The salient conclusions from this study are listed as follows.
  • Different turbulence RANS high- and low-Re models were validated to predict wall jets with heat transfer. The κ ω SST and SA turbulence models with low-Re modeling are recommended for satisfactory predictions of a quantity like the heat transfer coefficient. Numerical simulations in a simplified 3D model were performed to obtain the heat transfer correlations associated to the wall jet cooling.
  • The previous information (heat transfer correlations) is integrated in the developed 1D/3D conduction-radiation model with discrete ordinates method to predict and analyse the thermal behaviour of the glass. The 1D model was verified and a parametric study was conducted to detect the influence of glass thickness, radiative properties, cooling jets conditions such as temperature, velocity, and arrangement strategies.
  • Three different cooling strategies are analysed and compared. Cooling with opposite jets leads to less heat removed from the window and higher gradient of temperature due to the stagnation region at the middle of the glass plate and resulting fountain flow. There is no significant difference on the total heat removed from the window by considering cooling from one-side or in alternated scheme.
  • The average glass temperature predicted by 1D/3D model is in satisfactory agreement with full 3D curing furnace numerical simulation results, identifying the high window temperature for the situation without cooling (889 °C/929 °C) and impact of cooling in COS (758 °C/830 °C). The results for 3D full numerical simulations with cooling inside RBS show as well, the 1D/3D model, a negligible difference between different cooling schemes (one-sided or alternated).
  • The optimisation procedure based on the developed 1D/3D model leads to the cooling control conditions (minimum cooling power) for selected safety requirements (maximum window temperature and gradient of temperature). The demand of cooling power increases when there is a need of a lower maximum temperature. The optimisation shows that the use of the heat exchanger inside COS is more relevant for energetic purposes. The optimisation dictates Scheme C to be the best choice for the scheme of cooling, and Scheme A for T crit > 750  °C.
The results obtained in this study will help in the design of an innovative coil coating system, selection of suitable cooling glass window under high temperature conditions, and prediction of flow and heat and mass transfer with cost design temperature reduction.

Author Contributions

Conceptualization, R.J.F.N., J.E.P.N. and J.C.F.P.; Methodology, R.J.F.N., J.E.P.N. and J.C.F.P.; Software, R.J.F.N.; Validation, R.J.F.N.; Formal Analysis, R.J.F.N.; Investigation, R.J.F.N.; Resources, R.J.F.N.; Data Curation, R.J.F.N.; Writing—Original Draft Preparation, R.J.F.N., B.S.D., J.E.P.N. and J.C.F.P.; Writing—Review & Editing, R.J.F.N. and J.E.P.N.; Visualization, R.J.F.N. and B.S.D.; Supervision, J.E.P.N. and J.C.F.P.; Project Administration, J.E.P.N. and J.C.F.P.; Funding Acquisition, J.C.F.P. All authors have read and agreed to the published version of the manuscript.

Funding

This research was funded by the European Community’s Framework Programme for Research and Innovation Horizon 2020 under grant agreement no. 768692 (ECCO). This work was also supported by FCT, through IDMEC, under LAETA, project UIDB/ 50022/2020.

Institutional Review Board Statement

Not applicable.

Informed Consent Statement

Not applicable.

Conflicts of Interest

The authors declare no conflict of interest.

References

  1. Sander, J. Coil Coating; Vincentz Network: Hanover, Germany, 2014. [Google Scholar]
  2. Kolås, T.; Røyset, A.; Grandcolas, M.; Lacau, A. Solar energy materials and solar cells cool coatings with high near infrared transmittance for coil coated aluminium. Sol. Energy Mater. Sol. Cells 2019, 196, 94–104. [Google Scholar] [CrossRef]
  3. Joudi, A.; Svedung, H.; Cehlin, M.; Rönnelid, M. Reflective coatings for interior and exterior of buildings and improving thermal performance. Appl. Energy 2013, 103, 562–570. [Google Scholar] [CrossRef]
  4. Johansson, K.; Johansson, M. A model study on fatty acid methyl esters as reactive diluents in thermally cured coil coating systems. Prog. Org. Coat. 2006, 55, 382–387. [Google Scholar] [CrossRef]
  5. Gupta, G.; Pathak, S.; Khanna, A. Anticorrosion performance of eco-friendly silane primer for coil coating applications. Prog. Org. Coat. 2012, 74, 106–114. [Google Scholar] [CrossRef]
  6. Choi, J.W.; Chun, W.P.; Oh, S.H.; Lee, K.J.; Kim, S.I. Experimental studies on a combined near infrared (NIR) curing system with a convective oven. Prog. Org. Coat. 2016, 91, 39–49. [Google Scholar] [CrossRef]
  7. Mabbett, I.; Elvins, J.; Gowenlock, C.; Jones, P.; Worsley, D. Effects of highly absorbing pigments on near infrared cured polyester/melamine coil coatings. Prog. Org. Coat. 2013, 76, 1184–1190. [Google Scholar] [CrossRef] [Green Version]
  8. Mabbett, I.; Elvins, J.; Gowenlock, C.; Glover, C.; Jones, P.; Williams, G.; Worsley, D. Addition of carbon black NIR absorber to galvanised steel primer systems: Influence on NIR cure of polyester melamine topcoats and corrosion protection characteristics. Prog. Org. Coat. 2014, 77, 494–501. [Google Scholar] [CrossRef]
  9. Keramiotis, C.; Katoufa, M.; Vourliotakis, G.; Hatziapostolou, A.; Founti, M. Experimental investigation of a radiant porous burner performance with simulated natural gas, biogas and synthesis gas fuel blends. Fuel 2015, 158, 835–842. [Google Scholar] [CrossRef]
  10. Maznoy, A.; Kirdyashkin, A.; Pichugin, N.; Zambalov, S.; Petrov, D. Development of a new infrared heater based on an annular cylindrical radiant burner for direct heating applications. Energy 2020, 204, 117965. [Google Scholar] [CrossRef]
  11. Energy Efficient Coil Coating Process, European Project. Available online: https://www.spire2030.eu/ecco (accessed on 22 February 2022).
  12. Kim, K.M.; Moon, H.; Park, J.S.; Cho, H.H. Optimal design of impinging jets in an impingement/effusion cooling system. Energy 2014, 66, 839–848. [Google Scholar] [CrossRef]
  13. Cho, H.H.; Goldstein, R.J. Heat (Mass) Transfer and Film Cooling Effectiveness With Injection Through Discrete Holes: Part I—Within Holes and on the Back Surface. J. Turbomach. 1995, 117, 440–450. [Google Scholar] [CrossRef]
  14. Huber, A.M.; Viskanta, R. Effect of jet-jet spacing on convective heat transfer to confined, impinging arrays of axisymmetric air jets. Int. J. Heat Mass Transf. 1994, 37, 2859–2869. [Google Scholar] [CrossRef]
  15. Förthmann, E. On turbulent jet propagation (in German: Über turbulente Strahlausbreitung). Ingenieur-Archiv 1934, 5, 42–54. [Google Scholar] [CrossRef]
  16. Glauert, M.B. The wall jet. J. Fluid Mech. 1956, 1, 625. [Google Scholar] [CrossRef]
  17. Launder, B.E.; Rodi, W. The turbulent wall jet measurements and modeling. Annu. Rev. Fluid Mech. 1983, 15, 429–459. [Google Scholar] [CrossRef]
  18. George, W.K.; Abrahamsson, H.; Eriksson, J.; Karlsson, R.I.; Lofdahl, L.; Wosnik, M. A similarity theory for the turbulent plane wall jet without external stream. J. Fluid Mech. 2000, 425, 367–411. [Google Scholar] [CrossRef]
  19. Rostamy, N.; Bergstrom, D.J.; Deutscher, D.; Sumner, D.; Bugg, J.D. An experimental study of a plane turbulent wall jet using LDA. ICHMT Digit. Libr. 1998, 25, 50–60. [Google Scholar]
  20. Dejoan, A.; Leschziner, M.A. Large eddy simulation of a plane turbulent wall jet. Phys. Fluids 2005, 17, 025102. [Google Scholar] [CrossRef]
  21. Ahlman, D.; Brethouwer, G.; Johansson, A.V. Direct numerical simulation of a plane turbulent wall-jet including scalar mixing. Phys. Fluids 2007, 19, 065102. [Google Scholar] [CrossRef] [Green Version]
  22. Banyassady, R.; Piomelli, U. Interaction of inner and outer layers in plane and radial wall jets. J. Turbul. 2015, 16, 460–483. [Google Scholar] [CrossRef]
  23. Dakos, T.; Verriopoulos, C.A.; Gibson, M.M. Turbulent flow with heat transfer in plane and curved wall jets. J. Fluid Mech. 1984, 145, 339. [Google Scholar] [CrossRef]
  24. AbdulNour, R.S.; Willenborg, K.; McGrath, J.J.; Foss, J.F.; AbdulNour, B.S. Measurements of the convection heat transfer coefficient for a planar wall jet: Uniform temperature and uniform heat flux boundary conditions. Exp. Therm. Fluid Sci. 2000, 22, 123–131. [Google Scholar] [CrossRef]
  25. Godi, S.C.; Abraham, S.; Pattamatta, A.; Balaji, C. Evaluation of candidate strategies for the estimation of local heat transfer coefficient from wall jets. Exp. Heat Transf. 2020, 33, 40–63. [Google Scholar] [CrossRef]
  26. Godi, S.C.; Pattamatta, A.; Balaji, C. Heat transfer from a single and row of three dimensional wall jets—A combined experimental and numerical study. Int. J. Heat Mass Transf. 2020, 159, 119801. [Google Scholar] [CrossRef]
  27. Naqavi, I.Z.; Tyacke, J.C.; Tucker, P.G. A numerical study of a plane wall jet with heat transfer. Int. J. Heat Fluid Flow 2017, 63, 99–107. [Google Scholar] [CrossRef] [Green Version]
  28. ANSYS Inc. ANSYS Fluent User’s Guide, Release 17.2; ANSYS Inc.: Canonsburg, PA, USA, 2016. [Google Scholar]
  29. Chen, Y.; Lei, D. Analysis and numerical simulation research of the heating process in the oven. J. Therm. Sci. 2016, 25, 454–459. [Google Scholar] [CrossRef]
  30. Al-Nasser, M.; Fayssal, I.; Moukalled, F. Numerical simulation of bread baking in a convection oven. Appl. Therm. Eng. 2021, 184, 116252. [Google Scholar] [CrossRef]
  31. ANSYS Inc. ANSYS Fluent Theory Guide; ANSYS Inc.: Canonsburg, PA, USA, 2013; Volume 5317, pp. 724–746. [Google Scholar]
  32. Modest, M.F. Radiative Heat Transfer, 3rd ed.; Elsevier: Amsterdam, The Netherlands, 2013. [Google Scholar]
  33. Rek, Z.; Rudolf, M.; Zun, I. Application of CFD simulation in the development of a new generation heating oven. Stroj. Vestn. 2012, 58, 134–144. [Google Scholar] [CrossRef]
  34. Fidalgo, M.F.; Mendes, M.A.; Pereira, J.M. An automated method for efficient multi-parametric analysis of porous radiant burner performance. Int. J. Therm. Sci. 2021, 163, 106851. [Google Scholar] [CrossRef]
  35. Abrahamsson, H.; Johansson, B.; Lofdahl, L. A turbulent plane two-dimensional wall-jet in a quiescent surrounding. Eur. J. Mech. B Fluids 1994, 13, 533–556. [Google Scholar]
  36. Nguyen, T.D.; Souad, H. PIV measurements in a turbulent wall jet over a backward-facing step in a three-dimensional, non-confined channel. Flow Meas. Instrum. 2015, 42, 26–39. [Google Scholar] [CrossRef]
  37. Nait Bouda, N.; Schiestel, R.; Amielh, M.; Rey, C.; Benabid, T. Experimental approach and numerical prediction of a turbulent wall jet over a backward facing step. Int. J. Heat Fluid Flow 2008, 29, 927–944. [Google Scholar] [CrossRef]
  38. Tsai, Y.; Hunt, J.; Nieuwstadt, F.; Westerweel, J.; Gunasekaran, B. Effect of Strong External Turbulence on a Wall Jet Boundary Layer. Flow Turbul. Combust. 2007, 79, 155–174. [Google Scholar] [CrossRef]
  39. Talukdar, P.; Mishra, S.C. Analysis of conduction-radiation problem in absorbing, emitting and anisotropically scattering media using the collapsed dimension method. Int. J. Heat Mass Transf. 2002, 45, 2159–2168. [Google Scholar] [CrossRef]
  40. Zuckerman, N.; Lior, N. Jet impingement heat transfer: Physics, correlations, and numerical modeling. Adv. Heat Transf. 2006, 39, 565–631. [Google Scholar]
  41. Martin, H. Heat and mass transfer between impinging gas jets and solid surfaces. Adv. Heat Transf. 1977, 13, 1–60. [Google Scholar]
  42. Rubin, M. Optical properties of soda lime silica glasses. Sol. Energy Mater. 1985, 12, 275–288. [Google Scholar] [CrossRef] [Green Version]
  43. Fraas, L.; Minkin, L.; Avery, J.; Ferguson, L.; Samaras, J. Spectral control development for thermophotovoltaics. In Proceedings of the 2016 IEEE 43rd Photovoltaic Specialists Conference (PVSC), Portland, OR, USA, 5–10 June 2016; pp. 0323–0327. [Google Scholar] [CrossRef]
  44. Johansson, P.S.; Anderson, H.I. Direct numerical simulation of two opposing wall jets. Phys. Fluids 2005, 17, 055109. [Google Scholar] [CrossRef]
  45. Arabia, S. A numerical study of the flow and heat- transfer characteristics of an impinging laminar slot-jet including crossflow effects. Int. J. Heat Mass Transf. 1992, 35, 2501–2513. [Google Scholar]
  46. The MathWorks Inc. Global Optimisation Toolbox; The MathWorks Inc.: Natick, MA, USA, 2020. [Google Scholar]
Figure 1. Three-dimensional physical models of the coil coating oven: (a) full radiative oven configuration; and (b) simplified radiant burner section geometric model considering a battery of burners with a single row of burners.
Energies 15 02080 g001
Figure 2. Representation of different cooling schemes in a top view. Red/black arrows indicate that the wall jet is injected above/below the window.
Energies 15 02080 g002
Figure 3. Schematic representation of radiation intensity at the boundary x = L .
Energies 15 02080 g003
Figure 4. Iterative procedure for computing burners surface temperature: (a) flow chart; and (b) example of application.
Energies 15 02080 g004
Figure 5. Wall jet schematic representation and nomenclature.
Energies 15 02080 g005
Figure 6. Grid convergence study of κ ω SST.
Energies 15 02080 g006
Figure 7. Nusselt number along the wall: (a) results of high-Re κ ε turbulence models with wall functions; and (b) results of low-Re models.
Energies 15 02080 g007
Figure 8. Comparison between the 1D window model results and reference results reported by Talukdar and Mishra [39]: (a) influence of conduction-radiation parameter; and (b) influence of emissivity.
Energies 15 02080 g008
Figure 9. Temperature profiles for glass materials with different radiative properties.
Energies 15 02080 g009
Figure 10. Window average temperature for different window thickness values.
Energies 15 02080 g010
Figure 11. Contour plot of window temperature dependent of cooling gas injection velocity and temperature.
Energies 15 02080 g011
Figure 12. Local heat transfer coefficient at the window top surface (window-RBS interface) for different cooling schemes: (a) Scheme A; (b) Scheme B; and (c) Scheme C.
Energies 15 02080 g012
Figure 13. Local window temperature for different cooling schemes: (a) Scheme A; (b) Scheme B; and (c) Scheme C.
Energies 15 02080 g013
Figure 14. Iso-contours on window surface for: (a) incident radiation; and (b) temperature.
Energies 15 02080 g014
Figure 15. Iso-contours for: (a) velocity streamlines with cooling Scheme C; and (b) window temperature distribution for cooling Scheme C.
Energies 15 02080 g015
Figure 16. Iso-contours of window surface temperature for: (a) one-sided cooling Scheme A; and (b) alternated cooling Scheme C.
Energies 15 02080 g016
Figure 17. Energy budget of the coil coating oven.
Energies 15 02080 g017
Table 1. Coefficients for heat transfer correlation.
RBSCOS
ABCABC
C 1 0.00480.00580.00370.00770.00880.0087
C 2 0.8380.7950.8670.8190.8000.784
Table 2. Input parameters for reference case.
Design and Operating Conditions—Input Parameters
ModelingNumber of points100COSConvection coefficient, h COS [ W / m 2 · K ]10
DO modelS4Surrounding temperature, T COS [K]700
BurnerRadiative efficiency, Y rad [-]0.3WindowNumber of wavelength bands3
Emissivity, e b [-]0.9Wavelength range, λ [ μ m ]0–55–6.36.3–25
Gas temperature, T gas [K]1340Spectral absorption coefficient, k [ m 1 ]7.2228.9973.7
Gas velocity, v gas [ m / s ]1.975Spectral index of refraction, n λ [-]1.691.581.31
CoilSurface temperature, T coil [K]407.15Thickness, L [mm]2
Emissivity, ϵ coil [-]0.31Thermal conductivity, k t [ W / m · K ]8
Table 3. Average window temperature for the reference glass obtained with different number of spectral bands for the radiative properties.
Number of Bands123
Wavelength range, λ   [ μ m ] 0–250–5.75.7–250–55–6.36.3–25
Absorption coeff., k λ   [ m 1 ] 458.6617.68907.957.15228.91973.71
Index of refraction, n λ [-]1.511.681.341.691.581.31
Avg window temp., T ¯ w [°C]931.0982.8889.2
Table 4. Influence of burners radiative efficiency on burner surface temperature and average window temperature.
Radiative Efficiency, Y rad [-]0.30.40.5
Burner surface temperature, T bur [°C]136414771572
Avg window temperature, T w ¯ [°C]889.2967.71035.1
Table 5. Window cooling optimisation results.
RequirementOptimised VariablesObjective Function
T crit [°C] Δ T w T RBS [°C] v RBS [m/s] T COS [°C] v COS [m/s]SchemePower [kW]
800623275.042710.2A28.9
7501333275.042721.7C30.7
7001403275.038425.0C32.0
6501523275.031925.0C33.3
6001593275.026525.0C34.5
550143805.525025.0C65.0
5001298011.625025.0C110.9
4501158018.625025.0C153.0
400Not feasible
Publisher’s Note: MDPI stays neutral with regard to jurisdictional claims in published maps and institutional affiliations.