1. Introduction
Finding a point of maximum energy efficiency of all production assets of a company is the main task of energy saving. Development of drilling operations is connected with exploration of remote and hardly accessible depths, where oil and gas deposits of different types are accumulated. Energy consumption is a serious factor, influencing operating costs of drilling, as it comprises 60% of these costs. Therefore, decreasing energy consumption is a relevant direction of theoretical research and constructional-technical developments of drilling techniques [
1,
2,
3].
Directional drilling, including wells with horizontal intervals, is one of the directions to increase oil recovery of a layer due to a larger drainage area. The problem of energy-saving arises when rotary steerable systems are used, when the drill string rotates along the whole length, leading to considerable growth in the energy consumption rate.
Standardization of the rate of electricity consumption during survey and technological operations of well-drilling includes development and implementation of progressive limits with the purpose of establishing the economy policy principle.
The main task of standardization is to provide the possibility to apply technically substantiated progressive electricity consumption rates during planning and production, which would allow fulfillment of energy saving policy, rational distribution, and the most efficient use of energy. Energy consumption rates are set taking into account the results, reached in energy efficiency, and fulfillment of plans of organizational and technical measures, aimed at economy of fuel and energy resources. These limits also reflect planned development and implementation of new equipment in future, up-to-date technologies, and relevant methods of operations in accordance with international standard of energy efficiency ISO 50001:2011 and Russian Federation standard GOST R ISO 50001-2012.
One should consider the electrical energy consumption rate as a planned indicator of consumption of resources in the production of a unit of work of a specified quality [
4,
5,
6]. For a comprehensive assessment of efficiency of utilization of energy resources during production of similar or substitute operations, one should determine specific energy consumption (designed, planned, actual), which includes direct consumption of all energy types in the production of a unit of work for basic and auxiliary production and operational needs, including from the consumption volume of mentioned resources and energy supply [
7].
Electricity consumption rates are used for the planning of consumption of the resources and assessment of its efficiency. Keeping consumption of electricity within the established rates is an essential condition in case of financial incentives for saving of energy resources.
Companies achieve significant energy savings in the exploration and production segment through technical, technological, and organizational measures. For oil producing enterprises, the issues of optimizing energy costs are among the priorities, since the economic profitability of the enterprise greatly depends on how efficiently energy resources are used. In today’s situation, energy efficiency is increased through the use of technologies with minimum investment costs. To achieve a significant effect, it is required to widely introduce technologies that have both high technological and economic efficiency.
2. Classification of Consumption Rate
Electricity consumption rates are classified according to the main features:
by size scale: individual, expedition, group;
by period of action: annual, quarterly (for current plans);
by years of the five-year plan (for medium-term plans); and
by the final years of the five-year plans (for long-term plans).
Individual consumption rate should be considered as a rate of energy consumption required for operations in terms of a single specific organization with a given technological process, type of equipment, etc.
The group rate of consumption of electrical energy is the rate of consumption of these resources, covering all the various operating conditions at a given level of planning: for various technological processes, types of equipment, etc. The group (weighted average) rate is called the industry consumption rate.
Technological rates include only electrical energy, which is consumed directly by technological processes and standardized losses of fuel and energy due to the nature of the technological process and equipment used (except for external losses).
Technological consumption rate also includes energy losses connected with idle motion of equipment between operations, heating and launching of machines after servicing, and low-temperature downtimes. These losses are strictly limited by normal technological processes. Technological consumption rates do not include irrational losses, caused by violations of accepted technology, operation modes, etc.
Expedition rates of electrical energy consumption include all energy consumption for all drilling and auxiliary operations associated with the drilling expedition.
3. Composition and Size of Consumption Rates
Composition of electrical energy consumption rates should be considered as a list of electricity input items, which are taken into account in the limits for work, on the basis of which a specific composition of the consumption rates is determined in each drilling enterprise. The approximate composition of the consumption rates of electrical energy is given in
Table 1.
For determination of group rates of consumption of electrical energy, the calculation-analytical and calculation method are used. They imply determination of consumption rates of electrical energy in the following ways:
by calculation method according to electrical energy input items and progressive indicators of utilization of these resources in production;
by means of individual and expedition consumption rates and corresponding production volumes as average-weighted values.
Individual consumption rates are determined on the basis of theoretical calculations of experimentally established characteristics of energy-consuming machines, units, and equipment, taking into account specific consumption of electrical energy and implemented measures of energy-saving.
The main initial data for calculation of consumption rates of electrical energy include:
primary technical and technological documentation, technological regulations and instructions, experimentally proved power balances and standard characteristics of electrical and technological equipment, equipment passport data, standard indicators characterizing the most rational and efficient production conditions (power capacity factor, rates of consumption of energy resources in production, unit time rates and costs of research works, rates of energy losses during its transmission and transformation in other indices);
data about production volumes and structure;
data about planned and actual specific rates of consumption of electrical energy for recent years and reports on inspection of energy use in the production process;
planning of organizational and technical measures for energy saving.
4. Determination of Technological, Expedition, and Group Rates of Consumption of Electrical Energy on Well-Drilling during Research Work and Technological Operations
Calculation of rates of consumption of electrical energy on well-drilling during testing and technological operations consists of calculation of technological and expedition rates of consumption.
The technological rate of energy consumption
, kWh/m of penetration, is equal to a sum of technological rates of consumption of energy on separate types of operations:
where
—denote technological rates of consumption of energy on separate types of operations (
Table 1).
The technological rate of consumption of electrical energy
kWh/m of penetration, for a single unit, is found by taking into account the losses according to the following the equation:
where
WC denotes consumption of electrical energy for technological needs in the given time period;
ΔWL denotes electrical energy losses, kWh;
P denotes planned penetration of drilling for the given time period, in meters.
According to
Table 1, the expedition rate of electrical energy consumption
kWh/m of penetration, is found according the next the equation:
The average weighted group rate of electrical energy consumption
, kWh/m of penetration, for all levels of planning, is determined according to the equation:
where
n denotes the number of production units subordinate to this level of planning;
denotes the rate of consumption of electricity subordinate to this level of planning, kWh;
Pi denotes the planned volume of drilling operations subordinate to this level of planning, meters of penetration.
5. Determination of Electricity Input Items during Drilling
Consumption of electrical energy by electrical receivers, which take part in technological processes or auxiliary operations W
T(VP) kWh, is found using the following the equation:
where
denotes the consumption of electrical energy by each electrical receiver during the calculation period, kWh.
Consumption of electrical energy by one electrical receiver W
Ti, kWh, is found using the following equation:
where
PC denotes the installed capacity of motors (according to passport data), kWh;
k1 denotes the utilization ratio of electrical receivers (according to passport data);
τp denotes the operation time of electrical receivers, which is found experimentally, h.
The rate of consumption of electrical energy per meter of penetration, , kWh/m of penetration, is calculated in the following ways.
For a turbine downhole motor:
For an electrical downhole motor:
where
W1 denotes consumption of electrical energy on drilling;
W2 denotes consumption of electrical energy on the rotation of the string of drill pipes;
W3 denotes consumption of electrical energy for pumping of drilling fluid;
W4 denotes consumption of electrical energy on POOH operations;
W5 denotes consumption of electrical energy on RIH operations;
Ka denotes the coefficient taking into account consumption of energy, which goes on casing string lowering, flushing operations, and other auxiliary works (Ka > 1).
Separate components of specific rates of consumption of electrical energy are found using the following the equation.
The first component:
for rotary drilling
where V denotes the rate of penetration in the given interval, m/h;
for electrical drilling
where
ND denotes the power of the motor of the electrical drill, kW;
KD denotes the average coefficient of loading of the electrical drill motor (accepted as 0.8–0.85);
τD denotes the time of operation of the electrical drill on the bottom (time, consumed directly by drilling), h;
denotes the energy conversion efficiency of the system, which takes into account the losses in spindle , motor , cable , and transformer ; for easier calculation it is accepted as 0.5–0.55;
H denotes the well depth, m.
The second component:
where
m denotes the number of rotations of the rotary table, min;
(H2−H1) denotes the drilling depth interval, m.
The third component:
for rotary and electrical drilling
where
A denotes the drilling fluid rate, meters per second;
P0 denotes the total constant losses in pumping equipment;
For turbine drilling
where K
T denotes a coefficient, depending on turbine drill construction and its size [
7].
The fourth component:
where
G denotes the weight of the drillpipe stand in clay mud, tons;
nc denotes the average number of joints of the drillpipe stands in the string;
np denotes the average number of tripping operations.
The fifth component:
where n
r’ denotes the average number of pulling out of hole operations.
On the basis of Equations (1)–(16), the rates of consumption of electrical energy can be calculated for separate wells, using planned rates of penetration, corresponding drilling parameters, and planned indicators of running in hole and pulling out of hole operations in each depth interval.
In field conditions, it is recommended to calculate consumption of electrical energy per meter of penetration in different soil, taking into account the standard time for each unit during engineering and geophysical surveys.
where
Np denotes the rig engine power, kW;
KE, HS denotes the standard time for drilling 1 m of a well in a given soil.
For example, electrical energy is consumed by drilling rig model BU-75 BrE (drilling rig with nominal capacity of 75 tons used for drilling producing wells and deep exploration wells). For the power supply of the drilling process and camp facilities, the existing electricity network of the developed oilfield is used.
The calculation is carried out without network maintenance and a reactive component.
Calculation of the amount of electrical energy, consumed by drilling of the first well/next well in a pad (Visean development target) under condition:
Equivalent depth Heqv = 1400/2 = 700 m, commercial speed V = 1559.2/1868.7 m per machine-month.
Power N = 127/109 kWh per meter of penetration, the application capacity of the BU-75 BrE machine per day is 973 kW.
Preparation works: the first well 1340 × 2 = 2680 kWh, the application capacity W = 973 × 2 = 1946 kW.
Following well 1340 × 0.9 = 1206 kW, the application capacity W = 973 × 0.9 = 876 kW.
Drilling and casing:
The first well in a pad 127 × 1400 = 177,800 kWh, the application capacity W = 973 × (2 + 26.7 + 2.9) = 30,746.8 kW.
The next well in the pad 114 × 1400 = 159,600 kWh, the application capacity W = 973 × (0.9 + 22.5 + 2.6) = 25,298 kW.
(Vereiskian–Bashkirian development target) under condition:
Equivalent depth Heqv = 1160/2 = 580 m, commercial speed V = 2044.2/1394.6 m per machine-month.
Power N = 93/115 kWh per meter of penetration, the application capacity of the BU-75 BrE machine per day is 973 kW.
Preparation works: the first well 1340 × 2 = 2680 kWh, the application capacity W = 973 × 2 = 1946 kW.
The next well in the pad 1160 × 0.9 = 1044 kWh, the application capacity W = 973 × 0.9 = 876 kW.
Drilling and casing: The first well in a pad 93 × 1160 = 107,880 kWh, the application capacity W = 973 × (23.3 + 2.6) = 25,200 kW.
The next well in the pad 115 × 1160 = 133,400 kWh, the application capacity W = 973 × 21.6 = 21,016.8 kW.
What is more, companies should pay for the application capacity of equipment, reactive component of consumed energy, and network maintenance.
For assessment of the technical efficiency parameter, we propose to use specific integral mechanical criterion of efficiency–q
1. The criterion q
1 is the optimal parameter of technical efficiency of the well-drilling process. It takes into account the output of drilling equipment jointly with energy consumption. The specific criterion of technical efficiency is calculated according to the equation below:
where
W denotes the energy consumed by drilling of well interval 1,
t denotes the time of drilling of interval 1,
Ib denotes the base drilling interval, which is equal to 1 m.
Figure 1 demonstrates the dependence of criterion q
1 on well depth. It follows from the graph that with increasing depth, the drilling process is “rebuilt” in such a way that it becomes more perfect. However, on the depth of about 145 m it reaches its best. Before reaching this depth, the drilling process is inefficient and needs optimization.
Figure 1 shows the correlation between rate of penetration and criterion q
1. The graph demonstrates that the higher rate of penetration corresponds to the lower values of criterion q
1.
The results of calculations according to Equations (1)–(16) have shown that in the case of drilling a Visean development target by rig BU 75 BrE at a low rate of penetration Vm, the weight on bit P increases in a directly proportional manner and it is lower than the formation strength. With a rapid increase in the rate of penetration, weight on bit grows more slowly and at a depth of 145 m it will become equal to the hardness of the drilled formation, which corresponds to the maximal rate of penetration and depth. It is also indicative of the maximal penetration for these drilling conditions. Continued enhancement of weight on bit and rate of penetration after reaching 145 m leads to a rapid increase in power and energy consumption. Analysis of graphs (
Figure 1) shows that the drilling process becomes more efficient with high rates of penetration. However, an increase in the rate of penetration is reached directly by huge energy consumption. Therefore, by controlling the parameters by using telemetry or finding them according to the Equations (1)–(16), we can determine optimal drilling components at each depth: maximum rate of penetration with constant weight on bit or maximum penetration with minimal energy consumption.
There is no unified policy and planned measures in the field of energy efficiency during well construction. The measures that we propose will allow a decrease in energy costs during drilling by up to 30% and reduce losses in power grids by up to 15%.
5.1. Changes in Drilling Tool Design
Energy consumption can be decreased by application of drilling bits with gauge inserts, located along the helix. They demonstrate increased wear resistance during drilling of rocks of high and medium hardness and allow multiple repairs of the cutting part (
Figure 2). As cutting elements of the bit save their workability for a longer time (up to 30%), the less time is required for a bit replacement and pipe makeup-breakout operations. As a result, energy consumption decreases by 10–15% [
8].
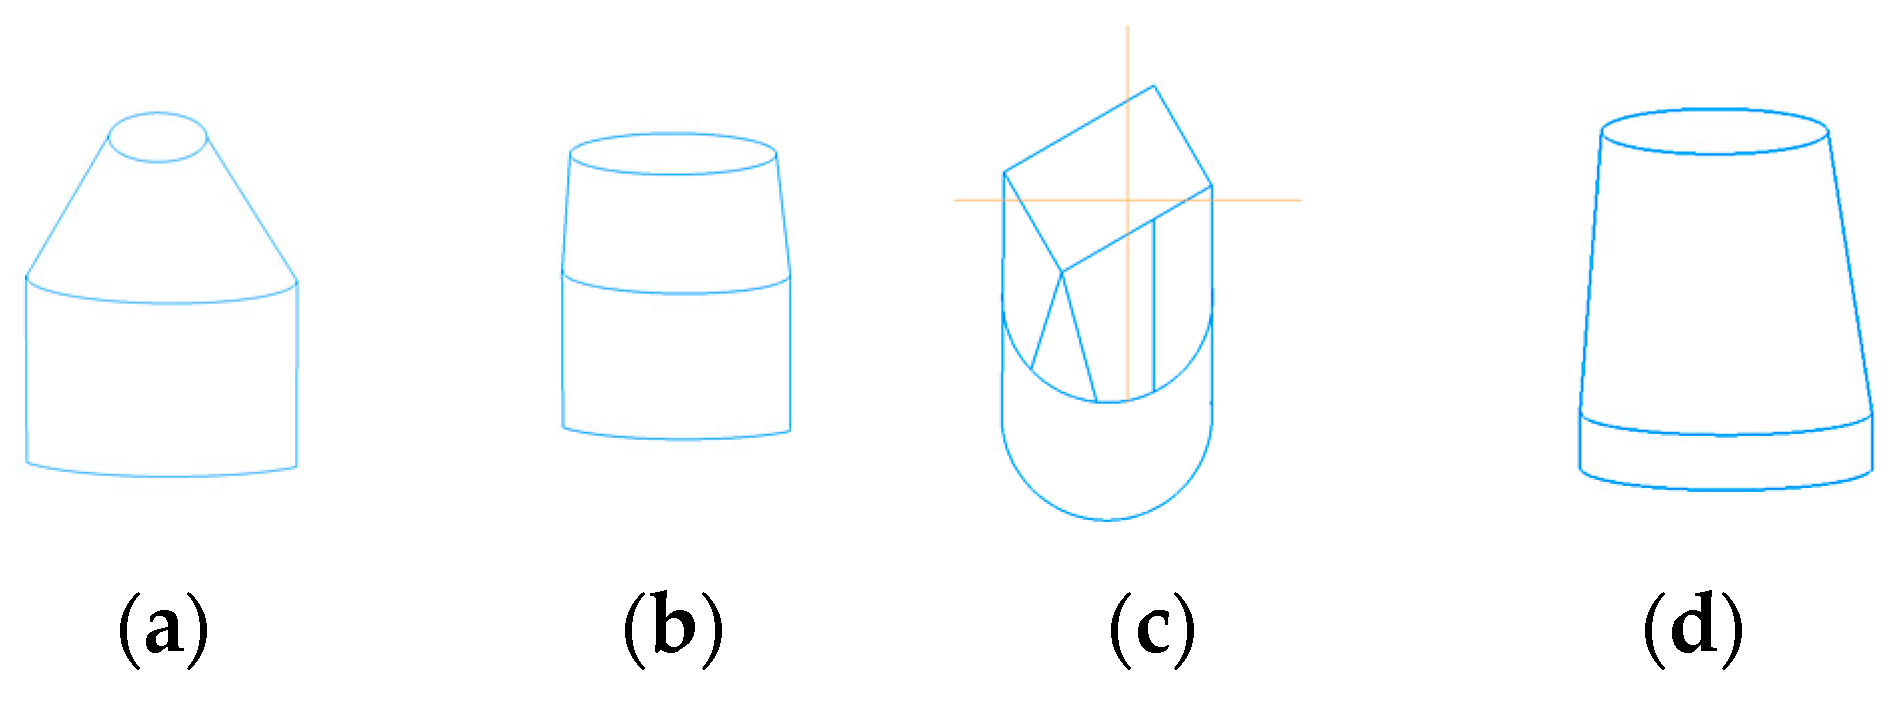
If we put in a row the next combination of drill bit inserts (
Figure 3) [
9]:
The chisel gauge insert performs well in soft homogenous drilling conditions;
A radial bow chisel is a good choice in soft-to-medium-soft formations (
Figure 3a);
The crest geometry of the QX (
Figure 3b) gauge inserts present a large cross-sectional area to the rock, creating large bottom-hole craters at the bit gauge maximizing life and penetration rates;
The SWIC shape coupled with TCI grades (
Figure 3c) increase gauge contact in medium-hard abrasive drilling conditions;
Ollon, double conical, and relief gauge SWIC are shapes for medium-hard to hard formations to hard formations (
Figure 3d);
Conical inserts offer both strength and wear resistance in hard, abrasive rock;
These inserts would cut the rocks more efficiently, reducing breakdowns owing to high wear resistance and strength. This would increase drill-bit service life as well as the rate of penetration. What is more, electrical energy consumption would be reduced by 3–8%.
In 2012, USA company ForoEnergy introduced laser technology in the oil, gas, geothermal, and mining industries. They proposed the use of lasers together with drilling tools. Laser drilling technology consists of rapid heating of hard rocks by strong laser beams, which causes spalling and softening of the rocks. Laser drilling allows penetration under a given angle, which allows penetration in areas that are tough to reach. Drilling speed increases by 300–400%. Under the action of a laser, the heated surface of hard rocks spalls and softens, so the mechanical bit penetrates more easily and wears much more slowly. Moreover, ForoEnergy claim that they successfully overcame the stimulated Brillouin scattering effect named after L. Brillouin. Stimulated Brillouin scattering (SBS) is a ″physics effect″ that chokes off the transmission of high-power laser photons in a fiber optic cable by reflecting the energy backwards to catastrophically destroy both the fiber optic cable and laser source. It was planned to test the technology in field conditions in 2014 [
10]. The results of pilot testing are not available due to the current crisis in the oil industry. The proposed technology will allow companies to increase the speed of penetration through hard rocks by up to 7 times. The ultra-low WOB and torque will extend bit life, reduce drilling operating costs, improve accuracy, and speed-up well completion, leading to reducing energy costs.
5.2. Modernization of Drilling Equipment
Cubility has invented a vacuum solids control system for drilling fluids, named MudCube (Cubility, Sandnes, Norway). The use of MudCube has allowed improvement of drilling mud quality along with reducing mud losses by 90%, decreasing drill cuttings by up to 50%. Among other benefits of this solids control system are a 30% decrease in labor input, reduced vibrations and noise level, enhanced service life of surface and downhole equipment, and increased level of industrial safety. The MudCube solution is implemented and used at Equinor ASA (Statoil, Norway), Maersk Drilling (Norway), and Talisman Energy Norway (Norway) [
11]. Modernization of technological equipment was the priority criterion for choosing a new technology to improve energy efficiency and resource conservation.
To decrease the costs of production drilling, Gazpromneft-Noyabrskneftegaz, one of subsidiaries of Gazpromneft, has purchased quick-mounting mobile modular transformer electrical substations of 35/6 kW. These substations provide fast energy supply from the field network instead of independent sources of power supply, working on diesel fuel. In case of rejecting independent sources of energy, the economy of costs on exploitation drilling by one drilling rig reaches 7 million rubles per month. Moreover, Gazpromneft-Noyabrskneftegaz implements automatic voltage regulator (AVR) units that allow increasing of voltage on long HV-lines of 6 kW (up to 14 km), thus providing the ability to supply drilling rigs with energy from the external electricity network. AVR usage helps to avoid power supply from independent energy sources, working on diesel fuel. In case of rejecting the independent sources of energy, the economy of costs on exploitation drilling by one drilling rig reaches 7 million rubles each month. In 2017, building of the new HV-110 kW station was finished; 110 kW substation Khoroshunovskaya and 110 kW-substation Yaraynerskaya were successfully connected with a network of OAO FGC UES. As a result of measures taken, the company saving on electricity consumption is 27 million rubles per month [
12].
Use of a variable-frequency electrical drive of alternating current keeps the power ratio at the drilling rig inlet in the range 0.95–0.98. To decrease voltage waveform distortion of the network, harmonic generators are equipped with a 12-pulse rectification circuit [
13,
14,
15,
16]. There are several solutions for reaching increased quality of electrical energy for supply of rigs with variable-frequency electrical drives, providing the standard values of the deviation of the power supply voltage and the total harmonic component of the voltage: use of harmonic filters or use frequency converters with active voltage rectifiers. If electrical drives work in steady-state modes and are supplied with energy from 6 kW power lines, the use of frequency converters with active voltage rectifiers with voltage negative feedback ensures standard parameters of voltage deviation (10%) and voltage distortion level in the supply line (5%). The use of active voltage rectifiers provides normal work of the drilling rig if the length of the power line does not exceed 9–10 km. This technical solution allows the reduction of losses in electricity networks by 10–15% and provides stability of drilling rig operation.
RN-Purneftegaz and SevKomNeftegaz have implemented an autonomous power complex for uninterruptible power supply of drilling rigs and technological objects of the North Komsomolskoye field in the Yamalo-Nenets Autonomous Okrug. The new object will allow companies to decrease the cost of electrical energy by 5–6 times due to the use of natural gas instead of diesel fuel. The power complex consists of six generating units of the container type, which are 6600 kW each, and it is made on the basis of gas-driven engine generators. Their main advantages are environmental friendliness and low costs of power generation. Unlike analogues of the diesel-generator type, the use of gas-driven engine generators can significantly reduce the impact on the environment and increase energy efficiency. The gas, extracted on the oilfield, serves as a fuel for these generators. What is more, the autonomous power complex is able to provide an abruptly variable electrical load of drilling rigs, connected with changes in drilling mode and geological rock composition.
5.3. Drill Pipe Design
The choice of drill pipes for use in oil and gas wells, operating in complex climate and geological conditions, including the continental shelf, deep-water areas, and Far North, horizontal and directional wells, is based on the selection of pipe joints. Number one priorities for all drill pipes include high strength and tightness of pipe joints along with increased resistance to high twisting, bending, and tensile loads. Such properties are demonstrated by GreenWell pipe joints of premium class with lubricant-free coating, pipe joints with vacuum seal, and plain end pipes ТМK UP CENTUM of superchromium steel 13Cr with gas impermeable thread joints of premium class. These drill pipes comply with API, DIN, EN, and ASTM international standards and energy management system ISO 50001:2011, as well as Russian standards and technical specifications.
Use of GreenWell pipe joints of premium class with lubricant-free coating, pipe joints with a vacuum seal, and plain end pipes ТМK UP CENTUM of superchromium steel 13Cr with gas impermeable thread joints of premium class allowed us to reduce energy costs by 30–40% during running in hole/pulling out of hole operations and pipe makeup/breakout. Economy per well with a depth of 2600 m reached 7.49 million rubles; time saved on drilling reached 5.73 h per well.
Well-drilling in complicated conditions has the highest share of overhead losses of technical and material resources and time [
17,
18,
19].
In such conditions, one of the most important tasks is reducing overhead costs by improvement of existing solutions and development of new, more modern, and effective technological solutions and technical means, which will make it possible to achieve high technical and economic results of well-drilling at a minimal cost [
20,
21,
22,
23,
24,
25,
26,
27,
28,
29,
30,
31,
32,
33,
34].
6. Research Results
Drilling operations in a well can be assessed using the diagram we developed. It can also be used to control the drilling team and how it follows the parameters of the drilling mode in technological and expedition rates of energy consumption (
Table 1, Equations (1)–(16)).The diagram (
Figure 4) is presented as a circle with circles inside. Each operation is confirmed by the data of manometers, pressure sensors, drilling fluid flow meters, and tachometers included in the system of ground control of the drilling process. The outer circle is divided into 24 parts, which correspond to hours of a day, and they are divided into 4 parts that correspond to 15 min. Other circles can be placed inside of each circle according to the data from sensors. If the line on the diagram runs parallel to one of the circles, it means that the drilling process is going under constant weight on bit, and energy consumption is stable. If the line runs parallel to the radial line, it is indicative of a sudden energy surge, which can happen during running the drill string into the hole using a rotary table or drill string straining in the case of sticking, etc. The diagram of the process of pulling the drill string out of the hole is opposite to a pattern of running in the hole. If the axial load stays constant during drilling, there are no energy surges, and technological rates of electrical energy consumption remain the same. If there are fluctuations in axial load on the bottom-hole, sensors show waves or jerks, which cause increased consumption of electrical energy. The inner circle demonstrates selection criteria: creation, knowledge/understanding, implementation, analysis, and assessment, which help to control drilling mode parameters automatically with telemetry. Applications, which can be used at analysis level, should contribute to the development of skills to distinguish essential aspects from non-essential aspects, highlight parts, and determine the relationship and structure of the content of technological drilling operations. Implementation allows quick adaptation to unknown situations and fast decision-making in case of emergencies on the drill site. Assessment helps to evaluate reliability, accuracy, quality, and performance efficiency, and take substantiated decisions. Applications that are used at creation-level should give an opportunity to generate ideas and develop technological processes of well construction in any reservoir conditions.
It is more efficient to use the diagram as a support and check against it at different stages from planning to implementation. At the planning stage the situation can be simulated without functional changes or, on the contrary, with considerable changes in drilling parameters, which require variation and selection of optimal technological and expedition rates of electrical energy consumption. Drilling parameters and technology are selected in the next step.
On the basis of the diagram, we recommend the following organizational and technical measures for saving of energy resources and reducing their consumption:
Improvement of production technology;
Better use and changing the production structure;
Increasing the power and fuel efficiency ratios in production;
Reduction of energy, consumed by electrical receivers by varying the engine power, the utilization factor of the electrical receivers, and their operation time;
Reduction of the amount of electrical energy consumed per meter of penetration is due to decreased energy rates on drill string rotation, mud pumping and tripping operations; optimal combination of power of motors, their load, time spent on bottom-hole operations and energy conversion efficiency of the spindle-cable-transformer system. Planning main drilling parameters and rate of penetration also contributes to energy saving.
Reduction of the amount of electrical energy consumed per meter of well-drilling in different soils depends on power and other technical characteristics of the drilling rig, the time required to drill one meter of well in different rock categories, and reducing the fuel consumption of drilling rigs per unit of power or per rig per day;
Reduction of energy consumption on auxiliary needs, for example, energy supply of weightlifting devices, drives of machine-tool equipment, special and technological equipment, welding operations, compressor units, cooling pumps, and pumping stations;
Reduction of energy losses in electrical receivers, directly involved in technological processes, for example drilling rig transformers, air and cable lines of drilling rigs, and ventilation units.
Energy supply of the drill site has specific features, which consist of non-uniform consumption of energy during the day and seasons of year. Electricity consumption has peaks and valleys. An isolated drilling power plant must have additional capacity in order to provide maximum load during peak hours, and to store excess of electricity during off-peak hours.
The drilling process consists of the operations shown in
Figure 4. During drilling, the pipe string hangs on a hook and lowers as it deepens. Once the bit fires, the entire pipe string is brought to the surface to be replaced. The mass of the entire structure in weight reaches many hundreds of kilonewtons. When drilling in a rotary way, it is necessary that a rotary motion and a load be transmitted to the destructive tool, providing sufficient pressure on the destructive material.
Figure 5 shows the dependence of the load that occurs during drilling. Rotor beds for typical operations are shown in
Figure 4.
The operation of the main drive of the actuators is shown in
Figure 6. In the process of drilling, the main part of the power is consumed by the drilling pump and the rotor, in the process of tripping operations by the winch and compressor. The operation of pumps during drilling is characterized by a constant load. During tripping operations, the drive has a sharply variable load from zero (engine idle) to maximum, changing in 5–7 min (
Figure 5).
Therefore, when lifting the tool from the well, it is necessary to ensure a smooth start of the winch and a gradual increase in speed. To ensure the flexibility of these characteristics, we recommend using ″artificial adjustment″ devices in the drilling rig drive, i.e., install intermediate gears between the engine and the actuator. These are mechanical (gear or chain multi-stage gearboxes), hydraulic (transformers), and electrical (DC machines).
Thus, at the beginning of drilling, less power is spent on pumping the flushing fluid, rotating the rotor and lifting the tool than when reaching greater depths. Regulation of the power and the amount of energy consumed will optimize the technological rate of consumption of electrical energy and expedition rate of consumption of electrical energy. A decrease in the technological rate of consumption of electrical energy and expedition rate of consumption of electrical energy is possible by reducing the rotation speed and increasing the load, reducing the short-term load, with rapid acceleration at different lifting speeds and reducing the lifting time of the tool.
7. Conclusions
This article has provided the results of the first attempt to substantiate the rates of energy consumption and energy savings during the well-drilling process. It was proposed to accept the electrical energy consumption rate as a planned indicator of consumption of resources in the production of a unit of work of a specified quality. For a comprehensive assessment of efficiency of use of energy resources during production of similar or substitute work, we determined specific energy consumption (designed, planned, actual), which includes direct consumption of all energy types in the production of a unit of work for basic and auxiliary production and operational needs, including from the consumption volume of mentioned resources and energy supply. Classification of the consumption rate of electrical energy according to its action period and size scale has been proposed. The composition and amount of energy consumption rates during well-drilling have been described. The technological, expedition, and group rates of electricity consumption for drilling wells during design, survey, and technological work have been determined. Electricity input items in drilling operations have been determined.
For the first time, a set of measures to reduce energy costs during drilling is shown:
- -
application of drilling bits with gauge inserts, located along the helix, which save increased wear resistance during drilling of rocks of high- and medium-hardness and allow multiple repairs of cutting parts,
- -
combination of design of drill bit inserts;
- -
laser technology of drilling for hard rocks;
- -
drilling mud solids control system;
- -
exploitation drilling with quick-mounting mobile modular transformer electrical substations of 35/10 (6) kW, instead of expensive independent sources of electricity, working on diesel fuel;
- -
several solutions for reaching increased quality of electrical energy for supply of rigs with variable-frequency electrical drives.
The developed diagram for assessment of well performance allows prediction of technological and expedition rates of electricity consumption. Its creation, knowledge/understanding, implementation, analysis, and assessment by means of telemetry will allow evaluation of energy consumption when simulating drilling operations with varying drilling parameters. It will also give an opportunity to select optimal technological or expeditionary rates of electricity consumption, taking account of drilling components at each depth: maximum drilling rate under constant weight on bit or maximum penetration. Based on the diagram, organizational and technical measures have been proposed to save energy resources and reduce their consumption.


 ,
, 


