Abstract
Proton Exchange Membrane (PEM) water electrolysis (WE) produces H2 with a high degree of purity, requiring only water and energy. If the energy is provided from renewable energy sources, it releases “Green H2”, a CO2-free H2. PEMWE uses expensive and rare noble metal catalysts, which hinder their use at a large industrial scale. In this work, the electrocatalytic properties of Transition Metal Phosphides (TMP) catalysts supported on Carbon Black (CB) for Hydrogen Evolution Reaction (HER) were investigated as an alternative to Platinum Group Metals. The physico-chemical properties and catalytic performance of the synthesized catalysts were characterized. In the ex situ experiments, the 25% FeP/CB, 50% FeP/CB and 50% CoP/CB with overpotentials of −156.0, −165.9 and −158.5 mV for a current density of 100 mA cm−2 showed the best catalytic properties, thereby progressing to the PEMWE tests. In those tests, the 50% FeP/CB required an overpotential of 252 mV for a current density of 10 mA cm−2, quite close to the 220 mV of the Pt catalyst. This work provides a proper approach to the synthesis and characterization of TMP supported on carbon materials for the HER, paving the way for further research in order to replace the currently used PGM in PEMWE.
1. Introduction
The increase in world population and its living standards has caused an uprise in global energy needs [1]. At this moment, energy is mainly generated by the combustion of fossil fuels [2], releasing greenhouse gases prejudicial to the world’s environment. This reliance on fossil fuels has caused serious concerns over their exhaustion in a relatively short time [3]. Thus, renewable and sustainable solutions must be found.
The nature and unpredictability of renewable energy sources (RES) raise questions over their applicability and reliability at a larger scale. Thus, it is imperative to couple RES with proper energy storage systems. These storage systems have to maintain the energy stored over the necessary time, and be able to supply it promptly [4].
Energy storage in the form of chemical bonds is a trustworthy and promising approach to addressing the dual issues of long-term energy storage and transportation systems [5]. Hydrogen has been labeled as a clean and reliable energy vector capable of replacing fossil fuels [6]. Its properties, such as an energy density of 120 mJ kg−1, which is roughly three times greater than gasoline or diesel, the fact that it can be obtained from a vast range of primary sources, and its greenhouse gases-free final use, makes it the ideal energy vector of the future [7].
However, H2 cannot be found in its pure state in nature, and 96% of H2 is currently produced via hydrocarbon reforming, coal gasification and pyrolysis [4]. These H2 production techniques release 2.5–5 tons of CO2 per ton of H2 produced, thus contributing to climate change [8]. In the water electrolysis process, direct current is applied to splitting the water molecules into H2 and O2. If this current is produced via RES, so-called “Green Hydrogen” is obtained, as it needs to have a carbon footprint below 36.4 g CO2 M J−1 [9]. It is a well-known process capable of delivering high purity hydrogen that can reach 99,999 vol.% after being dried, and oxygen impurities have been extracted [10].
There are four different types of water electrolysis, namely, alkaline water electrolysis (AWE), solid oxide electrolysis cells (SOEC), anion exchange membrane (AEM) in alkaline media, and proton exchange membrane (PEM) in acidic conditions. The focus of this work is the PEMWE system as it possesses several advantages over the other mechanisms, such as its compact design, production of ultrapure hydrogen, lower energy consumption, and the capacity to operate at higher current densities (2 A cm−2), while being more reliable and safe [11]. These properties make it attractive for industrial implementation. Currently, rare and expensive noble metals like Pt and Ir are used as catalysts to further WE reactions. Thus, in order to make this technology commercially appealing, it is necessary to replace the noble metals with cheap and earth-abundant materials, while maintaining efficiency and improving long-term stability [12].
Metallic platinum is commonly used at the cathode to promote the HER and metallic iridium or iridium oxide in the anode to forward the Oxygen Evolution Reaction (OER). Pt provides optimal electrochemical activity towards the HER in a highly acidic environment; however, its low terrestrial abundance, mining costs and environmental impact inhibit it from having any long-term application within commercial electrolyzers [5]. Furthermore, OER limits electrolytic water splitting due to the slow kinetics of the four-electron coupled mechanism, and hence, the need for an efficient catalyst. Ir and Ru oxides are the typical catalysts used for the OER, but increasing costs due to higher demand prevent their use for future industrial implementation [13].
Currently, due to the limiting factors regarding Pt and Ir, several transition metals have been studied as electrocatalysts for the HER and the OER. In the search for more sustainable catalysts, the premise of high catalytic activity must be accompanied by significant durability and stability under the harsh operating conditions of a PEMWE [14].
Regarding alternative electrocatalysts for the HER, the focus of this study, transition metal phosphides (TMP) are solid-state compounds formed from the combination of metallic or semi-metallic elements with phosphorus [5]. They are considered one of the most promising electrocatalyst alternatives as their distinct physicochemical properties overcome the inherent challenges of other non-noble metal materials [15,16]. The relatively strong M-P bonds provide high thermal stability, hardness and resistance to oxidation and chemical attack. TMP have several stoichiometry structures, where the variations in metal/phosphorus stoichiometric ratios provide a substantial change in their structure, which is reflected in their properties, such as the electronic modulation of the active sites or the participation of several metal sites to achieve water oxidation/reduction [16]. Several studies have led to multiple findings regarding the catalytic nature of transition metals and the electrokinetic contribution of phosphide ions [13].
TMP are usually prepared by solid-state synthesis using a direct redox reaction between the transition metal (TM) and the phosphide (P) at high temperature under an inert atmosphere. The transfer of electrons from the electropositive TM to the electronegative P is the driving force of the reaction. This method produces materials with low surface area, which hurts their catalytic performance. Therefore, an array of synthesis processes has been developed to produce nanostructured TMP with increased surface area. The common synthesis procedure follows the scheme of: reagents > nanostructured precursor > phosphorization > TMP electrocatalyst [17]. The hydrothermal, electrodeposition, coating and direct phosphorization routes are commonly used to produce TMP electrocatalysts [18,19,20,21].
A good catalyst for the HER cannot have high or low chemisorption energy as it slows the desorption process or causes difficulties in the chemical adsorption of protons. In this work, Fe, Ni and Co were selected as the transition metal phosphides to be explored, because Miles and Thomason [22] revealed that chemisorption of hydrogen on these non-noble metals was the closest to the Pt of all materials. Also, the price of Fe, Ni and Co is roughly 200,000, 2000 and 1000 times cheaper than Pt, respectively, which is crucial for sustained development of PEM technology [23,24].
An efficient, simple and easily scalable approach to the samples’ preparation was used [25]. Catalysts were easily obtained through the incipient wetness impregnation method by drop-wise addition. The synthesized catalysts were characterized in terms of their physico-chemical properties by N2 adsorption–desorption equilibrium isotherms at −196 °C, thermogravimetric analysis and X-ray diffraction. The catalytic performance was evaluated in ex situ Cyclic Voltammetry (CV) and Electrochemical Impedance Spectroscopy (EIS) tests. The best catalysts were studied in a PEMWE system by in situ polarization curves and EIS tests. The long-term stability of the most promising catalysts was also tested at a fixed current density of 10 mA cm−2.
This work aims to replace the PGM catalysts currently used in PEMWE systems, providing a broader view of what is required for the catalyst’s development by characterizing the materials and testing it both ex situ and in situ (using a PEMWE device).
2. Materials and Methods
2.1. Catalysts Preparation
For the HER catalysts, commercially available carbon black (Vulcan XC72, Cabot, Boston, MA, USA) was impregnated with three different transition metals: iron, nickel and cobalt. For each metal, three samples were prepared, containing different metal weight loadings, 5, 25 and 50% wt. In this preparation, Iron (III) nitrate nonahydrate, Fe(NO3)3. 9 H2O; Nickel (II) nitrate hexahydrate Ni(NO3)2. 6 H2O; and Cobalt (II) nitrate hexahydrate Co(NO3)2. 6 H2O were used as metal precursors. The samples were prepared through the incipient wetness impregnation method by drop-wise addition of an aqueous solution of the precursor to 0.5 g of CB in an ultrasonic bath, followed by drying in an oven at 100 °C overnight.
Then, the impregnated samples were thermally treated under nitrogen for 1 h and reduced under hydrogen for 3 h at 400 °C on a vertical tube furnace using a 100 cm3 min−1 flow rate. After this time, the samples were cooled to room temperature in a nitrogen atmosphere.
The CB supported biphasic material was obtained by using a gas transport phosphorization method, where 0.3 g of red phosphor per 0.25 g of catalyst was heated up to 500 °C for 1 h. Then, it was cooled down to 250 °C in an inert atmosphere for 12 h. For this process, 100 cm3 min−1 of N2 was used. This method is characterized by its simplicity, and for removing complicated procedures and post-treatment steps.
The sample denomination is as follows for non-phosphorized samples: XX% AA/BB, with XX representing the metal content of AA metal supported on the BB support. For example, metal content of 5% of Ni supported on CB is shown as 5% Ni/CB. Regarding the phosphorized samples, the nomenclature is similar, only adding the “P”, as can be seen in XX% AAP/BB. And, for the same example of the phosphorized sample, it is denominated 5% NiP/CB.
2.2. Materials Characterization
The textural properties of the catalysts were analyzed in a NOVA 4200e from Quantachrome (Boynton Beach, FL, USA) instruments by N2 adsorption–desorption equilibrium isotherms at −196 °C. Prior to the analysis, roughly 100 mg of the samples were degassed at 150 °C for 3 h. The specific surface area of the materials was obtained by the BET method, SBET, whereas the external surface area, Smeso, and micropore volume, Vmicro, were determined by the t-method. The pore size distribution was estimated by density functional theory (DFT).
A thermal process was used to perform an immediate analysis and estimate the metal content in the impregnated carbon black HER catalysts. The analysis was performed in a NETZCHST 409 LUXX (Netzsch, Selb, Germany) instrument. The samples were heated from room temperature to 900 °C with a heating rate of 10 °C min−1 in a nitrogen atmosphere. At 900 °C, the samples were maintained in the nitrogen atmosphere for 7 min and then 13 min in air. The first step is used to calculate the volatile content present in the carbon material. When the atmosphere is changed to air, the fixed content is burned, leaving behind only the metal that was impregnated in the carbon material and some metallic impurities present in the support.
The crystalline phase composition of the catalysts was evaluated by powder X-ray diffraction (XRD) experiments conducted on a X’Pert PRO diffractometer (PANalytical, Malvern, UK) set at 45 kV and 40 mA, using Cu Kα radiation (λ = 1.541874 Å) and a PIXcel detector. Data were collected using a Bragg–Brentano configuration in the 2θ range of 20–80° at a scan speed of 0.01° s−1.
2.3. Electrocatalytic Tests
2.3.1. Ex Situ Tests
For the ex situ experiments, the electrocatalytic performance of the synthesized TMP was evaluated by immobilization at the working electrode using a direct ink approach. The ink was prepared using 5 mg of the crushed electrocatalyst with 1000 µL of ethanol and 50 µL of Nafion perfluorinated resin solution (5% v/v Nafion solution). In order to improve electrocatalyst dispersion, the sample was sonicated for 10 s using a high-energy ultrasonic tip, emerged in an ultrasonic bath for 90 min, and, finally, sonicated for 10 more seconds with the ultrasonic tip. Then, the solution was added dropwise onto a 1 × 1 cm2 carbon paper electrode to obtain the 3 wt% electrode.
The ex situ Cyclic Voltammetry (CV) and Electrochemical Impedance Spectroscopy (EIS) tests were performed in a Metrohm Autolab PGSTAT302N (Herisau, Switzerlzand) potentiostat/galvanostat using a three-electrode setup, which consisted of a working electrode, mercury reference electrode and a graphite counter-electrode. The system was immersed in an electrolyte of 0.5 M H2SO4 solution under magnetic stirring at 80 rpm. The potential of the working electrode ranged from −0.25 to −0.6 V, with a scan rate of 5 mV s−1 for 49 cycles.
In this configuration, all potentials are reported versus the Reversible Hydrogen Electrode (RHE) by converting the measured values accordingly with Equation (1).
E(RHE) = Measured potential + 0.241 + 0.059 pH
However, this is not the only correction necessary, as in the three-electrode configuration the resistances need to be accounted for. Thus, Equation (2) is used.
where Ecorr is the potential corrected over iR values (V), Emea is the measured potential (V), i is the system current (A) and R can be read out from the leftmost intersection between the Nyquist curve and X-axis at high frequencies (Hz). The cyclic voltammetry curves are obtained by plotting the current density (j) vs. potential (V). Tafel plots (overpotential vs. log (j)) are plotted by fitting the linear region (roughly between 10–100 mA cm−2) and the Tafel slope is calculated from Equation (3).
where η is the overpotential (V), b is the Tafel slope (mV dec−1), j is the current density (mA cm−2) and j0 is the exchange current density (mA cm−2).
Ecorr = Emea − iR × 0.85
η = b × log (j/j0)
Furthermore, the Tafel slope and overpotential required to achieve 10 mA cm−2 are used to compare the performance of the electrocatalysts, and the stability of the materials under acidic conditions is examined during 49 cycles to assess their evolution over a larger period of time. The most promising electrocatalysts were then subjected to in situ tests in PEMWE to further assess their behavior under working conditions.
The catalytic stability was assessed at room temperature at a constant current density of −10 mA cm−2 for HER.
2.3.2. In Situ Tests
For PEMWE tests, a Nafion 115 membrane from Quintech was used. The membranes were prepared following three steps: (i) membrane pre-treatment, (ii) catalytic ink preparation, and (iii) deposition of the catalytic ink onto the membrane by spray painting.
Membrane cleaning and protonation pre-treatment were carried out by placing the membrane on a 3%v H2O2 solution and heating up to 80 °C. After 30 min, the membrane/solution was naturally cooled to 40 °C and washed with distilled water. This process was repeated using distilled water and a 0.5 M H2SO4 solution. The membrane was then stored in distilled water.
The electrocatalyst ink was prepared to meet a target of 3 mg cm−2 loading on the membrane. Due to process losses, it was required to use a solution of 60 mg of catalyst, 0.243 mL of 5 wt% Nafion solution, and 3.2 mL of iso-propanol. The solution was put in the ultrasonic bath for 30 min. The catalytic ink was then deposited by spray painting onto each side of a dried membrane at 40 °C.
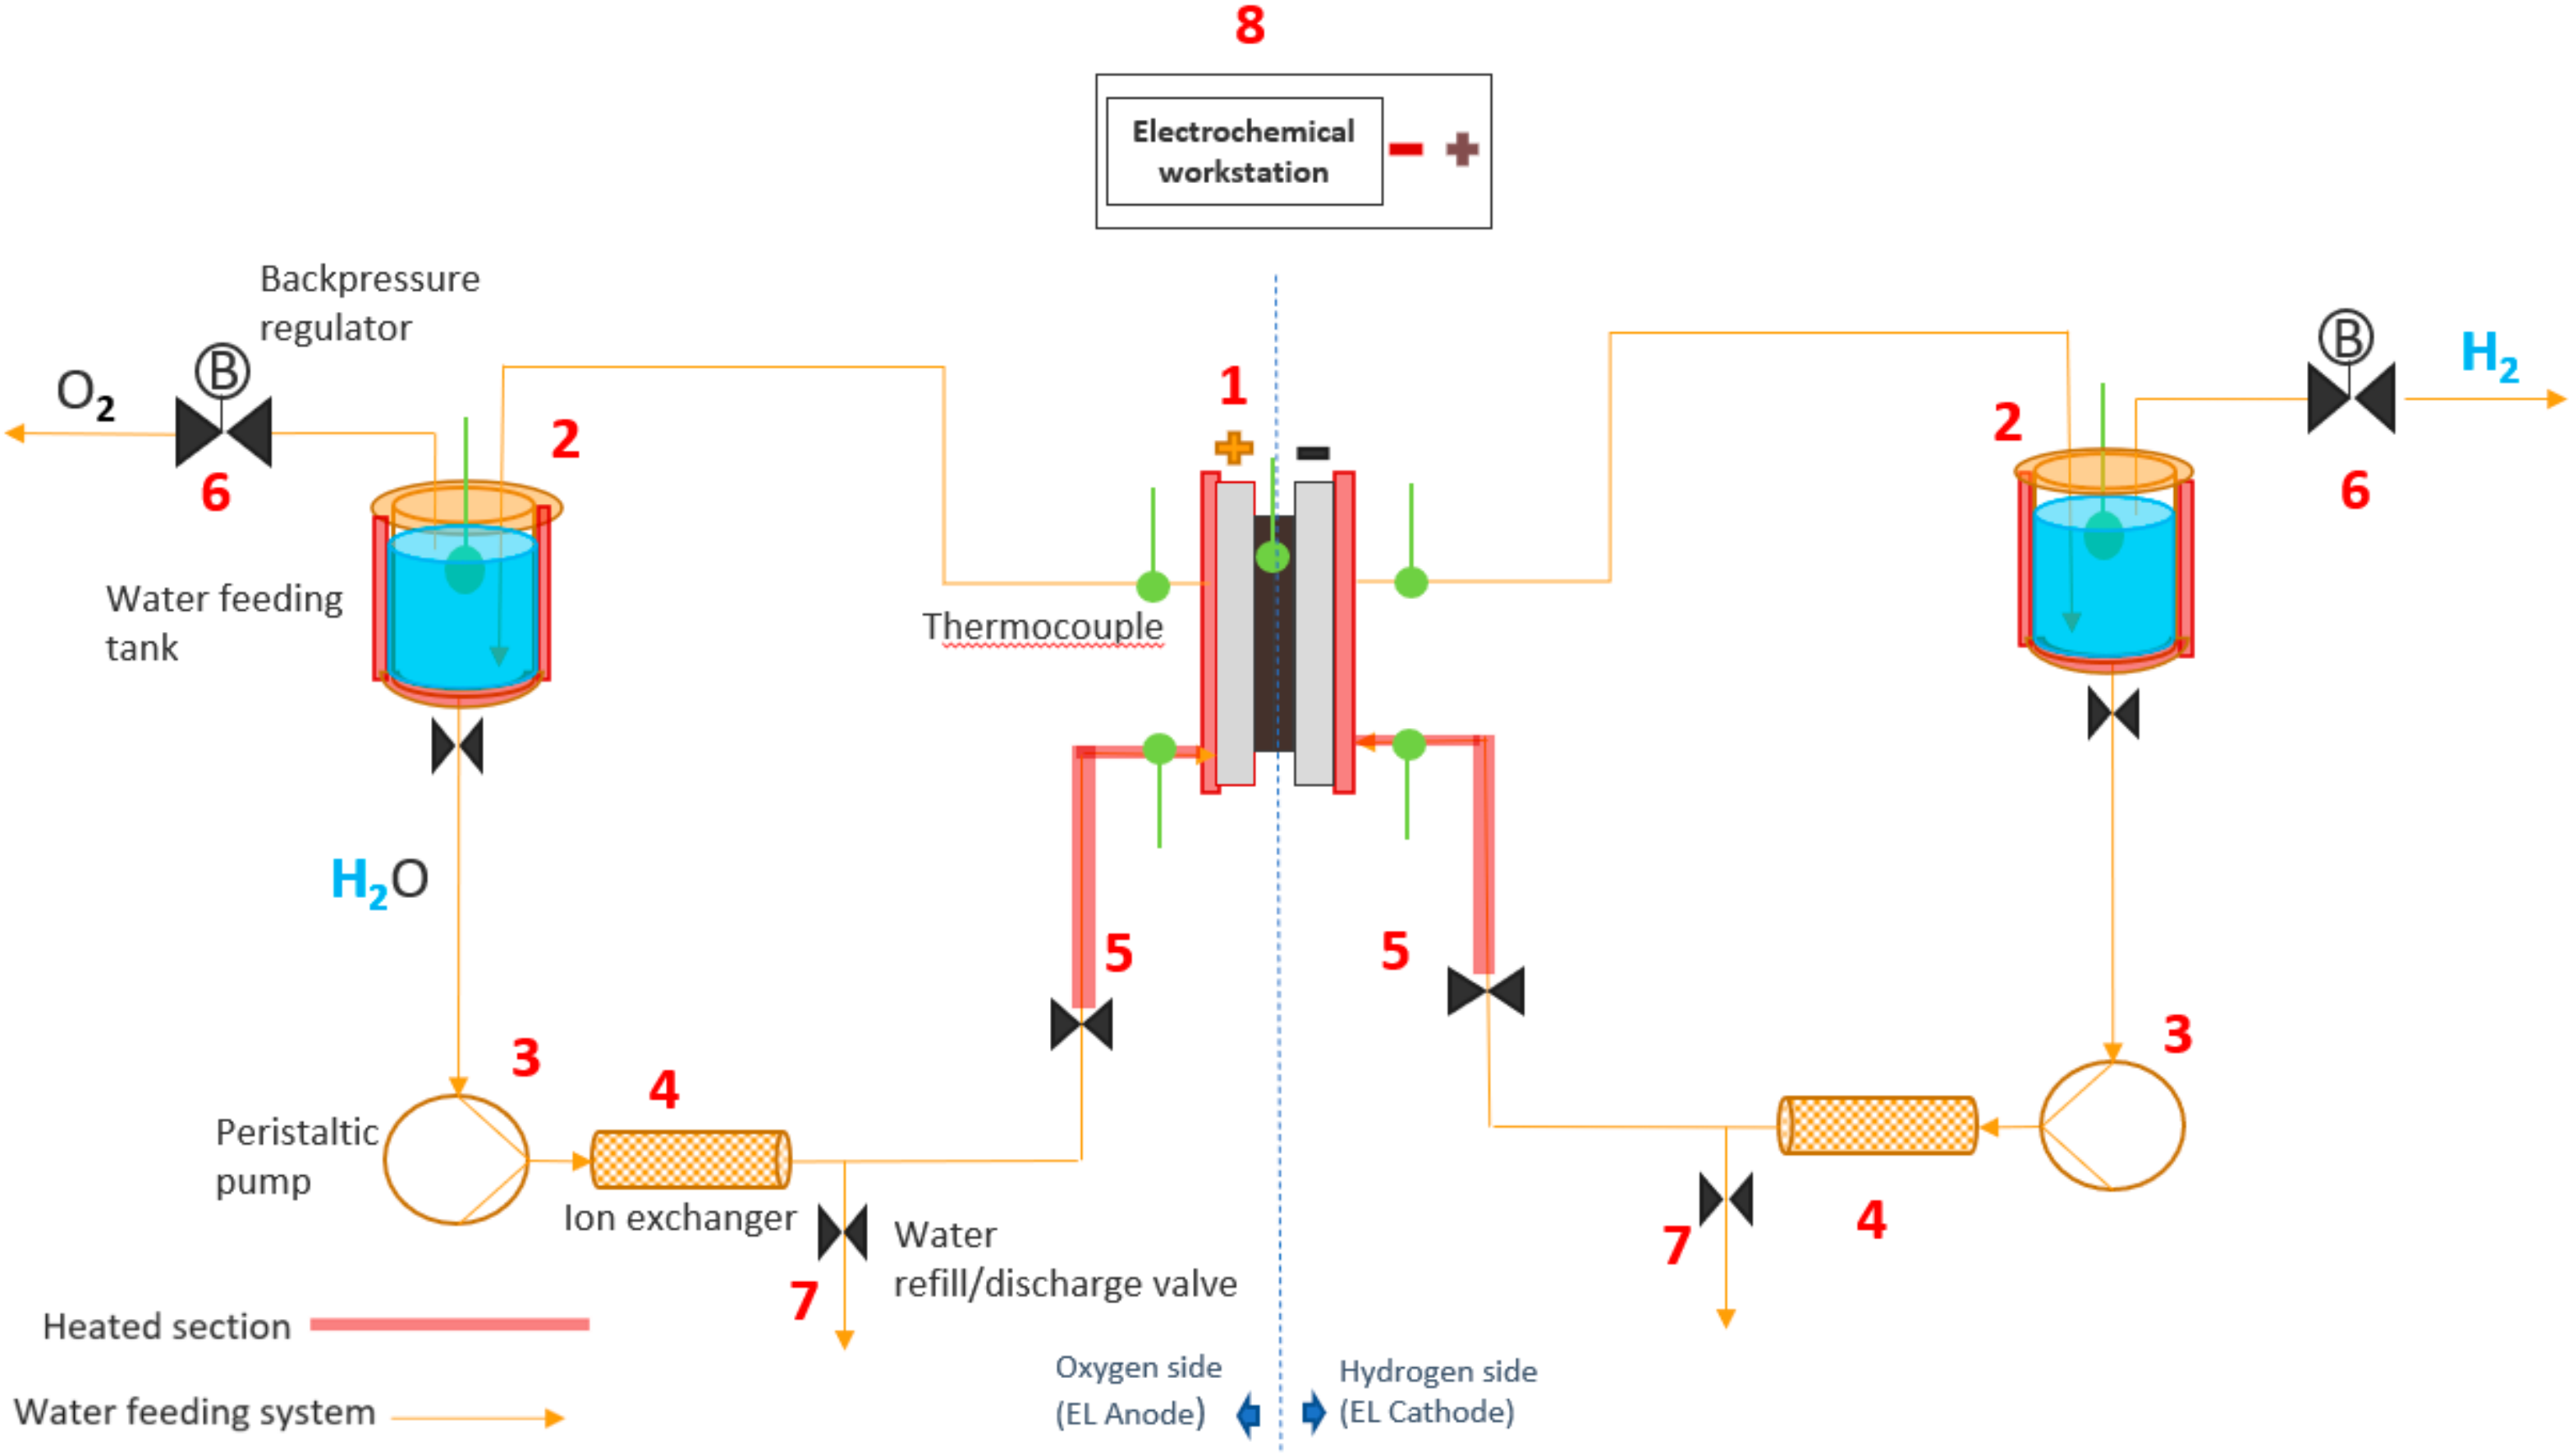
After examining the results of the previous experiments, a PEMWE with the most promising catalysts was assembled and tested. For those, in situ EIS and polarization curves assays were carried out. The experimental setup and PEMWE cell are shown in Figure 1 and Figure 2, respectively.
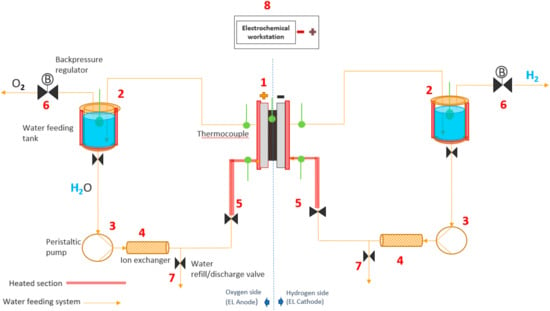
Figure 1.
Experimental setup used for the in situ polarization curves and electrochemical impedance spectroscopy.

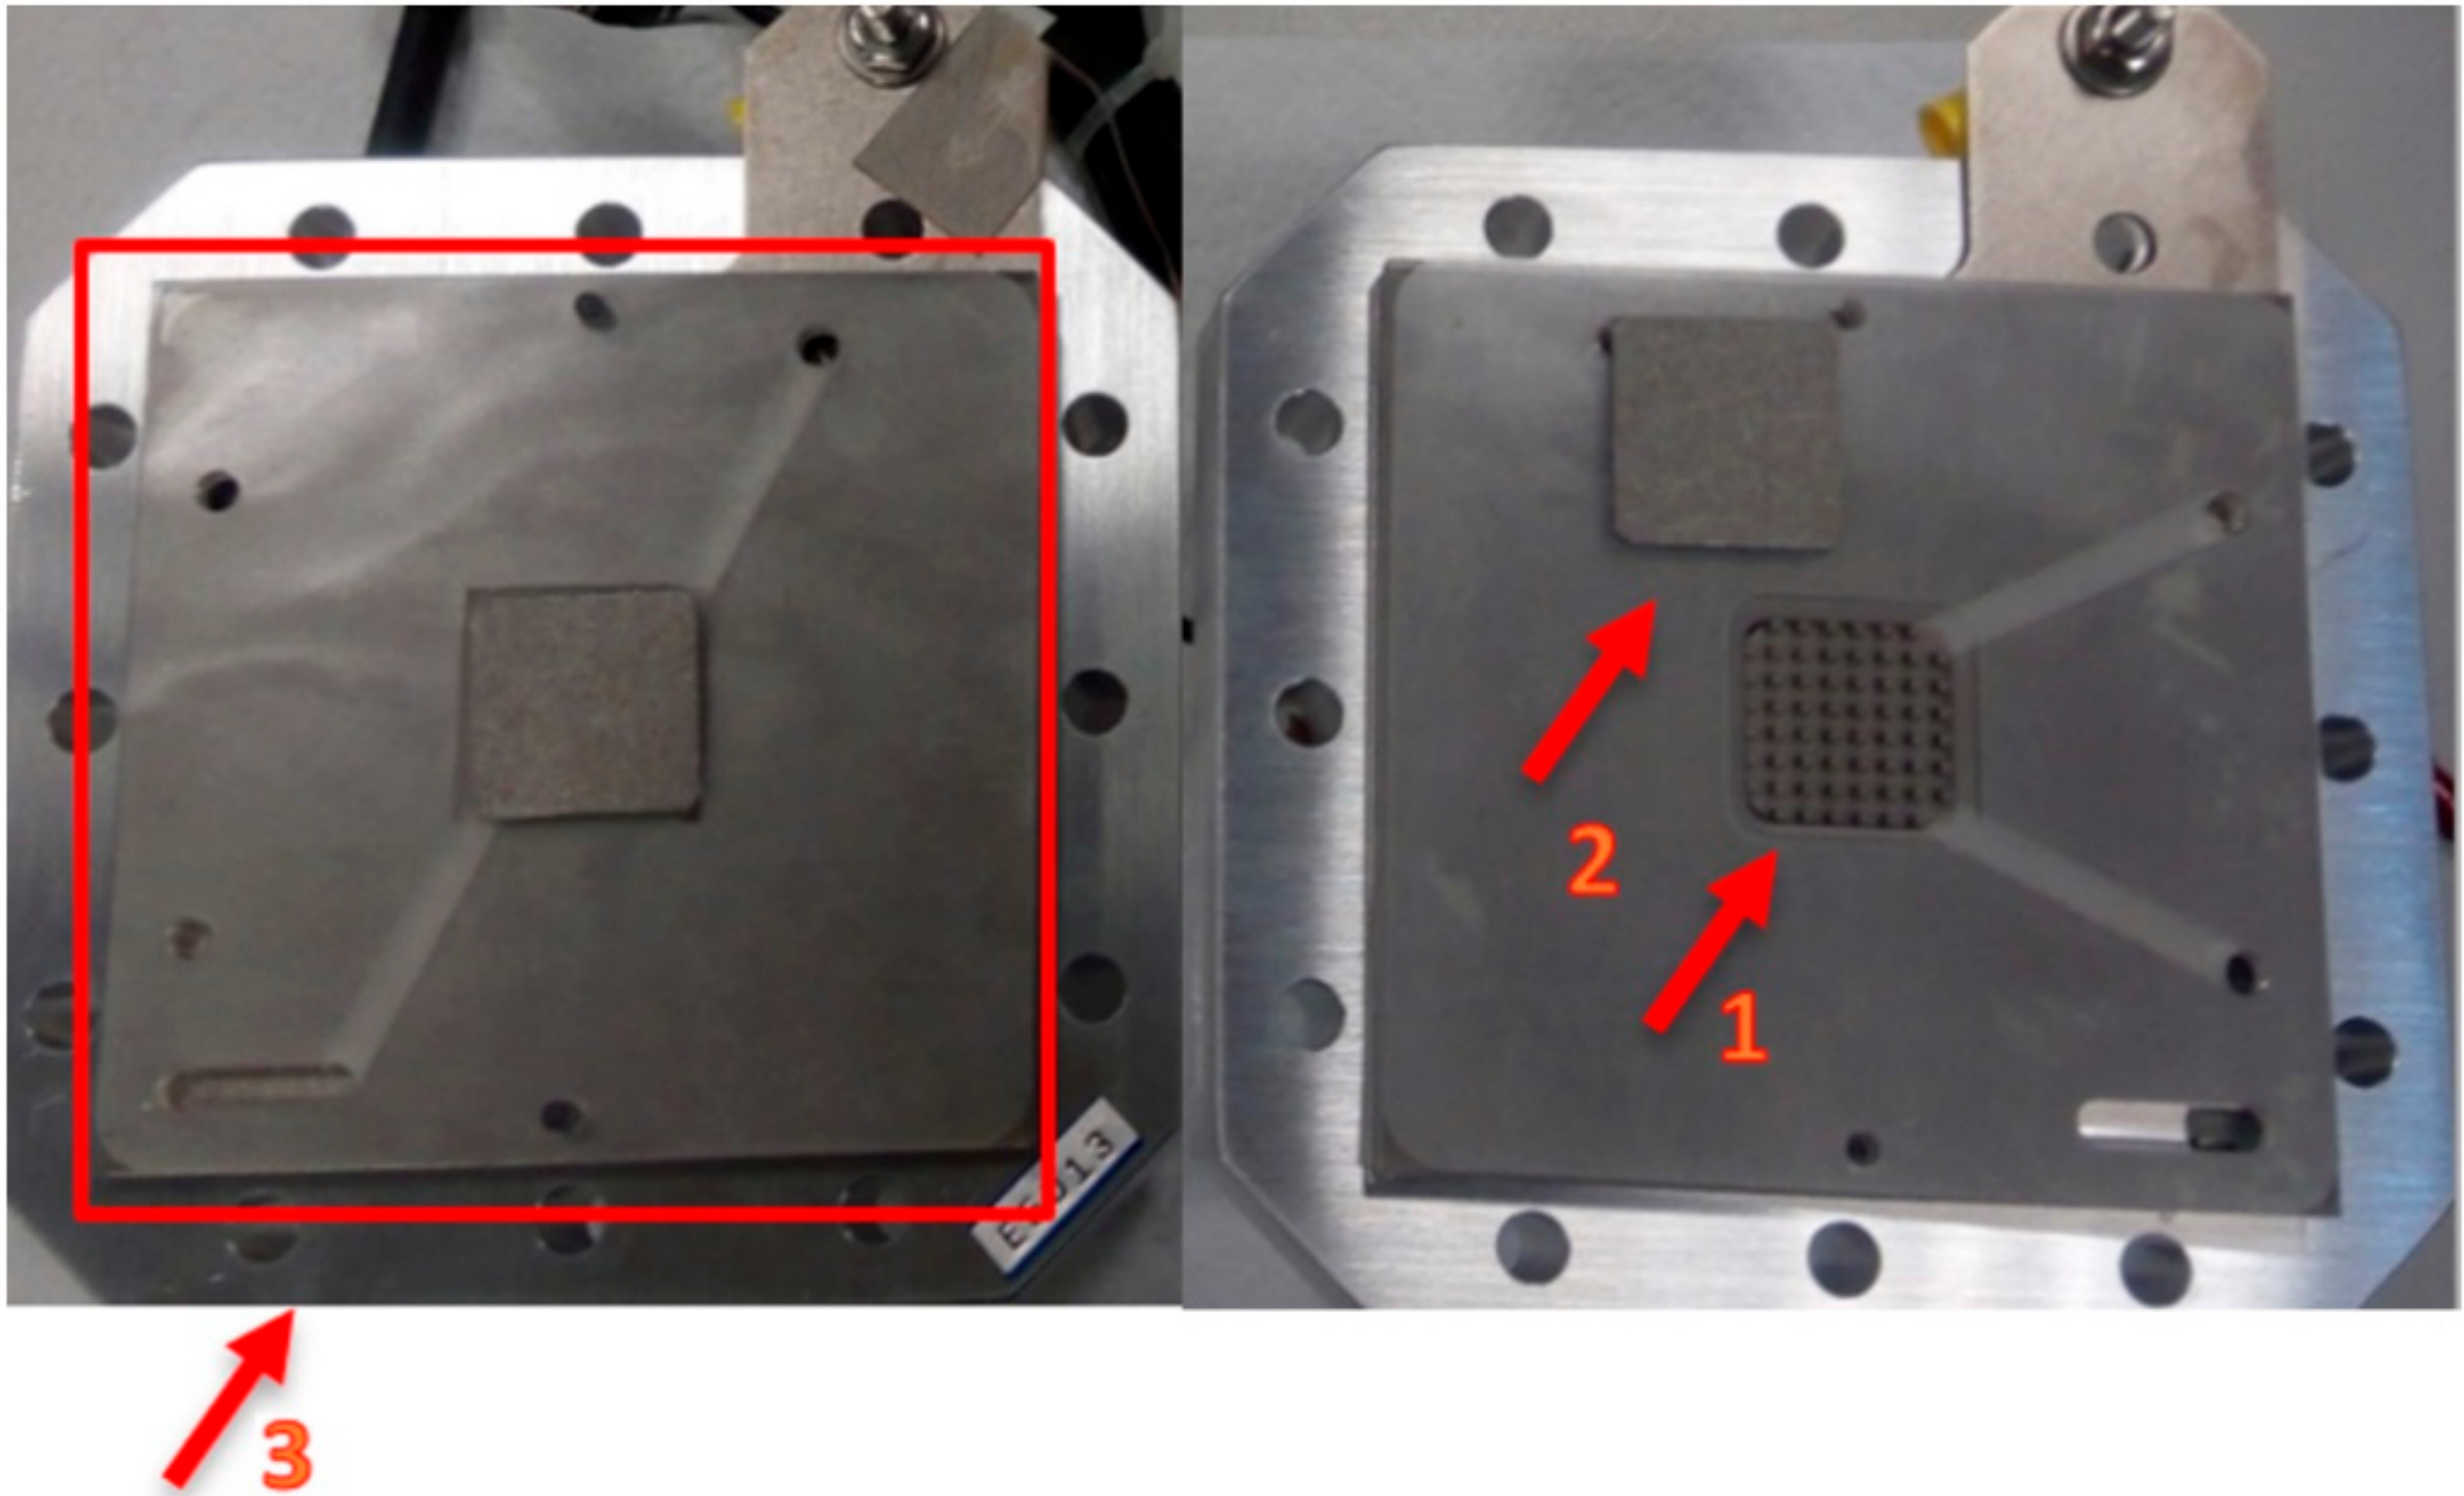
Figure 2.
PEMWE used for the in situ polarization curves and electrochemical impedance spectroscopy.
The water is stored in tanks (Figure 1), where it is heated up to 63 °C (a little higher than operating conditions due to thermal losses in the tubes). The water is then pumped by the peristaltic pump (3) through the ion-exchanger (Ominflow PROTECT+ion) (4), which keeps the conductivity under the desired value of 1 µS cm−1. The water refill/discharge valve (7) is commonly used to verify water conductivity, and to change the water course. There is a heating section (5) with thermocouples to ensure the right temperature at the inlet and outlet of the PEM (1). As the electrolysis reaction takes place in the EL, the evolved gases flow back to the water feeding tanks. Two back-pressure regulators (6) connected to these tanks allow pressurizing the system up to 2 bar. There is also an electrochemical station (8) (Zahner Zennium with a PP 241 potentiostat, Zahner) (Kronach, Gundelsdorf, Germany) connected with the system to register the cell outputs.
In Figure 2, 1 represents the active area, a square of 5 cm2 (2.23 cm × 2.23 cm); 2 is the porous transport layer (PTL), which is a 0.3 mm-thick Pt coated titanium felt from Bekaert; and 3 is the bipolar plate composed of titanium with column/pin type flow field.
A state-of-the-art Pt cathode and an Ir black anode are used as reference. To evaluate the HER catalyst’s performance, Ir black is used at the anode side and the developed HER catalysts are deposited on the cathode side of the membrane.
To perform the polarization curves, the following conditions are used: 60 °C; 60 mL min−1 water flow rate; atmospheric pressure; and the system is operated under galvanostatic or potentiostatic mode. During the tests, the potentiostat is set to 100 mA cm−2 for 5 min. Afterwards, the polarization curve is performed with a hold time of 1 min on each point, in galvanostatic mode ranging the current from 0.5 to 800 mA cm−2, with voltage stop at 2.0 V, as values over 2 V are prejudicial to the device. The tests are repeated until two consecutive polarization (IV) curves are in accordance. The IV curves are used to compare the electrocatalysts’ performance and provide meaningful data over their operation in a wider range of currents.
As for the EIS tests, they are performed right after the IV curves. First, like the CV tests, the potentiostat is set to 100 mA cm−2 for 5 min. Then the EIS spectra are recorded in potentiostatic mode by varying the operating voltages over these values: 1.415; 1.445; 1.465; 1.600; and 1.700 V. The operating conditions are at 10 mV AC amplitude excitation, with a frequency range of 100 kHz to 100 mHz, and before each voltage there is 3 min of stabilization time.
3. Results and Discussion
3.1. Catalyst’s Characterization
3.1.1. N2 Adsorption–Desorption Equilibrium Isotherms at −196 °C
These experiments were conducted to study the electrocatalysts’ textural properties, such as the BET specific surface area (SBET), external surface area (SMeso), pore (Vp P/Po = 0.95) and micropore (VMicro) volumes, and the pore size distribution.
All catalysts have a type IV isotherm, common in mesoporous materials, like carbon black. Type IV isotherms have an extensive hysteresis loop that covers a large range of values of P/P0.
Table 1 shows the textural properties of CB-supported catalysts with different metal contents and the original CB itself. It can be seen that specific surface area decreases with the increase in metal content. For instance, even for the lowest metal content (5 %wt.), the reduction in specific surface area (SBET) is noticeable. It can also be seen that the impregnated metals are most likely blocking the micropores entrance as the major difference for the CB and the 5% metal samples is the microporous volume. The energy required to fill in the micropores is quite high, making it a harder scenario to occur. And as the metal is incorporated onto the micropores, the pore volume also decreases (Vp P/P0 = 0.95), especially for the 25% and 50% metal content where the micropore volume decreases at a lower rate.

Table 1.
Textural properties of the catalysts supported on CB.
The catalysts were also analyzed after the phosphorization process to assess the influence of this process on textural properties (Table 2).
Table 2.
Textural properties of the phosphorized catalysts on CB.
By comparing the results shown in Table 1 with those in Table 2, it is evident that the phosphorized samples have a reduced BET surface area and pore volume. For example, from the Fe/CB samples to the FeP/CB samples the BET surface area decreased from 1209, 701, 282 m2 g−1 to 924, 415, 259 m2 g−1 for the 5, 25, 50% metal content, respectively. Another key parameter affected by the phosphorization was the pore and micropore volume, which decreased in both cases. However, in the case of 50% metal content of Fe/CB and Ni/CB to FeP/CB and NiP/CB, the values remained unchanged, which can be explained by the initial low micropore volume and the harder incorporation in these cases.
3.1.2. Thermogravimetric Analysis
Thermogravimetric (TG) analysis was carried out to evaluate the extension of metal impregnation onto the CB, which is quite important for higher amounts of metal impregnation. Table 3 shows the values determined of the moisture percentage, which is the mass loss before reaching 100 °C; the volatiles percentage, the mass loss during the heating process until 900 °C in the N2 atmosphere; and the fixed carbon percentage, which is correlated with the mass loss when the atmosphere is changed to air at 900 °C.
Table 3.
Immediate analysis determined by TG analysis.
The moisture percentage remains negligible, and the same for all samples. The volatiles percentage is roughly the same, as no functionalization process was made. Another key aspect to analyze is the amount of metal that remained on the carbon material. An approximation of metal content can be made by subtracting the CB ash (from the CB synthesis process) to the ash percentage, as shown in Table 3, where ash refers to the remaining material of the TG analysis. The values are in the range of the target metal loadings (~7 vs. 5; ~32 vs. 25 and ~60 vs. 50) showing that a proper impregnation method was used, and the small differences are within the method’s experimental error.
3.1.3. X-ray Diffraction
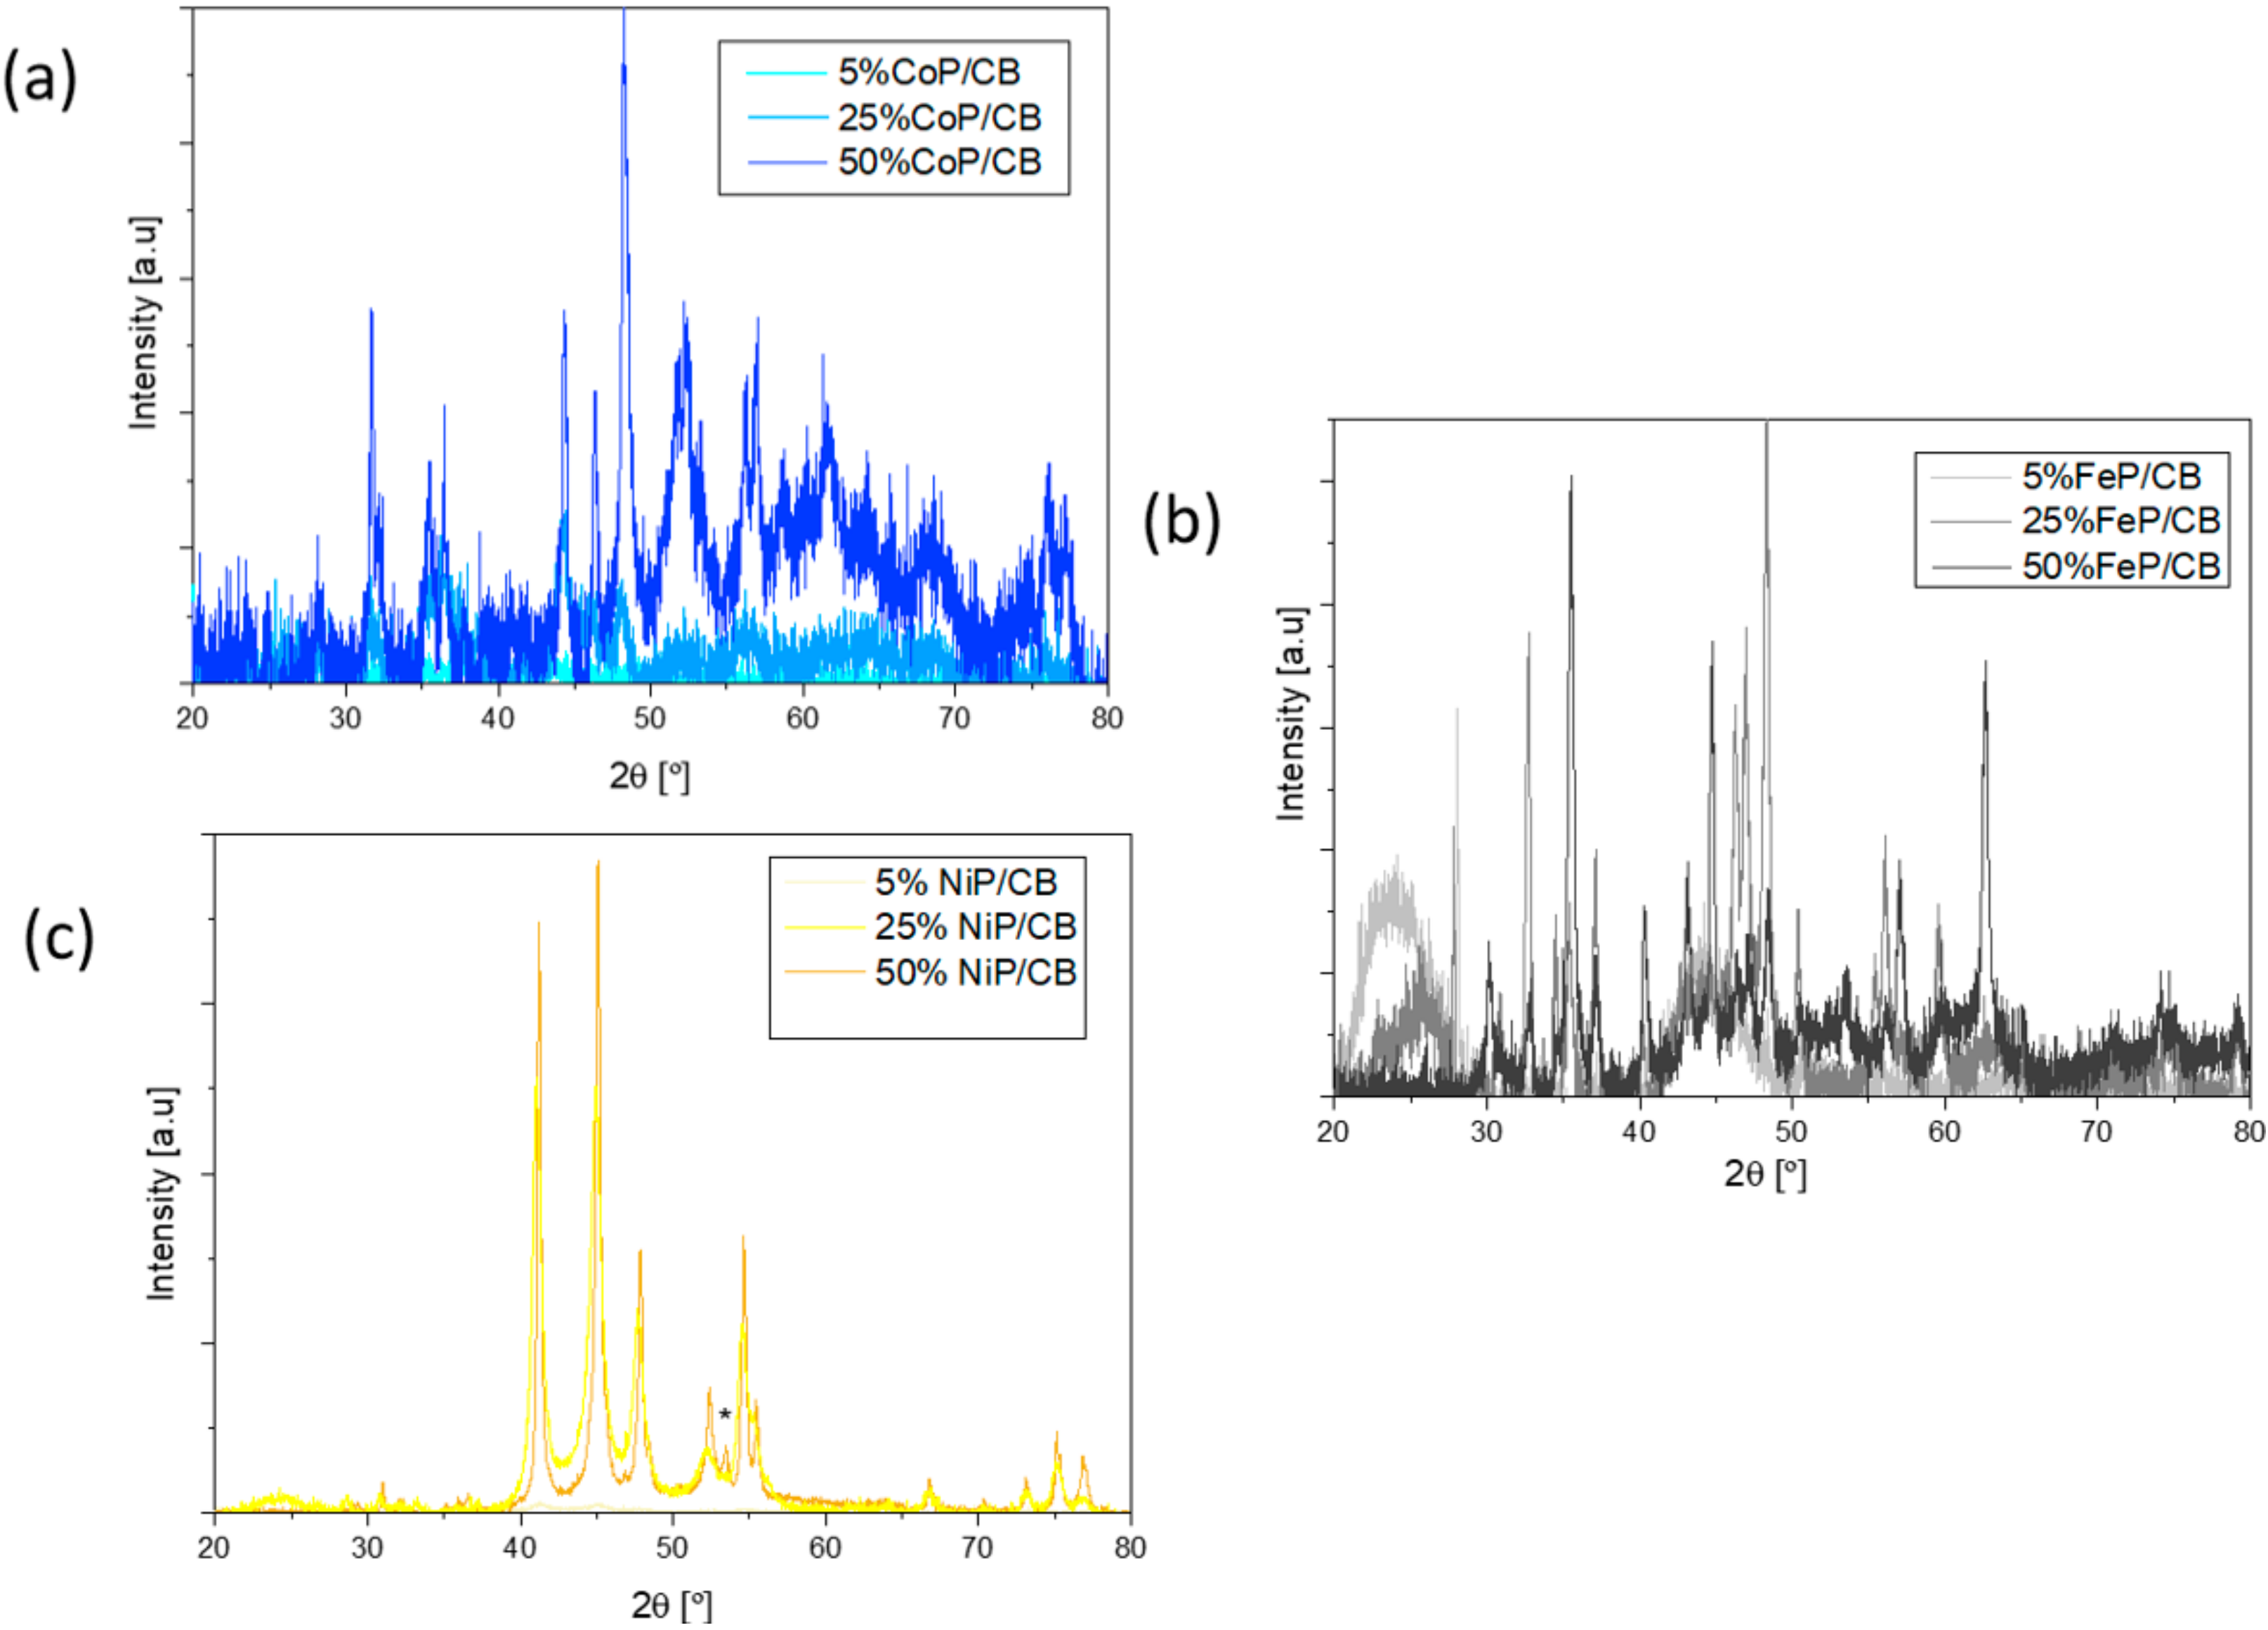
The crystalline structure of the synthesized TMP catalyst was analyzed by XRD, and the patterns for Co, Fe and Ni are presented in Figure 3.

Figure 3.
(a) XRD pattern of Co catalysts after the phosphorization process, (b) XRD pattern of Fe catalysts after the phosphorization process, (c) XRD pattern of Ni catalysts after the phosphorization process.
Firstly, by analyzing Figure 3a it can be concluded that the impregnation method was well performed as all samples have the characteristic peaks of Co (ICDD 04-014-0167; peaks at 44, 52 e 76°). The lack of cobalt oxide on the XRD patterns indicates that the reduction process was well conducted. In contrast, the XRD patterns show phosphorous, despite the P excess that was not able to incorporate onto the Co sample. The 5% CoP/CB sample showed the presence of CoP2 (ICDD 04-003-4573); in the 25% CoP/CB and 50% CoP/CB CoP samples, it was found the CoP crystalline phase (ICDD 03-065-2593; peaks at 32, 36, 47 and 48°) [26].
The iron catalyst XRD patterns are shown in Figure 3b. Similar to the cobalt results, Fe (ICDD 00-003-1050) is present in all metal contents, which corroborates the impregnation method effectiveness. The FeP crystalline phase (ICDD 01-078-1443, peaks at 33, 37, 48 and 60°) appears in the 25% and 50% metal content, and, in contrast, Fe2P (ICDD 04-006-5973) is present in the 5% and 25% metal content, which further validates the phosphorization process. For the 50% metal content, iron oxide (Fe2O3, ICDD 01-088-2359) is present in the XRD patterns, which indicates possible re-oxidation of the sample when in contact with air. It quantified the percentage of different phases present in the sample, being possible to conclude that the contribution from Fe2O3 is negligible. The quantifications obtained for the different phases are as follows: Fe0.96P0.04 (85%), Fe2O3 (6%) and FeP (9%).
The nickel catalyst XRD patterns are shown in Figure 3c. Unlike the previous TMP catalyst, only Ni2P (ICDD 04-001-9848, peaks at 41, 45, 48, 54 and 55°) appears on all the XRD patterns, supporting the impregnation method [26]. The phosphorization process was well executed as P (ICDD 04-017-5983) marked with “*” is exhibited, and Ni2P is present. In contrast with the other materials, the designated P peak indicates that an excess of P was not able to properly connect with the Ni material, which might affect the catalytic properties of the samples [27].
3.2. Electrochemical Analysis
3.2.1. Ex Situ CV and EIS
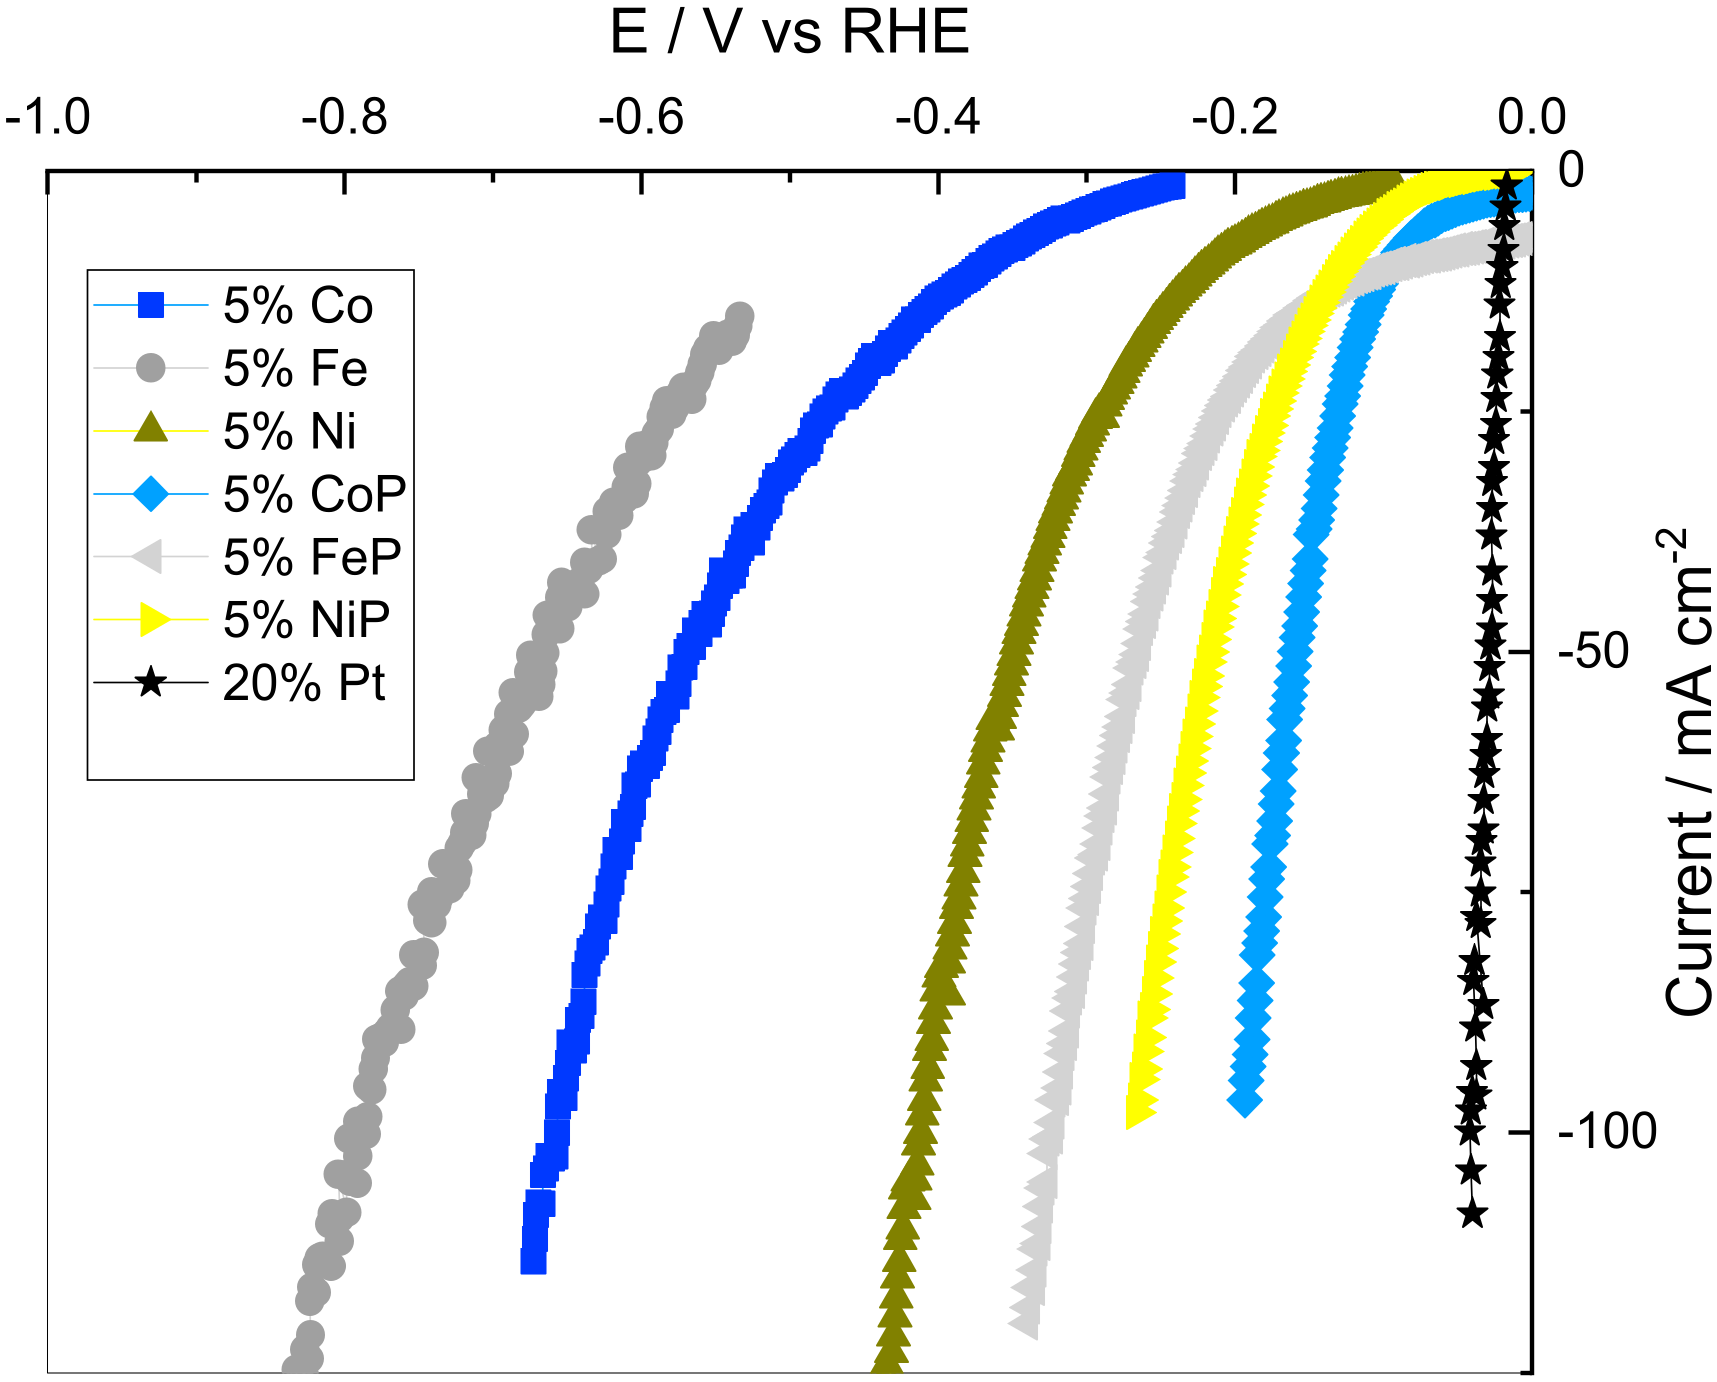
To evaluate the phosphorization effect on catalyst performance, additional tests were performed on P-less samples with 5% metal content. This loading was selected to reduce metal dispersion effects on the performance of the catalysts, which might be present at higher loadings. Figure 4 shows the CV curves for 5% metal content samples before and after the phosphorization process, and the 20% Pt supported on CB.

Figure 4.
Cyclic voltammetry curves for the 5% metal content samples before and after the phosphorization process, and the 20% Pt supported on CB.
Analyzing Figure 4, it can be seen that non-phosphorized samples need higher overpotentials for the same current density, thus having worse catalytic performances. This was an expected result, as the M-Hads bonding energy to form the required intermediates is too weak for iron, cobalt and nickel. Also, the doping of the P atom into the metal lattice allows the formation of M-P bonds that form a weak ligand effect [16]. This makes the electronegative P act as a proton acceptor, facilitating the proton incorporation to metals that would be harder otherwise [16]. The results are also in accordance with Miles and Thomason [28], who measured the catalytic activity towards the HER at 0.5 M H2SO4 for the non-P samples that follow the same pattern as Ni > Co > Fe. As expected, the state-of-the-art 20% Pt showed the best catalytic properties of all the analyzed species.
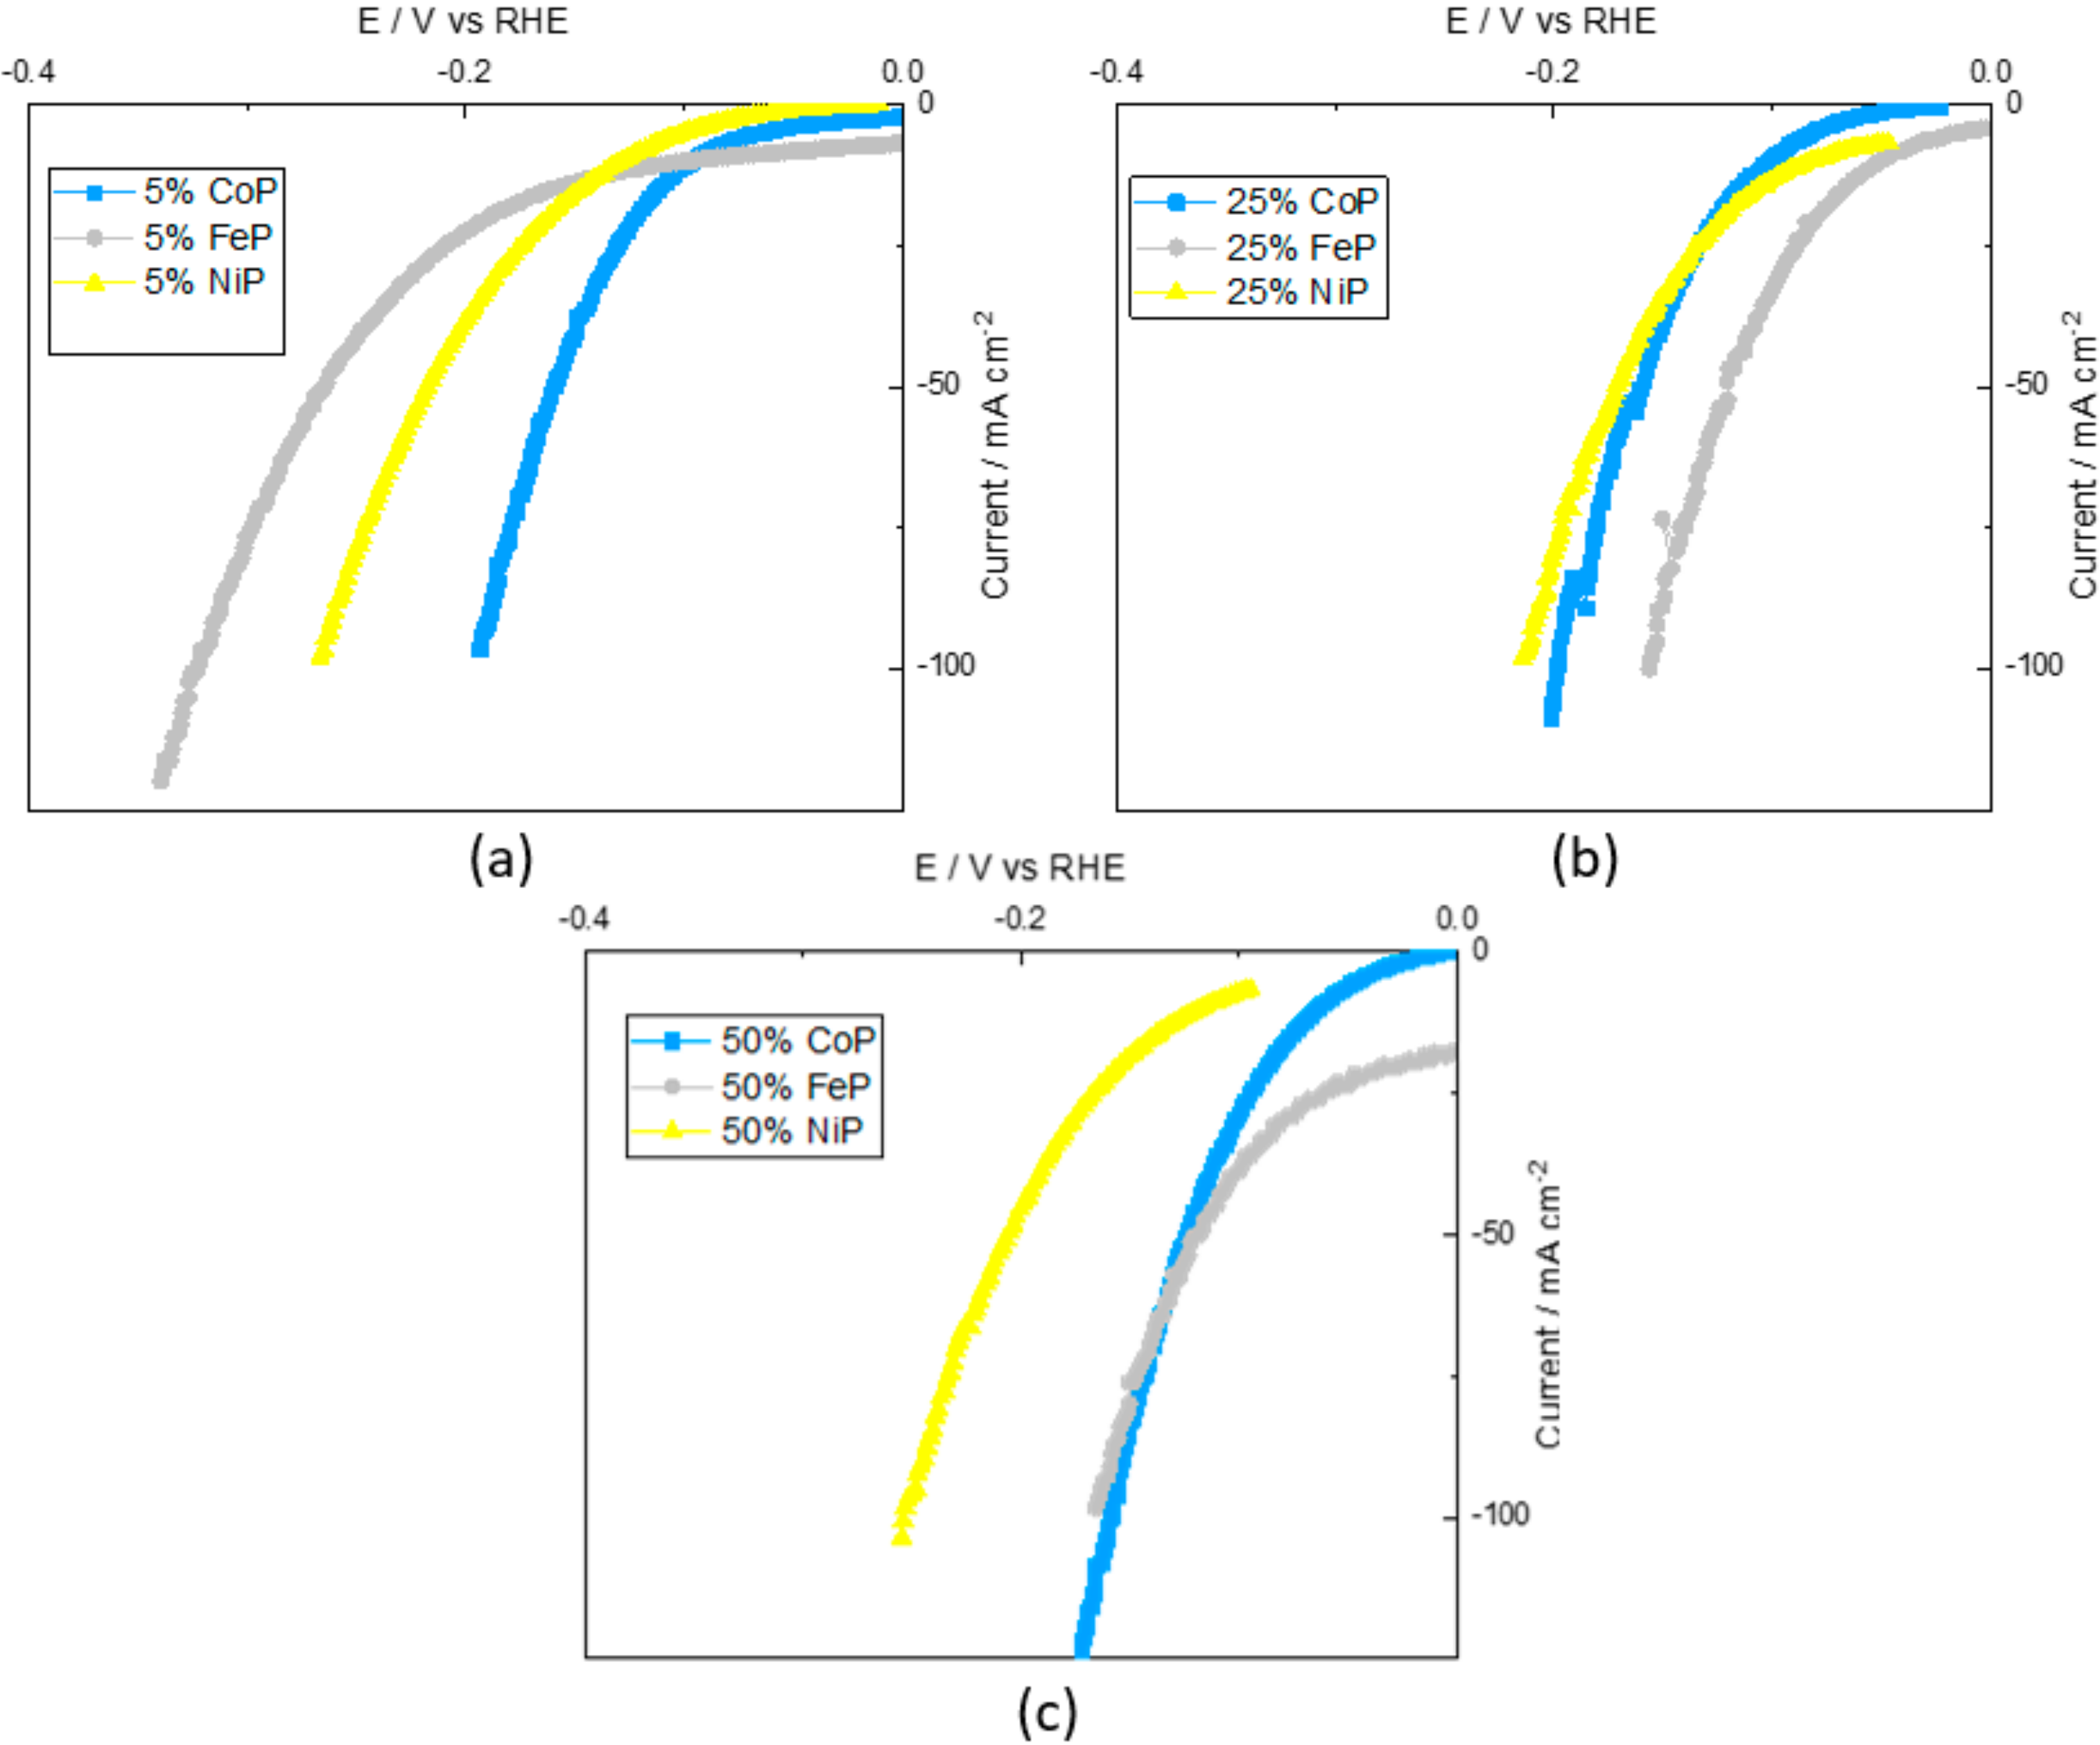
Thus, different metal contents were explored for TMP catalysts to evaluate the metal content impact on the catalyst performance. So, regarding the TMP catalysts, the CV curves for the phosphorated 5%, 25% and 50% metal content of Co, Fe and Ni supported on CB are shown in Figure 5.

Figure 5.
Cyclic voltammetry curves for the phosphorated (a) 5% metal, (b) 25% and (c) 50% metal content samples supported on CB.
Figure 5a shows that the CoP/CB sample was the most active of TMP samples, whereas FeP/CB was the least active. Owens-Baird et al. [29] reported that the Ni2P crystalline phase has the best catalytic activity of all crystalline phases for this metal content (Ni2P, CoP2 and Fe2P). However, the presence of a phosphorous crystalline phase in the NiP/CB sample indicates an excess of phosphorous that may hurt catalytic performance. Thus, the catalytic performance of the CoP/CB sample is superior in accordance with the reported results.
In Figure 5b, it can be seen that the 25% FeP/CB sample has the best catalytic performance of all TMP samples, and that 25% CoP/CB and 25% NiP/CB have very similar results. Using the same analysis as before, it can be seen that the FeP/CB sample is composed of FeP and Fe2P crystalline phases, and since the FeP phase is one of the most active of all, having a superior activity was expected. The CoP/CB and NiP/CB crystalline phases are CoP and Ni2P, respectively, which are close to the FeP/CB catalytic performance. This indicates that the results are on a par with that described in the literature [29].
Finally, for Figure 5c, 50% CoP/CB and 50% FeP/CB possess comparable performances that are quite superior to 50% NiP/CB. Andres et al. [30] reported that for a similar metal content (40%), the catalytic performance of CoP/CB was superior to NiP/CB, in accordance with the obtained results, despite the different crystalline phases present (Co2P and Ni12P5).
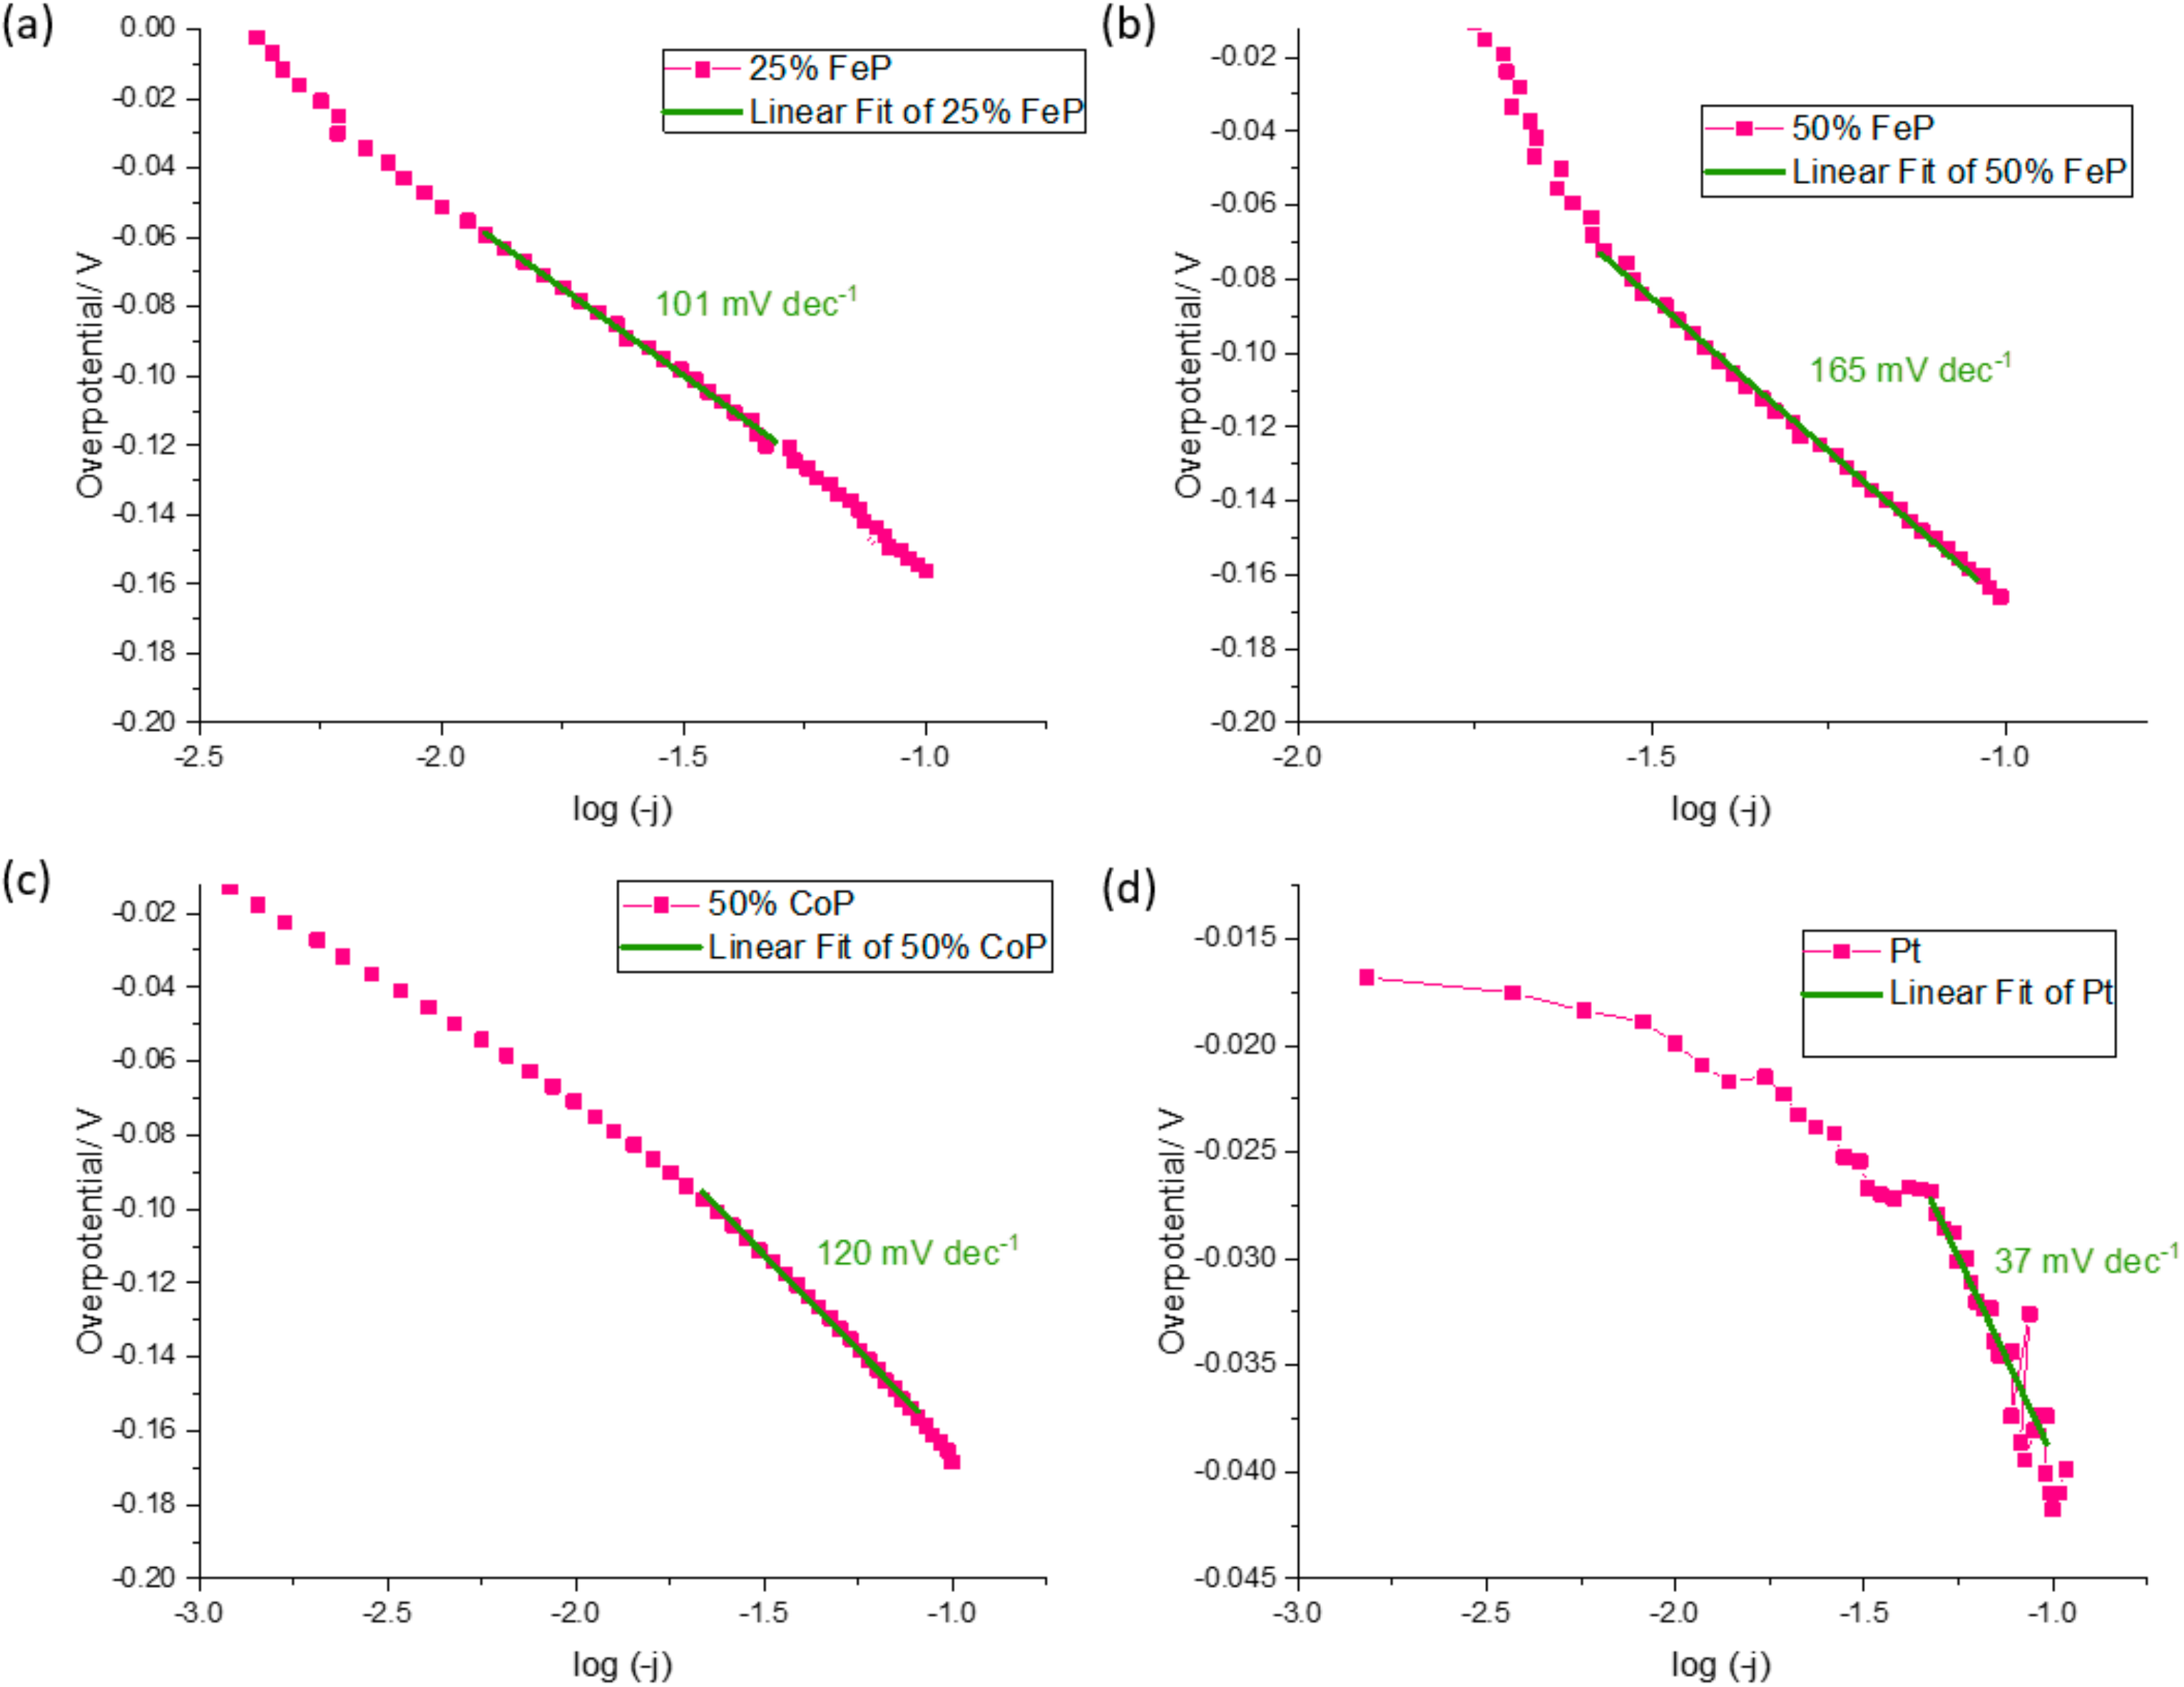
In order to better evaluate the catalytic performance of the TMP, several parameters such as the Tafel slope and overpotentials for 10, 50 and 100 mA cm−2 are shown in Table 4. In Figure 6, the Tafel slope of the samples that advanced to the PEMWE device are shown.
Table 4.
Key catalytic parameters.
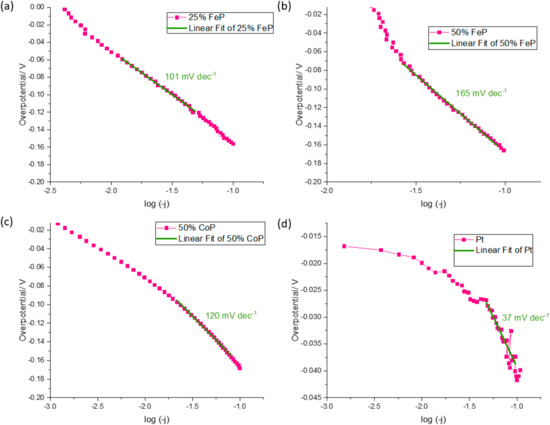
Figure 6.
Tafel slope determination for (a) 25% FeP/CB, (b) 50% FeP/CB, (c) 50% CoP/CB and (d) Pt/CB.
The ex situ experiments were carried out to determine the samples that would be implemented in the PEMWE system, as lower potential values represent better performance. The 25% FeP/CB catalyst was the first chosen material as its overpotentials (−51.0, −120.7 and −156.0 mV for a current density of 10, 50 and 100 mA cm−2, respectively) are the lowest values of all developed materials for a current density of 10 and 100 mA cm−2. The 50% CoP/CB was selected as its present values are similar to the 25% FeP/CB, with overpotentials of −63.5, −124.0 and −158.5 mV for a current density of 10, 50 and 100 mA cm−2, respectively. The 50% FeP/CB sample was selected despite the lack of overpotential results at 10 mA cm−2, as overpotentials of −111.8 and −165.9 mV for a current density of 50 and 100 mA cm−2, respectively, were similar with previously chosen materials, and for a current density of 50 mA cm−2 it had the lowest overpotential recorded. The Tafel slope can be interpreted as the necessary increase in overpotential to increase a fixed amount of current density. This analysis is commonly used to assess the HER mechanism by determining the Rate Determining Step (RDS). For the HER in an acidic environment, there are three candidate steps for the RDS: the Volmer reaction (with Tafel slope of ca. 120 mV/decade), the Heyrovsky reaction (Tafel slope of ca. 40 mV/decade), and the Tafel reaction (Tafel slope of ca. 30 mV/decade) [31]. The developed catalyst with the lowest Tafel slope value was 25% CoP/CB, with a Tafel slope of 85 mV dec−1; however, the registered overpotentials of −101.4, −159.5 and −198.3 for a current density of 10, 50 and 100 mA cm−2, respectively, are not promising enough to pass to the PEMWE tests. The obtained Tafel slope for the developed 25% and 50% metal content values indicate that the RDS of the HER is the Volmer reaction, as their values are close to the 120 mV dec−1 threshold. When compared with the literature values of similar catalysts, like Fe3P, Fe2P, FeP (57 mV dec−1, 66 mV dec−1 and 79 mV dec−1, respectively) [32], Ni2P/VB (75 mV dec−1) [28], and CoP/Ti (50 mV/dec−1) [33], it can be seen that the synthesized catalysts have higher Tafel slope values. However, these values are not far apart from the obtained results, and thus it can be concluded that the simplified preparation methodology has the potential to prepare electrocatalysts with a comparable performance to those reported in the literature with more complex preparation approaches.
In the case of Pt, overpotentials of −19.9, −27.9 and −41.0 mV were registered for a current density of 10, 50 and 100 mA cm−2, respectively, and a Tafel slope of 13 mV dec−1 in accordance with the literature results [28]. As expected, the Pt values are the lowest for all current densities, validating their status as the state-of-the-art catalyst for the HER.
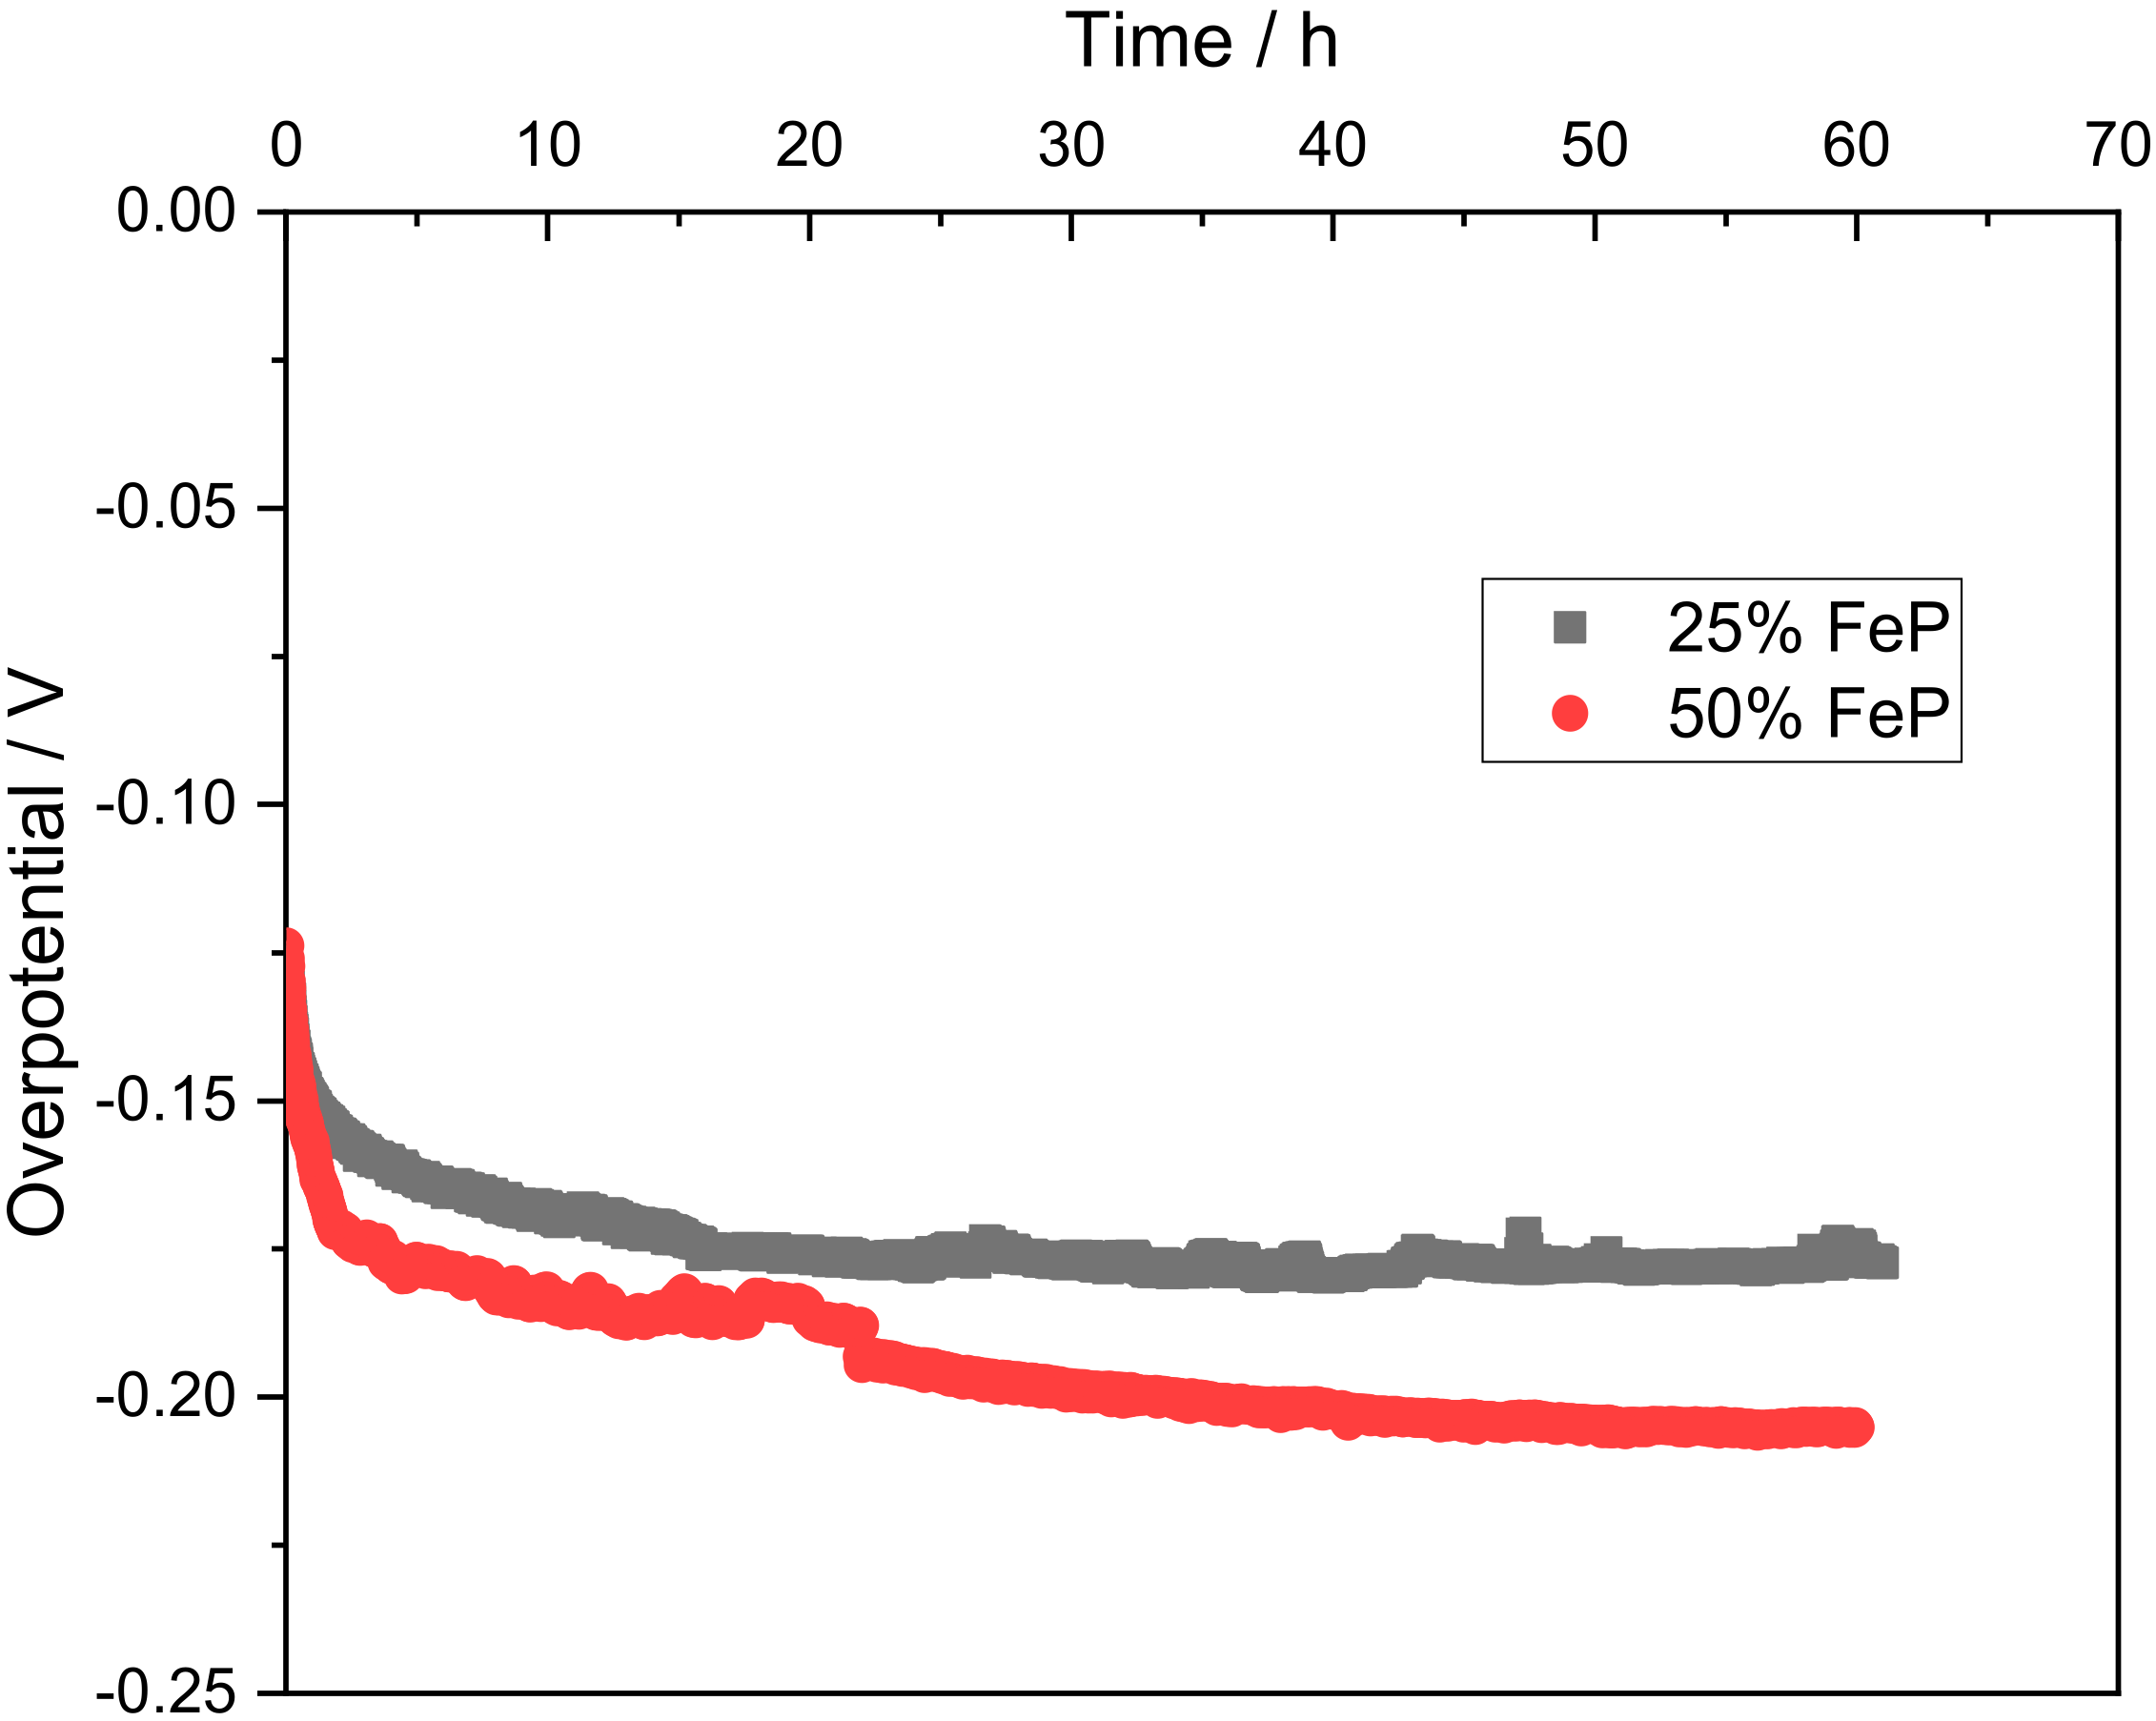
In accordance with the ex situ results, the best performing samples underwent stability tests to understand their behavior over a large period of time under acidic conditions and at a current density of 10 mA cm−2. The obtained overpotential for samples 25% FeP/CB and 50% FeP/CB are shown in Figure 7.
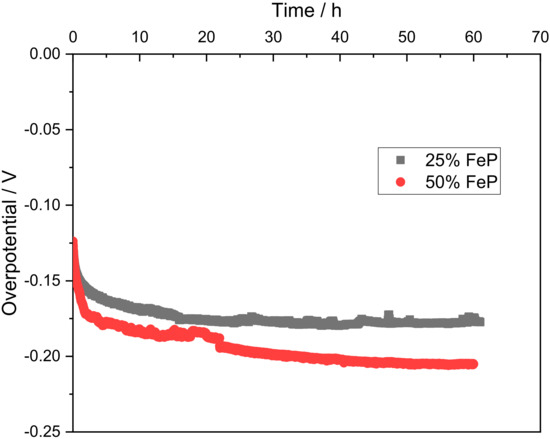
Figure 7.
Durability tests at 10 mA cm−2 for 25% FeP/CB and 50% FeP/CB.
In Figure 7, it can be seen that the overpotential required to maintain the 10 mA cm−2 initially decreases, indicative of an activation process. The 25% FeP/CB sample stabilizes after 24 h at −0.177 V as the activation process is commonly associated with the electrochemical in situ dephosphorization and oxidation process of the TMP [34], displaying the long-term stability of the sample. The 25% FeP/CB sample stabilized after 20 h, while in contrast, the 50% FeP/CB sample showed a slow deactivation profile between the 10–50 h range before reaching stabilization at −0.205 V.
3.2.2. In Situ Polarization Curves and EIS
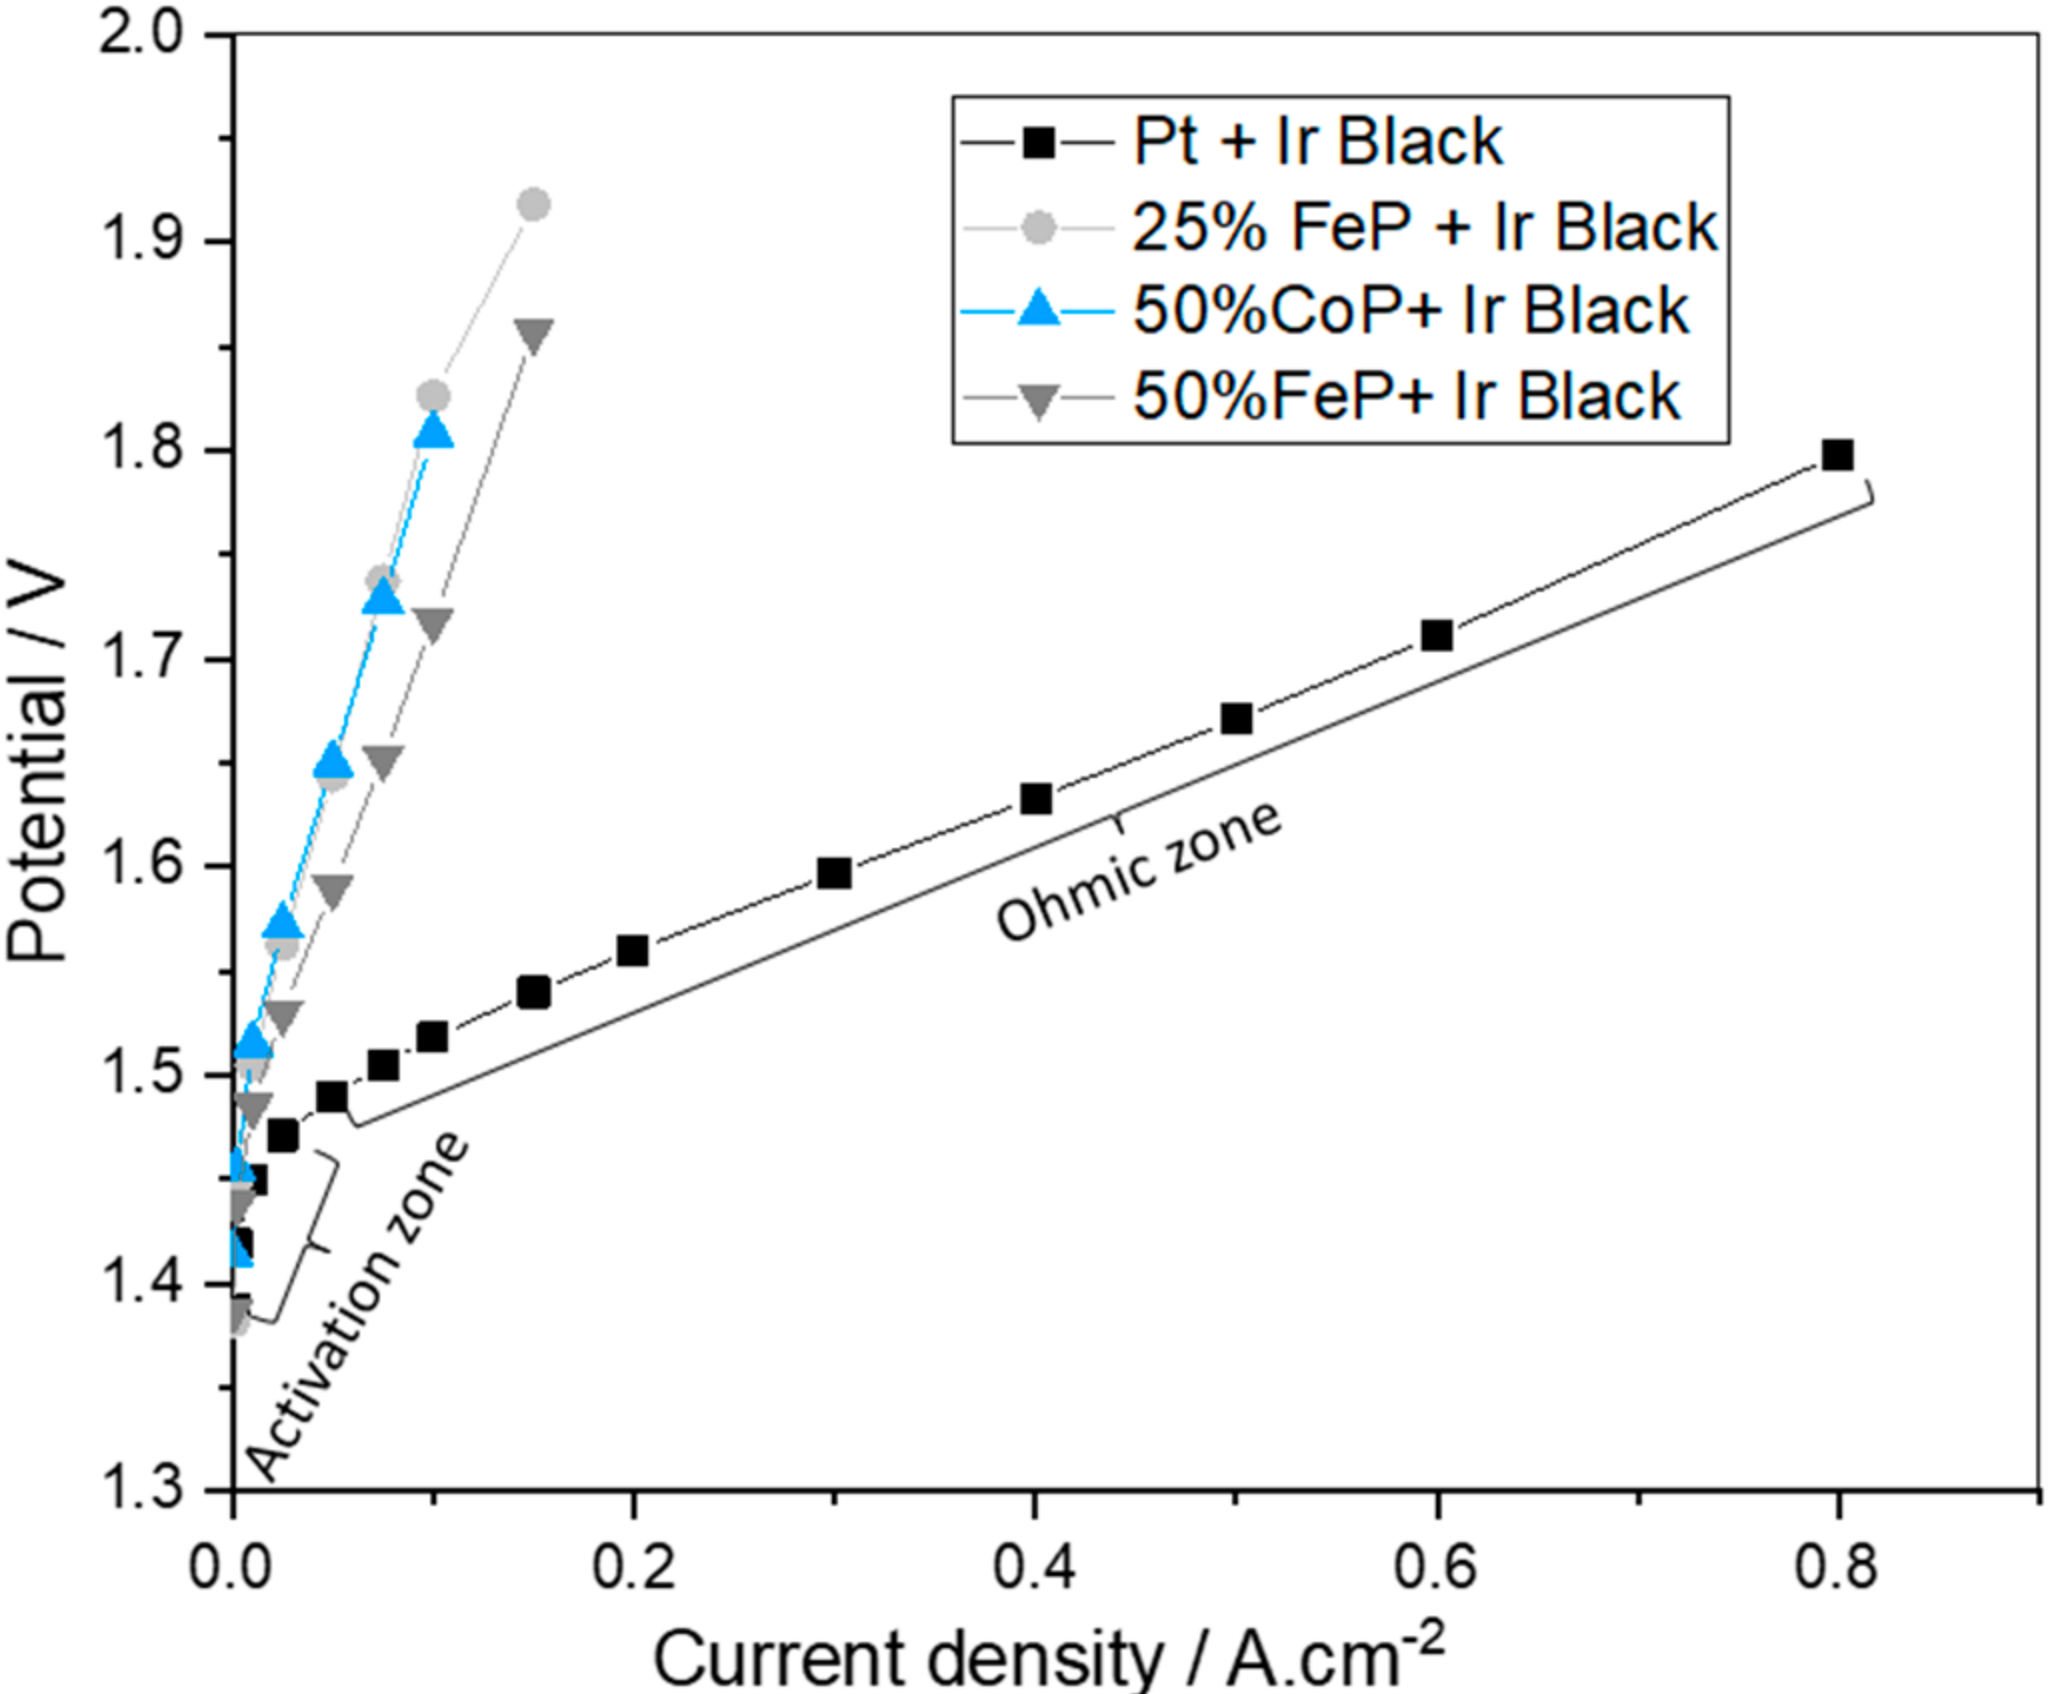
The results for the in situ polarization curves of the best-developed catalysts (25% FeP/CB, 50% FeP/CB and 50% CoP/CB) and the state-of-the-art Pt/CB catalyst for the HER coupled with Ir black as the OER catalyst are shown in Figure 8.

Figure 8.
Polarization curves of the best developed catalysts (25% FeP/CB, 50% FeP/CB and 50% CoP/CB) and the state-of-the-art Pt/CB catalyst for the HER coupled with Ir black as the OER catalyst.
In Figure 8, two different zones can be identified in the polarization curve: the activation and ohmic zones. The results obtained for the Pt/CB electrocatalyst show a logarithmic increase in the potential required for the initial phase (up to 10 mA cm−2), associated with the energy needed for reaction activation. In the ohmic zone, above 10 mA cm−2 a linear increase occurs originated by the protons and electrons movement and corresponding resistance. Analyzing the synthesized catalysts results, it is apparent that the polarization curves corresponding to the synthesized catalysts only present the zone corresponding to activation losses, indicating that catalyst activation is very slow. It was not possible to study the ohmic zone for the developed catalysts as potentials over 2 V can lead to system damage.
The Pt catalyst had the best catalytic performance (lower potential values for the same current density). This result validates the ex situ CV results and the literature values as Pt is considered the premier catalyst for the HER [28]. The overpotential at a current density of 10 mA cm−2 for the Pt membrane was 220 mV, close to the reported value of 197 mV [35]. Also, 50% FeP/CB has the best catalytic performance of all developed catalysts, suggesting that the presence of only the FeP crystalline phase in contrast with the presence of FeP and Fe2P crystalline phases for the 25% FeP/CB leads to a worse performance as reported in the literature [29]. Additionally, it further validates the FeP crystalline phase as having better characteristics than the CoP crystalline phase present in the 50% CoP/CB sample.
EIS is used to get a better understanding of the reaction process and performance- limiting factors in the membrane-electrode assemblies that are a core part of the PEMWE system [36]. EIS analysis is helpful to distinguish between ohmic and activation resistances [37]. The major disadvantage regarding EIS of PEM electrolysis system is that the response is affected by several parameters, such as the membrane type and thickness, the type of current collector, and others. Thus, the obtained results will only be compared with each other, and will provide a better notion of the complex phenomena occurring in a PEM system. The EIS results can be analyzed by modelling or fitting the impedance spectrum with an equivalent circuit. Depending on the characteristics and shape of each spectrum, different combinations of elements must be considered on the equivalent circuit (EEC) model [38]. EEC offers a useful tool to attest the data, whereas the circuit elements can be used to screen the relevant mechanisms occurring during the electrolysis process [36].
The impedance spectrum is usually represented as a Nyquist plot, where the imaginary part of the impedance is plotted against the real one. In Figure 9, the Nyquist graph for a potential of 1.445 V (activation phase) for the Pt/CB and 50% FeP/CB samples is presented.
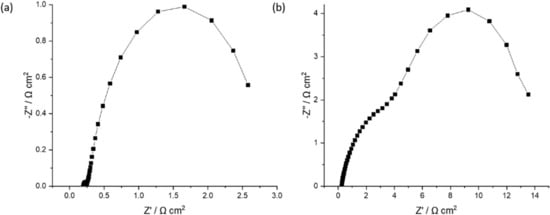
Figure 9.
Nyquist plot for a potential of 1.445 V (activation phase) for the (a) Pt/CB and (b) 50% FeP/CB samples.
As shown in Figure 9, at the high frequencies region (low real impedance), the imaginary impedance axis intercepts the real impedance one at a value representing ohmic losses (such as contact, ionic and electronic resistances). At medium frequencies, two arcs (partially overlapping) can be seen, representing activation losses due to the electrochemical reactions. For the Pt/CB sample, the first arc is smaller, indicating a low activation resistance when using the state-of-the-art material. The second arc probably corresponds to the activation of the OER, using Ir black catalyst, with a larger kinetic inhibition originated by the four-electron proton coupled mechanism, as referred in the Introduction section. For the 50% FeP/CB sample, the amplitude of the two arcs is considerably higher, indicating a significant increase in activation losses when using this catalyst.
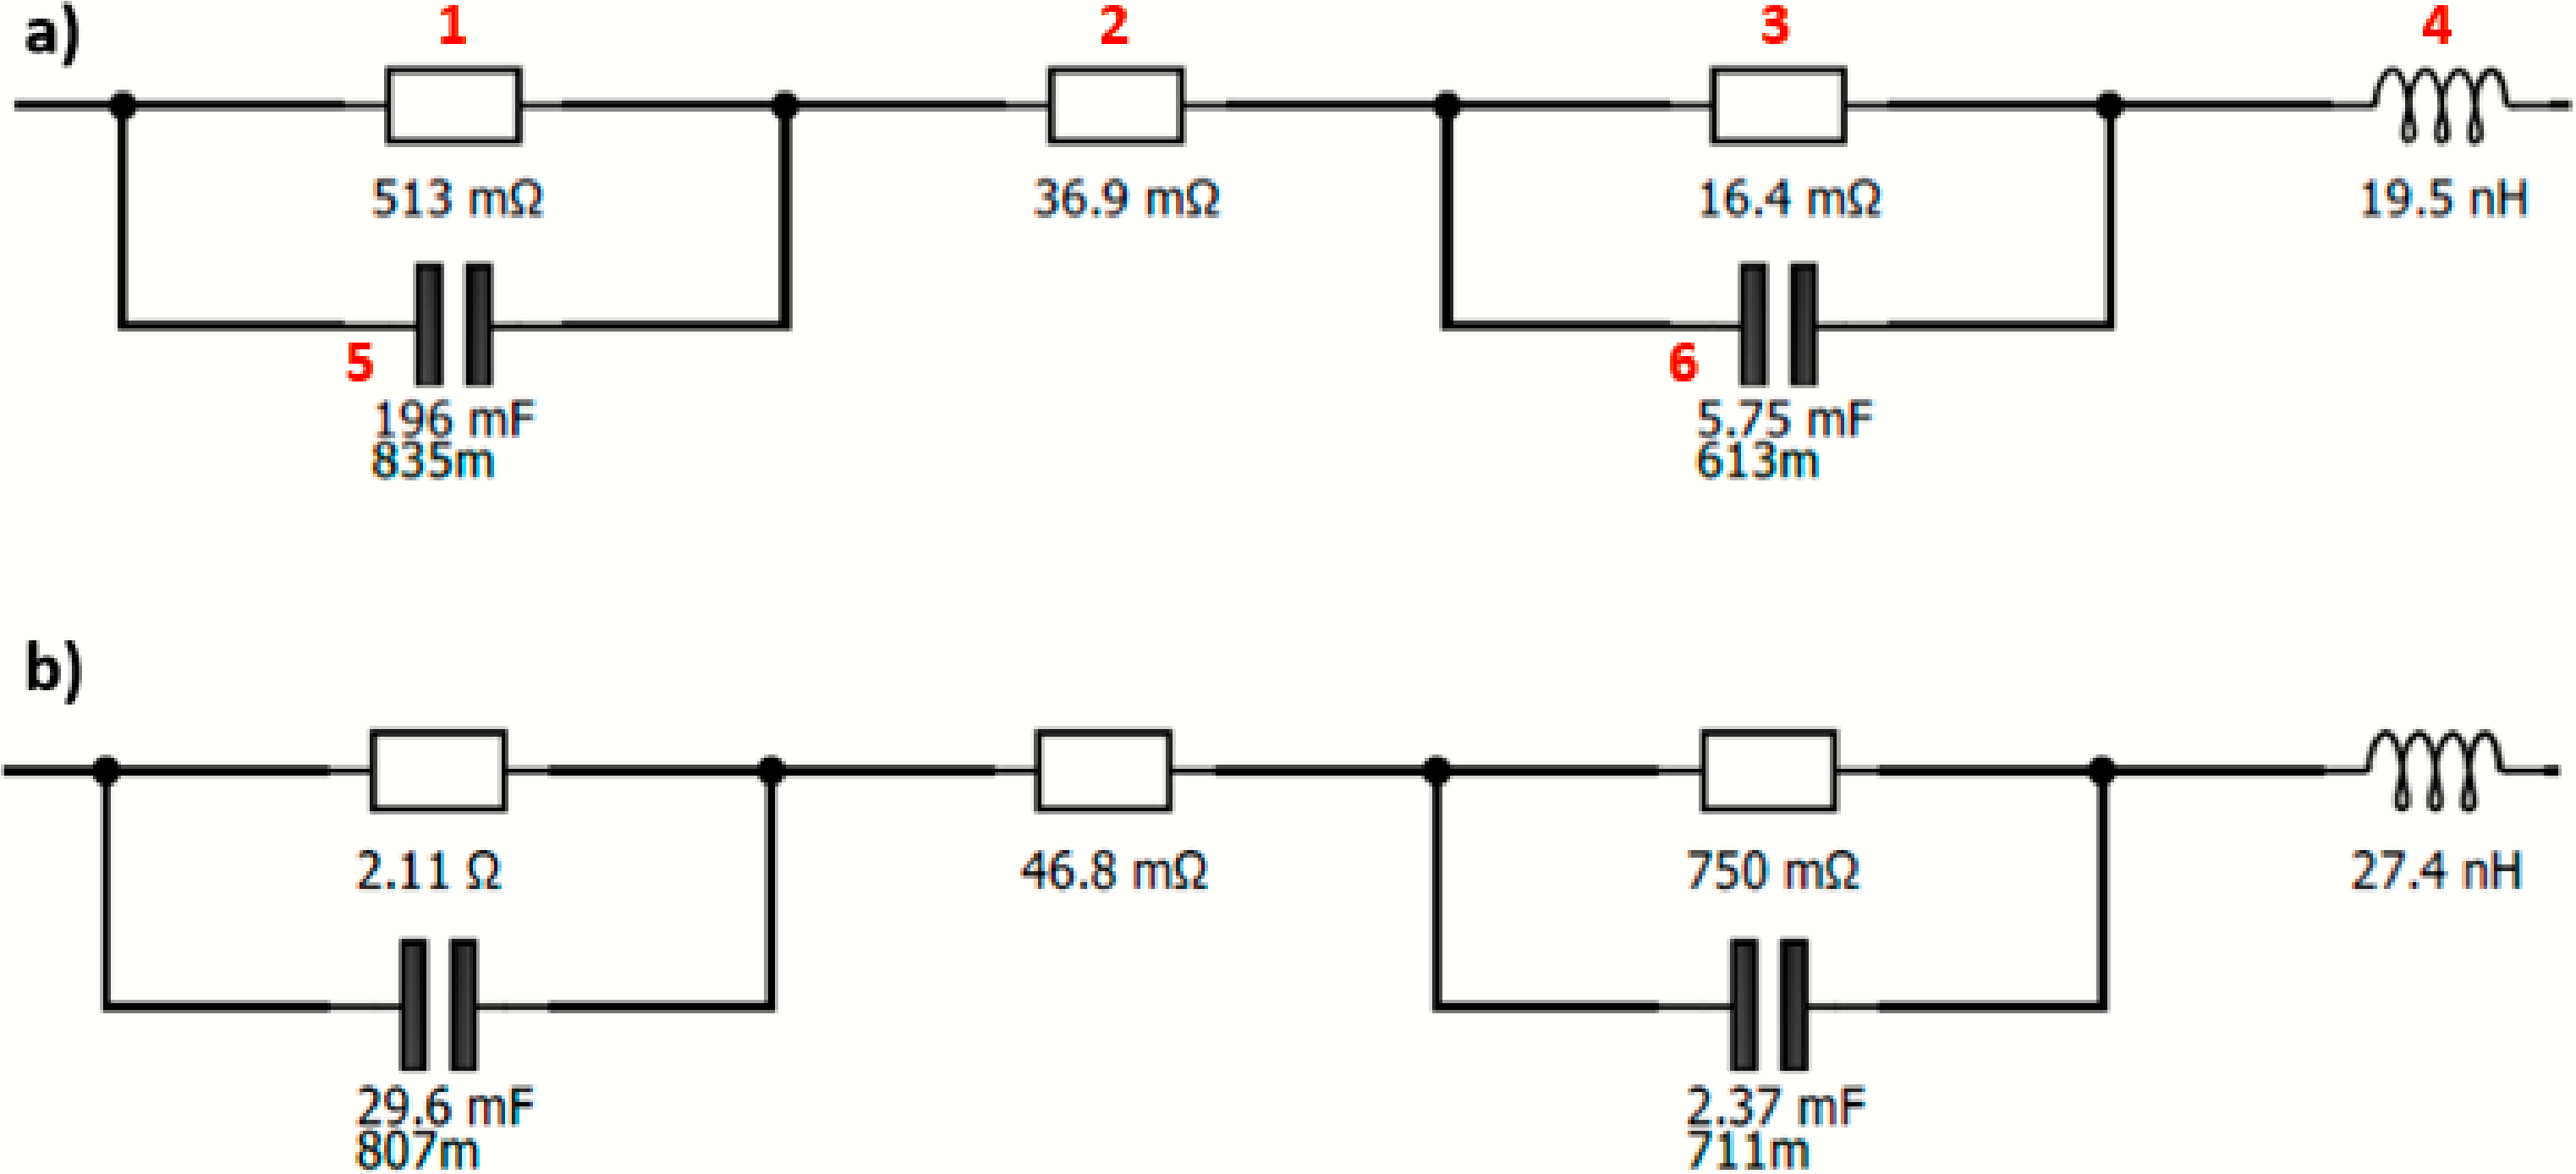
In Figure 10, the EEC is represented for the activation zone (1.445 V) for the 50% FeP and Ir black membrane and for the Pt/CB and Ir black membrane.
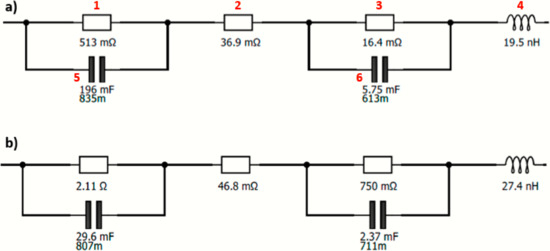
Figure 10.
EEC at 1.445 V for the (a) Pt/CB and Ir black membrane and (b) 50% FeP/CB and Ir black membrane.
This EEC is composed of two parallel combinations of a resistor (1, 3) and a constant-phase element (5, 6), respectively, representing the activation losses (RAct) corresponding to the HER and OER. In addition, another resistor (2) is needed to describe the ohmic resistances (ROhm). An inductor (4) is used to describe the wiring, connections and instrumental losses, not being relevant for the EEC analysis [38]. The EEC presented here is in accordance with the one proposed by Siracusano et al. [26] using a PEMWE cell (even with a different membrane and OER catalyst).
Analyzing Figure 10, the first and third resistances are the activation resistances, and the middle resistance is associated with the ohmic resistance. This system is quite helpful in analyzing the EIS spectra as it allows a proper fitting with associated errors.
In Table 5, the results for EIS analysis of the best-synthesized catalysts and Pt are shown.
Table 5.
Electrochemical impedance spectroscopy results for the best-developed catalysts and Pt.
The activation resistance is the sum of the first and third resistance, decreasing as the required potential increases. Analyzing Table 5, the Pt/CB sample has the lowest activation resistance, as expected, in accordance with polarization curves. Also, 50% FeP/CB in comparison with the other developed catalysts for both activation potentials (1.445 and 1.465 V) presents lower values, being in line with the polarization curves. The activation resistances decrease with an increase in the applied potential as we move further away from the activation phase. For all samples, the ohmic resistances remain constant through all the potential values, suggesting that the ohmic resistance is mainly associated with membrane properties.
4. Conclusions
Electrocatalysts consisting of transition metal phosphides supported on carbon black were successfully synthesized using a simplified approach to phosphorization, and evaluated in the hydrogen evolution reaction. The catalysts’ performance was correlated with their physico-chemical properties; as N2 adsorption–desorption equilibrium isotherms at −196 °C were executed to evaluate the electrocatalysts textural properties, TG analysis was performed to access the material thermal stability, and XRD was used to determine the crystalline phases present in all samples.
The synthesized electrocatalysts showed a good catalytic performance for the HER in the ex situ experiments, in particular the 25% FeP/CB, 50% FeP/CB and 50% CoP/CB samples with overpotentials of −156.0, −165.9 and −158.5 mV for a current density of 100 mA cm−2. These electrocatalysts have a Tafel slope in the range of the 120 mV dec−1, which indicates that the Volmer reaction is the RDS of the HER. Long-term stability was demonstrated for the 25% FeP/CB sample, with slight deactivation found for 50% FeP/CB. The phosphorization effect on the catalyst performance was also assessed, and it was shown that the non-phosphorized sample has worse catalytic performance as it needs higher potentials for the HER.
Regarding the PEMWE tests, the 50% FeP/CB had the best catalytic performance. Compared with the state-of-the-art Pt catalyst, the 50% FeP/CB required an overpotential for a current density of 10 mA cm−2 of 252 mV, quite close to the 220 mV of the Pt catalyst. This puts the 50% FeP/CB electrocatalysts in contention for possibly being an alternative for the HER, considering the ratio performance/cost. The EIS tests followed the same trend, as 50% FeP/CB showed the smallest activation resistance (after Pt), on a par with the in situ CV results.
In summary, this work shows that it can be possible to replace state-of-the-art Pt catalysts due to the TMP high catalytic activity, stability and price [5,35]. The benchmark Pt stability is around 50 h for 10 mA cm−2, a lower stability than developed catalysts, more than 60 h [13]. Also, this work provides a proper approach to the synthesis of TMP supported on carbon materials for the HER, paving the way for further research of these materials for the desired replacement of the PGM currently present in PEMWE.
Author Contributions
Conceptualization, J.R., J.P.S.S., D.S.F. and O.S.G.P.S.; Funding acquisition, J.P.S.S., A.M.F.R.P., M.F.R.P. and O.S.G.P.S.; Investigation, J.B., N.C.M.S. and A.R.; Methodology, J.R., J.P.S.S., D.S.F. and O.S.G.P.S.; Resources, J.P.S.S., A.M.F.R.P., M.F.R.P. and O.S.G.P.S.; Supervision, J.R., D.S.F. and O.S.G.P.S.; Writing—original draft, João Brito; Writing—review & editing, J.R., J.P.S.S., D.S.F., A.M.F.R.P., M.F.R.P. and O.S.G.P.S. All authors have read and agreed to the published version of the manuscript.
Funding
This paper is a result of the project “HyGreen&LowEmissions—Tackling Climate Change Impacts: the role of Green Hydrogen production, storage and use, together with low emissions energy systems”, with the reference NORTE-01-0145-FEDER-000077, supported by Norte Portugal Regional Operational Programme (NORTE 2020), under the PORTUGAL 2020 Partnership Agreement, through the European Regional Development Fund (ERDF). This research was financially supported by PTDC/EQU-EQU/1707/2020, funded by FCT and by LA/P/0045/2020 (ALiCE), UIDB/00532/2020 and UIDP/00532/2020 (CEFT), UIDB/50020/2020 and UIDP/50020/2020 (LSRE-LCM) funded by national funds through FCT/MCTES (PIDDAC).

Institutional Review Board Statement
Not applicable.
Informed Consent Statement
Not applicable.
Conflicts of Interest
The authors declare no conflict of interest.
References
- Kumar, S.S.; Himabindu, V. Hydrogen production by PEM water electrolysis—A review. Mater. Sci. Energy Technol. 2019, 2, 442–454. [Google Scholar] [CrossRef]
- Electricity. Our World in Data. 2021. Available online: https://ourworldindata.org/electricity-mix (accessed on 14 June 2021).
- BP Statistical Review of World Energy 2018. Available online: https://www.bp.com/content/dam/bp/business-sites/en/global/corporate/pdfs/energy-economics/statistical-review/bp-stats-review-2018-full-report.pdf (accessed on 14 June 2021).
- Nikolaidis, P.; Poullikkas, A. A comparative overview of hydrogen production processes. Renew. Sustain. Energy Rev. 2017, 67, 597–611. [Google Scholar] [CrossRef]
- Callejas, J.F.; Read, C.G.; Roske, C.W.; Lewis, N.S.; Schaak, R.E. Synthesis, Characterization, and Properties of Metal Phosphide Catalysts for the Hydrogen-Evolution Reaction. Chem. Mater. 2016, 28, 6017–6044. [Google Scholar] [CrossRef]
- Dou, Y.; Sun, L.; Ren, J.; Dong, L. Opportunities and future challenges in hydrogen economy for sustainable development. In Hydrogen Economy: Supply Chain, Life Cycle Analysis and Energy Transition for Sustainability; Elsevier: Amsterdam, The Netherlands, 2017; pp. 277–305. [Google Scholar]
- Contaldi, M.; Gracceva, F.; Mattucci, A. Hydrogen perspectives in Italy: Analysis of possible deployment scenarios. Int. J. Hydrogen Energy 2008, 33, 1630–1642. [Google Scholar] [CrossRef]
- Abbasi, T.; Abbasi, S. ‘Renewable’ hydrogen: Prospects and challenges. Renew. Sustain. Energy Rev. 2011, 15, 3034–3040. [Google Scholar] [CrossRef]
- States, M. What is CertifHy: CertifHy Aims to Develop the 1st European-Wide Green and Low Carbon Hydrogen GO Scheme One Definition of Green and Low Carbon Hydrogen throughout Europe Gives Confidence to Consumers and Will Allow Green H2 Uptake: A Common Agreement. 2018, pp. 1–17. Available online: https://www.fch.europa.eu/sites/default/files/CertifHy_AWP2018_Compliance_verification_V1.pdf (accessed on 20 February 2022).
- Ursua, A.; Gandia, L.M.; Sanchis, P. Hydrogen Production from Water Electrolysis: Current Status and Future Trends. Proc. IEEE 2012, 100, 410–426. [Google Scholar] [CrossRef]
- Xu, W.; Scott, K. The effects of ionomer content on PEM water electrolyser membrane electrode assembly performance. Int. J. Hydrogen Energy 2010, 35, 12029–12037. [Google Scholar] [CrossRef]
- Sun, H.; Liu, H.; Nie, M.; Zhao, Z.; Xue, Z.; Liao, J.; Xue, F.; Zhang, S.; Wu, M.; Gao, T. Synthesis and hydrogen evolution reaction of nanosized Ag–ZnO coated MoS2. Ceram. Int. 2021, 47, 13994–14000. [Google Scholar] [CrossRef]
- Hughes, J.P.; Clipsham, J.; Chavushoglu, H.; Rowley-Neale, S.J.; Banks, C.E. Polymer electrolyte electrolysis: A review of the activity and stability of non-precious metal hydrogen evolution reaction and oxygen evolution reaction catalysts. Renew. Sustain. Energy Rev. 2021, 139, 110709. [Google Scholar] [CrossRef]
- Zhang, S.; Zhang, X.; Rui, Y.; Wang, R.; Li, X. Recent advances in non-precious metal electrocatalysts for pH-universal hydrogen evolution reaction. Green Energy Environ. 2020, 6, 458–478. [Google Scholar] [CrossRef]
- Wang, Y.; Yan, D.; El Hankari, S.; Zou, Y.; Wang, S. Recent Progress on Layered Double Hydroxides and Their Derivatives for Electrocatalytic Water Splitting. Adv. Sci. 2018, 5, 1800064. [Google Scholar] [CrossRef] [PubMed]
- Li, Y.; Li, R.; Wang, D.; Xu, H.; Meng, F.; Dong, D.; Jiang, J.; Zhang, J.; An, M.; Yang, P. A review: Target-oriented transition metal phosphide design and synthesis for water splitting. Int. J. Hydrogen Energy 2020, 46, 5131–5149. [Google Scholar] [CrossRef]
- Abbas, M.A.; Bang, J.H. Rising Again: Opportunities and Challenges for Platinum-Free Electrocatalysts. Chem. Mater. 2015, 27, 7218–7235. [Google Scholar] [CrossRef]
- Yan, Y.; Shi, X.; Miao, M.; He, T.; Dong, Z.H.; Zhan, K.; Yang, J.H.; Zhao, B.; Xia, B.Y. Bio-inspired design of hierarchical FeP nanostructure arrays for the hydrogen evolution reaction. Nano Res. 2017, 11, 3537–3547. [Google Scholar] [CrossRef]
- Yang, X.; Lu, A.-Y.; Zhu, Y.; Min, S.; Hedhili, M.N.; Han, Y.; Huang, K.-W.; Li, L.-J. Rugae-like FeP nanocrystal assembly on a carbon cloth: An exceptionally efficient and stable cathode for hydrogen evolution. Nanoscale 2015, 7, 10974–10981. [Google Scholar] [CrossRef] [PubMed] [Green Version]
- Yang, J.; Zhang, Y.; Sun, C.; Liu, H.; Li, L.; Si, W.; Huang, W.; Yan, Q.; Dong, X. Graphene and cobalt phosphide nanowire composite as an anode material for high performance lithium-ion batteries. Nano Res. 2016, 9, 612–621. [Google Scholar] [CrossRef]
- Wang, X.; Kolen’Ko, Y.V.; Bao, X.-Q.; Kovnir, K.; Liu, L. One-Step Synthesis of Self-Supported Nickel Phosphide Nanosheet Array Cathodes for Efficient Electrocatalytic Hydrogen Generation. Angew. Chem. Int. Ed. 2015, 54, 8188–8192. [Google Scholar] [CrossRef] [PubMed]
- Miles, M.H.; Thomason, M.A. Periodic Variations of Overvoltages for Water Electrolysis in Acid Solutions from Cyclic Voltammetric Studies. J. Electrochem. Soc. 1976, 123, 1459–1461. [Google Scholar] [CrossRef]
- Platinum Price. Available online: http://www.platinum.matthey.com/prices/price-charts# (accessed on 27 July 2021).
- Trading Economics—Commodities. Available online: https://tradingeconomics.com/commodities (accessed on 27 July 2021).
- King, L.A.; Hubert, M.A.; Capuano, C.; Manco, J.; Danilovic, N.; Valle, E.; Hellstern, T.R.; Ayers, K.; Jaramillo, T.F. A non-precious metal hydrogen catalyst in a commercial polymer electrolyte membrane electrolyser. Nat. Nanotechnol. 2019, 14, 1071–1074. [Google Scholar] [CrossRef]
- Infantes-Molina, A.; Cecilia, J.; Pawelec, B.; Fierro, J.; Rodríguez-Castellón, E.; Jiménez-López, A. Ni2P and CoP catalysts prepared from phosphite-type precursors for HDS–HDN competitive reactions. Appl. Catal. A Gen. 2010, 390, 253–263. [Google Scholar] [CrossRef]
- Kucernak, A.R.J.; Sundaram, V.N.N. Nickel phosphide: The effect of phosphorus content on hydrogen evolution activity and corrosion resistance in acidic medium. J. Mater. Chem. A 2014, 2, 17435–17445. [Google Scholar] [CrossRef] [Green Version]
- Moon, J.; Jang, J.-H.; Kim, E.-G.; Chung, Y.-H.; Yoo, S.J.; Lee, Y.-K. The nature of active sites of Ni2P electrocatalyst for hydrogen evolution reaction. J. Catal. 2015, 326, 92–99. [Google Scholar] [CrossRef]
- Owens-Baird, B.; Kolen’Ko, Y.V.; Kovnir, K. Structure–Activity Relationships for Pt-Free Metal Phosphide Hydrogen Evolution Electrocatalysts. Chem. A Eur. J. 2017, 24, 7298–7311. [Google Scholar] [CrossRef] [PubMed]
- Parra-Puerto, A.; Ng, K.L.; Fahy, K.; Goode, A.E.; Ryan, M.P.; Kucernak, A. Supported Transition Metal Phosphides: Activity Survey for HER, ORR, OER, and Corrosion Resistance in Acid and Alkaline Electrolytes. ACS Catal. 2019, 9, 11515–11529. [Google Scholar] [CrossRef]
- Park, H.; Encinas, A.; Scheifers, J.P.; Zhang, Y.; Fokwa, B.P.T. Boron-Dependency of Molybdenum Boride Electrocatalysts for the Hydrogen Evolution Reaction. Angew. Chem. Int. Ed. 2017, 56, 5575–5578. [Google Scholar] [CrossRef] [PubMed]
- Schipper, D.E.; Zhao, Z.; Thirumalai, H.; Leitner, A.P.; Donaldson, S.L.; Kumar, A.; Qin, F.; Wang, Z.; Grabow, L.C.; Bao, J.; et al. Effects of Catalyst Phase on the Hydrogen Evolution Reaction of Water Splitting: Preparation of Phase-Pure Films of FeP, Fe2P, and Fe3P and Their Relative Catalytic Activities. Chem. Mater. 2018, 30, 3588–3598. [Google Scholar] [CrossRef] [Green Version]
- Popczun, E.J.; Read, C.G.; Roske, C.W.; Lewis, N.S.; Schaak, R.E. Highly Active Electrocatalysis of the Hydrogen Evolution Reaction by Cobalt Phosphide Nanoparticles. Angew. Chem. Int. Ed. 2014, 53, 5427–5430. [Google Scholar] [CrossRef] [PubMed]
- Amorim, I.; Xu, J.; Zhang, N.; Xiong, D.; Thalluri, S.; Thomas, R.; Sousa, J.; Araújo, A.; Li, H.; Liu, L. Bi-metallic cobalt-nickel phosphide nanowires for electrocatalysis of the oxygen and hydrogen evolution reactions. Catal. Today 2019, 358, 196–202. [Google Scholar] [CrossRef]
- Sapountzi, F.M.; Orlova, E.D.; Sousa, J.P.S.; Salonen, L.M.; Lebedev, O.I.; Zafeiropoulos, G.; Tsampas, M.N.; Niemantsverdriet, H.J.W.; Kolen’ko, Y.V. FeP Nanocatalyst with Preferential (010) Orientation Boosts the Hydrogen Evolution Reaction in Polymer-Electrolyte Membrane Electrolyzer. Energy Fuels 2020, 34, 6423–6429. [Google Scholar] [CrossRef]
- Siracusano, S.; Trocino, S.; Briguglio, N.; Baglio, V.; Aricò, A.S. Electrochemical Impedance Spectroscopy as a Diagnostic Tool in Polymer Electrolyte Membrane Electrolysis. Materials 2018, 11, 1368. [Google Scholar] [CrossRef] [PubMed] [Green Version]
- Yu, F.; Dai, X.; Beebe, T.; Hsiai, T. Electrochemical impedance spectroscopy to characterize inflammatory atherosclerotic plaques. Biosens. Bioelectron. 2011, 30, 165–173. [Google Scholar] [CrossRef] [PubMed] [Green Version]
- Pinto, A.; Oliveira, V.B.; Falcao, D. Experimental methods of characterization. In Direct Alcohol Fuel Cells for Portable Applications; Alexandra, D.S.F., Pinto, M.F.R., Oliveira, V.B., Eds.; Academic Press: Cambridge, MA, USA, 2018; pp. 113–155. [Google Scholar]

Publisher’s Note: MDPI stays neutral with regard to jurisdictional claims in published maps and institutional affiliations. |
© 2022 by the authors. Licensee MDPI, Basel, Switzerland. This article is an open access article distributed under the terms and conditions of the Creative Commons Attribution (CC BY) license (https://creativecommons.org/licenses/by/4.0/).