
Power Generation Performance Indicators of Wind Farms Including the Influence of Wind Energy Resource Differences

Abstract
:1. Introduction
- (1)
- The existing improved indicators have different emphases and application scenarios, which can only reflect partial characteristics of wind farms and fail in the comprehensive evaluation of power generation performance of wind farms.
- (2)
- The existing evaluation indicator systems have problems such as confusion, coupling and broadness, and the influence of wind energy resource differences could not be effectively eliminated, which makes it difficult to achieve the fair comparison of power generation performance among different wind farms.
- (3)
- The existing evaluation indicator systems cannot trace the causes of wind farm power generation performance loss, which is difficult to effectively guide the technical transformation and operation and maintenance management of wind farms.
- (1)
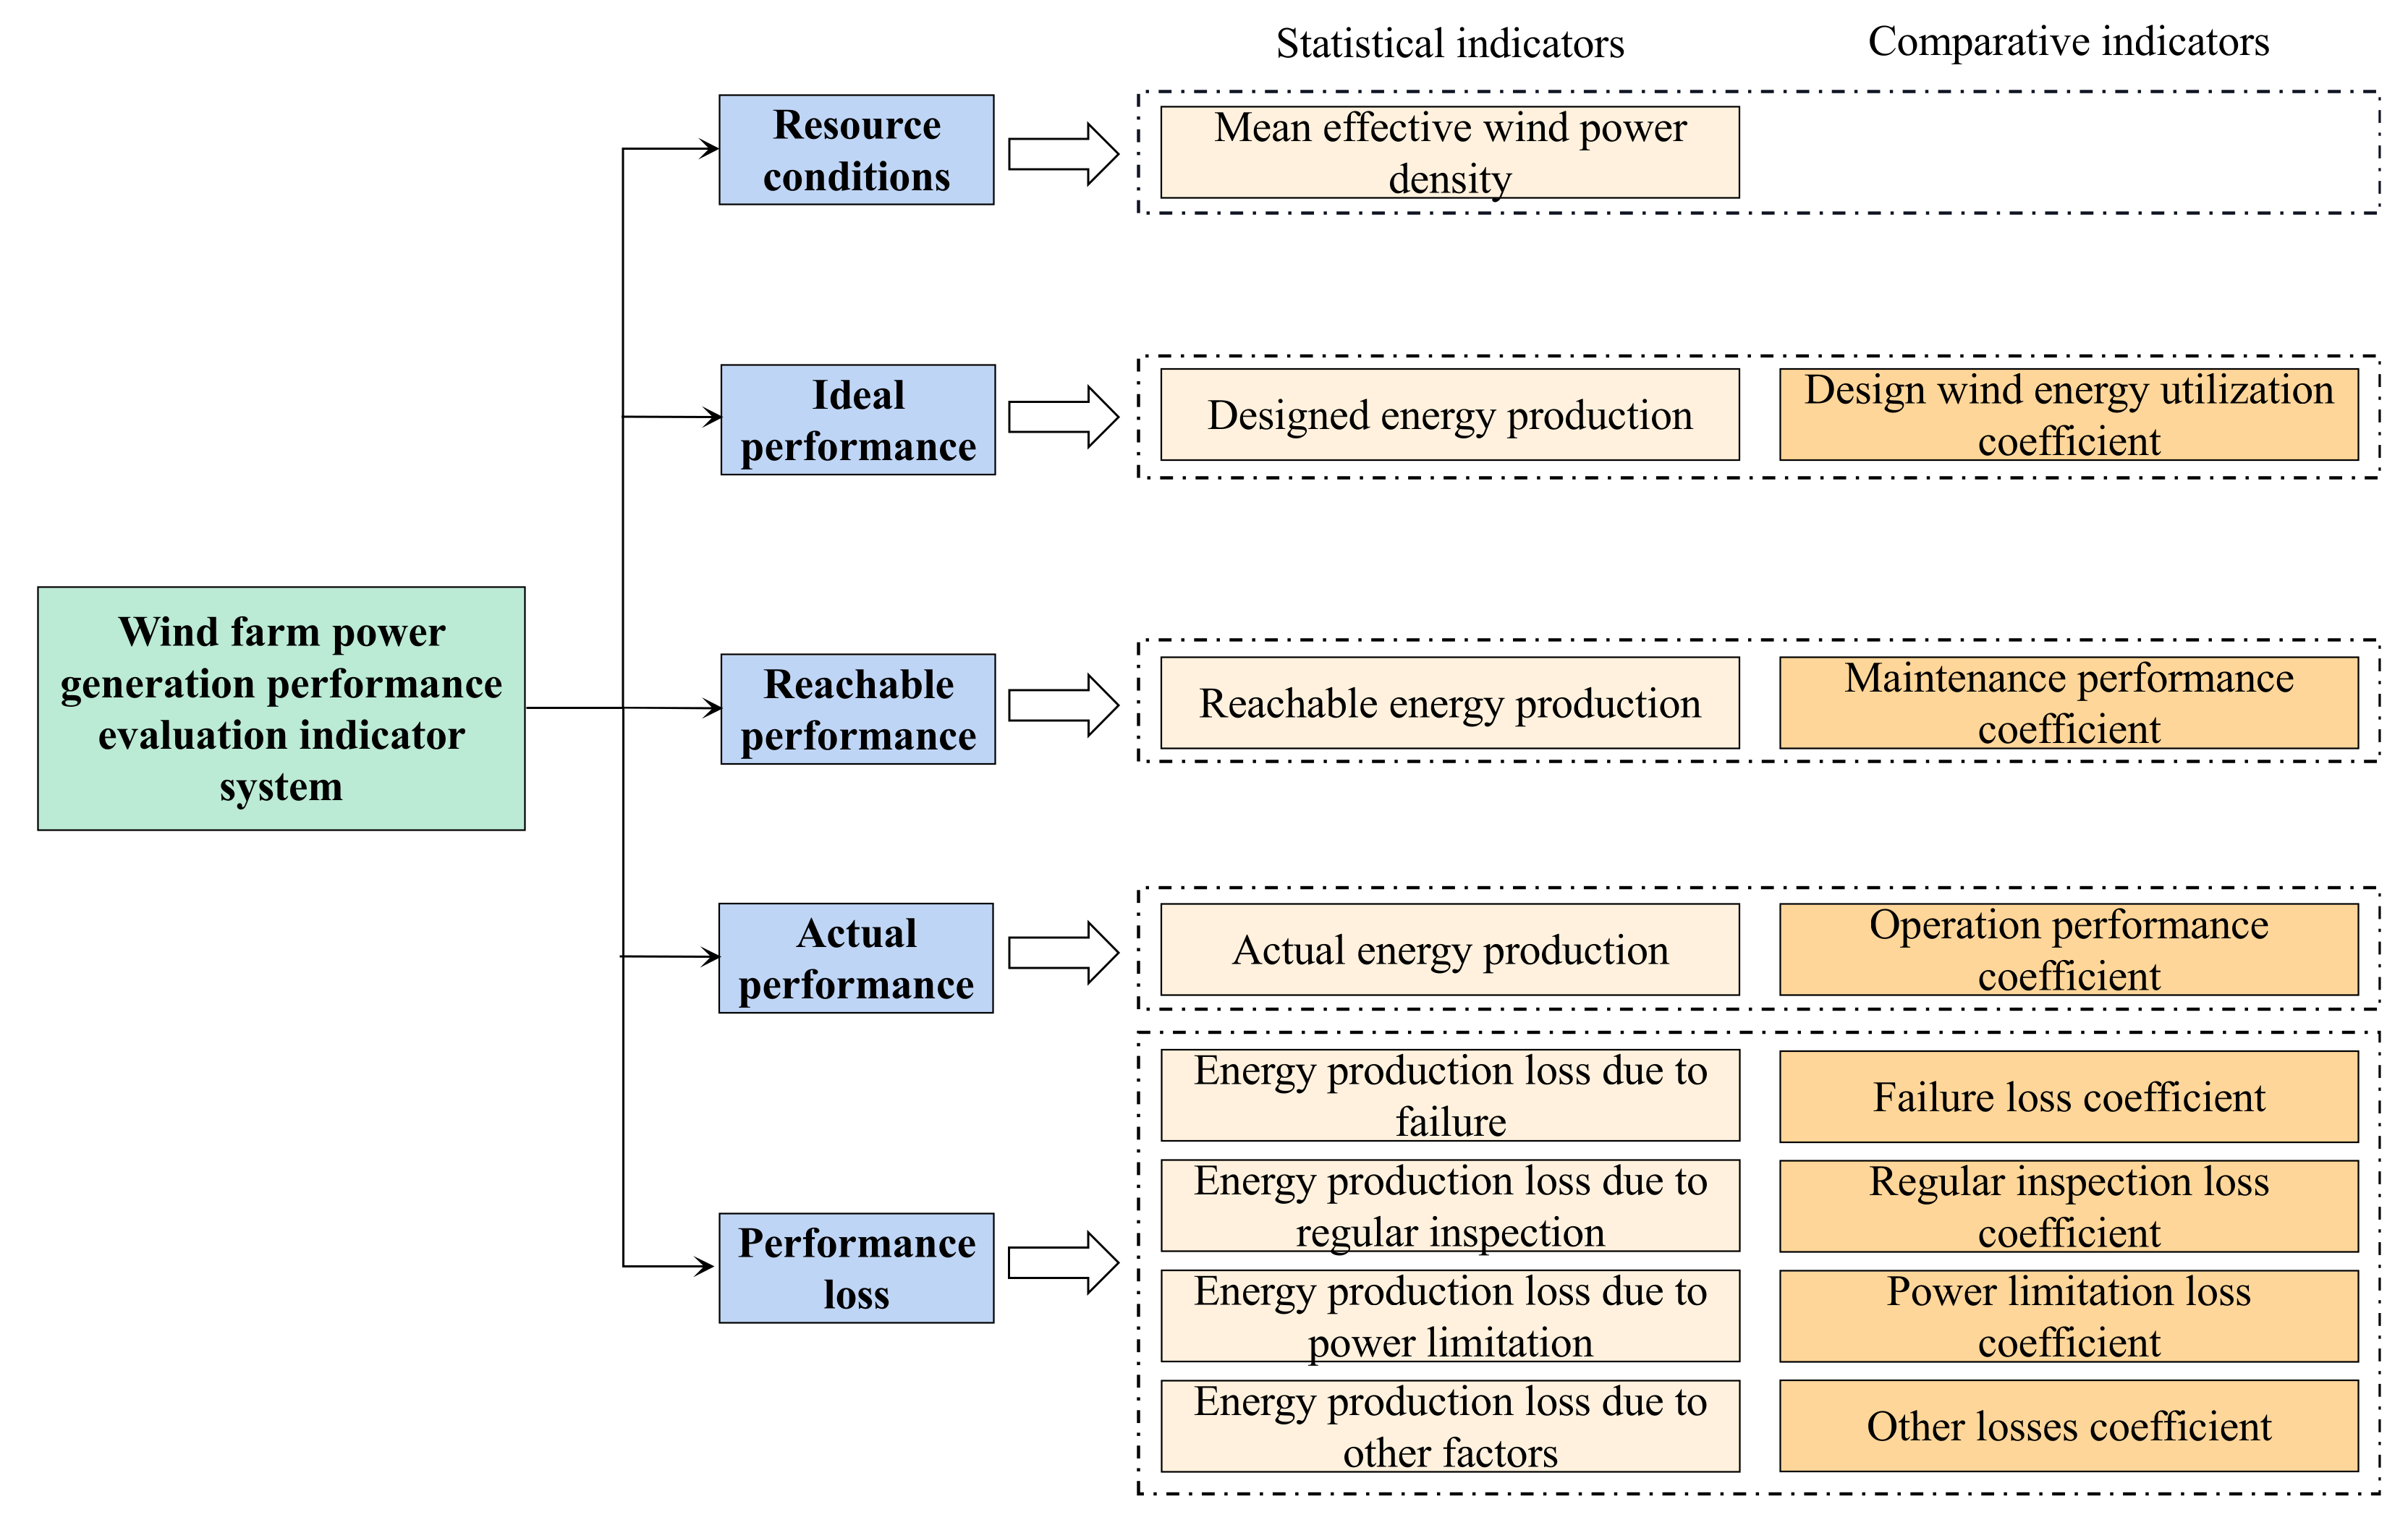
- The indicator system including new concepts such as resource conditions, ideal performance, reachable performance, actual performance, and performance loss is constructed, which are not cross coupled in functional characteristics and can maintain the independence, hence realize the quantitative evaluation of wind farm design, operation, and maintenance.
- (2)
- The comparative indicators based on the wind energy resource and design level of wind farms are proposed, which can effectively eliminate the influence of wind energy resource and design levels differences and achieve the fair comparison of power generation performance among different wind farms.
- (3)
- The refined performance loss indicators are proposed in a targeted manner to trace the source of power generation performance loss and guide the technical transformation and operation and maintenance management of wind farms.
- (4)
- The comprehensive evaluation method of wind farm power generation performance based on improved CRITIC weighting method is proposed to overcome the uneven situation of different evaluation indicators and realize the comprehensive comparison of power generation performance among different wind farms.
2. Wind Farm Power Generation Performance Evaluation Indicator System
2.1. The Design Principle of Indicator System
- (1)
- Purpose. The design purpose of indicator system is the prerequisite and foundation for the existence of indicator system. The construction of any indicator system must have a clear design purpose, and the selected evaluation indicators and the constructed indicator system must meet the purpose of wind farm power generation performance evaluation.
- (2)
- Science. The design of the indicator system must follow the actual situation of wind farms, which can not only objectively and effectively reflect the power generation performance level and development trend of wind farms but also conform to the scientific theory and objective facts that have been proved by practice.
- (3)
- Independence. The selected indicators should comprehensively reflect the power generation performance level of wind farms. The logical relationship among various indicators shall be ensured. Besides, they should be independent of each other to avoid cross coupling of information.
- (4)
- Operability. The definitions and calculation methods of indicators should be simple and easy to understand and quantify. The basic data used for indicators calculation should be easy to obtain in order to make a definite quantitative evaluation of wind farms power generation performance.
- (5)
- Comparability. The impact of external conditions shall be considered in the comparison of power generation performance among different wind farms due to the difference in wind energy resource, terrain, and wind turbine type of different wind farms. Therefore, the selected comparative indicators should be reasonable, fair, and comparable to facilitate the fair comparison of power generation performance among different wind farms.
2.2. The Structure Design of Indicator System
2.3. Definitions and Calculation Methods of Indicator
2.3.1. The Indicators of Resource Conditions
2.3.2. The Indicators of Ideal Performance
- (1)
- DEP
- (2)
- DWEUC
2.3.3. The Indicators of Reachable Performance
- (1)
- REP
- (2)
- MPC
2.3.4. The Indicators of Actual Performance
- (1)
- AEP
- (2)
- OPC
2.3.5. The Indicators of Performance Loss
- (1)
- Failure loss
- (2)
- Regular inspection loss
- (3)
- Power limitation loss
- (4)
- Other losses
3. Comprehensive Evaluation Method of Wind Farm Power Generation Performance Based on Improved CRITIC Weighting Method
3.1. Improved CRITIC Weighting Method
- (1)
- Establishment of the initial evaluation matrix
- (2)
- Normalization of the initial evaluation matrix by relative deterioration degree
- (3)
- Calculation of the contrast strength of each evaluation indicator
- (4)
- Calculation of the correlation coefficient and quantitative conflict index between the evaluation indicators
- (5)
- Calculation of the constant weight values of the evaluation indicators
- (6)
- Calculation of the variable weight values of the evaluation indicators by variable weight theory
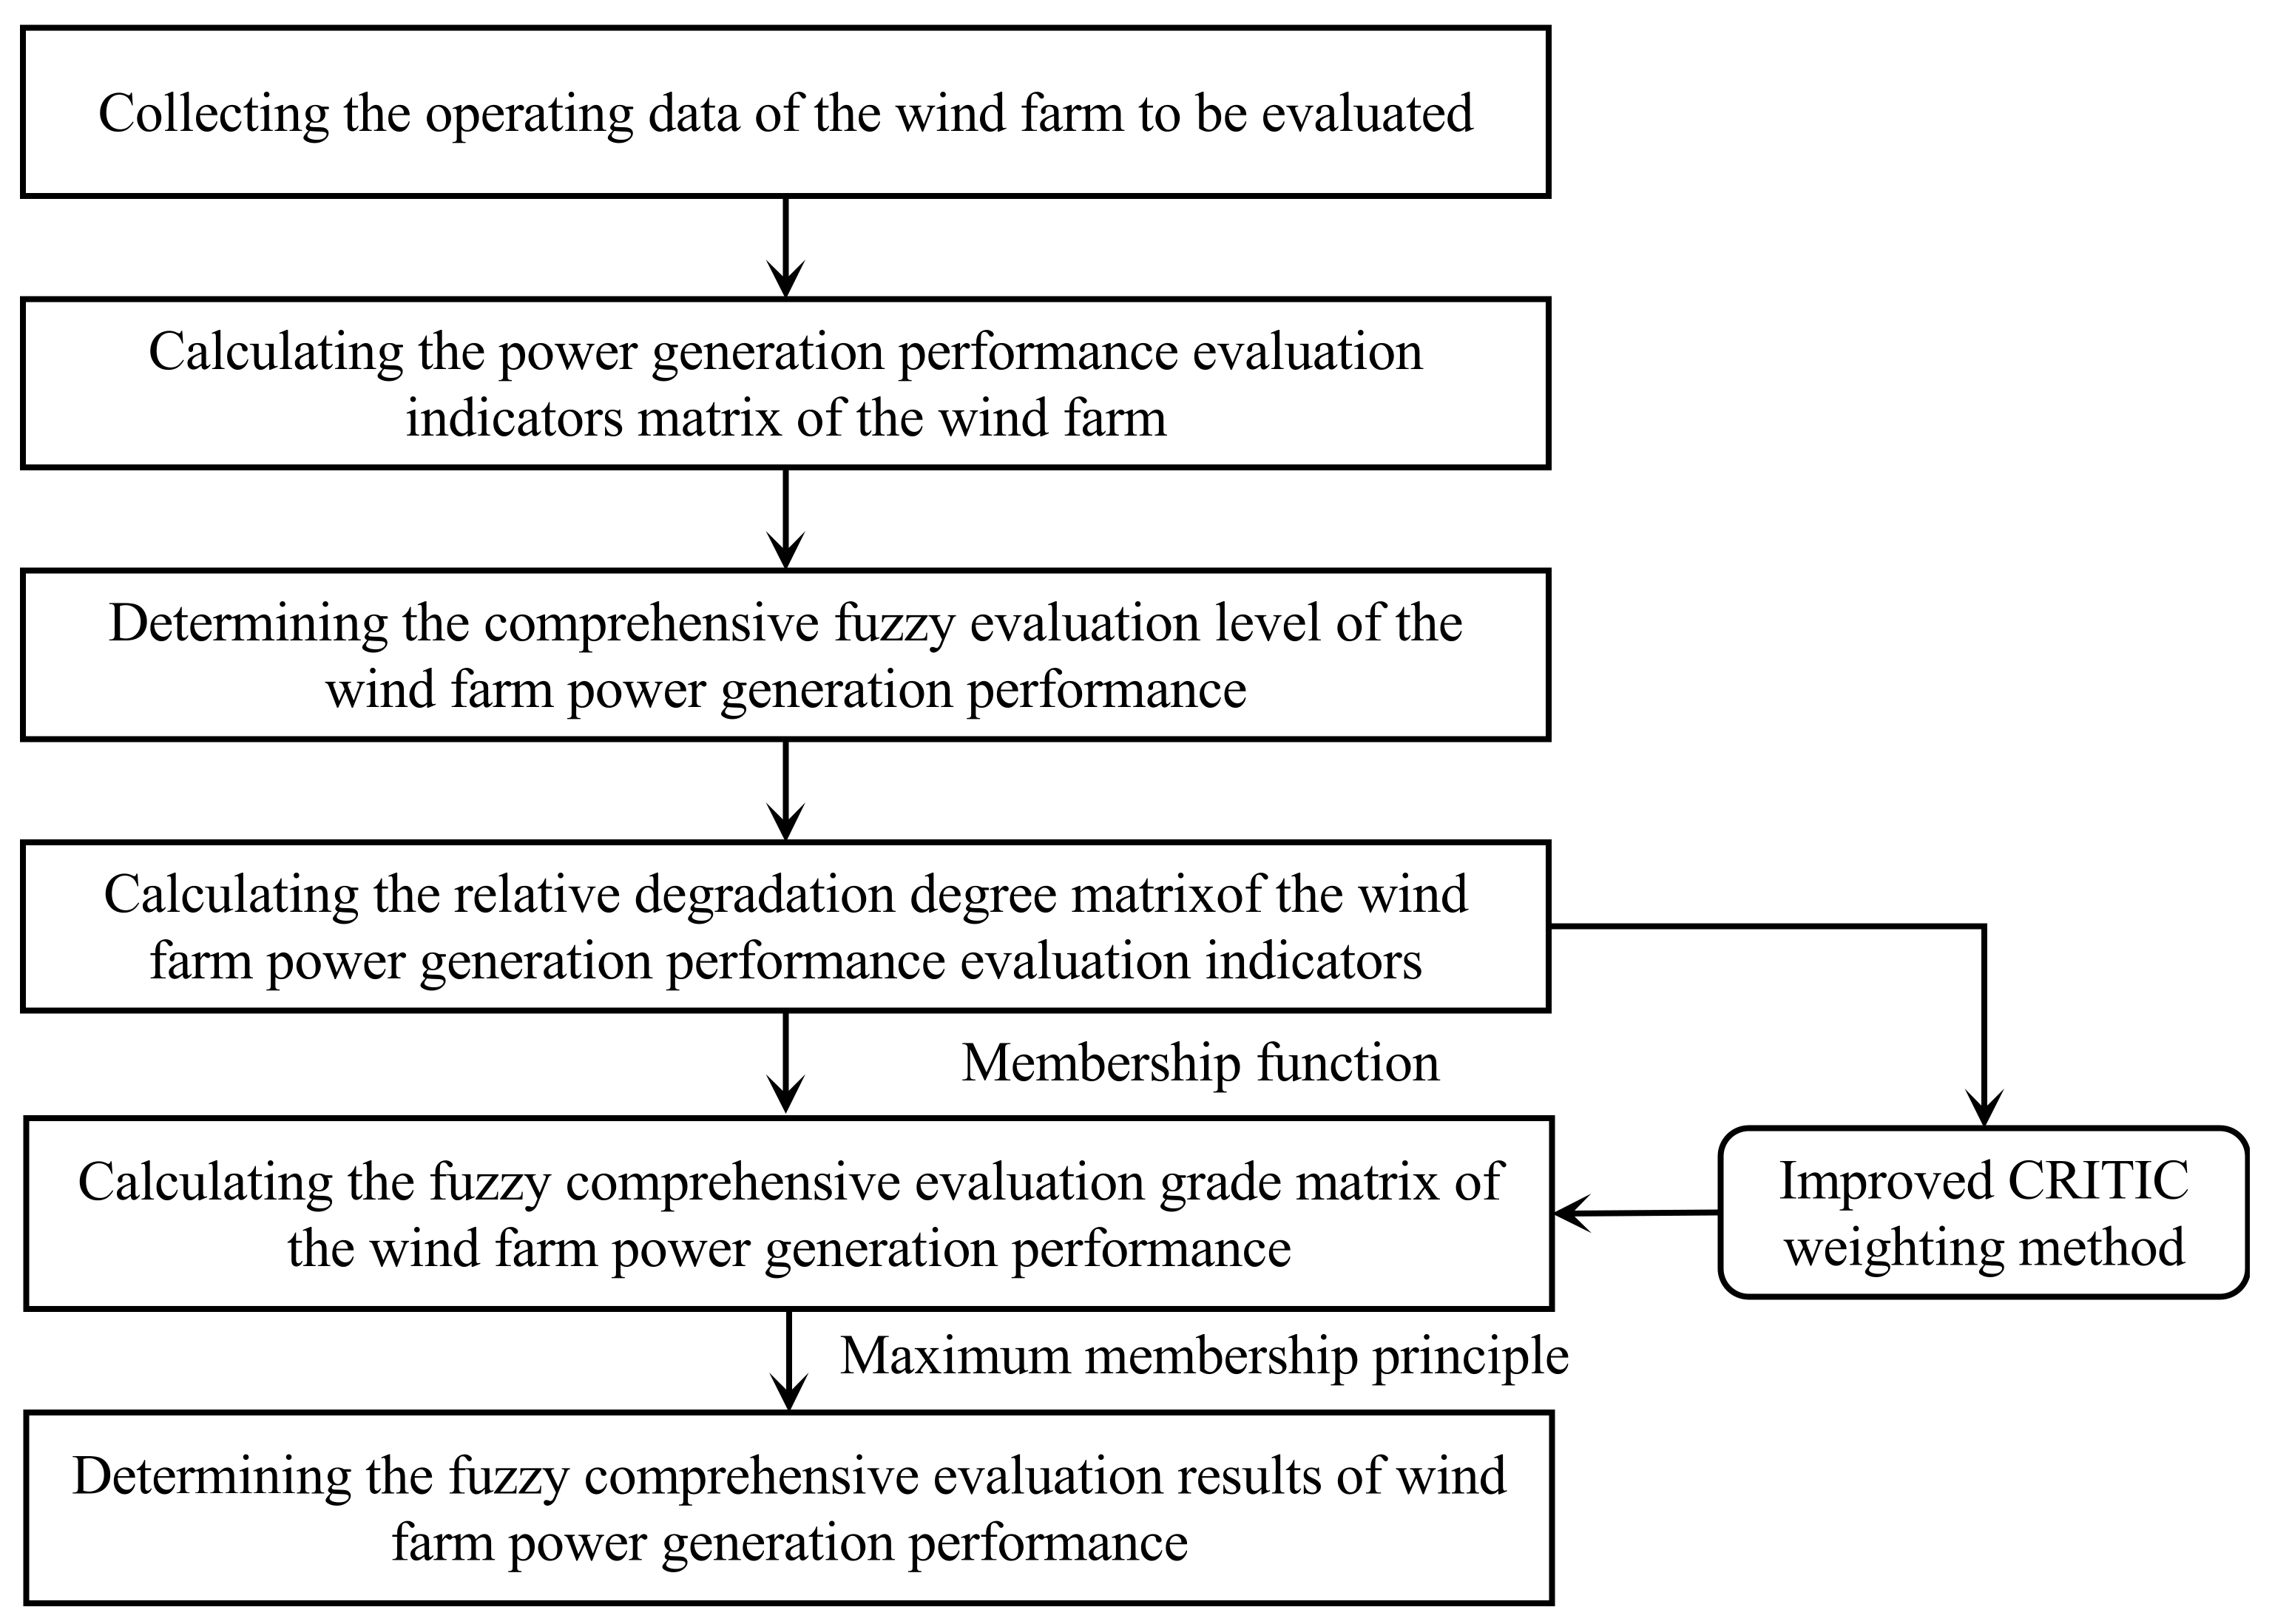
3.2. Modeling Process
- (1)
- Collecting the operating data of the wind farm to be evaluated, which mainly includes wind farm operation management system data, wind farm AGC system data (if any), wind turbine SCADA system data, anemometer tower data, wind turbine nacelle transfer function or lidar wind data, wind turbine design parameters (such as designed wind turbine power curve, hub height, rotor radius, etc.).
- (2)
- Calculating the power generation performance evaluation indicators matrix of the wind farm, which mainly includes six comparative indicators such as the DWEUC, MPC, FLC, RILC, PLLC, and OLC.
- (3)
- Determining the comprehensive fuzzy evaluation level of the wind farm power generation performance, which is mainly divided as . Among which, the larger the value n is, the more detailed the evaluation object is, and the more it can reflect the fuzziness and gradual change of the fuzzy evaluation. However, the greater the complexity and calculation of the model, it is necessary to consider the accuracy of the evaluation results and the complexity of the evaluation process. According to the practical needs of wind farm power generation performance evaluation, four evaluation levels are selected in this paper, namely .
- (4)
- Calculating the relative degradation degree matrix of the wind farm power generation performance evaluation indicators. Each evaluation indicator is normalized to obtain the deterioration degree matrix based on the concept of relative deterioration degree and the differences of indexes. The calculation steps are the same as those of the improved CRITIC weighting method in step (2) and the relative deterioration degree matrix is shown in Formula (25).where is the relative deterioration degree value of the m-th wind farm and the n-th indicator to be evaluated.
- (5)
- Determining the membership function. The triangular and semi-trapezoidal functions are adopted as the membership functions [29] in this paper, and the fuzzy decomposition interval of membership function is determined according to relevant criteria and expertise. The membership degree matrix corresponding to each evaluation level is obtained according to the relative deterioration degree of each indicator, and the membership matrix of the i-th wind farm to be evaluated is shown in Formula (26).where is the membership degree of the i-th wind farm and the n-th indicator belongs to the rank , and k was taken as 1, 2, 3, 4 in this paper.
- (6)
- Determining the variable weight values of the evaluation indicators by the improved CRITIC weighting method, of which the calculation steps are illustrated in Section 3.1, as shown in Formula (27).
- (7)
- Calculating the fuzzy comprehensive evaluation grade matrix of the wind farm power generation performance and the fuzzy comprehensive evaluation grade matrix of the i-th wind farm to be evaluated is shown in Formula (28).
- (8)
- Determining the fuzzy comprehensive evaluation results of power generation performance of wind farm by adopting the maximum membership principle.
4. Case Study
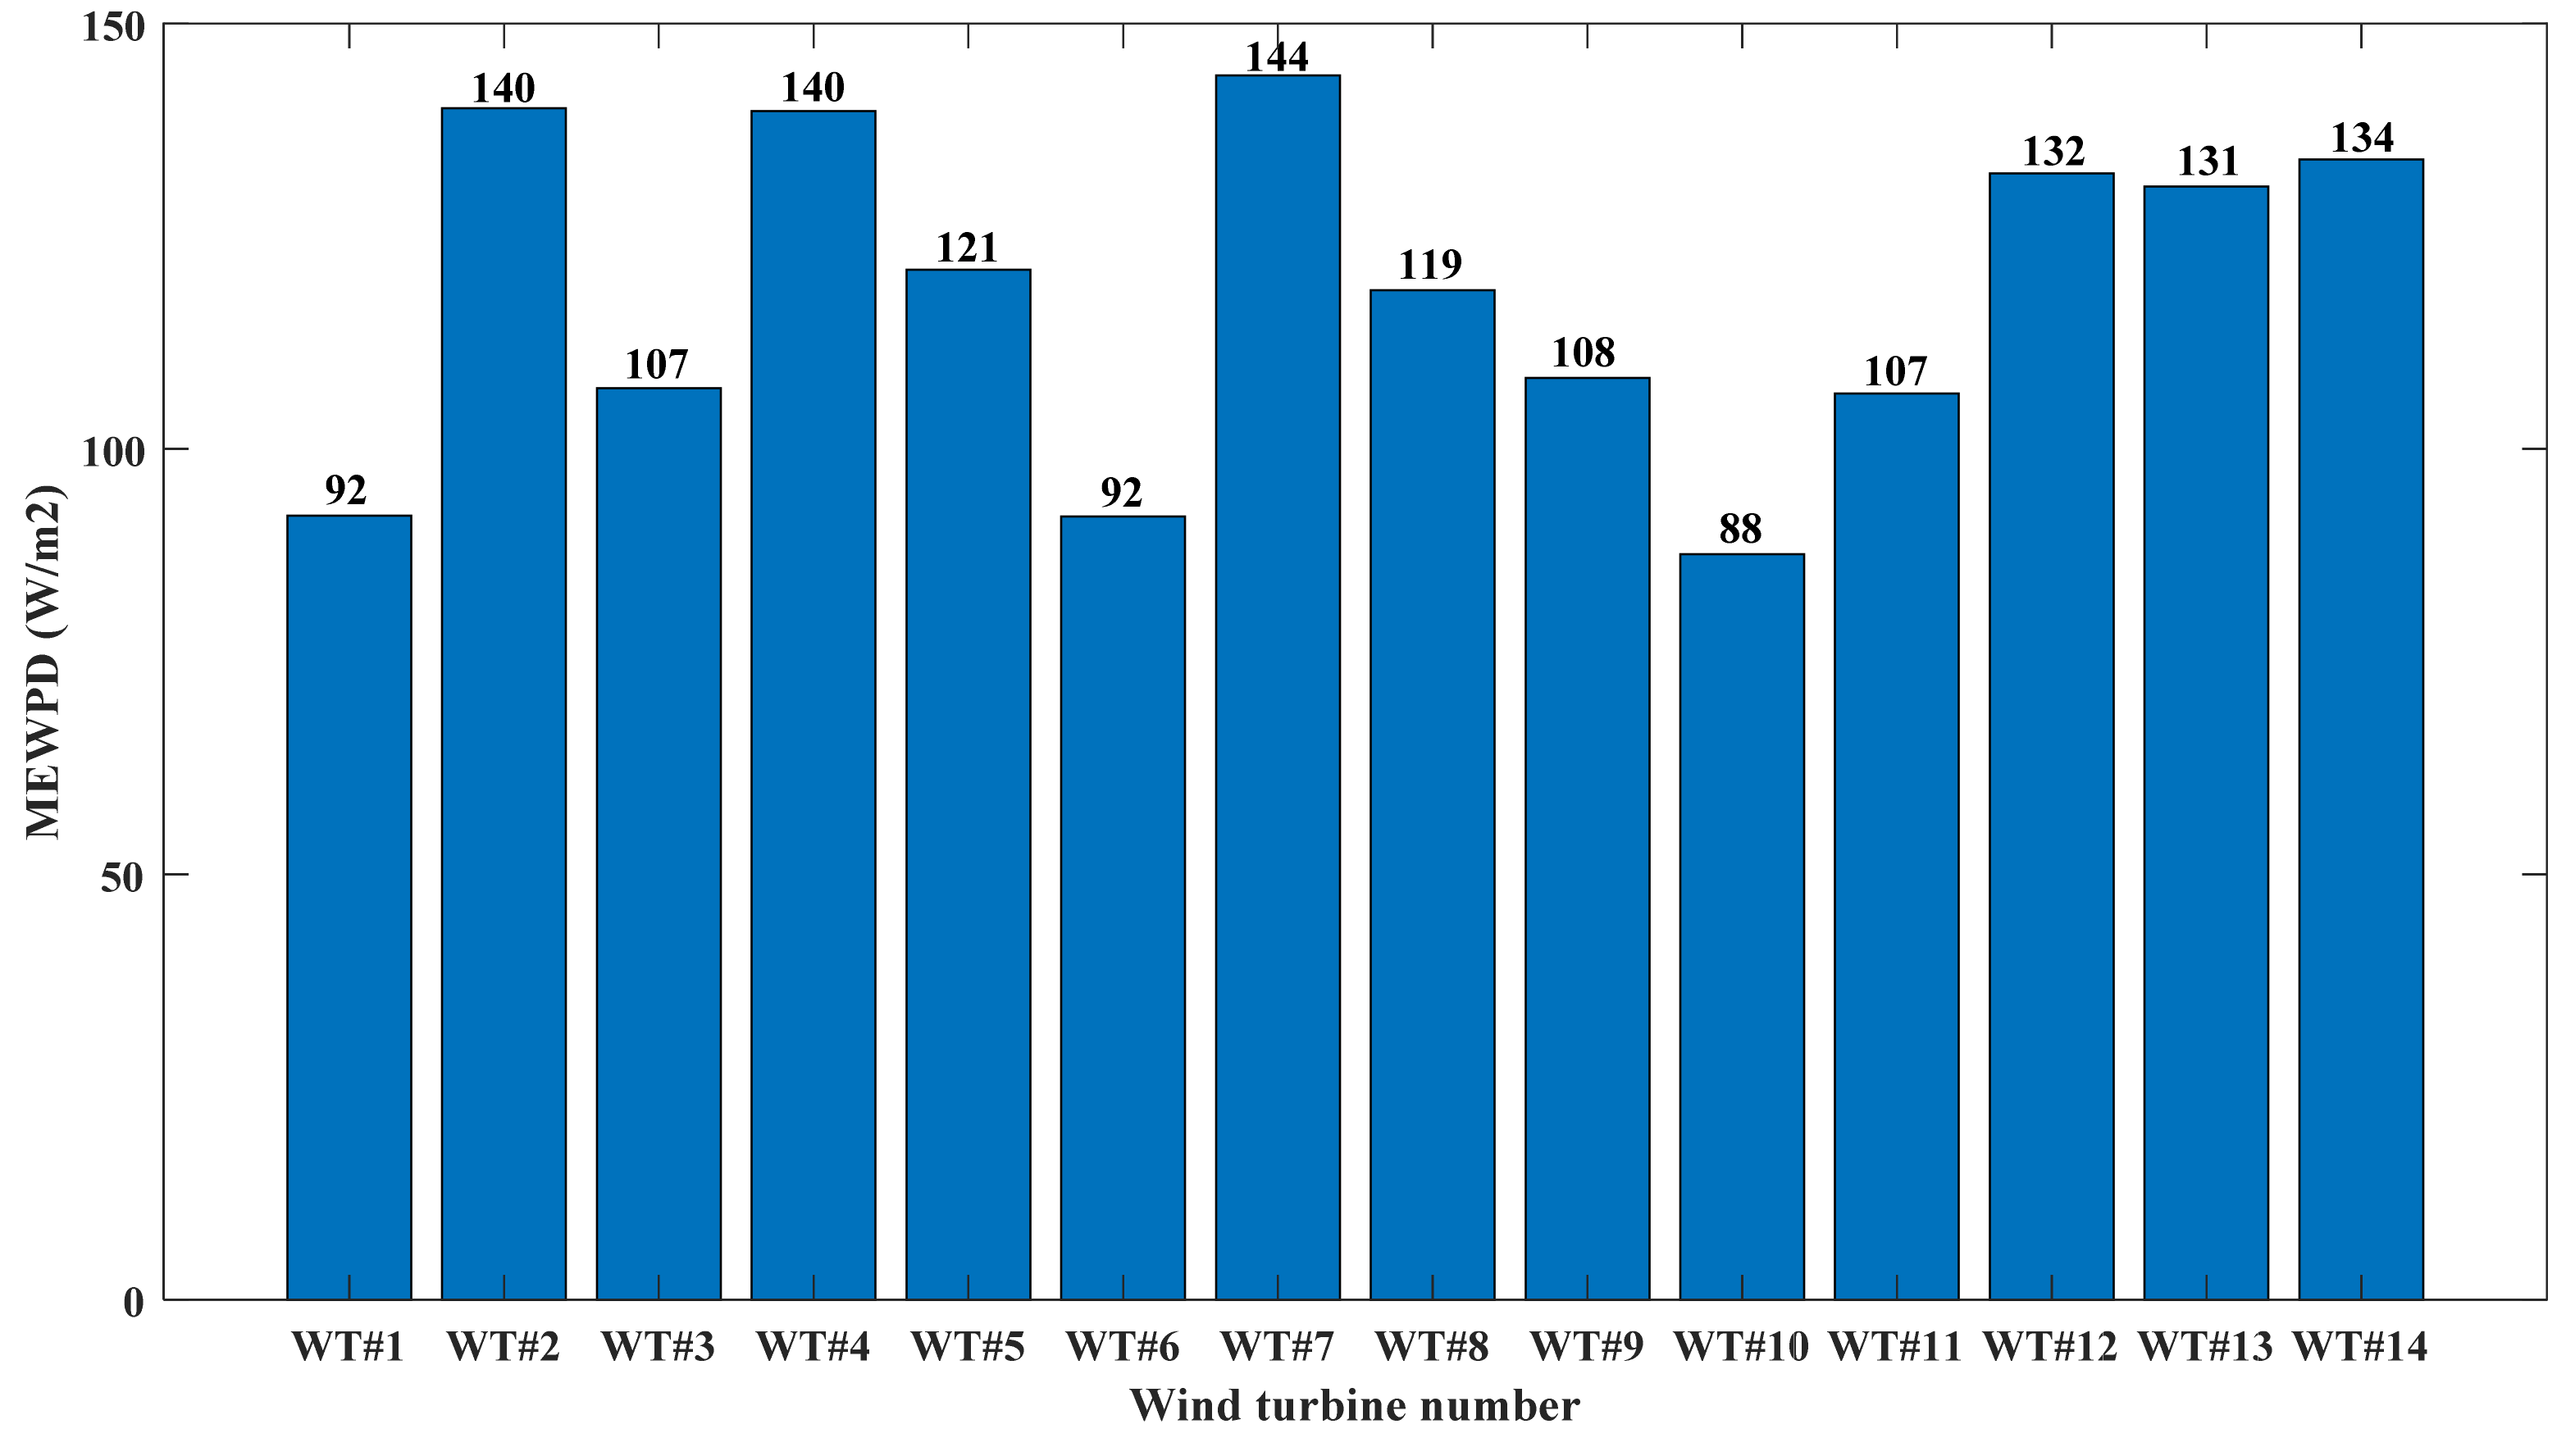
4.1. Data
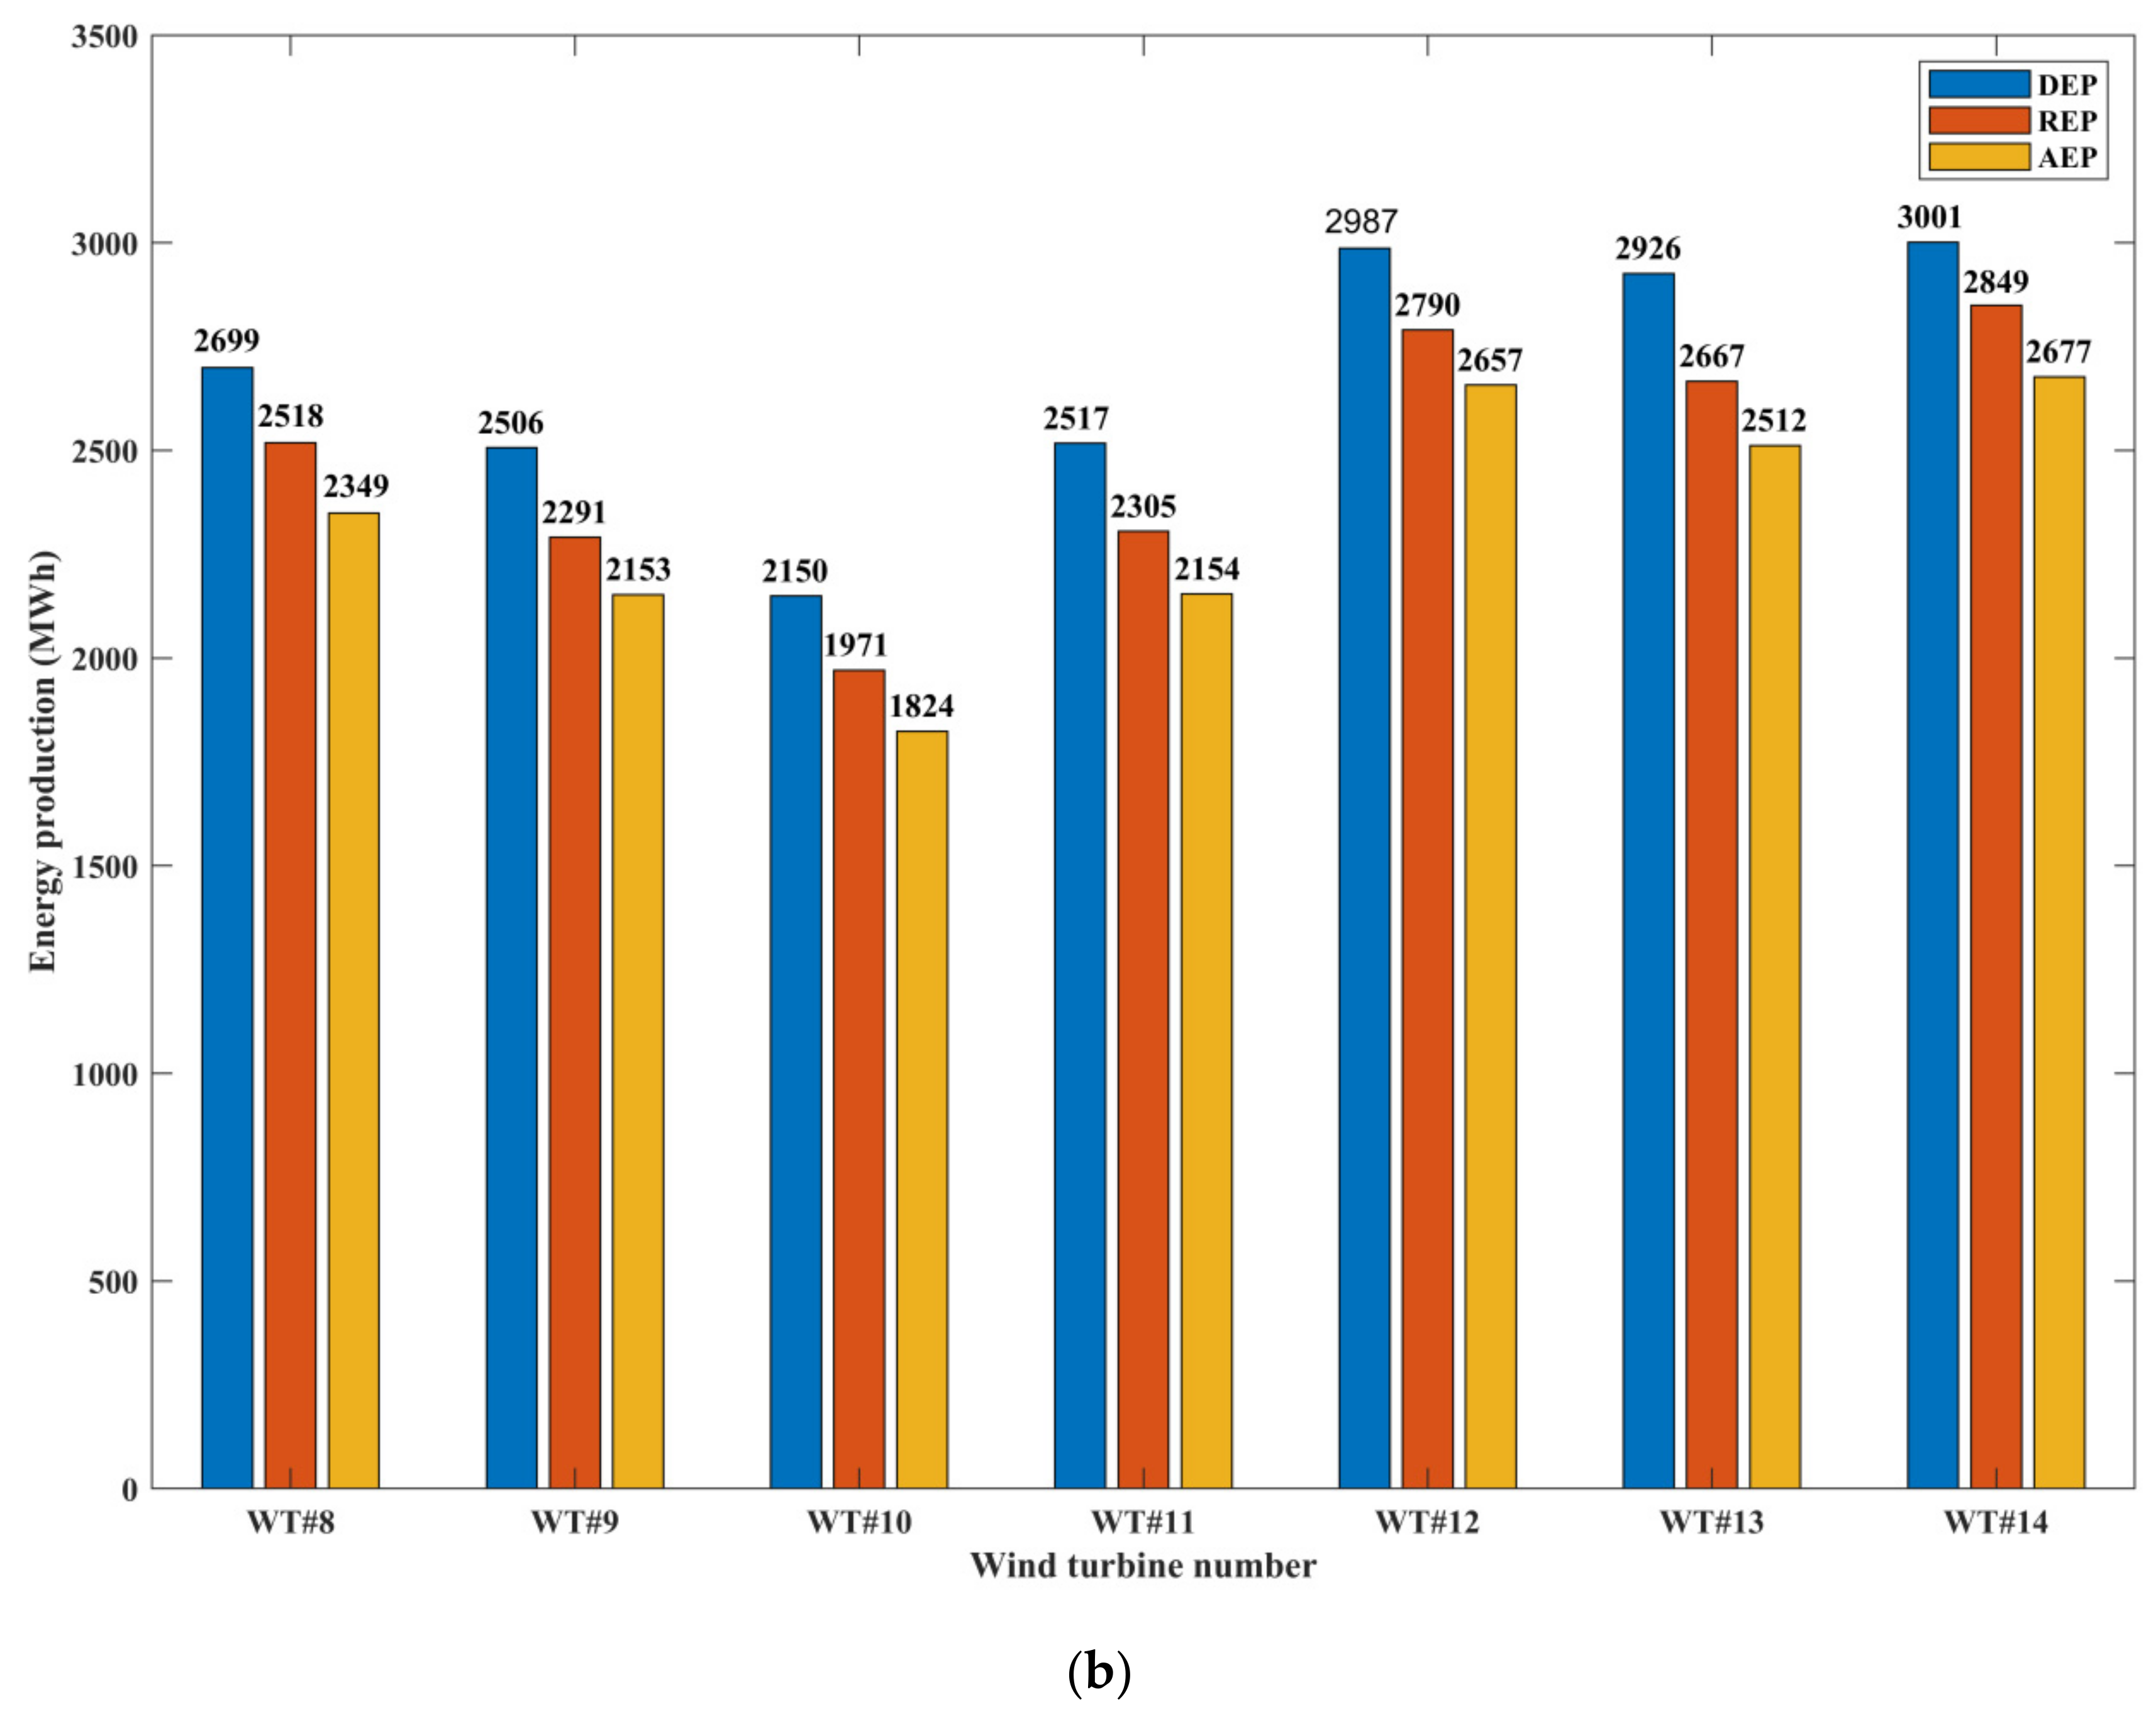
4.2. Wind Turbines Power Generation Performance Evaluation Results
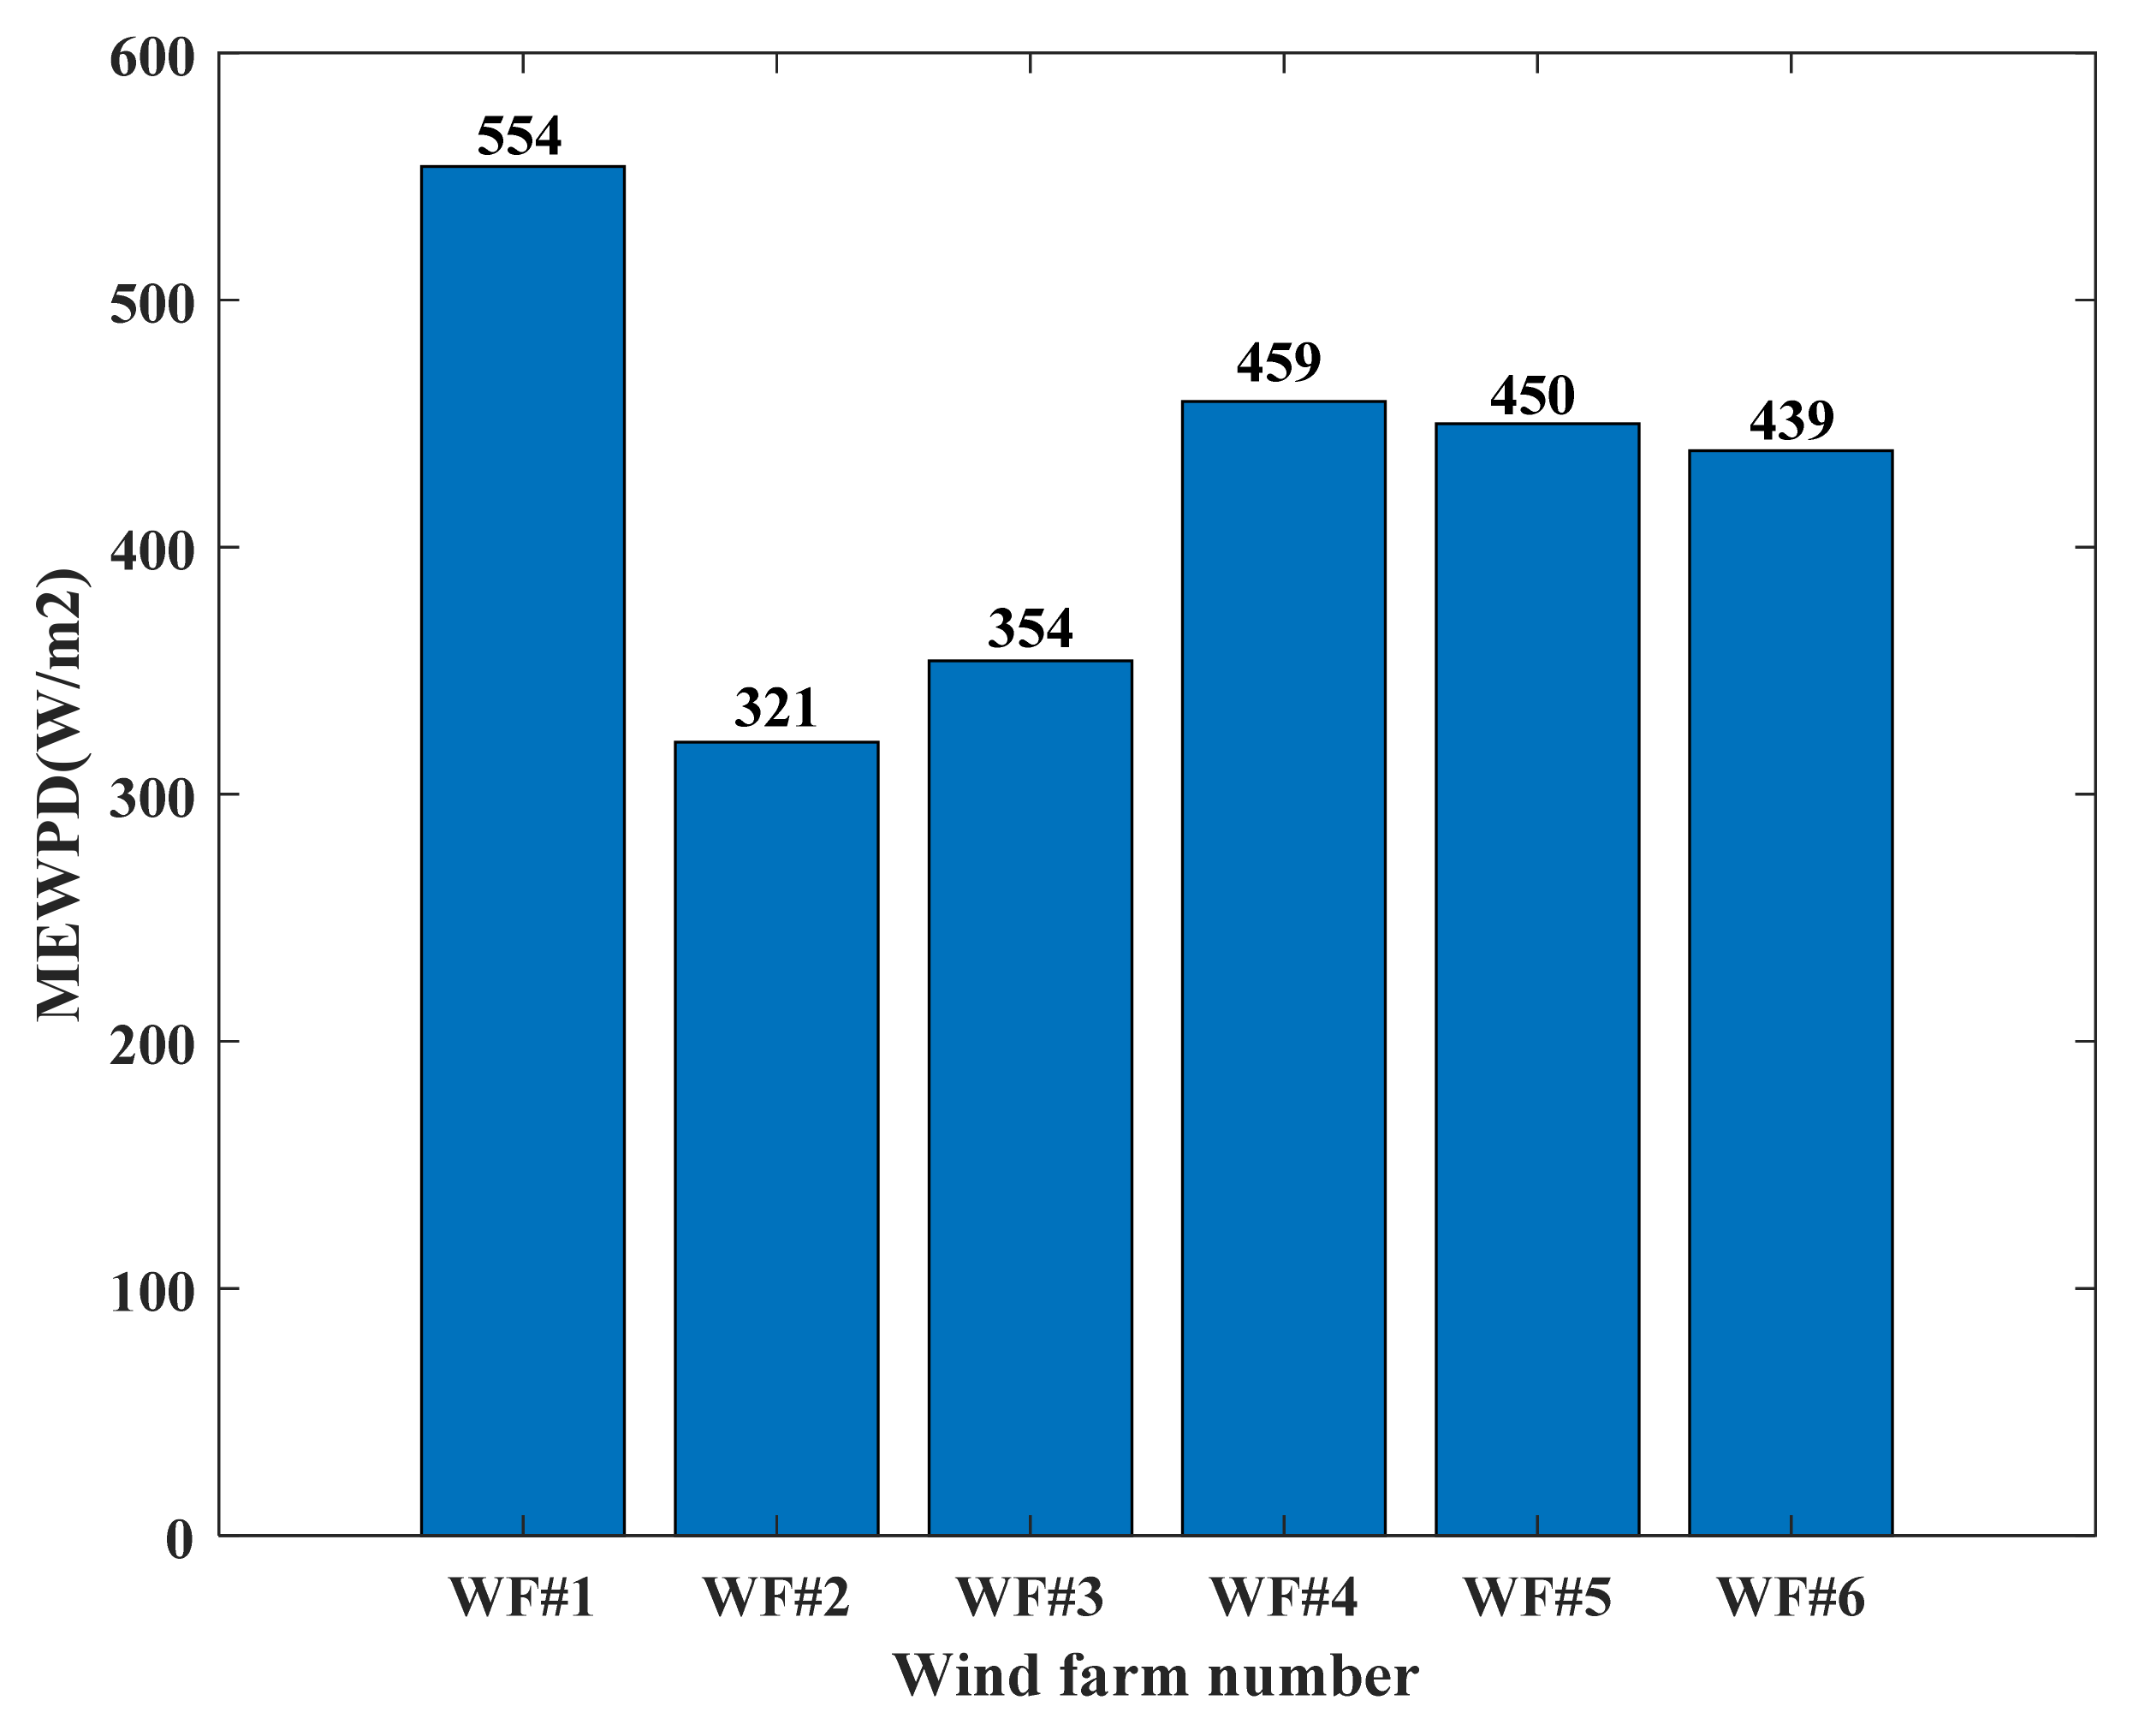
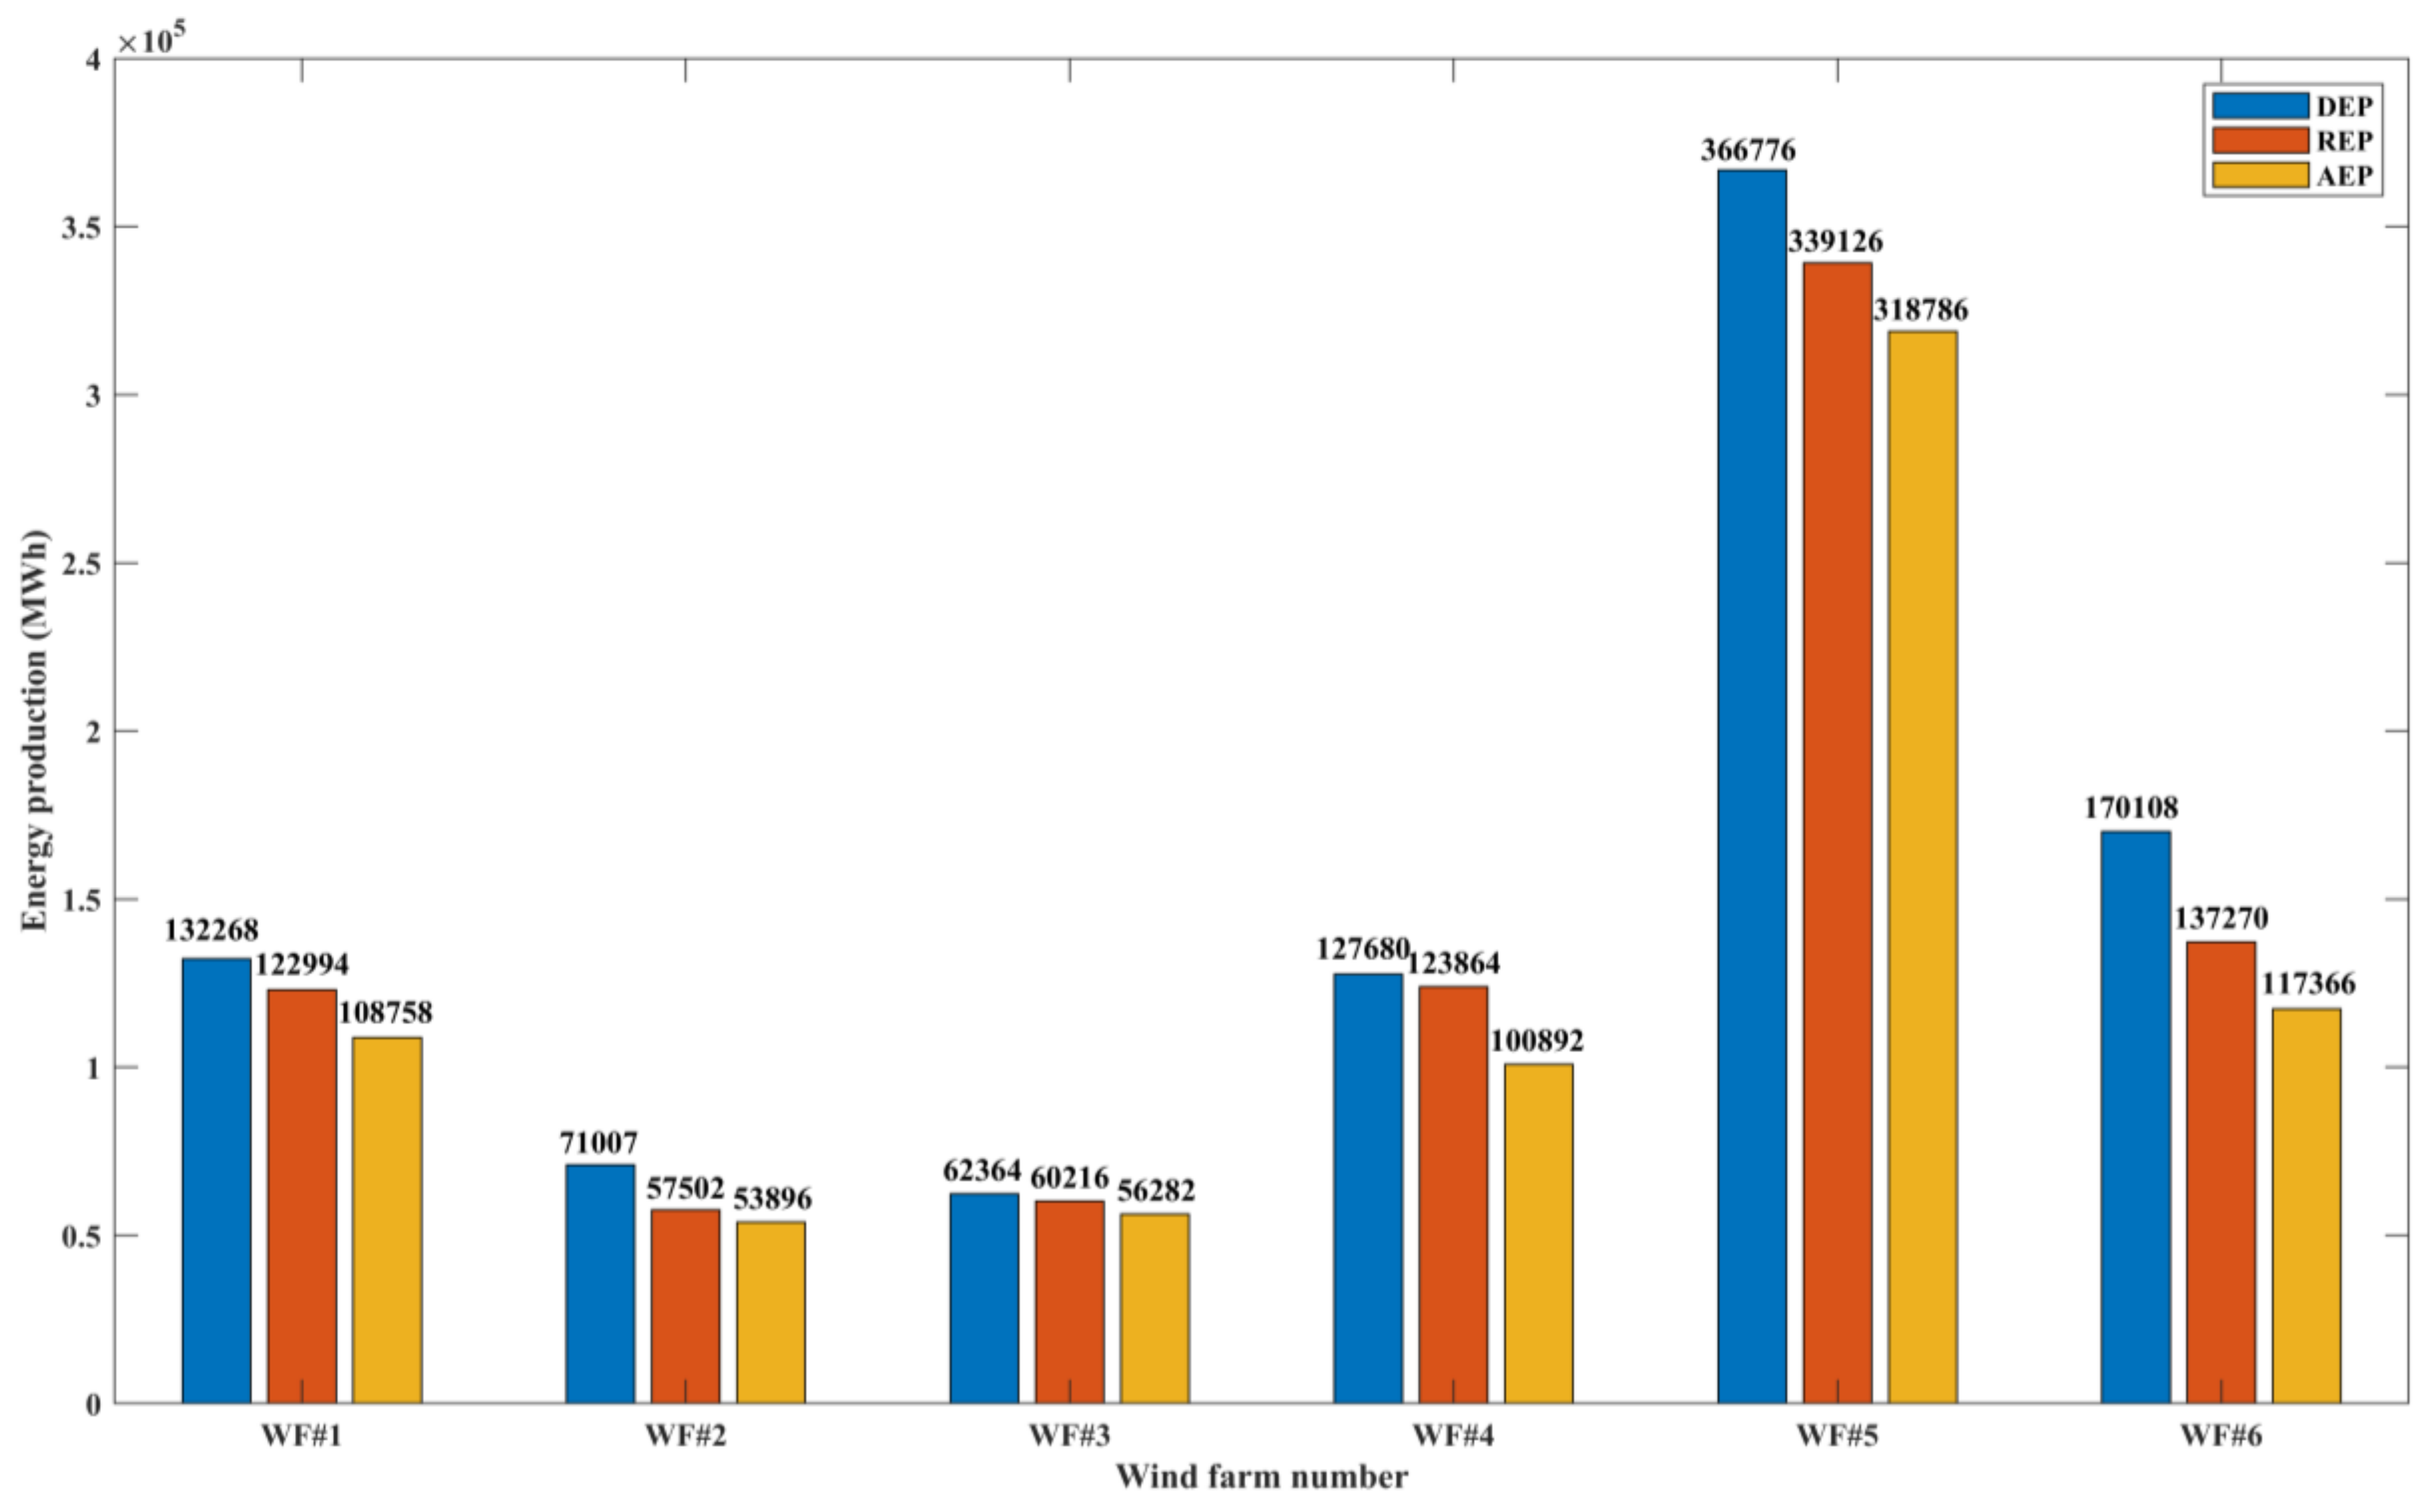
4.3. Wind Farms Power Generation Performance Evaluation Results
5. Conclusions
- (1)
- The proposed statistical indicators can realize the quantitative evaluation of different aspects, such as resource conditions, ideal performance, achievable performance, actual performance, and performance loss of wind farms, trace the root causes of power generation performance loss, and effectively guide the technical transformation and operation and maintenance management of wind farms.
- (2)
- The proposed comparative indicators are based on the wind energy resource and design level of wind farms themselves, which can effectively eliminate the influence of wind energy resource and design levels differences and achieve the fair comparison of power generation performance among different wind farms.
- (3)
- The proposed comprehensive evaluation model based on improved CRITIC weighting method can avoid the problems of one-sided and unreasonable evaluation results caused by the models based on CRITIC weighting method and entropy weighting method, and the results are more aligned with the actual power generation performance of wind farms, which can effectively realize the comprehensive evaluation and fair comparison of power generation performance of different wind farms.
Author Contributions
Funding
Acknowledgments
Conflicts of Interest
References
- Liu, Y.; Qiao, Y.; Han, S.; Xu, Y.; Geng, T.; Ma, T. Quantitative evaluation methods of cluster wind power output volatility and source-load timing matching in regional power grid. Energies 2021, 14, 5214. [Google Scholar] [CrossRef]
- Guo, Y.; Chen, X.; Liu, X.; Shi, S.; Ma, Q. Application of theoretical completion rate of power output for evaluation of offshore wind farms. Acta Energ. Sol. Sin. 2021, 42, 211–217. [Google Scholar] [CrossRef]
- Dong, X.; Li, J.; Gao, D.; Zheng, K. Research on unified assessment model of wind turbine efficiency and performance. J. Mech. Eng. 2021, 57, 253–260. [Google Scholar] [CrossRef]
- Dong, X.; Gao, D.; Li, J.; Li, S. Evaluation model on uncertainty of the wind turbine state. Sustain. Energy Technol. Assess. 2021, 46, 101303. [Google Scholar] [CrossRef]
- Aldersey, W.J.; Broadbent, I.D.; Strachan, P.A. Analysis of United Kingdom offshore wind farm performance using public data: Improving the evidence base for policymaking. Util. Policy 2020, 62, 100985. [Google Scholar] [CrossRef]
- Lo, S.F.; Wu, C. Evaluating the performance of wind farms in China: An empirical review. Int. J. Electr. Power Energy Syst. 2015, 69, 58–66. [Google Scholar] [CrossRef]
- Niu, B.; Hwangbo, H.; Zeng, L.; Ding, Y. Evaluation of alternative power production efficiency metrics for offshore wind turbines and farms. Renew. Energy 2018, 128, 81–90. [Google Scholar] [CrossRef]
- NB/T 31045-2013; Guide for Wind Farm Operation Index Evaluation. China Electric Power Press: Beijing, China, 2013.
- Yan, P. Research on Operation Performance Evaluation Method for Wind Farm. Master’s Thesis, North China Electric Power University, Beijing, China, 2017. [Google Scholar]
- Luo, H. Study on the Evaluation Methods for the Operation Performance of Wind Farm and Its Application. Master’s Thesis, Hunan University, Changsha, China, 2019. [Google Scholar]
- Meng, X. Analytical Research on Wind Farm Operation Status Based on Historical Data. Master’s Thesis, Hebei University of Technology, Tianjin, China, 2015. [Google Scholar]
- Pfaffel, S.; Faulstich, S.; Rohrig, K. Performance and reliability of wind turbines: A review. Energies 2017, 10, 1904. [Google Scholar] [CrossRef] [Green Version]
- Zhang, J.; Zhang, J.; Cai, L.; Ma, L. Energy performance of wind power in China: A comparison among inland, coastal and offshore wind farms. J. Clean. Prod. 2017, 143, 836–842. [Google Scholar] [CrossRef]
- Kulkarni, S.H.; Ramakrishnarao, A.T.; Dyamenally, G.R. Wind energy development in india and a methodology for evaluating performance of wind farm clusters. J. Renew. Energy 2016, 2016, 6769405. [Google Scholar] [CrossRef] [Green Version]
- Liu, Y.; Ye, L.; Benoit, I.; Liu, X.; Cheng, Y.; Morel, G.; Fu, C. Economic performance evaluation method for hydroelectric generating units. Energy Convers. Manag. 2003, 44, 797–808. [Google Scholar] [CrossRef]
- Liu, Y.; Qiao, Y.; Han, S.; Tao, T.; Yan, J.; Li, L.; Bekhbat, G.; Munkhtuya, E. Rotor equivalent wind speed calculation method based on equivalent power considering wind shear and tower shadow. Renew. Energy 2021, 172, 882–896. [Google Scholar] [CrossRef]
- Wen, B.; Wei, S.; Wei, K.; Yang, W.; Peng, Z.; Chu, F. Influences of wind shear and tower shadow on the power output of wind turbine. J. Mech. Eng. 2018, 54, 124–132. [Google Scholar] [CrossRef]
- Shin, D.; Ko, K. Application of the nacelle transfer function by a nacelle-mounted light detection and ranging system to wind turbine power performance measurement. Energies 2019, 12, 1087. [Google Scholar] [CrossRef] [Green Version]
- Han, S.; Qiao, Y.; Yan, P.; Yan, J.; Liu, Y.; Li, L. Wind turbine power curve modeling based on interval extreme probability density for the integration of renewable energies and electric vehicles. Renew. Energy 2020, 157, 190–203. [Google Scholar] [CrossRef]
- Yan, J.; Zhang, H.; Liu, Y.; Han, S.; Li, L. Uncertainty estimation for wind energy conversion by probabilistic wind turbine power curve modelling. Appl. Energy 2019, 239, 1356–1370. [Google Scholar] [CrossRef]
- Han, H.; Zhang, G.; Yang, W. Influence and adjustment of turbulence intensity on measured power curve of wind turbine. Acta Energ. Sol. Sin. 2015, 36, 1442–1447. [Google Scholar] [CrossRef]
- Zhang, D.; Li, W.; Liu, Y.; Liu, C. Reconstruction method of active power historical operating data for wind farm. Automat. Electron Power Sys. 2014, 38, 14–18+24. [Google Scholar] [CrossRef]
- Zhao, Y.; Ye, L.; Wang, W.; Sun, H.; Ju, Y.; Tang, Y. Data-driven correction approach to refine power curve of wind farm under wind curtailment. IEEE Trans. Sustain. Energy 2018, 9, 95–105. [Google Scholar] [CrossRef]
- Mei, Y.; Li, X.; Hu, Z.; Yao, H.; Liu, D. Identification and cleaning of wind power data methods based on control principle of wind turbine generator system. J. Chin. Soc. Power Eng. 2021, 41, 316–322+329. [Google Scholar] [CrossRef]
- Rani, P.; Mishra, A.R.; Pardasani, K.R.; Mardani, A.; Liao, H.; Streimikiene, D. A novel VIKOR approach based on entropy and divergence measures of Pythagorean fuzzy sets to evaluate renewable energy technologies in India. J. Clean. Prod. 2019, 238, 117936. [Google Scholar] [CrossRef]
- Peng, C.; Chen, Y.; Kang, Z.; Chen, C.; Cheng, Q. Robust principal component analysis: A factorization-based approach with linear complexity. Inf. Sci. 2020, 513, 581–599. [Google Scholar] [CrossRef]
- Xu, C.; Ke, Y.; Li, Y.; Chu, H.; Wu, Y. Data-driven configuration optimization of an off-grid wind/PV/hydrogen system based on modified NSGA-II and CRITIC-TOPSIS. Energy Convers. Manag. 2020, 215, 112892. [Google Scholar] [CrossRef]
- Dong, H.; Xu, K.; Yang, L.; Zhang, H. Wind turbine condition assessment method based on variable weight theory and fuzzy comprehensive evaluation. In Proceeding of the 2018 IEEE International Conference of Intelligent Robotic and Control Engineering (IRCE), Lanzhou, China, 24–27 August 2018. [Google Scholar] [CrossRef]
- Wang, M.; Niu, D. Research on project post-evaluation of wind power based on improved ANP and fuzzy comprehensive evaluation model of trapezoid subordinate function improved by interval number. Renew. Energy 2019, 132, 255–265. [Google Scholar] [CrossRef]


| Article | Category | Indicators |
|---|---|---|
| Guo et al. [2] | Performance indicators | Theoretical completion rate of power output |
| Dong et al. [3,4] | Performance and efficiency indicators | Performance cloud parameters, efficiency cloud parameters |
| Niu et al. [7] | Power production efficiency indicators | Availability, power generation efficiency, power coefficient |
| NB/T 31045-2013. [8] | Electricity indicators | Energy production, on-grid energy, off-grid energy, transformer substation electric power consumption, equivalent full load hours, capacity factor [5,6] |
| Equipment operation indicators | Real availability rate, mean time between failure | |
| Operation and maintenance indicators | Mean time to recovery, mean routine maintenance time, operation and maintenance cost per unit capacity, operation and maintenance cost per kilowatt-hour | |
| Power consumption indicators | Comprehensive wind farm electric power consumption rate, transformer substation electric power consumption rate, transmission line loss rate, electric power consumption rate for wind farm | |
| Yan et al. [9] | Wind turbine operation performance indicators | Power curve deviation, reachable performance factor of power curve, time-based availability, energetic availability, electricity loss factor, mean time of repair failures |
| Wind farm operation performance indicators | Wind farm wake effect control ability, wind turbine life optimization control ability, mean time to repair, comprehensive wind farm electric power consumption rate, transmission line loss rate, spare parts management ability | |
| Luo et al. [10] | Inherent characteristics indicators | Turbulence intensity, effective wind power density, effective wind hour rate, wind turbine distribution coefficient |
| Grid-connection characteristics indicators | Active power control ability, reactive power control ability, low voltage ride through ability, power prediction ability, Power quality | |
| Operation characteristic indicators | Capacity factor, equivalent full load hours, real availability rate, mean time between failure, mean time to repair, mean routine maintenance time, comprehensive wind farm electric power consumption rate, transmission line loss rate | |
| Meng et al. [11] | Wind resource indicators | Mean wind speed, effective wind hour rate, mean effective wind power density (MEWPD), |
| Operation indicators | Capacity factor, grid-connection hours, comprehensive wind farm electric power consumption rate | |
| Equipment operation indicators | Equipment availability, power generation ability, volatility | |
| Pfaffel et al. [12] | Performance and reliability indicators | Capacity factor, time-based availability, technical availability, energetic availability, failure rate and mean down time |
| Zhang et al. [13] | Energy performance indicators | Energy consumption intensity, energy payback time, energy payback ratio, energy return intensity |
| Kulkarni et al. [14] | Technical performance indicators | Energy production capacity, feasibility, risk, duration of preparation and implementation phase, technological maturity, reliability, safety, local technical knowhow |
| Environmental performance indicators | Investment cost, implementation cost, operation and maintenance cost, service life, economic value, availability of funds | |
| Economic performance indicators | Pollutant emission (CO2), need of waste disposal, land requirements | |
| Social performance indicators | Social acceptability, policy objectives, labor impact, political acceptance, compatibility with national energy |
| Wind Turbine Number | EPLF (MWh) | EPLRI (MWh) | EPLPL (MWh) | EPLOF (MWh) |
|---|---|---|---|---|
| WT #1 | 59.66 | 9.03 | 39.47 | 14.25 |
| WT #2 | 68.40 | 5.30 | 44.28 | 19.46 |
| WT #3 | 83.80 | 7.95 | 34.86 | 26.06 |
| WT #4 | 60.10 | 6.39 | 39.60 | 26.60 |
| WT #5 | 66.80 | 6.77 | 31.49 | 21.30 |
| WT #6 | 64.95 | 7.75 | 35.62 | 21.33 |
| WT #7 | 94.86 | 8.33 | 53.80 | 19.90 |
| WT #8 | 66.66 | 5.95 | 63.80 | 33.12 |
| WT #9 | 73.54 | 6.25 | 38.76 | 19.37 |
| WT #10 | 67.08 | 9.21 | 50.76 | 19.91 |
| WT #11 | 94.79 | 6.80 | 30.37 | 19.23 |
| WT #12 | 92.52 | 5.53 | 26.84 | 7.52 |
| WT #13 | 98.35 | 6.43 | 39.54 | 10.45 |
| WT #14 | 102.95 | 6.70 | 47.30 | 15.47 |
| Wind Turbine Number | DWEUC | MPC | OPC | FLC | RILC | PLLC | OLC |
|---|---|---|---|---|---|---|---|
| WT #1 | 0.5263 | 0.9360 | 0.9419 | 2.83% | 0.43% | 1.87% | 0.68% |
| WT #2 | 0.4743 | 0.9325 | 0.9522 | 2.38% | 0.18% | 1.54% | 0.68% |
| WT #3 | 0.4992 | 0.9316 | 0.9339 | 3.63% | 0.34% | 1.51% | 1.13% |
| WT #4 | 0.4812 | 0.9078 | 0.9531 | 2.12% | 0.23% | 1.40% | 0.94% |
| WT #5 | 0.5046 | 0.9309 | 0.9521 | 2.53% | 0.26% | 1.19% | 0.81% |
| WT #6 | 0.5256 | 0.9457 | 0.9389 | 3.06% | 0.37% | 1.68% | 1.00% |
| WT #7 | 0.4656 | 0.8937 | 0.9363 | 3.42% | 0.30% | 1.94% | 0.72% |
| WT #8 | 0.4904 | 0.9329 | 0.9327 | 2.65% | 0.24% | 2.53% | 1.32% |
| WT #9 | 0.4988 | 0.9139 | 0.9398 | 3.21% | 0.27% | 1.69% | 0.85% |
| WT #10 | 0.5288 | 0.9169 | 0.9254 | 3.40% | 0.47% | 2.58% | 1.01% |
| WT #11 | 0.5095 | 0.9158 | 0.9344 | 4.11% | 0.29% | 1.32% | 0.83% |
| WT #12 | 0.4863 | 0.9341 | 0.9525 | 3.32% | 0.20% | 0.96% | 0.27% |
| WT #13 | 0.4821 | 0.9114 | 0.9420 | 3.69% | 0.24% | 1.48% | 0.39% |
| WT #14 | 0.4828 | 0.9494 | 0.9395 | 3.61% | 0.24% | 1.66% | 0.54% |
| Wind Turbine Number | Entropy Weighting Method | ||||
|---|---|---|---|---|---|
| Excellent | Good | Medium | Poor | Result | |
| WT #1 | 0.6683 | 0.0436 | 0.1512 | 0.1368 | Excellent |
| WT #2 | 0.5987 | 0.1973 | 0.0223 | 0.1818 | Excellent |
| WT #3 | 0.1549 | 0.3817 | 0.3177 | 0.1458 | Good |
| WT #4 | 0.4912 | 0.0594 | 0.3349 | 0.1145 | Excellent |
| WT #5 | 0.4796 | 0.5178 | 0.0026 | 0.0000 | Good |
| WT #6 | 0.4230 | 0.2339 | 0.3307 | 0.0123 | Excellent |
| WT #7 | 0.1171 | 0.2387 | 0.2919 | 0.3523 | Poor |
| WT #8 | 0.3800 | 0.2270 | 0.0662 | 0.3268 | Excellent |
| WT #9 | 0.0524 | 0.7362 | 0.2114 | 0.0000 | Good |
| WT #10 | 0.2040 | 0.1457 | 0.3376 | 0.3127 | Medium |
| WT #11 | 0.2822 | 0.3644 | 0.1730 | 0.1804 | Good |
| WT #12 | 0.5709 | 0.2733 | 0.1558 | 0.0000 | Excellent |
| WT #13 | 0.4167 | 0.0646 | 0.3893 | 0.1294 | Excellent |
| WT #14 | 0.4490 | 0.1605 | 0.3905 | 0.0000 | Excellent |
| Wind Turbine Number | CRITIC Weighting Method | ||||
|---|---|---|---|---|---|
| Excellent | Good | Medium | Poor | Result | |
| WT #1 | 0.6770 | 0.0385 | 0.1273 | 0.1571 | Excellent |
| WT #2 | 0.5871 | 0.1838 | 0.0250 | 0.2041 | Excellent |
| WT #3 | 0.1410 | 0.4000 | 0.3247 | 0.1343 | Good |
| WT #4 | 0.4741 | 0.0546 | 0.3523 | 0.1190 | Excellent |
| WT #5 | 0.4554 | 0.5419 | 0.0027 | 0.0000 | Good |
| WT #6 | 0.4490 | 0.2062 | 0.3306 | 0.0142 | Excellent |
| WT #7 | 0.1078 | 0.2431 | 0.2677 | 0.3815 | Poor |
| WT #8 | 0.3935 | 0.2473 | 0.0740 | 0.2852 | Excellent |
| WT #9 | 0.0554 | 0.7370 | 0.2077 | 0.0000 | Good |
| WT #10 | 0.2291 | 0.1410 | 0.3249 | 0.3049 | Medium |
| WT #11 | 0.2675 | 0.3788 | 0.1829 | 0.1708 | Good |
| WT #12 | 0.5538 | 0.2759 | 0.1703 | 0.0000 | Excellent |
| WT #13 | 0.3976 | 0.0644 | 0.4138 | 0.1242 | Medium |
| WT #14 | 0.4625 | 0.1392 | 0.3983 | 0.0000 | Excellent |
| Wind Turbine Number | Improved CRITIC Weighting Method | ||||
|---|---|---|---|---|---|
| Excellent | Good | Medium | Poor | Result | |
| WT #1 | 0.5350 | 0.0363 | 0.1388 | 0.2898 | Excellent |
| WT #2 | 0.4454 | 0.1504 | 0.0441 | 0.3601 | Excellent |
| WT #3 | 0.1113 | 0.3257 | 0.3679 | 0.1952 | Medium |
| WT #4 | 0.3387 | 0.0603 | 0.4446 | 0.1564 | Medium |
| WT #5 | 0.4304 | 0.5669 | 0.0027 | 0.0000 | Good |
| WT #6 | 0.3598 | 0.2073 | 0.4155 | 0.0174 | Medium |
| WT #7 | 0.0206 | 0.0513 | 0.0600 | 0.8681 | Poor |
| WT #8 | 0.0861 | 0.0682 | 0.0233 | 0.8223 | Poor |
| WT #9 | 0.0550 | 0.7184 | 0.2266 | 0.0000 | Good |
| WT #10 | 0.0274 | 0.0276 | 0.0662 | 0.8789 | Poor |
| WT #11 | 0.0603 | 0.0991 | 0.0527 | 0.7879 | Poor |
| WT #12 | 0.4435 | 0.3315 | 0.2250 | 0.0000 | Excellent |
| WT #13 | 0.2819 | 0.0521 | 0.5019 | 0.1641 | Medium |
| WT #14 | 0.3446 | 0.1374 | 0.5180 | 0.0000 | Medium |
| Wind Farm Number | EPLF (MWh) | EPLRI (MWh) | EPLPL (MWh) | EPLOF (MWh) |
|---|---|---|---|---|
| WF #1 | 1958 | 731 | 404 | 11144 |
| WF #2 | 139 | 64 | 489 | 2915 |
| WF #3 | 176 | 116 | 768 | 2924 |
| WF #4 | 2007 | 647 | 2983 | 17384 |
| WF #5 | 3850 | 98 | 3292 | 13173 |
| WF #6 | 5459 | 1773 | 11159 | 1514 |
| Wind Farm Number | DWEUC | MPC | OPC | FLC | RILC | PLLC | OLC |
|---|---|---|---|---|---|---|---|
| WF #1 | 0.2352 | 0.9299 | 0.8842 | 1.59% | 0.59% | 0.33% | 9.06% |
| WF #2 | 0.3296 | 0.8098 | 0.9373 | 0.24% | 0.11% | 0.85% | 5.07% |
| WF #3 | 0.3047 | 0.9656 | 0.9338 | 0.29% | 0.19% | 1.28% | 4.86% |
| WF #4 | 0.2521 | 0.9701 | 0.8141 | 1.62% | 0.52% | 2.41% | 14.03% |
| WF #5 | 0.2701 | 0.9246 | 0.9398 | 1.14% | 0.03% | 0.97% | 3.88% |
| WF #6 | 0.2598 | 0.8070 | 0.8550 | 3.98% | 1.29% | 8.13% | 1.10% |
| Wind Farm Number | Entropy Weighting Method | ||||
|---|---|---|---|---|---|
| Excellent | Good | Medium | Poor | Result | |
| WF #1 | 0.1364 | 0.4341 | 0.2067 | 0.2228 | Good |
| WF #2 | 0.6063 | 0.1419 | 0.2518 | 0.0000 | Excellent |
| WF #3 | 0.6786 | 0.3153 | 0.0061 | 0.0000 | Excellent |
| WF #4 | 0.2509 | 0.3116 | 0.2947 | 0.1428 | Good |
| WF #5 | 0.4144 | 0.5800 | 0.0056 | 0.0000 | Good |
| WF #6 | 0.1428 | 0.1585 | 0.0644 | 0.6344 | Poor |
| Wind Farm Number | CRITIC Weighting Method | ||||
|---|---|---|---|---|---|
| Excellent | Good | Medium | Poor | Result | |
| WF #1 | 0.1459 | 0.4316 | 0.2662 | 0.1563 | Good |
| WF #2 | 0.4959 | 0.2494 | 0.2547 | 0.0000 | Excellent |
| WF #3 | 0.5921 | 0.4014 | 0.0066 | 0.0000 | Excellent |
| WF #4 | 0.2516 | 0.2618 | 0.2341 | 0.2524 | Good |
| WF #5 | 0.4878 | 0.5065 | 0.0056 | 0.0000 | Good |
| WF #6 | 0.2524 | 0.1111 | 0.0452 | 0.5913 | Poor |
| Wind Farm Number | Improved CRITIC Weighting Method | ||||
|---|---|---|---|---|---|
| Excellent | Good | Medium | Poor | Result | |
| WF #1 | 0.0528 | 0.1939 | 0.1438 | 0.6095 | Poor |
| WF #2 | 0.1924 | 0.1183 | 0.6893 | 0.0000 | Medium |
| WF #3 | 0.5763 | 0.4173 | 0.0064 | 0.0000 | Excellent |
| WF #4 | 0.0362 | 0.0535 | 0.0590 | 0.8513 | Poor |
| WF #5 | 0.4500 | 0.5445 | 0.0055 | 0.0000 | Good |
| WF #6 | 0.0174 | 0.0149 | 0.0060 | 0.9617 | Poor |
Publisher’s Note: MDPI stays neutral with regard to jurisdictional claims in published maps and institutional affiliations. |
© 2022 by the authors. Licensee MDPI, Basel, Switzerland. This article is an open access article distributed under the terms and conditions of the Creative Commons Attribution (CC BY) license (https://creativecommons.org/licenses/by/4.0/).
Share and Cite
Qiao, Y.; Liu, Y.; Chen, Y.; Han, S.; Wang, L. Power Generation Performance Indicators of Wind Farms Including the Influence of Wind Energy Resource Differences. Energies 2022, 15, 1797. https://doi.org/10.3390/en15051797
Qiao Y, Liu Y, Chen Y, Han S, Wang L. Power Generation Performance Indicators of Wind Farms Including the Influence of Wind Energy Resource Differences. Energies. 2022; 15(5):1797. https://doi.org/10.3390/en15051797
Chicago/Turabian StyleQiao, Yanhui, Yongqian Liu, Yang Chen, Shuang Han, and Luo Wang. 2022. "Power Generation Performance Indicators of Wind Farms Including the Influence of Wind Energy Resource Differences" Energies 15, no. 5: 1797. https://doi.org/10.3390/en15051797
APA StyleQiao, Y., Liu, Y., Chen, Y., Han, S., & Wang, L. (2022). Power Generation Performance Indicators of Wind Farms Including the Influence of Wind Energy Resource Differences. Energies, 15(5), 1797. https://doi.org/10.3390/en15051797