1. Introduction
In line with the energy supply security, environmental and economic goals of the European Union, among the several pathways to increase the penetration of Renewable Energy Sources (RES) into the European energy system, the so-called Power-to-Gas (P2G) [
1] represents a promising solution. Indeed, the current European Energy Roadmap is aiming to cut the EU greenhouse gas emissions by at least 80% by 2050 [
2]. In this scenario, the role of gas and P2G (i.e., the process of converting the surplus of renewable electrical energy into a gaseous fuel) can be fundamental [
3]. Complementary to green power, this technology could produce green or clean gases contributing to reach the climate targets. Green gases not only are a feedstock for several industrial processes, but they would also reduce carbon emissions. Moreover, P2G is a pivotal element for the coupling of the electric and gas infrastructures, thereby facilitating the integration of renewable sources into well established and high performing energy storage and distribution systems. As shown by Kilkiş et al. [
4], the Power-to-X technologies (multiplicity of electricity conversion, energy storage and reconversion pathways that use surplus electric power) offer a wide range of opportunities to integrate variable renewable energy sources into useful forms of energy that are demanded at the specific moment or a later use; among these technologies, the P2G concept can offer the benefit of allowing renewable power to be converted into a synthetic fuel as a way of integrating power and gas grids [
5].
Economic aspects of synthetic gas production based on renewable energy have been studied in various works, referring to specific P2G solutions based on different technologies and with variable boundary conditions. However, based on the produced synthetic gas and on the involved technologies, both the appropriate methodology for the analysis and the parameters affecting the obtained results may importantly differ.
As an example, Michailos et al. [
6] analyzed the biomethane production using an integrated anaerobic digestion, gasification and CO
2 methanation process, assessing the viability of such an integrated energy system. Marocco et al. [
7], instead, assessed the techno-economic feasibility of H
2-based energy storage systems; the economic viability of the several analyzed scenarios has been outlined by computing the Levelized Cost of Energy (LCOE). In Davis et al. [
8], the synthetic natural gas (SNG) production through integrated low-temperature water electrolysis and methanation has been studied, providing a detailed economic analysis able to calculate the SNG production cost. Furthermore, synthetic natural gas production from coal and biomass is analyzed in [
9], evaluating the possibility of integrating carbon capture and storage technology and highlighting the strong dependence of the SNG specific cost from electricity prices and operating hours. In addition, a techno-economic investigation on a simple P2G system, with the SOEC operated in simply electrolytic mode along with conventional methanation reactors, has been performed by Salomone et at. [
10], showing promising results in terms of LCOE.
Compared to the literature in the field, the originality of this study stands in the demonstration of the economic feasibility of the co-electrolysis high-temperature methanation thermally integrated technology. In detail, the new contribution of this study to the state-of-the-art is the presentation of a complete techno-economic analysis applied to a promising and innovative cutting-edge P2G energy storage system, proposed in the literature by the authors, which includes a co-electrolyzer based on a Solid Oxide Electrolyte Cell (SOEC) and an advanced experimental high-temperature methanator. The co-SOEC is coupled with a renewable generator and with other subsystems of the storage plant, in order to obtain positive thermal synergies (as investigated also in other recent studies, e.g., see Mehrpooya and Karimi [
11]) and operated in co-electrolysis mode [
12], which can produce benefits in terms of CO
2 neutrality. In more details, co-electrolysis operated in intermediate/high temperature regime and thermally matched with an advanced experimental methanator, as investigated in this study, allows to exploit the largest conversion efficiency values of electrolysis, generally recognized for the SOEC technology, and leads to maximize the overall efficiency of the SNG production process [
13]. To the best of the authors’ knowledge, the economic feasibility of this particular typology of P2G system has not been investigated before this study. In particular, this work is a continuation of two earlier studies of the authors [
13,
14] on an original P2G solution and it represents the comprehensive techno-economic assessment. In a first study [
13], the P2G system has been introduced and the thermodynamic performance has been evaluated through different parameters, demonstrating the possibility of thermally integrating the electrolysis and the methanation processes at relatively high temperature. As a preliminary focus of a broader study, the analysis has been performed only in design conditions, i.e., with the energy input kept constant. The thermodynamic analysis has been enhanced in [
14], in which an off-design evaluation has been carried out by means of a self-developed numerical model. In this paper, instead, as a further step, a detailed thermo-economic parametric analysis has been developed, with the purpose of assessing the cost-effectiveness of the proposed P2G technology in order to evaluate the feasibility of its introduction into the market. In particular, the economic analysis starts from a detailed methodology [
15] that provides correlations for the estimation of capital and variable costs related to each component installed in the plant. This has been extended and adapted to the proposed P2G system with the aim to estimate the SNG economic value through a cash flow analysis, in order to (i) assess the economic feasibility and current limits of the proposed solution and (ii) to highlight the direction for the technology competitiveness. Several configurations of the proposed P2G solution—accounting for different operating temperatures and pressure setup and, as a consequence, also considering different optimized layouts of the process—are modeled, analyzed and are finally compared both from thermodynamic and economic viewpoints. Furthermore, in order to broaden the economic analysis based on the detailed cost methodology, parametric studies are performed. In particular, the effect of the investment cost, of the electricity purchase price and of the renewable generator size on the SNG value is investigated. In addition, future cost developments of the SOEC technology are evaluated; finally, a valorization of the CO
2 is also taken into account, considering different values of carbon tax.
The structure of the paper can be summarized as follows. In
Section 2, the considered P2G system is introduced and the thermodynamic model is shown. In
Section 3, the analyzed configurations are described. In
Section 4, the coupled renewable generator assumptions are shown, while in
Section 5, the economic analysis approach is presented. Finally, the obtained results are provided and discussed in
Section 6.
2. The Power-to-Gas System: Features and Thermodynamic Model
In this study, a new P2G system formerly introduced [
13], has been further investigated (see the simplified scheme in
Figure 1). The originality of this system stands in particular in the connection, implemented at high temperature, between a co-electrolyzer and an experimental methanation reactor.
Considering the complex system as a black box, it shows incoming and outgoing streams that can be divided into material and energy streams. The input material streams are water, carbon dioxide and sweep air; instead, the main output of the system is the produced SNG stream that can be introduced into the natural gas (NG) network. The energy streams can derive from an external electric source (a renewable generator) or from an external heat source; they can also come from internal processes and then recovered to meet the system thermal demand.
The considered system can be divided into three main blocks, on the basis of the operating temperature:
- (1)
a central high-temperature (HT) block (red colored in
Figure 1);
- (2)
an upstream heat recovery section (HRS), for water preheating, reaching lower temperatures with respect to the levels required in the HT area;
- (3)
a downstream low-temperature (LT) area (blue colored in
Figure 1).
The three highlighted blocks represent key subsystems of the P2G plant. The main component of the HT area is the co-electrolyzer (simultaneous electrolysis of water and carbon dioxide) of SOEC technology, producing H
2 and CO. Downstream of the SOEC, a high-temperature methanator (HTM) has been introduced; in this component (modeled by means of data derived from an experimental reactor [
16,
17]), the conversion to SNG of the gas mixture coming from the SOEC takes place through hydrogenation.
The produced rough gas still contains unconverted elements in addition to methane; in order to upgrade the produced SNG, a downstream LT plant section has been considered. This zone is constituted by a low-temperature methanator (LTM), modeled on the basis of the catalyst-based TREMP
TM process, and by a SNG end-of-line treatment, i.e., mainly gas compression and water purging (C. and Sep., in
Figure 1).
The thermodynamic setting of the P2G system has been optimized in [
13], in which different layout arrangements have been investigated and compared; in particular, it has been found that the best performing arrangement is the one with the SOEC and the experimental HTM both operating at the same temperature (600 °C, i.e., an intermediate value between thermal levels characteristic of high temperature SOEC and of conventional methanation reactors). This result represents the starting point of this study, and it is a desirable operating condition for the SOEC in order to reduce the overall plant temperature and cost. In the state-of-the-art of conventional SOEC, this operating temperature is not currently fully efficient due to poor materials conductivity at low temperature levels and operations at 600 °C are possible only by means of novel materials not completely developed in this moment. Indeed, while the intermediate temperature range of operation at 700 °C is currently feasible, the considered value of 600 °C represents a target, already demonstrated but only in lab scale [
18]. In addition, a P2G system with more conventional operating temperature regimes (850 °C for the SOEC and 450 °C for the experimental methanator) has also been evaluated. The operating temperature of the LTM section has been set to 200 °C and the SNG output pressure after the LT compression section has been considered equal to 60 bar, while reactants are fed in the system at 1 bar. The inlet reactant mass flow rate values are calculated considering feeding the SOEC with 80% H
2O and 20% CO
2 as volume fractions and the reference system sizing is established in the study by considering a SOEC power size equal to 1 MW.
In order to evaluate the design and off-design thermodynamic performance of the P2G process, the system has been modeled in an integrated tool environment. In more detail, the model is based on a complex interaction between two software environments (see
Figure 2), namely Aspen HYSYS
TM environment [
19] and MATLAB
TM environment [
20]. The first one is a chemical process simulator used to mathematically model chemical processes; in this environment, the layout of the P2G system has been created using conventional components from the tool library or implementing specific sub-models. This chemical environment is limited to the design analysis and, in order to also evaluate the off-design performance of the system (i.e., when the electric power quantity produced by the renewable generator differs from the design value), it has been integrated with the MATLAB
TM environment. Different specific routines have been developed for the key areas of the system whose core is represented by the SOEC sub-model due to its highest energy consumption. This sub-model shows, as input, experimental data in the form of polarization curves for a reference SOEC, and, as output, the SOEC outlet temperature and efficiency (more details on the numerical model can be found in the previous study of the authors [
14]). The results of the simulations for the P2G system under different boundary conditions through the off-design model represent the thermodynamic input data for the economic analysis carried out in this study.
3. The Power-to-Gas System Thermodynamic Configurations
In order to evaluate how the operating parameters of the different system blocks affect the system performance (from the thermodynamic and economic viewpoints), different possible settings have been taken into account. The considered main key parameters are the operating pressure and temperature, whose variation can also influence the arrangement of the system components. Indeed, by setting the SOEC pressure (and, also as a consequence, the other sub-sections), two different layouts are generated. In the first layout, the SOEC, the HTM and the LTM are set at ambient pressure and the produced SNG is pressurized up to 60 bar in the C. & Sep. section. Instead, in the second layout, the whole system is pressurized at 8 bar, but the produced SNG is still pressurized up to 60 bar in line with the first layout. The pressure level of the second layout represents the current state-of the-art for pressurized co-electrolyzers of SOEC technology and this value derives from the study of Mehran at. [
21], in which an experimental pressurized SOEC co-electrolyzer has been analyzed. A general schematic of the P2G system is shown in
Figure 3: the highlighted pump (for inlet water) and compressors (for the CO
2 and the Sweep Air) are needed only in the pressurized configuration.
Regarding the operating temperature, two different settings have been evaluated for both layouts. The considered temperature and pressure configurations are summarized in
Table 1.
Analyzing the temperature settings, the followed pattern highlights two different P2G concepts: conventional (Ambient 1 and Pressurized 1) and innovative (Ambient 2 and Pressurized 2). Indeed, regarding the conventional concept, the SOEC operating temperature (850 °C) is in line with the state-of-the-art for high temperature electrolyzers [
22] and the HTM temperature (450 °C) corresponds to the point of maximum conversion rate [
13]. Instead, in the innovative concept, the temperatures of the SOEC and of the HTM have been shifted to operating points (600 °C) less conventional for the single components, with the aim to explore possible synergies among the sub-sections. Indeed, a viable solution to achieve the synergy between the SOEC and the HTM can be represented by the operation of both the components at relatively high temperature levels, as shown by lo Faro et al. [
18]. Finally, for both the temperature settings, the LTM operating temperature has been set after a parametric study of its effect, considering the typical temperature range of operation of this technology [
23].
4. Renewable Energy Input
In order to provide the electricity input to the P2G system, the coupling with an external renewable power source has been considered; in particular, the wind generation has been evaluated as a representative non-programmable electricity input. Nevertheless, the proposed approach is general, and it can be applied to other electrical energy sources.
In this study, a long-term yearly evaluation has been carried out and the data used in the analysis are related to the Italian wind generation (TERNA [
24,
25], data referring to year 2019). In particular, the normalized wind production profile (with respect to the yearly peak value) has been considered (see
Figure 4). It should be noticed that this is the average production profile on a wide region, used for the sake of generality of the carried out study, aimed at investigating a large-scale storage solution.
Starting from the SOEC design electric power input (reference size equal to 1 MW) and accounting also for the compression and auxiliaries’ consumption, the P2G off-design operating range has been assumed between −50% and +50% of the design inlet power. The power peak value of the coupled wind production profile has been initially set equal to 1700 kW (i.e., ratio between SOEC size and renewable peak equal to 1/1.7), with a mean annual power equal to 750 kW, corresponding to a nameplate power size equal to 3 MW and 2200 equivalent hours of operation per year. In a subsequent evaluation, the wind profile peak power to the P2G system power size ratio has been the object of a parametric analysis.
The analysis of the integrated renewable source and P2G storage operation has been numerically carried out, by calculating the time-step characteristic performance parameters of the coupled systems. The conducted analysis is of quasi-static type and, as a consequence, the dynamics are not accounted for. The variability of the wind has been included as a sequence of static steps. However, process dynamics (accumulation of mass and energy in the several components of the plant) can play a fundamental role in the estimation of the system performance and then, this aspect will be considered in future research. In particular, the operating strategy of the procedure is based on the comparison (in each single time step of the year) between the electric power produced by the renewable generator () and the operating limits of the P2G system ( and ):
- (1)
If < is introduced into the electric grid;
- (2)
If ≤ ≤ , powers the P2G process;
- (3)
If > , the quantity (-) is introduced into the electric grid;
where the subscript refers to the -th time step of the year.
5. Economic Analysis
In order to assess the feasibility of the P2G technology, an economic evaluation has been carried out. The main aim of this analysis is the estimation of the SNG economic value, corresponding in this study to the cost of production, that is, the minimum gas selling price allowing for economic feasibility of the initial capital investment. In particular, the economic feasibility of the P2G process is evaluated through a cash flow analysis, based on the Net Present Value (
) defined as:
where
[EUR] represents the total initial investment cost of the whole P2G plant,
[-] is the discount rate,
[EUR] is the net cash inflow (function of the SNG value, as specified below) at the
i-th year and
[year] is the useful time horizon.
The main output of the analysis, i.e., the SNG value, has been determined by imposing the condition of having a return on the investment in a considered time horizon. In all the scenarios investigated in this study, the time horizon has been considered equal to 20 years and the reference discount rate equal to 7% [
26].
5.1. Net Cash Inflow
In order to calculate the net cash inflow, the following general assumptions have been considered:
The main input/output mass and energy flows characterizing the P2G system operation are taken into account, quantifying the specific economic relevance.
Due to the intermittent renewable electricity input, the P2G plant works in the entire operating range of the SOEC (±50% of its design value); along a year, each input/output economic quantity is computed on a 5-min time step basis.
The net cash inflow in the
-th year is calculated as:
where
[EUR/year] is the revenue due to the
SNG valorization in the
-th year and
[EUR/year] is the operation and maintenance cost of the
P2G plant in the
-th year. Potentially,
[kWh/year] is the energy input of the P2G system in the
-th year and
[EUR/kWh] is the electricity purchase cost in the
-th year. The latter term is included in the analysis only in the specific case in which the owner of the renewable plant is different with respect to the owner of the P2G plant; as presented later in this paper, this parameter has been the object of a specific sensitivity analysis.
The revenue term mainly depends on the
SNG production at the outlet of the P2G system (evaluated through the P2G system full-load and part-load thermodynamic simulations), via the following equation:
where
[kg] is the total amount of SNG produced in the
i-th year (calculated by integrating single time-step data of the year),
[kJ/kg] is the yearly mean lower heating value of the SNG and
[EUR/kWh] is the target of the economic analysis, namely the specific SNG economic value per unit of fuel energy content. Eventually,
[ton/year] is the yearly amount of inlet CO
2 and
[EUR/ton] is the yearly avoided costs term in case of carbon tax application. This last term is included in the analysis only if a CO
2-based taxation scenario is considered; as shown later in the paper, this parameter has been the object of a specific sensitivity analysis.
The operation and maintenance cost term for the
-th year has been evaluated using the following detailed expression [
27]:
where:
[EUR/year] is the maintenance cost of the plant;
[EUR/year] is the operation cost of the plant due to the manpower;
[EUR/year] is the cost for the material substitution;
[EUR/year] is the cost for H2O and CO2 provision;
[EUR/year] is the cost for liquid treatment at the outlet of the plant.
In this study,
has been assumed equal to the 3% of the total investment cost [
28]. The specific operation cost of the P2G plant has been assumed equal to EUR 60/kW per year [
29]. Regarding
, it has been assumed related only to the replacement of the catalyst (
) in the methanation reactors and of the
SOEC stack (
), according to the Equations (5)–(7), as reported in [
10]:
where
[EUR/m
3] is the specific cost of the catalyst (assumed equal to 30 EUR/m
3 [
30]),
[m
3] is the volume of the catalyst and
[year] is the number of years.
Finally, the specific provision cost of the water has been set at 0.85 EUR/ton [
29], the specific provision cost of CO
2 refers to values presented in [
30] and
is assumed according to [
27]. The operation and maintenance costs used in this study are summarized in
Table 2.
5.2. Total Initial Investment Cost
In order to provide a first assessment of
with a comprehensive approach, the estimated costs related to each component of the plant can be taken into account. The main considered components are heat exchangers, methanation reactors, compressors, pumps, electrolyzer and heaters. The adopted approach refers to a study of Giglio et al. [
15], in which the cost assessment of a different P2G system has been carried out. In more detail, this study allows to assess the SNG value of a P2G plant that comprises technologies, such as the high temperature electrolyzer and the experimental methanator, not commercially available. A general cost estimation methodology for power plants, originally developed by the National Energy Technology Laboratory (NETL) [
31], is applied to the P2G systems; it provides correlations for the estimation of capital and variable costs related to each component installed in the plant. According to this methodology, the total initial investment cost is given by the sum of the components investment costs (
) plus an additional cost (
) related to the control system development:
where
is referred to the
-th component of the plant and
is the number of elements installed in the plant. The
cost is determined on the basis of the main component (i.e., the SOEC in this study, due to its highest electrical energy consumption) [
32].
The NETL
cost functions are reliable for technologies available on the market; in this case, according to [
29], the empirical relations and related coefficients have been obtained through wide market analyses. On the contrary, lack of extensive commercial price information currently occurs for the SOEC.
5.2.1. SOEC Cost
Due to the technology readiness level of the SOEC (mainly laboratory scale), a wide set of market cost data is not available to evaluate the investment cost of the electrolyzer via the above mentioned detailed equations; nevertheless, according to the estimated values reported in [
33], a first reference specific cost per unit of electrical power
, equal to 5700 EUR/kW for a reference size of 1 MW, has been initially assumed in this study. Therefore, the investment cost of the SOEC has been initially calculated as:
where
[MW] is the electrical power size of the SOEC and
is an exponential size correction parameter (in this study, assumed equal to 0.907 in line with data by Schmidt et al. [
33] on electrolysis cost trend forecast, elaborated by Salomone et al. [
10]). The specific cost of the SOEC results is very high if compared with other electrolysis technologies; as it will be discussed later, the cost of the SOEC represents the greatest share in the total investment, with this specific cost assumption, based only on a limited set of market data. Therefore, the reference SOEC specific cost has been object of a parametric variation in this study, as shown later in the paper.
5.2.2. Conventional Components Cost
For the conventional components of the P2G system (reactors, heat exchangers and fluid machines), the
term has been calculated through the following general equation [
29]:
where
[€] is the investment cost in the base year (the method refers to 2001 as base year),
is a dimensionless factor that takes into account the operating pressure and the type of material,
is a dimensionless factor related to the contingencies (assumed equal to 0.2 in line with [
10]),
is a dimensionless factor related to the taxes (equal to 0.2 as in [
10]) and
is the exchange rate Euro/Dollar (equal to 0.85 EUR/USD at the moment of investigation [
34]). In order to update the values of
, the
and
economic indexes—Chemical Plant Cost Indexes (CPCI) [
35]—have been considered.
The value of
has been calculated as [
10] using the equation:
where
is a characteristic quantity related to the size (evaluated for each component through the P2G system thermodynamic simulations in Aspen HYSYS
TM) and
,
and
are coefficients of the model. In particular, the characteristic quantity
is different depending on the considered component and it corresponds to:
Exchange surface [m2] for heat exchangers;
Electrical power [kW] for pumps and compressors;
Thermal power [kW] for heaters;
Volume [m3] for methanation reactors.
All the values used in this analysis for the coefficients of the model (
,
and
) refer to [
29] as specified below.
5.2.3. The Pressure and Material Correction Factors
The values of
for compressors and heaters have been assumed in line with [
15], respectively equal to 2.40 and 2.75. For the other components,
has been calculated as:
where, according to [
29],
depends on the operating pressure,
is the material correction factor, while
and
are empirical parameters provided on the basis of the component type. In particular, for pumps and heat exchangers,
has been calculated through the following empirical correlation:
where
[bar] is the internal pressure, while
,
and
are component-type specific coefficients [
29].
For the methanation reactors,
depends on both pressure and size. Its calculation is divided into three steps [
28]:
- (1)
The reactor volume is calculated on the basis of the needed catalyst quantity; the total volume of catalyst (
) is obtained as a function of the produced methane by means of linear interpolation of literature data on methanation reactors [
31]; then, the volume of a single reactor (
) can be calculated as [
15]:
where
is the number of reactors in the considered plant.
- (2)
The diameter of a single reactor can be evaluated with the hypothesis of cylindric reactor and assuming the ratio
[
28] (where
is the height and
is the diameter of the reactor), as:
- (3)
The following empiric correlation for
is finally applied [
29]:
The
correction factors used in Equation (12) have been selected on the basis of the typical material and the actual operating temperature of the considered component, according to the reference values reported in [
29].
In order to select coefficients of the cost correlations (11–12) according to [
29], additional design assumptions have been made: (i) the compressors are supposed of rotary or centrifugal type on the basis of the size; (ii) the pumps are supposed of centrifugal type; (iii) for heat exchangers with an exchange surface higher than 10 m
2, fixed tubes geometry is supposed, while for heat exchangers with an exchange surface lower than 10 m
2, double pipes are considered; (iv) if the
value for Equation (11) lays outside the correlation validity range (limit values can be found in [
29]), the extrapolated investment cost (
) has been evaluated as:
where
is given by Equation (11),
is the actual value of the characteristic quantity,
is the reference value of the characteristic quantity (i.e., the validity range limit near the actual value) and
is the scaling factor (assumed equal to 0.84 for compressors and equal to 0.60 for the other components [
29]). Then,
is used in Equation (10) instead of
if the characteristic quantity stays outside the validity range. The economic data for the components of the system are summarized in
Table 3.
5.3. Parametric Investigation
Once the above described economic model has been established, in order to evaluate the effect of different new scenarios and boundary conditions on the economic feasibility of the P2G proposed technology, several variation and sensitivity analyses have been carried out, by acting on some key parameters of the model.
A first analysis has been carried out on the economic sustainability of the proposed P2G solution in the current NG system, assuming to set the SNG value at a current NG market price value and investigating the resulting effect on the P2G maximum allowed investment cost. Secondly, in order to evaluate the impact of the electricity cost contribution in the final SNG cost, a specific sensitivity analysis has been conducted, varying the electricity purchase cost from 0 EUR/MWh (reference value in this paper) to 140 EUR/MWh (LCOE for a residential wind reference project [
36]).
Then, three key driving factors possibly affecting present and future economic performance of the P2G strategy have been considered, namely:
- (1)
Introduction of a carbon tax;
- (2)
Future SOEC specific cost developments;
- (3)
Renewable generator size in relation to the P2G power size.
Several values of the carbon tax regimes applied worldwide, as provided by the “State and Trend of Carbon Pricing” reports [
37,
38,
39], can be considered. According to these consecutive international reports, only few governments currently impose a carbon tax and prices are variable from country to country, ranging from few USD/ton
CO2 up to values larger than 100 USD/ton
CO2 (
Figure 5); in order to explore a wide range of current and future trend scenarios, the carbon tax value can be varied between a null value up to the maximum current values (i.e., tax values in some European countries such as Sweden), also expected in the future in various countries, due to the current trends toward carbon emission reduction.
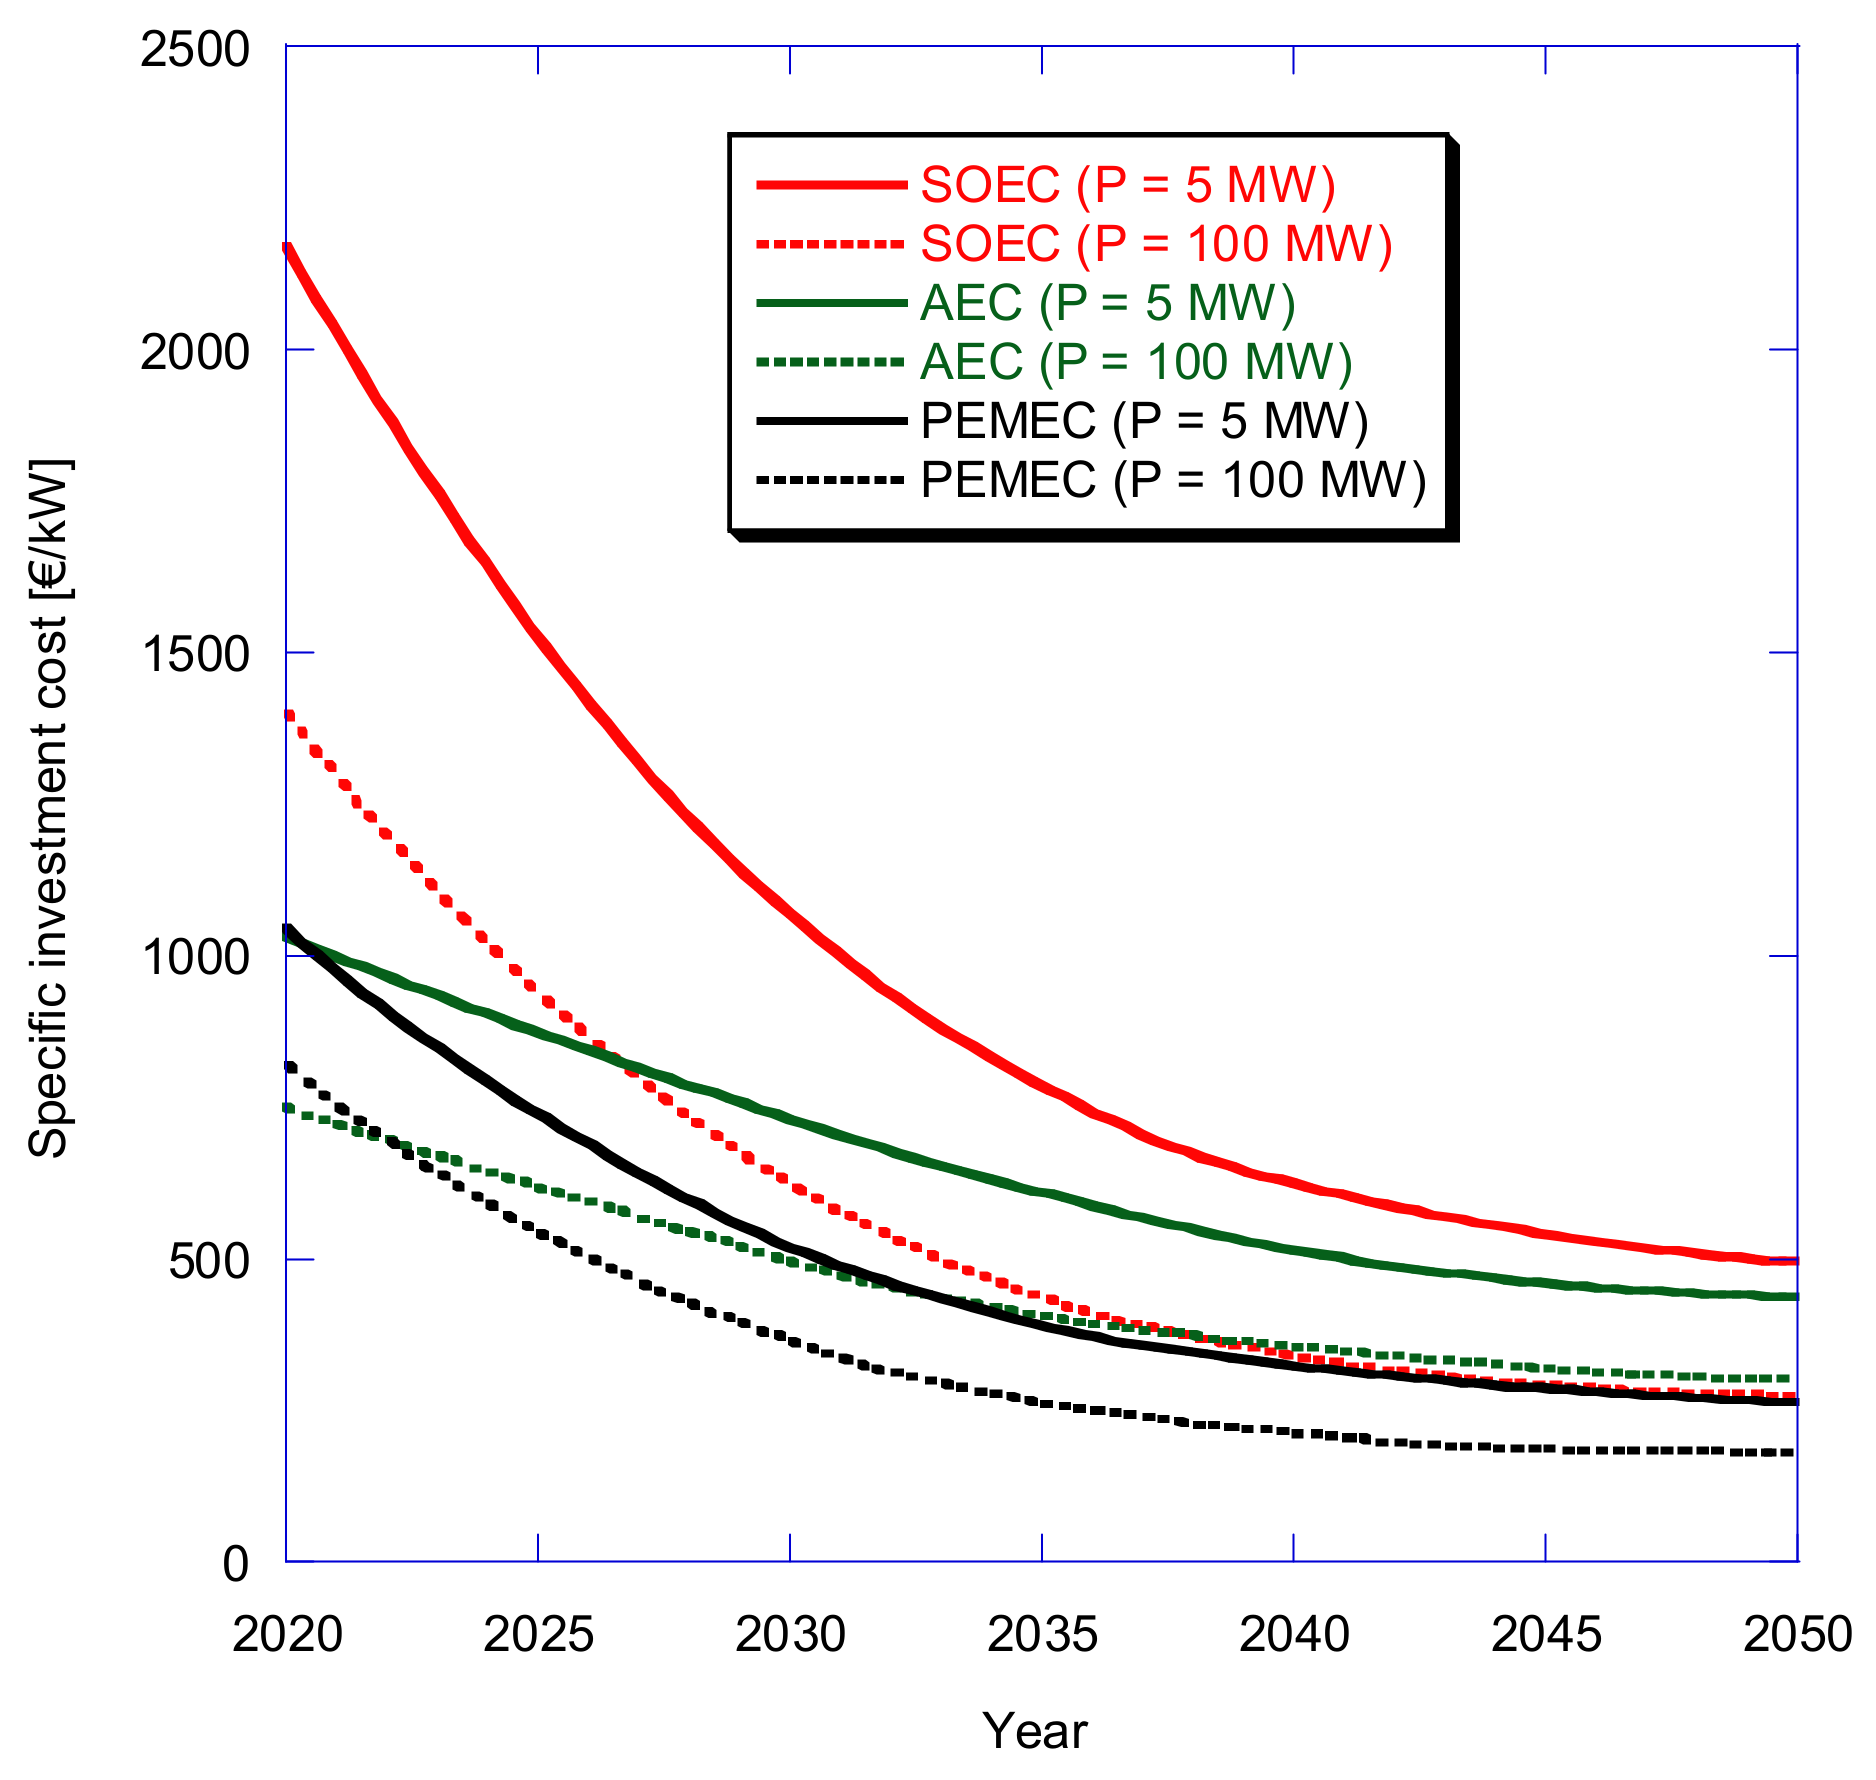
Regarding the SOEC technology cost developments, promising cost reductions related to the technological learning (cost reductions through an increase in the volume of production) as well as scaling effects (cost reductions as a consequence of an upscaling) are expected, according to the most updated roadmaps [
1]. State-of-the-art applications of Alkaline Electrolysis Cell (AEC) and Proton Exchange Membrane Electrolysis Cell (PEMEC) systems already range at multiple-megawatt-installations and economies of scale today represent a valuable factor for investment decisions. The SOEC technology is expected to reach this development in the intermediate future [
1]; in
Figure 6 the cost development of electrolysis systems is shown related to scaling effects and technological learning, with a prediction of SOEC specific costs around 500 EUR/kW in 2050.
Regarding the coupled renewable generator size, this parameter significantly affects the SNG production of the P2G plant, since it is the main energy input of the system. In particular, the ratio between the size of the non-programmable renewable generator and the size of the P2G storage system strongly affects the actual design/off-design conditions of its components and the resulting storage equivalent operating hours. In order to analyze its effect on the P2G system economic performance, the renewable source input peak electric power has been varied in this study to be between 1000 kW and 5000 kW, using the same normalized production profile introduced in
Section 4.
The effects of these three specific parameters have been investigated separately and then additional parametric analyses have been carried out, combining the mutual effects on the economic performance.
5.4. Performance Parameters
In order to compare the considered configurations, different global performance indicators have been evaluated. In particular, the system operation can be firstly characterized in terms of “operating time”, i.e., the total number of hours per year in which the available electric input power is within the SOEC operating range and therefore the P2G storage system is operative; the corresponding “P2G plant utilization factor” (ratio of the operating hours versus the total annual hours) is also considered.
Energy performance of the P2G system configurations in terms of renewable electricity utilization and conversion are also evaluated; in particular, the SNG yearly production is reported and two different corresponding performance indicators, named respectively “renewable energy utilization factor” and “P2G electric energy conversion rate”, have been calculated.
The “renewable energy utilization factor” is calculated as the share of the total available renewable energy actually used by the P2G system to produce SNG. This parameter could result in lower than 100% mainly depending on the renewable generator size, the P2G size and its operating range. Indeed, due to periods with renewable power overproduction or underproduction in comparison with the SOEC operating power range, a fraction of renewable energy can result in being non-storable.
The “P2G electric energy conversion rate” (
) is also introduced, and defined as:
where,
[kg/s] is the mass flow rate of produced SNG at the
-th time step of the year,
[s] is the
-th time step of the year (in this study equal to 300 s),
[kJ/kg] is the lower heating value of the produced SNG at the i-th time step of the year and
[kWh] is the wind energy available in the entire year.
The value is related to the energy conversion efficiency of the single P2G components, considering their values in design and off-design conditions occurring during the P2G system operation throughout the year.
6. Results and Discussion
In this section, the full results of the conducted analyses are presented. In more detail, at first the results of the preliminary economic analysis are shown, based on the thermodynamic arrangements presented in
Section 3, on the assumptions presented in
Section 4 and on the cost model for the system components provided in
Section 5. The considered configurations are compared by means of different energy and economic performance parameters; in particular, preliminary results of the SNG economic value are shown in a reference techno-economic scenario. Then, the results of different parameters manipulation are discussed. Firstly, the effect of a target SNG cost setting on the admissible investment cost is shown. Secondly, the impact of the electricity cost contribution in the final SNG cost is evaluated. Then, the effect of three separate key parameters is analyzed: (i) renewable generator size; (ii) introduction of a carbon tax; and (iii) future SOEC cost development. In order to evaluate the effect of the different parameters simultaneously, a combined analyses are carried out. In particular, the effect of the SOEC cost development is combined, at first, with the introduction of a carbon tax and then, with the variation of the renewable generator size. Finally, the combined effect of the variation of all the three parameters is shown.
6.1. Preliminary Results: Reference Techno-Economic Scenario
Table 4 shows some key results of the comparative analysis among the four considered P2G thermodynamic configurations, obtained in a reference techno-economic scenario, i.e., with the ratio between the SOEC power size and the renewable generation peak power equal to 1/1.7; with SOEC specific investment cost equal to 5700 EUR/kW and with no carbon tax application. The calculated results reported in
Table 4 show that the different thermodynamic configurations of the system provide similar values in terms of operating time during the year; at ambient pressure (Ambient 1 and Ambient 2 configurations), values are slightly higher with respect to the pressurized systems (the largest value is equal to 3896 h/year for the Ambient 2 case). The operating time of the system Ambient 2 corresponds to about 45% of the annual hours. In all the examined configurations the P2G storage operation covers less than half of the year.
The values of renewable energy utilization factor are also quite similar for the different configurations; this index is equal to about 74% for both the pressurized systems; in general, almost three quarters of the available renewable generation is used by the storage system.
Regarding the overall SNG production, results are higher for systems at ambient pressure: 216 ton/year of SNG are produced in case Ambient 2, while 189 ton/year are obtained in case Pressurized 1. This leads to larger values of the P2G electric energy conversion rate in cases Ambient 1 and Ambient 2: the calculated value of is up to around 59% for the storage system with ambient SOEC and equal to around 55% for the configurations with the pressurized SOEC.
Concerning the economic performance in the reference scenario, the calculated specific investment cost per unit of size power of the storage system show values ranging between 6400 EUR/kW and 6900 EUR/kW, depending on the considered system configuration; the solutions with higher SOEC operating temperature (e.g., case Ambient 1 vs case Pressurized 1) are characterized by larger investment costs, while the pressurized configurations show lower investment costs (about 6400 EUR/kW for case Pressurized 2) in comparison with the solutions where the SOEC operates at ambient pressure.
These results can be explained by observing
Figure 7, showing the calculated detailed cost contributions affecting the total investment cost. The specific cost of the SOEC component is almost the same for all the considered configurations and it results in the predominant contribution, in comparison with the cost of the other components; in particular, the contribution of the electrolyzer cost on the total investment cost ranges from the 82% of the total investment cost for the case Ambient 1, to the 89% for the case Pressurized 2. Indeed, the pressurized systems present higher costs in terms of Balance of Plant (BoP) with respect to the systems at ambient pressure, mainly due to the pressure impact on the material choice. The calculated cost of heat exchangers is the second most relevant contribution, and it is higher in the cases of SOEC with high operating temperature. The heat exchanger contribution results are higher for the system at ambient pressure if compared with the corresponding pressurized systems at the same operating temperatures. More in general, even if some cost contributions related with materials and compression are larger in the pressurized systems, the size of some key plant components (mainly heat exchangers and heaters) results are reduced. This can be observed in
Figure 7, which shows that the difference in terms of economic performance among the different examined thermodynamic configurations could be enlarged only if the SOEC cost would become less relevant, as discussed in the following paragraph.
Table 4 shows quite similar operation and maintenance (O&M) specific costs per unit of P2G power size, for the four examined configurations. The O&M costs are influenced by the size of the components, resulting in being slightly lower for the pressurized systems (about 440 EUR/kW
P2G for Pressurized 2).
In addition, the calculated economic value reported in
Table 4 of the produced SNG, i.e., its production cost in the considered reference techno-economic scenario, depends on the investment and O&M specific costs and on the SNG production in the four different P2G configurations. Despite the higher investment costs, the system configurations at ambient pressure present larger SNG production quantities during the year; the configurations with low SOEC operating temperature (Ambient 2) provide lower SNG production cost, with a value equal to 387 EUR/MWh, while the pressurized case with high SOEC temperature (Pressurized 1) provide the largest cost of SNG equal to 420 EUR/MWh.
These preliminary economic findings obtained in a reference techno-economic scenario show that the SNG value results are extremely high for all the considered P2G configurations, if compared to the current NG market price (for sake of comparison, the 2019 average NG price for household consumers in the Euro area is equal to 63.226 EUR/MWh [
39]).
6.2. Parametric Investigation Results
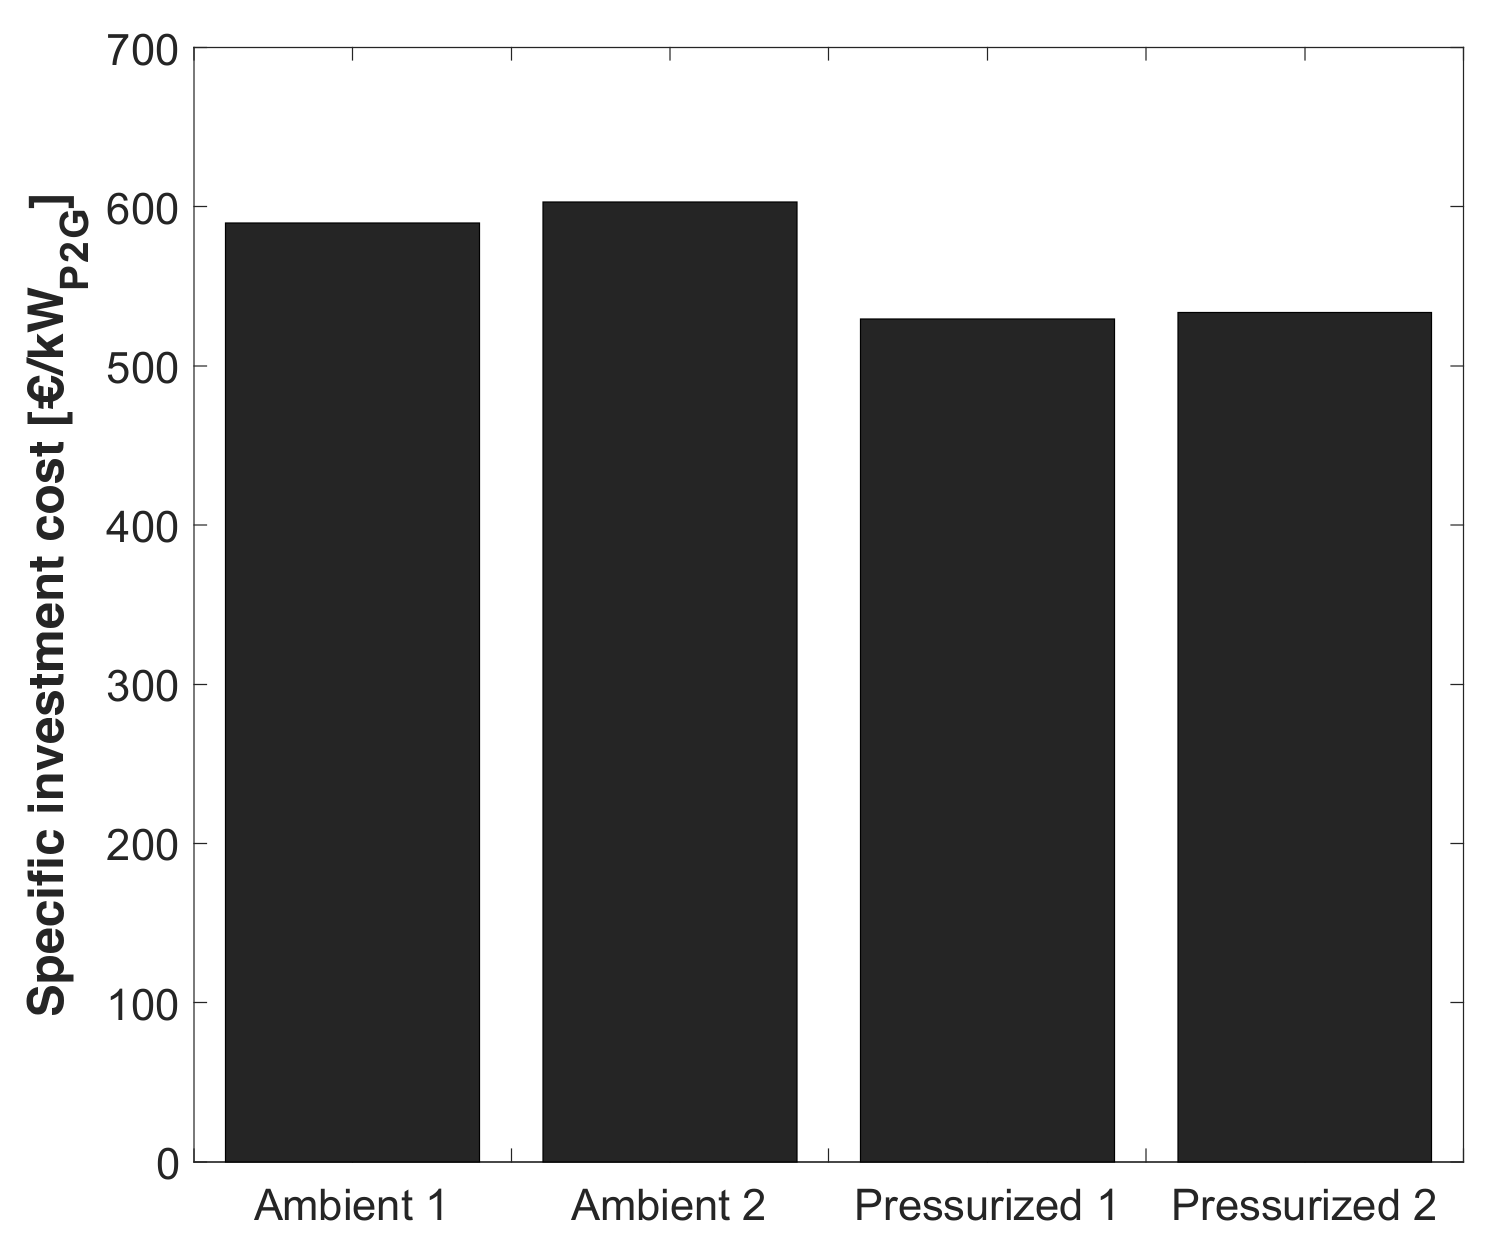
Figure 8 shows results of a first variation implemented in the economic analysis, carried out under modified boundary conditions. Specifically, the developed economic model has been applied to the same thermodynamic configurations of the P2G system but setting the SNG cost of product at a given target value, with the aim to calculate the corresponding maximum allowed total investment cost in the same considered time horizon. Equation (1) is used, where:
; the detailed analytical cost correlations for components in this case are not included and
is considered as unknown.
In particular, the SNG value has been forced to assume the target value equal to 63.226 EUR/MWh, i.e., the 2019 average NG price for household consumers in the Euro area [
40]. Moreover, for the sake of simplicity, the carbon tax is not included and the ratio between design power size of the P2G and the renewable generator size is the same of the reference techno-economic scenario.
The obtained results (
Figure 8) show that, in order to be competitive with the current NG pricing, the total investment specific cost of the P2G plant should be in the range of 530 to 600 EUR/kW
P2G of installed plant, i.e., one order of magnitude lower than the reference current specific cost of the SOEC component.
In
Figure 9, the results of the parametric analysis acting on the electricity purchase price are presented. The SNG value increases with the increase in the electricity price for the considered configurations, reaching a value of about 50% higher (in correspondence of an electricity price equal to 140 EUR/MWh) with respect to the reference case in this paper (0 EUR/MWh). In addition, in
Figure 9, the electricity purchase price in two different moments of a specific day is shown. In particular, referring to the second day of the year 2021, in the Italian scenario (data from GME [
41]), the electricity purchase price during the night (equal to 31 EUR/MWh) and during the day (equal to 65 EUR/MWh) has been considered. These two values, representative of the daily variability of the electricity price, lead to fluctuations of the SNG value during a single day.
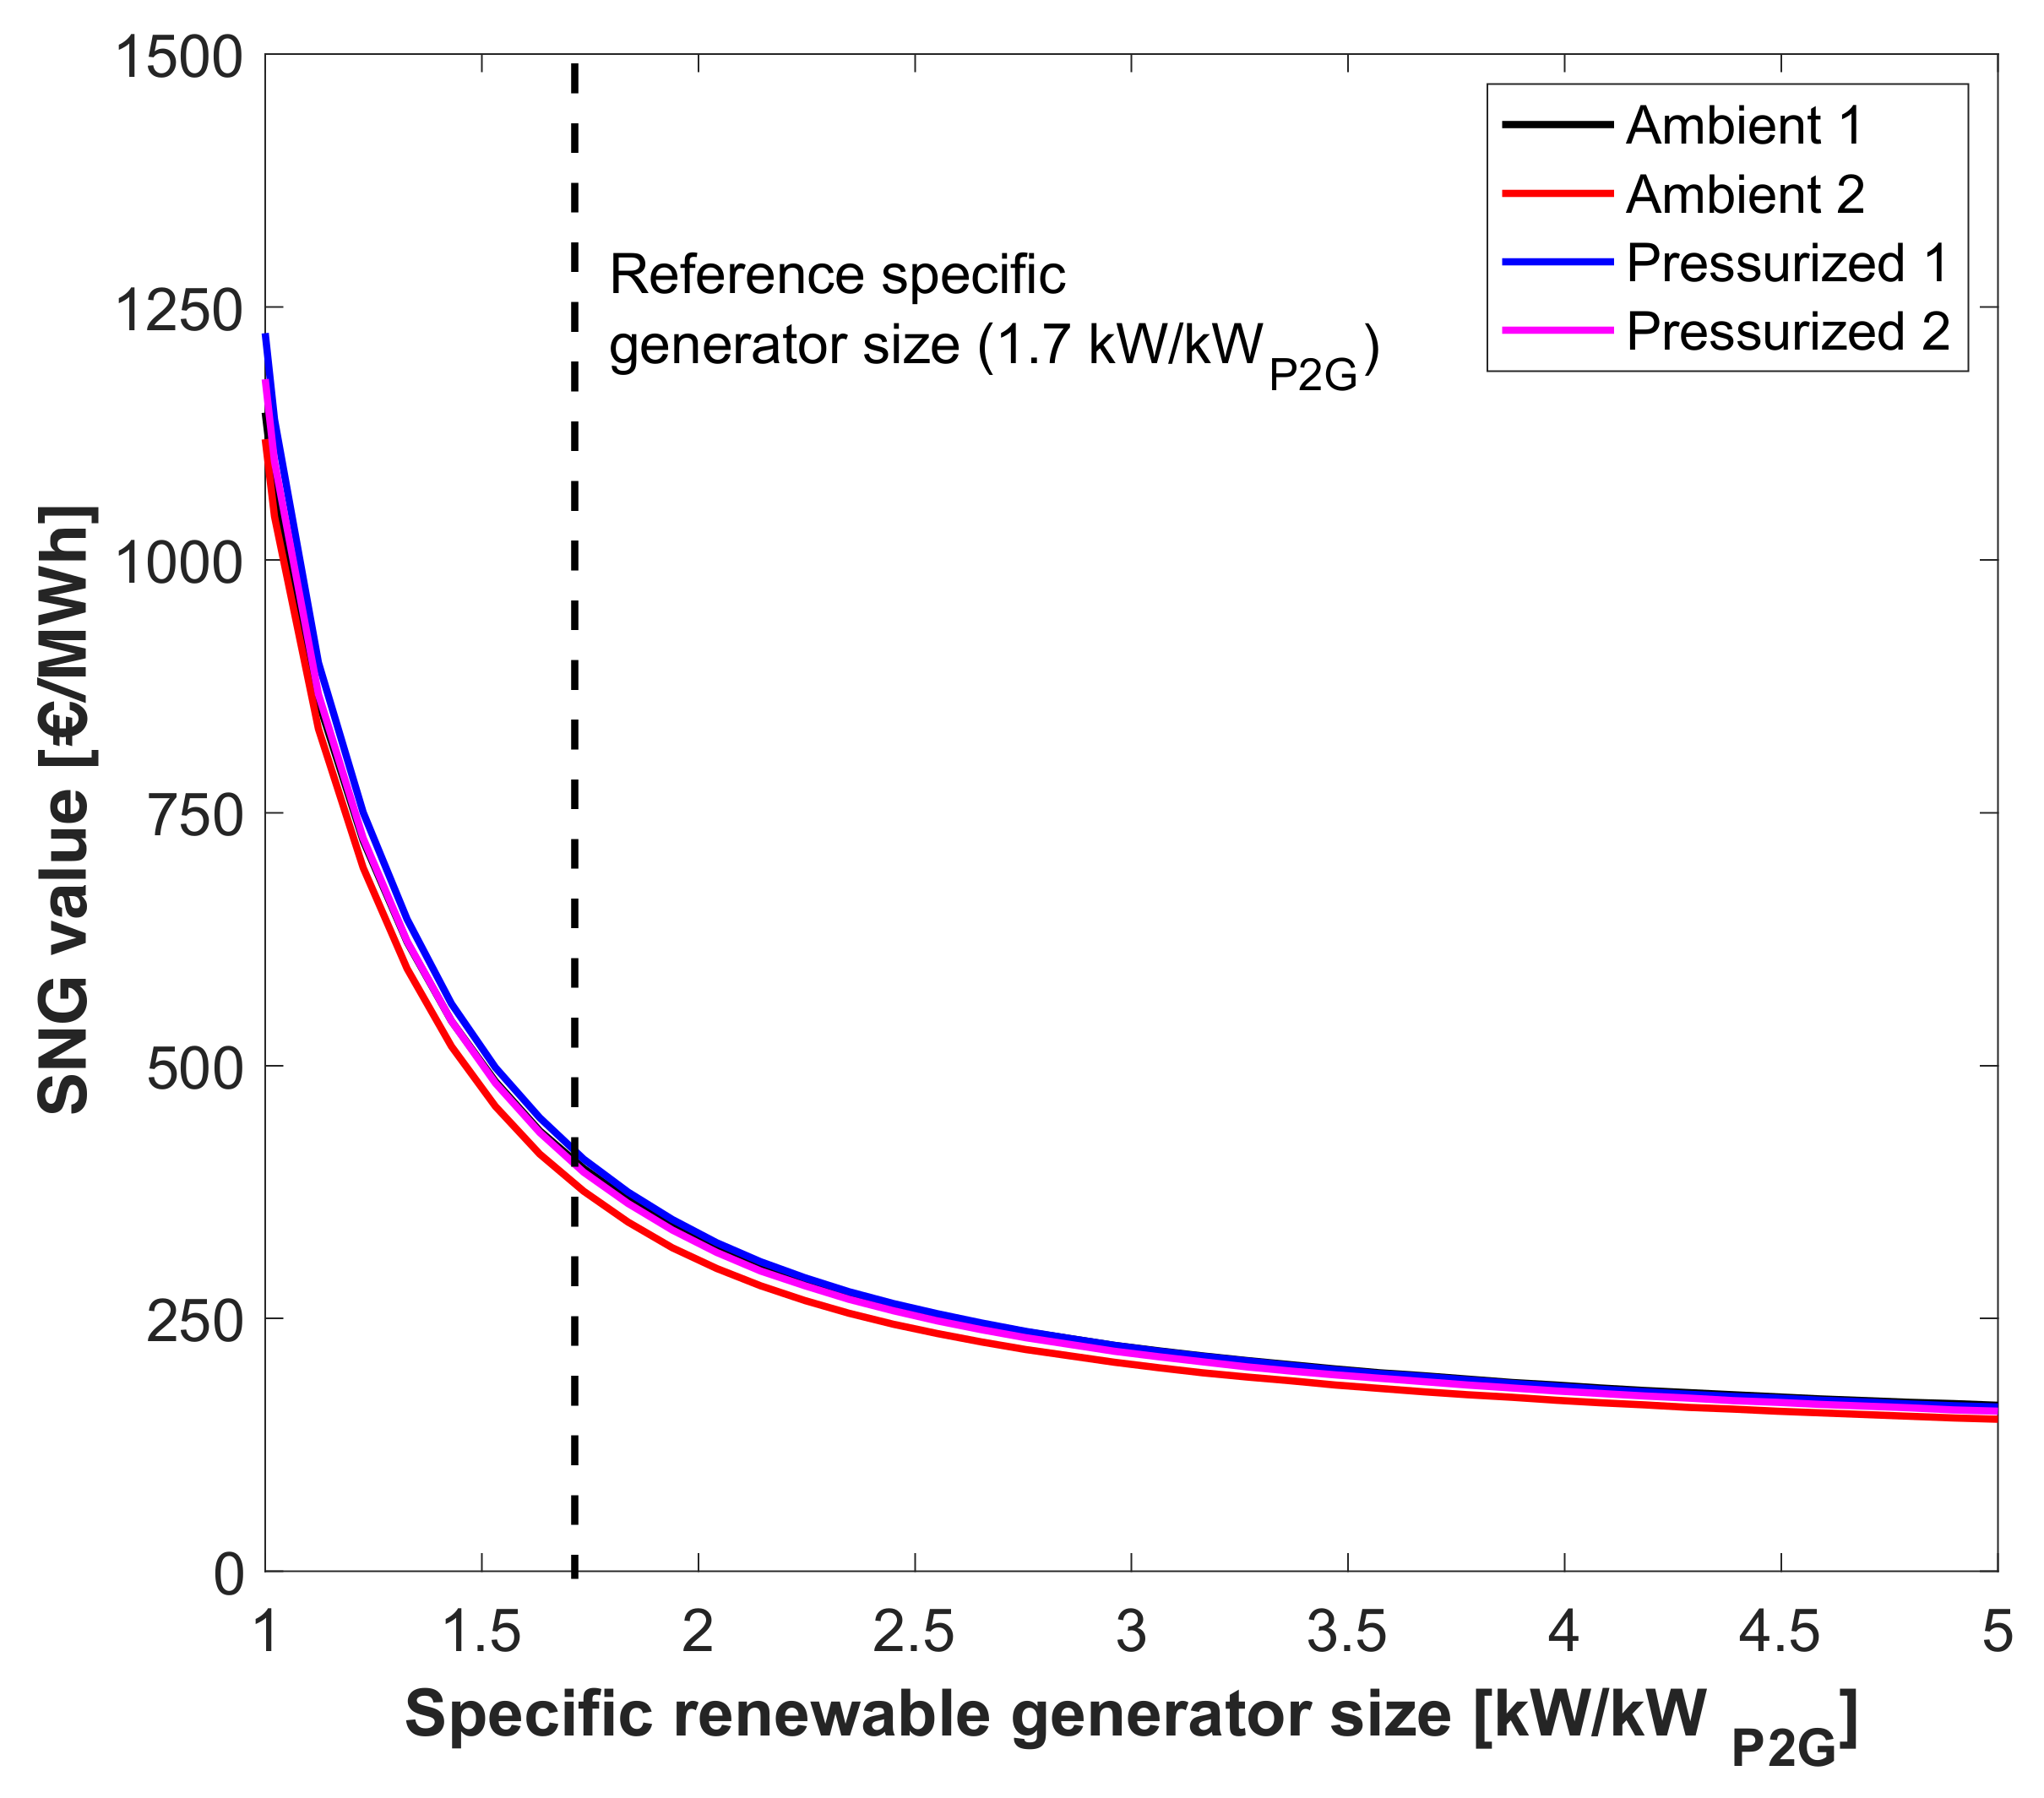
6.2.1. Effect of the Size of the Renewable Generator and of the P2G System
In order to analyze the economic effect of the renewable generator sizing combined with the P2G system size, an additional parametric analysis has been carried out. In this investigation, the P2G total investment costs have been kept equal to the values obtained with a detailed cost analysis in present-day reference conditions as reported in
Table 2; the effect of a CO
2 tax has not been included and the corresponding SNG value has been calculated via Equation (1). In particular, the renewable generator peak power size has been varied in the range between 1 MW and 5 MW per 1 MW of P2G power size. The results (
Figure 10) show that the SNG value decreases with the increase in the renewable generator size; in particular, for all the analyzed configurations, by increasing the ratio between the size of the renewable generator and the storage system, the SNG value seems to approach an asymptotic value equal to about 160 EUR/MWh, achieved for power size ratio values higher than 5 kW/kW
P2G. In this condition, the SNG value becomes lower with respect to the reference size ratio scenario, since the renewable power production is higher and the P2G plant can exploit a higher amount of electrical energy and then produce a higher quantity of SNG.
6.2.2. Effect of a Carbon Tax Application
In order to quantify the positive effect of the avoided carbon emissions due to the storage plant operation with CO
2 as input, a carbon tax analysis has been performed. The full range of values reported in
Figure 5 that covers the current carbon pricing worldwide scenario has been taken into account. A maximum value equal to 140 USD/ton
CO2, corresponding to countries with high taxation conditions, has been considered as a realistic boundary condition for the parametric investigation. The results of this analysis are shown in
Figure 11; the obtained SNG value monotonically decreases with the increase of the carbon tax for all the examined plat configurations. Case Ambient 2 provides the best economic results, with an SNG value of about 365 EUR/MWh in correspondence with a carbon tax equal to 140 USD/ton
CO2.
6.2.3. Effect of the SOEC Cost
The economic analysis has been further extended by varying the SOEC specific cost, considering cost developments and scaling effects reported in
Figure 6. Future cost projections up to year 2050 for three different power size levels of the SOEC electrolyzer system have been considered, namely small size (5 MW), medium size (50 MW) and large size (100 MW). The results of this analysis are presented in
Figure 12 for the different P2G thermodynamic arrangements and for different reference year of SOEC pricing. In more detail, in the year 2020, the SNG value is still too high (165 EUR/MWh for case Ambient 2 and 170 EUR/MWh for case Pressurized 2, considering the SOEC electrolyzer cost of medium size) if compared with the current NG price range; conversely, in the year 2050, with the SOEC cost reduction, the SNG value is much lower, showing a value of about 85 EUR/MWh for both Ambient 2 and Pressurized 2.
6.2.4. Combined Effects of Sizing, of CO2 Tax and of SOEC Cost
In order to show the effect of the different parameters simultaneously on the economic sustainability of the P2G plant, combined variation analyses have been carried out. In particular, the effect of the SOEC cost development expected in the future (considered mandatory for the SNG production cost reduction, due to its current very high impact on the total capital cost) has been combined, at first, with the introduction of a carbon tax in line with current CO2 pricing; then, the variation of the renewable generator size has been examined in combination with an investment cost evolution scenario. Finally, the effects of three different aspects are shown combined in a single economic map.
The joint economic effects of the expected SOEC cost development and of three different regimes of carbon tax are presented in
Figure 13. The two combined effects could lead to an additional reduction of the SNG value; while in the year 2020, the SNG production cost is equal to about 153 EUR/MWh for Ambient 1 and 159 EUR/MWh for Pressurized 1 (considering a SOEC of medium size and a carbon tax of 140 USD/ton
CO2), in the year 2050 the SNG value could become more competitive, with a value of about 64 EUR/MWh for both the configurations. The effect of carbon tax introduction becomes more relevant in the future scenarios, with the lowest SOEC cost, when it could cause a drop of around 20% in the SNG value, while currently the CO
2 tax could only reduce the SNG value of around 10%.
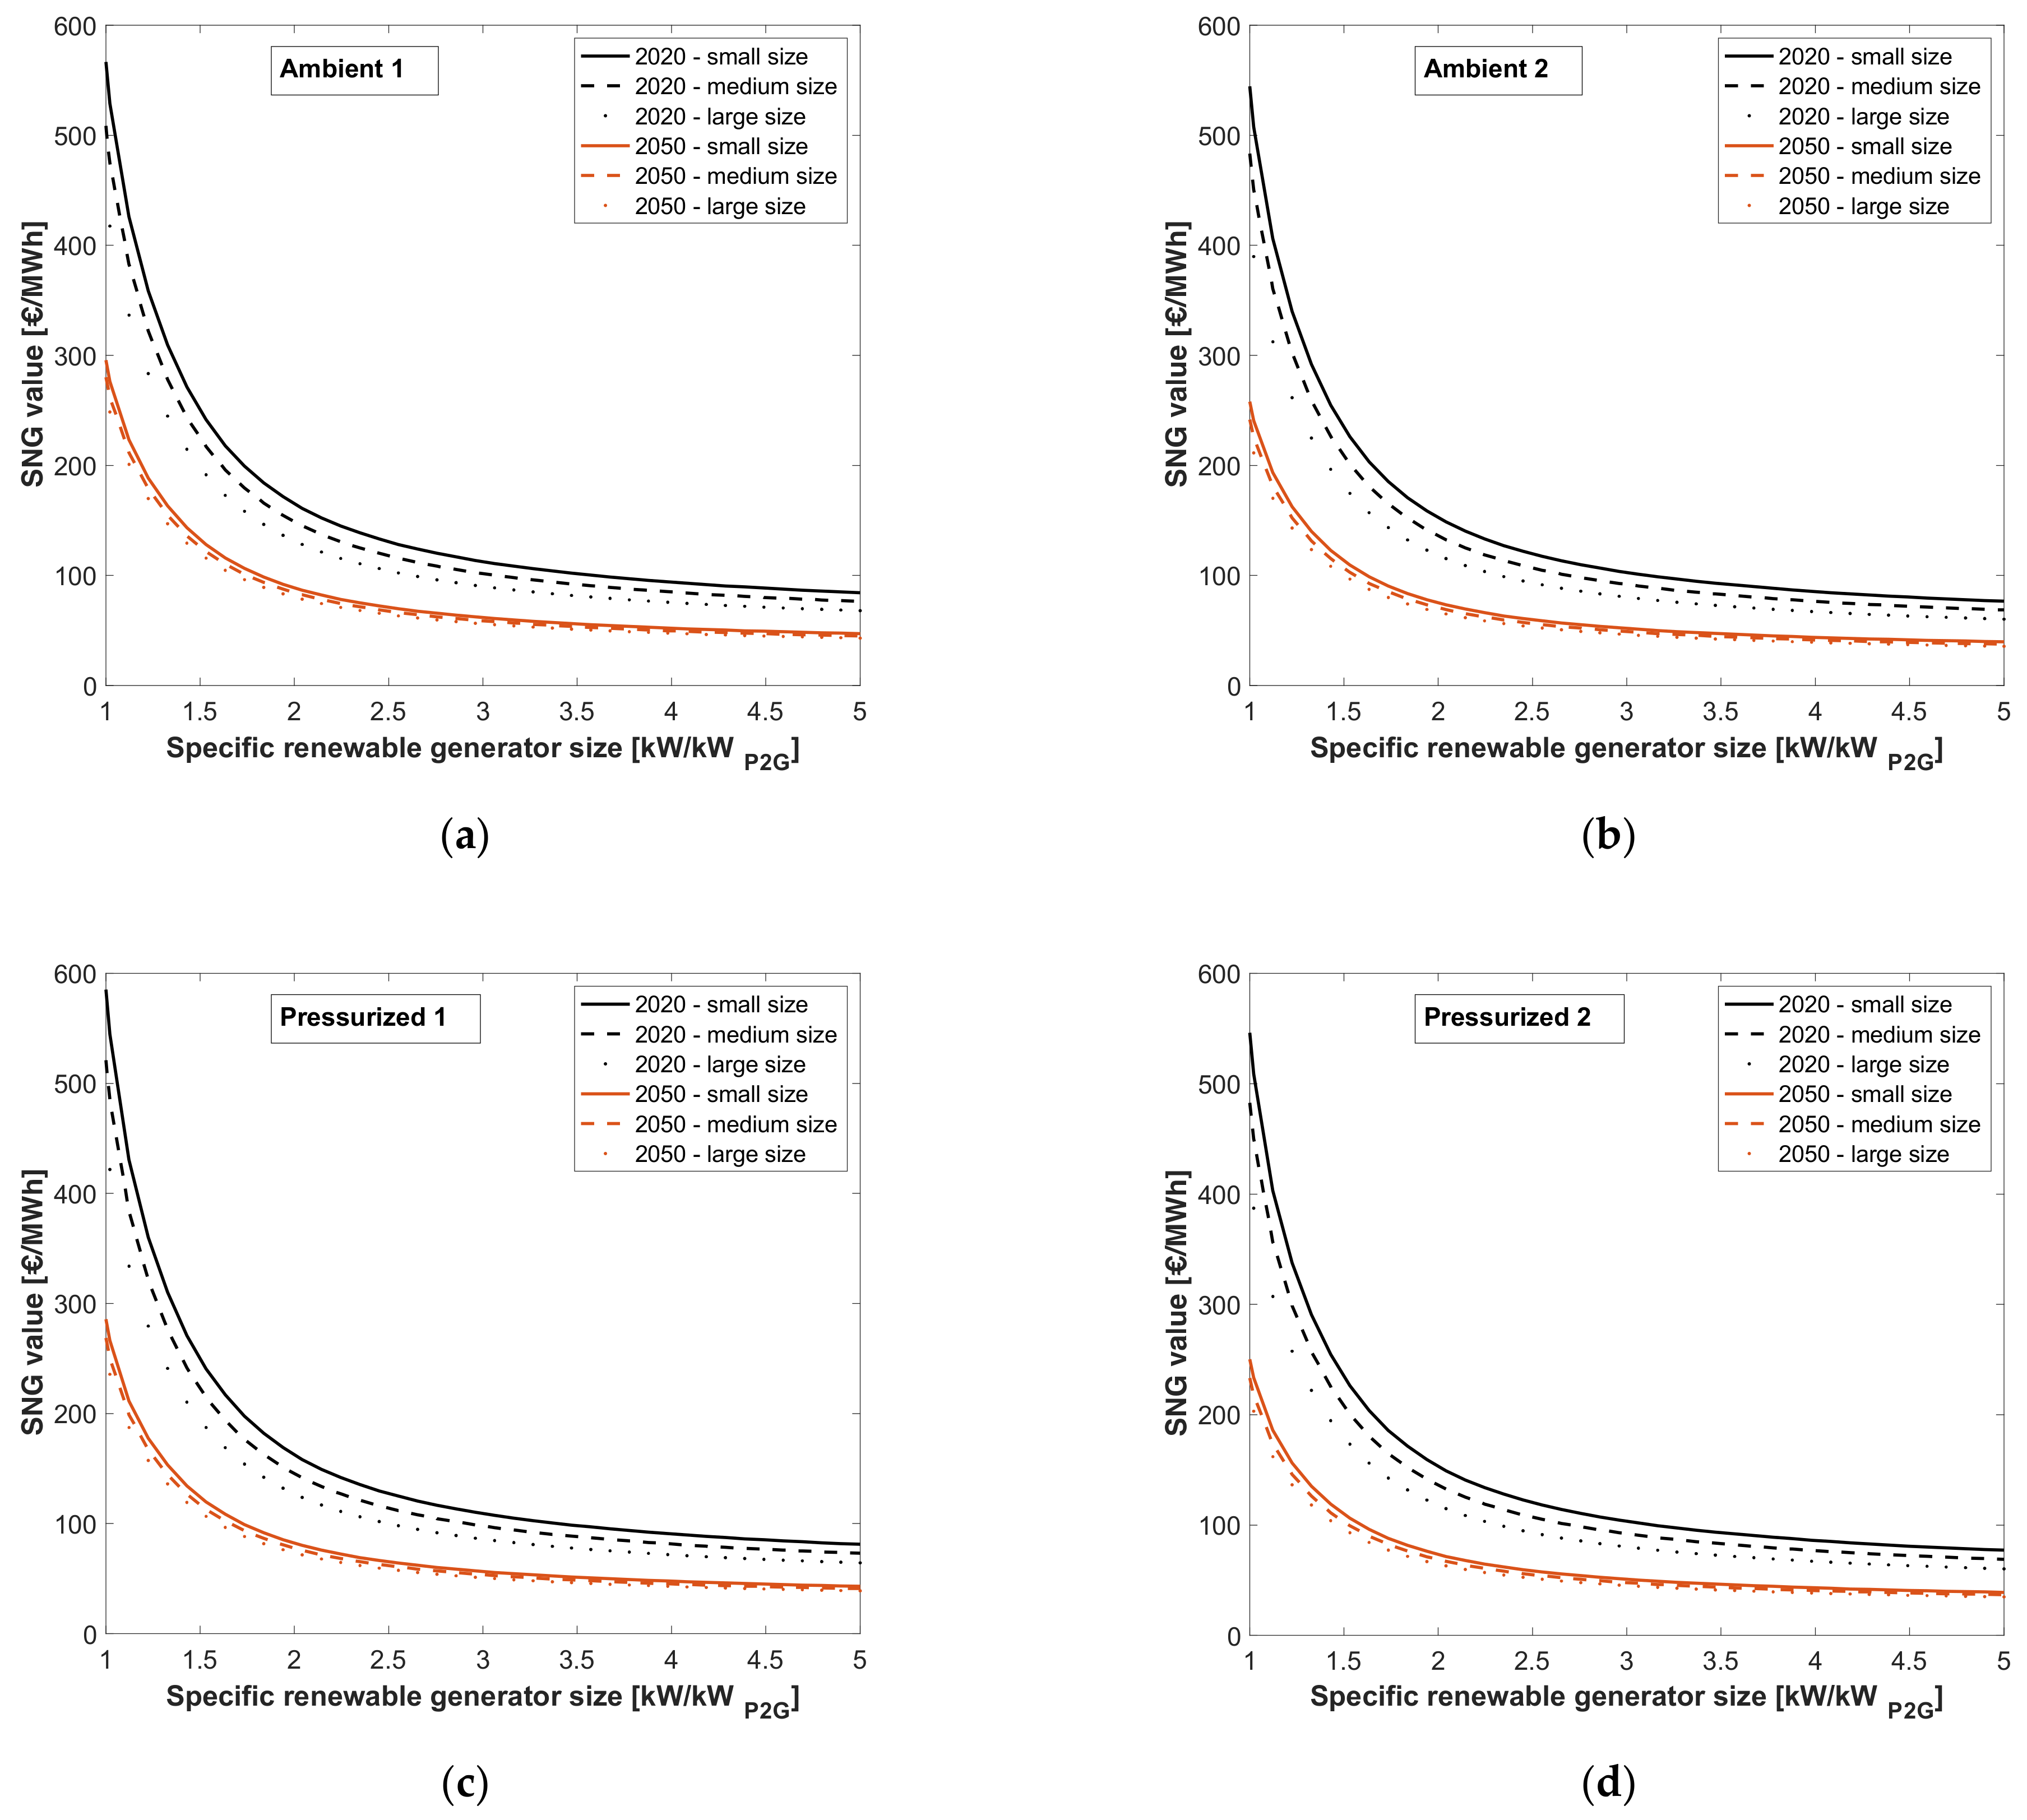
Figure 14 shows the parametric variation of the SNG cost versus the renewable generator specific size for different SOEC investment cost and size conditions and excluding the additional economic benefits of carbon tax. The analyzed cases show the same trend, for the different configurations: the SNG value decreases with the increase in the specific renewable generator size; in particular, the best configurations are Ambient 2 and Pressurized 2, with an output SNG value for both the systems of about 37 EUR/MWh (considering an oversized renewable generator by five times the P2G plant size, with a SOEC of medium size in the year 2050).
Finally,
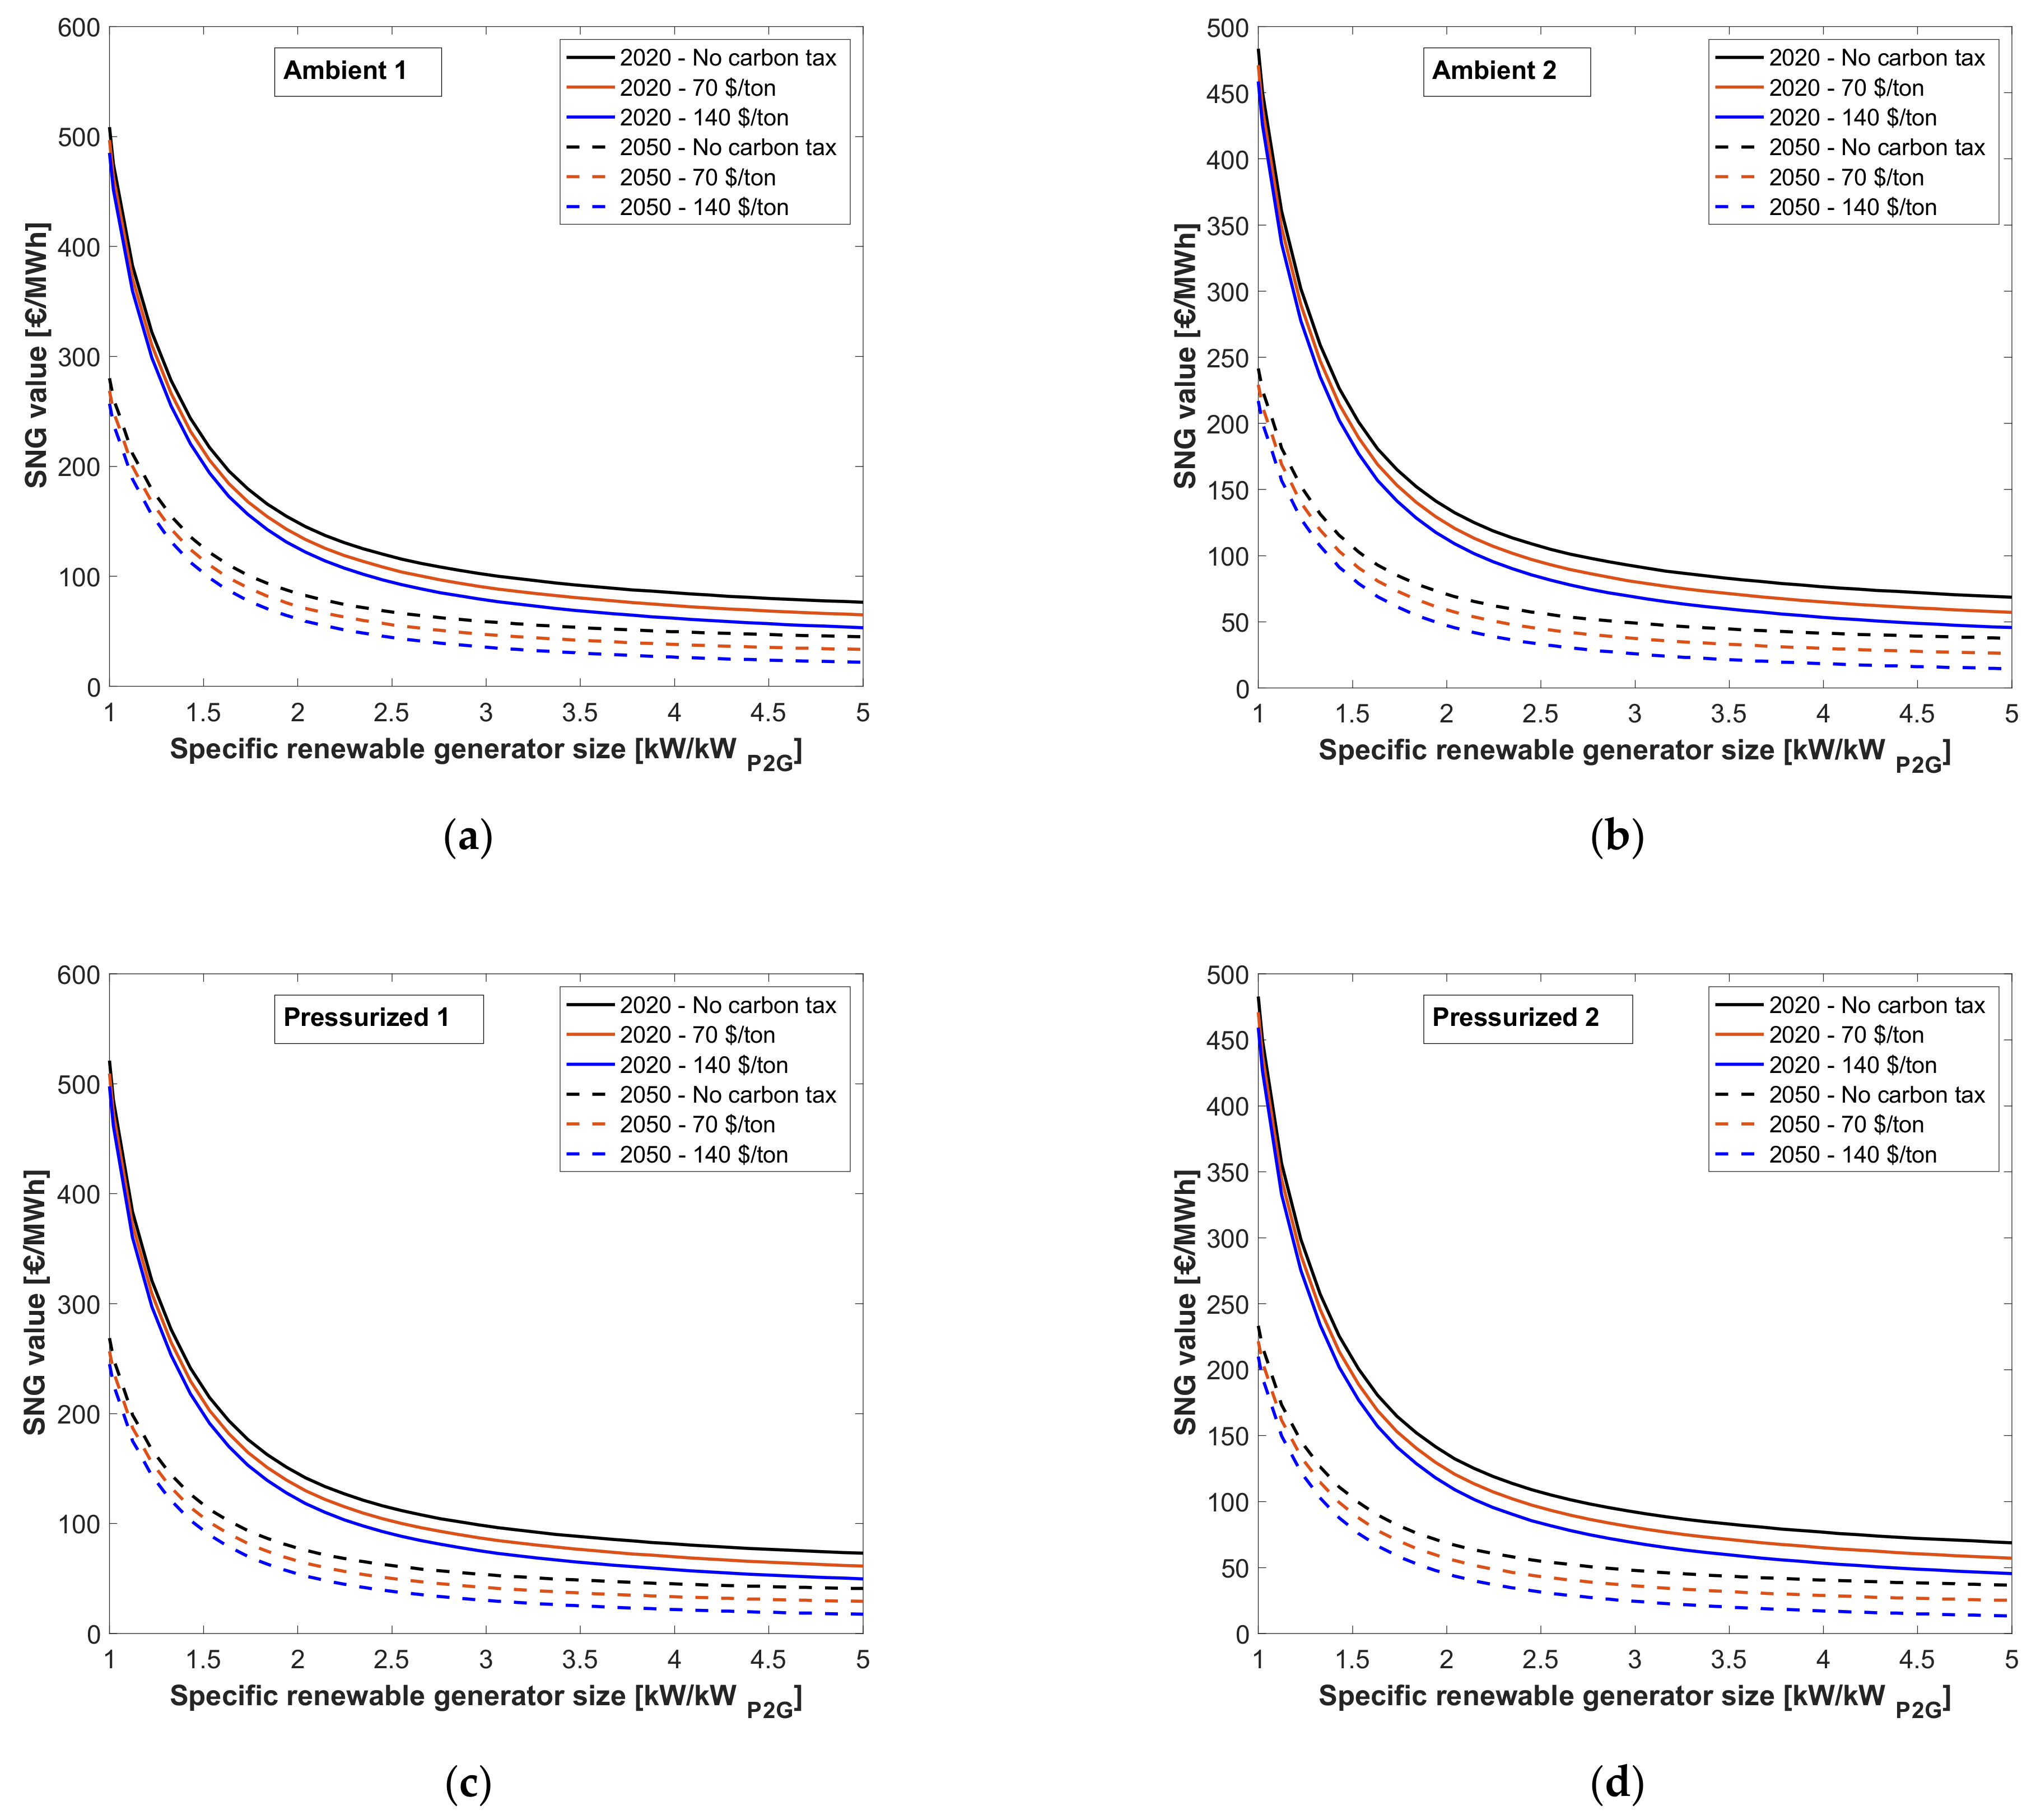
Figure 15 provides generalized maps of trend of the SNG value versus the specific renewable generator size, in two extremely different SOEC cost scenarios (corresponding to 2020 and 2050), for a medium size SOEC and for different carbon tax boundary conditions.
The shown plots are in line with the previous plots of
Figure 14, but they indicate that the introduction of a carbon tax leads to increasing benefits at high power ratio values between the size of the renewable generator and of the P2G system. Considering the concurrent beneficial effects of: (i) the large size of the renewable generator in comparison with the P2G system, (2) the future development of SOEC costs, and (iii) the introduction of carbon tax values larger than 100 USD/ton
CO2, the SNG specific cost could reach a value of about 14 EUR/MWh for configurations Ambient 2 and Pressurized 2.
7. Conclusions
The economic feasibility of an innovative P2G energy storage system coupled with a renewable generator has been investigated via a wide spectrum techno-economic analysis. The proposed P2G process is based on a high temperature co-electrolyzer of SOEC technology and on two methanation sections, namely a high-temperature experimental reactor and a conventional low-temperature section. Four system configurations were previously identified, accounting for different operating temperatures and pressures, have been compared using data of thermodynamic models developed in Aspen HYSYSTM and MATLABTM environments.
The economic investigation is based on a detailed methodology, providing correlations for the estimation of capital and variable costs related to each component installed in the plant, with the aim to assess the SNG economic value in terms of production cost through a cash flow analysis. In order to evaluate the effect of different characteristic input data and potential scenarios on the economic feasibility of the P2G solutions, a parametric approach has been considered. In particular, the effect of the total plant investment cost on the SNG value has first been investigated. Then, three key affecting factors have been considered: (i) introduction of a carbon tax; (ii) future SOEC cost developments; and (iii) renewable generator size in comparison with the storage system power size.
The results point out that the combination of a system at ambient pressure and with a thermal synergy between the co-electrolyzer and the high-temperature methanator presents the best economic performance; indeed, the pressurized systems and the system at ambient pressure with the components operating at different temperature levels show a higher SNG value. Finally, the parametric analyses show that with a lower cost of the SOEC and with an oversized renewable generator (approximately five times higher than the P2G system) the SNG value could be considered to be competitive in the NG market. In addition, it has to be taken into account that the SNG from P2G routes can contribute to increase the share of renewable energy in the transport and heating sectors, minimizing at the same time the expansion of the electricity grid infrastructure. Therefore, the P2G technology can play a key role in the next phase of the energy transition.
In future studies, in order to complete the energy conversion cycle of the proposed solution, the behavior of the storage system will be evaluated when integrated in a real scenario of functioning, with a real renewable production and a real electrical demand, considering also different energy vectors. In addition, process dynamics can play a fundamental role in the evaluation of the system performance and then, this topic will be further researched in the future.


 ,
, 


