
Earth-Mover-Distance-Based Detection of False Data Injection Attacks in Smart Grids

 ,
,
Abstract
:1. Introduction
- (1)
- It has been found that the differences between the probability distributions of data variation in different periods may overlap with each other, and the results are unsatisfactory if they are used directly for attack detection. Therefore, Joint Image Transformation (JIT) is used to map the variation of measurement data. The proposed method makes the probability distribution of data variation more significant by stretching and compressing, which provides a data basis for accurate detection of FDIAs.
- (2)
- Considering the dynamic correlation of adjacent moment measurement data, a FDIAs detection method based on Earth-Mover Distance (EMD) is proposed. The difference between the probability distribution of different measurement data variation is compared through EMD.
- (3)
- The detection method of this paper has been proven to have high accuracy through case studies.
2. Background
2.1. System Model
2.2. Bad Data Detection and Identification
2.3. Principle of False Data Injection Attack
3. Methodology
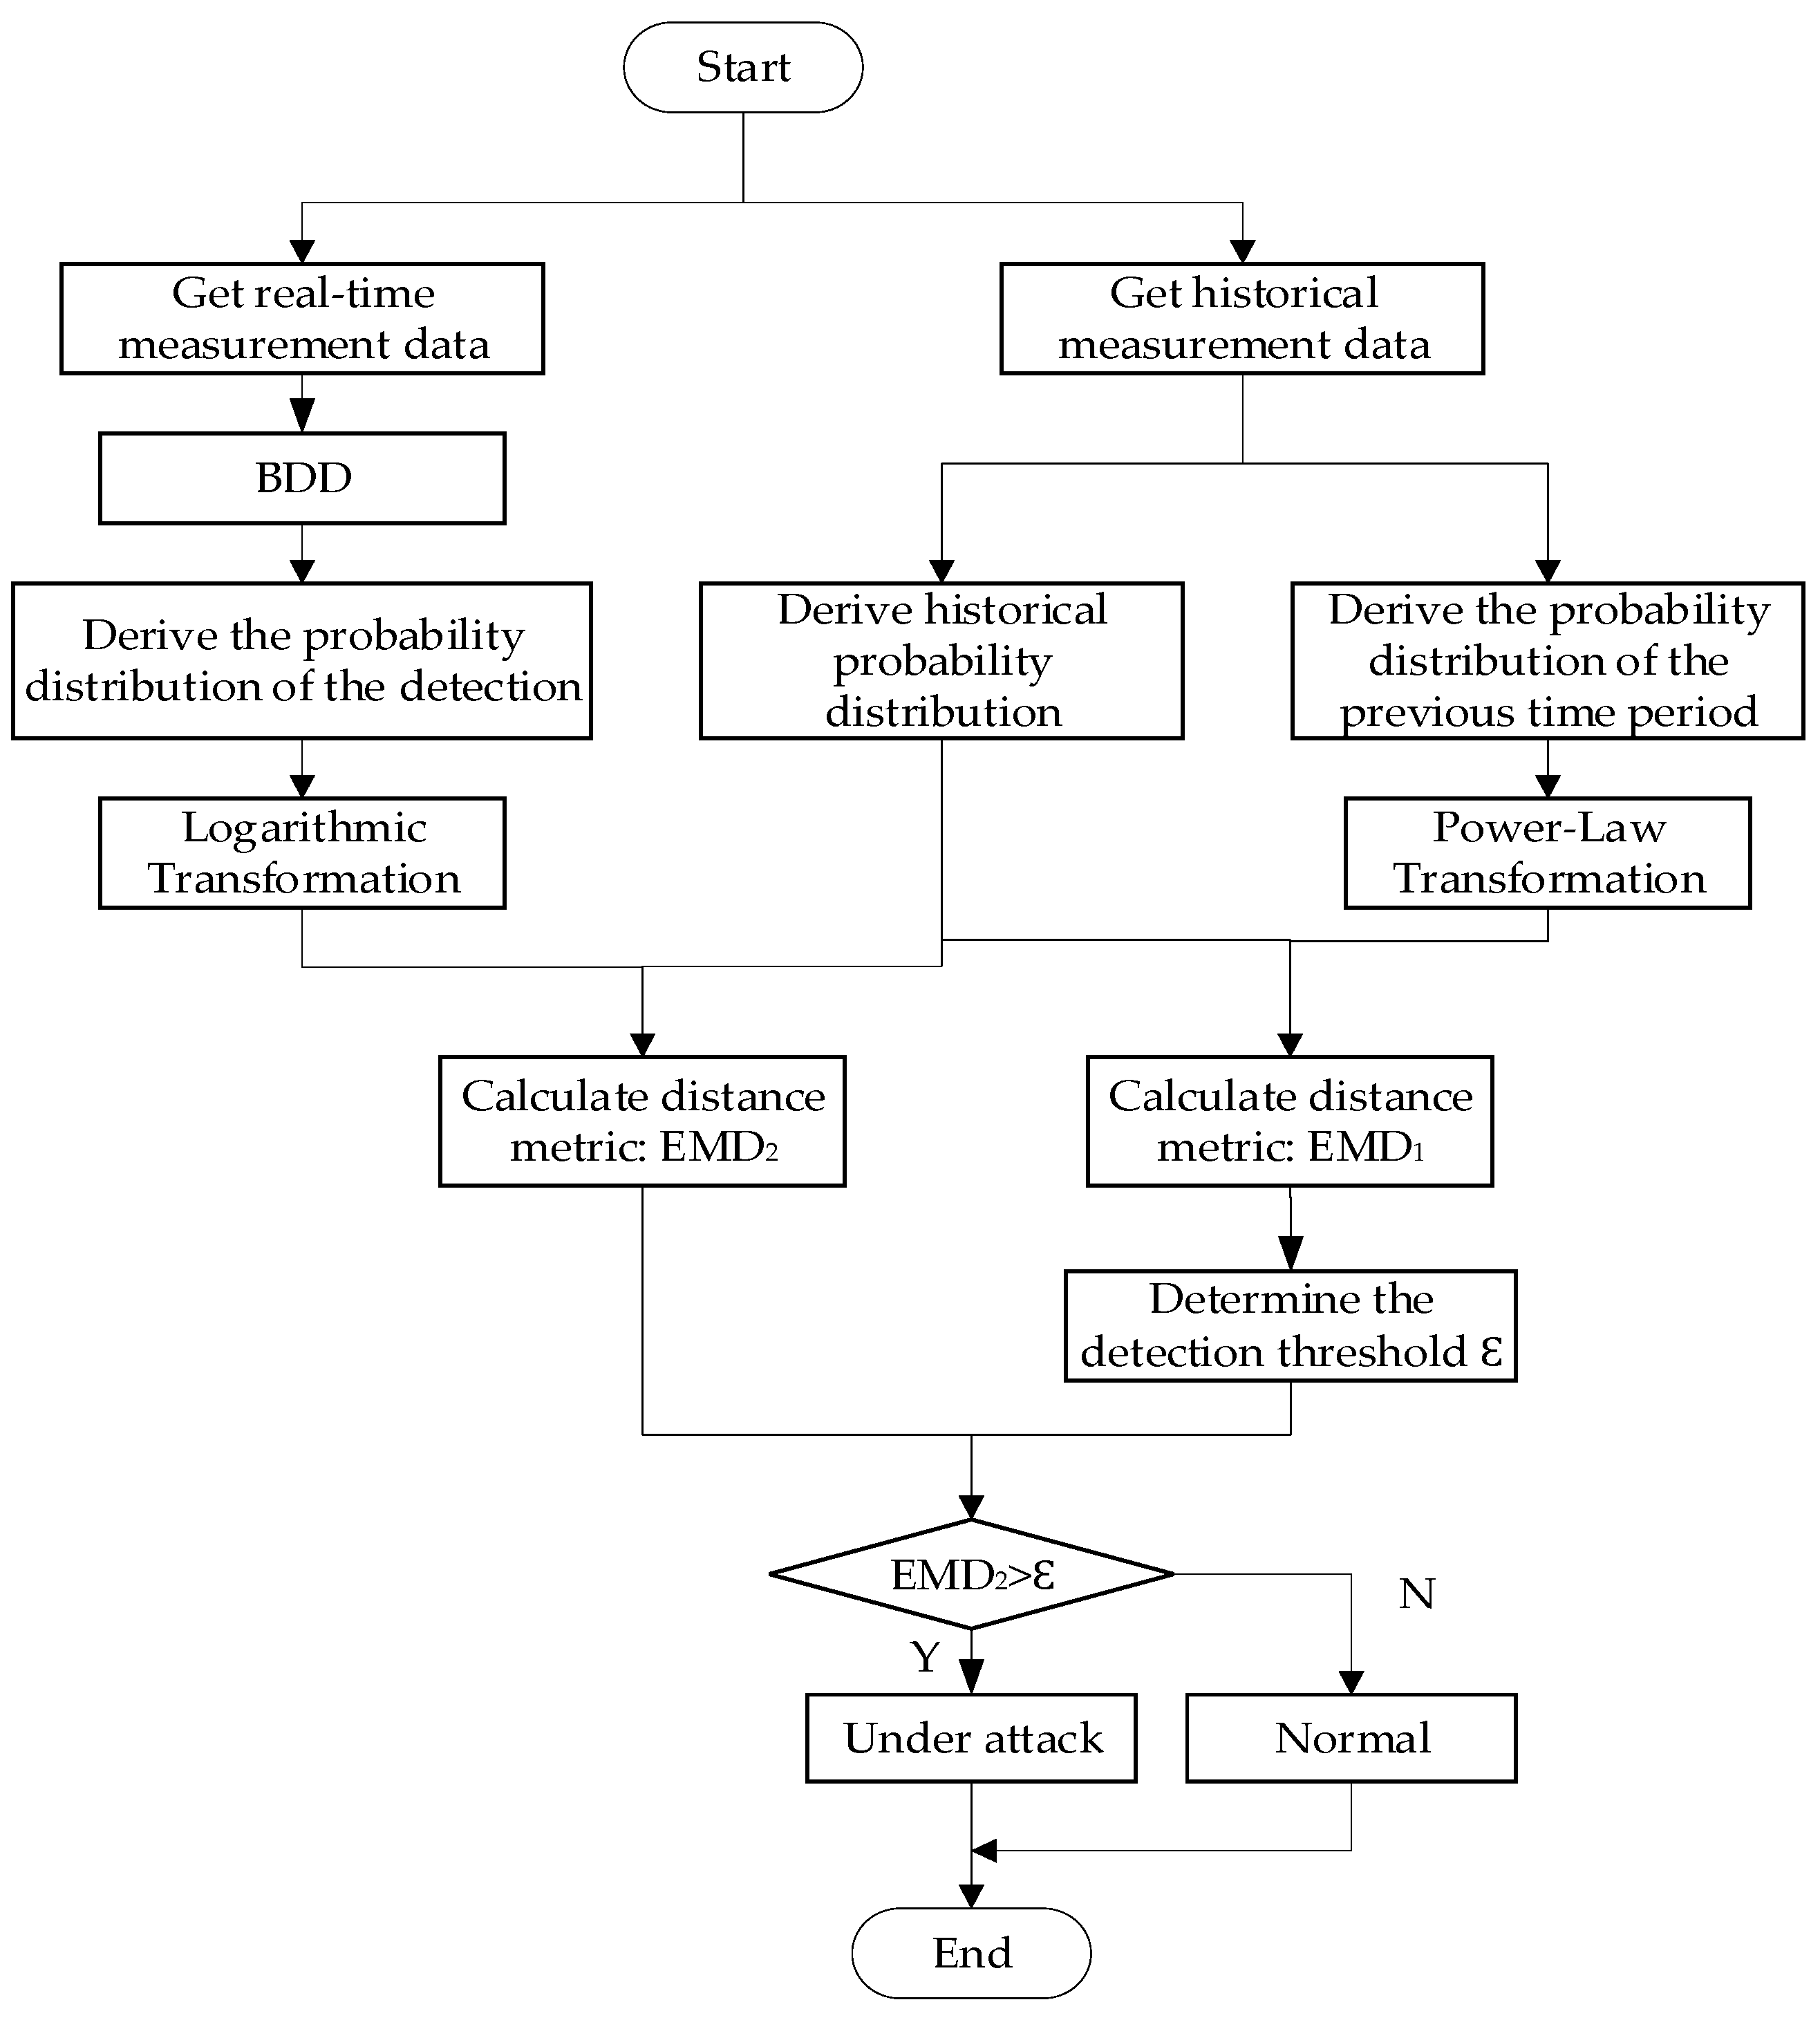
3.1. Proposed Schemes
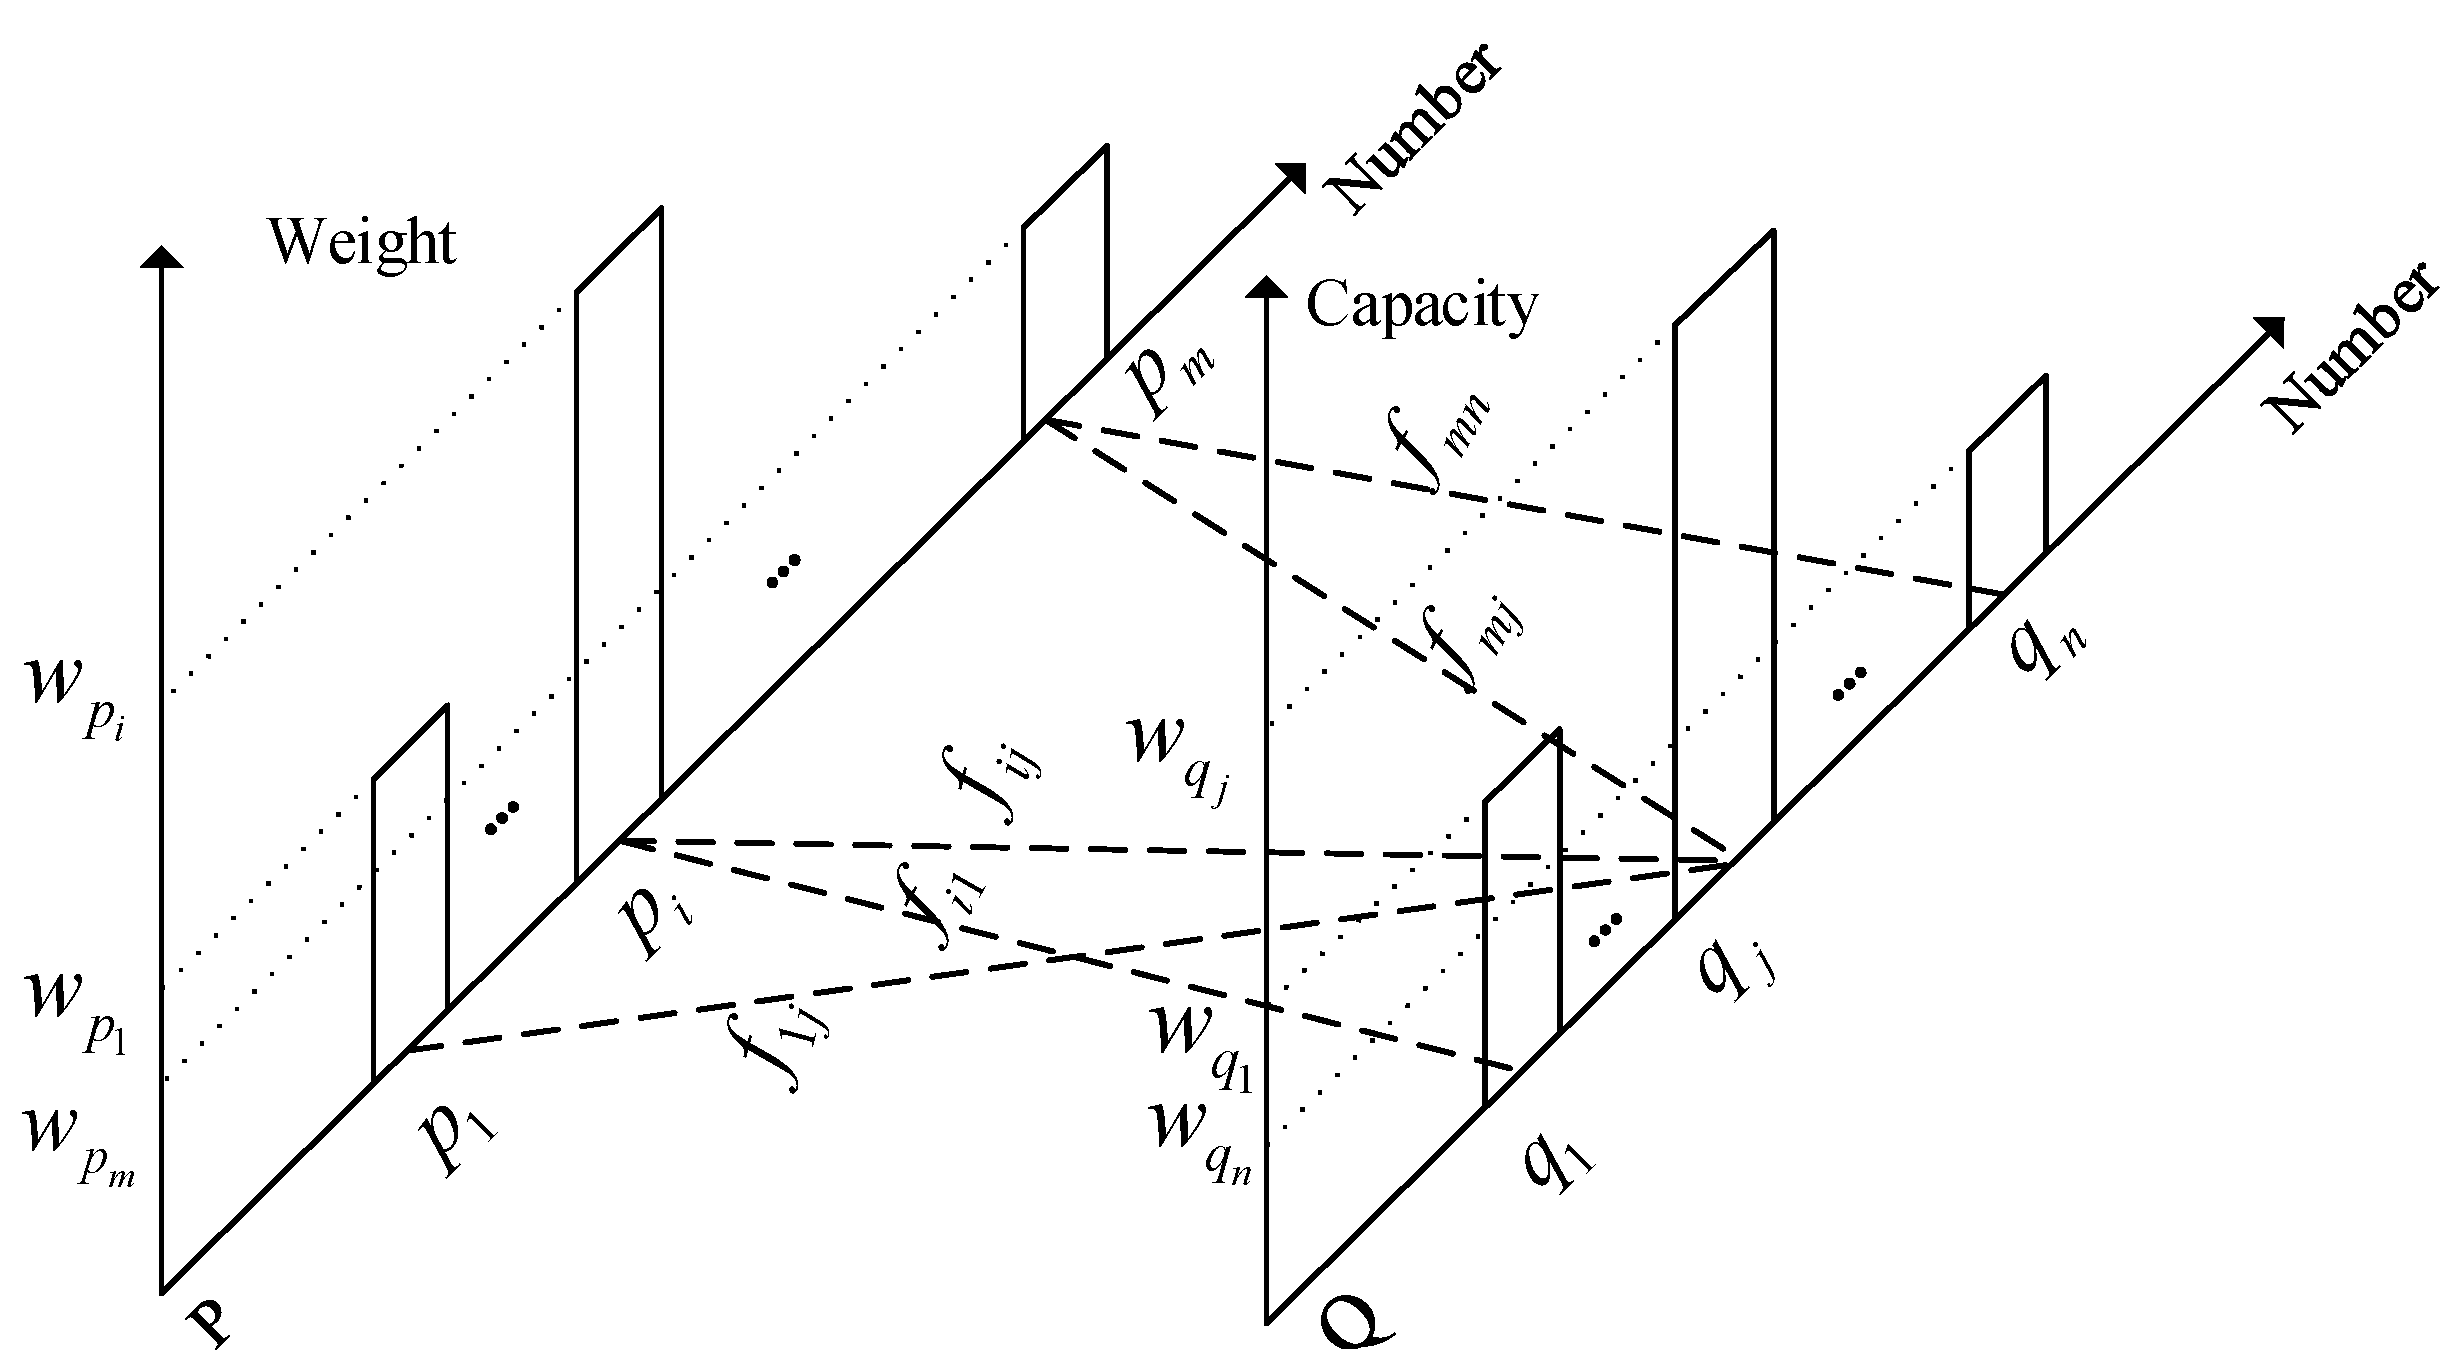
3.2. Earth-Mover Distance
- (1)
- It can be moved from to and cannot be moved from to .
- (2)
- The sum of supply weights moved from to cannot exceed total weight .
- (3)
- The sum of supply weights gained by in cannot exceed total capacity .
- (4)
- The total number of movements to the minimum of the total supply weight in and the total capacity in .
3.3. Joint Image Transformation Technology
- (1)
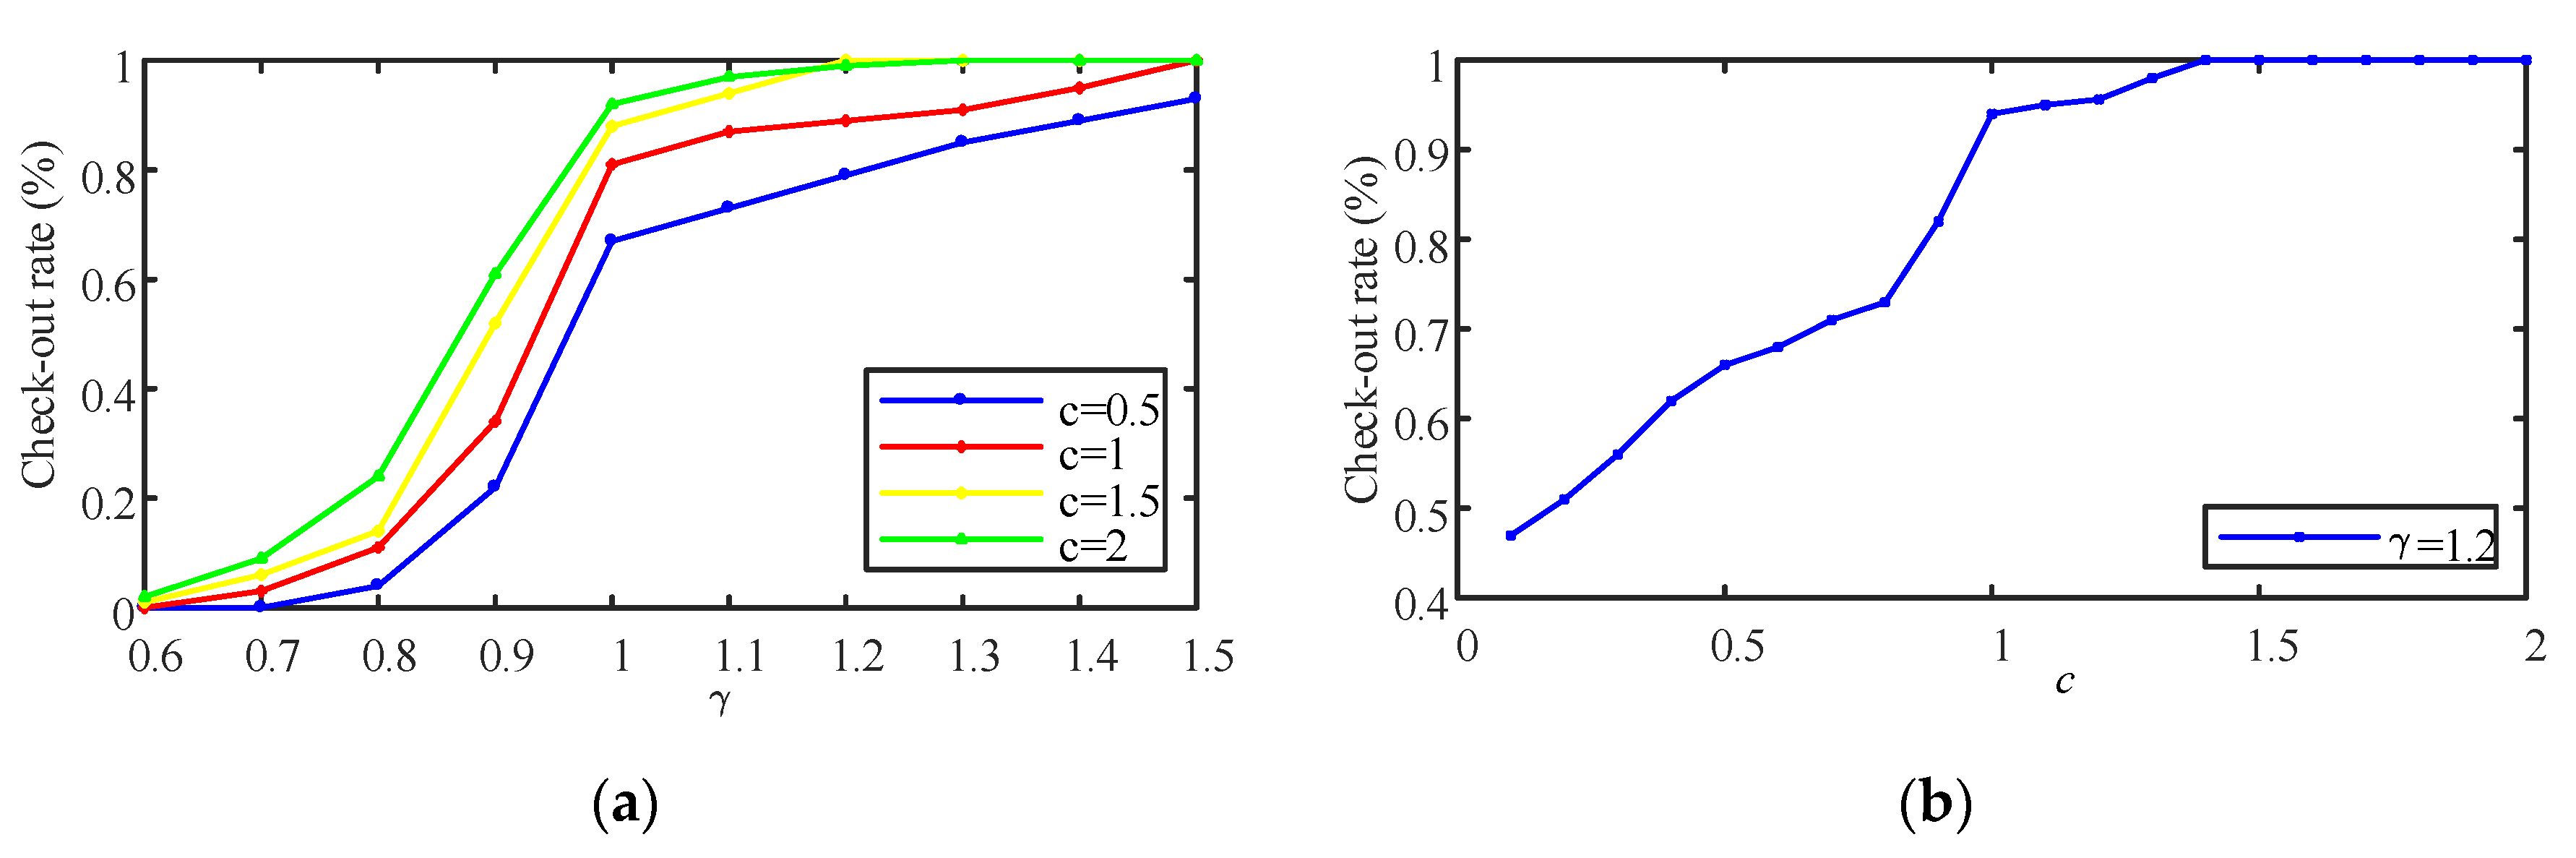
- Power-Law transformationwhere and are positive constants. If , power-law transformation can map small range of input measurement data variation into wide range. Similarly, it can also map the broader range into narrower range. Here, power-law transformation is used to map a wide range of measured data variation as input to a narrower range of measured data variation output.
- (2)
- Logarithmic transformationwhere c is scale proportional constant. In the field of image processing, logarithmic transformation transforms the brightness by expanding the value of dark pixels in the image and compressing the higher brightness value. Here, logarithmic transform is used to map a narrow range of measured data variation as input to a wider range of measured data variation output.
3.4. Threshold Determination
4. Case Simulation
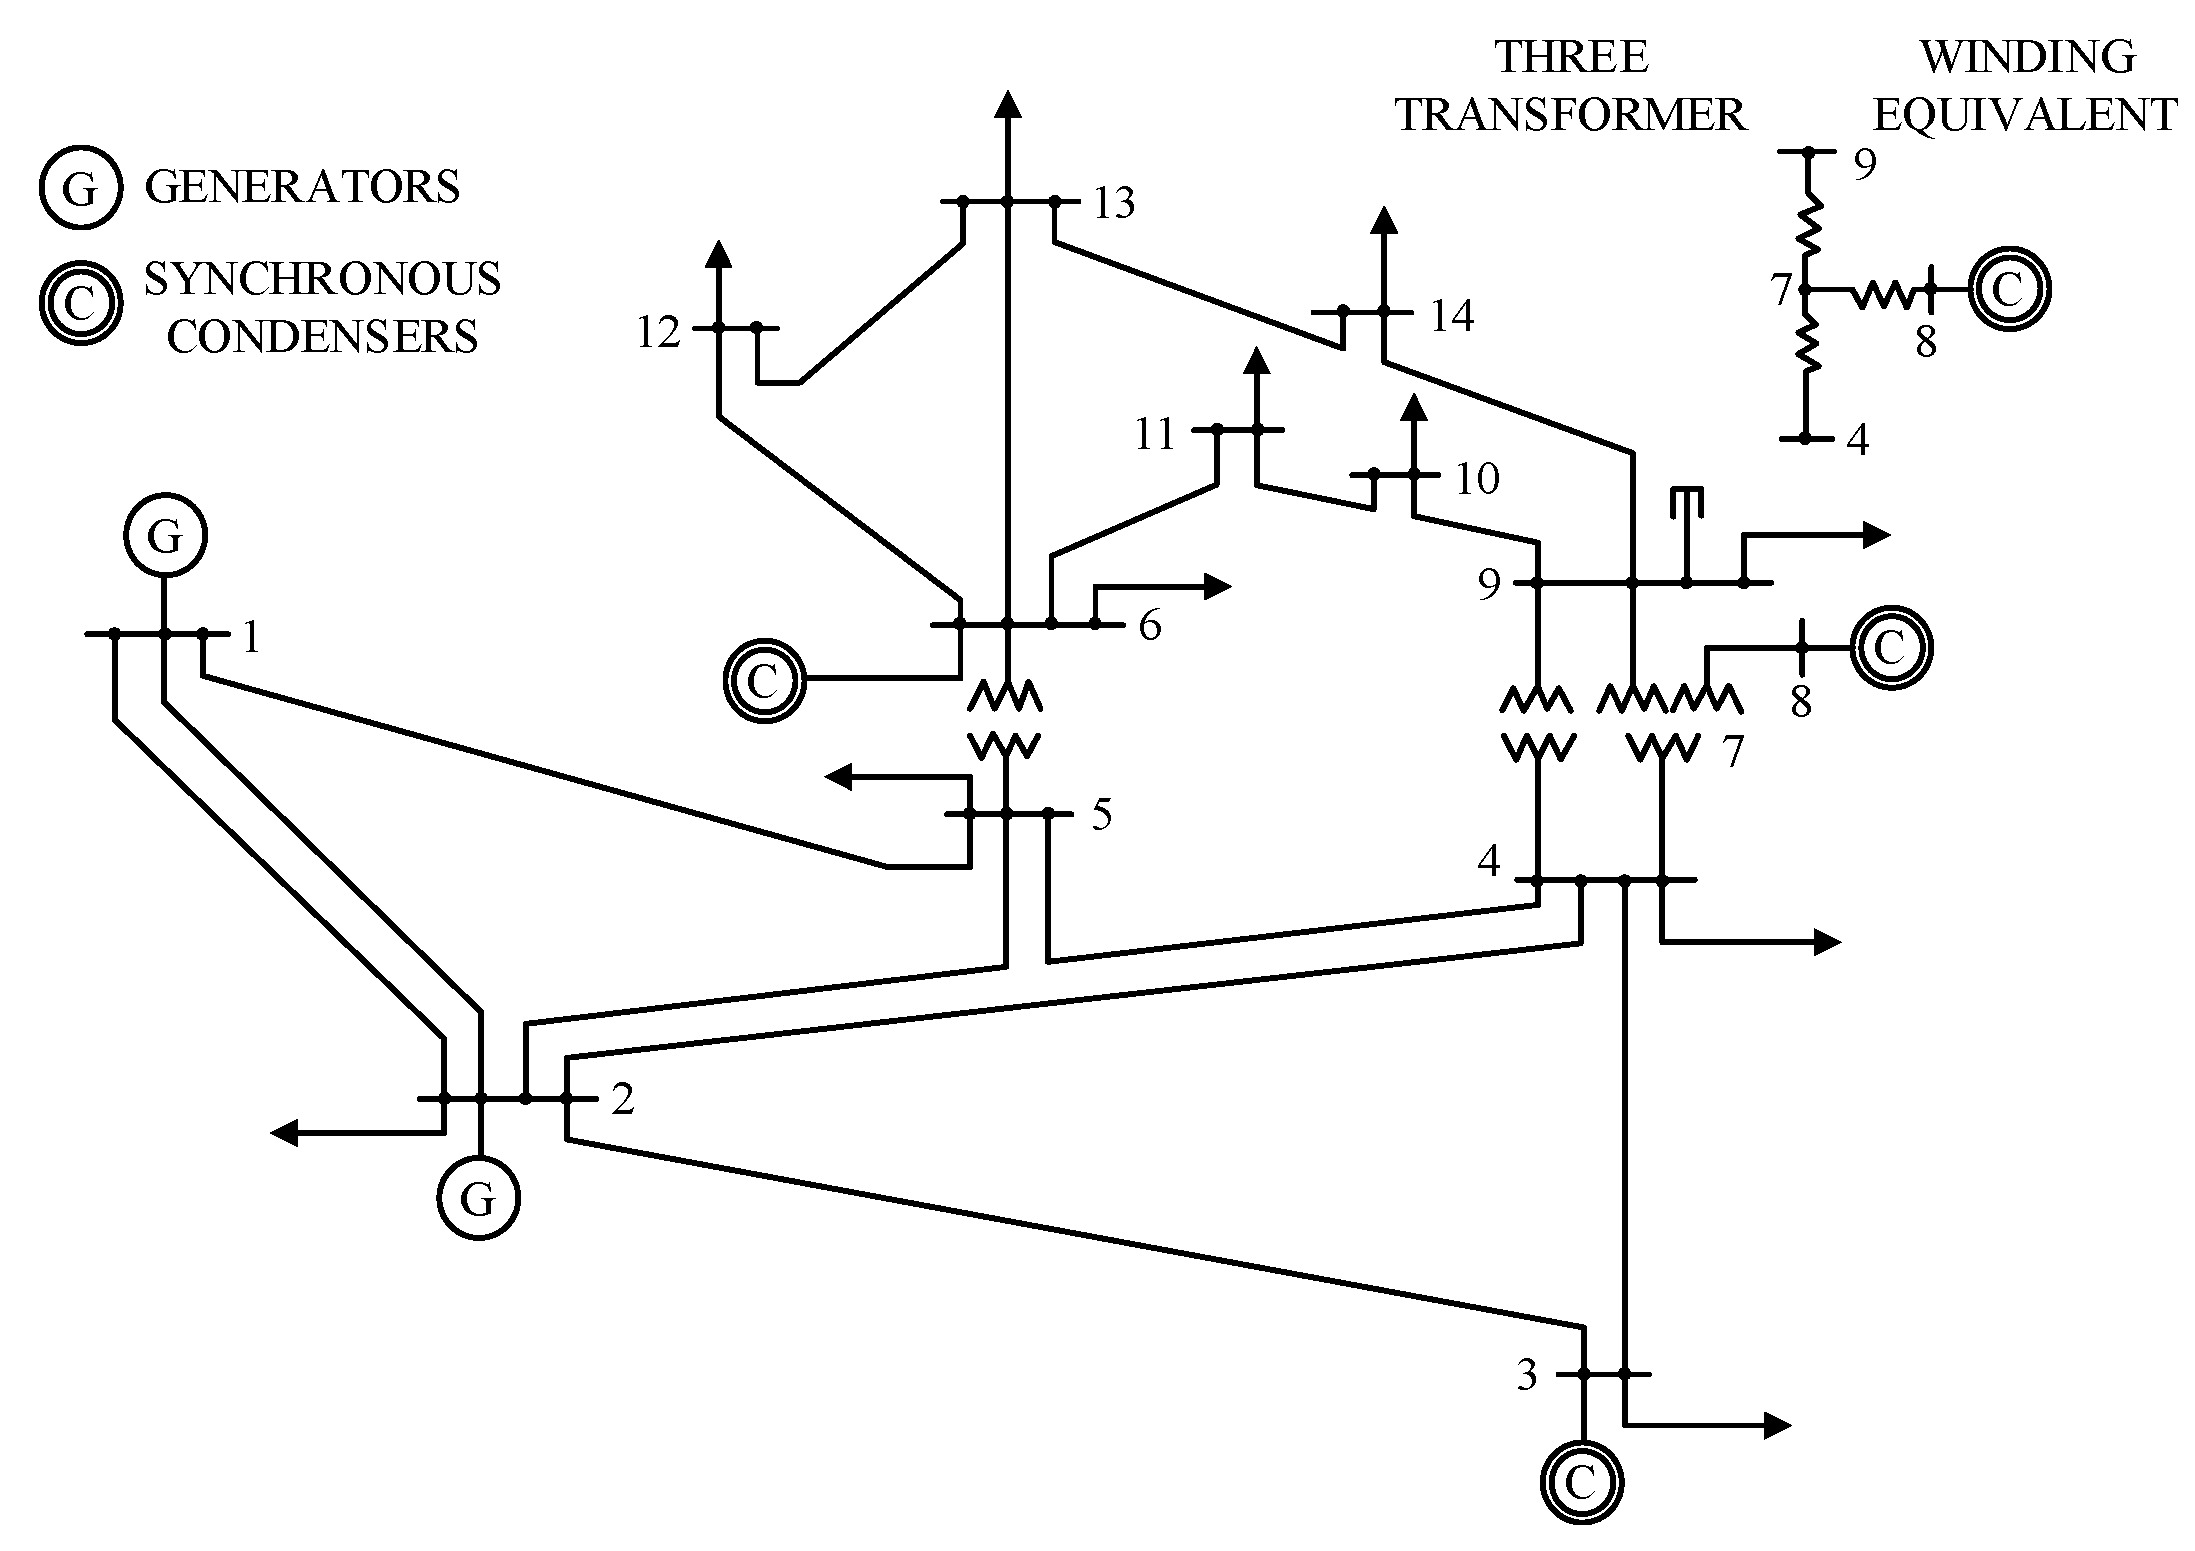
4.1. Test System
- (1)
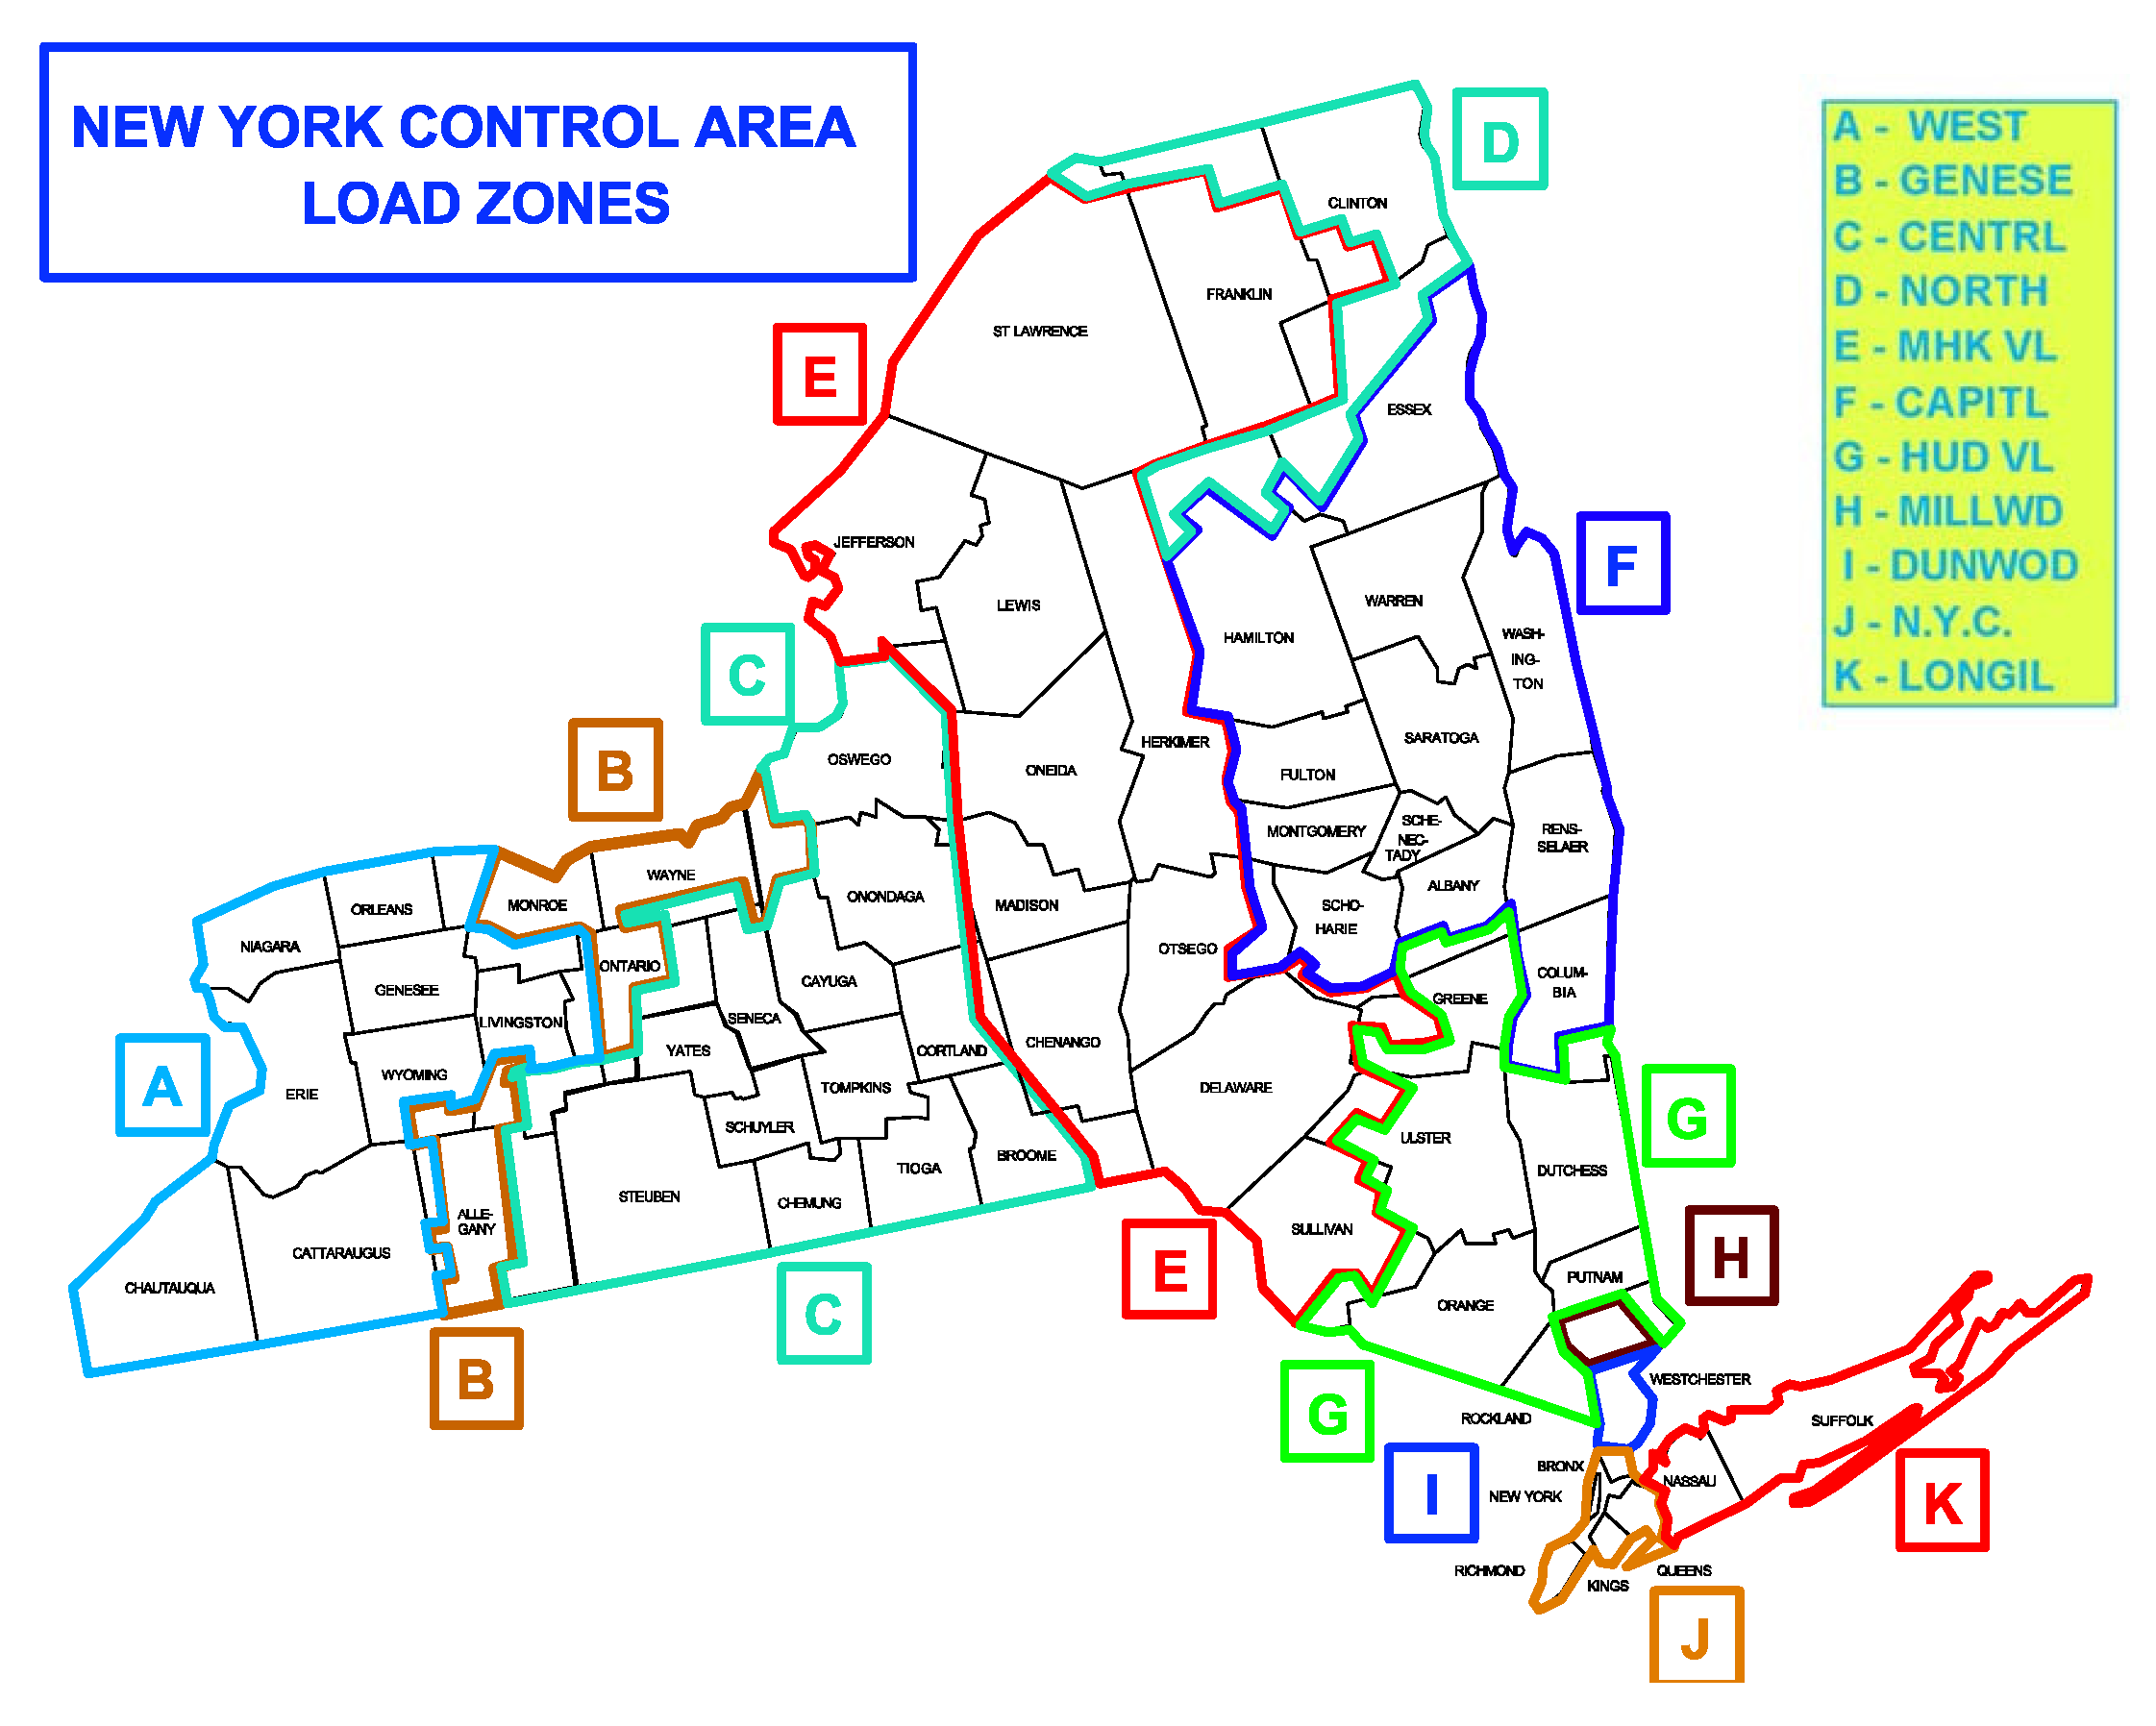
- Correspond the NYISO regional loads (CAPITL, CENTRL, DUNWOD, GENESE, HUD VL, LONGIL, MHK VL, MILLWD, N.Y.C., NORTH, WEST) to 11 load nodes:where, the first line is the node number of IEEE14 bus system. The second line is the corresponding NYISO region number.
- (2)
- Standardize the NYISO load data according to IEEE 14 standard system of active power of initial load node and generator node, so that the test system runs within the initial value range of the state. Due to the lack of system node reactive load, it is assumed that the system has a constant power factor to calculate the reactive power of each node at a 5min interval.
- (3)
- Calculate the ratio of new total load to initial total load of IEEE14 standard system to change the active and reactive power, and then obtain the active and reactive power every 5min interval. Here, it is assumed that the growth rate of active power from generator is the same as that of the total load, which can be adjusted by the system operator who knows the power generation plan in advance.
- (4)
- Calculate the power flow to get the system state vector, that is, the voltage and phase angle of each node.
- (5)
- Calculate measurement vector according to the measurement equation .
4.2. Simulate FDIAs
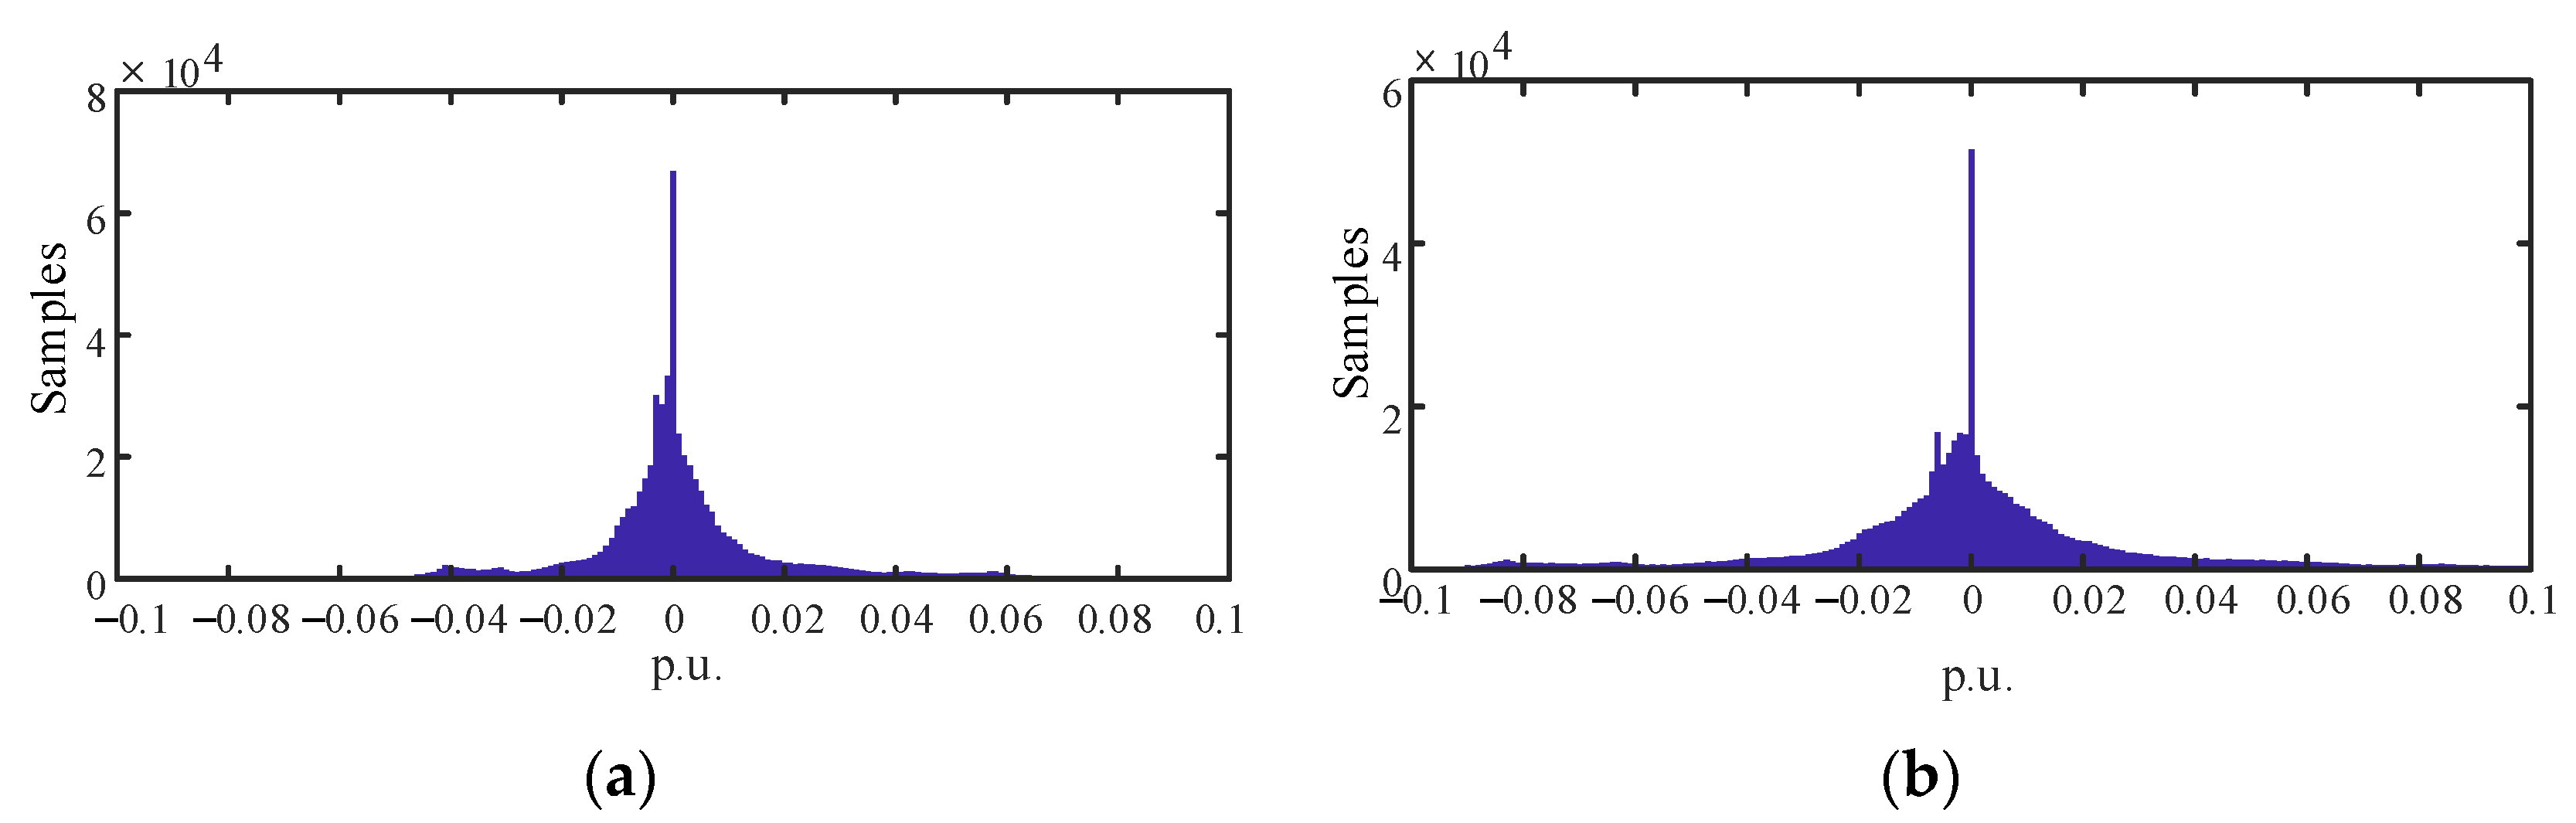
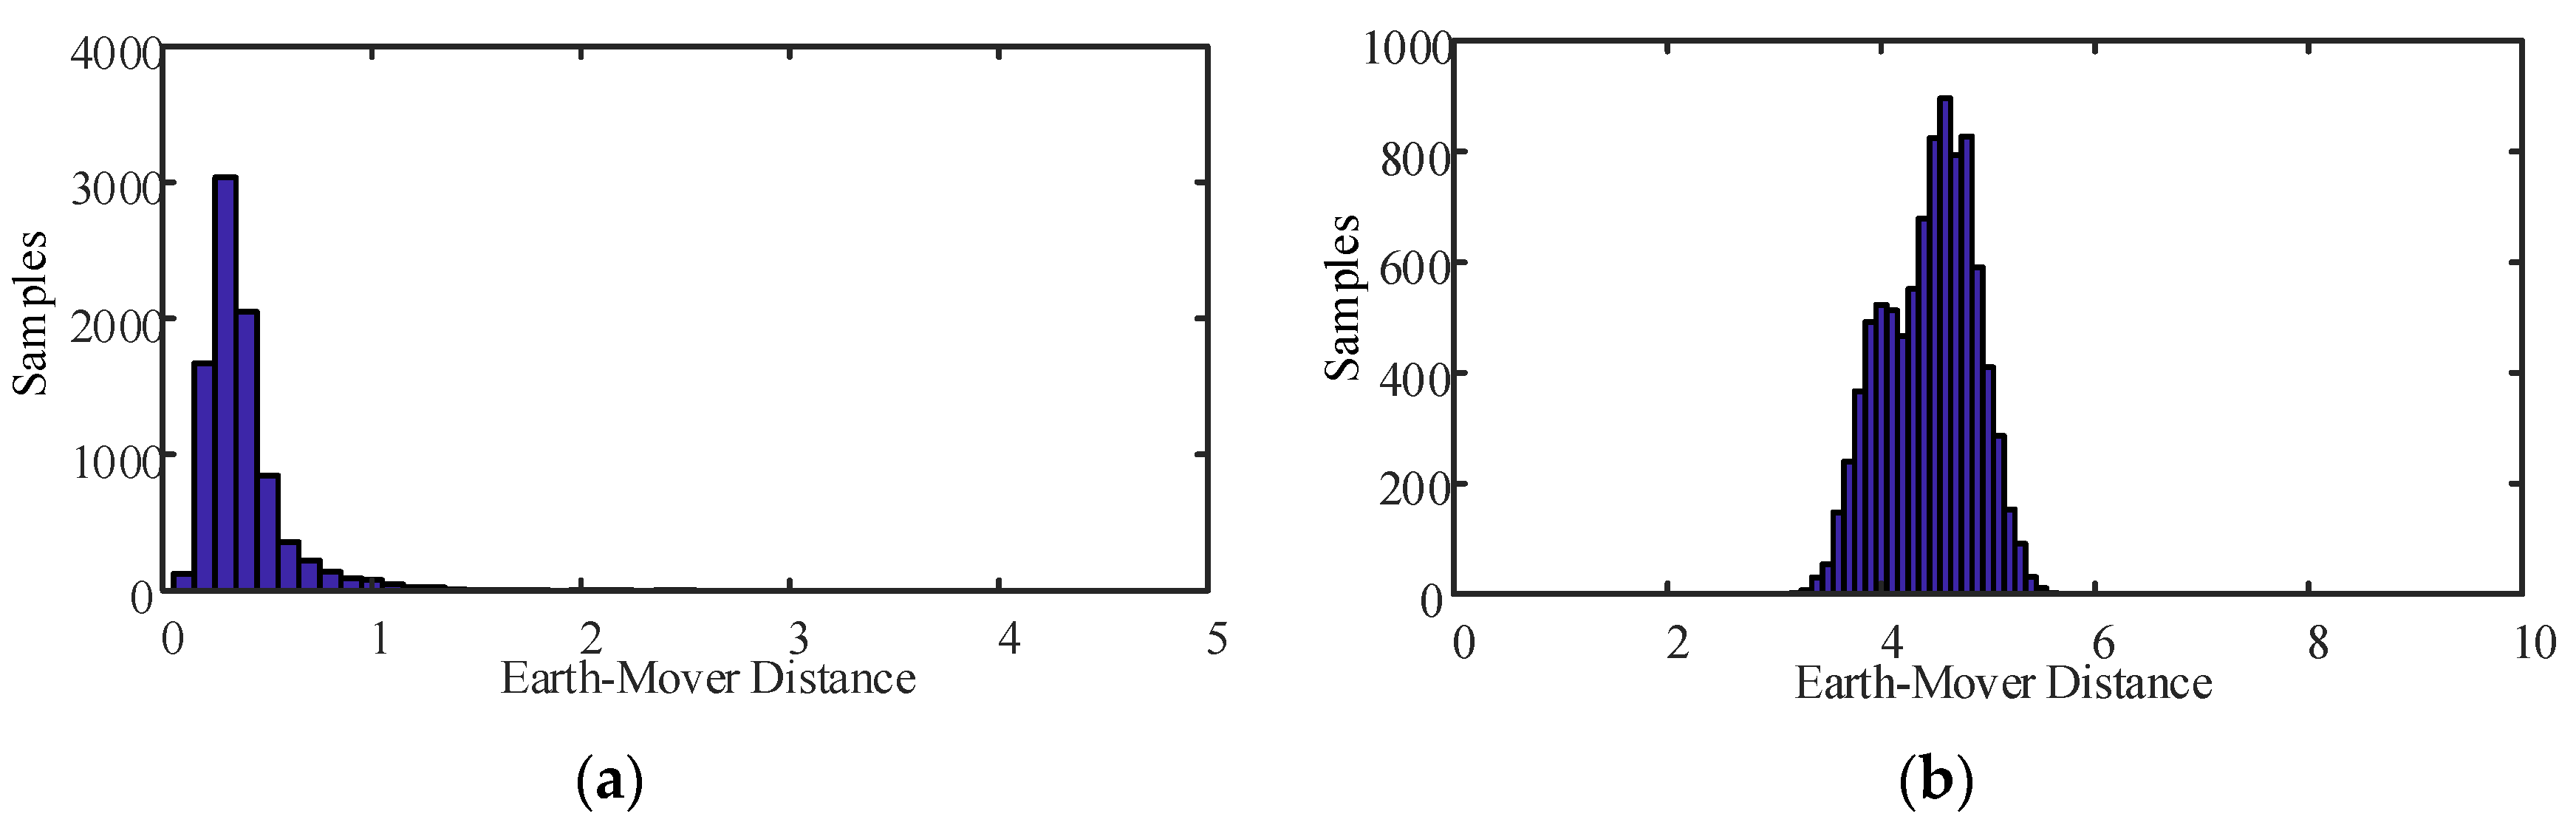
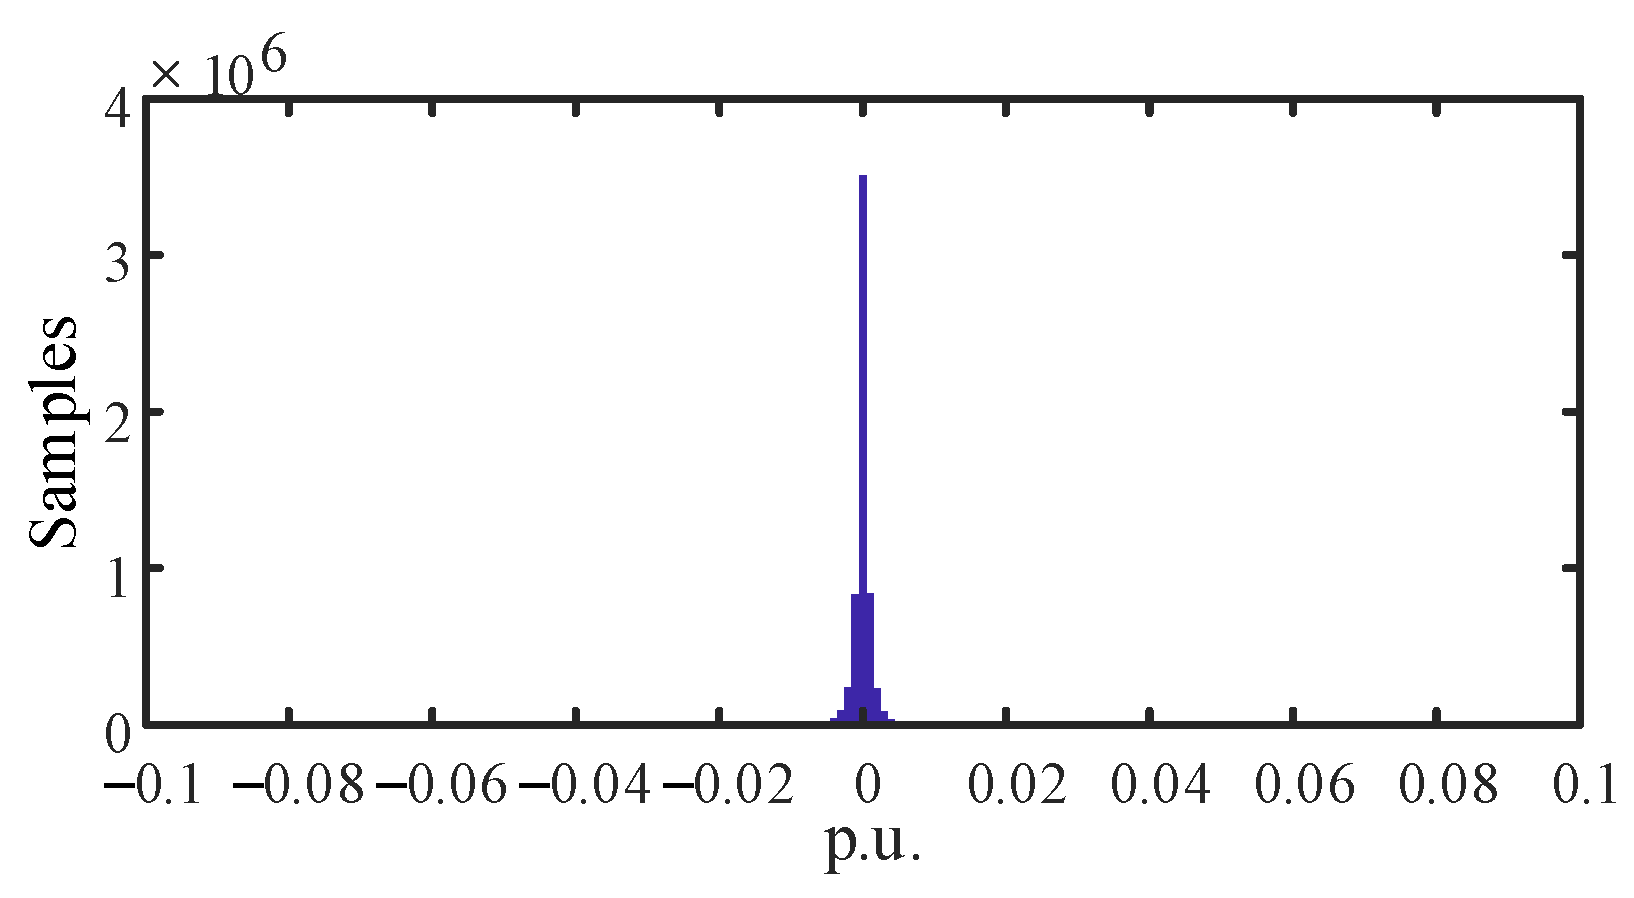
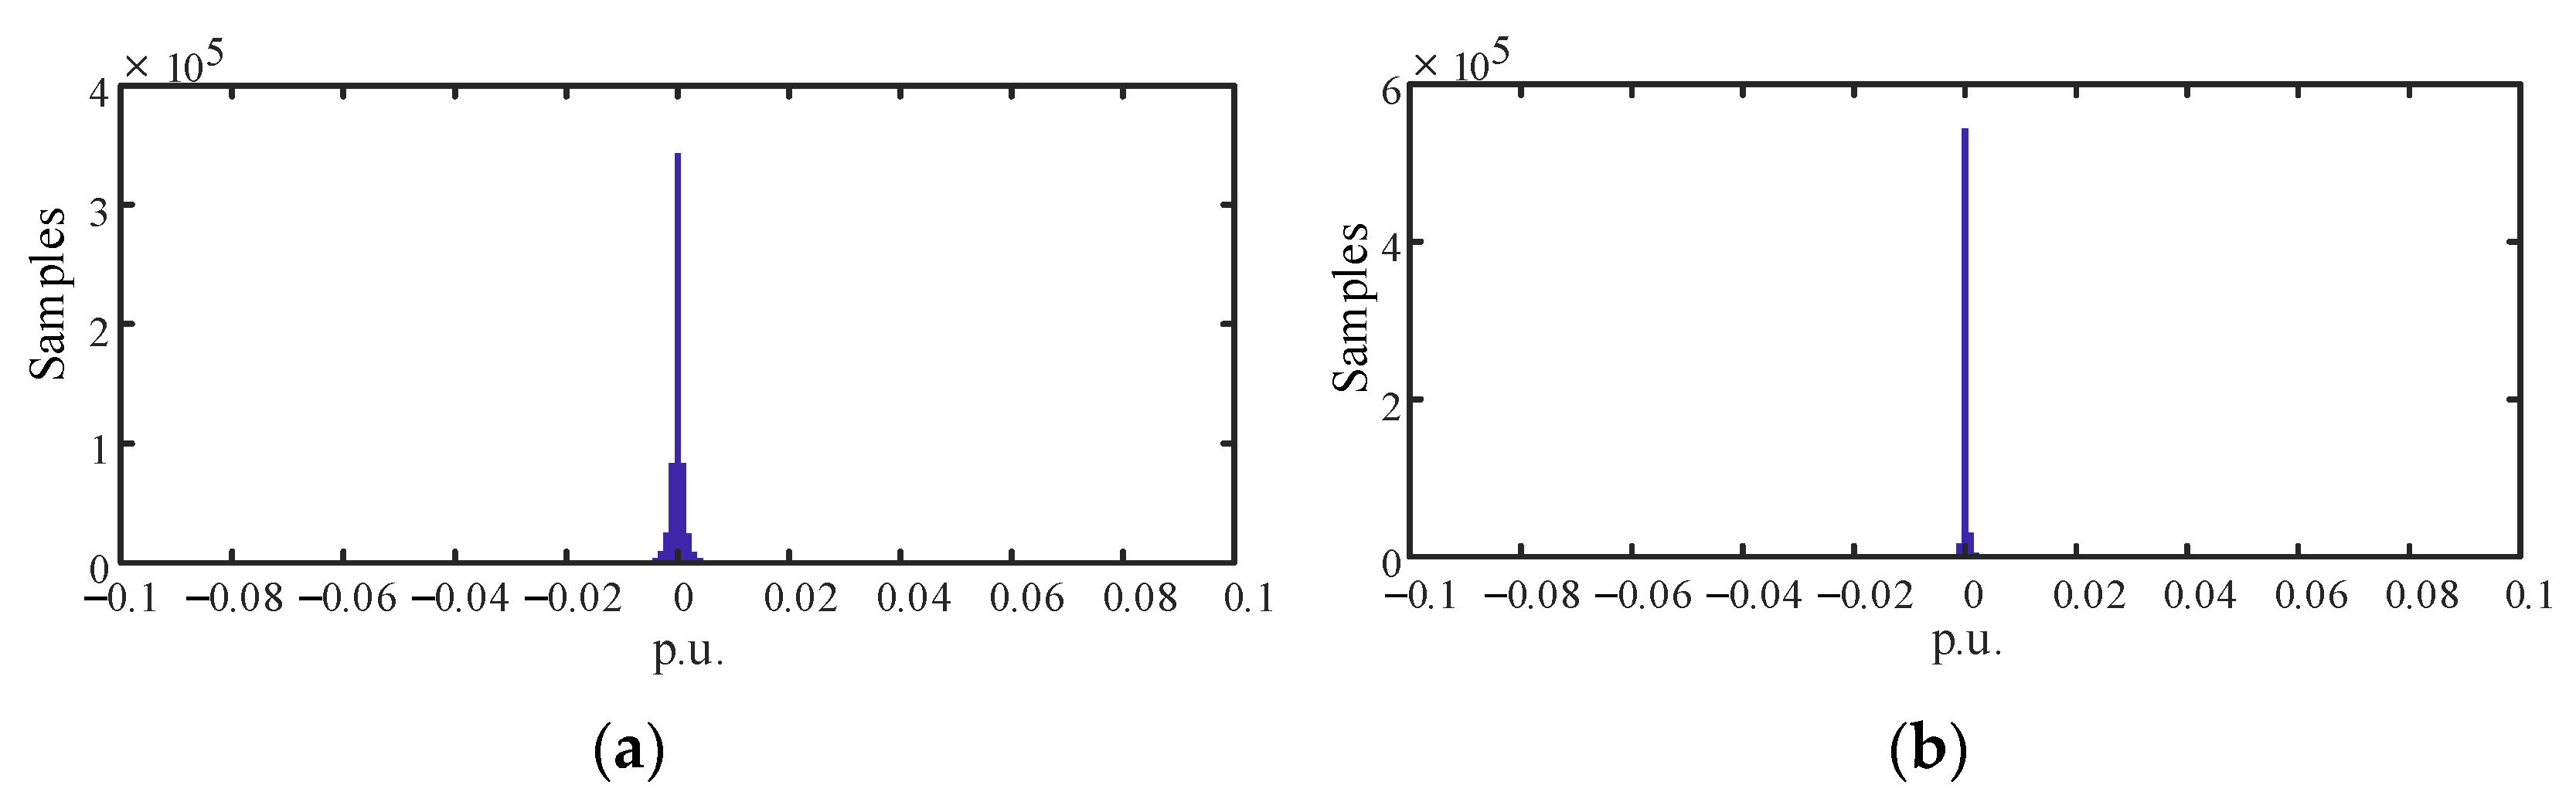
4.3. Probability Distribution of Measurement Variation
4.4. Detection Metric and Detection Threshold
4.5. Effect of JIT on Detection Accuracy
5. Results Analysis
6. Conclusions
Author Contributions
Funding
Institutional Review Board Statement
Informed Consent Statement
Data Availability Statement
Conflicts of Interest
References
- Tang, Y.; Chen, Q.; Mengya, L.I.; Wang, Q.; Ming, N.I.; Liang, Y. Overview on cyber-attacks against cyber physical power system. Autom. Electr. Power Syst. 2016, 40, 59–69. [Google Scholar]
- Xian, G. Analysis of Venezuela’s blackouts and suggestions on network security of critical infrastructure. Inf. Technol. Netw. Secur. 2019, 38, 1–2. [Google Scholar]
- Deng, R.; Xiao, G.; Lu, R.; Liang, H.; Vasilakos, A.V. False data injection on state estimation in power systems attacks, impacts, and defense: A survey. IEEE Trans. Ind. Inform. 2017, 13, 411–423. [Google Scholar] [CrossRef]
- Li, Q.; Sun, H.; Sheng, T.; Zhang, B.; Wu, W.; Guo, Q. Injection attack analysis of transformer false data in substation state estimation. Autom. Electr. Power Syst. 2016, 40, 79–86. [Google Scholar]
- Qi, W.; Wei, T.; Yi, T.; Ming, N. A review of the false data injection attack against the cyber physical power system. Acta Autom. Sin. 2019, 45, 74–85. [Google Scholar]
- Liu, Y.; Ning, P.; Reiter, M.K. False data injection attacks against state estimation in electric power grids. ACM Trans. Inf. Syst. Secur. 2011, 14, 1–33. [Google Scholar] [CrossRef]
- Kosut, O.; Jia, L.; Thomas, R.; Tong, L. Limiting false data attacks on power system state estimation. In Proceedings of the 44th Annual Conference on Information Sciences and Systems (CISS), Princeton, NJ, USA, 17–19 March 2010; pp. 1–6. [Google Scholar]
- Hu, Z.; Yong, W.; Tian, X.; Yang, X.; Fan, R. False data injection attacks identification for smart grids. In Proceedings of the Third International Conference on Technological Advances in Electrical, Electronics and Computer Engineering (TAEECE), Beirut, Lebanon, 29 April–1 May 2015; pp. 139–143. [Google Scholar]
- Qu, Z.; Dong, Y.; Wang, Y.; Chen, L. Improved robust unscented Kalman filtering algorithm for dynamic state estimation of power systems. Autom. Electr. Power Syst. 2018, 42, 87–92. [Google Scholar]
- Chen, B.; Li, H.; Li, B. Application research on pseudo measurement modeling and AUKF in FDIAs identification of distribution network. Power Syst. Technol. 2019, 43, 3226–3236. [Google Scholar]
- Wang, D.; Guan, X.; Gu, T.; Shen, C.; Xu, Z. Extended distributed state estimation: A detection method against tolerable false data injection attacks in smart grids. Energies 2014, 7, 1517–1538. [Google Scholar] [CrossRef] [Green Version]
- Ahmed, S.; Lee, Y.; Hyun, S.-H.; Koo, I. Feature selection-based detection of covert cyber deception assaults in smart grid communications networks using machine learning. IEEE Access 2018, 6, 27518–27529. [Google Scholar] [CrossRef]
- Xue, D.; Jing, X.; Liu, H. Detection of false data injection attacks in smart grid utilizing ELM-based OCON framework. IEEE Access 2019, 10, 31762–31773. [Google Scholar] [CrossRef]
- Mostafa, M.; Ashkan, S.; Seifi, A.R. A statistical unsupervised method against false data injection attacks: A visualization-based approach. Expert Syst. Appl. 2017, 10, 1016–1035. [Google Scholar]
- Li, Y.; Zeng, J. Detection method of false data injection attack on power grid based on improved convolutional neural network. Autom. Electr. Power Syst. 2019, 43, 97–104. [Google Scholar] [CrossRef]
- Ahmed, S.; Lee, Y.; Hyun, S.; Koo, I. Unsupervised machine learning-based detection of covert data integrity assault in smart grid networks utilizing isolation forest. IEEE Trans. Inf. Forensics Secur. 2019, 14, 2765–2777. [Google Scholar] [CrossRef]
- Wang, D.; Wang, X.; Zhang, Y.; Jin, L. Detection of power grid disturbances and cyber-attacks based on machine learning. J. Inf. Secur. Appl. 2019, 46, 42–52. [Google Scholar] [CrossRef]
- Kurt, M.N.; Yilmaz, Y.; Wang, X. Distributed quickest detection of cyberattacks in smart grid. IEEE Trans. Inf. Forensics Secur. 2018, 13, 2015–2030. [Google Scholar] [CrossRef]
- Li, S.; Yilmaz, Y.; Wang, X. Quickest detection of false data injection attack in wide-area smart grids. IEEE Trans. Smart Grid 2015, 6, 2725–2735. [Google Scholar] [CrossRef]
- Malhotra, P.; Vig, L.; Shroff, G.; Agarwal, P. Long short term memory networks for Anomaly detection in time series. In Proceedings of the 23rd European Symposium on Artificial Neural Networks, Computational Intelligence and Machine Learning, Bruges, Belgium, 22–24 April 2015; pp. 89–94. [Google Scholar]
- Liu, L.; Esmalifalak, M.; Ding, Q.; Emesih, V.A.; Han, Z. Detecting false data injection attacks on power grid by sparse optimization. IEEE Trans. Smart Grid 2014, 5, 612–621. [Google Scholar] [CrossRef]
- Mestav, K.R.; Tong, L. Universal Data Anomaly Detection via Inverse Generative Adversary Network. IEEE Signal Process. Lett. 2020, 27, 511–515. [Google Scholar] [CrossRef]
- Khalid, H.M.; Peng, J. Immunity toward data-injection attacks using multisensor track fusion-based model prediction. IEEE Trans. Smart Grid 2017, 8, 697–707. [Google Scholar] [CrossRef]
- Liu, X.; Wu, Z. Online defense research of spatial-hidden malicious data injection attacks in smart grid. Proc. Chin. Soc. Electr. Eng. 2020, 13, 1520–1534. [Google Scholar]
- Zhao, J.; Zhang, G.; Scala, M.L.; Dong, Z.Y.; Chen, C.; Wang, J. Short-term state forecasting-aided method for detection of smart grid general false data injection attacks. IEEE Trans. Smart Grid 2017, 4, 1580–1590. [Google Scholar] [CrossRef]
- Gu, C.; Jirutitijaroen, P.; Motani, M. Detecting false data injection attacks in ac state estimation. IEEE Trans. Smart Grid 2015, 5, 2476–2483. [Google Scholar]
- Singh, S.K.; Khanna, K.; Bose, R.; Panigrahi, B.K.; Joshi, A. Joint-transformation-based detection of false data injection attacks in smart grid. IEEE Trans. Ind. Inform. 2018, 14, 89–97. [Google Scholar] [CrossRef]
- Cheng, G.; Lin, Y.; Chen, Y.; Bi, T. Adaptive State Estimation for Power Systems Measured by PMUs With Unknown and Time-Varying Error Statistics. IEEE Trans. Power Syst. 2021, 36, 4482–4491. [Google Scholar] [CrossRef]
- Abur, A.; Exposito, A.G. Power System State Estimation: Theory and Implementation, 3rd ed.; CRC Press: Boca Raton, FL, USA, 2004. [Google Scholar]
- Rubner, Y.; Tomasi, C.; Guibas, L.J. The Earth Mover’s Distance as a metric for image retrieval. Int. J. Comput. Vis. 2000, 40, 99–121. [Google Scholar] [CrossRef]
- Gonzalez, R.C.; Woods, R.E. Digital Image Processing, 3rd ed.; Pearson: Upper Saddle River, NJ, USA, 2008. [Google Scholar]
- Hug, G.; Giampapa, J.A. Vulnerability assessment of ac state estimation with respect to false data injection cyber-attacks. IEEE Trans. Smart Grid 2012, 3, 1362–1370. [Google Scholar] [CrossRef] [Green Version]


| Attack State | Attack Intensity (IA%) | EMD Range |
|---|---|---|
| No attack | 0D | (0.08~2.37) |
| 1D | (0.88~3.34) | |
| 5D | (2.61~4.38) | |
| 10D | (2.98~4.83) | |
| 1D | (2.35~5.31) | |
| 5D | (5.90~7.67) | |
| 10D | (6.46~8.02) |
| State | KLD[26] UD% for IA% | Joint Transformation[27] UD% for IA% | ||||||
| 5D | 10D | –5D | –10D | 5D | 10D | –5D | –10D | |
| 2 | 0 | 1 | 0 | 0 | 0 | 0 | 0 | |
| 56 | 32 | 55 | 22 | 0.03 | 0.02 | 0. 16 | 0.14 | |
| 0 | 0 | 0 | 0 | 0 | 0 | 0 | 0 | |
| 0 | 0 | 0 | 0 | 0 | 0 | 0 | 0 | |
| 0 | 0 | 0 | 0 | 0 | 0 | 0 | 0 | |
| 70 | 61 | 70 | 58 | 0 | 0 | 0 | 0 | |
| 95 | 95 | 96 | 96 | 46.6 | 0 | 46.6 | 0 | |
| 0 | 0 | 0 | 0 | 0 | 0 | 0 | 0 | |
| 0 | 0 | 0 | 0 | 0 | 0 | 0 | 0 | |
| 0 | 0 | 0 | 0 | 0 | 0 | 0 | 0 | |
| 2 | 0 | 1 | 0 | 0 | 0 | 0 | 0 | |
| 0 | 0 | 0 | 0 | 0 | 0 | 0 | 0 | |
| 7 | 0 | 5 | 0 | 0 | 0 | 0 | 0 | |
| State | EMD UD% for IA% | EMD&JIT UD% for IA% | ||||||
| 5D | 10D | –5D | –10D | 5D | 10D | –5D | –10D | |
| 0 | 0 | 0 | 0 | 0 | 0 | 0 | 0 | |
| 0.01 | 0 | 0.01 | 0 | 0 | 0 | 0 | 0 | |
| 0 | 0 | 0 | 0 | 0 | 0 | 0 | 0 | |
| 0 | 0 | 0 | 0 | 0 | 0 | 0 | 0 | |
| 0 | 0 | 0 | 0 | 0 | 0 | 0 | 0 | |
| 0 | 0 | 0 | 0 | 0 | 0 | 0 | 0 | |
| 1.02 | 0.92 | 1.02 | 0.92 | 0 | 0 | 0 | 0 | |
| 0 | 0 | 0 | 0 | 0 | 0 | 0 | 0 | |
| 0 | 0 | 0 | 0 | 0 | 0 | 0 | 0 | |
| 0 | 0 | 0 | 0 | 0 | 0 | 0 | 0 | |
| 0.03 | 0 | 0.03 | 0 | 0 | 0 | 0 | 0 | |
| 0 | 0 | 0 | 0 | 0 | 0 | 0 | 0 | |
| 0 | 0 | 0 | 0 | 0 | 0 | 0 | 0 | |
Publisher’s Note: MDPI stays neutral with regard to jurisdictional claims in published maps and institutional affiliations. |
© 2022 by the authors. Licensee MDPI, Basel, Switzerland. This article is an open access article distributed under the terms and conditions of the Creative Commons Attribution (CC BY) license (https://creativecommons.org/licenses/by/4.0/).
Share and Cite
Qu, Z.; Yang, J.; Lang, Y.; Wang, Y.; Han, X.; Guo, X. Earth-Mover-Distance-Based Detection of False Data Injection Attacks in Smart Grids. Energies 2022, 15, 1733. https://doi.org/10.3390/en15051733
Qu Z, Yang J, Lang Y, Wang Y, Han X, Guo X. Earth-Mover-Distance-Based Detection of False Data Injection Attacks in Smart Grids. Energies. 2022; 15(5):1733. https://doi.org/10.3390/en15051733
Chicago/Turabian StyleQu, Zhengwei, Jingchuan Yang, Yansheng Lang, Yunjing Wang, Xiaoming Han, and Xinyue Guo. 2022. "Earth-Mover-Distance-Based Detection of False Data Injection Attacks in Smart Grids" Energies 15, no. 5: 1733. https://doi.org/10.3390/en15051733
APA StyleQu, Z., Yang, J., Lang, Y., Wang, Y., Han, X., & Guo, X. (2022). Earth-Mover-Distance-Based Detection of False Data Injection Attacks in Smart Grids. Energies, 15(5), 1733. https://doi.org/10.3390/en15051733