Article

Data–Driven Fault Diagnosis and Cause Analysis of Battery Pack with Real Data

1
School of Electronic and Electrical Engineering, Kyungpook National University, Daegu 41566, Korea
2
Department of Hydrogen and Renewable Energy, Kyungpook National University, Daegu 41566, Korea
3
Department of Electrical Engineering, Kyungpook National University, Daegu 41566, Korea
*
Author to whom correspondence should be addressed.
Energies 2022, 15(5), 1647; https://doi.org/10.3390/en15051647
Submission received: 10 January 2022 / Revised: 13 February 2022 / Accepted: 18 February 2022 / Published: 23 February 2022

Abstract

:
Owing to the increasing use of electric vehicles (EVs), the demand for lithium-ion (Li-ion) batteries is rising. In this light, an essential factor governing the safety and efficiency of electric vehicles is the proper diagnosis of battery errors. In this article, we address the detection of battery problems by using the intraclass correlation coefficient (ICC) method and the order of cell voltages to enhance EV performance. Furthermore, we propose a framework for diagnosing problems with battery packs, which could be used to detect abnormal behavior. The proposed method calculates ICC values based on the terminal voltages extracted from a caravan battery pack. These ICC values are then used to determine whether the battery has a defect. In addition, the order of cell voltages is used to analyze the causes of faults. Furthermore, we conducted experiments to investigate and evaluate battery cell faults in EVs. The experimental results indicate that the proposed approach can be used to detect battery cell faults accurately.

1. Introduction

Nowadays, global warming and climate change are among the greatest concerns for humans. Several researchers have attempted to raise public awareness about the effects of modern technology and innovation [1]. Electric vehicles (EVs) represent one solution to these problems. Owing to their environmental benefits, strong performance, and nonpolluting nature, EVs have always been popular forms of transportation [2,3,4]. The potential fuel efficiency of EVs is one of the major reasons to support their growth. A more compelling reason is their ability to reduce greenhouse gas emissions. The battery plays a critical role in EVs, because it provides driving power and absorbs braking energy. In terms of electric cars, several prognostications have been made concerning battery development. Many of these forecasts differ significantly owing to the uncertainty associated with batteries. The future of EVs would be bright if new batteries with considerably higher energy densities and lower costs are developed. Owing to the voltage and capacity limitations of individual cells, battery packs typically consist of many battery cells arranged in a series and parallel [5,6]. The condition of the batteries during EV operation is crucial for ensuring vehicle safety and reliability.
Batteries can be optimized with a battery management system (BMS) to enhance their longevity and performance. In BMS software, model algorithms are implemented, usually based on equivalent circuit models (ECMs), which continuously monitor battery dynamics and estimate battery data [7,8]. A battery management system (BMS) is used [9,10] to determine the cell states and collect cell identification data. BMSs offer several features that increase the battery life, such as equalization and energy management [11,12,13]. However, a local BMS cannot detect battery faults, which may lead to a fire or an explosion [14,15]. Four causes of electrical accidents have been identified, namely overcharging [16], over-discharging [17], external short circuit, and internal short circuit [18,19]. In the first two types, voltage abnormalities tend to be avoided by estimating the SOC of the batteries rather than providing customer-valued information [5,20]. External and internal short circuits pose a greater risk than overcharging and undercharging. As a result of the short circuit fault, more heat is generated, which is more likely to cause a thermal runaway [18,21]. In Reference [22], an electrochemical–thermal-coupled model was used to demonstrate that an internal short circuit causes an abnormal voltage, temperature, and state of charge (SOC) response. Instead of the electrochemical–thermal-coupled model, the fault diagnostic algorithm was based on the energy balance equation (EBE) model, which reduced the computational burden. An internal short circuit fault was estimated more accurately using a model-based switching model proposed in Reference [23], and RLS was also used to determine the parameters and detect faults. This method uses RLS to estimate the parameter values for low computational costs. Still, the result was unreliable fault detection due to the effects of online cell balancing on the data collected from other cells in the pack.
Researchers have used nonlinear parity equations [24] to calculate the residuals of the voltage, current, and fan setting based on the equivalent circuit model (ECM), thermal model, and SOC model. The probability density function was used to select the thresholds of these residuals. More comprehensive fault detection and isolation were performed for the current and voltage sensors, as well as for the cooling fan. Recently, researchers developed a new mechanism by using the proportional–integral–observer-based method [25] to detect and estimate faults in current sensors with the aim of improving the energy estimation. The concept of sliding mode observers modeled on electrical and thermal dynamics was introduced [26]. The sliding surfaces of each observer were used to derive filter expressions for fault detection. In Reference [26], based on the assumption that voltage, current, and temperature sensor faults are bounded and finite, the outputs of the aforementioned filters were used to detect, isolate, and estimate sensor faults. An RLS-based parameter estimation scheme was proposed in Reference [27] to detect and isolate the faults of voltage and current sensors. The computed parameters were used in the ECM; the parameters were then processed using a weighted moving average filter and subjected to a cumulative sum (CUSUM) analysis to search for abnormalities in the residuals. As a result, this method was able to successfully detect deterioration in battery performance when sensor failure occurred in a limited environment.
Recent studies have focused on fault determination based on the entropy theory. In Reference [28], Shannon entropy and the Z-score method were used to detect abnormalities in battery temperature and predict the time and location of faults to prevent thermal runaway. In Reference [29], the authors described the voltage variation, current variation, and rate of temperature change as three criteria for characterizing external short circuit faults. They set thresholds based on these criteria to recognize external short circuit faults. Li-ion batteries differ in terms of their characteristics, and for this reason, this method is unreliable, because it cannot confirm that the set thresholds are accurate. Additional experiments would be needed to verify the thresholds for Li-ion batteries. This study [30] presented a multi-fault diagnostic strategy using interleaved voltage measurement topology and an improved correlation coefficient method. Various types of faults can be diagnosed using this strategy, including internal and external short circuits, sensor faults, and connection faults. Two different voltage sensors were used to correlate each battery and contact resistance to identify the location and type of faults accurately. To eliminate the influence of battery inconsistency and measurement errors, a method of calculating improved correlation coefficients was applied. To isolate various faults accurately using topology-based methods, a battery pack must be connected in a series with interleaved voltage measurements in which multiple cells are placed in a series.
Continuous use of a lithium-ion battery can lead to the consumption of lithium ions and solvents within the battery, thus reducing the usable battery capacity. Under unintentionally severe conditions, such as high or low temperatures, overcharging, and over-discharging, components that may act as internal resistances are generated more rapidly than usual. Batteries are widely used in packs consisting of individual cells connected in parallel, because they are operated over long periods. The fact that the voltage and temperature of individual cells can be measured independently means that faults in or failure of individual cells can be easily detected. Since the temperature sensor is not attached to all cells in the battery pack, the accuracy with which an abnormality can potentially be detected differs depending on how far the abnormal cell is from the temperature sensor. When using the battery pack as a whole, it is difficult to determine the data of individual cells, and for this reason, it is difficult to discover anomalies, which increases the possibility of their occurrence.
In this study, we aimed to analyze the external and internal characteristics of batteries and define the abnormalities. To this end, we proposed a method to diagnose battery pack failure based on the intraclass correlation coefficient (ICC) and order of cell voltages. Correlation coefficients have been used to detect faults, and they have served as reliable diagnostic measures against normal or abnormal fluctuations. Moreover, the order of the cell voltages approach can help with fault identification. Additionally, we propose a framework for diagnosing problems in battery packs to detect battery anomalies. Furthermore, the proposed model can be adapted based on actual caravan data and can be applied to detect battery issues in other vehicles or caravans with similar features.
The remainder of this paper is organized as follows. In Section 2, we introduce the fault diagnosis and analysis methods used herein and provide detailed explanations of the proposed framework. A simulation in which the proposed method is applied to data is described in Section 3. Section 4 summarizes the process of validating the proposed method by using actual data. Our concluding remarks are presented in Section 5.

2. Fault Diagnosis and Analysis Methods

2.1. Intraclass Correlation Coefficient

As a statistical measure, an intraclass correlation coefficient (ICC) indicates the consistency of the association between two groups. It has been used as an analytical tool for measuring data reliability. Ronald Fisher proposed the concept of ICC. The ICC is used to determine the match and correlation between battery cells. In general, the battery is most used in the middle region of the SOC, but the middle region of the SOC of lithium iron phosphate (LFP) batteries is extremely flat. This makes it difficult to diagnose abnormalities by using the voltage graph alone. Herein, we use curve points to determine whether cells are balanced, but the proposed approach cannot be used to determine the degree of cell unbalance.
If cell voltages are different within the same battery pack due to severe cell unbalance, an abnormality exists. Moreover, if cell unbalancing is severe, the battery capacity is low, or battery resistance is high, a low ICC value is obtained. ICC is derived from the Pearson correlation coefficient, and its value ranges between 0 and 1. The closer the ICC value to 0, the lower is its degree of similarity, thus the scenario can be diagnosed as abnormal (meaning the battery can be diagnosed as abnormal by using the ICC values of cell voltages). The model to be used in conjunction with ICC is determined according to the type and definition.
According to the guidelines provided by Koo and Li, specific models are used, such as single rater and consistency models. This is the C,1 model, and the ICC value is obtained through subjects and measurements:
σ r 2 M S B S M S E k
σ v 2   M S E
ρ 2 C = σ r 2 σ r 2 + σ v 2
ρ 2 C M S B S M S E M S B S + k 1   ·   M S E     ICC   C , 1
r is the subject index where the subject refers to the target of the measurement. Here, r represents the voltage value of the cell, and k indicates the number of measurements. In this paper, the number of voltage-measuring sensors is k. r i , which is a deviation from the mean for subject i . σ r 2 is a variance of r i . MSBS is the mean square between subjects, and MSE indicates the mean square error. σ r 2 can obtain with MSBS, MSE, and k. σ v 2 is to calculate the error, which can be obtained from the MSE. According to Reference [31], the C,1 model of ICC is expressed as Equation (1).

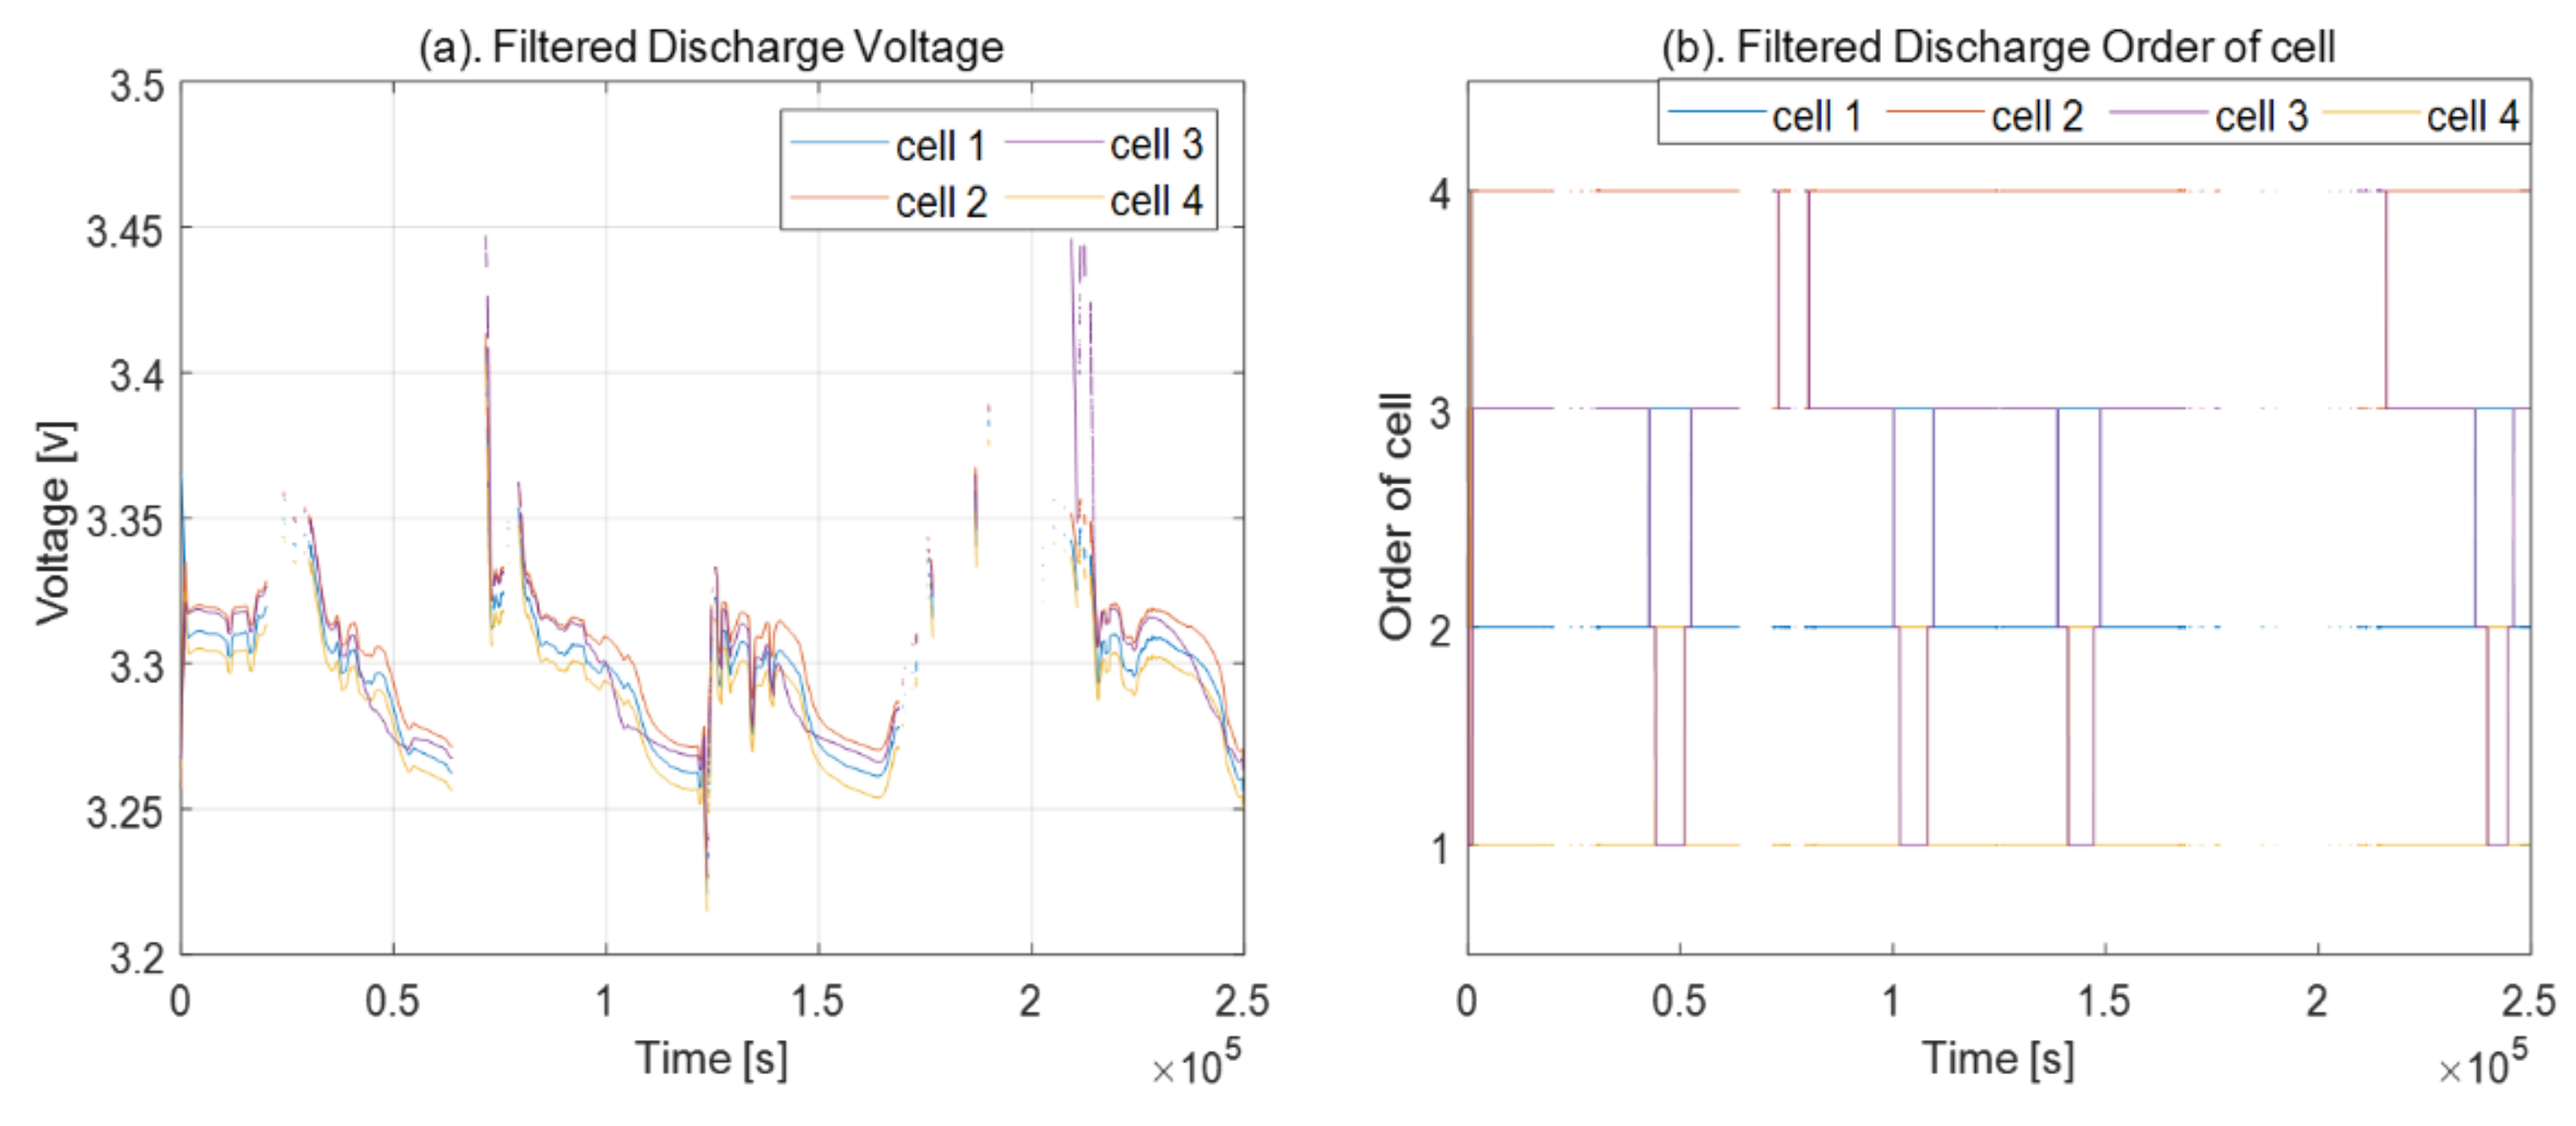
2.2. Order of Cell Voltages
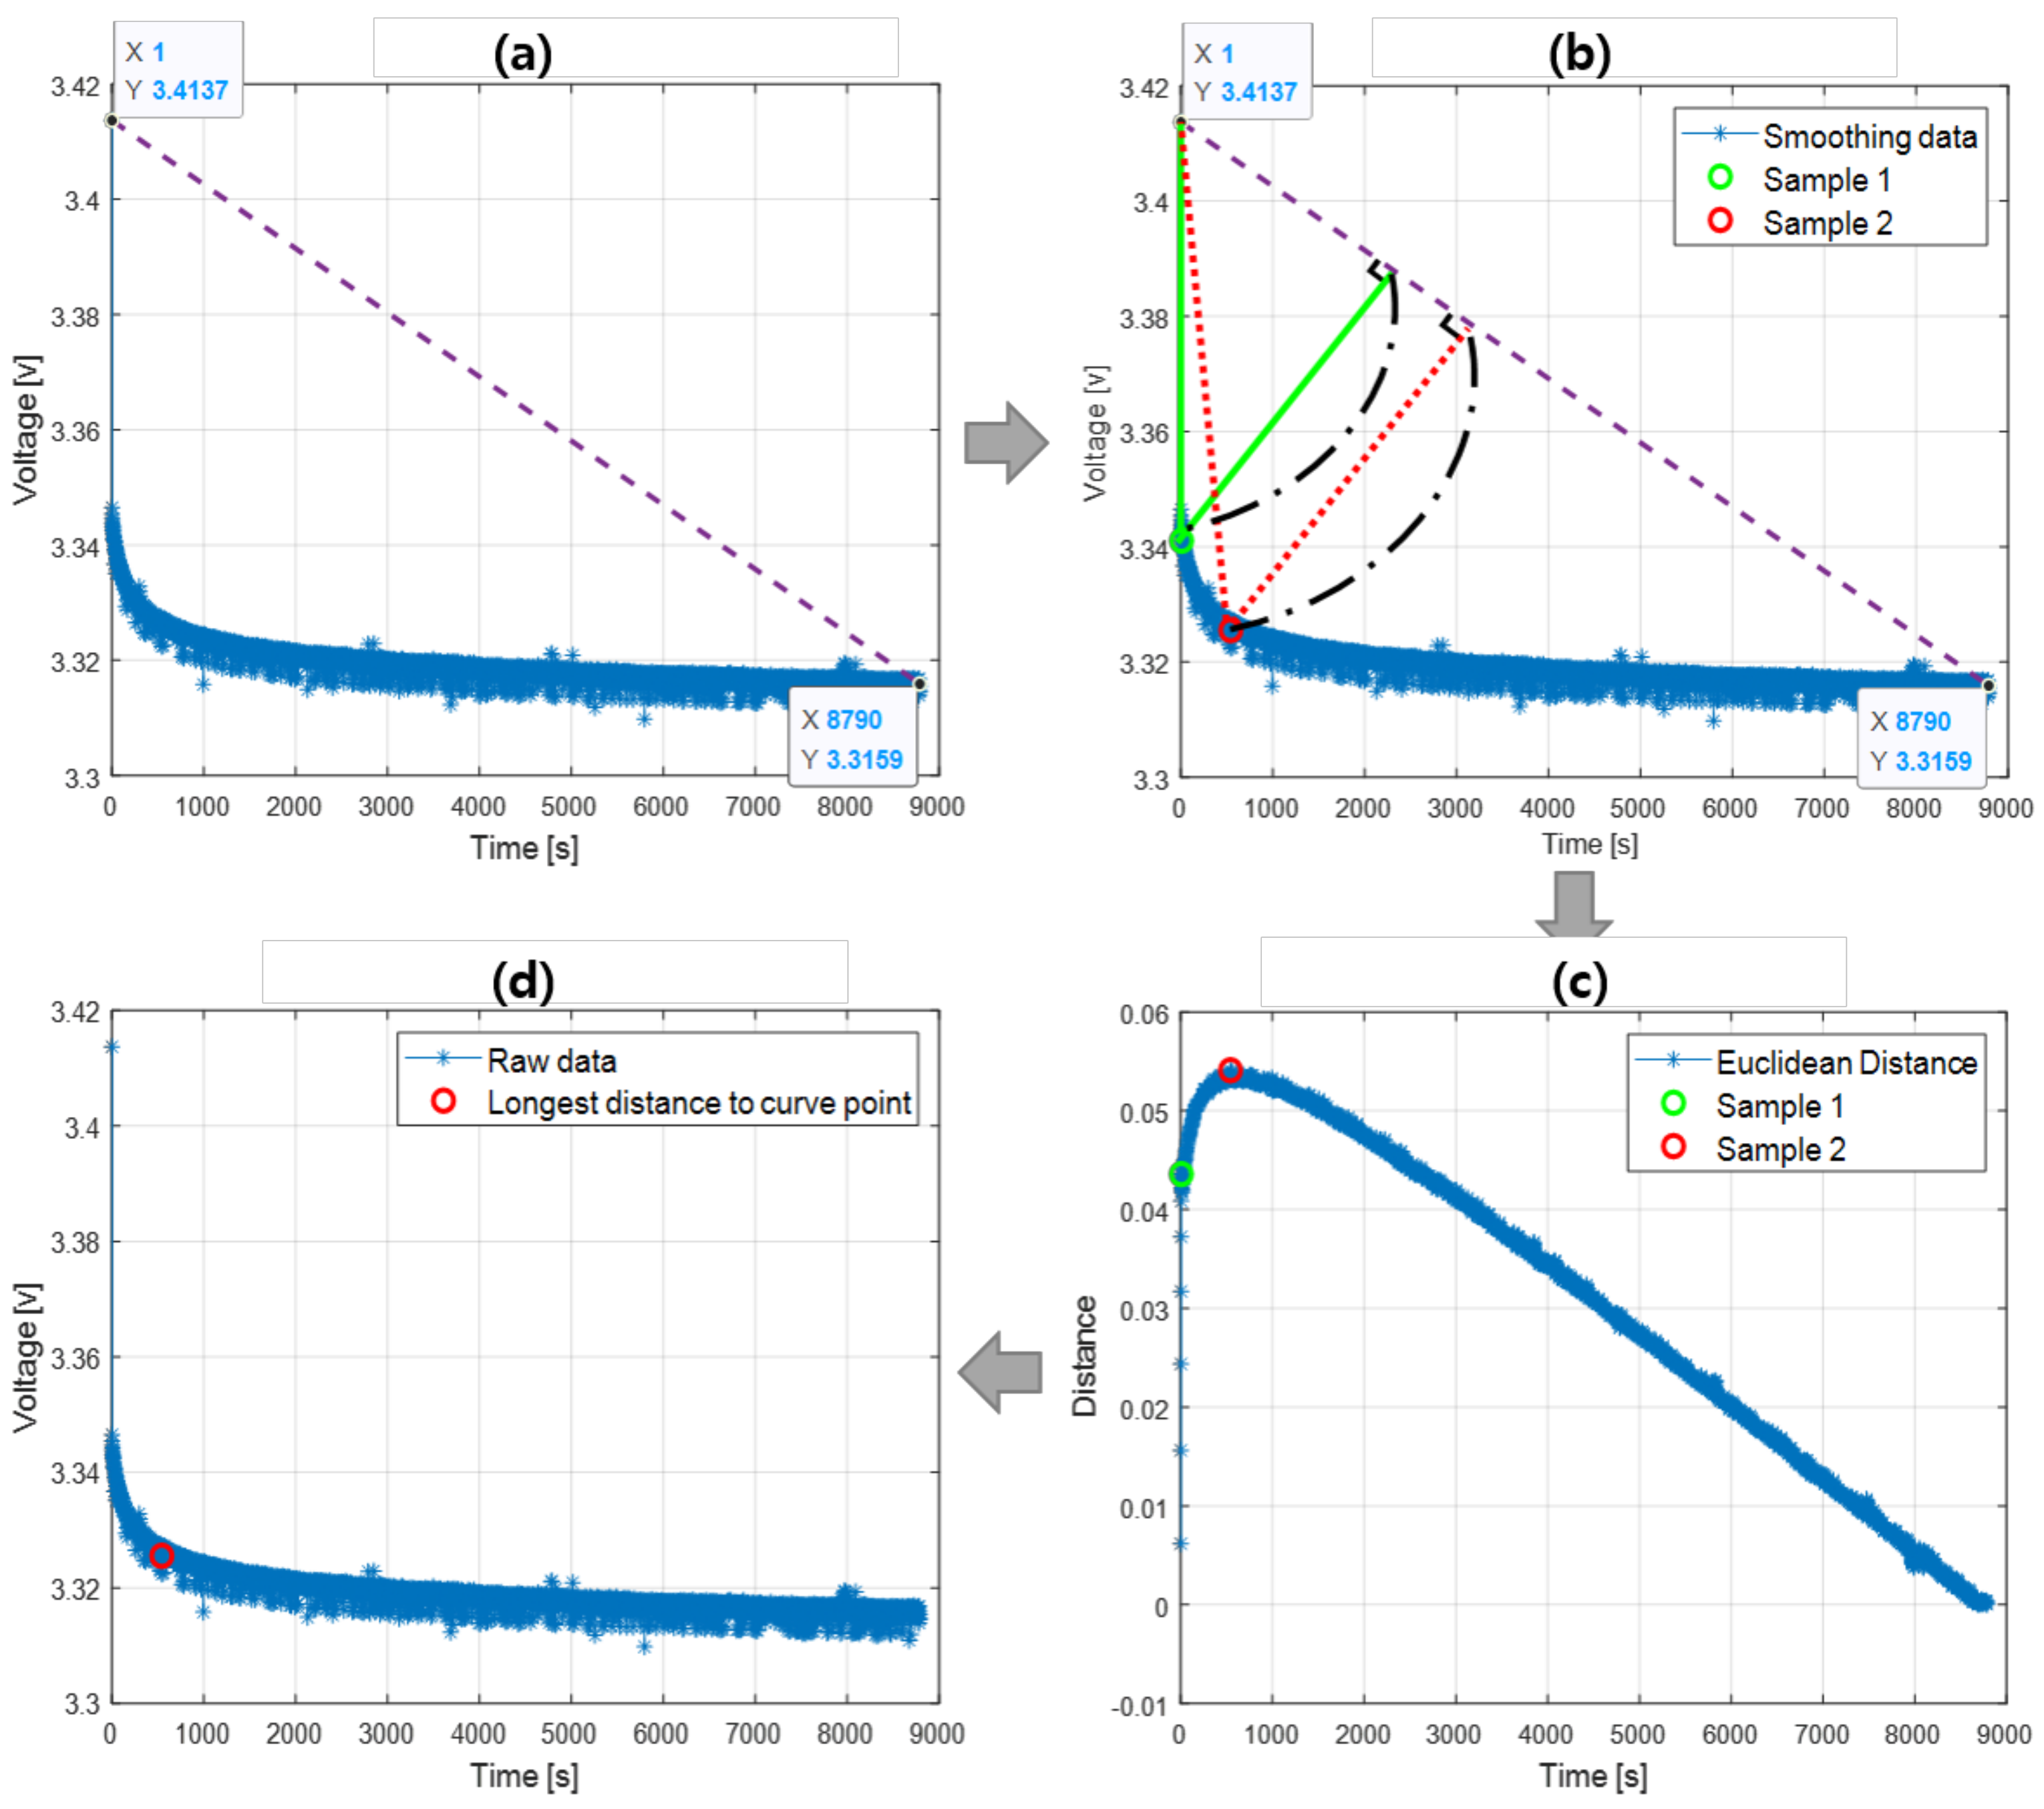
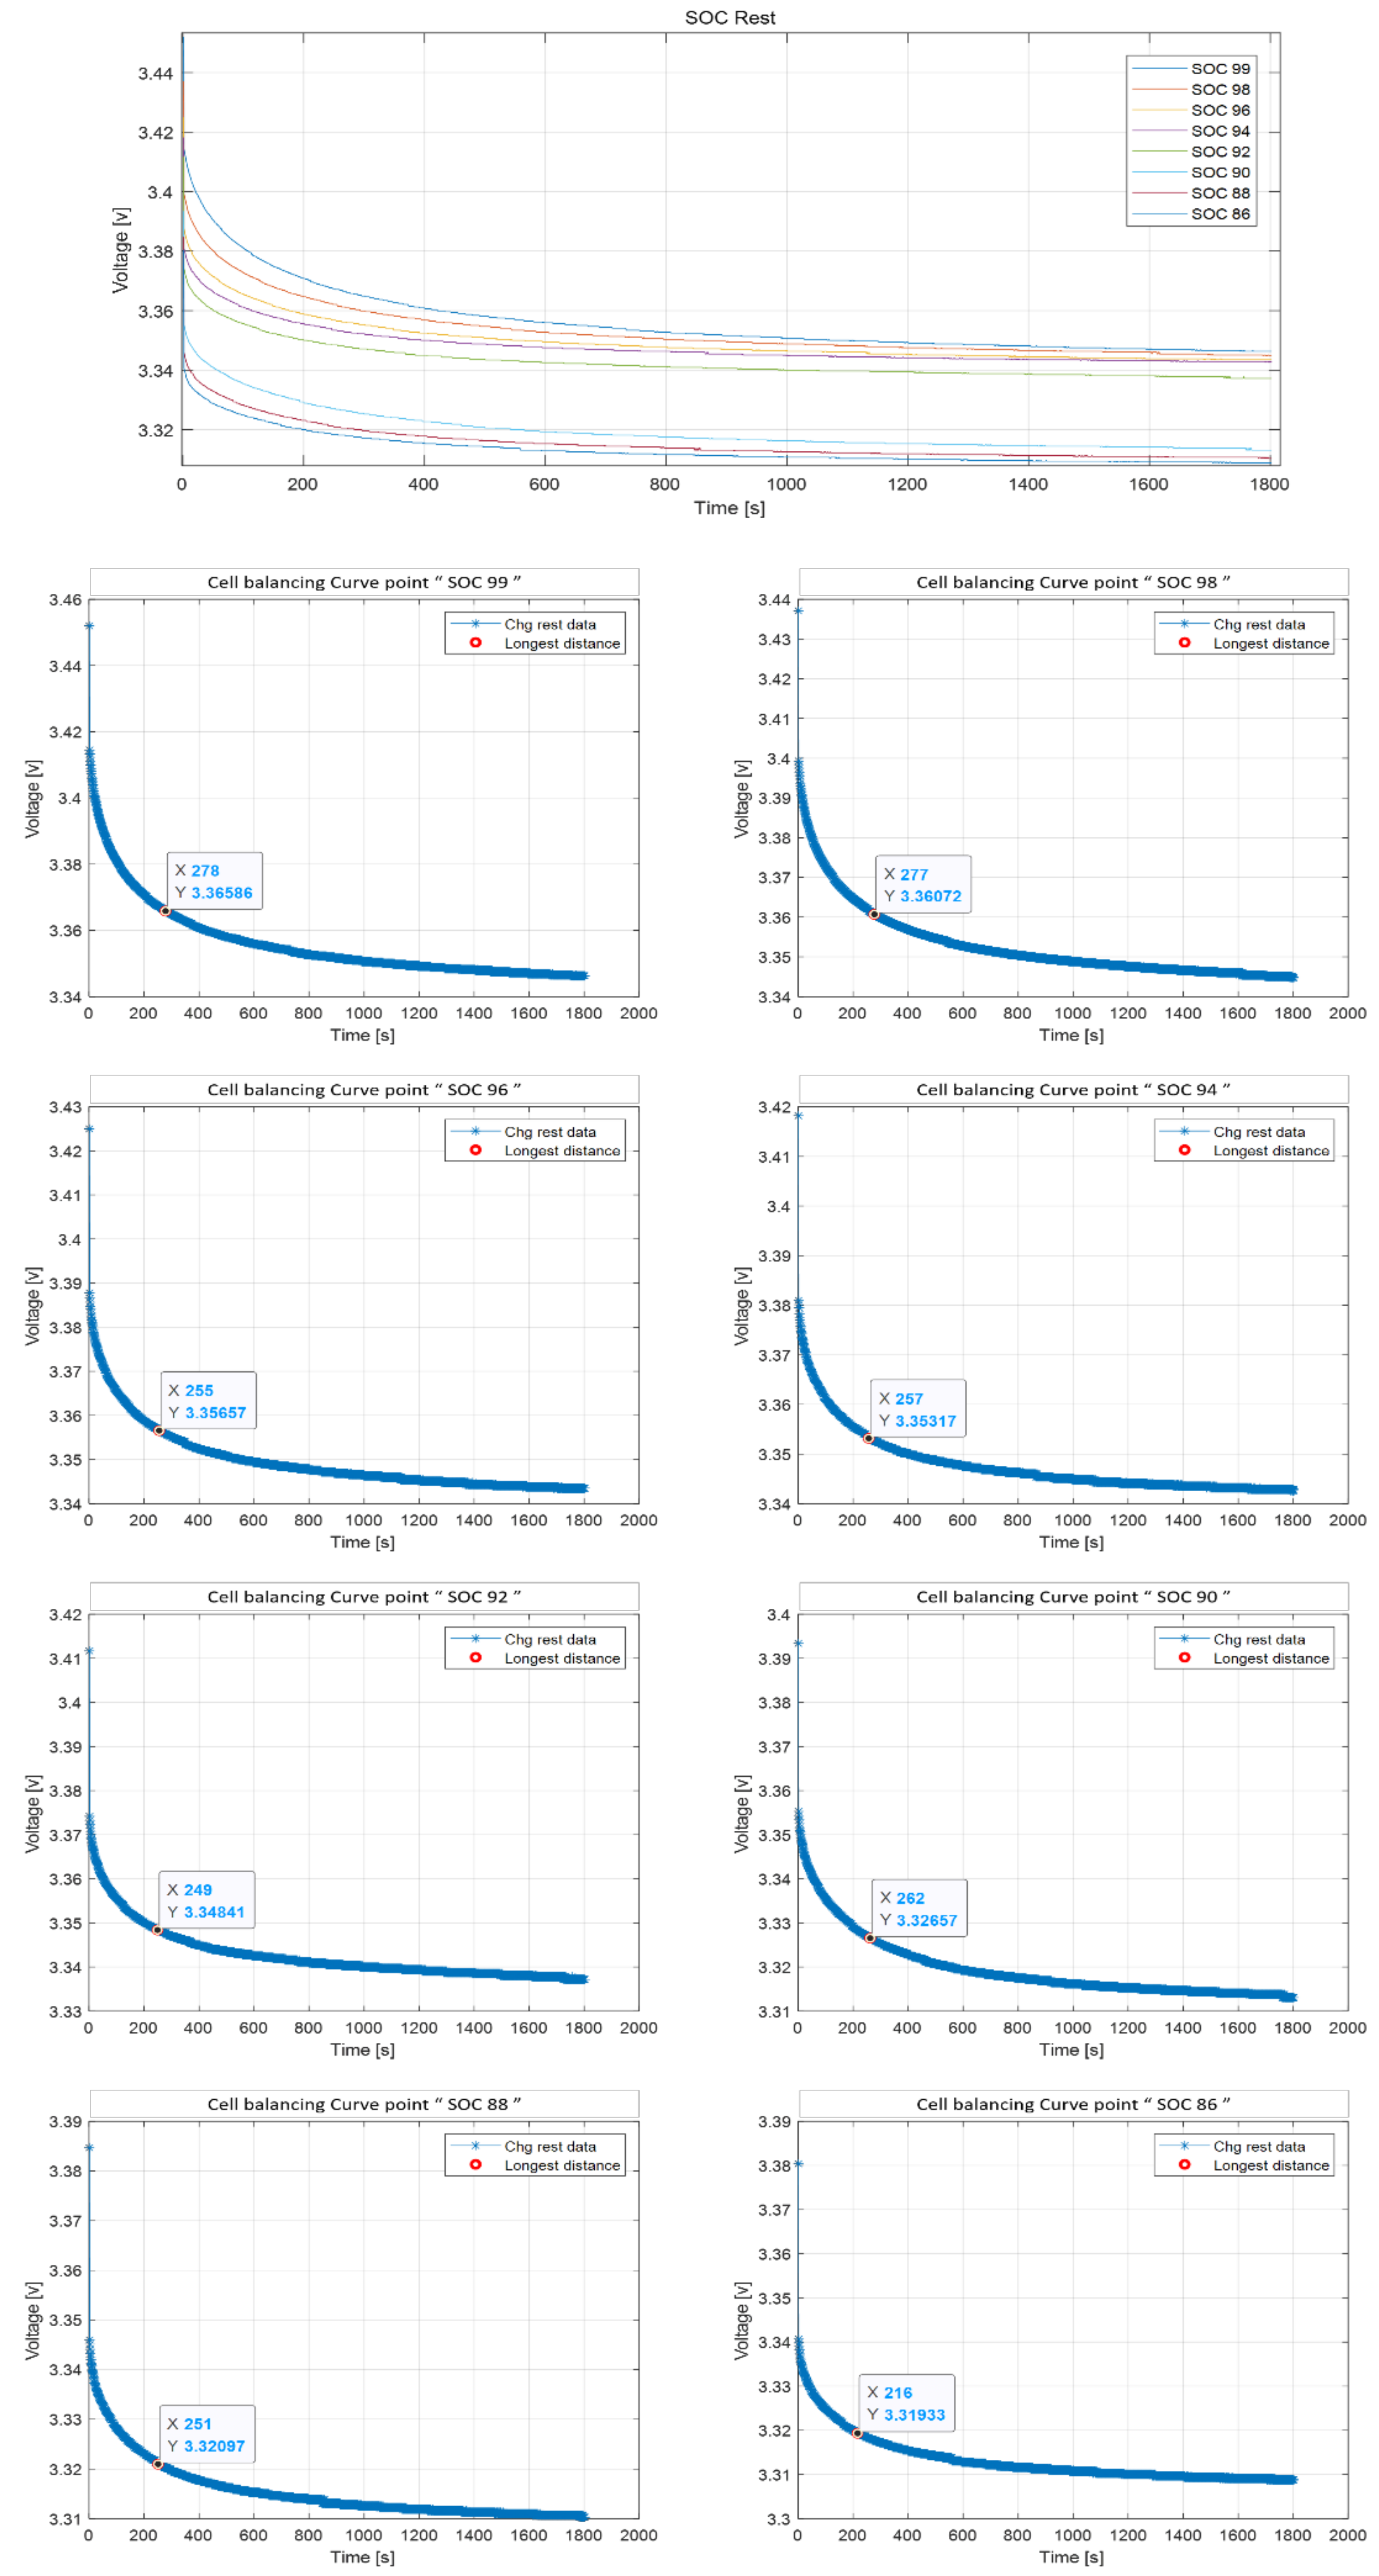
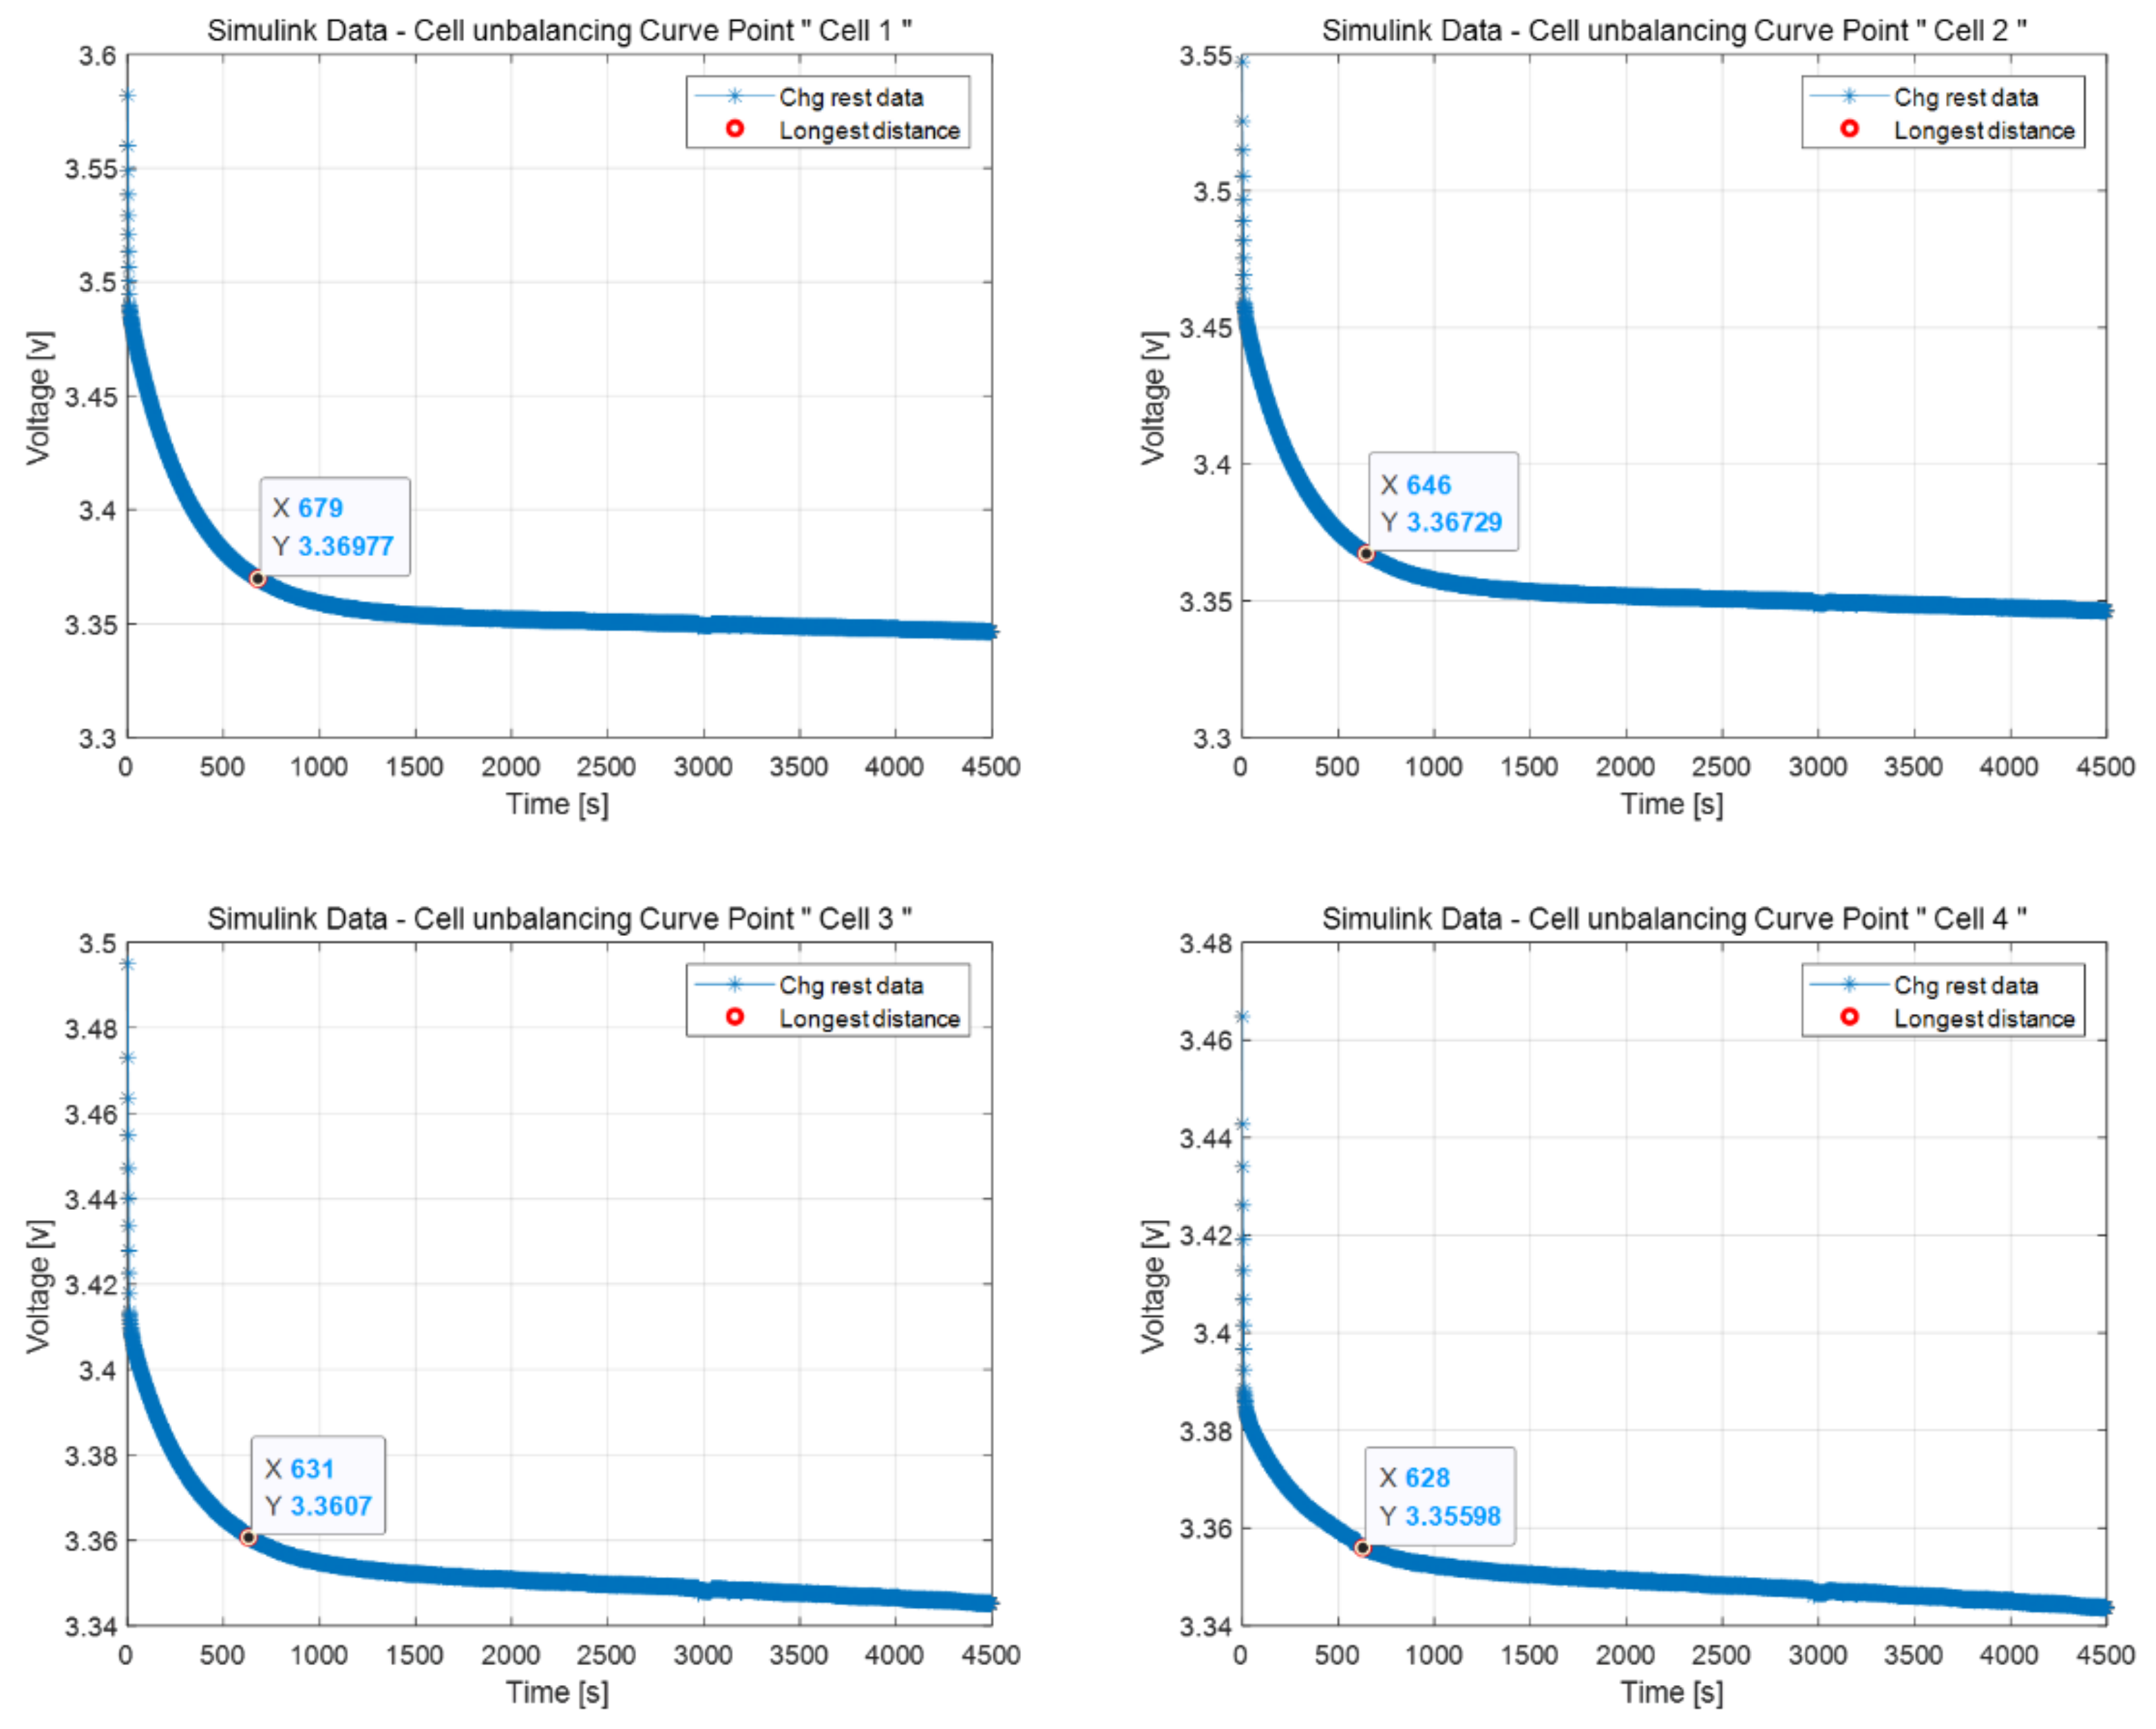
Since ICC alone is insufficient to determine the cause of an abnormality, an order of cell voltages is used to determine the cause. The order of cell voltages represents high and low voltage values. A problem caused by an external factor increases the resistance considerably greater than a problem caused by an internal factor. Therefore, according to Ohm’s law, if the same current is applied to a cell with and without a resistance problem, the corresponding voltage will have a specific characteristic. In discharge currents, the voltage is invariably lower than that of the normal cell, and in charging currents, the voltage is always higher. In other words, in resistance problem data with a constantly flowing current, the order of cell voltages is almost constant. Additionally, the overpotential section of a cell with a capacity problem is shorter than that of a normal cell, and for this reason, the order of cell voltages changes even when a constant current flows. Since each issue has different characteristics, the order of cell voltages with stable current flows is typically used.

2.3. Curve Point

When the value of the current changes in a scenario where the current flows, the voltage graph is a curve rather than a straight line, owing to polarization. However, as the number of batteries connected in parallel/series increases, the probability of a change in the battery cell balance increases. Cell unbalance, which is not a severe challenge, refers to the state in which the battery SOC is misaligned. Cells with high SOC reach the charge cut-off voltage first, whereas cells with low SOC reach the discharge cut-off voltage first in the battery pack. However, even in a normal case, because the cells that reach the charge/discharge cut-off at any given point are different, the difference between the curve points is used to determine whether the battery is normal or is affected by a cell balance problem.
The curve can be obtained by computing the Euclidean distance according to the following equation and the method used to find the longest distance between points i and j in n-dimensions. X i v and X j v represent the characteristics of individual i and j. p denotes the number of portions in the sample, and v denotes the number of individuals [32].
d i j = v = 1 p X i v X j v 2
Figure 1 describes identifying a curve point based on Euclidean distance. The blue line represents the raw data or the smoothing spline data of the rest period after the charge cut-off voltage is reached. The purple line connecting the first and end points is orthogonal to each point in the raw data or the smoothing spline data (Figure 1a). In Figure 1b, the circle is randomly set to demonstrate obtaining the Euclidean distance. The distance is measured by drawing a perpendicular line from the straight purple line to each real voltage data point. After that, the measured distance is indicated. Figure 1c shows the distance between ex 1 and ex 2. The point with the most significant distance is displayed in the raw data in Figure 1d. It is considered the curve point.

2.4. Proposed Methodology (Configuration of Fault Diagnosis & Cause Analysis)

Herein, we propose a model for estimating battery pack failure based on the ICC and order of cell voltages. Correlation coefficients are used to detect faults through reliable diagnostics despite normal fluctuations. The ICC value can indicate a defect and cannot identify a defective cell. Notably, a cell identified as abnormal based on ICC may not necessarily be faulty. Consequently, the order of cell voltages is used to detect cell faults. In general, the order of cell voltages can be used to analyze the cause of abnormality, because voltage behavior is variable for each reason.
Moreover, we propose a diagnostic framework for battery pack problems that could be useful for detecting battery-related issues. The proposed flowchart for diagnosing abnormalities in a battery is illustrated in Figure 2.
This flowchart is to determine the capacity, resistance, and cell balancing problems. A battery with multiple anomalies would demonstrate various symptoms, making it hard to determine which anomaly affects the battery. In the case of multiple problems simultaneously occurring, the proposed logic can determine the most significant anomaly of all the associated anomalies.
The abnormality criterion is subject to change depending on the application and the used environment. In this paper, the criteria for abnormal symptoms were assumed to be 10% deviation for each item, respectively. Preliminary studies confirmed that any abnormality causes at least a few percentages (e.g., 3%) of SOC deviation through these criteria. To this end, we deployed ICC to initially filter out the normal condition (i.e., the condition where the SOC deviation is less than 3%).
In this paper, since the cell balancing problem is determined using the idle period after full charging, the charge and discharge voltage data were generated by designating the SOC as 100–97% using a simulation. The SOCs were assigned as Cell 1 = 100%, Cell 2 = 99%, Cell 3 = 98%, Cell 4 = 97%, and Cell 5 = 96%, and then, the cycles were performed. Figure 3 demonstrates different causes of abnormalities, including capacity problem, resistance problem, typical cell balancing problem, and serious cell balancing problem.
As for the voltage data used, as shown in Figure 4, the curve that reached near the full charge was 12 times, and the voltage that reached near the full discharge was 4 times. Since ICC is designed to catch the behavioral difference rather than the differences in the values, the SOC deviation is more likely to be detected at around the full charge events where the voltage fluctuation is more like to have deviated from each other. Hence, even if there could be voltage differences between the cells in the middle SOC range for various reasons (SOC deviation, resistance deviation, and capacity deviation), the voltage fluctuation would be almost identical. Therefore, the ICC may not be able to identify the faulty conditions.
As a result of applying the voltage to the ICC (at the area near the full charge),
(1)
ICC value cell 1 and cell 2 < 0.5: 0%
(2)
ICC value cell 1 and cell 3 < 0.5: 16.6%
(3)
ICC value cell 1 and cell 4 < 0.5: 83.3%
(4)
ICC value cell 1 and cell 5 < 0.5: 91.7%
To demonstrate why the ICC criterion was set to 0.5 for the small SOC deviation, Figure 5 illustrates the ICC by increasing the SOC deviation by 1%. From here, it can be observed that most of the ICC values shift to below 0.5 after the SOC deviates more than 3%.
If there is a problem through ICC, the flow chart of the voltage is used to analyze the cause. The capacity is changed depending on the number of lithium ions available for activation. It means that batteries with a lower capacity will charge and discharge faster than other batteries in use. A cell with a capacity problem reaches the “steady state” faster than a cell with other standard capacities when a constant current continues to flow. Thus, it is possible to change the order of the voltages. On the other hand, in the case of a cell with a resistance problem, the voltage is lower than that of other cells when the discharge current flows, and the voltage is higher than that of other cells when the charging current flows.
In addition, in the case of a cell balancing problem, the voltage of a specific cell is constantly low or high, thus the order of the voltages does not change when a current flows. Due to these characteristics, the capacity problem can be identified based on the continuous current flowing.
The most prominent are distinguished between resistance and cell balancing is identifying cells that have reached the cut-off voltage. While the current flows, the voltage is affected by resistance. When a charging current flows through a cell with significant resistance, the voltage will show a higher SOC, even though the actual SOC of the cell is 50%. When the current flows, specific cells affected by significant resistance reach charge and discharge cut-off voltages. However, in the case of the cell balancing problem, the cell that has reached the cut-off voltage during the charged state and the cell that has reached the cut-off voltage during the discharged state are not the same. Therefore, it is possible to separate the resistance and cell balancing problem.
Finally, only a cell balancing problem may be suspected when the capacity and resistance are within the normal range. If there are problems with both capacity and resistance, there is a high probability that the cell balancing problem is also included. The authors of [33,34] show that cell balancing is attempted when SOC deviation occurs by about 10%. Therefore, “typical cell balancing” is a case where the SOC deviation is 3%~15%, including the margin, and if SOC deviation exceeds 15%, then it is classified as a serious cell balancing problem.
Typical cell balancing means that the cells’ SOC does not match. SOC 100% is based on the cell that arrives at the charging cut-off voltage first in a battery pack. Conversely, a 0% SOC is the standard for the discharge cut-off voltage.
A serious cell balancing problem means that the difference between the highest SOC and the lowest SOC at a full-charge cut-off voltage is more than 15%.
The cell SOC deviation can be identified using the voltage deviation as well. However, the LFP battery has a flat voltage over the long SOC range. Thus, the curve point method can provide more vivid evidence for identifying the SOC deviation, because it uses vector information (the curve itself) rather than single-point voltage information. In the “rest after charge” section, the curve point uses the area where the voltage drops in a curved shape. The difference in the curve point was designated as 60 s, and it was obtained through experiment of the LFP 280 (Ah) prismatic cell. Figure 6 is the result of an experiment with a 3-h rest after charging in units of 1% at the SOC 100%~86% area. The curve points are similar from SOC 100% to SOC 88%, and the curve point of SOC 86% could appear at a place with a difference of about 1 min. Thus, the degree of cell unbalancing was determined using the curve point. Since the values used in this paper were generated based on the caravan’s LFP battery data, the values used in ICC and curve points can be changed depending on the application or the battery types.

3. Simulation of a Caravan Battery Pack

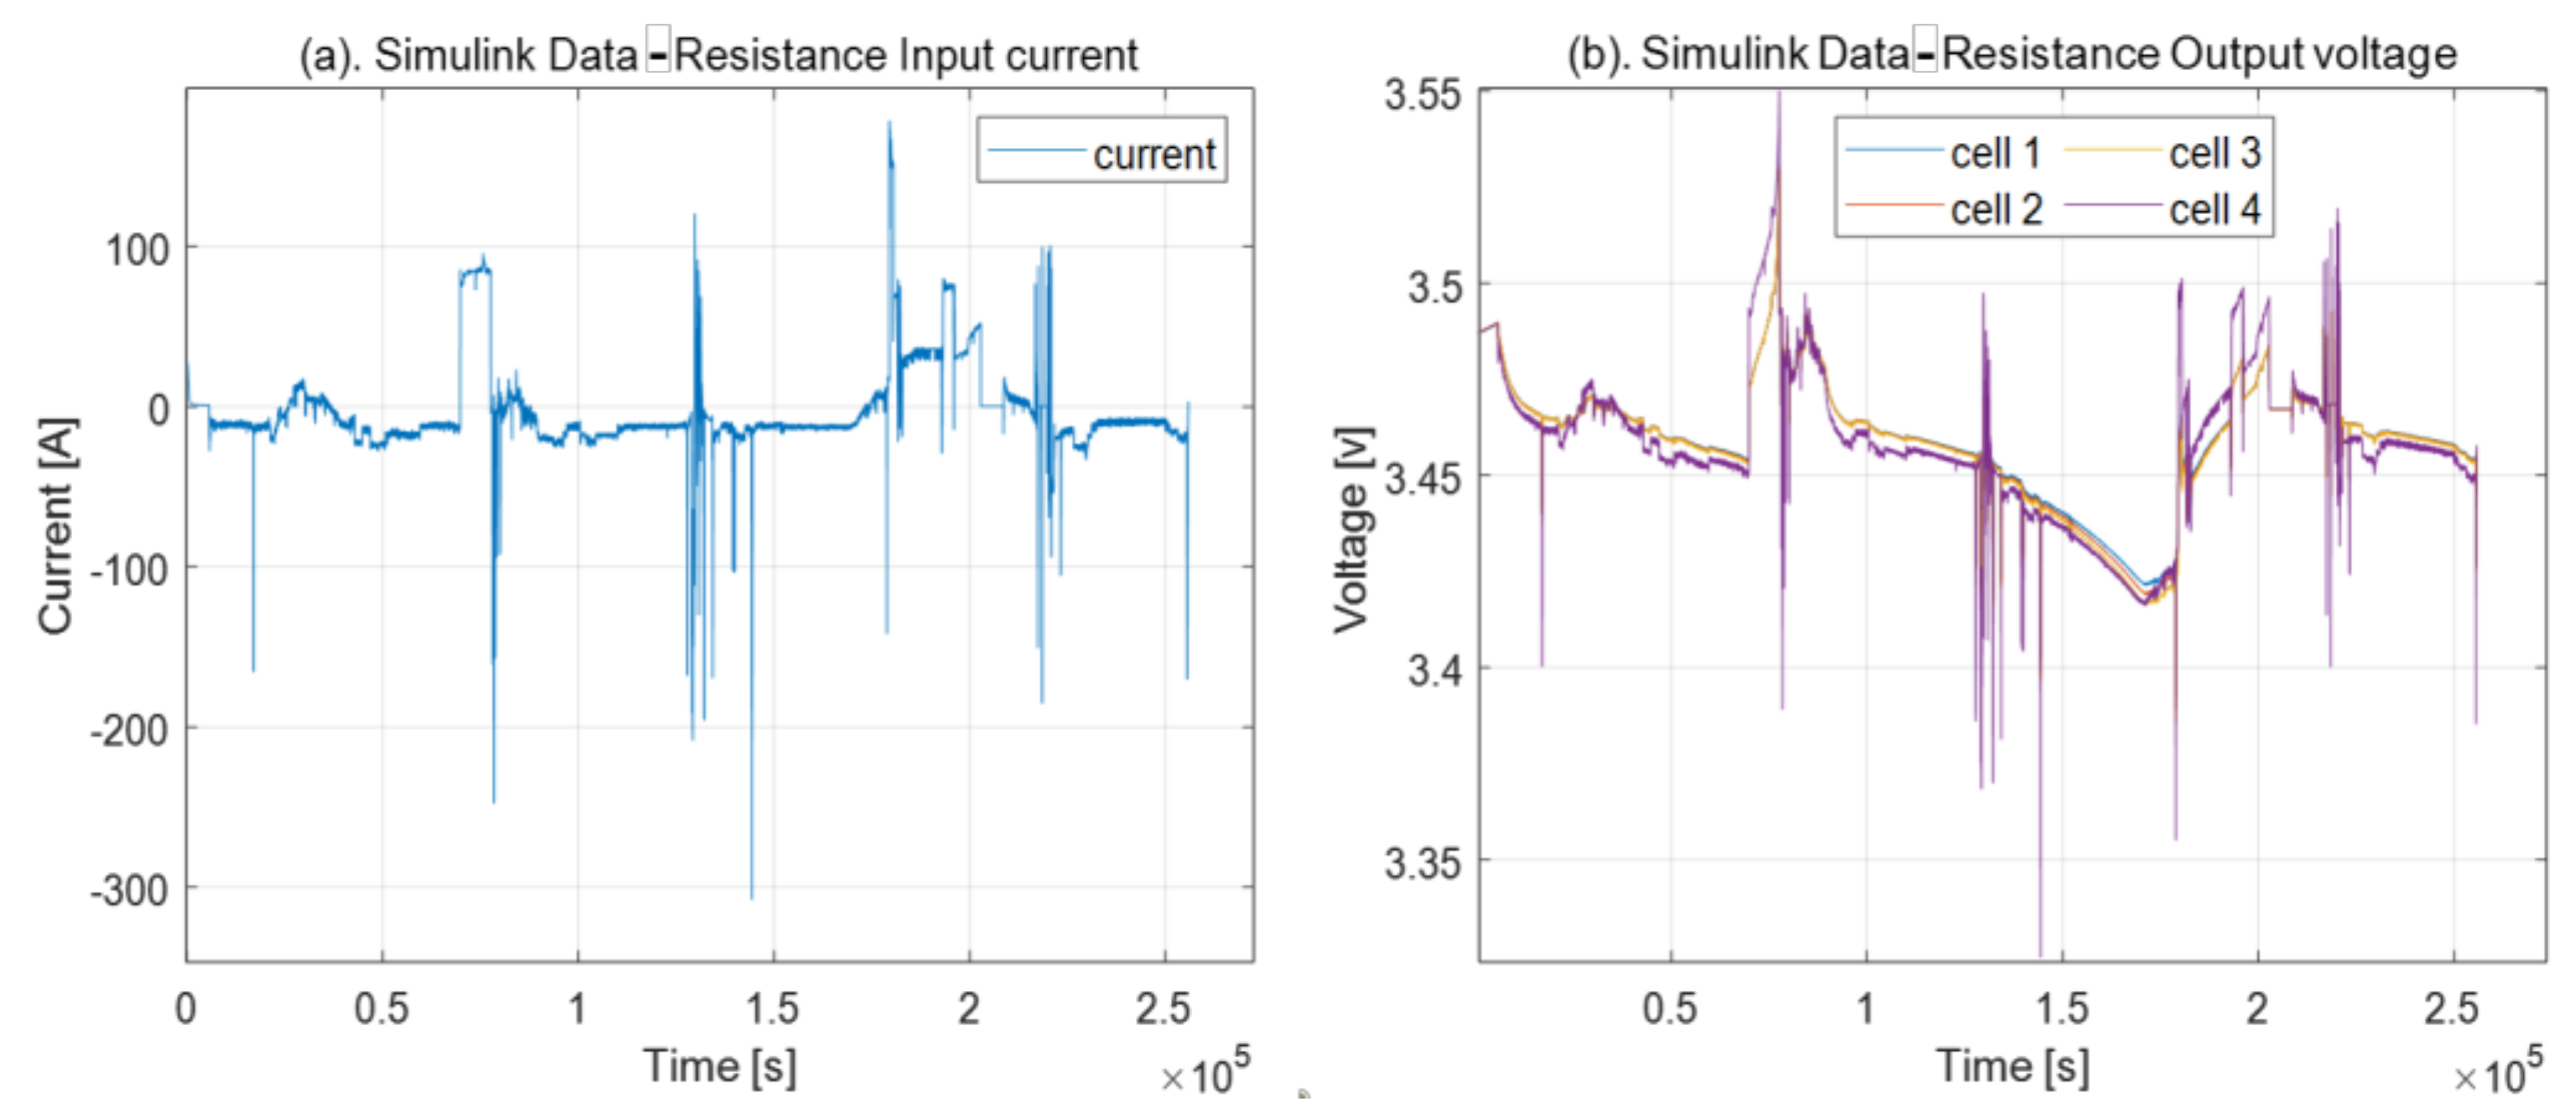
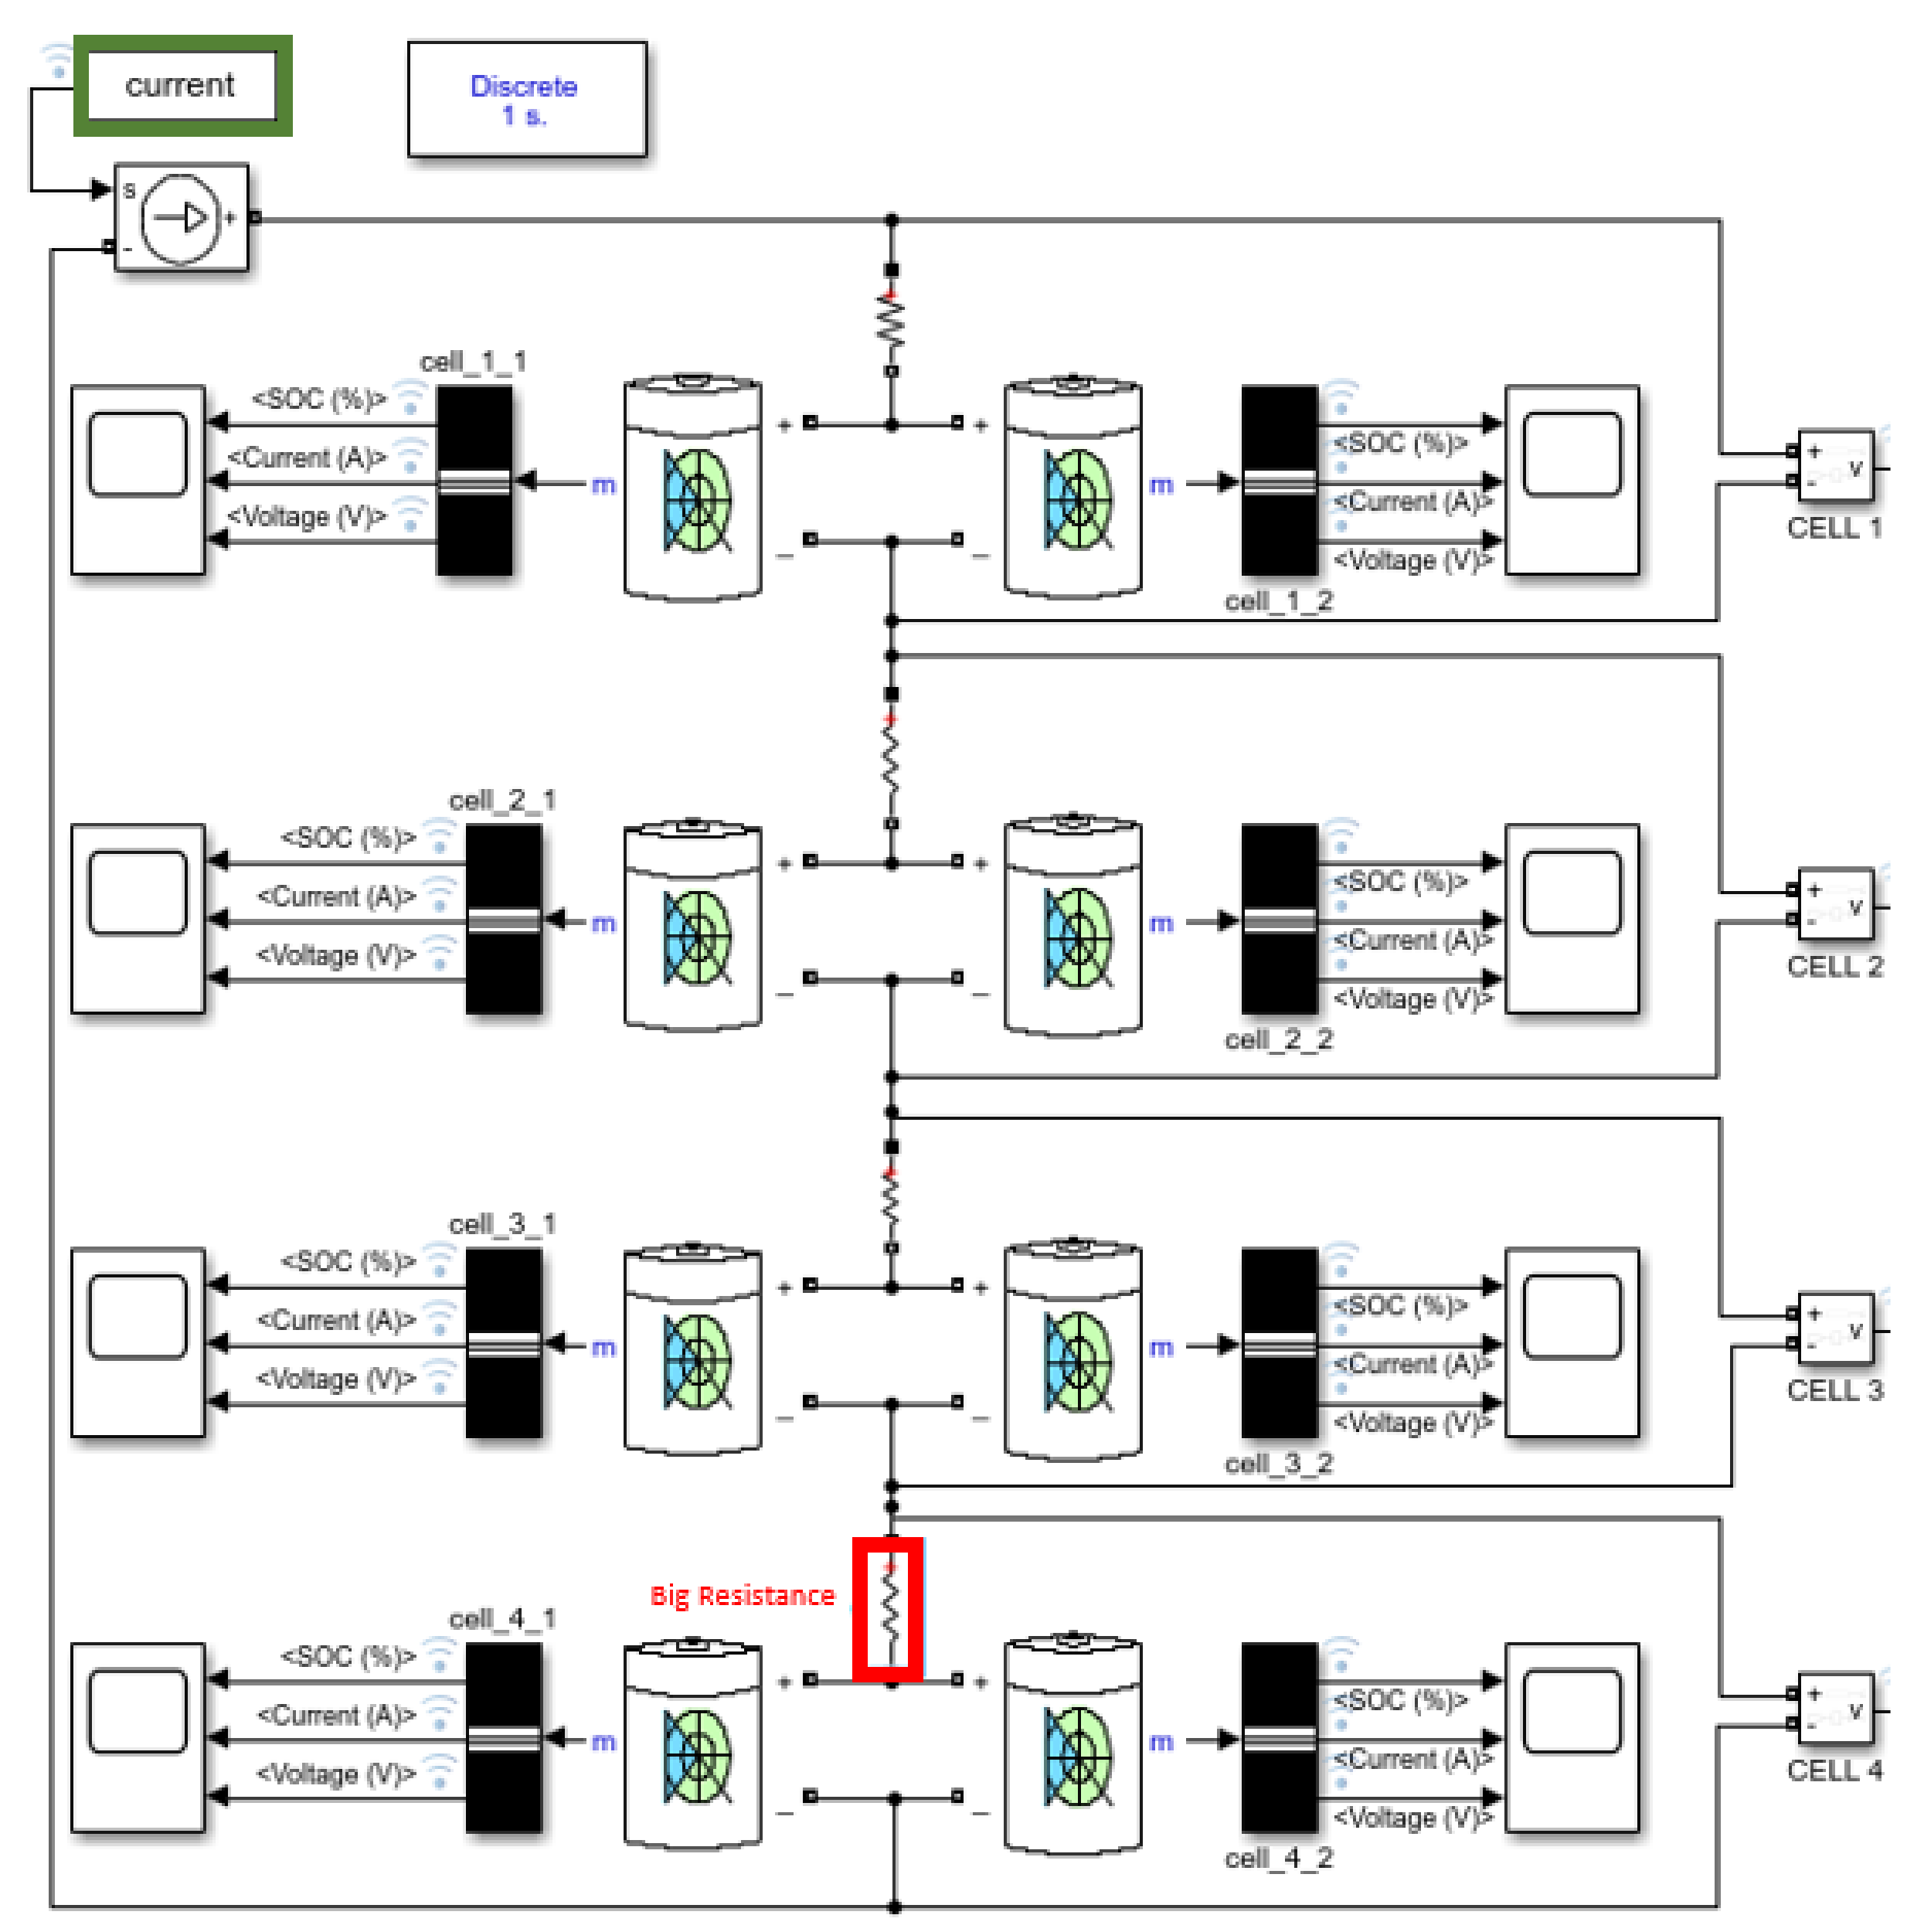
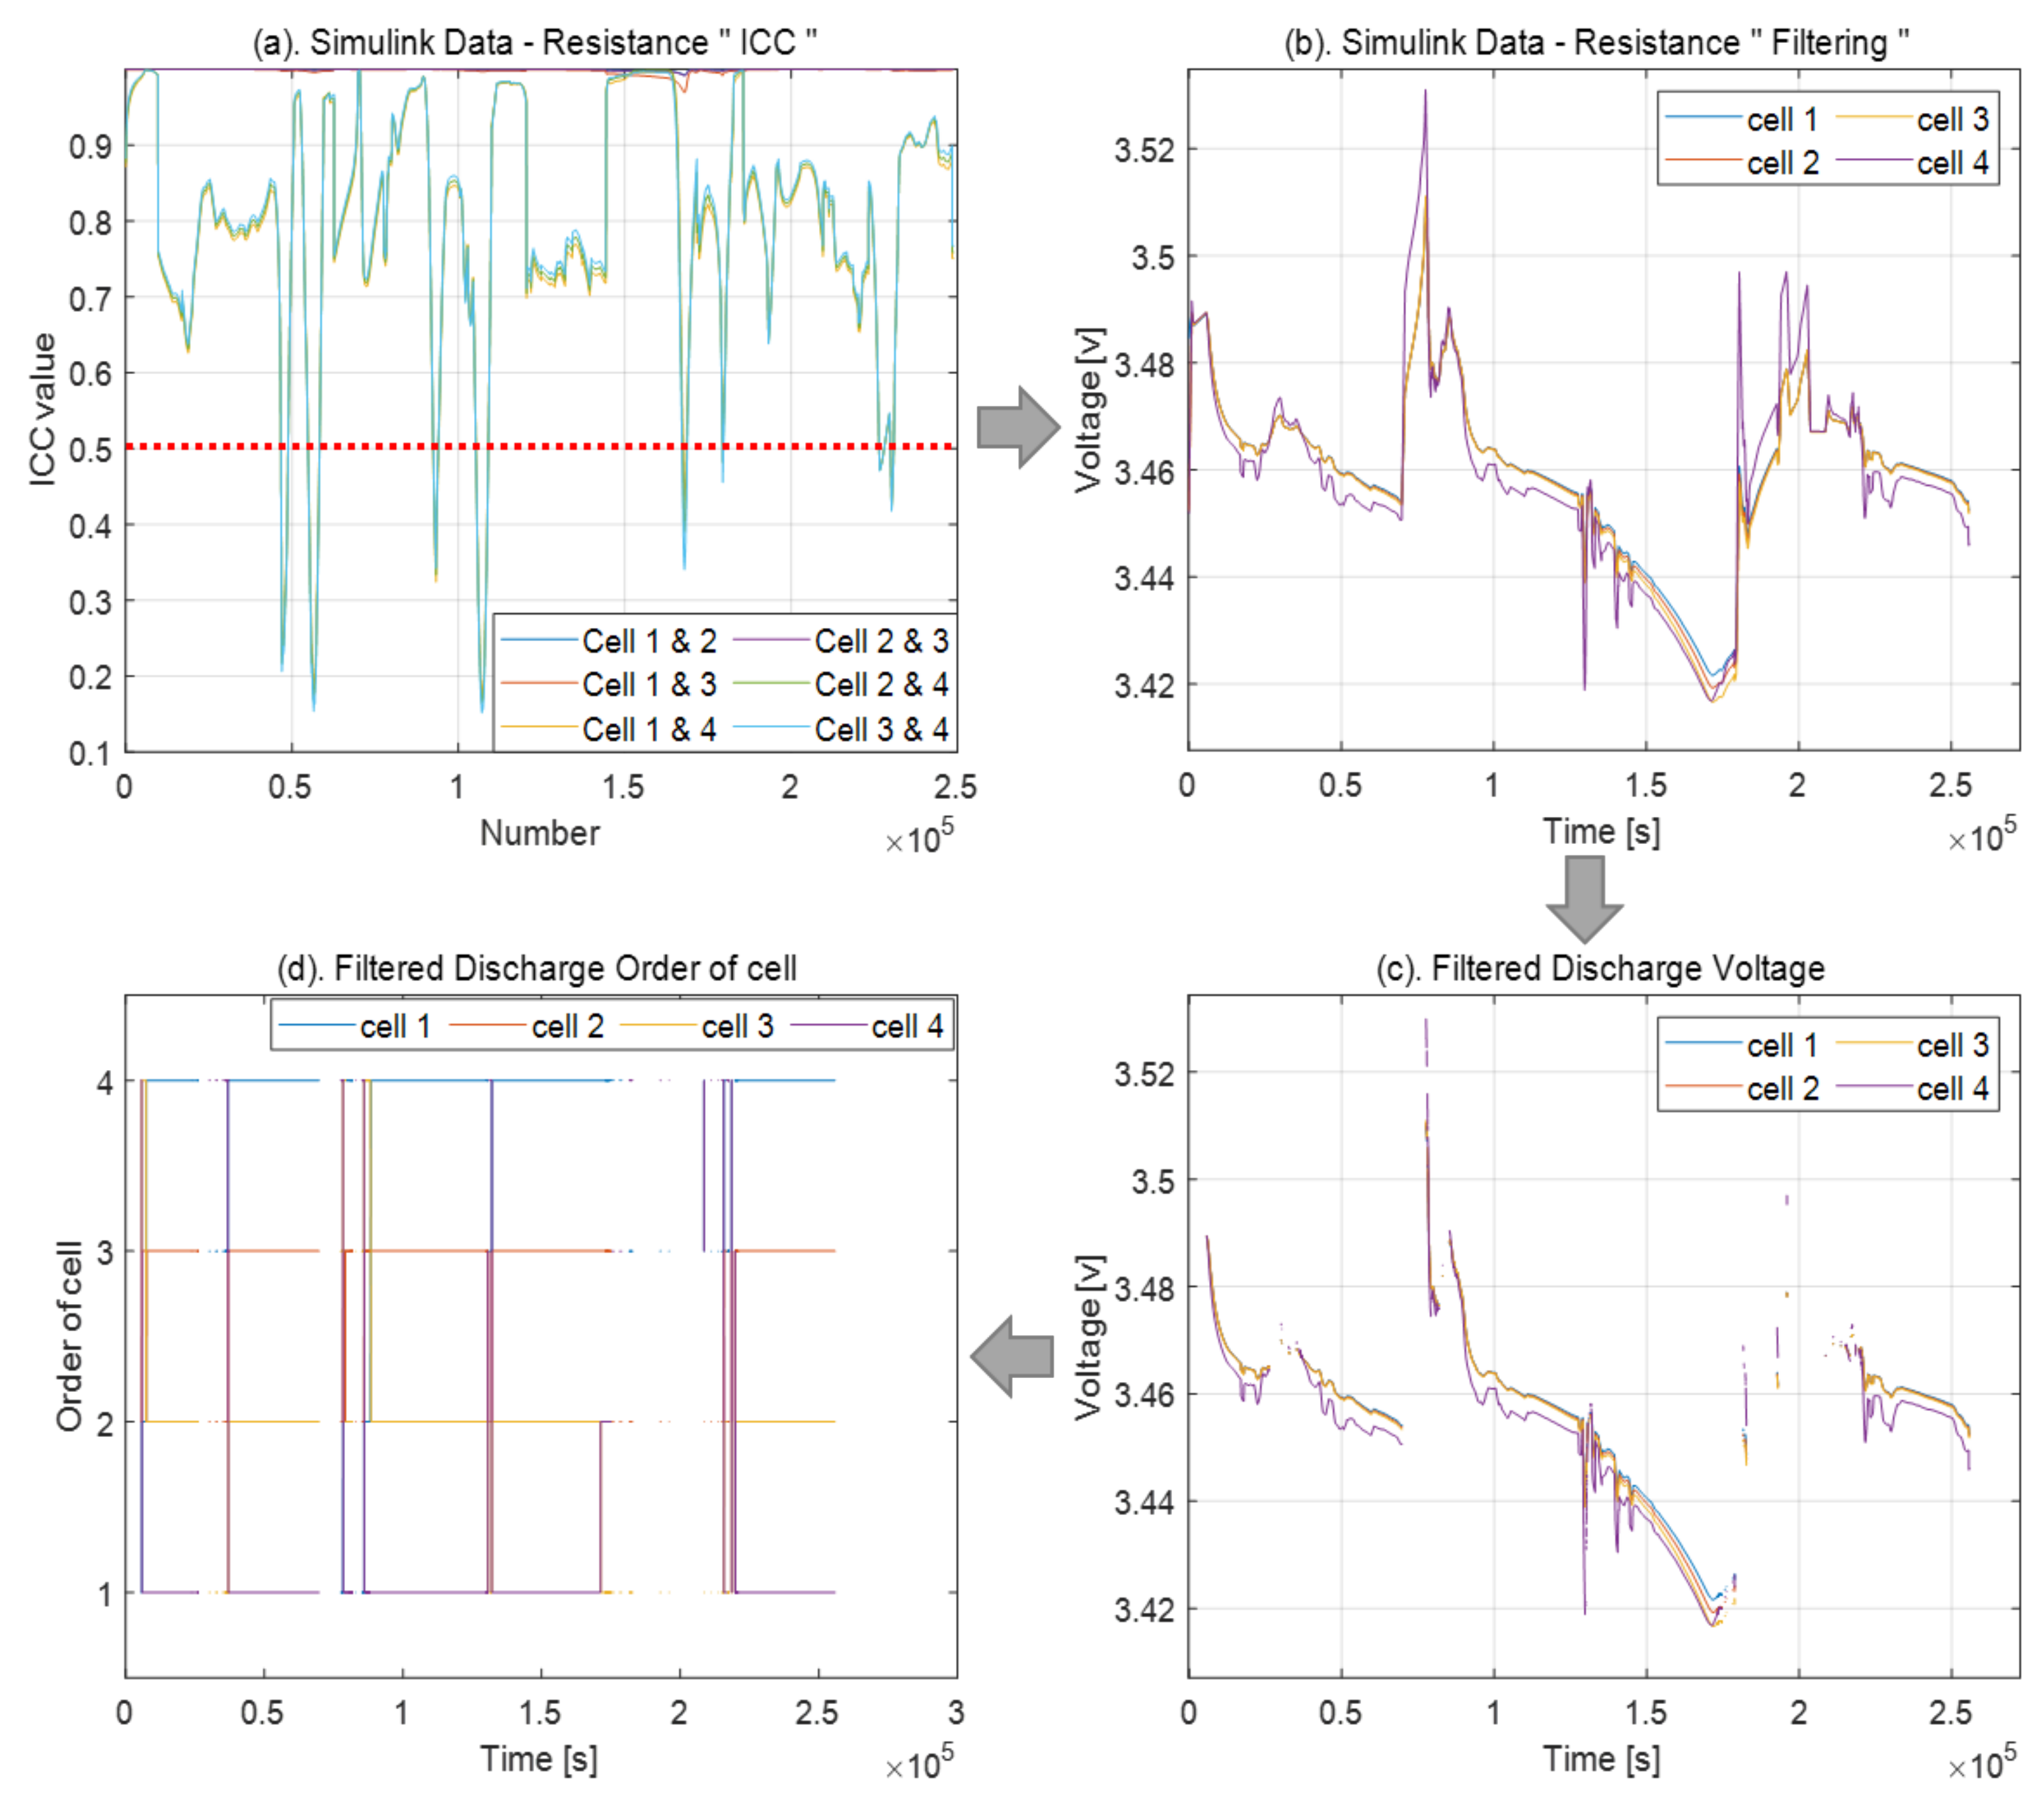
3.1. Resistance Problem

A caravan battery pack simulation was implemented in Simulink to obtain the actual data. As long as the capacity and resistance of the cells are identical, the same voltage was produced. Therefore, we set different cell capacities and resistances for comparison. Since the resistance problem was modeled, the capacity was set in a range in which the effect of the capacity difference was negligible. The capacities and resistance of cell 1 were 280 (Ah) and 0.06 (mΩ), those of cell 2 were 275 (Ah) and 0.06 (mΩ), those of cell 3 were 270 (Ah) and 0.06 (mΩ), and those of cell 4 were 275 (Ah) and 0.3 (mΩ), respectively. The resistance of cell 4 was five times higher than that of the other cells. Herein, the input data for Simulink were obtained from the capacity problem described in Section 4.2.
Figure 7b shows the data extracted using Simulink in Figure 8. Cell 4, the resistance of which was five times higher than those of the other cells, exhibited more remarkable voltage variation at higher and lower currents than the other cells. Although cell 4 did not reach the cut-off voltage, despite its capacity being set equal to that of cell 2, it is evident that cell 4 was at its peak when a large current flowed. Therefore, it is reasonable to expect that this cell will be the first to attain the cut-off voltage if the current continues to flow.
Since the current data are real, the extracted voltage data appear similar to the actual data. According to the voltage data in Figure 8b, cell 4 exhibits more significant variations than the other cells, but it is a stretch to identify cell 4 as abnormal or faulty based on these findings.
Therefore, its abnormality is determined using the ICC value.
Figure 9a shows the ICC value obtained by entering the voltage data into the ICC model. An abnormality was suspected when the ICC value decreases to less than 0.5. As shown in Figure 8a, under peak conditions, the voltage variation with respect to the other cells differs considerably, depending on whether a large charge current of 100 (A) or a large discharge current of −200 (A) flows, resulting in an ICC value of 0.5 or smaller. The next step is to perform a cause analysis considering the order of the voltages.
The resistance value implemented in Simulink is constant; voltage fluctuations occur due to current insertion from the actual caravan data. Owing to multiple resistors in environments, the voltage fluctuations are more significant than those illustrated in Figure 8. Although the noise level is not greater than that in the actual data, the nonconstant current made it difficult to analyze the order of the cell voltages. We performed filtering to remove noise from the voltage data, as illustrated in Figure 9b. After that, we checked the order of voltages.
The current value input into Simulink had a longer discharging section than the charging section, and for this reason, we used data from the discharging section. Figure 9c shows the charging and discharging sections based on the current value. Therefore, if the charging current flows just before the discharge current, the voltage will initially peak; after which, it will drop to its lowest value. Thus, when analyzing the data, as the current transitions from negative to positive or positive to negative, the current flows steadily.
In Figure 9d, even though the capacity of cell 3 is smaller than that of cell 4, it is evident that the voltage of cell 4 is the lowest in the part where the discharge current flows steadily, meaning that it is affected by a significant resistance. Therefore, in the case of resistance and capacitance problems, we used the order of voltage to analyze the cause.
Lastly, to figure out whether it is a resistance problem or only a cell balancing problem, we will check whether a cell that has reached cut-off voltage in a charged state is the same as a cell that has reached cut-off voltage in a discharged state. Figure 8b shows that only cell 4 draws a voltage waveform larger than other cells when charging and discharging and is close to the cut-off voltage. Through this, the resistance problem was simulated, and the cause was analyzed.

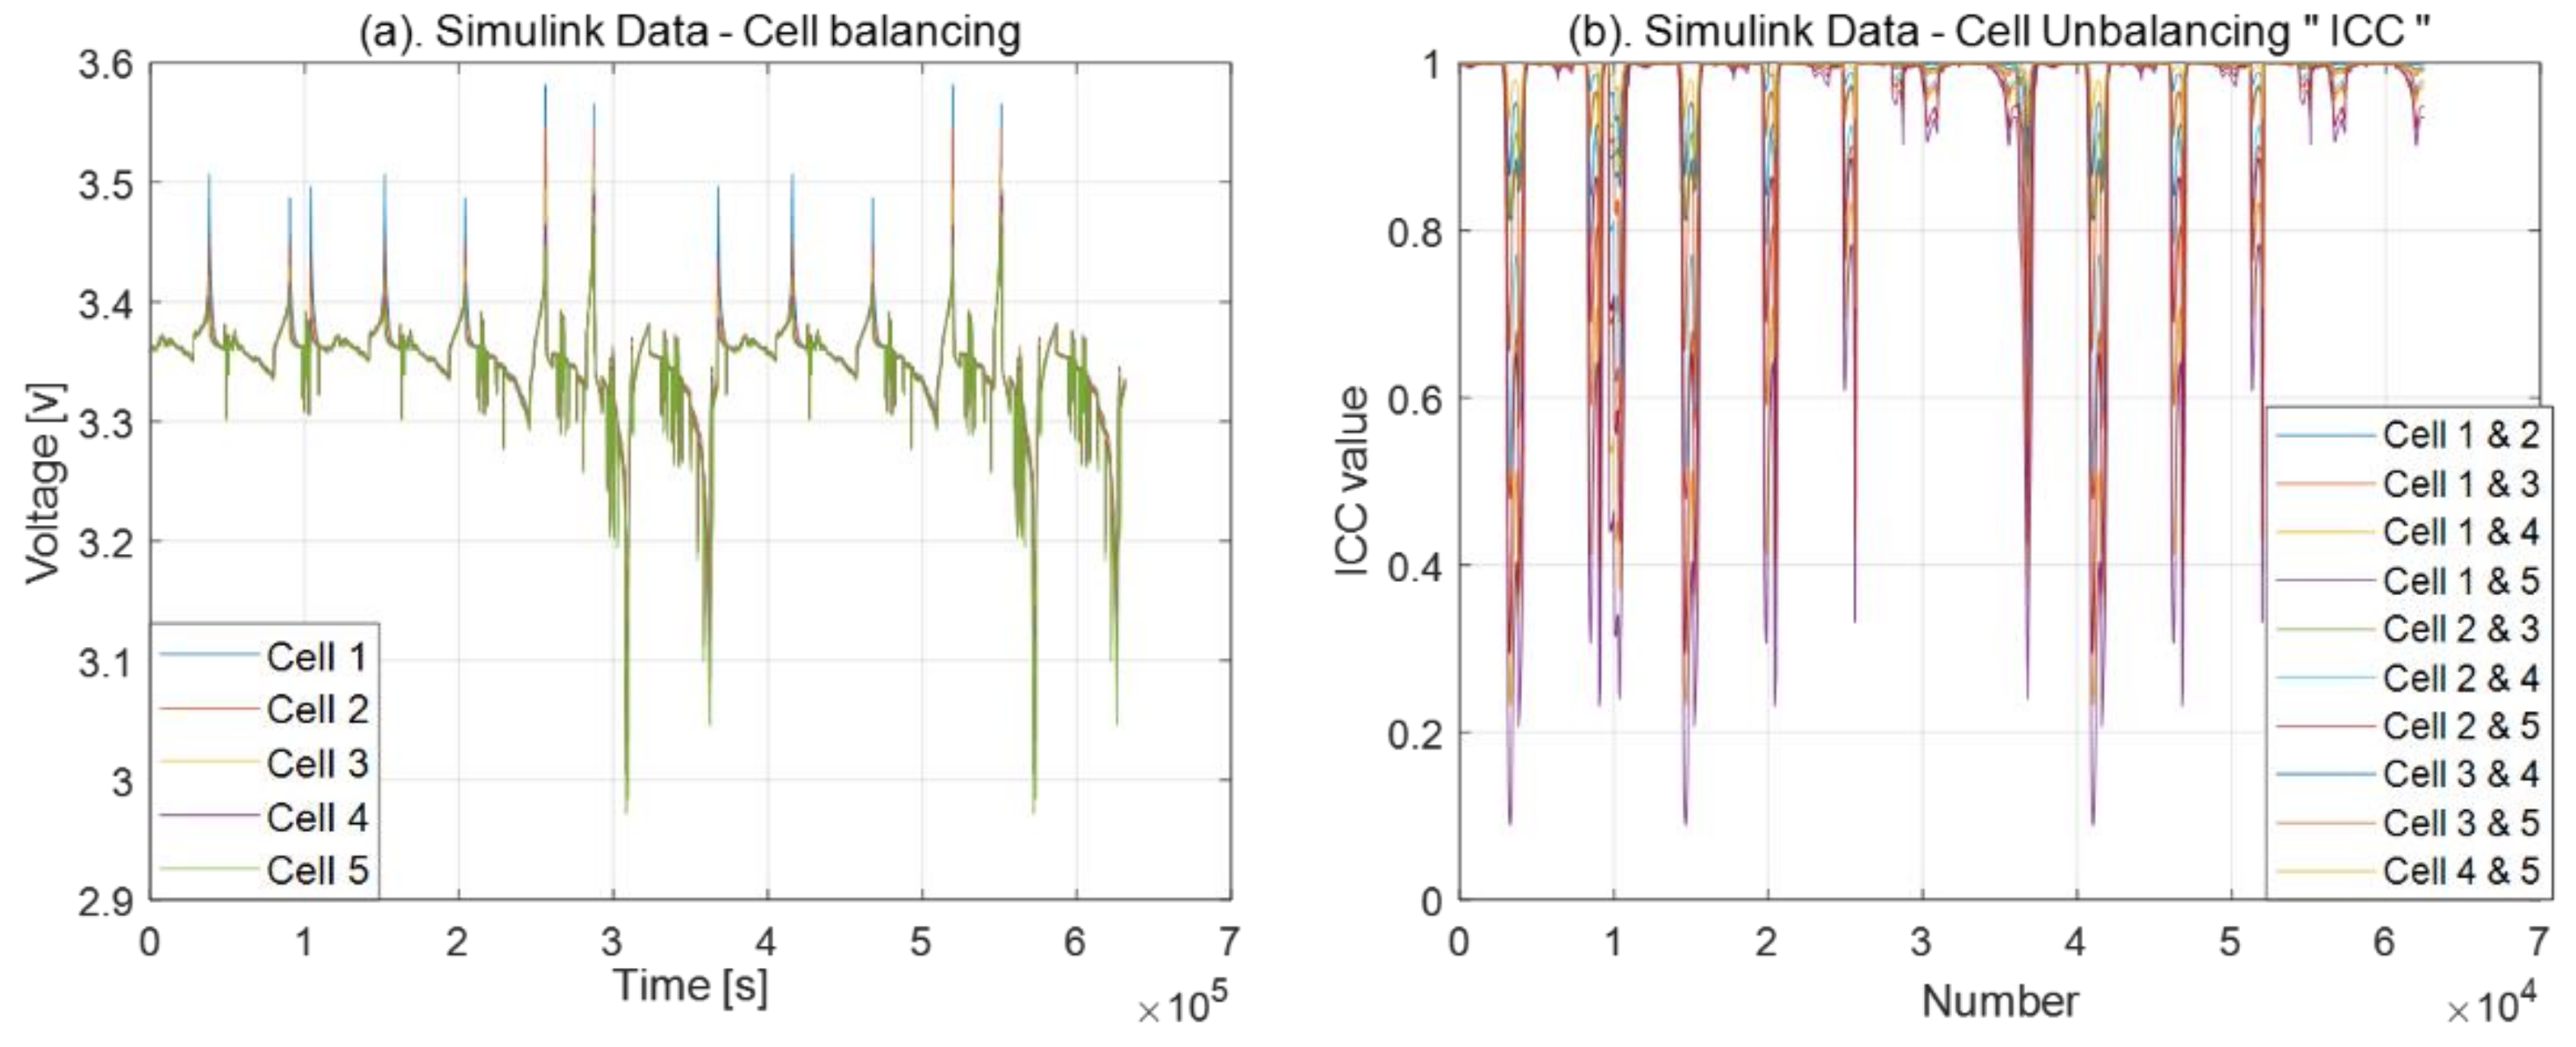
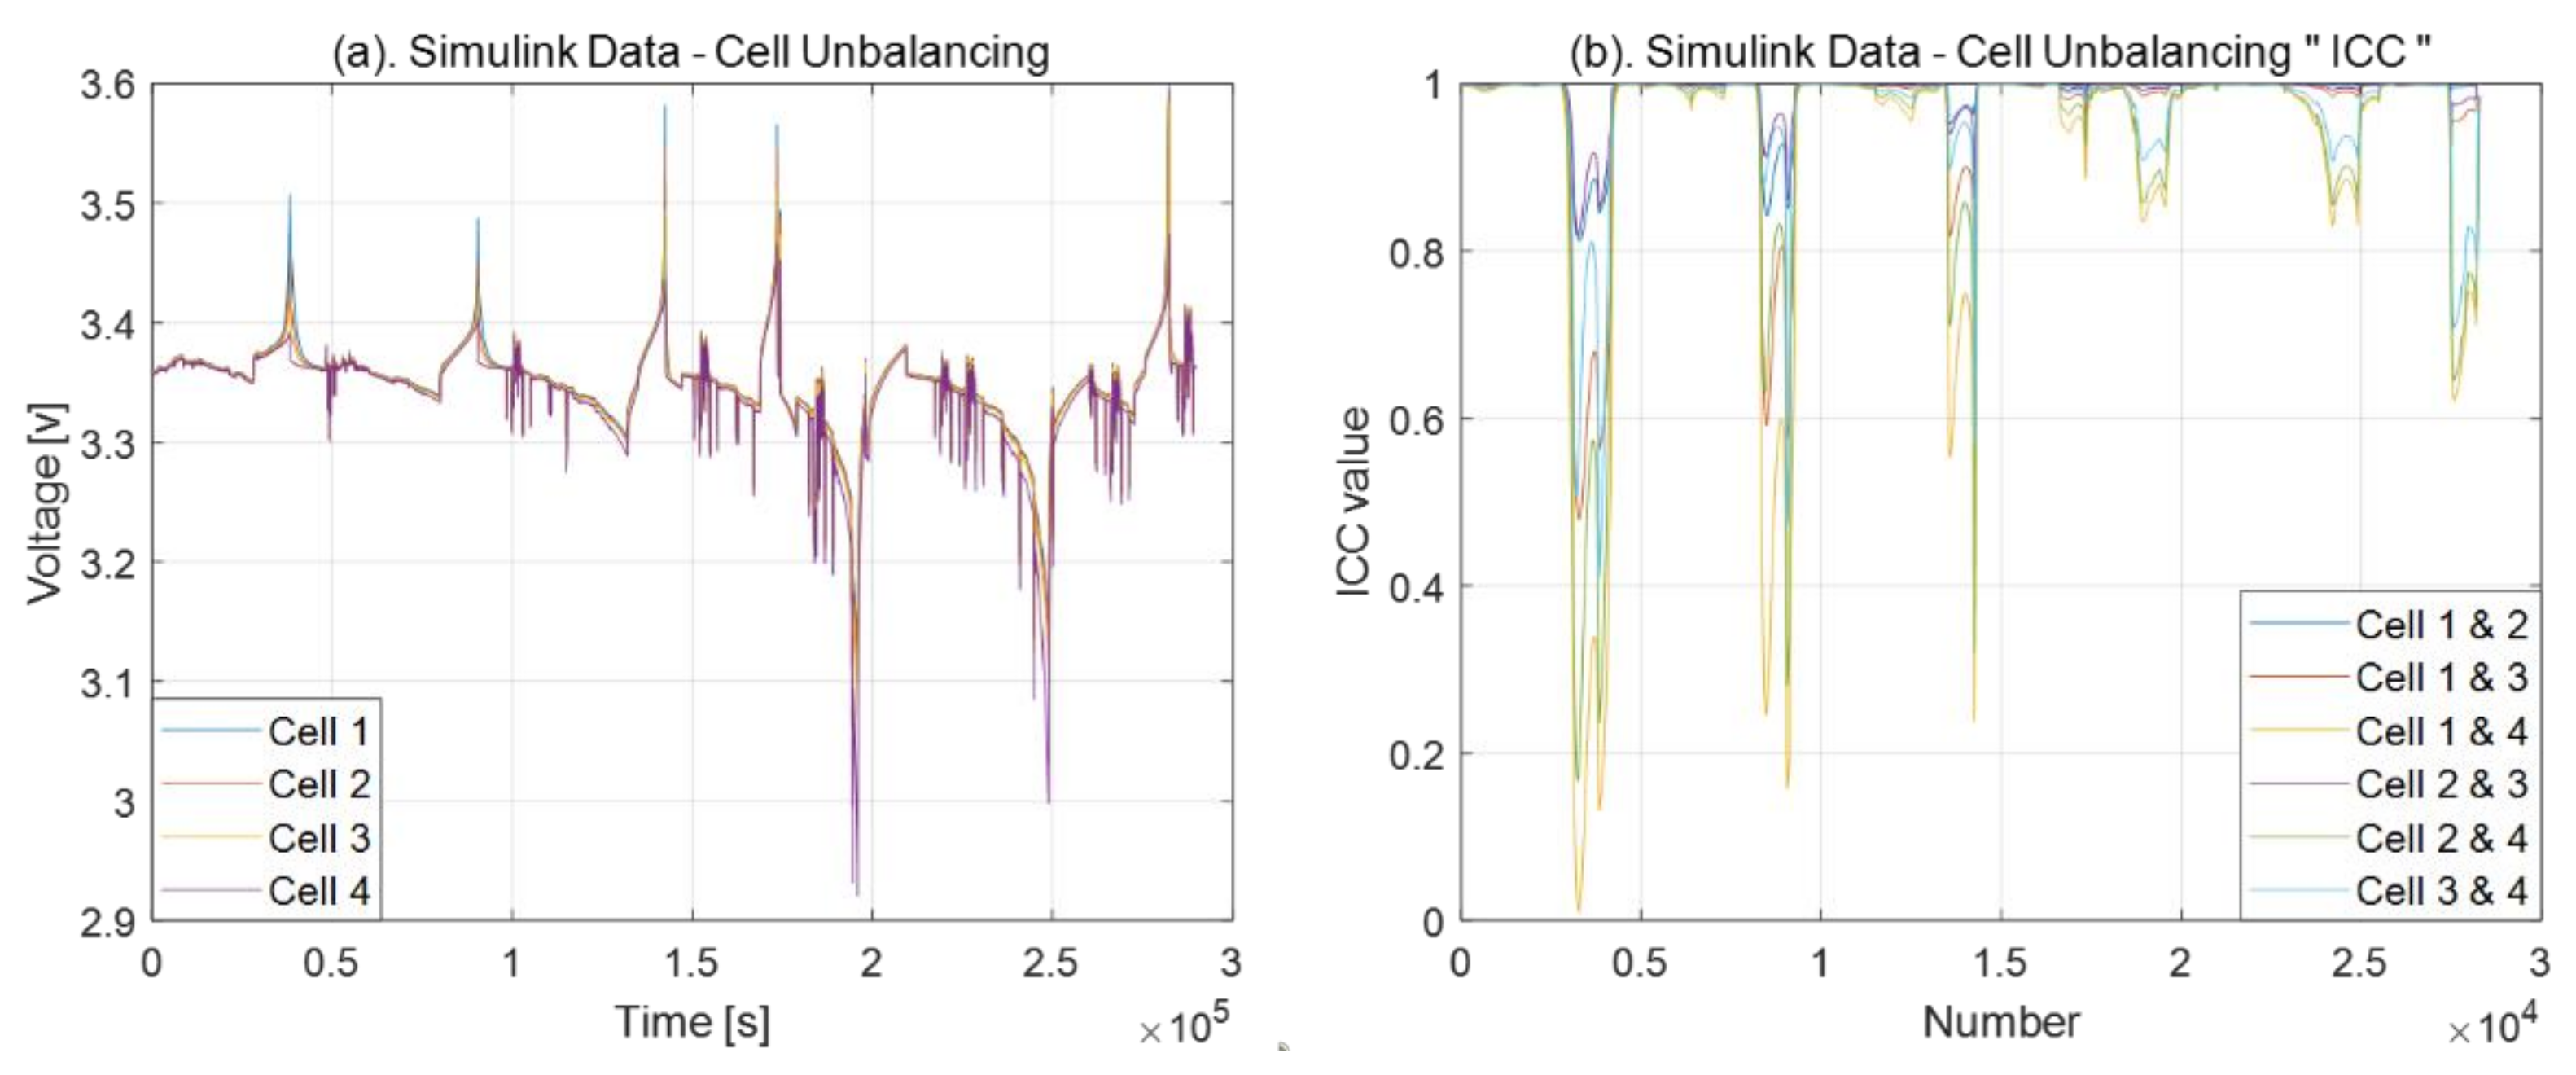
3.2. Cell Balancing Problem

As shown in Figure 8, the capacities of all cells were the same as 280 (Ah), and the initial SOC was designated as Cell 1 = 100%, Cell 2 = 99%, Cell 3 = 98%, and Cell 4 = 95% and then cycled. A curve changes fast in a full charge and full discharge section, thus it seemed that it would be possible to verify the difference by the initial SOC more easily. A variety of sections were created close to full charge and full discharge. When the generated voltage data was put into the ICC, it was found that the ICC value between SOC 100% and SOC 95% fell below 0.5 from the data near the full charging region. This result means less similarity.
Next, to distinguish it from the resistance problem, Figure 10a shows the voltage when the cells are unbalancing in the battery pack, and b shows the voltage in ICC. In Figure 10a, it can be seen that cell 1 reaches the charge cut-off voltage and cell 4 reaches the discharge cut-off. A cell that reaches the cut-off voltage according to the order of the suggested flow chart is used. If each cell inside the battery pack has a different SOC, the high SOC cell has a higher voltage, and the low SOC cell has a lower voltage.
Figure 11 data is filtered, and the order of the voltage is determined. When the filtered voltage data are listed according to the voltage level, it may be seen that the filtered voltage data are arranged in order from the high initial SOC, which shows a result similar to the resistance problem. To distinguish it from the resistance problem, identify the cells that reach the cut-off voltage in the order of the suggested flow chart.
The SOC 100% of a battery pack in which individual cells are connected in a series is based on a cell that has reached the cutoff voltage first in a fully charged state. Conversely, SOC 0% is determined by the cell’s voltage arriving at the full discharge cut-off voltage. If the SOC of cells is different, a cell that reaches cut-off voltage in a charged state is not the same as a cell that reaches the cut-off voltage in a discharged state, thus it could be determined whether it is a resistance problem or a cell balancing problem.
The charging cut-off voltage of the LFP battery is 3.6 (v). It means that 3.5 (v) is near full charge, and cell 1 is the highest. In addition, cell 4 voltage is the lowest in Figure 11 that can be seen as a cell-balancing problem, not a resistance problem, since different cells reach each cut-off voltage.
This paper obtains a curve point using the rest period after fully charging to check the degree of unbalancing when the cell balancing problem is identified. Suppose the curve point algorithm is used to determine the degree of problem with cell balancing. In that case, the criteria for determining the result may vary depending on the field of battery use and environmental conditions. To assess the degree of cell balancing by applying the “curve point” algorithm based on the data of the caravan battery to Simulink, the Simscape battery pack was implemented by setting the capacity, type, and resistance of the battery used in the caravan as similar as possible.
Curve points are obtained from the rest period after a charge. The degree of cell balancing is determined based on the cell with the highest SOC. Previously, the ICC value derived between Cell 1 and Cell 4 had a value of less than 0.5. For this reason, the problem was thought to be suspected. Figure 12 shows the voltage with rest after a full charge of each cell, along with the curve points. The curve point of Cell 1 is about 679 s, Cell 2 is 646 s, Cell 3 is 631 s, and Cell 4 is 628 s. However, the curve point from Cell 4 was about 51 s apart from Cell 1′ which made it possible to analyze that cell balancing can be attempted and then returned to normal through calibrations. It can be seen that the ICC values of Cell 2 and Cell 3 are not significantly different from the ICC values of Cell 1, and the results of the curve point also show that there was no significant problem.

4. Validation with Real Data

4.1. Description of Battery Pack Used and Data Collection Procedure

The battery pack used herein consisted of 280 (Ah) cells connected in the two parallel 4 series (2P4S) configuration. In addition, the battery pack was equipped with a sensor that could measure the voltage, current, and temperature. The sensor was connected to the BMS, and the battery pack was installed in a caravan for use. Data were transferred between computers and the BMS through CAN interfaces. The research variables were four voltages (Cell 1, Cell 2, Cell 3, and Cell 4) and two currents measured at each parallel connection point. Among the four cells, Cell 1 and Cell 4 were connected to the BMS, thus their resistance was significantly higher than those of the other two cells. The voltage, current, and temperature data from the BMS were collected at 1-s intervals and uploaded to cloud storage. Herein, we focused on analyzing the voltage and current data. The data gathering process is illustrated in Figure 13.

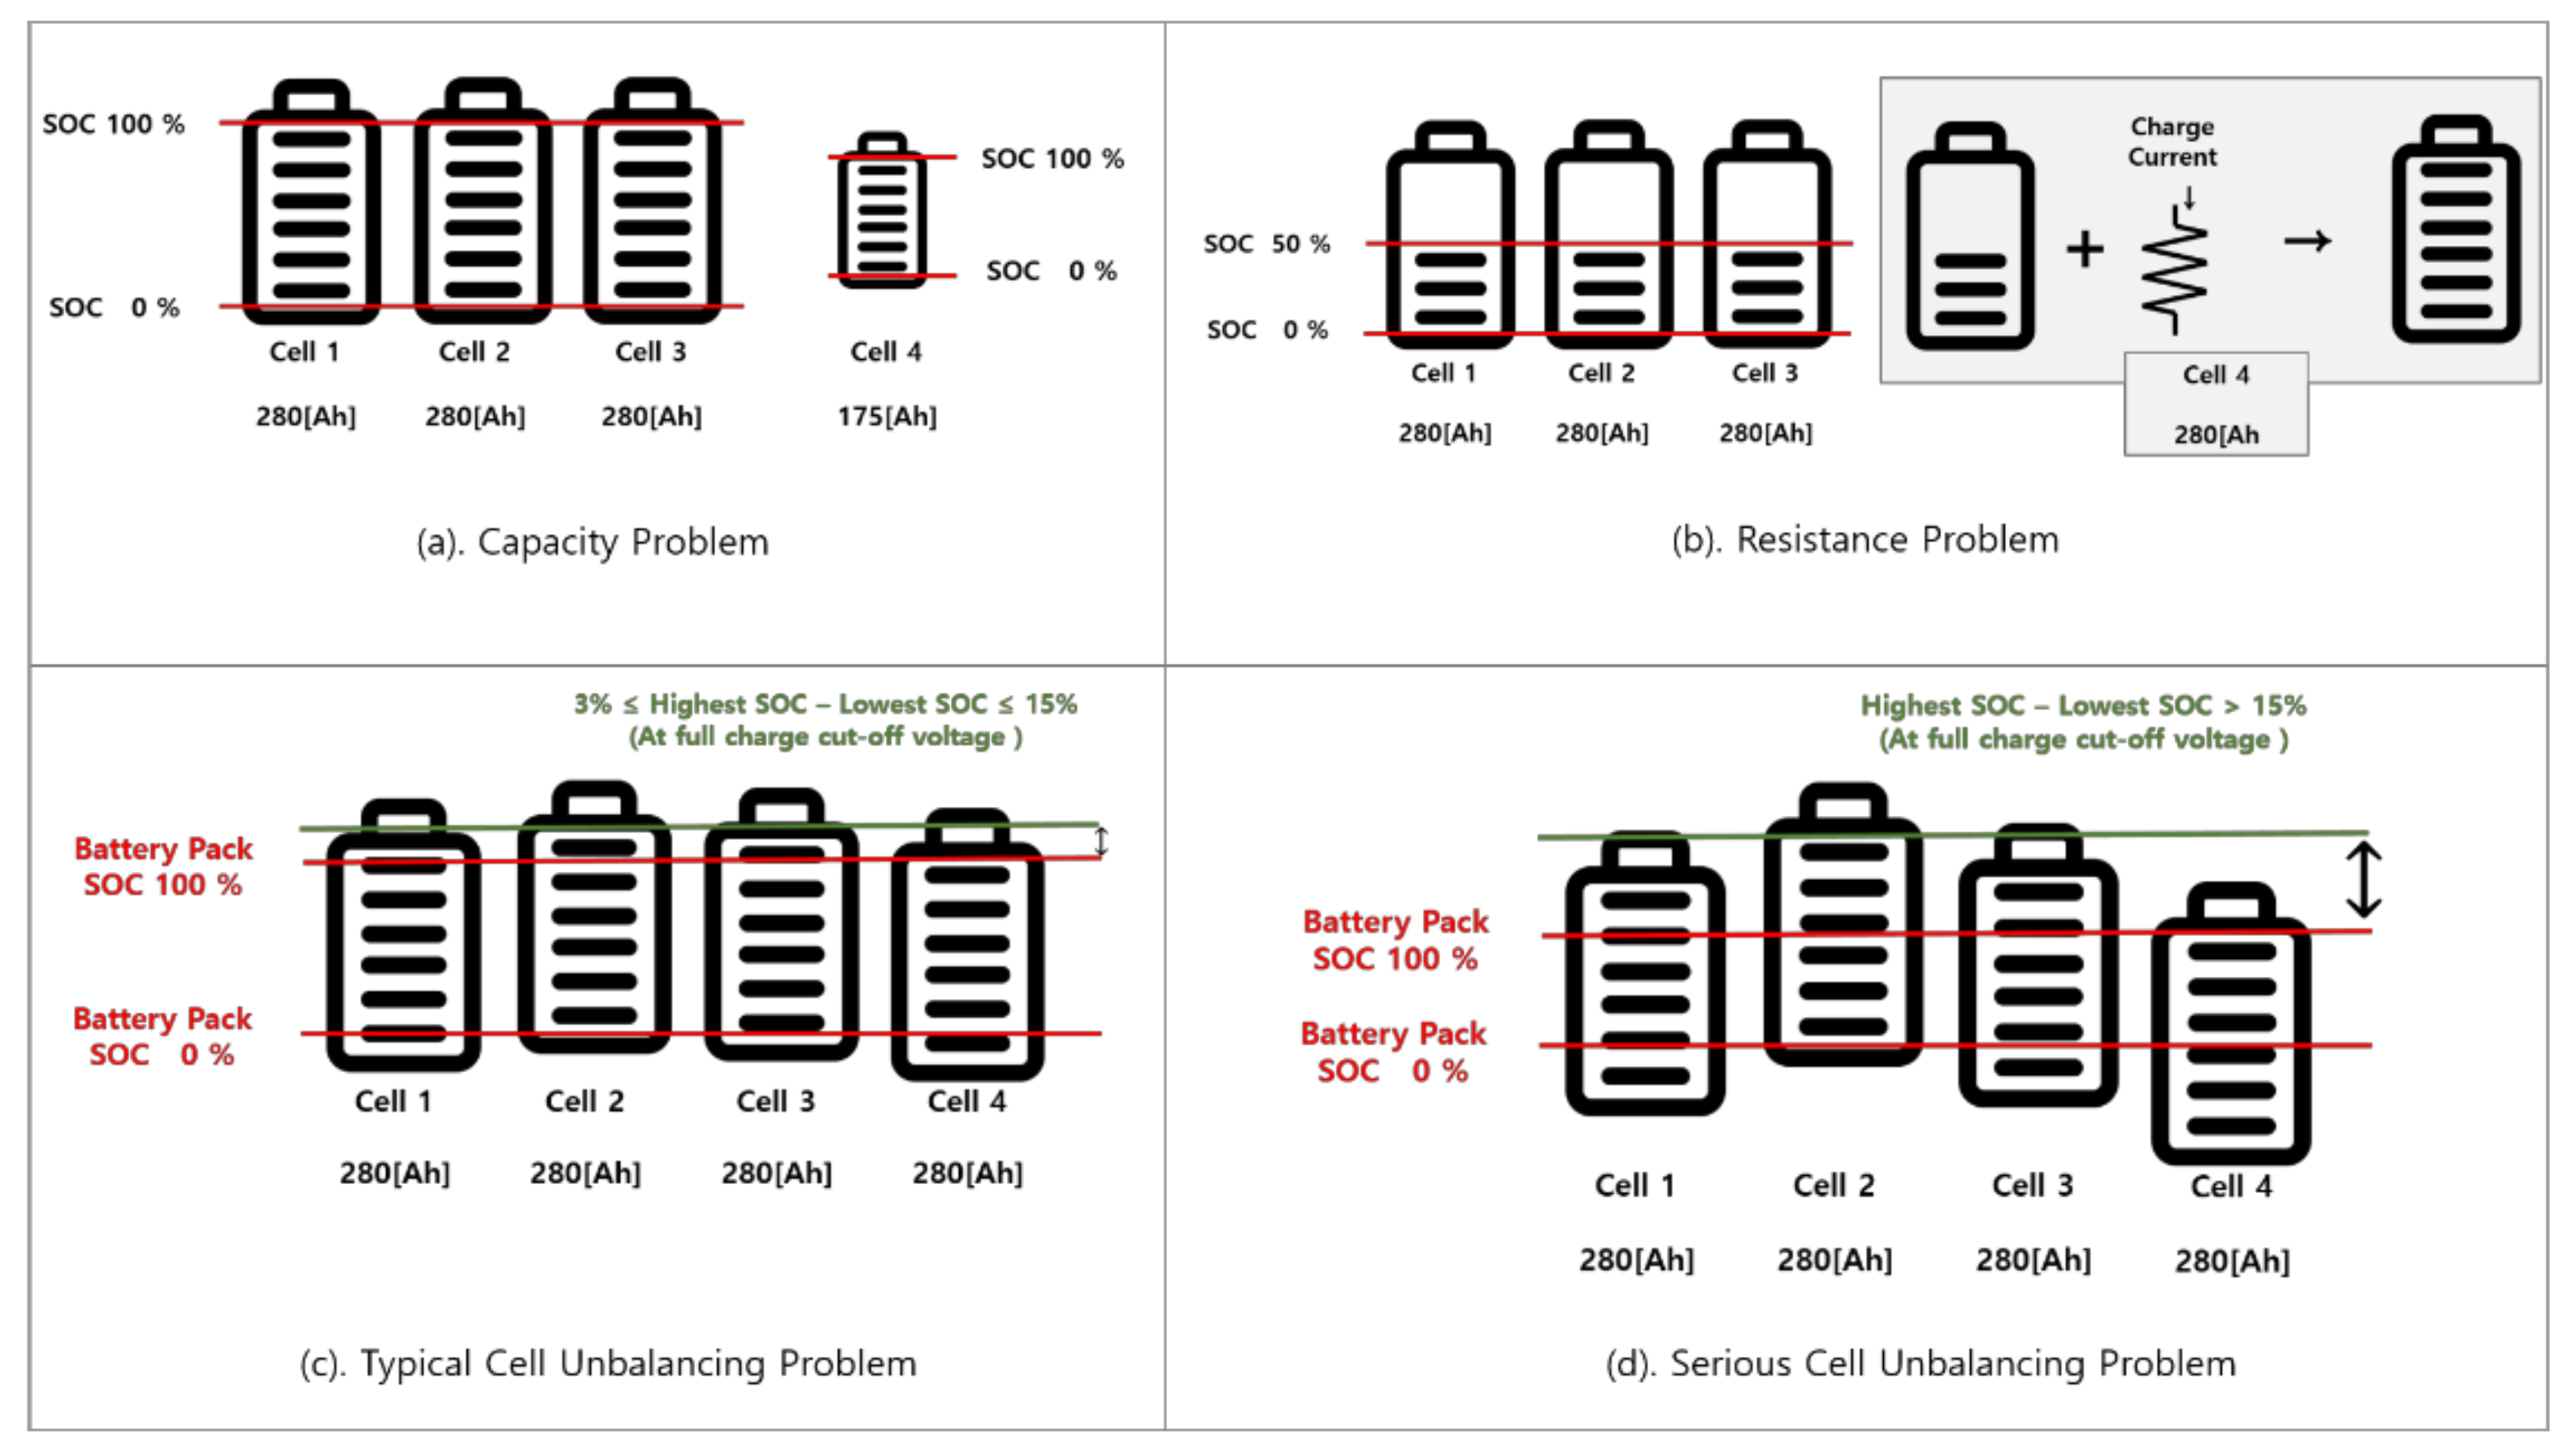
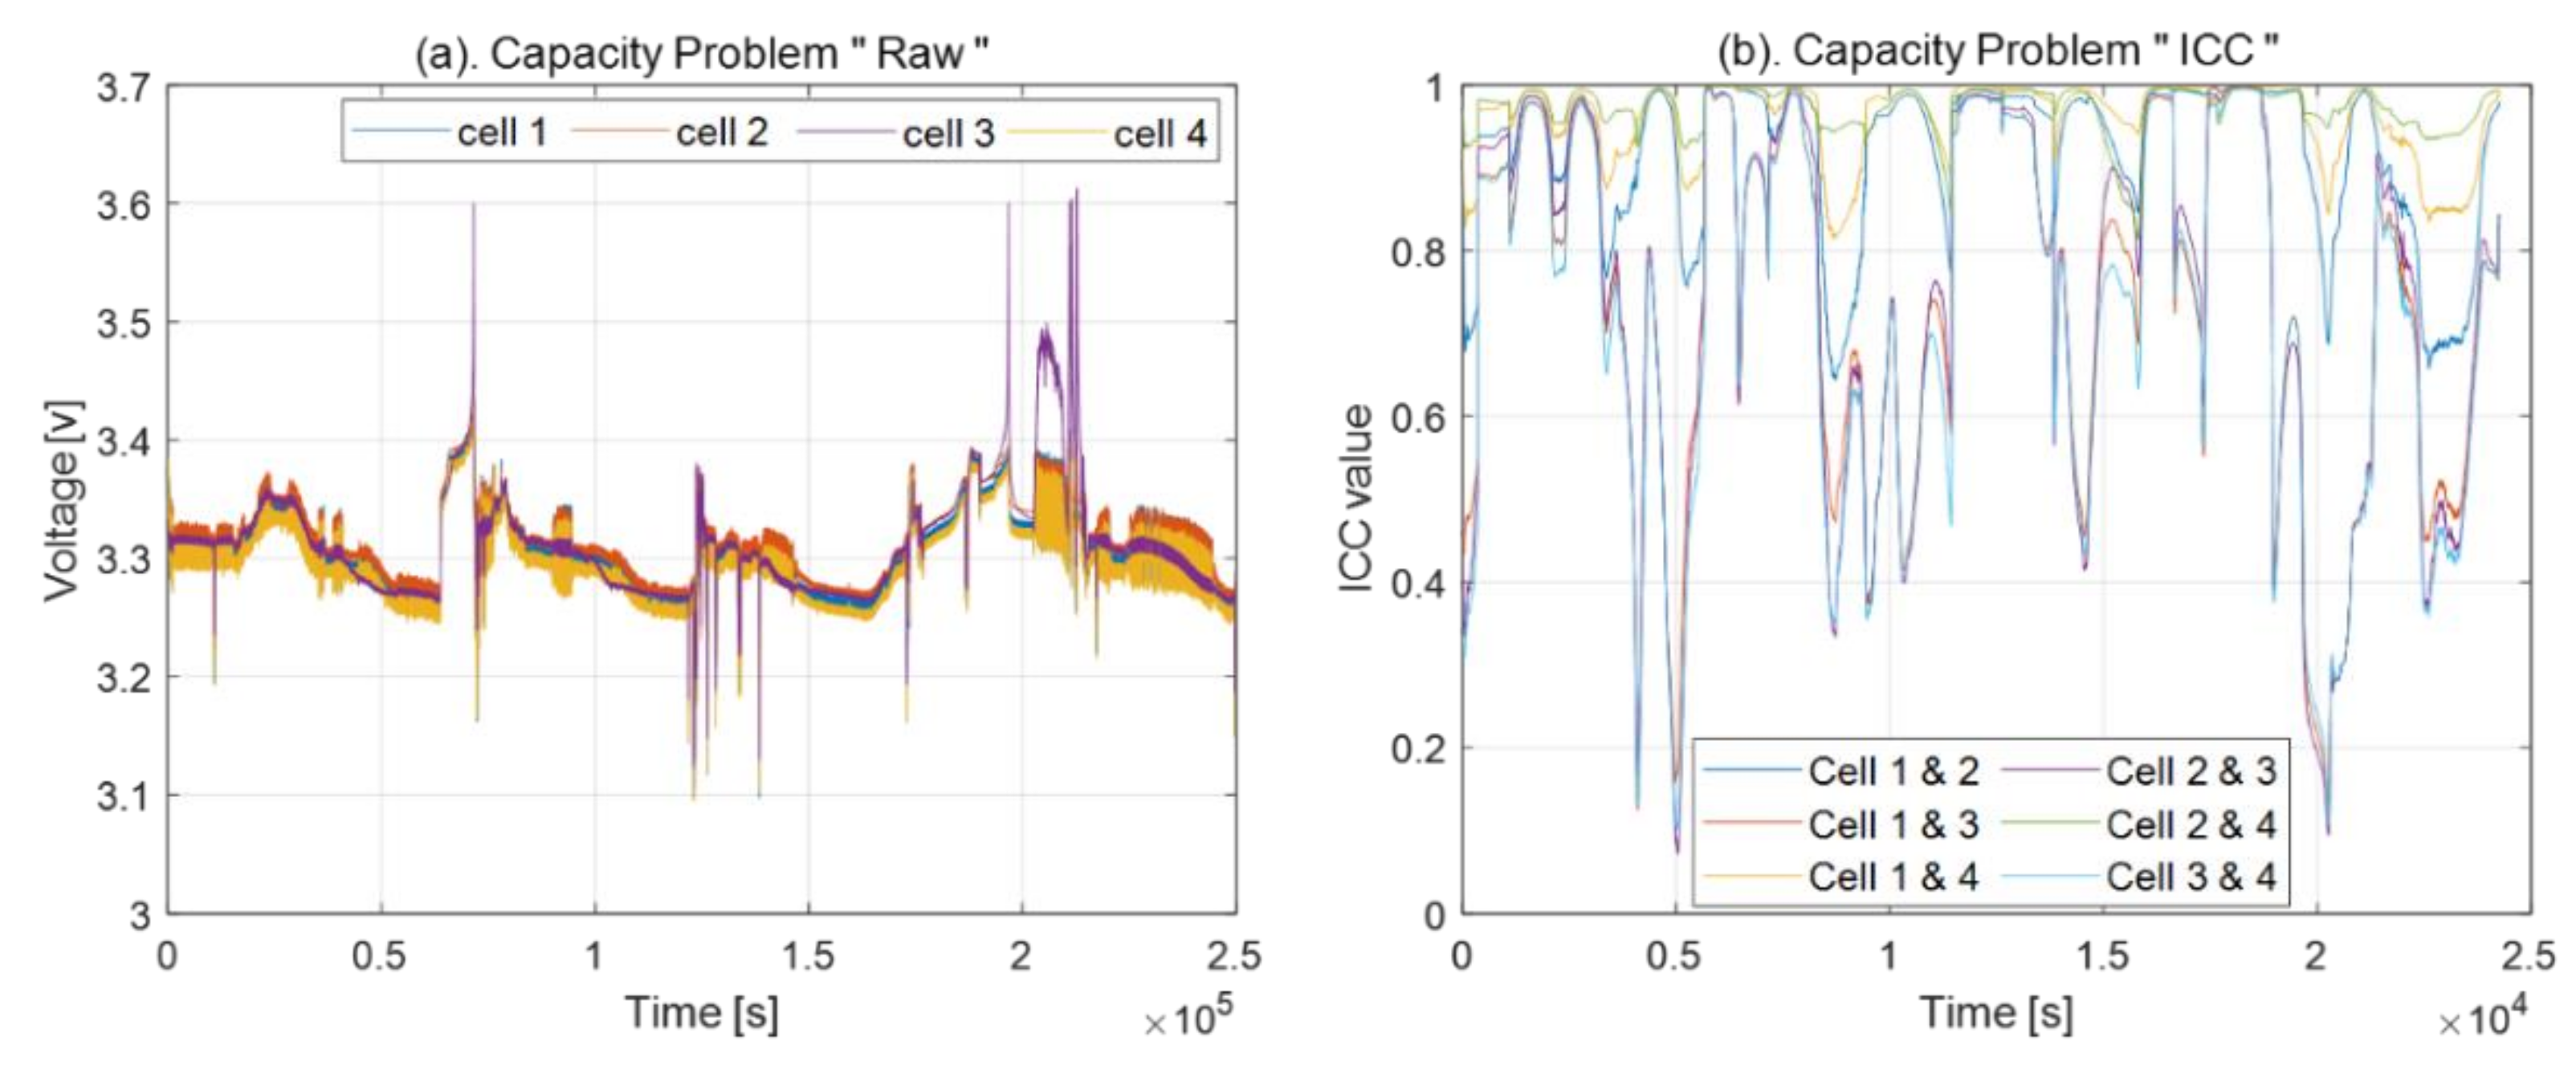
4.2. Capacity Problem

The battery capacity depends on the number of active lithium ions available inside the battery. If the lithium-ion concentration is higher, the battery capacity is higher. As the battery continues to be used, an irreversible reaction occurs between the lithium ions provided by the positive electrode and the negative electrode, which changes the chemical state of the battery and prevents it from returning to its original condition, thus acting as a resistance and reducing the number of active lithium ions available. Thus, the battery capacity decreases.
As each battery ages, typically, its capacity decreases. A battery must be replaced once its state of health (SOH) reaches 80%. Generally, SOH 80% represents the end of life (EOL). However, batteries are strongly affected by external conditions. Therefore, battery packs usually have different aging rates. In battery packs with varying aging rates, only one cell has a smaller capacity than the other cells during continuous use. At this point, if the capacity is noticeably low, the amount of lithium ions in the battery is small. Therefore, the cut-off voltage is reached before the other cells during charging or discharging. If this situation continues, the SOC gap widens, leading to cell unbalance, which worsens with time. Finally, it becomes a defect.
The voltage data of the battery pack considered herein are shown in Figure 14. In the caravan battery, cell 3 had a capacity of roughly 170 (Ah), while the other cells had capacities of approximately 275 (Ah), meaning that a difference of approximately 1.6 times existed. The current of the capacity problem data is shown in Figure 8a, and cell 3 shows a different voltage form from the other cells in the charging section, as well as the discharging section of the voltage data.
The purpose of importing raw data into an ICC model is to check for problems. The use of ICC is one approach to finding correlations. ICC values smaller than 0.5 indicate a weak correlation. As shown in Figure 14b, a weak correlation is often observed.
Additionally, lines are found below 0.5 in the case of cell 3, which indicates that this cell is suspicious. Nevertheless, because the ICC value does not guarantee the existence of an abnormality in a particular cell, the order of cell voltages in the flowchart is used to analyze the abnormal cells and the underlying causes. To this end, we used a moving average filter instead of a smoothing spline to eliminate noise.
As a continuous discharge current flows through a battery cell with a significantly lower capacity in the battery pack, the cell with the least capacity reaches a lower voltage more quickly than the other cells owing to the difference in the amount of internal active material. A battery cell with a low capacity arrives at the steady state first because of the relatively lower amount of internal activation material than that in normal cells. During discharge, the steady state is at a subordinate position. Thus, the cell with the capacity problem reaches the steady state first and has the lowest voltage among the other cells. Once the other cells reach the steady state, their voltage decreases and returns to the order of voltages before they reach the steady state. Therefore, the sequence of voltages can be used to check for capacity problems.
Figure 15a shows the discharge section after filtering all of the voltages in Figure 14a, which is extremely useful, because a considerable amount of noise is removed through filtering. Figure 15b shows the cells, in Figure 15a in the order of high voltage during discharge. After charging, when discharging commences, cell 3 drops to the lowest position after some time. If the discharge current flows continuously, the sequence of cells returns to its original position, which is a characteristic of the capacity problem, as described above.

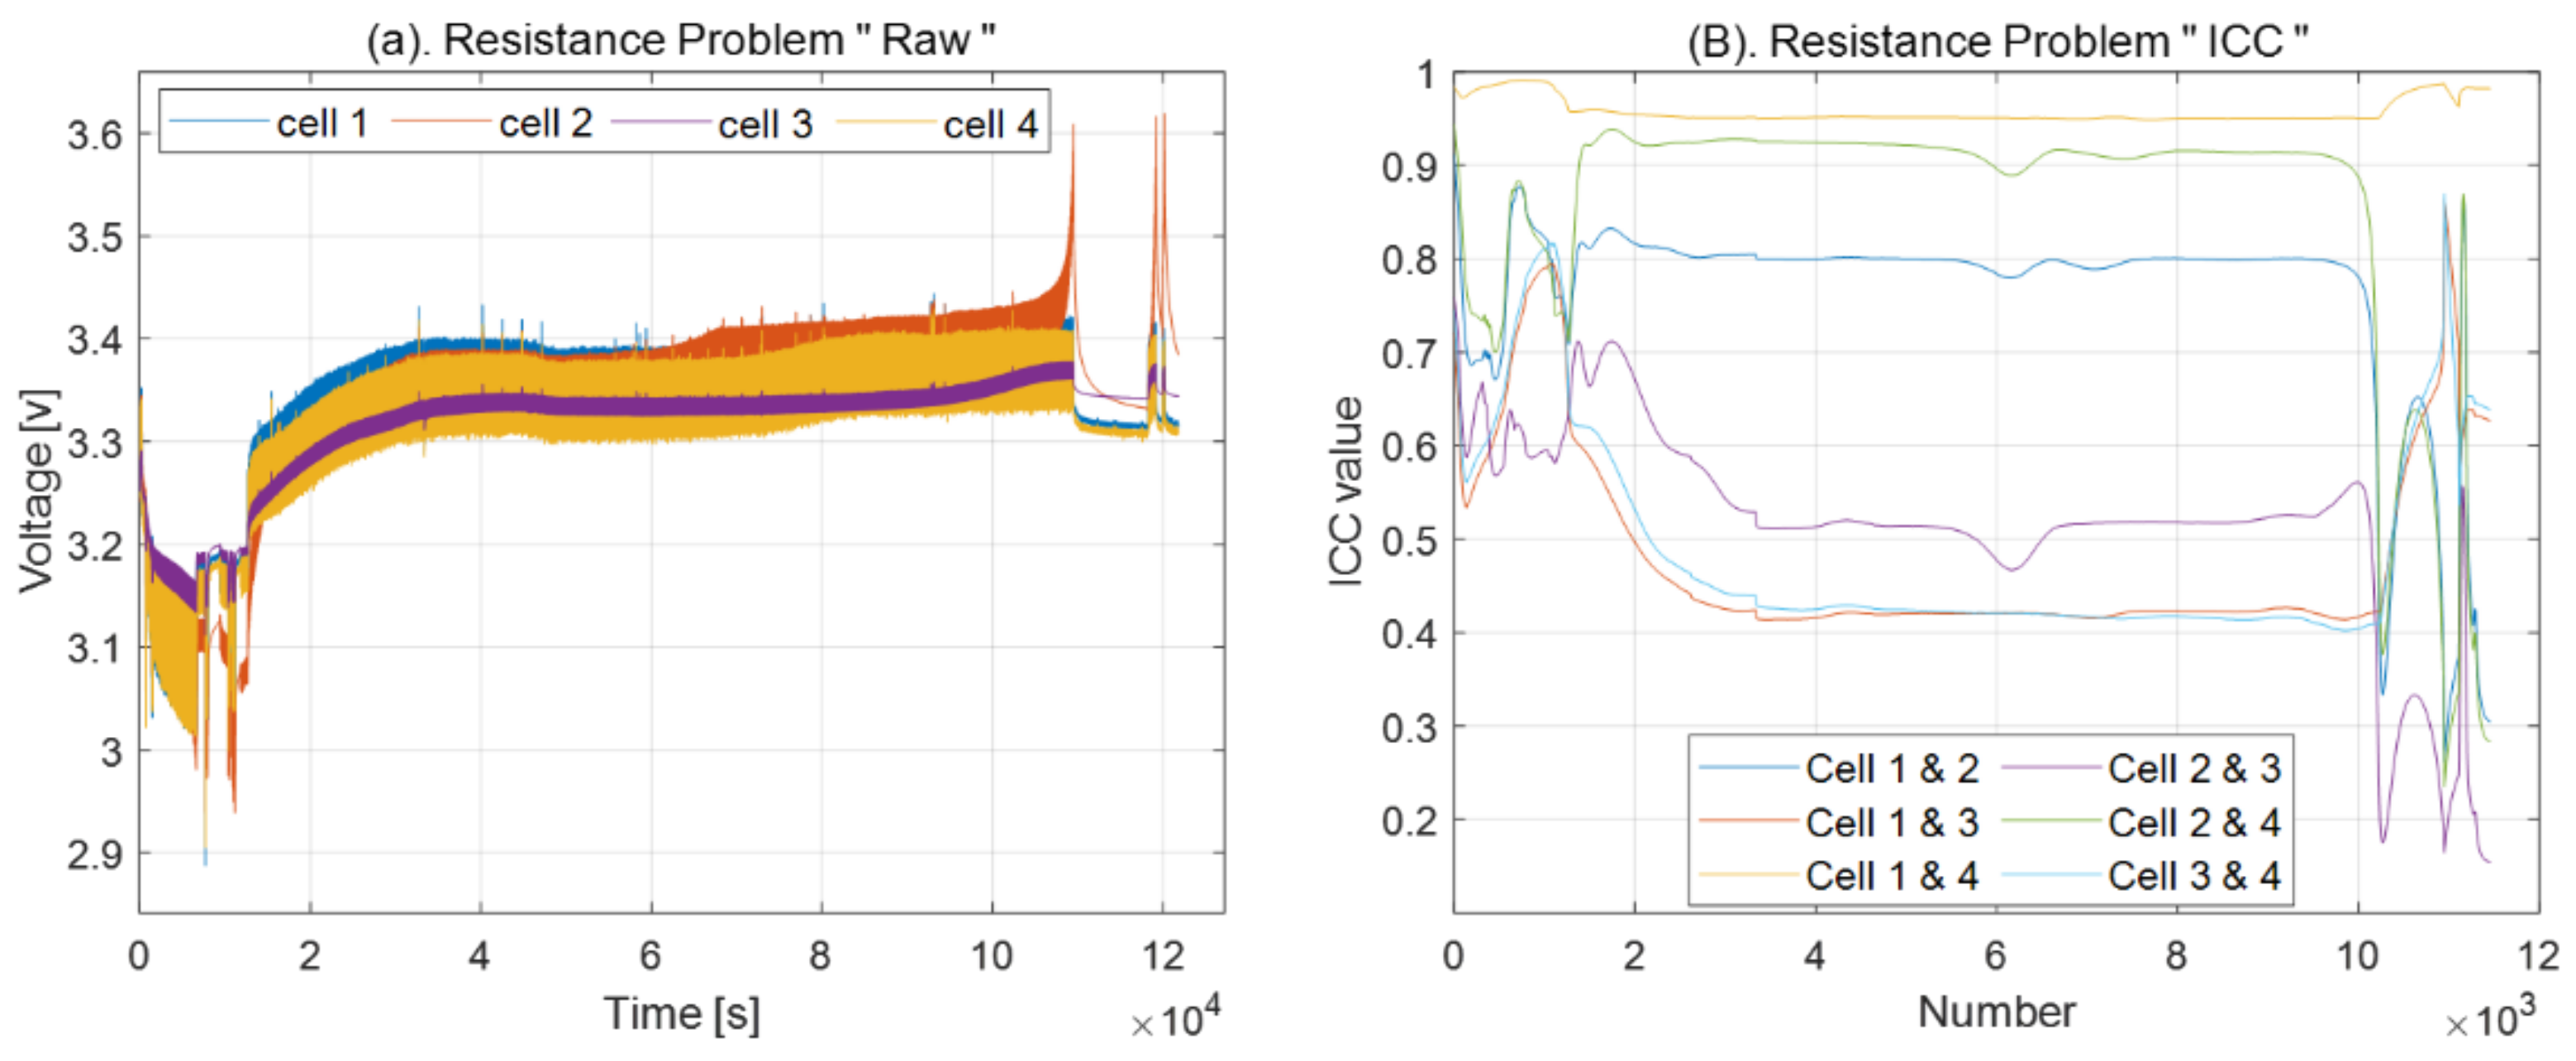
4.3. Resistance Problem

As described in Section 4.1, cell 1 or 4 has the highest resistance in the absence of defects. According to Ohm’s law, if all cells are charged or discharged with the same current, one of the two cells must reach the cut-off voltage. However, in Figure 16a, cell 2 has reached the cut-off voltage, pointing to a possible problem. In fact, while disassembling this pack, the busbar screws of cell 2 were looser than those of the other cells.
According to Figure 16b, the ICC value of the resistance data is less than 0.5 throughout the continuous discharge period, and the relationship between almost all of the data is poor when the battery is fully charged. Since cells 1 and 4 supply BMS power, their resistances are higher than those of the other cells, and for this reason, the ICC values of these two cells are extremely high. By contrast, cell 3 showed a poor correlation with all the cells. If the resistances of cells 2 and 3 were similar, we can expect that the relationship between each of the cells would be strong. By contrast, cell 2 showed a stronger connection between cell 1 and cell 4, meaning that the voltage validations of cells 2, 1, and 4 were similar, which is additional evidence for a scenario in which cell 2 is suspected to have significant resistance.
Based on these data, the ICC low value is not necessarily an indicator of a defective cell. Hence, by using the cause analysis algorithm, problematic cells and the cause of the problems can be identified.
According to Figure 17, once the voltage has been filtered, the trace of cell 2 reaching the full discharge cut-off voltage remains at first; then, it grows slowly as the charging current flows. When a steady charging current flows, the voltage of cell 2 increases gradually until it peaks and remains there. In this case, cell 3 is at the lowest position owing to low resistance. In the data of approximately 50,000 s, the voltages of cell 3 and cell 4 change for a while because of changes in the charging current, but the difference is more significant in the case of cell 4 because of its higher resistance.
Thus, cell 3 can be considered a potentially suspicious cell in the ICC model, but the ICC is only a technique to determine the correlation. When abnormal cell detection is performed based on the order of cell voltages, cell 2 reaches the cutoff voltage by itself, and its voltage is high when the charging current is continuous. In raw data and filtered data, it can be judged that there is a resistance problem by seeing that both cell 2 reach the charge and discharge cut-off voltage. Thus, it can be concluded that cell 3 is not problematic, and cell 2 has a resistance problem. Hence, based on the order of the cell voltages and the cells reaching the cut-off voltage, it was identified that cell 2 has a resistance problem.

5. Conclusions

Herein, we proposed a model to identify the failures of caravan battery packs by using ICC and the order of cell voltages. The order of cell voltages can be used to reliably identify battery faults. To analyze the cause of failure, we used actual battery terminal voltages rather than modeled data. Additionally, the proposed model can be trained using real-world vehicle data, which would enable it to accurately identify battery issues in vehicles with similar features. To monitor battery abnormalities, we designed a new framework for diagnosing problems with battery packs. In this manner, we focused on diagnosing abnormalities and analyzing their causes based on the data gathered from capacity and resistance problems. Based on the experimental and theoretical results, the proposed method was found to be suitable for fault detection and anomaly resolution. In the future, we aim to apply the proposed method to data obtained from complex problems and conduct more extensive research. Furthermore, we intend to analyze the causes of battery failure by further subdividing the causes into external and internal problems.

Author Contributions

Conceptualization, J.Y. and S.H.; methodology, J.Y.; software, J.Y.; validation, J.Y., J.J.; formal analysis, J.Y., J.J.; Investigation, J.Y., J.J. and S.G.; resources, J.Y.; data curation, J.Y., J.J. and S.G.; writing—original draft preparation, J.Y., S.G.; writing—review and editing, J.Y., S.G.; visualization, J.Y.; supervision, S.H.; Project administration, S.H.; Funding acquisition, S.H. All authors have read and agreed to the published version of the manuscript.

Funding

This work was supported in part by the Korea Institute of Energy Technology Evaluation and Planning (KETEP) and in part by the Ministry of Trade, Industry & Energy (MOTIE) of the Republic of Korea under grant 20191210301990.

Institutional Review Board Statement

Not applicable.

Informed Consent Statement

Not applicable.

Data Availability Statement

Not applicable.

Conflicts of Interest

The authors declare no conflict of interest.

References

  1. Liu, Y.; Li, J.; Chen, Z.; Qin, D.; Zhang, Y. Research on a multi-objective hierarchical prediction energy management strategy for range extended fuel cell vehicles. J. Power Sources 2019, 429, 55–66. [Google Scholar] [CrossRef]
  2. Hannan, M.; Hoque, M.; Mohamed, A.; Ayob, A. Review of energy storage systems for electric vehicle applications: Issues and challenges. Renew. Sustain. Energy Rev. 2016, 69, 771–789. [Google Scholar] [CrossRef]
  3. Du, J.; Ouyang, D. Progress of Chinese electric vehicles industrialization in 2015: A review. Appl. Energy 2017, 188, 529–546. [Google Scholar] [CrossRef]
  4. Zou, C.; Manzie, C.; Nesic, D. A Framework for Simplification of PDE-Based Lithium-Ion Battery Models. IEEE Trans. Control Syst. Technol. 2015, 24, 1594–1609. [Google Scholar] [CrossRef]
  5. Chen, Z.; Li, X.; Shen, J.; Yan, W.; Xiao, R. A Novel State of Charge Estimation Algorithm for Lithium-Ion Battery Packs of Electric Vehicles. Energies 2016, 9, 710. [Google Scholar] [CrossRef]
  6. Dubarry, M.; Vuillaume, N.; Liaw, B.Y. From single cell model to battery pack simulation for Li-ion batteries. J. Power Sources 2009, 186, 500–507. [Google Scholar] [CrossRef]
  7. Hu, X.; Zhang, K.; Liu, K.; Lin, X.; Dey, S.; Onori, S. Advanced Fault Diagnosis for Lithium-Ion Battery Systems: A Review of Fault Mechanisms, Fault Features, and Diagnosis Procedures. IEEE Ind. Electron. Mag. 2020, 14, 65–91. [Google Scholar] [CrossRef]
  8. Tran, M.-K.; Fowler, M. A Review of Lithium-Ion Battery Fault Diagnostic Algorithms: Current Progress and Future Challenges. Algorithms 2020, 13, 62. [Google Scholar] [CrossRef] [Green Version]
  9. Lu, L.; Han, X.; Li, J.; Hua, J.; Ouyang, M. A review on the key issues for lithium-ion battery management in electric vehicles. J. Power Sources 2013, 226, 272–288. [Google Scholar] [CrossRef]
  10. Wei, Z.; Zou, C.; Leng, F.; Soong, B.H.; Tseng, K.-J. Online Model Identification and State-of-Charge Estimate for Lithium-Ion Battery with a Recursive Total Least Squares-Based Observer. IEEE Trans. Ind. Electron. 2017, 65, 1336–1346. [Google Scholar] [CrossRef]
  11. Wang, Y.; Zhang, C.; Chen, Z.; Xie, J.; Zhang, X. A novel active equalization method for lithium-ion batteries in electric vehicles. Appl. Energy 2015, 145, 36–42. [Google Scholar] [CrossRef]
  12. Wei, J.; Dong, G.; Chen, Z.; Kang, Y. System state estimation and optimal energy control framework for multicell lithium-ion battery system. Appl. Energy 2017, 187, 37–49. [Google Scholar] [CrossRef]
  13. Wang, Y.; Chen, Z.; Zhang, C. On-line remaining energy prediction: A case study in embedded battery management system. Appl. Energy 2017, 194, 688–695. [Google Scholar] [CrossRef]
  14. Wang, H.; Kumar, A.; Simunovic, S.; Allu, S.; Kalnaus, S.; Turner, J.A.; Helmers, J.C.; Rules, E.T.; Winchester, C.S.; Gorney, P. Progressive mechanical indentation of large-format Li-ion cells. J. Power Sources 2017, 341, 156–164. [Google Scholar] [CrossRef] [Green Version]
  15. Abada, S.; Marlair, G.; Lecocq, A.; Petit, M.; Sauvant-Moynot, V.; Huet, F. Safety focused modeling of lithium-ion batteries: A review. J. Power Sources 2016, 306, 178–192. [Google Scholar] [CrossRef]
  16. Meethong, N.; Huang, H.-Y.S.; Speakman, S.A.; Carter, W.C.; Chiang, Y.-M. Strain Accommodation during Phase Transformations in Olivine-Based Cathodes as a Materials Selection Criterion for High-Power Rechargeable Batteries. Adv. Funct. Mater. 2007, 17, 1115–1123. [Google Scholar] [CrossRef]
  17. Maleki, H.; Howard, J.N. Effects of overdischarge on performance and thermal stability of a Li-ion cell. J. Power Sources 2006, 160, 1395–1402. [Google Scholar] [CrossRef]
  18. Chen, M.; Bai, F.; Song, W.; Lv, J.; Lin, S.; Feng, Z.; Ding, Y. A multilayer electro-thermal model of pouch battery during normal dis-charge and internal short circuit process. Appl. Therm. Eng. 2017, 120, 506–516. [Google Scholar] [CrossRef] [Green Version]
  19. Xia, B.; Shang, Y.; Nguyen, T.; Mi, C. A correlation based fault detection method for short circuits in battery packs. J. Power Sources 2017, 337, 1–10. [Google Scholar] [CrossRef] [Green Version]
  20. Li, Z.; Huang, J.; Liaw, B.Y.; Zhang, J. On state-of-charge determination for lithium-ion batteries. J. Power Sources 2017, 348, 281–301. [Google Scholar] [CrossRef] [Green Version]
  21. Peng, P.; Jiang, F. Thermal safety of lithium-ion batteries with various cathode materials: A numerical study. Int. J. Heat Mass Transf. 2016, 103, 1008–1016. [Google Scholar] [CrossRef]
  22. Feng, X.; Weng, C.; Ouyang, M.; Sun, J. Online internal short circuit detection for a large format lithium ion battery. Appl. Energy 2016, 161, 168–180. [Google Scholar] [CrossRef] [Green Version]
  23. Seo, M.; Goh, T.; Park, M.; Koo, G.; Kim, S.W. Detection of Internal Short Circuit in Lithium Ion Battery Using Model-Based Switching Model Method. Energies 2017, 10, 76. [Google Scholar] [CrossRef]
  24. Marcicki, J.; Onori, S.; Rizzoni, G. Nonlinear fault detection and isolation for a lithium-ion battery management system. In Proceedings of the ASME 2010 Dynamic Systems and Control Conference, Cambridge, MA, USA, 12–15 September 2010; Volume 1, pp. 607–614. [Google Scholar]
  25. Xu, J.; Wang, J.; Li, S.; Cao, B. A Method to Simultaneously Detect the Current Sensor Fault and Estimate the State of Energy for Batteries in Electric Vehicles. Sensors 2016, 16, 1328. [Google Scholar] [CrossRef] [Green Version]
  26. Dey, S.; Mohon, S.; Pisu, P.; Ayalew, B. Sensor fault detection, isolation, and estimation in lithium-ion batteries. IEEE Trans. Control. Syst. Technol. 2016, 24, 2141–2149. [Google Scholar] [CrossRef]
  27. Tran, M.-K.; Fowler, M. Sensor Fault Detection and Isolation for Degrading Lithium-Ion Batteries in Electric Vehicles Using Parameter Estimation with Recursive Least Squares. Batteries 2019, 6, 1. [Google Scholar] [CrossRef] [Green Version]
  28. Hong, J.; Wang, Z.; Liu, P. Big-Data-Based Thermal Runaway Prognosis of Battery Systems for Electric Vehicles. Energies 2017, 10, 919. [Google Scholar] [CrossRef] [Green Version]
  29. Xia, B. External short circuit fault diagnosis for lithium-ion batteries. In Proceedings of the 2014 IEEE Transportation Electrification Conference and Expo (ITEC), Dearborn, MI, USA, 15–18 June 2014; pp. 1–7. [Google Scholar]
  30. Kang, Y.; Duan, B.; Zhou, Z.; Shang, Y.; Zhang, C. A multi-fault diagnostic method based on an interleaved voltage measurement topology for series connected battery packs. J. Power Sources 2019, 417, 132–144. [Google Scholar] [CrossRef]
  31. Koo, T.K.; Li, M.Y. A Guideline of Selecting and Reporting Intraclass Correlation Coefficients for Reliability Research. J. Chiropr. Med. 2016, 15, 155–163. [Google Scholar] [CrossRef] [Green Version]
  32. Gonçalves, D.N.S.; Gonçalves, C.D.M.; de Assis, T.F.; da Silva, M.A. Analysis of the Difference between the Euclidean Distance and the Actual Road Distance in Brazil. Transp. Res. Procedia 2014, 3, 876–885. [Google Scholar] [CrossRef] [Green Version]
  33. Baronti, F.; Fantechi, G.; Leonardi, E.; Roncella, R.; Saletti, R. Hierarchical platform for monitoring, managing and charge balancing of LiPo batteries. In Proceedings of the 2011 IEEE Vehicle Power and Propulsion Conference, Chicago, IL, USA, 6–9 September 2011; pp. 1–6. [Google Scholar]
  34. Imtiaz, A.M.; Khan, F.H. “Time Shared Flyback Converter” Based Regenerative Cell Balancing Technique for Series Connected Li-Ion Battery Strings. IEEE Trans. Power Electron. 2013, 28, 5960–5975. [Google Scholar] [CrossRef]
Figure 1. Determining the curve point based on Euclidean distance; (a). Smoothing data, (b) How to find curve point, (c). Distance to line, and (d). Curve point in the raw data.
Energies 15 01647 g001
Figure 2. Proposed flowchart for abnormality detection.
Energies 15 01647 g002
Figure 3. Types of causes of abnormalities ((a) capacity problem, (b) resistance problem, (c) typical cell balancing problem, and (d) serious cell balancing problem).
Energies 15 01647 g003
Figure 4. Cell balancing simulation (a) voltage (left) and (b) ICC value (right).
Energies 15 01647 g004
Figure 5. ICC value histogram.
Energies 15 01647 g005
Figure 6. Voltage and curve point during 3 h of rest after fully charging.
Energies 15 01647 g006
Figure 7. (a) Input current (left) and (b) output voltage (right).
Energies 15 01647 g007
Figure 8. Simulation of a caravan battery pack with a resistance problem.
Energies 15 01647 g008
Figure 9. Simulink data with the resistance problem ((a) ICC value, (b) filtering of voltage data, (c) cutting the discharge part in (b), and (d) order of cell voltages).
Energies 15 01647 g009
Figure 10. Simulink data with a cell balancing problem ((a) voltage and (b) ICC value).
Energies 15 01647 g010
Figure 11. Simulink data with cell balancing problem ((a) filtering the discharge part in cell balancing problem voltage data, and (b) an order of cell voltages).
Energies 15 01647 g011
Figure 12. Curve point with cell balancing problem.
Energies 15 01647 g012
Figure 13. Process of gathering data.
Energies 15 01647 g013
Figure 14. Capacity problem ((a) voltage and (b) ICC value).
Energies 15 01647 g014
Figure 15. Capacity problem ((a) filtering the discharge part in Figure 13 (left) and (b) order of cell voltages).
Energies 15 01647 g015
Figure 16. Resistance problem ((a) voltage and (b) ICC value).
Energies 15 01647 g016
Figure 17. Resistance problem ((a) filtering the charge part in Figure 15 (left), and (b) order of cell voltages).
Energies 15 01647 g017
Publisher’s Note: MDPI stays neutral with regard to jurisdictional claims in published maps and institutional affiliations.

