Abstract
The vertical curve is a major factor affecting vehicle exhaust (CO2, CO, NOx, PM2.5) emissions. This article takes a heavy-duty diesel truck as a typical vehicle, combining instantaneous speed, acceleration and the vehicle-specific power VSP to divide the operating mode, and the exhaust emission of a heavy-duty diesel truck is then calculated by using MOVES. Finally, the environmental modification factors (EMFs) are used to evaluate the influence of curvature change on the exhaust emissions. The results show that CO2 and PM2.5 emissions of heavy-duty diesel trucks are increasing with the curvature of the crest vertical curve changing; with the increase and decrease of curvature K of the crest vertical curve by 50%, CO and NOx emissions showed an increasing trend. Among the four main emissions, CO2 emission amount is the largest, followed by NOx, CO and PM2.5. The emission rates of CO2 and PM2.5 increase with the increase of curvature of the crest vertical curve, and the minimum values of CO2 and PM2.5 emission rates are 46.7 g/s and 0.022 g/s, respectively. The emission rates of CO and NOx increase with the increase of curvature. The minimum point of emission rates of CO and NOx are 0.042 g/s and 0.259 g/s, respectively.
1. Introduction
Vehicle exhaust pollution is becoming one of the main issues of widespread international concern. Since most diesel vehicles are not equipped with an exhaust post-treatment system [1], diesel engines emit more pollutants and have more impact on air pollution by [2] than gasoline engines. The internal combustion engine exhaust of diesel vehicles mainly comes from incomplete combustion of fuel. Its main pollutants are particulate matter (PM), COx, NOx and hydrocarbons (HCs) [3]. When diesel engine cars are driving in the variable slope point section, more fuel consumption is needed to maintain the running state, and then emit more exhaust gas relative to the flat slope section [4,5]. Some research shows that the vertical curve change affects the emission control of various diesel vehicles [6,7,8]. This paper aims to discuss the relationship between the vertical curve design index and the exhaust emission of diesel vehicles, and to provide a theoretical basis for the green highway design and energy saving and emission reduction.
Existing exhaust emission prediction models mainly include the MOVES and MOBILE models developed in the United States, the COPERTIV model developed in Europe, and models such as ASPECT, CHANGER, and IVE [9,10,11,12]. Among them, the CHANGER and ASPECT models use road life-cycle modeling, and have strict requirements on data information such as material use, energy consumption, and recycling. poor. The COPERTIV and MOBILE models establish models based on fixed driving conditions, but due to the limitation of test conditions, it is difficult to reflect all the running characteristics of the actual road, and the accuracy of the calculation results is not high. The IVE and MOVES models build carbon emission models based on the specific power of vehicles, which can more comprehensively reflect the operating conditions of vehicles when calculating emissions [10,11,12]. In particular, the MOVES model is a quantification model of carbon emissions in the United States designated by the US Environmental Protection Agency [13]. It adopts the modeling method of specific power and working condition division, and combines acceleration and speed to reflect the operating conditions of the vehicle. Other parameters that affect vehicle exhaust emissions, such as road type, vehicle age distribution, weather information, fuel information and 1/M maintenance systems, can more accurately reflect the actual vehicle emission characteristics. Therefore, this paper adopts the MOVES model (Motor Vehicle Emission Simulator) developed by the US Environmental Protection Agency to calculate vehicle exhaust emissions.
Huang Guantao [14] conducted a sensitivity analysis on parameters such as weather (temperature, humidity), vehicle age, and 1/M maintenance regime in the MOVES model. The change of the vehicle age of the emission source has a greater impact on the emission of each emission (CO2 exception). With the increase of vehicle age, the emission of pollutants presents a stepwise increase; the relative humidity and the 1/M maintenance system have little effect on the emission of pollutants. WU Meixuan [15] studied the emission characteristics of diesel engine exhaust pollutants under different working conditions (altitude, vehicle speed, engine speed and load). The results found that the effects of altitude, vehicle speed, engine speed, and load on the emissions of various pollutants (PM, NOx. and combustion time, etc., which in turn affect the production and emission of various pollutants. Li Longfei [16] analyzed the influencing factors that are closely related to the carbon emission during the highway operation period, such as vehicle type and CO2 emission coefficient, vehicle running speed, traffic volume, radius of circular curve, pavement surface layer characteristics, slope and length of longitudinal curve, and carbon sink of green belt plants; Taking the carbon emission during the highway operation period as the parent sequence, and the key parameters of each route design as the base, grey correlation analysis was carried out, and the low carbon correlation degree of the key parameters of the highway route design was obtained.
Domestic and foreign scholars have undertaken a lot of research on the geometric design of the longitudinal section in low-emission highways. Jinliang Xu et al. [17] used the law of conservation of mechanical energy, the first law of thermodynamics and the theory of vehicle longitudinal dynamics to determine the influence of slope design indicators on fuel consumption. JIA, XL [5] studied the quantitative relationship between longitudinal slope and carbon emission, and found that carbon emission increased significantly when the longitudinal slope value was greater than 3%, and proposed a relationship between carbon emission and longitudinal slope through a case study. Based on MOVES, Liu Zhen [18] studied the vehicle fuel consumption and vehicle exhaust emission laws of typical vehicles under different alignment indicators such as flat and straight sections, longitudinal slope sections, and curved slope combined sections and different highway grades. It can be seen that the research on longitudinal slope sections at home and abroad is relatively mature. In the research on low emission of vertical curve sections, Dong yaping et al. [6] deduced the carbon dioxide under different types of vertical curves according to the law of conservation of mechanical energy and the theory of vehicle longitudinal dynamics by dividing vertical curves into downhill/asymmetric/symmetric vertical curves. Emissions models show the effect of slope on vehicle carbon emissions on vertical profiles consisting of downhill/asymmetric/symmetric vertical curves with slopes greater than equilibrium slope, where carbon emission rates are determined by slope and radius. However, due to the adoption of the IPCC conversion model, the quantitative relationship between other exhaust emissions and the vertical curve cannot be obtained. Ko et al. [8] generated a second-by-second speed profile using speed prediction and a polynomial model, and extracted fuel consumption and emission rates based on vehicle-specific power and speed using the Emissions Simulator (MOVES) modeling software. The results show that the designed vehicle consumes and produces 10% less fuel and carbon dioxide on the top vertical curve, respectively, and the design speed is 1.5 times greater than the minimum vertical curve speed recorded in the AASHTO Green Paper. However, the velocity prediction model it uses only considers the velocity at the midpoint of the vertical curve, the non-uniform acceleration model is used to simulate the acceleration, and the accuracy needs to be further studied.
The purpose of this study is to explore the law of diesel vehicle exhaust emissions on vertical curve sections, and to provide a reference for the design of green highways in China. In this paper, the truck dynamics model is used to obtain the instantaneous speed and acceleration changes of diesel vehicles; the parameters in MOVES are corrected based on China’s climate, fuel and other information, and finally the MOVES model is used to quantify the exhaust emissions in order to obtain the vertical curve curvature and vehicle exhaust.
2. Materials and Methods
In order to fully reveal the influence of the linear variation of crest vertical curve on the exhausts emission of heavy-duty diesel trucks at grade change point sections, this paper chooses the means of experimental simulation to predict the exhausts emission of heavy-duty diesel trucks. The comprehensive mobile source emission model MOVES developed by the US Environmental Protection Agency combines acceleration and instantaneous speed to reflect the operating conditions of the vehicle, and it can accurately reflect the vehicle emission characteristics in actual operation. In this paper, the MOVES model is chosen to predict the exhaust emissions of heavy-duty diesel trucks at grade change points [19,20,21].
2.1. Scheme Design
The grade change point section is composed of straight slope section and crest vertical curve section. In order to study the influence of curvature change of crest vertical curve on vehicle exhausts emission of grade change point section, this paper assumes that the grade change point section is composed of three sections: front slope section (L1 section), crest vertical curve section (L2 section) and back slope section (L3 section), The schematic diagram is shown in Figure 1. According to relevant research [5,6], the steeper the longitudinal slope of the highway, the greater the emission of motor vehicle exhausts. In order to observe the relationship between crest vertical curve alignment and exhausts emission more clearly, the grades of L1 and L3 straight slopes are set as 9% and −9%, respectively. The curvature of L2 crest vertical curve is divided into three cases: benchmark K value, higher than benchmark K value, lower than benchmark K value. Benchmark K value is 39 m/% of K value recommended by the AASHTO Green Book [22]. Assuming the total length of the grade change point section is constant, the change of curvature of L2 section will inevitably lead to the change of length of L2. The greater the curvature of crest vertical curve, the shorter the length of L2 section and the longer the lengths of L1 and L3 sections.
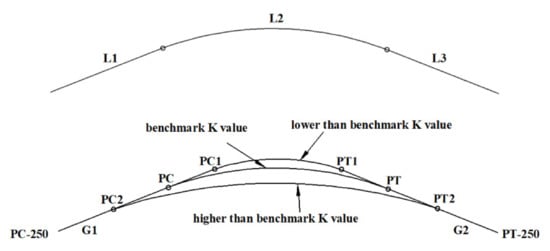
Figure 1.
Schematic diagram of the grade change point section.
The simulation schemes for the three cases are shown in Table 1. When simulated curvature benchmark value is K, the crest vertical curve section is a curve from PC to PT. The crest vertical curve section higher than the benchmark value K is a curve from PC2 to PT2, including 50%, 40%, 30%, 20% and 10% higher than the benchmark value K. The crest vertical curve section below the benchmark value K is a curve from PC1 to PT1, including 50%, 40%, 30%, 20% and 10% below the benchmark value K. The length of curve section above the benchmark value K is larger than the benchmark curve section length, while the length of curve section below the benchmark value K is smaller than the benchmark curve segment length. In order to make the grade change point section include all the assumed scheme lengths in this paper, L1 section and L3 section are, respectively, taken as 250 m before point PC and 250 m after point PT, which are defined as (PC-250 point) and (PT+250 point).

Table 1.
Simulation scheme of the grade change point section.
2.2. Speed Prediction Model
It is necessary to divide the operating mode according to the speed and acceleration of motor vehicles when using MOVES model. Due to the lack of consideration of vehicle driving dynamics in using average speed, it is impossible to evaluate in detail the influence of highway geometric indicators on vehicle exhaust emission. Therefore, in this paper, the instantaneous speed and acceleration of heavy-duty diesel trucks are used to reflect their operating mode. The accuracy of simulation results partly depends on the choice of instantaneous acceleration and instantaneous velocity models.
In order to accurately calculate the instantaneous speed and acceleration of heavy-duty diesel trucks on the grade change point section, it is necessary to calculate the instantaneous speed of heavy-duty diesel trucks on L1, L2 and L3 sections, respectively. The research results of Ko M [8] show that the heavy-duty diesel truck can be regarded as driving at a uniform speed when driving on the crest vertical curve section, so this study assumes that the speed of the heavy-duty diesel vehicle on the L2 section is the speed when entering the crest vertical curve. The instantaneous speed of heavy-duty diesel trucks on L1 and L3 sections is calculated by the truck dynamics model. The driving force of heavy-duty diesel trucks on a longitudinal slope is shown in Equation (1):
where, F = tractive effort, = aerodynamic resistance, = rolling resistance, = grade resistance.
Traction effort generated by the engine of a heavy-duty diesel truck is used to overcome the external resistance and the power required for automobile acceleration, traction effort, aerodynamic resistance, rolling resistance and grade resistance are expressed by Equations (2)–(5):
The r is the engine efficiency coefficient, the P is engine generated power (kW) and V is the driving speed (m/s). Rolling resistance is caused by the deformation of tires interacting with the road surface, which mainly depends on vehicle weight, road surface condition and tire type. Heavy vehicles will increase tire deformation and increase the running resistance of vehicles. Among them, the rolling coefficients CR and Cr are 0.01 and 1/4473, respectively [23]. Grade resistance is caused by gravity generated by slope road surface. Because the slope of highway is very small, sin θ can be replaced by tan θ. G is the longitudinal slope (%).
Due to inertia of rotating parts and gear reduction ratio, both static mass and rotating mass need vehicle acceleration force. The acceleration force is expressed by Formula (6):
From Formulas (2) to (6), the acceleration formula can be expressed as (7):
Among them, M is the static mass (kg) and is the effective mass of the heavy-duty diesel trucks. When the truck runs, there is a moment of inertia between the wheels and the engine, which will give the car partly more mass than the static one. The mass of the truck diesel vehicle at this time is [24]. According to the difference of engine size and number of gears, the / ratio of trucks will be different. According to Bester’s research [25], when the speed exceeds 25 km/h, the error of M/Me ratio of different vehicles is less than 5%, which can be expressed by a unified linear model for different vehicles, such as Formula (8). The M/Me ratio can be brought into Formula (7) to calculate the acceleration of heavy-duty diesel trucks running on L1 and L3 sections, such as Formula (9).
The research of Lan shows that when the truck speed is greater than 65 km/h, the acceleration and instantaneous speed are linear, and when the speed of heavy-duty diesel vehicle is lower than 65 km/h, the acceleration is the reciprocal function of speed due to low resistance [24]. The linear and non-linear acceleration models are shown in Formula (10).
In which α, β, c and d are parameters, and the calculation formulas are as follows:
where V0 is the initial speed, Vh is final speed, is acceleration corresponding to V0 and Vh.
2.3. Operating Mode Distribution
In order to estimate the vehicle emission level, it is necessary to find the operating mode code according to the instantaneous speed and instantaneous VSP (vehicle-specific power) value of the vehicle, and to match the second-by-second operating mode of the vehicle to the corresponding operating mode distribution. Carbon emissions per operating mode are then calculated from the MOVES model. The cumulative carbon emissions of vehicles during driving can be obtained by adding the carbon emissions of all operating modes. VSP can comprehensively consider the actual driving power output of vehicles, which is closely related to emissions. The calculation formula is shown in Equation (12) [26]:
where VSP is the instantaneous vehicle-specific power of motor vehicles; ν is the instantaneous speed of the vehicle (m/s); a is vehicle acceleration (m/s2); is the road longitudinal slope (%); M is the mass of a heavy-duty diesel truck (t); A is rolling resistance (kw s/m); B is the rotating rolling resistance (kw s/m2); C is air resistance (kw s/m3); g is the acceleration of gravity (9.8 m/s2).
The MOVES model developed by the U.S. EPA is based on instantaneous vehicle speed and vehicle-specific power, and divides the operating mode of exhausts emission prediction into 23 operating mode intervals. The vehicle-specific power VSP, instantaneous speed and acceleration of the truck are calculated by Formulas (1)–(11). The operating mode distribution of the diesel truck at the grade change point section is obtained by the principle of dividing operating mode in the MOVES model.
2.4. Parameter Localization Correction
The database of MOVES model is based on the data of motor vehicle emissions from various States and counties in the United States, it is unreasonable to directly predict the carbon emission level of motor vehicles in China. Therefore, based on the information of roads, traffic, vehicles and fuel in China, this paper reasonably revised six parameters, such as area, vehicle type, road type, operating mode distribution, age distribution, and others. These need to be input to simulate the motor vehicle emission level at MOVES microcosmic level. The basic parameters are set as follows [19,20]:
Time spans: there are many differences in diesel emission standards and diesel quality between China and the United States. Diesel oil used in Shaanxi Province is currently at the fifth stage of national emission standards. Therefore, after comparing the relevant parameters of the United States and China, 2000 is determined as the calculation year of the MOVES model, and the comparison of diesel quality between China and the United States is shown in Table 2 [21].

Table 2.
Comparison of diesel oil quality between China and America.
Geographic bounds: the MOVES model provides more than 3000 geographical areas in 50 states of the United States for users to match the geographical information needed for modeling. By comparing the latitude and longitude, altitude, mean temperature, average annual precipitation and relative humidity of Shaanxi Province and the states of the United States. This paper considers Missouri as a geographic area in a simulation [20].
Vehicles: synthesizing the above analysis and considering the present situation and future development trend of Chinese models, the heavy diesel vehicle is selected as the representative model, corresponding to the emission source type with code 53 in the MOVES model;
Fuel type: this paper selects the type of −20# diesel oil, corresponding to the MOVES model code 20,043 fuel;
Age distribution: the average car age is 6 years, corresponding to the car age combination with code 6 in MOVES model;
I/M: according to Huang Guantao’s research (2011) [14], I/M has less exhaust emission, so an I/M-free system is adopted in this paper.
3. Results and Discussion
3.1. Speed Prediction
The truck dynamics model was used to calculate the second-by-second speed and accelerations of grade change point section, and the speed on the road with different grade change points sections is calculated according to the change of curvature K. The AASHTO Green Book (2011) recommends the standard K value of 39 m/% when the standard speed is 90 km/h [22]. The K value of the crest vertical curve should be higher than the recommended minimum standard value in road design. Actually, the K value of the crest vertical curve may be less than the recommended minimum standard value when the actual terrain is limited.
It is assumed that the heavy-duty diesel truck starts at an initial speed of 80 km/h, and travels unevenly on longitudinal slopes of 9% and −9%. According to the literature [8], when the truck passes through a crest vertical curve, its acceleration and instantaneous speed have no obvious change, and the driving speed is the speed when entering the crest vertical curve. Therefore, this study assumes that the speed of heavy-duty diesel trucks always keeps the speed when entering the crest vertical curve when passing through the crest vertical curve. Figure 2a shows the real-time speed prediction curve of heavy-duty diesel trucks in the grade change points section. When the curvature of the crest vertical curve changes, the speed change amplitude diagram when entering the crest vertical curve section is shown in Figure 2b.
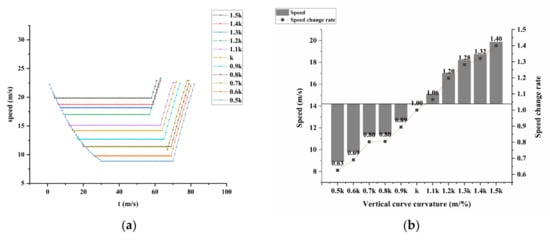
Figure 2.
Speed change diagram of heavy-duty diesel vehicle: (a) Instantaneous speed versus time graph; (b) the speed change amplitude diagram in crest vertical curve section.
As shown in Figure 2, when a heavy-duty diesel truck runs on a grade change point section, the speed value of the heavy-duty diesel truck entering the crest vertical curve is lower as the curvature of the crest vertical curve in L2 section decreases. After passing through the crest vertical curve, the speed of a heavy-duty diesel truck decreases almost linearly. When the curvature of a crest vertical curve is 1.5 K, 1.4 K, 1.3 K, 1.2 K and 1.1 K, the speed of a heavy-duty diesel truck is 40%, 32%, 28%, 20% and 6% higher than that of the benchmark curvature K. When the curvature of the crest vertical curve is 0.5 K, 0.6 K, 0.7 K, 0.8 K and 0.9 K, the speed of a heavy-duty diesel truck entering the crest vertical curve decreases by 11%, 19.5%, 19.7%, 31% and 37%, respectively. The smaller the curvature of crest vertical curve, the lower the speed of a heavy-duty diesel truck entering L2. The main reason may be that the smaller the curvature of the crest vertical curve, the shorter the length of the L2 section, the longer the deceleration time of a heavy-duty diesel truck in the L1 section, and the more the speed of a heavy-duty diesel vehicle decreases, so the lower the speed when entering the L2 section.
3.2. Exhaust Emissions at Grade Change Point Sections
The effect of crest vertical curve shape index on the exhaust of a diesel truck is the purpose of this paper. The focus is on the road alignment index, regardless of the influence of traffic flow on vehicle exhaust emissions. Therefore, it is assumed that a heavy-duty diesel truck runs alone on the road section, and the traffic volume corresponding to MOVES is 1. MOVES does not directly report the emissions of each operating mode, and this study adopts a single operating mode distribution (i.e., the target operating mode distribution fraction is 1, and the rest is 0). By changing the target operating condition interval and repeating the operation, the required emission rate of each operating condition is obtained. According to the exhaust emission of each operating mode interval under the speed curve of seconds in the driving time, the total emission is obtained. The expression is as follows:
Etype is the total emissions of carbon dioxide (CO2), carbon moNOxide (CO), nitrogen oxides (NOx) and particulate matter PM2.5. Etype,bin is the exhausts emissions of heavy-duty diesel trucks in the operating conditions at t. The database of exhausts emissions under different vertical curvatures on a two-lane highway with front and back longitudinal slopes of 9% and −9% is obtained through MOVES simulation.
In this paper, environmental modification factors (EMFs) are used to evaluate the influence of curvature change on the exhausts emission of a road with grade change point section. Environmental correction factor EMFs indicate the change of exhaust emission when geometric parameters change to basic conditions. When EMFs are equal to 1, it means that the change of geometric parameters has no effect on the exhausts emission of heavy-duty diesel trucks; when EMFs are less than 1, it means that the change of geometric parameters will reduce the exhaust emissions of heavy-duty diesel trucks; when EMFs are greater than 1, it means that the change of geometric parameters will increase the exhaust emissions of heavy-duty diesel trucks.
In order to obtain the exhaust emission rule of heavy-duty diesel trucks at a grade change point, the exhausts emissions of front slope (L1), crest vertical curve (L2) and back slope (L3) were calculated, respectively, and the influence of curvature change of crest vertical curve on exhaust emissions at grade change points was quantified by EMFs. Figure 3, Figure 4, Figure 5 and Figure 6 show the emissions of CO2, CO, NOx and PM2.5 of heavy-duty diesel trucks at grade change points when there is curvature change of L2.
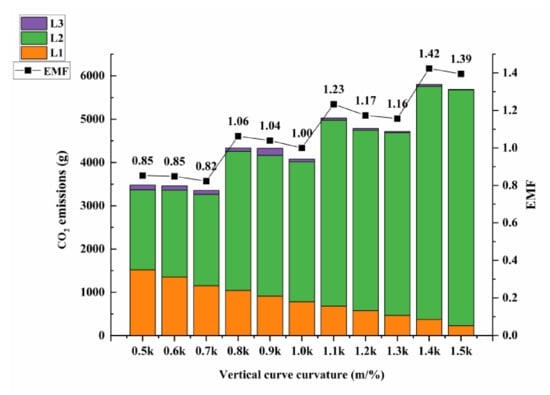
Figure 3.
Relationship between CO2 emissions and curvature.
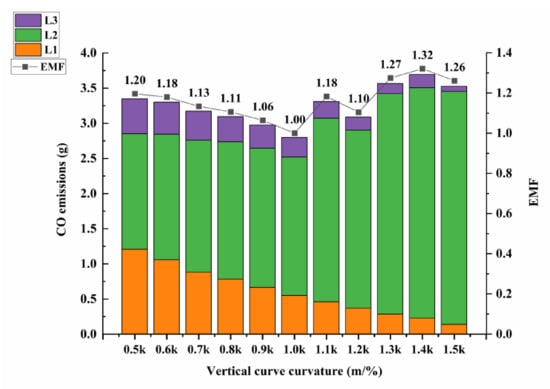
Figure 4.
Relationship between CO emissions and curvature.
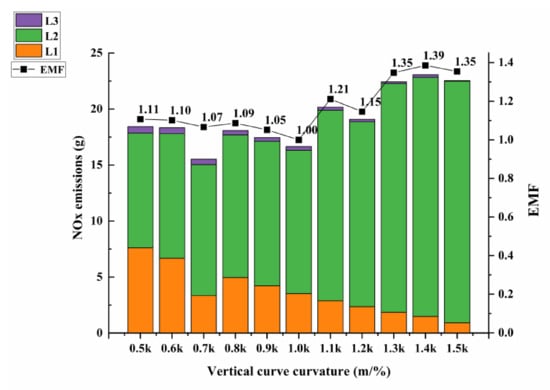
Figure 5.
Relationship between NOx emissions and curvature.
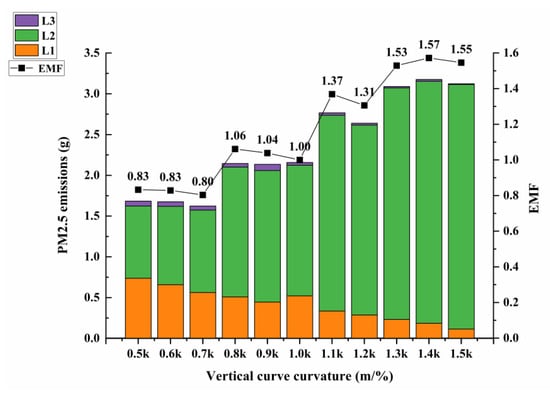
Figure 6.
Relationship between PM2.5 emissions and curvature.
As shown in Figure 3, Figure 4, Figure 5 and Figure 6, the main ordinate is the cumulative exhaust emissions of the L1, L2 and L3 sections, and the secondary ordinate axis represents the influence of curvature change of the L2 section on exhausts emissions at grade change point sections. It can be seen from Figure 3, Figure 4, Figure 5 and Figure 6 that with the increase of curvature of crest vertical curve in the L2 section, the emissions of CO2, CO, NOx and PM2.5 in the L2 section all increase; while the emissions of CO2, CO, NOx and PM2.5 in L1 and L3 sections all show a decreasing trend, the length of the L1 section and the L3 section are equal. When the curvature of the L2 section is consistent, heavy-duty diesel trucks emit more CO2, CO, NOx and PM2.5 in the L1 section than in the L3 section. The main reasons are: with the increase of curvature of the L2 section and the longer length of the crest vertical curve section, heavy-duty diesel trucks will consume more oil consumption, so the emissions of CO2, CO, NOx and PM2.5 will also increase. The L1 section and L3 section have the same length, and heavy-duty diesel trucks need more power to overcome the height difference when going uphill than when going downhill, so more exhausts emissions will be emitted when going uphill.
Based on the K value specified in the AASHTO Green Book, this paper compares the influence of the increase and decrease of K value on the exhausts emission of heavy-duty diesel trucks. The data show that with the curvature of crest vertical curve changing from 0.5 K to 1.5 K, the CO2 and PM2.5 emissions of heavy-duty diesel trucks are increasing. When K value increases by 50% of the benchmark K, the CO2 emissions increase by 39% compared with K value; the emission of PM2.5 increased by 57% compared with that at K value. Among the four kinds of emission studied, CO2 emissions are the largest, followed by NOx, CO and PM2.5 emissions.
3.3. Exhausts Emission Rate in Crest Vertical Curve Section
Exhausts emissions per unit time of heavy-duty diesel trucks on crest vertical curve sections are called emission rate. With the curvature of the crest vertical curve section increasing from 0.5 K to 1.5 K, the running conditions of heavy-duty diesel trucks from PC−250 to PC2 are consistent. When the load diesel vehicle enters the PC2, the section with curvature greater than the reference K value travels at a uniform speed, and the section with curvature less than or equal to the reference K value continues to slow down until it enters the crest vertical curve to drive at a uniform speed. The speed of entering the crest vertical curve varies with the acceleration time of the load diesel vehicle, and the exhaust emission per unit time of the load diesel vehicle in the crest vertical curve section changes. The greater the curvature of crest vertical curve section, the shorter the length of crest vertical curve, the longer the length of front and rear longitudinal slope sections, the longer the deceleration time of heavy-duty diesel trucks, and the lower the speed of entering crest vertical curve. When the curvature of the crest vertical curve changes, the trend diagram of exhaust emission per unit time of the heavy-duty diesel truck in the crest vertical curve section is shown in Figure 7.
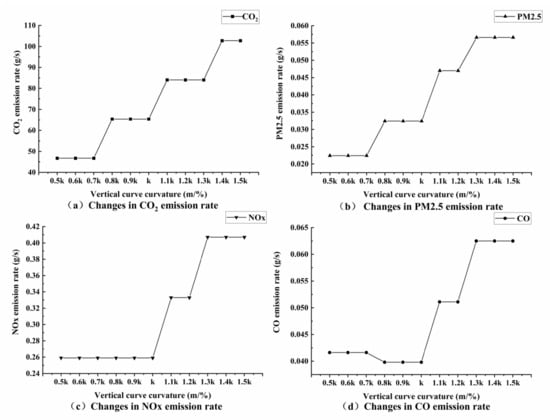
Figure 7.
Exhausts emission rate of crest vertical curve section: (a) Changes in CO2 emission rate; (b) Changes in PM2.5 emission rate; (c) Changes in NOx emission rate; (d) Changes in CO emission rate.
As shown in Figure 3, Figure 4, Figure 5 and Figure 6, In the crest vertical curve section, the exhaust emission rate of the load diesel vehicle varies with the change of the crest vertical curve curvature of the variable slope section. The change trend of CO2 emission rate of a heavy-duty diesel truck increases with the increase of the curvature of the crest vertical curve; 0.5 K–0.7 K and 1.4 K–1.5 K are the minimum point and maximum point of CO2 emission rate, respectively. The minimum and maximum CO2 emission rate are 46.7 g/s and 102.93 g/s, respectively. The PM2.5 emission rate of heavy-duty diesel vehicles increases with the curvature of the crest vertical curve. 0.5 K–0.7 K and 1.3 K–1.5 K are the minimum and maximum PM2.5 emission rates, respectively, and the PM2.5 emission rate is the minimum. The value and maximum value are 0.022 g/s and 0.057 g/s, respectively. The emission rates of CO2 and PM2.5 for a heavy-duty diesel truck increase in the changing intervals of the crest vertical curve with curvatures of 0.7 K–0.8 K, K–1.1 K, and 1.3 K–1.4 K, and the emission rates of CO2 and PM2.5 are the same in other changing intervals. The NOx emission rate of a heavy-duty diesel truck remains the same when the curvature is 0.5 K to K. When the curvature is from K to 1.5 K, the trend of NOx emission rate is increasing, 0.5 K–K, 1.3 K–1.5 K is the minimum and maximum point of NOx emission rate, and the minimum and maximum values are 0.259 g/s, 0.407 g/s, respectively. The CO emission rate shows a decreasing trend when the curvature is 0.7 K–0.8 K; the CO emission rate increases when the curvature is between K–1.1 K and 1.2 K–1.3 K, and the CO emission rate does not change in other intervals; 0.8 K–K and 0.3 K–1.5 K are the minimum point and maximum point of CO emission rate, respectively. The minimum and maximum CO emission rates are 0.040 g/s and 0.063 g/s.
The curvature of a crest vertical curve affects the acceleration and deceleration time and the speed of entering the crest vertical curve. The larger the curvature of the crest vertical curve, the shorter the deceleration time of the diesel truck, and the greater the speed when entering the crest vertical curve. As a matter of fact, the continuous high speed of the truck driving on the crest vertical curve will inevitably lead to the increase CO2, CO, NOx, PM2.5 discharges of the truck. In part of the variation range, the exhaust emission of the diesel truck is constant. The main reason is that the operating mode distribution is calculated by the instantaneous velocity, acceleration, the specific power VSP of the motor vehicle in the MOVES. There are 23 operating mode distribution in the MOVES model, and each operating mode distribution corresponds to different emission rates. During the running of the load diesel vehicle at the variable slope point, the speed and specific power change is small in a short period of time, and when the instantaneous speed and specific power are distributed in the same range, the calculated exhaust emission of the load diesel vehicle remains coincident.
3.4. Discussion
This paper uses the combination of the truck dynamics model and the MOVES model to obtain the exhaust emission law of heavy-duty diesel vehicles on the road section at the point of changing slopes. In order to match the MOVES model with the actual road traffic and vehicle conditions in China, the parameters in the MOVES model are modified locally from the perspectives of geographic information, climate conditions, and vehicle fuel characteristics. This can more accurately reflect the emission characteristics of Chinese vehicles in actual operation.
In the vertical curve section, when the curvature of the vertical curve changes from 0.5 K to 1.5 K, the CO2 and PM2.5 emission rates of heavy duty diesel vehicles increase with the increase of the curvature. This phenomenon is consistent with the results of literature [6,8]. Almost the same, the difference is in the literature [8], when the vertical curve curvature is greater than 1.3 K, the CO2 and PM2.5 emission rates show a decreasing trend. This may be due to inconsistent speed prediction models chosen. This may be due to the fact that the greater the curvature of the vertical curve, the higher the engine load of the heavy-duty diesel vehicle, so the engine needs more fuel, which in turn produces more CO2. The reason why more PM emissions increase in the exhaust may be because of the following: the greater the curvature of the vertical curve, the shorter the deceleration time of the heavy-duty diesel vehicle, and the greater the speed when entering the vertical curve. The continuous driving of heavy duty diesel vehicles on the vertical curve at a higher speed will lead to an increase in the fuel delivery of each cycle of the diesel engine, an increase in the concentration of the oil–air mixture in the cylinder, and an expansion of the fuel-rich area, so more PM is generated [27].
When the vertical curve curvature is less than K, the emission rates of NOx and CO are almost unchanged. When the vertical curve is greater than K, the emission rates of NOx and CO increase with the increase of the curvature. This is consistent with the research conclusions of other scholars [8]. The formation of NOx is mainly due to the presence of sufficient oxygen and suitable in-cylinder temperature, and the fuel combustion of diesel vehicles will be affected by oxygen. Under high-speed conditions, the percentage of oxygen is higher, and NOx is more likely to be generated, so there will be a vertical curve greater than K, and the NOx emission rate will gradually increase [28]. For the CO emission rate, the main reason is that the diesel engine emits less CO under medium load conditions; when running under low load conditions, the fuel mixture is too lean, which increases the incidence of flame quenching, thereby promoting CO emission. Under heavy load conditions, the fuel mixture is too rich, which aggravates the local hypoxia in the cylinder, resulting in the increase of CO produced [29]. This principle can explain that with the increase of curvature, the CO emission rate of heavy-duty diesel vehicles appears as a trend that is decreasing and then increasing.
4. Conclusions
If the curvature is too large, the motor vehicle will not only block the driver’s sight, but also cause large exhaust emissions. In the design of a variable slope point, the curvature of a crest vertical curve should be greater than or equal to the minimum standard stipulated in the Green Book. The flatter the crest vertical curve, the smaller the engine load, and the less exhaust emission of the diesel truck at the variable slope point section.
At the crest vertical curve section (L2 section), when the curvature of the crest vertical curve changes from 0.5 K to 1.5 K, the change trend of CO2 and PM2.5 emission rates of heavy-duty diesel vehicles increases with the increase of the curvature. When the curvature of a crest vertical curve is less than K, the emission rates of NOx and CO are almost constant. When the crest vertical curve is larger than K, the emission rates of NOx and CO increase with the increase of curvature. In the vertical curve design, the smaller curvature K value is helpful for green geometric design.
In this paper, heavy-duty diesel vehicles are used as the research object, and we studied the influence of the curvature of the convex vertical curve section on vehicle exhaust emissions. Whether it is applicable to other types of vehicles and the concave vertical curve needs to be further verified.
Author Contributions
Conceptualization, X.J.; methodology, X.J.; software, X.Q.; validation, S.L. and W.Z.; formal analysis, X.C.; investigation, X.C.; resources, W.Z.; data curation, S.L.; writing—original draft preparation, X.Q.; writing—review and editing, X.Q.; visualization, X.J.; supervision, X.J.; project administration, S.L.; funding acquisition, X.J. All authors have read and agreed to the published version of the manuscript.
Funding
This research was funded by the National Key Research and Development Program of China [Grant No. 2021YFB2600403]; the Natural Science Foundation of Shaanxi Province [Grant No. 2020JM-260].
Institutional Review Board Statement
Not applicable.
Informed Consent Statement
Not applicable.
Data Availability Statement
Not applicable.
Conflicts of Interest
The authors declare no conflict of interest.
References
- Longhin, E.; Gualtieri, M.; Capasso, L.; Bengalli, R.; Mollerup, S.; Holme, J.; Øvrevik, J.; Casadei, S.; di Benedetto, C.; Parenti, P.; et al. Physico-chemical properties and biological effects of diesel and biomass particles. Environ. Pollut. 2016, 215, 366–375. [Google Scholar] [CrossRef] [PubMed]
- Mahesh, S.; Ramadurai, G.; Nagendra, S.M.S. Real-world emissions of gaseous pollutants from diesel passenger cars using portable emission measurement systems. Sustain. Cities Soc. 2018, 41, 104–113. [Google Scholar] [CrossRef]
- Pu, Y.C. Study on Cu-Based Catalysts Used for On-Board Reforming of Methanol for Hydrogen Production In Assisting Diesel Combustion Applications; Xiamen University: Xiamen, China, 2019. (In Chinese) [Google Scholar]
- Feng, Y. What are the shortcomings of the current diesel vehicle management system? Environ. Econ. 2015, Z4, 45. [Google Scholar]
- Jia, X.; Xu, J.; Liu, X. Association of Carbon emissions and Expressway Longitudinal Slope in Northern China. J. Residuals Sci. Technol. 2017, 14, 177–183. [Google Scholar] [CrossRef]
- Dong, Y.; Xu, J. Estimation of Vehicle Carbon Emissions in China Accounting for Vertical Curve Effects. Math. Probl. Eng. 2020, 2020, 1595974. [Google Scholar] [CrossRef]
- Kang, M.W.; Shariat, S.; Jha, M.K. New highway geometric design methods for minimizing vehicular fuel consumption and improving safety. Transp. Res. Part C Emerg. Technol. 2013, 31, 99–111. [Google Scholar] [CrossRef]
- Ko, M.; Lord, D.; Zietsman, J. Environmentally conscious highway design for crest vertical curves. Transp. Res. Rec. 2012, 2270, 96–106. [Google Scholar] [CrossRef]
- EPA. Dynamometer Drive Sehedule Quick View [EB/OL]. Available online: http://www.epa.gov/nvfel/methods/quiekdds.htm (accessed on 26 December 2021).
- Austin Thomas, C. Methodology for Generating Driving Cycles for Inventory Development; U.S. Environmental Protection Agency: Washington, DC, USA, 1995.
- Kouridis, C. COPERTIV III Computer Program to Calculate Emissions from Road Transport; European Environment Agency: Copenhagen, Denmark, 2000. [Google Scholar]
- University of California at Riverside. IVE Model Users Manual (Version2.0); The US Environmental Protection Agency: Washington, DC, USA, 2008.
- EPA. Draft Motor Vehiele Emission Simulator (MOVES) 2009: Software Design and Reference Manual; United States Environmental Protection Agency: Washington, DC, USA, 2009.
- Huang, G. Evaluation of Traffic Emissions at Microscopic Level Based on MOVES; Beijing Jiaotong University: Beijing, China, 2011. [Google Scholar]
- Wu, M.; Zhao, Z.; Li, H.; Zhang, P. Influence of different working conditions on emission characteristics of pollutants in diesel engine exhaust: A review. J. Civ. Environ. Eng. 2022, 44, 197–206. [Google Scholar]
- Li, L. Research on the Key Parameters of Low-carbon Highway Route Design; Ocean University of China: Qingdao, China, 2014. [Google Scholar]
- Xu, J.; Dong, Y.; Yan, M. A model for estimating passenger-car carbon emissions that accounts for uphill, downhill and flat roads. Sustainability 2020, 12, 2028. [Google Scholar] [CrossRef] [Green Version]
- Liu, Z. Road Alignment Index Evaluation with Vehicle Pollution and Fuel Consumption; Southeast University: Nanjing, China, 2017. [Google Scholar]
- Xu, J.; Jing, L.; Han, Y.; Yan, M. MOVES-based prediction model for carbon emissions of heavy-duty diesel vehicles on small radius and circular curve sections. Highw. Transp. Sci. Technol. 2018, 35, 124–131, 158. [Google Scholar]
- Yang, D.; Wang, M.; Qiu, Z. Research on vehicle fuel consumption and emission assessment of different highway grades. Sci. Technol. Eng. 2017, 17, 108–114. [Google Scholar]
- Zhang, X.; Xu, J.; Li, M.; Li, Q.; Yang, L. Modeling impacts of highway circular curve elements on heavy-duty diesel trucks’ CO2 emissions. Int. J. Environ. Res. Public Health 2019, 16, 2514. [Google Scholar] [CrossRef] [PubMed] [Green Version]
- A Policy on Geometric Design of Highways and Streets, 6th ed.; AASHTO: Washington, DC, USA, 2011.
- Mannering, F.L.; Washburn, S.S.; Kilareski, W.P. Principles of High-way Engineering and Traffic Analysis; John Wiley & Sons: Hoboken, NJ, USA, 2009. [Google Scholar]
- Lan, C.J.; Menendez, M. Truck speed profile models for critical length of grade. J. Transp. Eng. 2003, 129, 408–419. [Google Scholar] [CrossRef]
- Bester, C.J. Truck Speed Profiles. In Transportation Research Record: Journal of the Transportation Research Board; No. 1701, TRB; National Research Council: Washington, DC, USA, 2000; pp. 110–115. [Google Scholar]
- Song, G.; Yu, L. Estimation of fuel efficiency of road traffic by characterization of vehicle-specific power and speed based on floating car data. Transp. Res. Rec. 2009, 2139, 11–20. [Google Scholar] [CrossRef]
- Wang, X.; Yin, H.; Ge, Y.; Yu, L.; Xu, Z.; Yu, C.; Shi, X.; Liu, H. On-vehicle emission measurement of a light-duty diesel van at various speeds at high altitude. Atmos. Environ. 2013, 81, 263–269. [Google Scholar] [CrossRef]
- Zhang, P.; Su, X.; Chen, H.; Geng, L.; Zhao, X. Experimental investigation on NOx and PM pollutions of a common-rail diesel engine fueled with diesel/gasoline/isopropanol blends. Sustain. Energy Fuels 2019, 3, 2260–2274. [Google Scholar] [CrossRef]
- Yu, L.; Ge, Y.; Tan, J.; He, C.; Fu, G.; Guo, J.; Wang, X. Combustion and emission characteristics of a heavy-duty diesel engine at different altitudes. Neiranji Xuebao/Trans. CSICE (Chin. Soc. Intern. Combust. Engines) 2013, 31, 507–512. [Google Scholar]
Publisher’s Note: MDPI stays neutral with regard to jurisdictional claims in published maps and institutional affiliations. |
© 2022 by the authors. Licensee MDPI, Basel, Switzerland. This article is an open access article distributed under the terms and conditions of the Creative Commons Attribution (CC BY) license (https://creativecommons.org/licenses/by/4.0/).