
Leveraging Graph Analytics for Energy Efficiency Certificates


Decision Support Systems Laboratory, School of Electrical and Computer Engineering, National Technical University of Athens, 9 Heroon Polytechniou Str., 15773 Athens, Greece
*
Author to whom correspondence should be addressed.
Energies 2022, 15(4), 1500; https://doi.org/10.3390/en15041500
Submission received: 27 December 2021
/
Revised: 28 January 2022
/
Accepted: 15 February 2022
/
Published: 17 February 2022
(This article belongs to the Special Issue Big Data Applications for Intelligent Energy Management in Buildings)
Abstract
:As energy efficiency is becoming a subject of utter importance in today’s societies, the European Union and a vast number of organizations have put a lot of focus on it. As a result, huge amounts of data are generated at an unprecedented rate. After thorough analysis and exploration, these data could provide a variety of solutions and optimizations regarding the energy efficiency subject. However, all the potential solutions that could derive from the aforementioned procedures still remain untapped due to the fact that these data are yet fragmented and highly sophisticated. In this paper, we propose an architecture for a Reasoning Engine, a mechanism that provides intelligent querying, insights and search capabilities, by leveraging technologies that will be described below. The proposed architecture has been developed in the context of the H2020 project called MATRYCS. In this paper, the reasons that resulted from the need of efficient ways of querying and analyzing the large amounts of data are firstly explained. Subsequently, several use cases, where related technologies were used to address real-world challenges, are presented. The main focus, however, is put in the detailed presentation of our Reasoning Engine’s implementation steps. Lastly, the outcome of our work is demonstrated, showcasing the derived results and the optimizations that have been implemented.
1. Introduction
Energy efficiency is among the top priorities of the European Union, and for that reason, a European framework [1] as well as a number of directives [2,3] have been established. These initiatives generate a vast amount of diverse data, which are yet fragmented, and, as a result, they cannot be utilized for data analysis, intelligent querying, and extraction of patterns. Thus, the need of graph analytics arises, aiming for the extraction and visualization of these data, as well as the creation of knowledge databases that will contain information about energy performance analytics and the related buildings. Moreover, by enabling graph solutions and the available knowledge from digital twins [4], the added value of these data can be enhanced, since, additionally to their usage as individual data points, the interconnections between them are also explored. Moreover, the installation of more and more sensors and IoT-based systems [5,6] has led to an enormous volume of generated data. The analysis and process of these data can be beneficial in the monitoring [7] and management of energy consumption [8,9,10,11], as well as in the decision-making process regarding energy consumption [12,13].
The efficient management of energy consumption and generation is more than necessary due to the increasing CO2 emissions from the building stock and the threats of climate change. The buildings have turned to solutions that include the adoption of more and more sensors (IoT), as well as information and communication technologies (ICT), feeding more and more of the generated data to artificial intelligence (AI) models [14] that need to process them. The handling of these data can play a crucial role in the mitigation of CO2 emissions and in the establishment of more efficient energy management.
The combination of the aforementioned technologies and the exploitation of big data [15] can lead to a decarbonized future with significantly less CO2 emissions from building operations. Following this approach, it is necessary to understand how the existing technologies, methods, as well as models and solutions, could be integrated by the building sector. This approach is vital in order to generate knowledge from the building data and constitutes the Big Data Value Chain (BDVC), which plays a key role in the energy economy of the future, providing more opportunities towards the vision of further digitalization and, thus, accelerating the energy transition.
The Reasoning Engine is the component responsible for the handling of the metadata produced by the buildings, and it does so by leveraging the graph analytic capabilities. To be more specific, the Reasoning Engine is a mechanism that provides intelligent querying, insights, and search capabilities by leveraging the available knowledge for the digital twin and analytics services. It also provides functionalities for the addition of more data to the existing knowledge base. The Reasoning Engine module is capable of consuming data produced from various sources (e.g., REST APIs, databases, files, etc.) and of both JSON and RDF formats. After being received, these data are persisted to the Reasoning Engine’s graph database, which (Neo4j [16]) is a powerful inference engine that enables graph functionalities over entities and connections for extracting new insights and patterns from datasets.
Graph databases are one of the latest strategies in big data storage for buildings that arise in popularity thanks to their ever-increasing accessibility. Graph databases are constructed to handle highly connected and linked data effectively. Therefore, they are a very promising approach for inference analysis. Multiple benchmarks highlight their strengths, comparing them to their non-graph database variant when applied to highly connected data [17]. This is implied by expensive JOIN operations in non-graph databases, while graph databases offer to traverse a large number of connections in a very short amount of time.
In the context of the H2020 project MATRYCS (https://matrycs.eu accessed date 28 December 2021), a reasoning engine was implemented using the data from EREN pilot. The aforementioned data are energy performance certificates from buildings in Castilla y León and contain information about the buildings’ location (coordinates, municipality, province), primary energy consumption, energy ratings, CO2 emissions, heating and cooling demands, registration date, and number. In this paper, we contribute to the Reasoning Engine functionality by enabling graph functionalities and properties over linked data instead of web ontologies and RDF schemas, aiming to extract added value from linked and connected data. Neo4j is a well-known graph database with an attached query language, CYPHER (https://neo4j.com/developer/cypher/ accessed date 28 December 2021). While a graph is not an ontology, an ontology can be represented in a graph. The challenge of this work is to use CYPHER to query not just a graph but also a knowledge graph. We will describe the work carried out in order to enable Neo4j to use JSON and RDF data as input and translate queries from SPARQL (https://www.w3.org/TR/rdf-sparql-query/ accessed date 28 December 2021), which is the query language of ontologies, to CYPHER. Additionally, we aim to use Neo4j to store ontologies and JSON data in both streaming and batch format. The aim of generating semantic information through graph database functionalities is to optimise the AI models’ data-driven energy predictions in urban infrastructure.
A reasoning engine for the building sector, and more specifically for energy efficiency certificates, is of significant importance for the improvement actions and pattern recognition by leveraging axioms and rules over the input data. In the present use case, the input data are the EREN energy certificates. The pattern recognition pipeline is based on logical inferences that evaluate the input data using graph properties and entities. The result of this procedure is the enhancement of the input for prediction models applied in the building sector, which process a large volume and variety of both real-time and historical data, in order to extract meaningful information and make data driven decisions.
The rest of the paper is organized as follows. Section 2 analyzes the state of the art of the treated domain. In Section 3, the architecture and the implementation of the Reasoning Engine, and the way the different sub-components are organized around a graph database, are described. Section 4 presents the results from queries to Reasoning Engine REST APIs, and Section 5 summarizes the key issues that have arisen in this paper.
2. State of the Art Analysis
NoSQL databases are non-tabular databases. They store data differently than relational tables, and they are categorized depending on the way they store the data [18]. Over time, four major types of NoSQL databases have emerged: document databases, key-value databases, wide-column stores, and graph databases [19]. The majority of reasoning engines utilize NoSQL databases and more specifically graph databases. This kind of database has built-in inference engines to manage the stored data. For this development, and considering the graph database utilization, Neo4j (https://neo4j.com/ accessed date 29 December 2021) [20] is broadly used in reasoning engine use cases. Graph databases have features including reliability, high availability, fast response, and a high level of replication [21]. These characteristics make this kind of database widely used in various sectors such as banking, networking, and aviation. The main advantage of using a graph database is the relationship established between the element and the power of inference that this structure provides. Therefore, they are mainly used in fraud detection, graph-based search, intelligent querying, and real time traffic managements and recommendations.
One of the use-cases where the Neo4j graph database was used is the case of the “Panama Papers”, where the International Consortium of Investigative Journalists utilized Neo4j to store and process information provided by the whole journalist network [22].
Another real-world use case where a graph database was used is the one related to the multinational retail corporation, Walmart, which used it for the improvement of the customer experience in its stores. More specifically, Neo4j data science algorithms were leveraged to measure centrality, betweenness, and similarity. This resulted in the replacement of the old, low-latency legacy systems by Neo4j that provided recommendations and inference by combining historical and user session data [23].
Moreover, NBC News once made usage of Neo4j for the analysis of a vast number of tweets made by Russian agents during the 2016 U.S. Presidential election. What NBC was aiming to showcase was how Twitter was used as a communication channel to spread disinformation and stimulate division [24].
The presented use cases showcase how graph databases’ features, such as performance, flexibility, network management, and social interconnect, are used in real life applications to enhance their efficiency and to extract insights from data.
Cloud-computing applications that leverage graph databases currently produce large-scale big graphs and reasoning applications in order to extract interesting, meaningful, and exploitable insights and patterns from these data. As a result, analytics over graphs is now a top-tier challenge in database and reasoning research, and this has resulted in a fast-growing interest of this field from both the academical and the industrial community.
The big graph analytics problem arises in several application scenarios that belong to a wide range of fields. Following, an example of end-to-end processing and an example of graph time times are demonstrated.
The work of [25] focused on a framework that supports end-to-end graph processing, achieved by proceeding to complex neighborhood-centric analysis over big graphs in Cloud environments. This method is called NSCALE. NCALE introduces an abstraction that not only allows reasoning on graph analytics via sub-graphs, but also supports two metrics of utter importance: performance and memory optimization.
The work of [26] provides architecture and main functionalities of a tool known as VERTEXICA. VERTEXICA supports big graph analytics, and the main benefit it provides is that it works on top of relational DBMS. Using VERTEXICA, the end-users can avoid the restrictions that arise from the usage of plain SQL statements. Instead, they are able to exploit natural vertex-centric interfaces for defining analytics over big graphs, where all the data management activities, including query processing, can be expressed via an intuitive graphical interface.
3. Methodology, Architecture, and Implementation
3.1. Methodology
The methodology, depicted in Figure 1, for the proposed Reasoning Engine architecture is based on the results of the state-of-the-art analysis and research and the need that arises for extracting information by leveraging rules and axioms from energy efficiency certificates. The next step was the identification of the datasets that could be potentially used for graphical representation. Then, the technical phase initiated with the consumption of the dataset using Confluent Kafka and the persistence and indexing of Neo4j graph storage. NeoSemantincs and graph data science plugins of Neo4j enabled the querying of stored data and finally the creation of REST APIs to expose the querying results.
3.2. Architecture
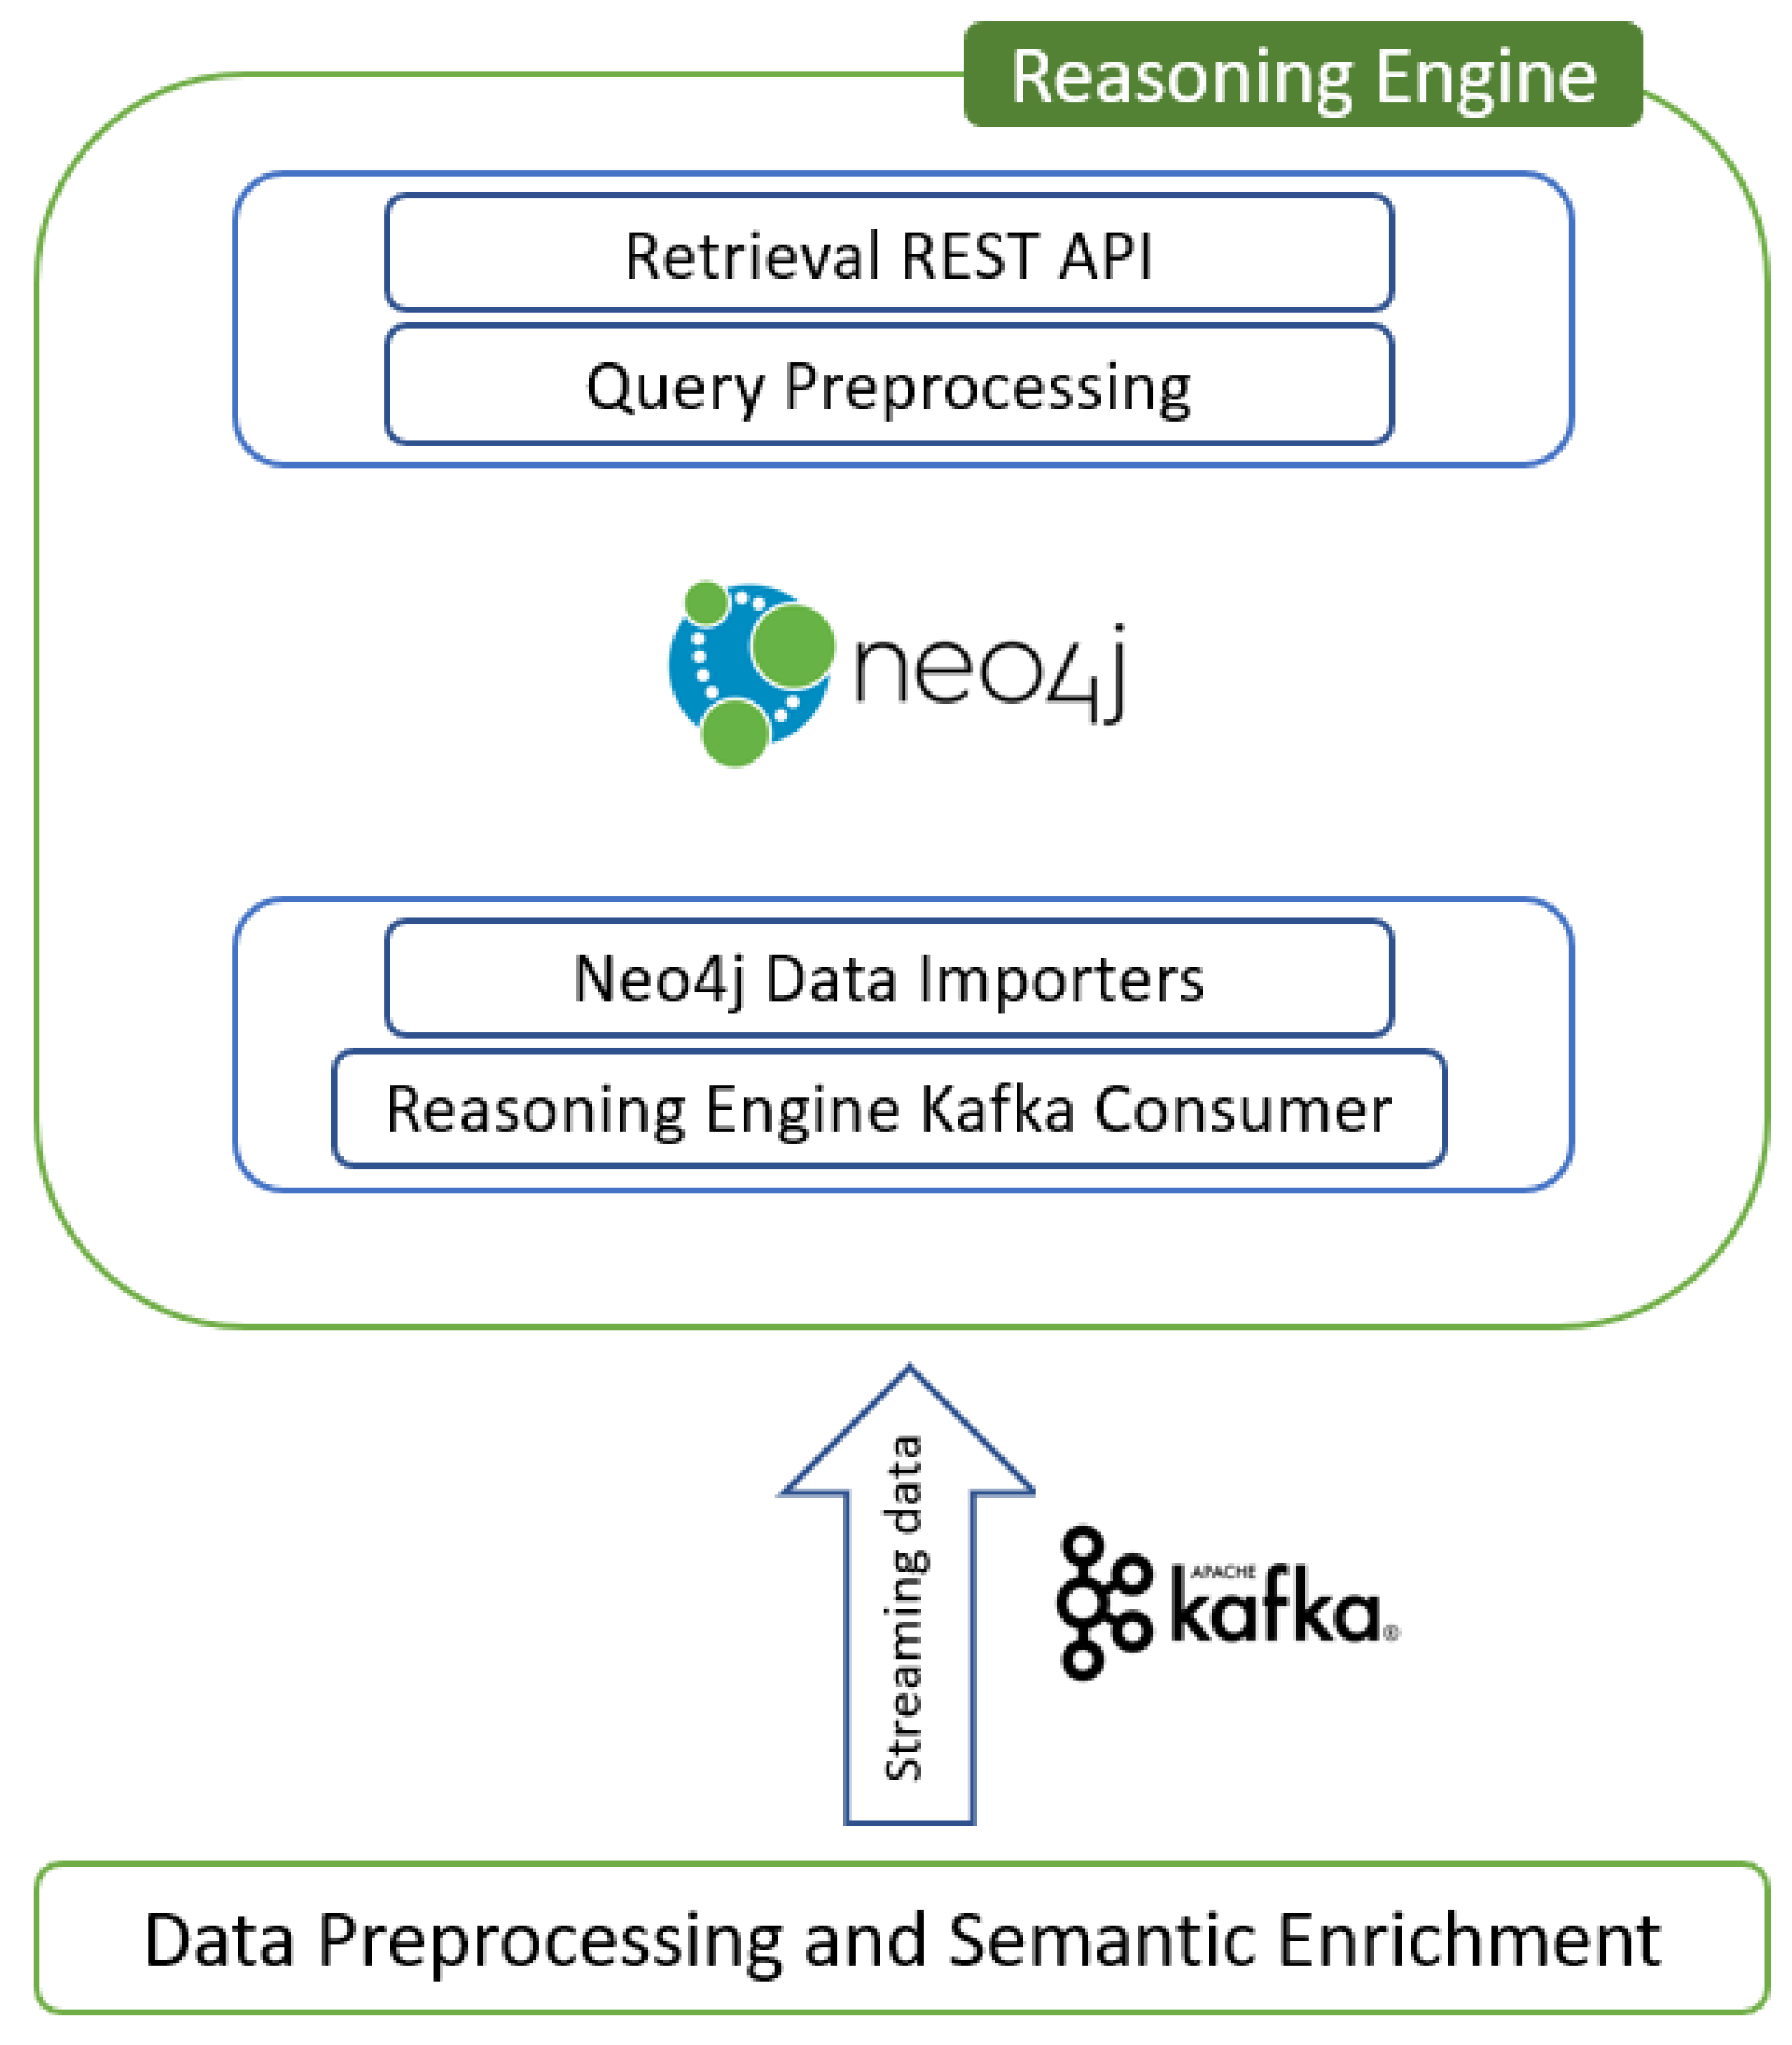
Figure 2 depicts the proposed architecture of the Reasoning Engine. As shown, the data are produced from the data pre-processing and semantic enrichment layer, where they are homogenized and pre-processed before being sent to the reasoning engine through Kafka topics.
The proposed architecture, Figure 2, consists of five components, namely the Reasoning Engine Kafka consumer, the Neo4j data importers, the Neo4j graph database, the query pre-processing, and the retrieval REST API.
The Reasoning Engine Kafka consumer is a Kafka consumer written in Python 3. It receives data from the data pre-processing and semantic enrichment layer. These are JSON or RDF data that contain EREN energy performance certificates. The consumer receives these data and sends them to the Neo4j data importers (https://neo4j.com/developer/data-import/ accessed date 29 December 2021). This component is a series of CYPHER scripts that are connected with the Kafka (https://kafka.apache.org/ accessed date 29 December 2021) consumer through Neo4j Python Driver. The consumed JSON data are channelled to the CYPHER scripts, where they are transformed from JSON data to NEO4J entities (nodes and connections). The Neo4j data importers, as previously mentioned, enable several scripts in order to insert the data into Neo4j structures. After that, these data can be queried, and useful knowledge can derive from them. The Reasoning Engine also provides REST APIs for interacting with the stored metadata in Neo4j. This is the stage where the data are exposed to the upper layer though REST protocols, and it has two sub-components responsible for the overall functionality. The retrieval REST engine is where external users can submit queries to the Reasoning Engine using POST REST function and JSON payloads. The query pre-processing module receives the JSON data from retrieval REST engine and transforms the JSON data to CYPHER in order to query the Neo4j graph database. The result is the REST API’s response, and it is sent back in JSON format. The request presented in Table 1, is an example usage of Reasoning Engine’s REST API collection.
Furthermore, the Reasoning Engine component has integrated the neosemantics (https://neo4j.com/labs/neosemantics/ accessed date 29 December 2021) toolkit, which is used to upload ontologies, RDF data, and other semantic information, and transform them into Neo4j entities. CYPHER language is more flexible than SPARQL, and by leveraging Neo4j plugins such as graph data science, apoc, and neosemantics, the connections between metadata are more transparent.
3.3. Implementation
The implementation of the Reasoning Engine was initiated with the development of a Python Confluent Kafka (https://docs.confluent.io/platform/current/clients/consumer.html accessed date 29 December 2021) consumer, which was used for receiving JSON and RDF data from the data pre-processing and semantic enrichment layer. The Faust (https://faust.readthedocs.io/en/latest/ accessed date 29 December 2021) library, which is the Kafka Streams implementation in Python, was used to consume and process events from different time windows and to construct a real time and highly intensive data pipeline.
Before proceeding with more implementation details, it is significant to present the EREN Energy Efficiency Certificates dataset. It consists of of ~300 K rows and 15 columns and contains primary building information, such as registration number, emissions, heating, and cooling demand. Table 2 demonstrates the dataset columns, with a short description for each column and sample values.
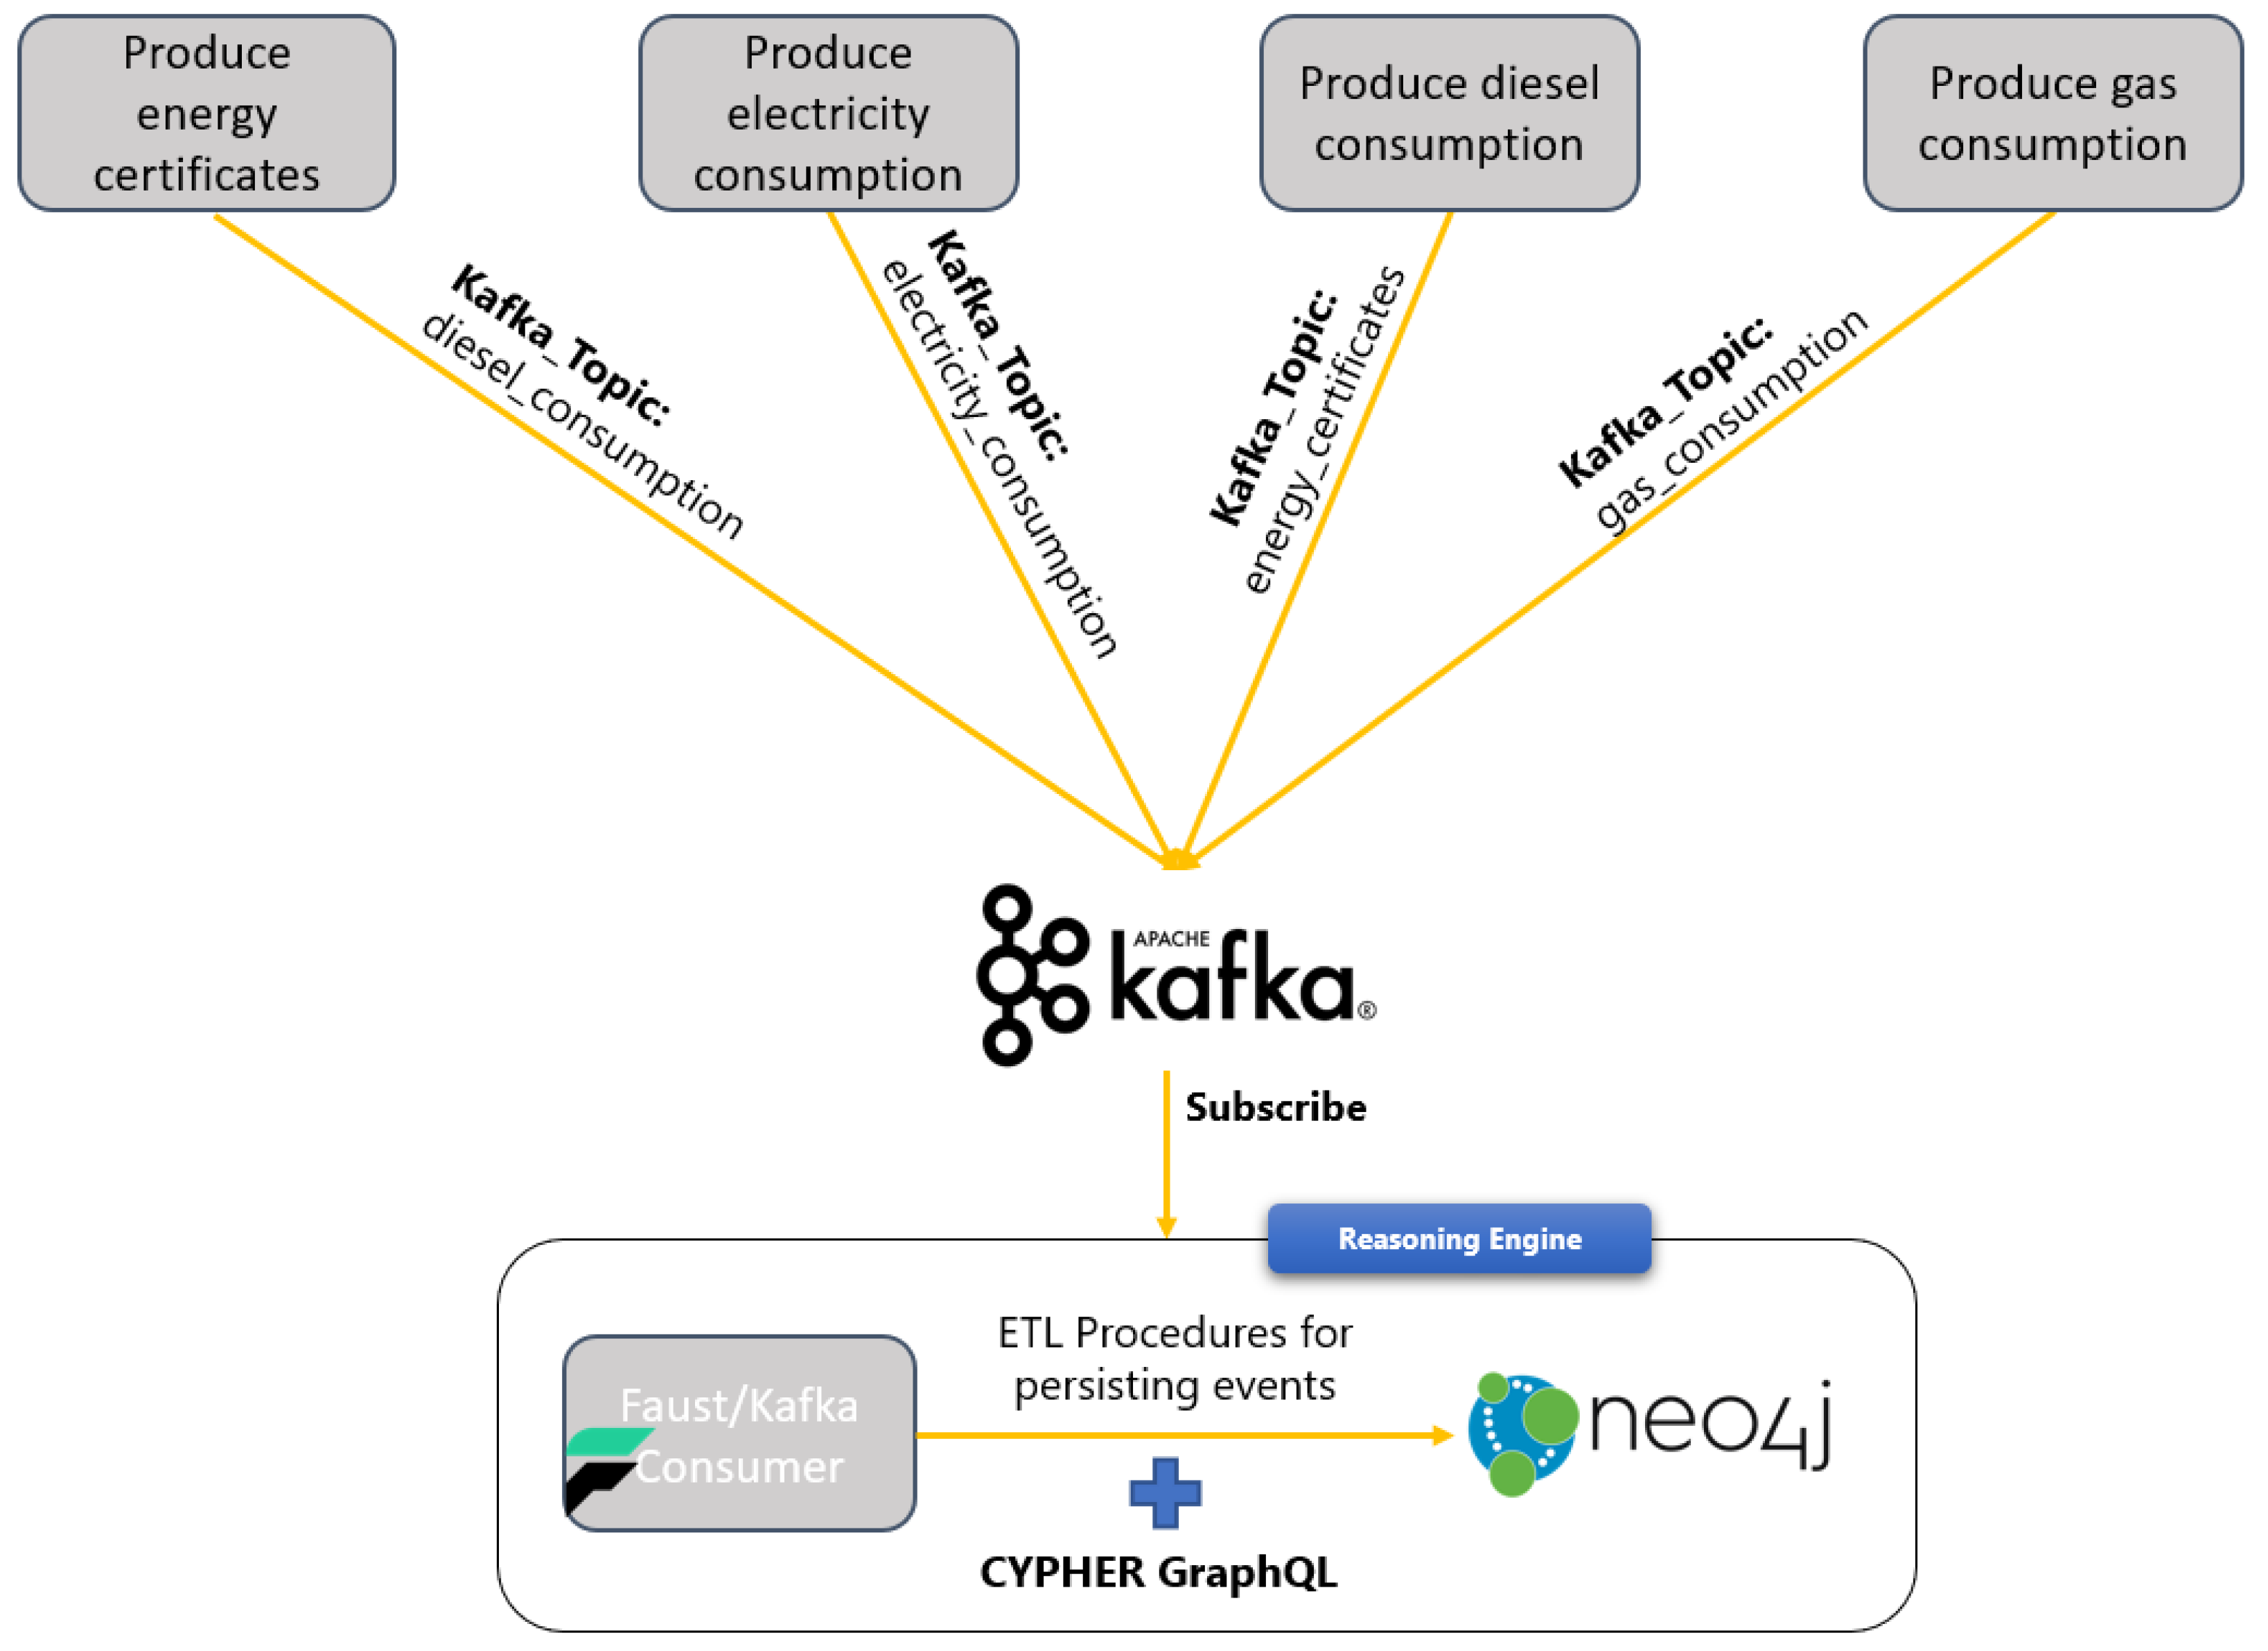
Figure 3 depicts the data flow in the Reasoning Engine Kafka consumer. More specifically, the EREN data are produced in four different Kafka topics (each topic is related to building data and attributes such as energy certificates, electricity, gas, and diesel consumption). The Faust/Kafka consumer is subscribed to all these topics, and it receives the incoming events. Following, it performs ETL (extract, transform, and load) procedures using the Pandas framework (https://pandas.pydata.org/ accessed date 20 December 2021), Neo4j Python Driver, and CYPHER GraphQL in order to persist them in the Neo4j graph database.
The CYPHER scripts that persist the consumed events to Neo4j are the reasoning data importers. These scripts receive JSON or RDF data and construct the entities in Neo4j in order to extract hidden patterns and value from buildings metadata. The metadata construction in the graph database aids the intelligent querying and inference over stored data and enhances the machine and deep learning model training. The data from the Reasoning Engine Kafka consumer are channelled to the Reasoning Engine data importers through Neo4j Python Driver. Figure 4 depicts the data flow from the Reasoning Engine consumer through data importers and subsequently to Neo4j.
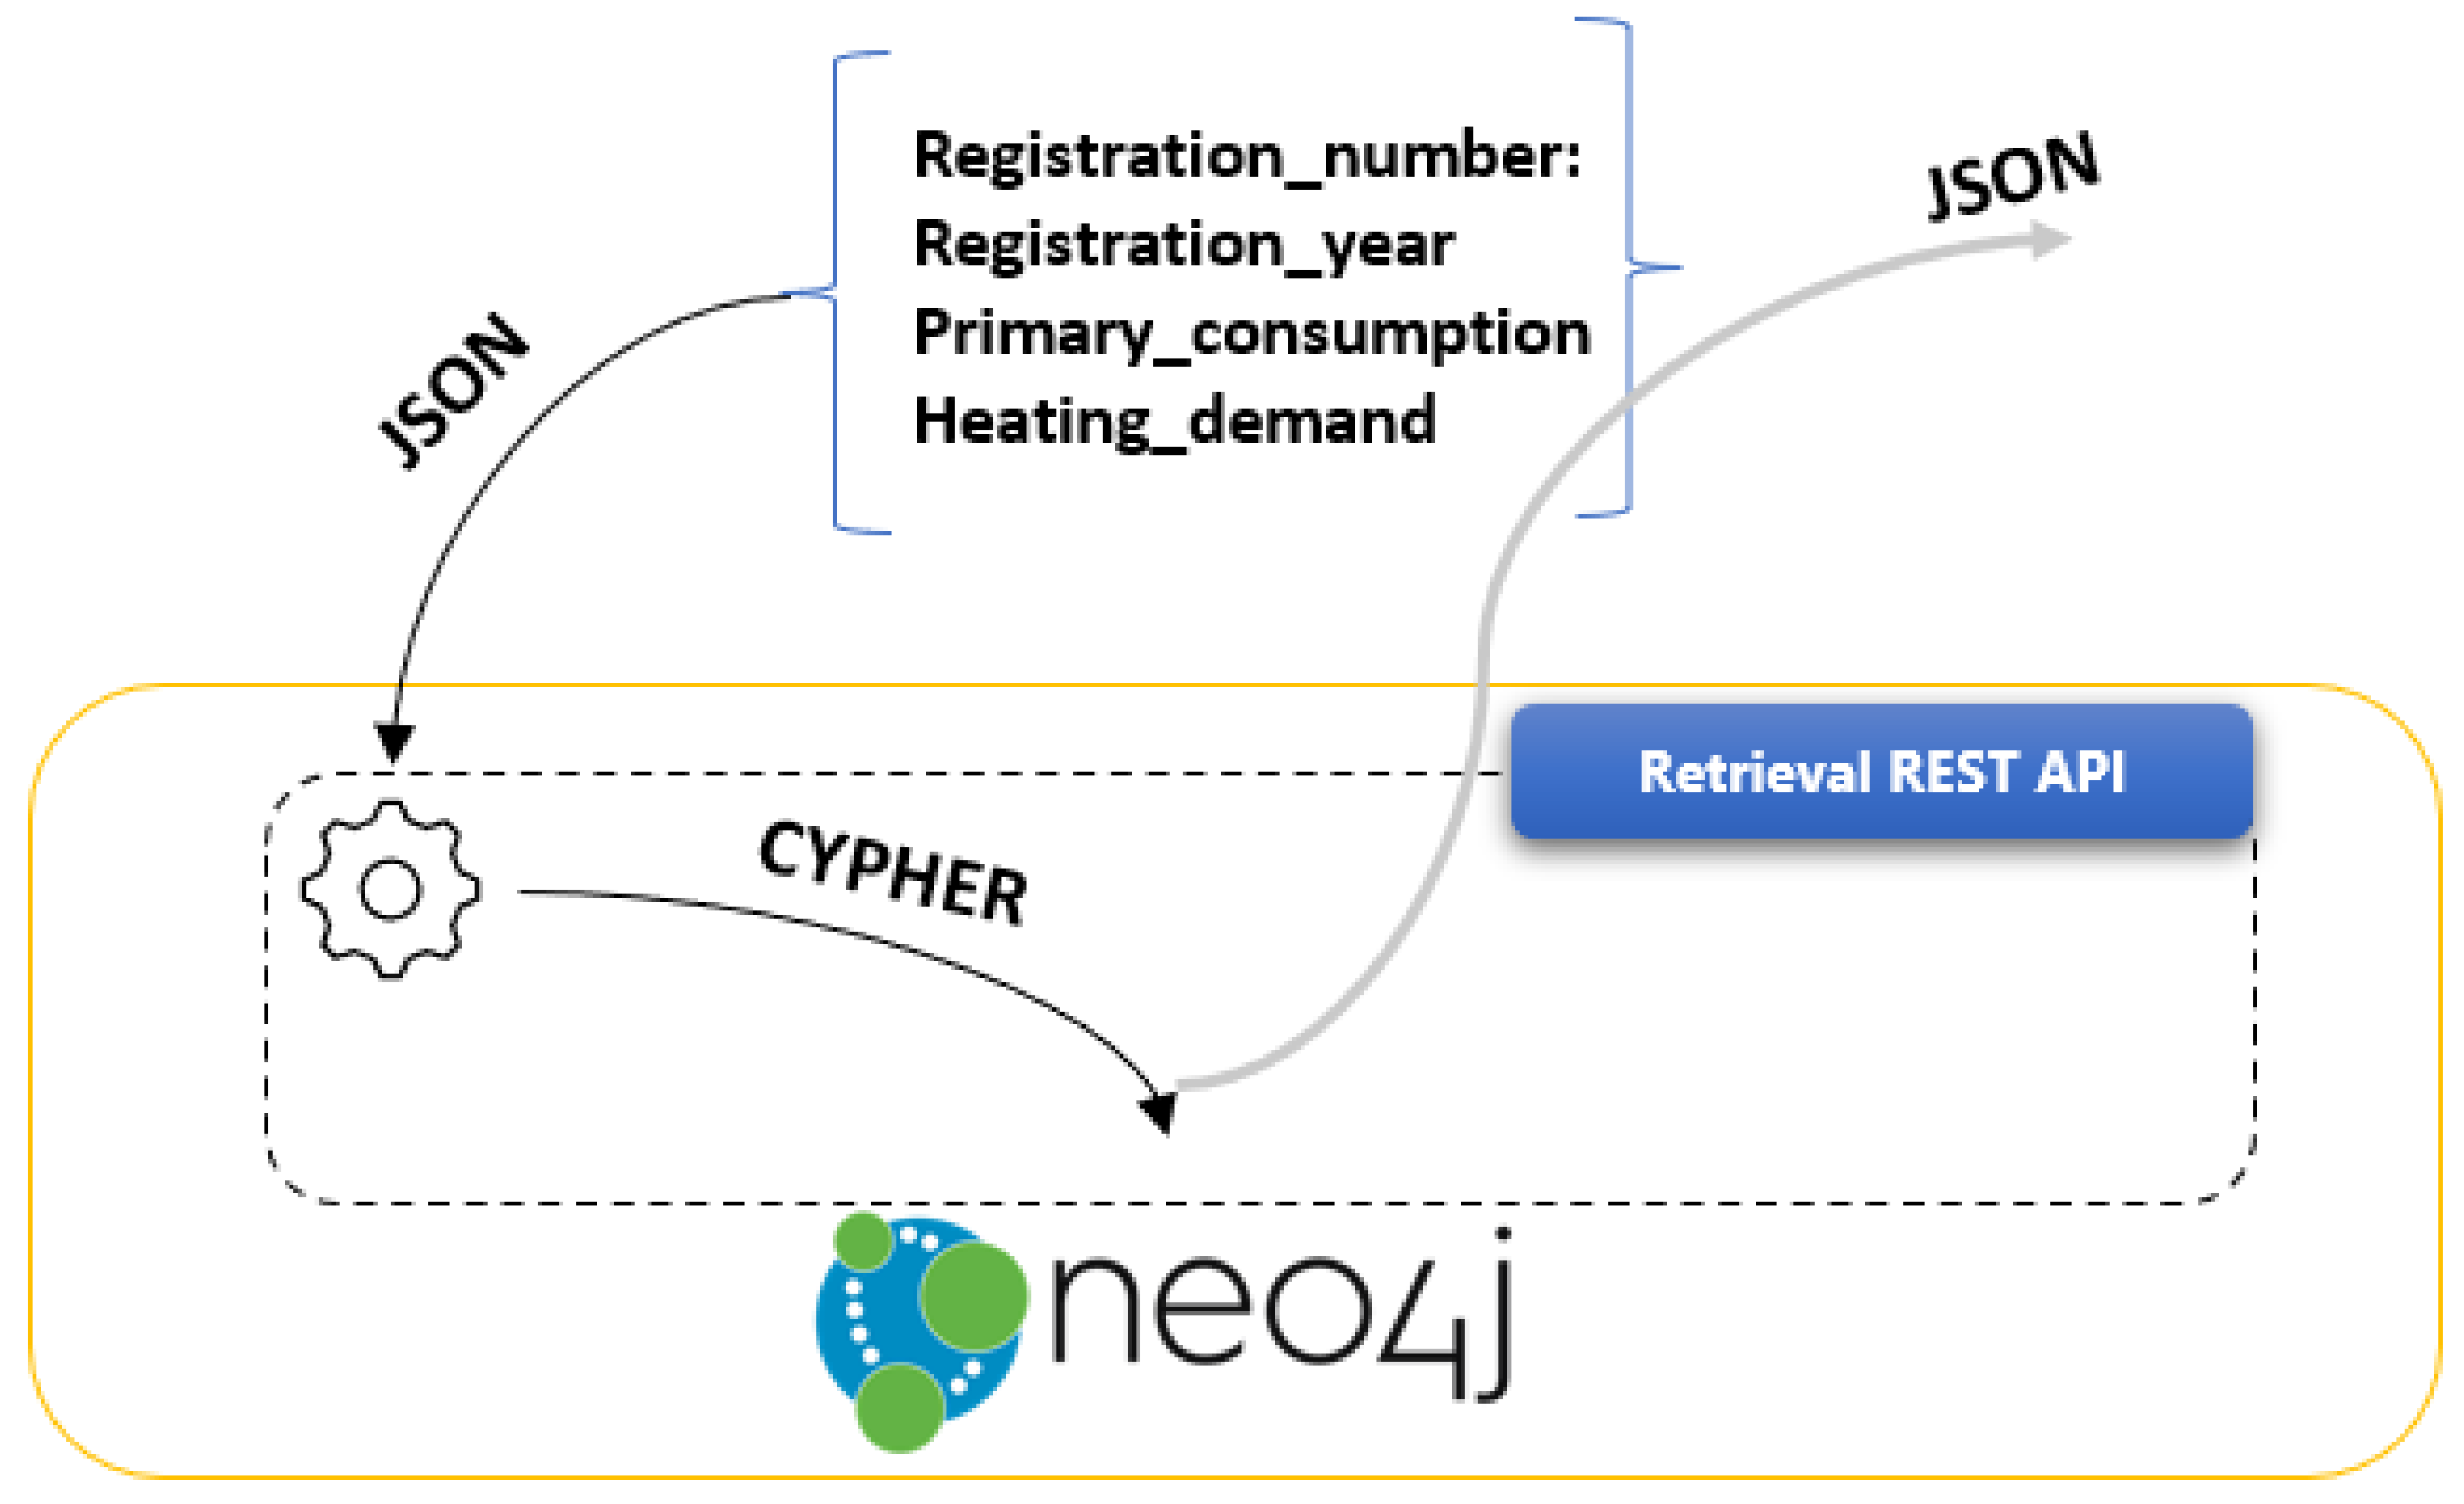
The Retrieval REST API, which flow is depicted in Figure 5, is the collection of REST services that expose the stored Neo4j entities on the upper layers of ANALYTICS layer. It was implemented using Flask REST Framework (https://flask-restful.readthedocs.io/en/latest/ accessed date 23 December 2021), Pandas DataFrames (https://pandas.pydata.org/pandas-docs/stable/reference/api/pandas.DataFrame.html accessed date 23 December 2021) and Neo4j Python Driver (https://neo4j.com/docs/api/python-driver/current/ accessed date 23 December 2021). The services are triggered by HTTP requests that have been submitted. The provided JSON payloads are parsed from the query pre-processing module, which translates the JSON attributes to CYPHER queries.
4. Results
In this section, the data flow through the Reasoning Engine’s sub-components are demonstrated. More specifically, the results from the Reasoning Engine Kafka consumer, the data represented in the graph database, and queries using the Reasoning Engine Retrieval REST API will be presented.
4.1. Data Flow in Reasoning Engine Kafka Consumer
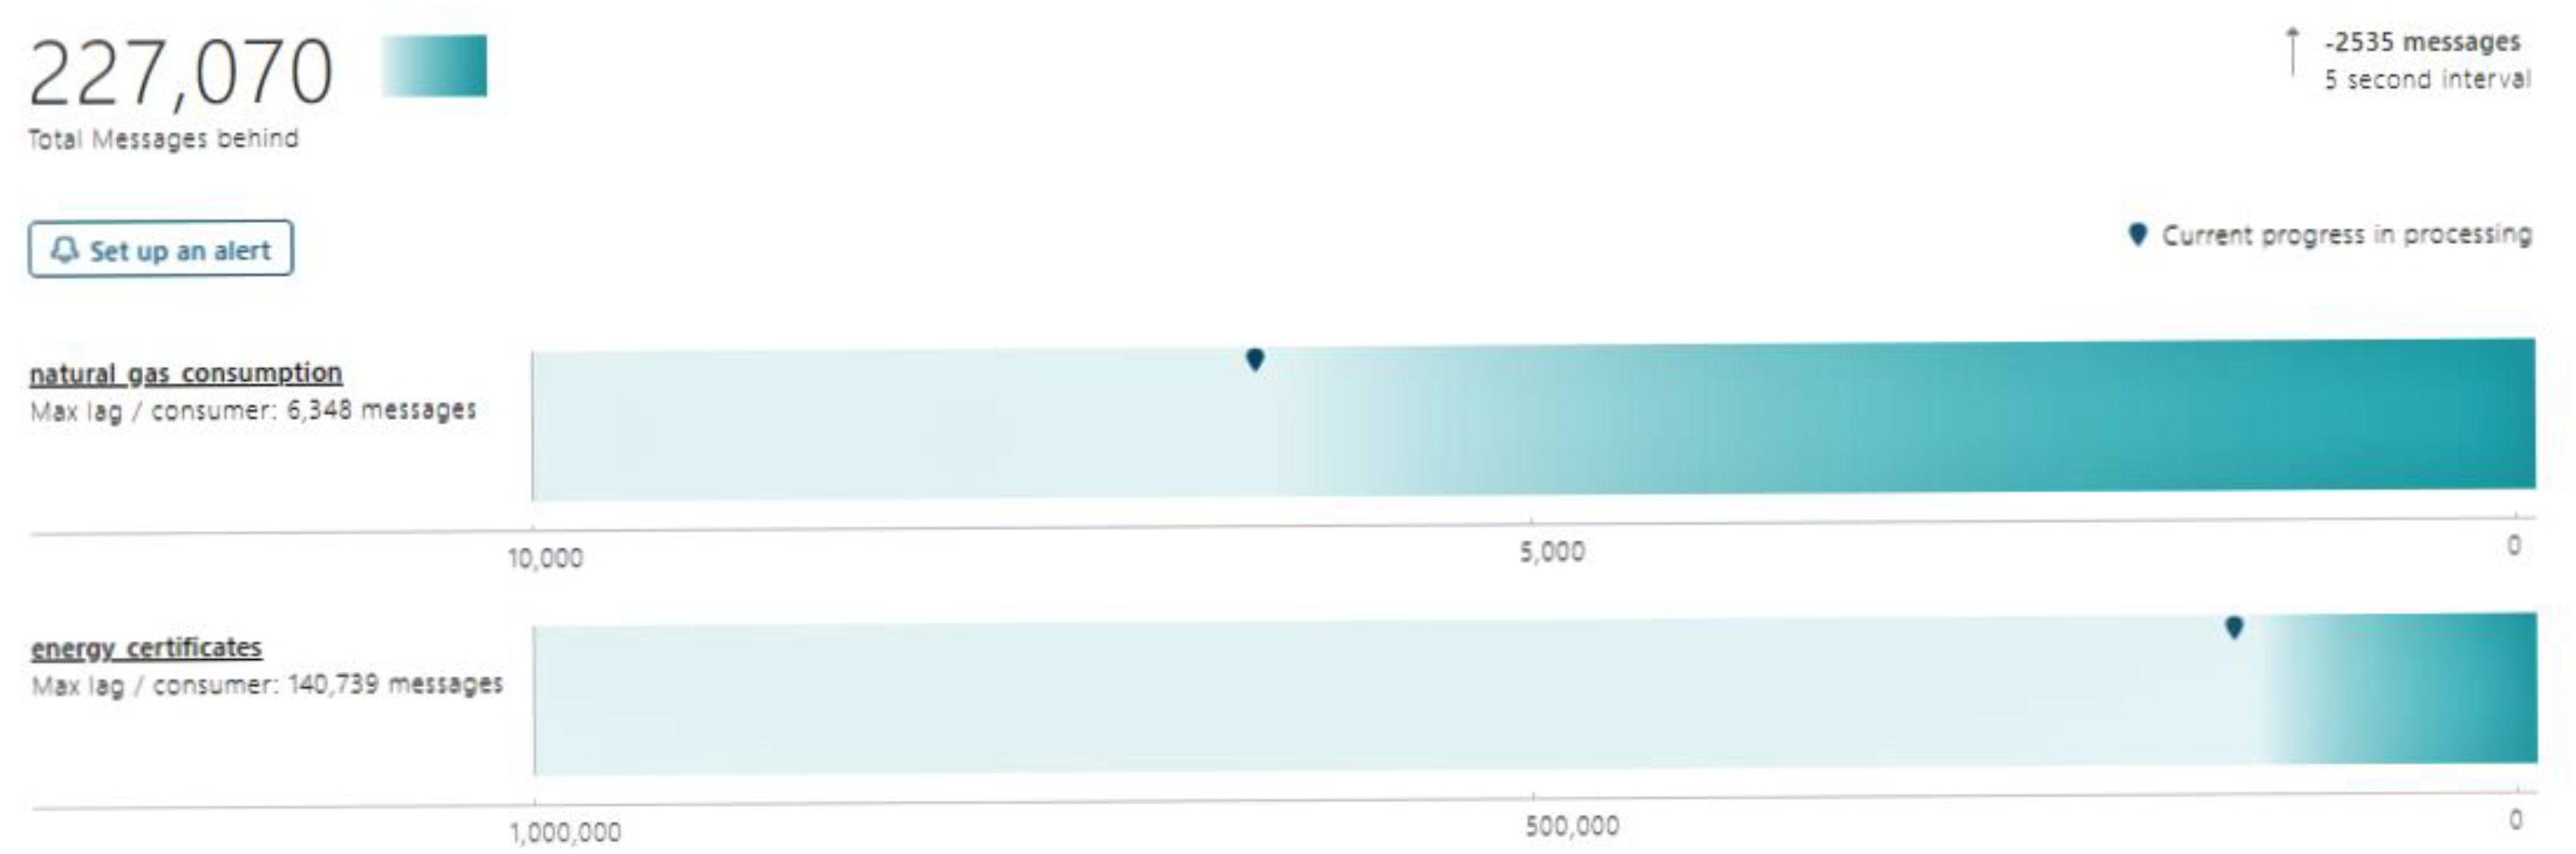
The data from the data pre-processing and semantic enrichment module are produced to Apache Kafka in JSON format. The EREN energy certificates, electricity consumption, diesel consumption, and gas consumption data are produced, respectively, to the topics “energy_certificates”, “electricity_consumption”, “diesel_consumption”, and “gas_consumption”. The Reasoning Engine Kafka consumer is subscribed to these four different topics and receives the data using the window functionality of Python Faust library in order to operate batch insert functionalities in the following steps. Figure 6 demonstrates the queued data in the Reasoning Engine consumer.
The goal of this task is to consume events originated from the “energy_certificates” Kafka topic, and these messages are in the format presented in Table 2. Following the events’ consumption, the incoming data are persisted into the Neo4j graph database. The pipeline that stores these data builds the graph entities using CYPHER and semantics plugins of Neo4j, enables the axioms and rules of graph properties, and leverages the metadata connection for the formation of logical inferences.
The Reasoning Engine exposes stored data via the REST services that it exposes. The end user is given the capability of submitting general CYPHER queries to Neo4j. In additional to this general-purpose functionality, prepared queries are also implemented. In this case, the input of the REST APIs is JSON formatted objects which, specifically, include building attributes (e.g., registration number, registration date, primary consumption, address, etc.). Below, some REST APIs are demonstrated. The queries conducted with the Reasoning Engine functionalities can vary; they can either be very simple (e.g., selection of top building certificates) or much more sophisticated queries (e.g., similarity queries or queries that enable graph data science plugin and calculate clusters over the stored graph entities).
4.2. Graph Creation in Neo4j
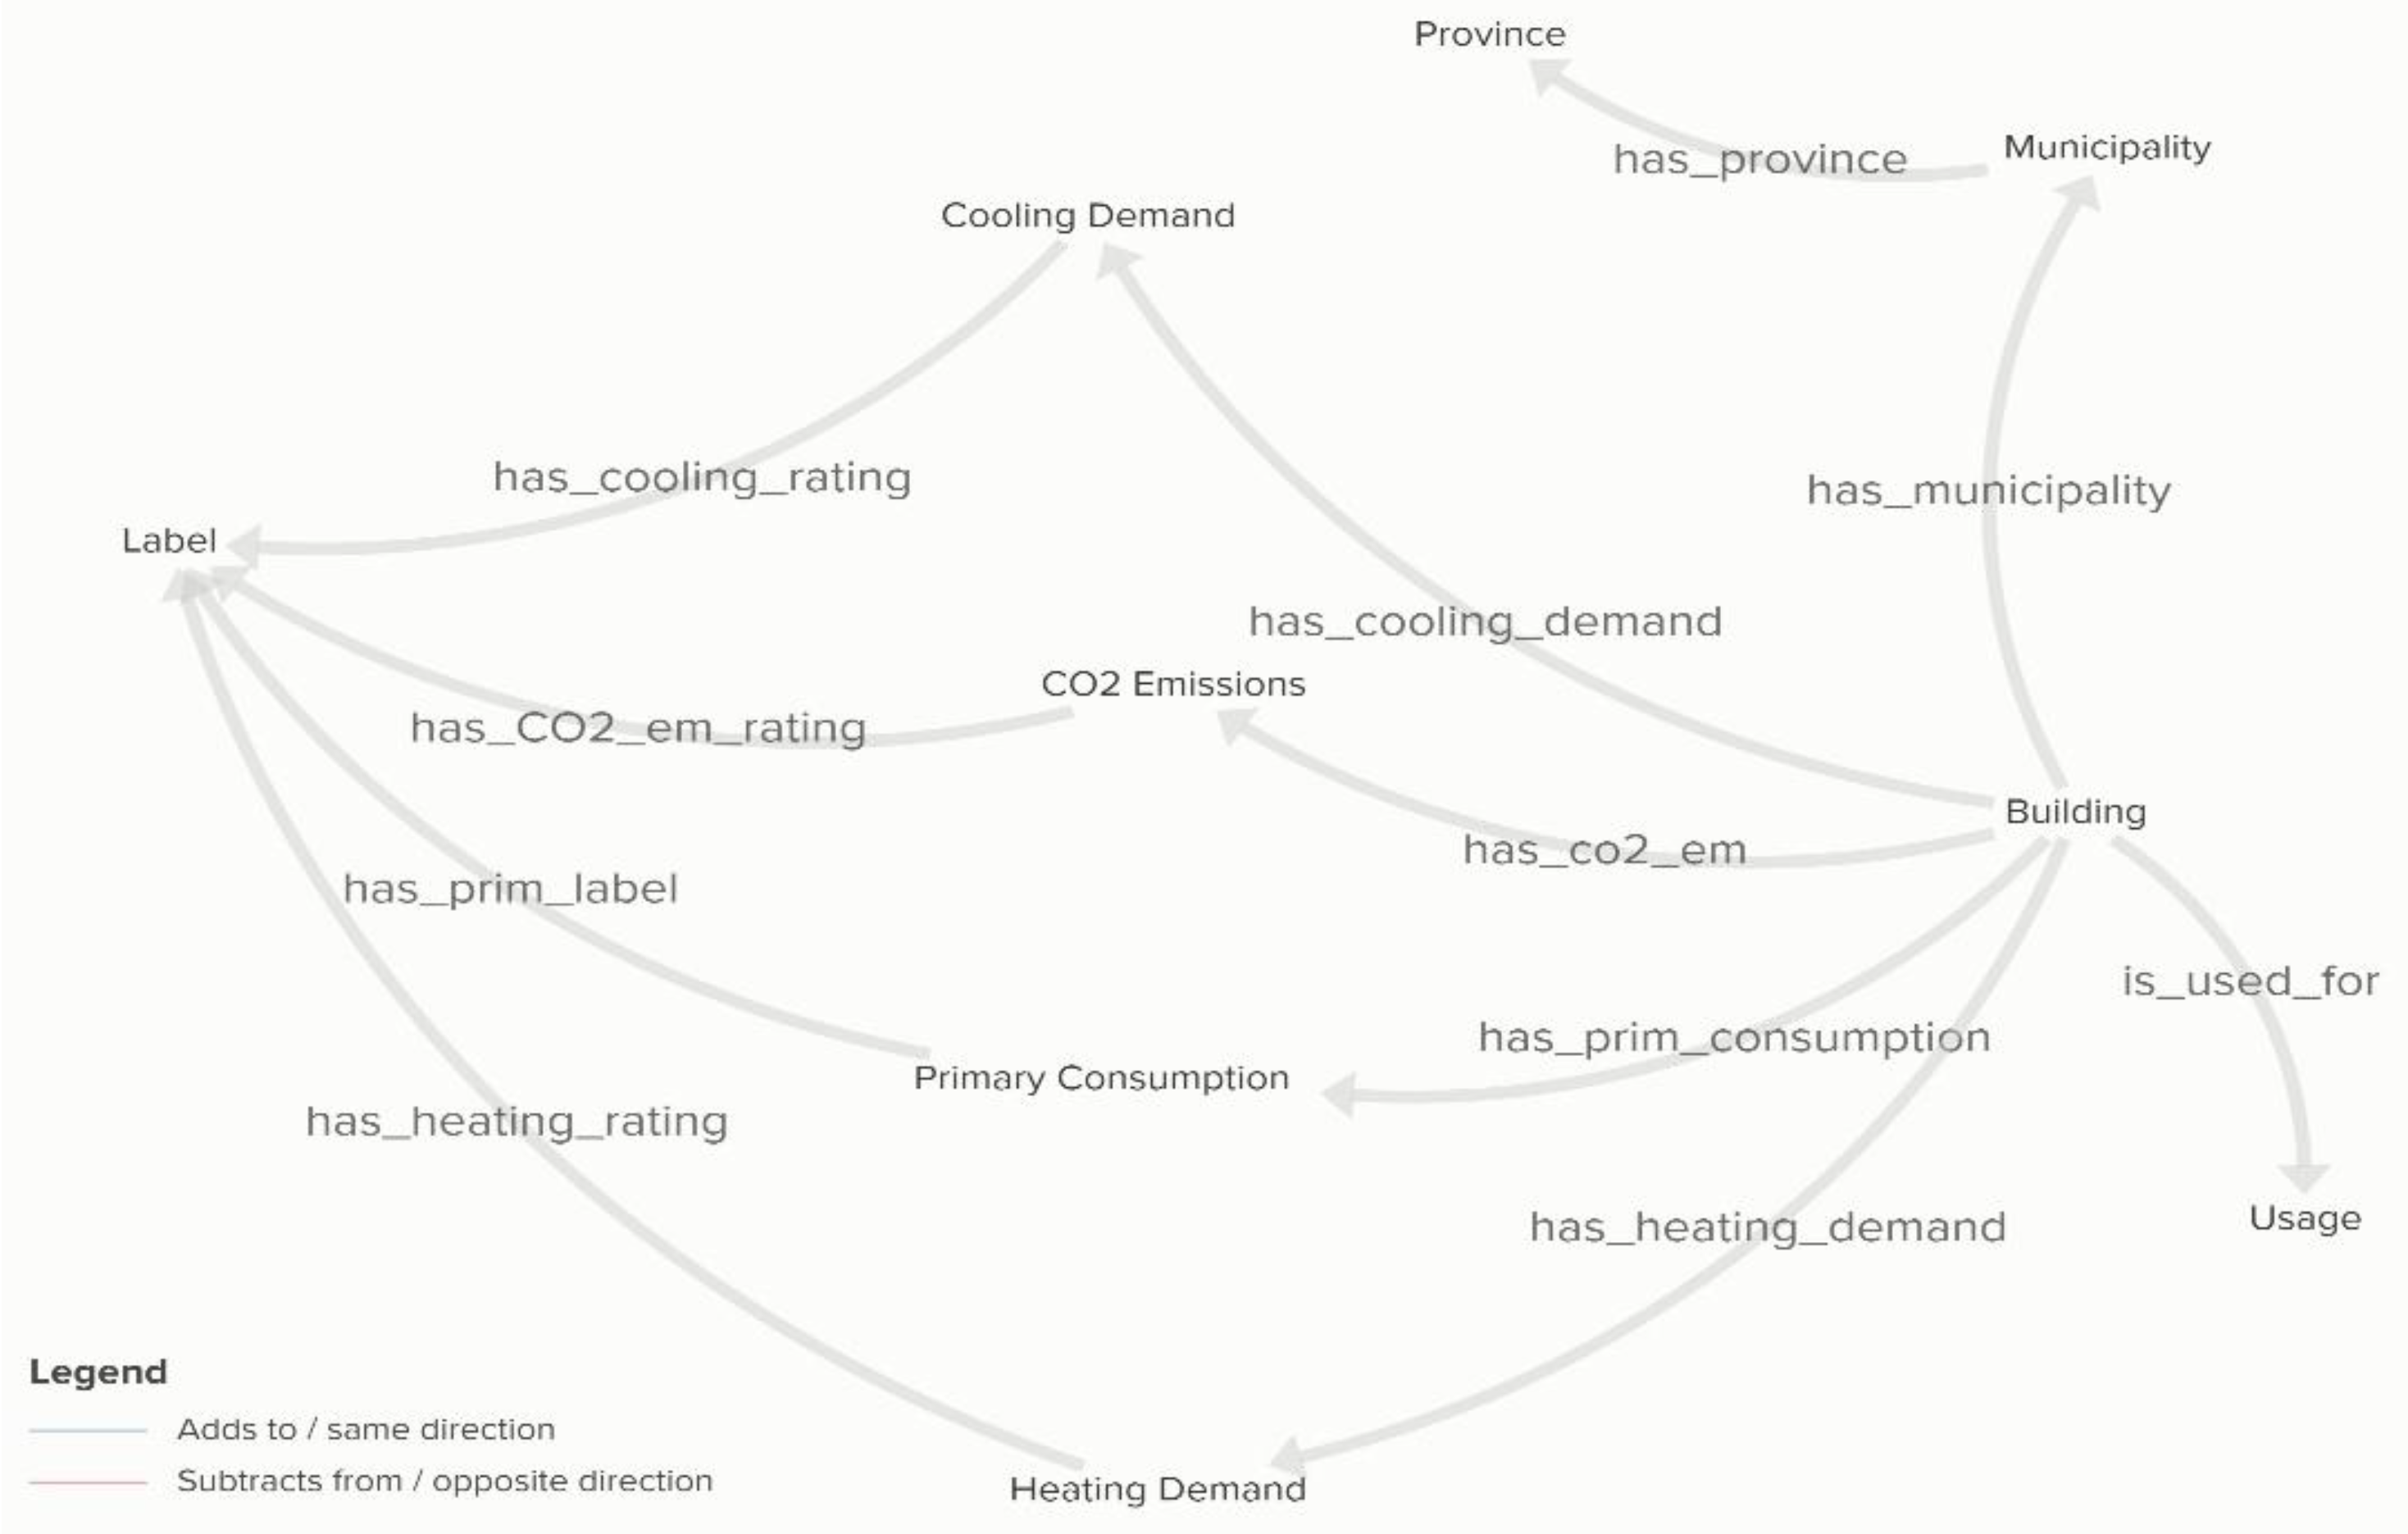
The Reasoning Engine Kafka consumer enables batch insertion by leveraging the Neo4j Data Importers. Figure 6 depicts the consumption of the incoming events from Reasoning Engine Kafka Consumer and the construction of Neo4j entities for each specific event from Neo4j Data Importers. These importers are a series of CYPHER scripts that receive the batch window data from the Kafka consumer and persist the JSON data to the Neo4j graph database. The embedded JSON objects are now transformed to graph entities. As a result, the data querying will be more effective and significantly faster using graph functionalities. Figure 7 depicts the resulting graph in Neo4j.
4.3. Retrieve Data from Reasoning Engine
The data retrieval process from Reasoning Engine is conducted through its REST API. The Reasoning Engine retrieval REST API leverages the Python Neo4j Driver and CYPHER to query the stored EREN data that are structured in graph format. The following REST API call calculates the average primary consumption of buildings classified with primary consumption A.
The response received from the Retrieval REST API, which includes the requested average primary consumption of buildings, is presented in Table 3. The REST API receives CYPHER queries and, on its backend, transforms the aforementioned query result from Neo4j entities to JSON.
The query could be extended in order to find the average primary consumption of buildings located in ABRADA municipality. The new query sent to the Reasoning Engine is demonstrated in Table 4. The following tables (Table 4 and Table 5) demonstrate some queries from Reasoning Engine Retrieval REST API.
The response, Table 6, received from the Retrieval REST API is the average consumption requested.
5. Conclusions
This paper presented a metadata-driven component that aims to combine existing modern technological breakthroughs in the areas of the machine learning/deep learning and big data in order to develop a new data analytics solution for energy management and energy-efficient buildings. The proposed approach realizes a holistic, state-of-the-art semantics empowered module for the buildings sector.
The prediction of a building’s energy consumption is of utter importance since the main goal of today’s society is to maintain and protect the natural environment and modernize the urban infrastructure. The architecture that we propose provides the necessary capabilities for boosting scalable big data management and semantics processing, with a vision to reduce some of the major hindrance of previous RDFs (resource description frameworks) and ontologies solutions. This can be achieved by introducing innovative graph databases capable of handling semantic data in a more efficient and meaningful way.
The ideal AI models should be able to predict the energy consumption of the related buildings, and, for that reason, the Reasoning Engine component leverages these building’s metadata in order to produce information that can be utilized for the optimization of these AI models. The Reasoning Engine that was introduced will be used to aim at solving problems that may constitute building blocks for more complex problems, such as energy performance prediction, multi-criteria assessment of building interventions, etc.
As future work, the Reasoning Engine graph database will be enriched with further datasets from large-scale pilots in order to combine metadata from different sources and generate more specific and detailed information for different kinds of buildings.
Furthermore, the results of inferences from the Reasoning Engine will be used for data enrichment on a data warehouse system. This system will be based on query engine technologies such as Presto (https://prestodb.io/ accessed date 26 December 2021), Apache Druid (https://druid.apache.org/ accessed date 26 December 2021) and Hive (https://hive.com/ accessed date 26 December 2021) and will aggregate information and queries from multiple sources of data. These data will be enhanced with inference results, and then they could be visualized from a data warehouse system visualization engine that could be implemented in future work with a vision to expand the current architecture. This type of connection could be established by using the microservices-oriented nature of the Reasoning Engine and the fact that it exposes a number of REST APIs. These REST APIs can be integrated with other systems that support the HTTP protocol.
Author Contributions
Conceptualization, P.K. and K.A.; methodology, G.K.; software, P.K.; validation, P.K., G.K. and K.A.; formal analysis, P.K.; investigation, K.A.; resources, G.K.; data curation, P.K.; writing—original draft preparation, P.K., G.K. and K.A.; writing—review and editing, P.K., G.K. and K.A.; visualization, P.K.; supervision, D.A.; project administration, D.A. All authors have read and agreed to the published version of the manuscript.
Funding
This work has been co-funded from the European Union’s Horizon 2020 research and innovation program under the MATRYCS project ‘Modular Big Data Applications for Holistic Energy Services in Buildings’, grant agreement No 101000158.
Institutional Review Board Statement
Not applicable.
Informed Consent Statement
Not applicable.
Data Availability Statement
The datasets used for Reasoning Engine’s implementation can be found in the following url: https://analisis.datosabiertos.jcyl.es/explore/dataset/certificados-de-eficiencia-energetica/export/?location=10,41.15005,-2.43043&basemap=jawg.streets, accessed date 26 December 2021.
Conflicts of Interest
The authors declare no conflict of interest. The funders had no role in the design of the study; in the collection, analyses, or interpretation of data; in the writing of the manuscript, or in the decision to publish the results.
Abbreviations
| Definition | |
| AI | Artificial Intelligence |
| APACHE | APACHE SOFTWARE FOUNDATION |
| API | Application Programming Interface |
| BDVC | Big Data Value Chain |
| CYPHER | Neo4j Graph Database Query Language |
| DL | Deep Learning |
| EREN | Regional Energy Agency in Spain |
| EPC | Energy Performance Certificates |
| GraphQL | Graphical Query Language |
| HTTP | Hypertext Transfer Protocol Secure |
| IoT | Internet of Things |
| JSON | JavaScript Object Notation |
| ML | Machine Learning |
| ML/DL | Machine Learning/Deep Learning |
| REST | Representational State Transfer |
| RDF | Resource Description Framework |
| SPARQL | Semantic Query Language |
References
- Helm, D. The European Framework for Energy and Climate Policies. Energy Policy 2014, 64, 29–35. [Google Scholar] [CrossRef]
- Energy Performance of Buildings Directive—European Commission. Available online: https://ec.europa.eu/energy/en/topics/energy-efficiency/energy-performance-of-buildings/energy-performance-buildings-directive (accessed on 16 December 2021).
- Energy Efficiency Directive—European Commission. Available online: https://ec.europa.eu/energy/topics/energy-efficiency/targets-directive-and-rules/energy-efficiency-directive_en (accessed on 16 December 2021).
- Lu, Q.; Parlikad, A.; Woodall, P.; Don Ranasinghe, G.; Xie, X.; Liang, Z.; Konstantinou, E.; Heaton, J.; Schooling, J. Developing A Digital Twin at Building and City Levels: Case Study of West Cambridge Campus. J. Manag. Eng. 2020, 36, 05020004. [Google Scholar] [CrossRef]
- Marinakis, V.; Doukas, H. An Advanced Iot-Based System for Intelligent Energy Management in Buildings. Sensors 2018, 18, 610. [Google Scholar] [CrossRef] [PubMed] [Green Version]
- Marinakis, V.; Doukas, H.; Karakosta, C.; Psarras, J. An Integrated System for Buildings’ Energy-Efficient Automation: Application in the Tertiary Sector. Appl. Energy 2013, 101, 6–14. [Google Scholar] [CrossRef]
- Marinakis, V.; Karakosta, C.; Doukas, H.; Androulaki, S.; Psarras, J. A Building Automation and Control Tool for Remote and Real Time Monitoring of Energy Consumption. Sustain. Cities Soc. 2013, 6, 11–15. [Google Scholar] [CrossRef]
- Marinakis, V. Big Data for Energy Management and Energy-Efficient Buildings. Energies 2020, 13, 1555. [Google Scholar] [CrossRef] [Green Version]
- Marinakis, V.; Doukas, H.; Koasidis, K.; Albuflasa, H. From Intelligent Energy Management to Value Economy through a Digital Energy Currency: Bahrain City Case Study. Sensors 2020, 20, 1456. [Google Scholar] [CrossRef] [PubMed] [Green Version]
- Marinakis, V.; Doukas, H.; Tsapelas, J.; Mouzakitis, S.; Sicilia, Á.; Madrazo, L.; Sgouridis, S. From Big Data to Smart Energy Services: An Application for Intelligent Energy Management. Future Gener. Comput. Syst. 2020, 110, 572–586. [Google Scholar] [CrossRef]
- Wei, Y.; Zhang, X.; Shi, Y.; Xia, L.; Pan, S.; Wu, J.; Han, M.; Zhao, X. A Review of Data-Driven Approaches for Prediction and Classification of Building Energy Consumption. Renew. Sustain. Energy Rev. 2018, 82, 1027–1047. [Google Scholar] [CrossRef]
- Marinakis, V.; Doukas, H.; Spiliotis, E.; Papastamatiou, I. Decision Support for Intelligent Energy Management in Buildings Using the Thermal Comfort Model. Int. J. Comput. Intell. Syst. 2017, 10, 882. [Google Scholar] [CrossRef] [Green Version]
- Papadakos, G.; Marinakis, V.; Konstas, C.; Doukas, H.; Papadopoulos, A. Managing the Uncertainty of the U-Value Measurement Using an Auxiliary Set along with a Thermal Camera. Energy Build. 2021, 242, 110984. [Google Scholar] [CrossRef]
- Ahmad, T.; Chen, H.; Huang, R.; Yabin, G.; Wang, J.; Shair, J.; Azeem Akram, H.; Hassnain Mohsan, S.; Kazim, M. Supervised Based Machine Learning Models for Short, Medium and Long-Term Energy Prediction in Distinct Building Environment. Energy 2018, 158, 17–32. [Google Scholar] [CrossRef]
- Sheng, G.; Hou, H.; Jiang, X.; Chen, Y. A Novel Association Rule Mining Method of Big Data for Power Transformers State Parameters based on Probabilistic Graph Model. IEEE Trans. Smart Grid 2018, 9, 695–702. [Google Scholar] [CrossRef]
- Miller, J.J. Graph database applications and concepts with Neo4j. In Proceedings of the Southern Association for Information Systems Conference, Atlanta, GA, USA, 23–24 March 2013; Volume 2324. [Google Scholar]
- Vukotic, A.; Watt, N. Neo4j in Action; Manning: Shelter Island, NY, USA, 2015. [Google Scholar]
- Kunda, D.; Phiri, H. A Comparative Study of NoSQL and Relational Database. Zamb. ICT J. 2017, 1, 1–4. [Google Scholar] [CrossRef]
- Angles, R. A Comparison of Current Graph Database Models. In Proceedings of the 2012 IEEE 28th International Conference on Data Engineering Workshops, Arlington, VA, USA, 1–5 April 2012. [Google Scholar]
- Guia, J.; Gonçalves Soares, V.; Bernardino, J. Graph Databases: Neo4j Analysis. In Proceedings of the 19th International Conference on Enterprise Information Systems, Porto, Portugal, 26–29 April 2017. [Google Scholar]
- Mary Femy, P.F.; Reshma, K.R.; Varghese, S.M. Outcome Analysis Using Neo4j Graph Database. Int. J. Cybern. Inform. 2016, 5, 229–236. [Google Scholar]
- Cabra, M. How the ICIJ Used Neo4j to Unravel the Panama Papers. Available online: https://neo4j.com/blog/icij-neo4j-unravel-panama-papers/ (accessed on 29 October 2021).
- Packer, D. How Walmart Uses Neo4j for Retail Competitive Advantage. Available online: https://neo4j.com/blog/walmart-neo4j-competitive-advantage/ (accessed on 29 October 2021).
- Allen, D.; Hodler, A.; Hunger, M.; Knobloch, M.; Lyon, W.; Needham, M.; Voigt, H. Understanding trolls with efficient analytics of large graphs in neo4j. BTW 2019. [Google Scholar] [CrossRef]
- Quamar, A.; Deshpande, A.; Lin, J. NScale: Neighborhood-Centric Analytics on Large Graphs. Proc. VLDB Endow. 2014, 7, 1673–1676. [Google Scholar] [CrossRef]
- Jindal, A.; Rawlani, P.; Wu, E.; Madden, S.; Deshpande, A.; Stonebraker, M. Vertexica. Proc. VLDB Endow. 2014, 7, 1669–1672. [Google Scholar] [CrossRef]
Figure 1.
Methodology of the proposed Reasoning Engine architecture.
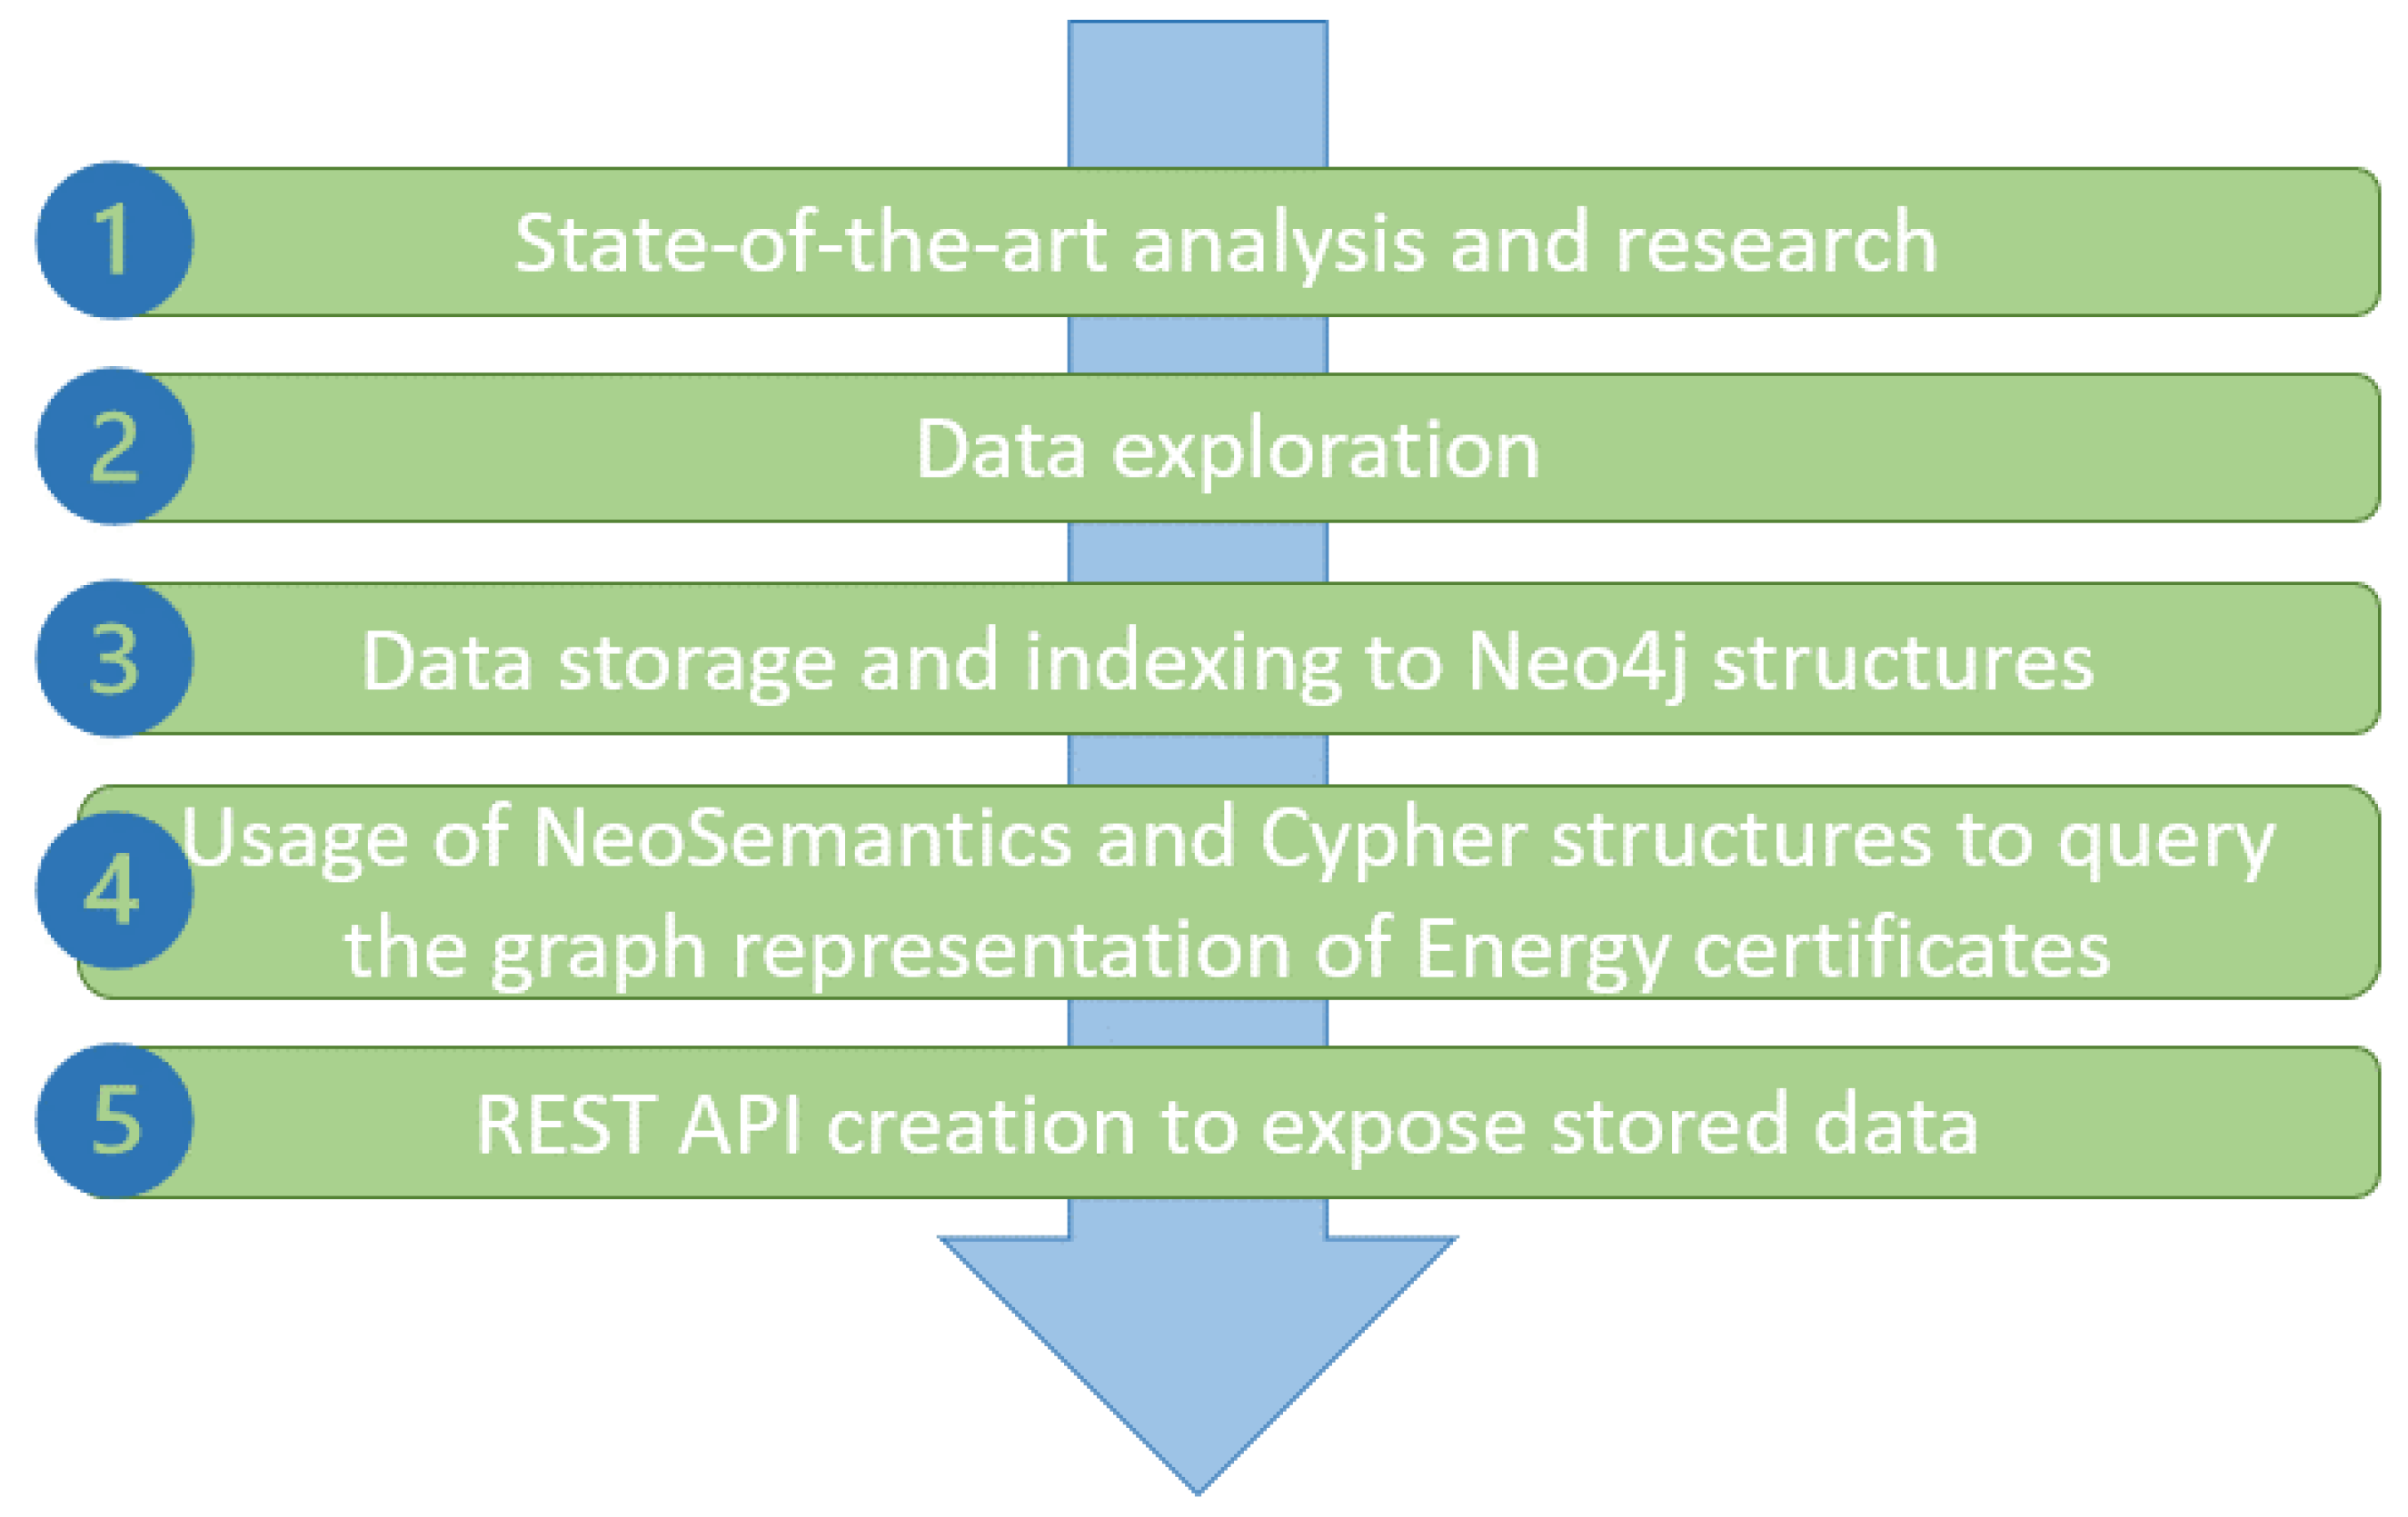
Figure 2.
Reasoning Engine proposed architecture.

Figure 3.
Data flow in the Reasoning Engine Kafka consumer.

Figure 4.
Data flow in the Reasoning Engine Kafka consumer.
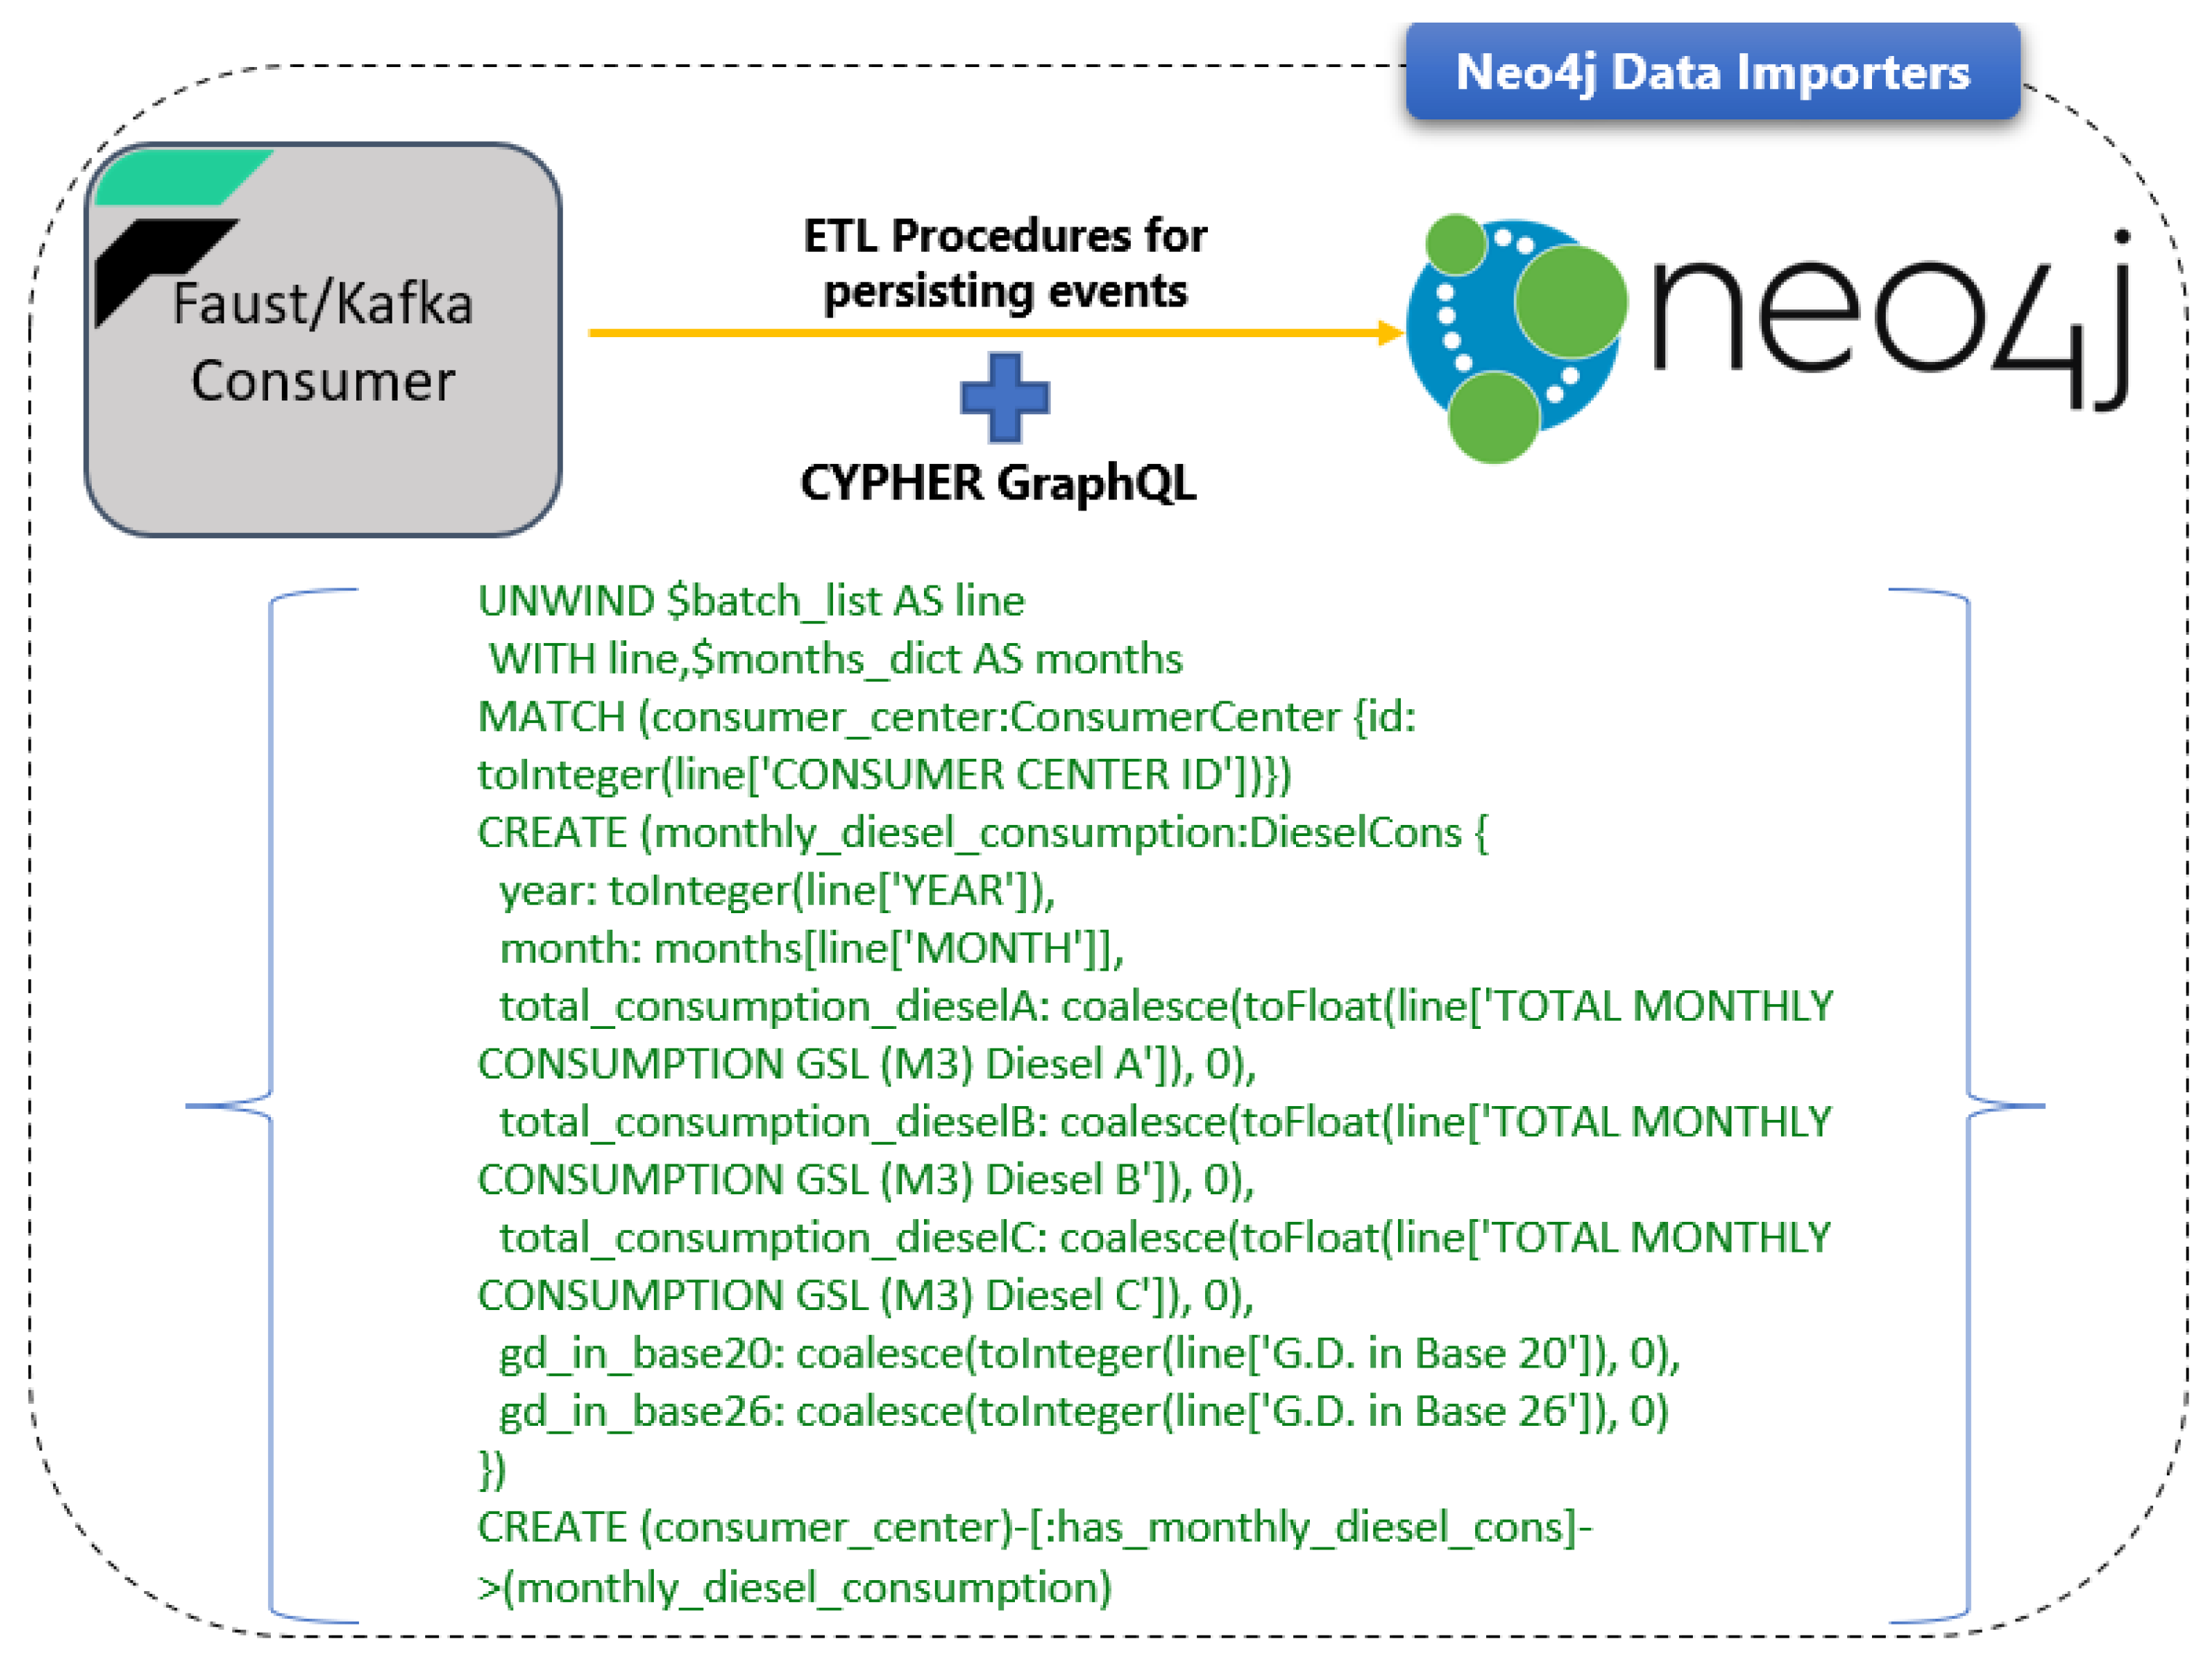
Figure 5.
Data flow in the Reasoning Engine retrieval REST API.

Figure 6.
Data received from Reasoning Engine Kafka consumer.

Figure 7.
EREN data stored in Neo4j.


Table 1.
Reasoning Engine’s REST API collection example.
| curl --location --request POST ‘http://reasoning_engine:5000/leif/service’ \ --header ‘Content-Type: application/json’ \ --data-raw ‘{ “heating_total_consumption”: ${heating_total_consumption}, “heating_co2_emission”: ${heating_co2_emission}, “hot_water_total_consumption”: ${hot_water_total_consumption}, “hot_water_co2_emission”: ${hot_water_co2_emission}, “electricity_total_consumption”:${electricity_total_consumption}, “electricity_co2_emission”:${electricity_co2_emission} } |
Table 2.
EREN energy efficiency certificates dataset.
| Column | Short Description | Example Value |
|---|---|---|
| registration_number | Building’s registration number | 050190003VI1870TI |
| registration_date | Building’s registration date | 1 August 2017 |
| building_usage | Building’s primary usage | FAMILY HOUSE |
| coordinates | Building’s location (long, lat) | −4.6788, 40.66 |
| address | Building’s address | CALLE DAVID HERRERO 24 05005 |
| municipality | Municipality that the building belongs to | ARENAS DE SAN PEDRO |
| province | Province that the building belongs to | ABRADA |
| primary_consumption_ratio | Building’s primary consumption ratio (total consumption) | 543.0 |
| primary_consumption_rating | Building’s primary consumption label | A |
| co2_emissions_ratio | Building’s CO2 emissions ratio | 61.0 |
| co2_emissions_rating | Building CO2 emissions label/rating | E |
| heating_demand_rating | Building’s heating demand rating | E |
| heating_demand_ratio | Building’s heating demand ratio | 111.87 |
| cooling_demand_ratio | Building’s cooling demand ratio | 12.14 |
| cooling_demand_rating | Building’s cooling demand rating | C |
Table 3.
Retrieve average primary consumption.
| curl --location --request POST ‘http://reasoning_engine:5000/query’ \ --header ‘Content-Type: text/plain’ \ --data-raw ‘MATCH (b:Building)-[:has_primary_cons]->(prim_cons:PrimaryCons)-[:has_primary_label]->(l:Label {rating: ‘\’’A’\’’}) RETURN avg(prim_cons.ratio) as average_primary_cons’ |
Table 4.
Average consumption for buildings with a primary consumption.
| [ { “average_primary_cons”: 35.88089204257478 } ] |
Table 5.
Retrieve average primary consumption for buildings located in ABRADA municipality.
| curl --location --request POST ‘http://reasoning_engine:5000/query’ \ --header ‘Content-Type: text/plain’ \ --data-raw ‘MATCH (b:Building)-[:has_municipality]-(m:Municipality {name: ‘\’’ADRADA (LA)’\’’}) MATCH (b)-[:has_primary_cons]->(prim_cons:PrimaryCons)-[:has_primary_label]->(r:Label) RETURN avg(prim_cons.ratio) as abrada_avg_cons’ |
Table 6.
Average consumption of building located in ABRADA.
| [ { “abrada_avg_cons”: 349.7089201877938 } ] |
Publisher’s Note: MDPI stays neutral with regard to jurisdictional claims in published maps and institutional affiliations. |
© 2022 by the authors. Licensee MDPI, Basel, Switzerland. This article is an open access article distributed under the terms and conditions of the Creative Commons Attribution (CC BY) license (https://creativecommons.org/licenses/by/4.0/).
Share and Cite
MDPI and ACS Style
Kapsalis, P.; Kormpakis, G.; Alexakis, K.; Askounis, D. Leveraging Graph Analytics for Energy Efficiency Certificates. Energies 2022, 15, 1500. https://doi.org/10.3390/en15041500
AMA Style
Kapsalis P, Kormpakis G, Alexakis K, Askounis D. Leveraging Graph Analytics for Energy Efficiency Certificates. Energies. 2022; 15(4):1500. https://doi.org/10.3390/en15041500
Chicago/Turabian StyleKapsalis, Panagiotis, Giorgos Kormpakis, Konstantinos Alexakis, and Dimitrios Askounis. 2022. "Leveraging Graph Analytics for Energy Efficiency Certificates" Energies 15, no. 4: 1500. https://doi.org/10.3390/en15041500
Note that from the first issue of 2016, this journal uses article numbers instead of page numbers. See further details here.