Abstract
Electric cars are becoming increasingly popular in Poland and around the world. More and more of them appear on the roads, especially in the centers of large cities. They are perceived and advertised as zero-emission cars, not polluting the environment. However, electric cars, such as cars with combustion engines, need to be “refueled”, so they are charged from the power grid. It is important to say that it depends on what the source of energy is. Unfortunately, in the case of Poland, most of the energy in this network (about 80%) comes from sources using fossil fuels (lignite, hard coal, and natural gas). These are not environmentally friendly energy sources. Despite the use of multi-stage exhaust gas cleaning, toxic compounds and carbon dioxide get into the atmosphere. The situation is stalemate because the more energy is needed to power industry, households and electric cars, the more carbon dioxide is emitted into the atmosphere. This paper will demonstrate that the use of the term “green vehicle” in reference to electric automotive vehicles may be a misuse of the term, because if the local conditions of toxic emissions binding for vehicles with combustion engines had been taken into account during type-approval tests of such vehicles, electric vehicles would never have been put into service, not only in towns but everywhere else, too. Calculations show that carbon dioxide (201.2 g), nitrogen oxides (0.166 g), and particulate matters (0.0095 g) emitted by electropower plants are almost twice as large per 100 km than emitted by diesel engine. The solution to this situation is only an increased investment in the power industry based on renewable energy sources (RES). Currently, photovoltaic and wind power plants are experiencing rapid development in Poland, but they produce energy in an unpredictable way, and moreover, they need huge areas to build high-power installations. Much more stable sources of energy are hydroelectric power plants, which are in serious regression in Poland. Planned investments are constantly postponed. Yet, even in the lower Vistula cascade, already planned in the middle of the last century, there is a potential which, if used, would make it possible to ensure clean energy for powering electric vehicles for several dozen years to come. The authors wanted to pay attention to the need to introduce sustainable diversification of energy sources which, following the increase of investment in hydropower, would make it possible to plan the development of electromobility in Poland in a more secure way. The launch of the Lower Vistula cascade would eventually enable the zero-emission operation of approximately 1.5 million electric vehicles.
1. Introduction
Climate change is a global problem that represents one of the greatest challenges facing mankind. For the past 30 years, world leaders have been meeting to determine how to intensify global action to address the climate crisis. Conclusions highlight the need to strengthen the global response to climate change [1].
The key to countering climate change is to control and reduce CO2 emissions, which is currently among the world’s most pressing environmental challenges [2]. Actions taken for the environment should take into account the idea of sustainable and balanced development. Sustainable development aims to meet the needs of the current generation in such a way that future generations are not prevented from meeting their needs. This is based on a comprehensive approach that combines economic, social, and environmental issues in a way that ensures that they are mutually reinforcing [3].
At present, it is extremely important to ensure the stability of the electricity and fuel sector. Increasing concerns about the climate and attempts to stop global warming have made renewable energy sources the future of the power industry. The United Nations’ decisions on climate change and subsequent legal regulations of the European Union, introducing restrictions on the emission of harmful gases, caused the number of new investments in expansion of the conventional energy sector to decrease dramatically. More and more countries are abandoning coal as the primary source of electricity generation or intend to do so in the coming years. In recent years, policy makers have also focused their attention on the transport sector, which is a huge consumer of energy and a source of CO2 emissions and air pollutants.
Some authors [4] note that the increasing pressure of global warming on society results in the search for solutions that focus on low or zero-emission forms of transport. In such an aspect, it seems that electromobility, i.e., introducing vehicles with electric or hybrid drive systems [5,6], may become one of the more effective solutions. Many researchers argue that the development of electromobility can improve air quality by reducing CO2 and NOx emissions [7,8,9,10]. Others argue that electromobility may become the dominant technology used for future mobility in urban agglomerations [11,12,13]. Therefore, today, the implementation of electricity-based transport solutions has become an important part of the development strategy in every EU Member State [14].
However, electromobility will be an effective solution only when widespread energy generation from renewable energy sources (RES) is implemented. The basic problem that is not mentioned in the context of electromobility is the fact that in Poland, electric vehicles are charged from the power grid, in which, according to data for 2020, over 70% of energy comes from burning coal and another 10% from burning natural gas [15]. The introduction of electric vehicles will therefore shift the sources of greenhouse gases (GHG) generation from internal combustion engine vehicles to coal-fired power plants. This will reduce emissions at the locations where the vehicles are operating, but given the generally increasing demand for electricity, the end result will be a global increase in emissions of carbon dioxide and other gaseous and particulate pollutants present in the exhaust from coal-fired power plants. The increase in pollutants associated with the operation of electric-powered vehicles will also result from the lower efficiency of the energy conversion chain between the primary energy source (the power plant) and the wheels of these vehicles as compared with combustion-powered vehicles, as will be discussed later in this paper. In light of these considerations, it should be asked how the development of electromobility in Poland will affect the growth of electricity consumption and the emission of toxic compounds and GHG and, first of all, what the technical possibilities of increasing the acquisition of electricity from the renewable energy sector in relation to the total energy produced are.
2. Background
2.1. Materials and Methods
To characterize the problem of the demand for electricity generated in hydroelectric power plants in Poland, scientific literature as well as reports available on the websites of various state institutions were used [16,17,18]. Characteristics of the share of electricity produced in Poland against the background of other renewable energy sources were discussed on the basis of statistical data from the Central Statistical Office from 2002 to 2020 [19] and from the Energy Regulatory Office [20].
A detailed analysis of electricity production volumes was carried out on the example of the lower Vistula River, which is one of the rivers with the largest unused technical potential in Poland. Hydrological conditions were characterized based on flow data for the Vistula River at the Włocławek gauging station. Hydrological data cover the period 1990–2019 and were obtained from the Institute of Meteorology and Water Management—National Research Institute. Data on the volume of energy produced on a monthly and annual basis, as well as the flow through the turbines with a breakdown by individual months in 2002–2011 were obtained for the Włocławek hydroelectric power plant. The data were provided by Energa company, which administered the facility.
We evaluated the level of energy consumption by electric vehicles and estimated levels of gaseous and particulate emissions from coal-fired power plants, and used data obtained from calculating traction parameters of selected electric vehicles and information contained in the NPS report for 2020 [16] and KOBiZE report [21].
2.2. Electric Car Market in Poland
The appearance of electric cars on the streets of major cities no longer causes excessive excitement. They have a reputation for being eco-friendly vehicles that do not emit gaseous and particulate pollutants into the environment. This is only part of the truth. In reality, pollution from electric cars is emitted not at the places where they are used, but at the power plants where electricity is generated. In Poland, about 81% of electric energy comes from the combustion of fossil fuels (lignite, hard coal, or natural gas), and the combustion of these fuels is accompanied by the emission of carbon monoxide and dioxide, sulfur, and nitrogen oxides, but also by quite large amounts of particulate matter of various sizes (PM2.5, PM10). An additional factor is the low energy conversion efficiency of the electric vehicle’s propulsion system, which results in only about 20% of the energy from the fuel at the power plant being delivered to the wheels of the electric vehicle. This results in an increased level of electricity production by the coal-fired power plant and accompanying high emissions of toxic components and GHG (greenhouse gases) compared to internal combustion engine cars, where about 30% of the thermal energy is delivered to the vehicle wheels [22].
The number of electric cars on Polish roads is not large and at the end of 2020 was estimated at about 19,000 (about 53% electric cars and 47% plug-in hybrids) [23].
Poland clearly remains behind in terms of the number of electric cars comparing to European Union. While in Poland newly registered cars with an electric engine account for less than 2%, in the EU it is about 10% [23]. In 2020, about 9900 new electric cars were registered, which means dynamic increase at a level of 140% per year [24]. However, electric cars require electric charging stations to refill the “fuel”. So far, there are not many of them. By the end of 2020, almost 3200 charging points for electric cars were available in Poland [25], about 100 of them have a capacity of more than 50 kW. Unfortunately, sometimes they are located in normal parking spaces, so access to the charging point is not always possible. Tesla cars have only 10 high power charging stations in Poland [26], although they have a capacity of up to 150 kW and allow the battery to be charged in 10 min with enough energy for another 150 km. Due to limited access to professional charging stations, owning an electric car in most cases forces users to rely on the home electric grid. Long-distance, out-of-town trips can be problematic due to the lack of charging stations with adequate power along the anticipated driving route. The available level of electrical power is a key consideration when charging a car, as it determines the time spent recharging the battery. Typically, home grids have between 10 and 16 kW of power, and this is the capacity to power all household electrical appliances. Home car chargers are made in several power standards: 3.6, 7.1, 11, and 22 kW [27]. They allow to charge a battery of about 40 kWh overnight (2 to 12 h). This is enough time to charge the vehicle’s battery, although a 22 kW charger will require an increased power allowance and the need for a three-phase connection for a household. With one car, this power source may be sufficient, but if a family uses more than one electric car, charging vehicles may be problematic. For those living in a block of flats and without indoor garage space, an electric car may be an unavailable dream.
It is worth considering what would happen if all passenger car owners decided to replace their combustion engine vehicles with electric drives. The number of passenger cars registered in Poland exceeds 29 M [28] but ca. 24 M have bought mandatory liability insurance and passed technical inspection. The average mileage of a passenger car in Poland is ca. 15,000 km/year [29]. Energy use of an electric car is 15–20 kWh/100 km; with an average energy consumption of 17.5 kWh/100 km, an electric car will consume 2625 kWh per year (2.63 MWh). All the cars will consume about 65.8 TWh of electricity per year. Since the efficiency of the electricity grid in Poland is about 85–88% [30], and the efficiency of chargers remains at 95%, power plants will have to provide additional production of about 80 TWh of electricity (about 3.2 TWh per million electric cars).
2.3. Electric Energy Production in Poland in Comparison to EU
The average annual electricity production in Poland between 2000 and 2020 was 158,421 GWh. The highest energy production was recorded in 2017, where about 170,465.2 GWh of energy was produced, while the lowest was in 2003 (144,145 GWh) (Figure 1 and Figure 2). In 2017, 3033.9 GWh of electricity was produced from water energy which is 1.76% of the total energy produced in Poland and about 21.6% of the technical potential of Polish rivers.
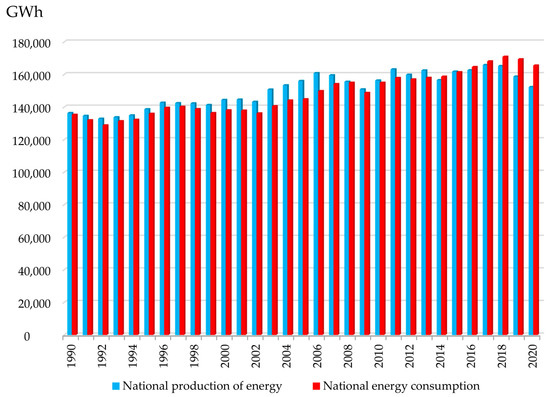
Figure 1.
National production and consumption of electric energy in years 1990–2020 (based on data from National Power System [15]).
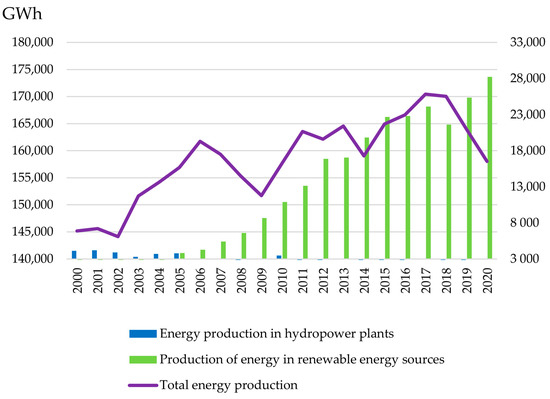
Figure 2.
Electric energy production in water power plants and renewable energy sources comparing to overall energy production in Poland between 2000–2020 (based on data from Central Statistic Office [19]).
Especially noteworthy is the comparison of national electricity production with its consumption. From 1990 to 2015, more electricity production was recorded than electricity consumption, which meant that Poland was an exporter of electricity. From 2016 to 2020, it is visible that the volume of electricity consumption exceeds electricity production. This means that Poland has become an importer of electricity in recent years, which is the result of an electricity deficit. The size of the deficit in 2020 reached an alarming level of 13.2 TWh (165.532–152.308 TWh), or almost 10% of annual production [15].
According to data available in [31], Poland, as one of the few European Union (EU27) countries, apart from France, Slovenia, and Romania, did not achieve the target of obtaining a 15% share of energy from renewable sources in total final consumption of electricity in 2020. In 2020, Poland achieved only 12.91% of its declared share of 15% [31].
Increasing energy consumption by the 80 TWh per year needed to power all passenger cars would force the energy deficit to nearly 66%. This means that several large power plants would need to be built to meet our electricity needs for electric cars.
The National Power System in Poland is currently capable of providing uninterrupted power supply both during the current demand and in situations of temporary peak power consumption. However, as trends and forecasts indicate, the demand for energy will increase with each passing year. At that time, the existing energy infrastructure will become inefficient and continuity of supply will be seriously threatened. Therefore, expansion and modernization of the transmission and distribution network becomes an inevitable necessity [32]. With the increase in demand for electricity and the development of renewable energy sources, it will be necessary to increase the density and upgrade the electricity grid. Investments in so-called smart electricity grids will be necessary [33]. The existing electricity infrastructure including, among others, transmission and distribution lines is systematically modernized. Electricity infrastructure, which is unsuitable for existing loads, is replaced first with new generation infrastructure. The effect of changes is the improving efficiency of energy transmission, which over the last years has increased from 80% in 2004 to almost 89% in 2016 [34,35], but especially low voltage networks energy losses are still at a significant level. The changes taking place in the energy market are leading to the decentralization of energy generation, thus increasing the local dimension of energy and taking advantage of the distribution generation advantages of reducing energy losses associated with its transmission, transformation, and distribution, which in turn has an impact on improving energy efficiency [36]. The development plan for meeting Poland’s current and future electricity demand and modernizing its infrastructure is detailed in the Energy Policy of Poland until 2040. In the strategic documents adopted by the Polish government, an almost new electricity system will be built in the 2040 perspective, with zero-emission sources as a strong basis [37,38].
Fossil fuel power plants are not considered a good solution because they produce a lot of toxic components in the exhaust gas. Therefore, we have to focus on renewable energy sources, such as wind power plants, photovoltaic power plants, and hydroelectric power plants. Wind and photovoltaic energy are very popular in Poland, but they have problems with low efficiency and durability and their production capacity is strongly dependent on the time of day or year, which implies the use of solutions such as energy storage systems, which also reduces the profitability of this type of investment. Analyzing the growth rate of electricity production and consumption in Poland since 1990, it can be estimated that if no significant actions are taken, the required level of electricity production might not be reached even in the next 60 years (2090) (Figure 3).
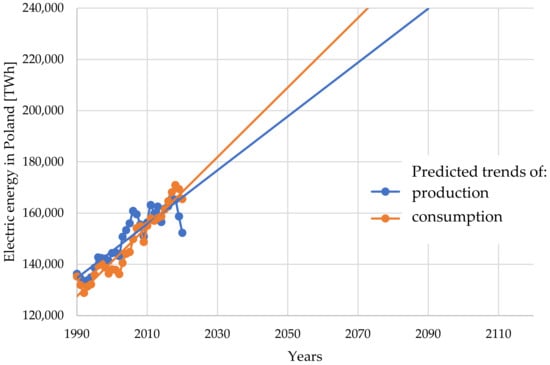
Figure 3.
Electricity production and consumption in Poland (points) based on last decade of data with prediction to the end of XXI Century (lines) (based on data from National Power System [15]).
Despite the population decrease, electricity consumption in Poland is still growing. According to long-term forecasts and assuming different scenarios, the demand for energy will increase with each passing year. The development plan for meeting current and future electricity demand for 2021–2030 estimated that the national net electricity demand will be over 181 TWh in 2030 and over 204 TWh in 2040 (more than even the projected consumption shown in Figure 3). The analysis takes into account a number of macro-factors affecting the structure of energy consumption in the household, transport, industry, and services sectors, changes in energy efficiency, projected Gross Domestic Product growth in individual sectors, technological and consumer changes, and changes resulting from EU regulations regarding Poland’s fulfilment of the required RES target in gross final energy consumption. Structural changes were taken into account, i.e., primarily the development of the electric vehicle market and heat pumps [37]. The increase in the share of energy from RES complements the decreasing share of energy generated from conventional sources, including hard coal. In the case of unfavorable meteorological and hydrological conditions, the amount of electricity produced from RES will be lower than the average throughout the year with a simultaneous increase in electricity demand. In this case, the electricity production curve will be less steep than the electricity consumption curve. The disproportion between the level of installed capacity from renewable sources and the level of production from renewable sources reaches 50% [15]. It can be seen in the report that the level of renewable energy production increased in 2020 to about 10% which is mainly due to the increase in the number of PV installations, but at the same time, the capacity of RES installations increased by almost 20% which means that their use is not full.
2.4. Quality of Electric Energy in Poland
Electric cars are seen and advertised as environmentally friendly solutions. Ignored is the fact that they need quite a large amount of electricity, stored in batteries, to drive motors. This energy is obtained in a way that does not use, as one would expect, renewable energy sources. This energy is obtained from an electric grid during the charging process and is fed into the grid from power plants. In Poland, the dominant share of electricity production from non-renewable sources is visible. Almost 72% of the energy market is occupied by coal-fired power plants operating on hard coal and lignite, and slightly more than 9% by gas-fired power plants operating on natural gas [15] (Figure 4).
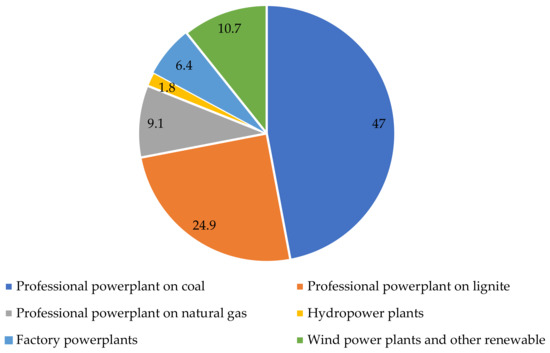
Figure 4.
Percentage share in national electricity production of individual groups of power plants by fuel type in 2020 (based on data from National Power System [15]).
In addition to electricity, coal-fired power plants produce flue gases that contain carbon dioxide, toxic compounds, heavy metals, and dust. The composition of flue gases depends on the type of power plant, the purification systems installed, and the level of electricity production. The efficiency of coal- and gas-fired power plants in our country does not exceed 40%, which means that if such a facility does not operate as a combined heat and power plant, 60% of the heat is uselessly released into the atmosphere.
Another omitted fact is the low efficiency of electric grid transmission network to consumers. Only 85–88% of the energy generated at the power plant is delivered to the vehicle charging station where the batteries are recharged [34,35]. Even less energy goes to the vehicle’s wheels because charging stations, batteries, electric motors, and electrical converters in the vehicle also have their own efficiency. The greater the energy loss from the power plant to the wheels of the vehicle, the more energy the power plant has to generate for every 100 km an electric car has to travel. The different stages of energy transformation increase the amount of toxic emissions into the environment. It may turn out, therefore, that the use of an electric vehicle causes greater total emissions of toxic (and greenhouse) compounds than a car with an internal combustion engine. As a result, this means that electric cars, if tested for total emissions from power plants, could fail to meet the standard of allowable air emissions of toxic compounds prescribed for cars with internal combustion engines.
Currently the Euro 6d emission standard has to be met (from January 2021), which limits the emission of carbon monoxide (CO in spark ignition (SI) passenger cars to 1 g/km, hydrocarbons HC to 0.06 g/km, nitrogen oxides NOx to 0.06 g/km for SI engines and 0.08 g/km for diesel engines, and particulate matter PM to 0.005 g/km. The standard sets a limit of 95 g/km of CO2 emission for an average vehicle of each manufacturer [39,40]. In addition, coal-fired power plants emit other toxic compounds not emitted by automobiles such as sulfur oxides SOx and also compounds of chromium, mercury, copper, zinc, and arsenic.
2.5. Energy Demand of Electric Vehicles
Electric vehicles are driven by electricity stored in the battery. An analysis of electricity requirements for a vehicle’s propulsion carried out by [41] included three popular electric car models: Nissan Leaf, Hyundai Ionic, and Tesla S. Calculations have shown that the average energy consumption for covering 100 km in a standard NEDC test in these three types of vehicles is about 15 kWh. Since the energy reaching the wheels of an electric vehicle is reduced by the losses at the various stages of energy conversion (Table 1), the power plant actually has to produce more energy.

Table 1.
Efficiency of electric vehicle components [41].
Assuming that the efficiency of thermal power plants (coal- and gas-fired) is about 38%, the efficiency of the whole energy conversion chain from the thermal energy generated from the fuel to the wheels of an electric vehicle is about 22%. This is about 8–10% less energy than that of a car with an internal combustion engine [41].
The efficiency of the energy conversion system of 57% means that in order to charge the battery with the energy needed to cover 100 km for an average car, the power plant must generate about 26.3 kWh, allowing to generate about 15 kWh at the wheels of the vehicle. Generation of this amount of energy will be associated with the emission of toxic compounds whose levels are shown in Table 2.
Table 2.
Emission indicator of chemical compounds connected with the burning process in the production sector and energy transformation in 2019 [21].
Table 3 shows the calculated emissions of particular components of exhaust gases with respect to the energy produced in the Polish Power System and used to recharge the traction battery of an average electric vehicle to a level that enables to travel a distance of 100 km. Emissions of carbon dioxide (CO2) and particulate matter (PM) have doubled and the emission of nitrogen oxides (NOx) has almost tripled with respect to the current limit values applicable to vehicles powered by a conventional combustion engine (Euro 6d). Only the emission level for carbon monoxide (CO) is met for electric cars.
Table 3.
Calculated amounts of fumes emissions for electric vehicle with energy demands from conventional powerplant at level 26.3 kWh/100 km.
On the basis of the analysis presented above, it may be stated that an electric vehicle, despite its many undoubted advantages, has a very negative environmental impact in the case of coal-fired power generation. Despite significant progress in the field of pollution control at power plant chimneys, thanks to the installation of dust electrostatic precipitators or flue gas desulphurization and denitrification systems, coal-fired power plants still release huge quantities of substances hazardous to humans and the environment into the atmosphere. The problems grow because of electric vehicles (BEV and PHEV) market growth. It is expected that by 2040, there will be half a billion electric cars on European roads [42].
3. Discussion and Results
3.1. Renewable Energy Production for Powering Electric Cars
Electric cars in Poland would become greener if the energy that powered them came from renewable sources. From the renewable energy solutions available on a larger scale, it is possible to use wind power plants and photovoltaic power plants with their cons and hydroelectric power plants.
Wind and photovoltaic energy are very popular in Poland, but they pose problems of low efficiency and durability. Additionally, wind and PV power plants need a lot of land area for electric energy production. Wind power plants require a lot of space. One of the largest wind farms in Poland covers 252.2 hectares with 15 wind turbines. The total capacity reaches 30 MWe. This means that wind power needs 7.5 ha of land to produce 1 MWe of electricity. Since wind turbines only produce energy 30% of the time during the year [30], in fact, three times as much land will be needed (more than 20 ha/MWe) [43,44]. An average photovoltaic cell is able to produce approximately 140 W from one square meter of surface area. The cell’s energy is only generated during solar activity. They can produce 90% more energy in the summer months than in the winter months. Comparing the power output of a 668 W photovoltaic cell with an annual energy production of 562 kWh, it can be estimated that the photovoltaic cell was operating at full power for about 850 h per year (about 10% of the time) [45]. This results in the need to use about 1 hectare of land (about 100 kWh per year) to produce 1 MWe of power. Assuming above, generating the 80 TWh of energy needed to power electric cars would require 100 GW of photovoltaic cells. If the average cell has a power of ca. 140 W/m2, it was estimated that to create a whole system of solar energy to power all (ca. 30 million) electric cars, an area of about 700 km2 of cells would be needed. This area is only slightly larger than Warsaw (517 km2) and represents about 0.2% of Poland’s area, but does not take into account such aspects as access and technical roads or segmentation of cells due to fire safety reasons, etc.
One of the best renewable energy solutions is to use water energy to produce electricity. The largest hydroelectric power plant in Poland, HP Włocławek, produces 160.2 MWe of electric energy. The power plant covers an area of about 2 ha, which is a fraction of the area occupied compared to wind and photovoltaic power plants. The power of a hydroelectric power plant depends on the height of water damming and its flow rate, which indirectly depends on the catchment area and rainfall intensity. However, the catchment area does not belong to the area occupied by the hydropower plant and is independent of it. It is easy to calculate that the area factor for hydropower (0.01 ha/MWe) is much more favorable than for wind and PV power. Another advantage of hydropower plants is the long and relatively stable lifetime, which can reach up to 100 years compared to 20 years for wind power plants [46] and 25 years for photovoltaics [47] (Table 4). The potential in this area is still possible to implement, because in Poland, only about 15% of the technical potential of flowing water is used. A large unrealized project in the field of hydropower is, for example, the cascade of the lower Vistula River, where another 5 water stages were supposed to be built with a total capacity of 850–1340 MW [48,49,50].
Table 4.
Comparison of renewable energy production methods.
3.2. Rivers’ Energetic Potential
The distribution of hydropower in Poland is uneven and related to the presence of water resources. Basically, the power that can be obtained in a hydropower plant depends on the water flow rate Q and the height of the fall H. It can be expressed by Equation (1).
where: ηe—efficency of power plant.
Poland’s water resources, determined on the basis of flow capacity of larger rivers, are at an average level. The largest river flows in Poland are provided by the Vistula and the Oder in their outlet sections. The watercourses with lower flows may obtain higher power using higher gradient height. From the point of view of river energy use, the differences in elevation in Poland compared with other countries are small because they result from the predominantly flat terrain. Knowing these two parameters, i.e., flow and gradient, it is possible to assess the energy potential of individual rivers.
Theoretical water resources of Polish rivers were identified in the 1960s based on the World Energy Council methodology. Calculations made by A. Hoffmann show that the theoretical resources of Polish rivers average 2625 MW in terms of power potential and about 23 TWh/year in terms of energy potential [51,52,53]. Technical resources of all flowing waters in Poland reach 14 TWh/year, which is 61% of all theoretical resources. The Vistula River Basin has the highest potential (9.3 TWh/year) and the Oder River Basin (2.5 TWh/year). According to [49], electrical energy power potential of the Vistula River is 2047.2 MW, which represents 6459 GWh of electricity. The Lower Vistula Cascade has the highest capacity, with a calculated capacity of 1338.2 MW and a planned energy production of 4153 GWh. According to new calculations by [50], the total power of the Lower Vistula Cascade, depending on adopted variant, can range from 507.1 MW to 857.4 MW, which allows an average annual energy production of 3428.4 to 4221.1 GWh.
The geographical division of this potential is as follows: Vistula River Basin—9.3 TWh/year, including Vistula 6.2 TWh/year, Odra River Basin—2.5 TWh/year, including Odra 1.8 TWh/year, coastal river basin—0.3 TWh/year, small hydropower plants—2.0 TWh/year.
Regions with the most favorable conditions for hydropower development are in southern Poland (mountainous areas). The greatest potential among mountain tributaries of the Vistula is the Dunajec River (814 GWh/year), while among the mountain tributaries of the Oder River—the Bóbr River (320 GWh/rok) [53,54].
The obtained results indicate that the possible implementation of the cascade of damming stages together with hydroelectric power plants on the Lower Vistula River would make a significant contribution to energy production in the National Power System. The remaining technical resources refer to coastal rivers and small hydropower plants. In comparison to other European countries, this potential is small [54].
The main reason for the unsatisfactory development of hydropower in Poland and in numerous European countries is administrative and legal barriers, which are mostly the result of a very narrow understanding of nature and natural resources protection [55]. An example of a lengthy process related to the implementation of investments is the planned construction of a hydroelectric power station in Siarzewo, below Włocławek, with a capacity of 80 MW. Public consultations on the selection of power station location began in 2012; during the next 2 years, studies on the environmental impact of the investment were conducted; and in early 2015, an environmental impact report was submitted. One year after submitting the report, an institution responsible for issuing the environmental decision (Regional Director of Environmental Protection) refused to give its consent to the investment. The investor appealed the decision and finally a positive environmental decision was issued on 27 December 2017.
In 2018, another concept for the management of the Vistula River was presented, which included new technical solutions for development of the lower Vistula River. Recommended variant of development of the lower Vistula includes, apart from Włocławek and Siarzewo power stations planned for implementation, another four water stages in Solec Kujawski, Chełmno, Grudziądz, and Gniew (Figure 5). The planned height differences will allow utilization of the stages for power engineering, but will also secure the guaranteed depth in the river for the needs of inland waterways.
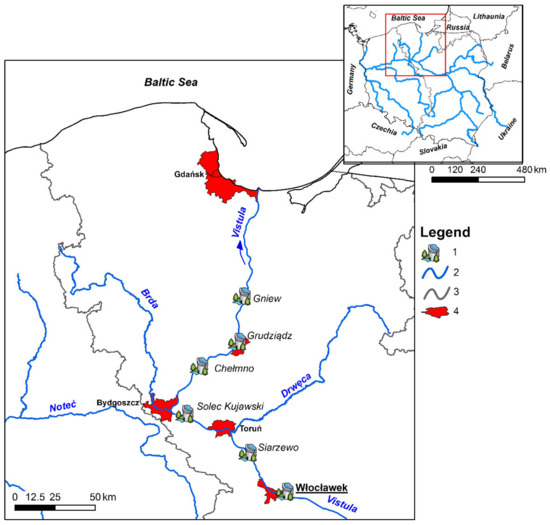
Figure 5.
Power stations planned for implementation of the lover Vistula River (Legend: 1—planned hydropower plant, 2—rivers, 3—border of the Vistula River basin water region, 4—cities).
The initial schedule assumed that construction would begin in late 2023 or early 2024 and be completed in 2029. In accordance with the above information, it appears that the planned investment is unlikely to be completed within the timeframe foreseen. Consequently, it may not be possible to achieve the environmental targets for renewable energy sources either.
3.3. Electric Energy Production in Włocławek Hydropower Plant
Włocławek hydroelectric power plant is the largest water-flow power plant in Poland. Power plant capacity is 160.2 MW (Figure 6). The amount of energy produced depends on the flow of Vistula River. The lowest flow in Włocławek in 2002–2011 period occurred in 2003 and amounted to 678 m3/s, while the long-term average (1961–2015) was 918 m3/s. The highest mean annual flow of the Vistula River in Włocławek was 1582 m3/s and occurred in 2010. The average annual electricity production at hydroelectric power plant in Włocławek in 2002–2012 was 763.8 GWh. In dry years, e.g., 2003, it was about 581.3 GWh, while in wet years (2010) it was 1102.6 GWh.
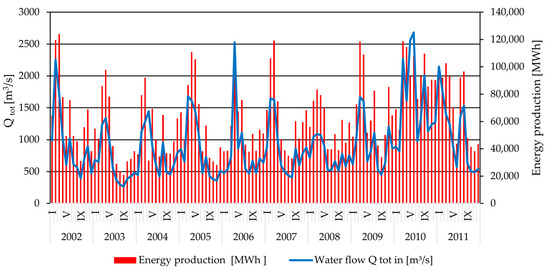
Figure 6.
Electric energy production in power plant Włocławek in years 2002–2011 (based on data received from the Włocławek hydropower plant).
This investment provides about 24% of electricity obtained from hydropower and 34% of energy produced in run-of-river power plants (except pumped storage) in Poland (Figure 7). In wet years, e.g., 2010, energy produced by hydroelectric power plant Włocławek generated 31.61% of the total energy produced in hydroelectric power plants (37.8% in run-of-river power plants). In dry years, the share of energy produced from hydroelectric power plant Włocławek was 17.22% of the total energy produced from domestic hydroelectric power plants and 30.5% in run-of-river power plants in Poland. Those data, taken directly from HP Włocławek, can be used as a reference point to estimate the potential of the Lower Vistula Cascade in terms of increasing the possibility of ensuring energy needs, including EV charging.
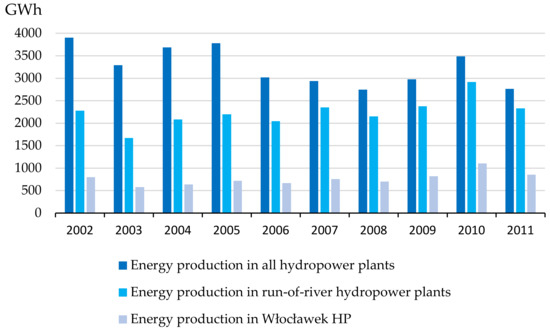
Figure 7.
Total energy produced in water power plants in Poland (based on data from Central Statistic Office [19]) and energy produced in power plant Włocławek (based on data from power plant) in years 2002–2011.
This means that, depending on the year, the amount of electricity produced can be up to 40% higher than the multi-year average. A similar situation may occur at the planned new facilities, which will produce an average of 4.221 TWh and even more than 5.900 TWh in wet years. Since 3.15 TWh of energy is needed to ensure that 1 million electric vehicles can be charged, it means that the total amount of energy produced will make it possible to provide electricity for approximately 1.5 million cars one year after all the stages of the Lower Vistula Cascade have been built and started up. The power plant in Włocławek alone will make it possible to power about 300,000 cars a year, based on data from HP Włocławek, and after Siarzewo power plant becomes operational, comparing possibilities of HP Włocławek to planned installed power of HP Siarzewo, the potential will increase even to about 0.5 million cars. Moreover, because described facilities are run-on-river HPs, there is no need to power them as it is in case of pumped-storage installations (which are the majority in Poland now) where renewable sources, e.g., from PV farms, cannot be used.
3.4. Discussion
Europe is trying to be a pioneer in renewable technologies and a leader in the fight against global warming. Such an approach means that the mining industry is being liquidated and coal power plants are being replaced by renewable energy sources. Despite the increase in the share of electricity production from renewable energy sources declared in the EU agreements, Poland has problems with achieving it (the planned share of 15% of RES in 2020 was achieved at the level of 12%). Further increase in the number of electric cars in Poland will contribute to the increase in demand for electricity.
However, how cost-effective for the consumer are EVs without subsidies? Despite the advantages of lower CO2 emissions per kilometer combined with renewable energy and independence from fossil fuels [56], EVs have the advantage of being perceived as cheaper than conventional vehicles. This perception may be due to the fact that the higher initial cost is easier for consumers to estimate than the operating cost [5]. However, existing studies show that operating costs may actually be lower for EVs than for conventional ones [6] as long as an excise tax on the energy used to charge the cars is not introduced, thus changing the price relationship and affecting cost-effectiveness. In the case of hybrid vehicles, energy consumption depends on many factors that may be dependent or independent of the driver, e.g., driving technique and travel time [39]. With the consumer energy price at 1.40 PLN/kWh, driving 100 km (15 kWh) will cost about 20 PLN. Driving the same distance in a car with a petrol engine (approximately 7 l/100 km at 6 PLN per liter) will cost approximately 42 PLN, which is twice as much.
The expansion of the renewable energy sector has progressed slowly. Planned targets have not been reached and the next steps are approaching rapidly. Investing in wind and photovoltaic power requires large areas of land. Unit capacities are also low. The proportion of time these energy sources are used also leaves much to be desired (weak solar radiation in winter months, downtime at night in case of photovoltaic cells and low average wind speed in Poland makes it difficult to use them). There are no investments in high-power hydropower. Local conditions allow the construction of several hydroelectric power plants within the Lower Vistula Cascade (upper Vistula, Oder). However, the realization of investments encounters constant obstacles, including protests of ecological organizations, despite the use of natural river flows which rely on the natural hydrological cycle, and the deadlines for the realization of already planned facilities are postponed or suspended.
The main problem in Poland in investments related to building new hydroelectric power plants is the long period of investment realization. This is connected with environmental limitations and investment costs [55]. An example of the planned investment in Siarzewo near Włoclawek was described in [54]. Long-lasting procedures result from the intervention of numerous environmental groups that participate in administrative proceedings. The construction of large water reservoirs and damming on large rivers such as the Vistula significantly affects the natural environment. The construction of small hydropower plants causes less impact on the environment. The main advantages of hydroelectric power plants in comparison to the wind and photovoltaic power industry are proven technology and higher efficiency of the plants. Some of the hydropower plants have been in operation for more than 100 years. In recent years, there has been an increase in the use of solar and wind energy. This is especially evident from the perspective of their installed capacity, which, among others, at the end of 2020 amounted to, respectively, 3420 MW and 6347 MW [54]. Despite the fact that this capacity accounts for 19.8% of the total installed capacity, the contribution of solar and wind power to meet the national electricity demand is relatively low, 1.4% and 9.2%, respectively. Both sources are characterized by high variability in their power output and very low dispatchability [57].
Small hydropower plants have a positive impact on the environment by storing water in small retention reservoirs. They make it possible to regulate the amount of water in a river under extreme hydrological conditions and improve small water retention. Water storage in small retention reservoirs is extremely important because Poland is counted among countries with some of the lowest renewable water resources [58,59]. Therefore, it is advisable to build small hydropower plants on existing dams while minimizing the negative impact on the environment.
Electromobility development should be supported by investment in renewable energy sources. Investment in the development of hydropower is one of many possibilities of acquiring electricity. The authors’ task is to draw attention to the special case of Poland, whose energy sector is based on conventional energy. Public awareness plays a large role in this matter. The awareness of Polish society concerning the sources of electric energy production, technological possibilities, and needs is often based on stereotypical, sometimes wrong beliefs. Therefore, a necessary action for the modernization of Polish energy market should be extensive research into information and the promotion of renewable energy sources that will raise public awareness. Due to differences in the electricity mix used in various countries, the environmental impact of electric vehicles might be positive or negative. Sources of electricity generation can lead to serious complications in reducing emissions through the electrification of mobility [60].
4. Conclusions
In recent years, an increase in the number of electric cars in the Polish automotive market has been noticeable. The future of electric cars in Poland largely depends on promotional actions and a support system. Analysis carried out shows that it cannot be assumed a priori that electric vehicles are environmentally friendly. An analysis of environment-friendliness should take into account all the impacts of mobility on the environment, including production, operation of the vehicle (CO2 emissions), and recycling of electric vehicles. These analyses should take into account the specific conditions of each country in terms of electricity sources. However, taking into account only the emissions of toxic compounds and carbon dioxide by Polish power plants when generating the energy needed to charge electric vehicles indicates that these vehicles are not environment-friendly at all and, with regard to the emissions of nitrogen oxides, carbon dioxide, and particulate matter, they cause higher emissions as compared with vehicles with internal combustion engines meeting the Euro 6 standard.
An improvement in the levels of greenhouse gas emissions and toxic components of exhaust gases can only be achieved by increasing the share of RES in electricity production. Investments are going slowly and the greatest momentum is in the construction of photovoltaic and wind power plants, but the density of energy possible to be acquired by these power plants is relatively low, which makes it necessary to occupy large areas of land taken from agriculture. It also causes problems with the development of energy infrastructure if these power plants are built in more distant regions of the country. Yet, we have quite a large potential in hydropower in Poland, where, especially on large rivers, the energy density is much higher. The cascade of the Lower Vistula, once built, could provide energy for several million electric cars.
According to the authors, the development of electromobility and zero-emission should be implemented at the stage of analysis of energy generation sources. A dual action that aims primarily to invest in the development of renewable energy sources and to promote the use of renewable energy sources in various sectors of the economy, with particular respect to the transport sector.
More and more sources of renewable energy in Poland have to be built. It is a key solution for the Polish energy problem. However, this should not be focused on PV and wind farms only. Water sources of energy, large and small, also have to be built, because they use different forms of energy and work in different conditions. The diversification of enviromently friendly sources of electrical energy is much safer than using only one form of produced electricity.
The top priority now is for policymakers as well as the public to become aware of the problem and try to find solutions that will not cause new environmental problems.
Author Contributions
Conceptualization, K.K.-W. and L.S.; methodology, L.S.; validation, K.K.-W., L.S. and F.P.; formal analysis, K.K.-W.; investigation, L.S.; resources, K.K.-W., L.S. and F.P.; data curation, K.K.-W. and L.S.; writing—original draft preparation, K.K.-W.; writing—review and editing, F.P.; visualization, L.S. and F.P.; supervision, F.P.; project administration, F.P.; funding acquisition, F.P. and K.K.-W. All authors have read and agreed to the published version of the manuscript.
Funding
This research was funded by the Military University of Technology, grant number UGB 758/2022.
Institutional Review Board Statement
Not applicable.
Informed Consent Statement
Not applicable.
Data Availability Statement
Not applicable.
Conflicts of Interest
The authors declare no conflict of interest.
References
- Zmiana Klimatu: Co Robi UE? Available online: https://www.consilium.europa.eu/pl/policies/climate-change/# (accessed on 14 November 2021).
- Tao, F.; Zhang, H.; Hu, J.; Xia, X.H. Dynamics of green productivity growth for major Chinese urban agglomerations. Appl. Energy 2017, 196, 170–179. [Google Scholar] [CrossRef]
- Available online: https://ec.europa.eu/info/strategy/international-strategies/sustainable-development-goals/eu-approach-sustainable-development_pl (accessed on 14 November 2021).
- Pollák, F.; Vodák, J.; Soviar, J.; Markovič, P.; Lentini, G.; Mazzeschi, V.; Luè, A. Promotion of Electric Mobility in the European Union—Overview of Project PROMETEUS from the Perspective of Cohesion through Synergistic Cooperation on the Example of the Catching-Up Region. Sustainability 2021, 13, 1545. [Google Scholar] [CrossRef]
- Contestabile, M.; Offer, G.; North, R.; Akhurst, M.; Woods, J.A. Electric Vehicles: A Synthesis of the Current Literature with a Focus on Economic and Environmental Viability. Available online: https://spiral.imperial.ac.uk/bitstream/10044/1/11038/2/2012%20EV%20Lit%20Rev%20FINAL.pdf (accessed on 14 November 2021).
- Propfe, B.; Kreyenberg, D.; Wind, J.; Schmid, S. Market Penetration Analysis of Electric Vehicles in the German Passenger Car Market Towards 2030. Int. J. Hydrogen Energy 2013, 38, 5201–5208. [Google Scholar] [CrossRef]
- Wu, G.; Inderbitzin, A.; Bening, C. Total cost of ownership of electric vehicles compared to conventional vehicles: A probabilistic analysis and projection across market segments. Energy Policy 2015, 80, 196–214. [Google Scholar] [CrossRef]
- Tucki, K.; Orynucz, O.; Świć, A.; Mitoraj-Wojtanek, M. The Development of Electromobility in Poland and EU States as a Tool for Management of CO2 Emissions. Energies 2019, 12, 2942. [Google Scholar] [CrossRef] [Green Version]
- Kubiczek, J.; Hadasik, B. Segmentation of Passenger Electric Cars Market in Poland. World Electr. Veh. J. 2021, 12, 23. [Google Scholar] [CrossRef]
- Skrúcaný, T.; Kendra, M.; Stopka, O.; Milojevič, S.; Figlus, T.; Csiszár, C. Impact of the Electric Mobility Implementation on the Greenhouse Gases Production in Central European Countries. Sustainability. 2019, 11, 4948. [Google Scholar] [CrossRef] [Green Version]
- Pietrzak, K.; Pietrzak, O. Environmental Effects of Electromobility in a Sustainable Urban Public Transport. Sustainability 2020, 12, 1052. [Google Scholar] [CrossRef] [Green Version]
- Ruggieri, R.; Ruggieri, M.; Vinci, G.; Poponi, S. Electric Mobility in a Smart City: European Overview. Energies. 2021, 14, 315. [Google Scholar] [CrossRef]
- Połom, M. E-revolution in post-communist country? A critical review of electric public transport development in Poland. Energy Res. Soc. Sci. 2021, 80, 102227. [Google Scholar] [CrossRef]
- Christidis, P.; Focas, C. Factors Affecting the Uptake of Hybrid and Electric Vehicles in the European Union. Energies 2019, 18, 3414. [Google Scholar] [CrossRef] [Green Version]
- Zestawienie Danych Ilościowych Dotyczących Funkcjonowania KSE w 2020 Roku. Raport 2020 KSE (Compilation of Quantitative Performance Data of National Power System in 2020), Polskie Sieci Energetyczne. Available online: https://www.pse.pl/dane-systemowe/funkcjonowanie-kse/raporty-roczne-z-funkcjonowania-kse-za-rok/raporty-za-rok-2020 (accessed on 15 September 2021).
- Ministerstwo Inftrastruktury (Ministry of Infrastructure). Available online: https://www.gov.pl/web/infrastruktura (accessed on 1 October 2021).
- Ministerstwo Klimatu i Środowiska (Ministry of Climate and Environment). Available online: https://www.gov.pl/web/klimat (accessed on 1 October 2021).
- Państwowe Gospodarstwo Wodne Wody Polskie (State Water Holding „Polish Water”). Available online: https://wody.gov.pl/ (accessed on 20 September 2021).
- Główny Urząd Statystyczny (Central Statistic Office). Available online: http://stat.gov.pl/ (accessed on 15 September 2021).
- Urząd Regulacji Energetyki (The Energy Regulatory Office). Available online: https://www.ure.gov.pl/ (accessed on 10 September 2021).
- KOBiZE (Emmisivity of CO2, SO2, NOx, CO and Total PM Indicators for Electric Energy—National Centre for Management and Balancing of Emission). Available online: https://www.kobize.pl/uploads/materialy/materialy_do_pobrania/wskazniki_emisyjnosci/Wskazniki_emisyjnosci_grudzien_2020.pdf (accessed on 16 September 2021).
- Samochody Elektryczne. Ile aut „z Wtyczką” jest w Polsce? Available online: https://www.wyborkierowcow.pl/auta-elektryczne-w-polsce-ile-elektrykow-jest-w-naszym-kraju/ (accessed on 18 May 2021).
- Kowalska-Pyzalska, A.; Kott, M.; Kott, J. Why Polish market of alternative fuel vehicles (AFVs) is the smallest in Europe? SWOT analysis of opportunities and threats. Renew. Sustain. Energy Rev. 2020, 133, 110076. [Google Scholar] [CrossRef]
- Spory Wzrost Rejestracji Samochodów Elektrycznych w 2020 Roku. Wciąż Jednak Jest Ich Niewiele. Available online: https://moto.pl/MotoPL/7,88389,26704563,to-bylo-rekordowe-12-miesiecy-dla-rynku-samochodow-elektrycznych.html (accessed on 20 January 2021).
- Polska ma 3,5 Tysiąca Punktów Ładowania Pojazdów Elektrycznych. Available online: https://www.rynekelektryczny.pl/infrastruktura-ladowania-pojazdow-elektrycznych (accessed on 13 September 2021).
- Ładowanie w Drodze. Available online: https://www.tesla.com/pl_PL/supercharger (accessed on 6 August 2021).
- Available online: https://www.innogy.pl/pl/dla-mediow/2018/innogy-polska-udostepnia-kolejne-stacje-ladowania-samochodow-elektrycznych (accessed on 26 June 2019).
- Smartdriver. z Myślą o Kierowcach. Available online: https://www.smartdriver.pl/liczba-samochodow-w-polsce-ile-aut-jezdzi-po-polskich-drogach (accessed on 8 July 2020).
- Available online: https://www.autodna.pl/blog/sredni-przebieg-auta-w-polsce-europie/ (accessed on 25 June 2019).
- Available online: https://www.rp.pl/artykul/649811-Straty-w-przesyle-siegaja-w-kraju-12-proc-energii-rocznie.html, (accessed on 25 June 2019).
- Zakrzewska, S.; Gil-Świderska, A. Energetyczna infrastruktura krytyczna w Polsce- perspektywy i zagrożenia (Energetic critical infrastructure in Poland—Perspectives and threats). Rynek Energii 2018, 138, 55–64. [Google Scholar]
- Available online: https://www.eea.europa.eu/data-and-maps/daviz/countries-breakdown-actual-res-progress-10#tab-chart_2 (accessed on 25 December 2020).
- Jankiewicz, S. Infrastruktura energetyczna jako istotny element bezpieczeństwa Polski (Energy infrastructure as an important elemnet of Poland’s security). Przedsiębiorczość Zarządzanie 2018, IX, 195–202. [Google Scholar]
- Niewiedział, E. Efektywność energetyczna a straty energii elektrycznej (Energetical efficiency against electricity loses). Elektro Info 2017, 154, 47–53. [Google Scholar]
- Niewiedział, E.; Niewiedział, R. Analiza Statystyczna Strat Energii Elektrycznej w Krajowym Systemie Elektroenergetycznym w XXI Wieku (Statistical Analysis of Electrical Energy Loses in National Power System in XXI Century). Available online: http://straty.ptpiree.pl/konferencje/straty/2018/straty_2018.pdf (accessed on 8 July 2020).
- Available online: https://www.pse.pl/dane-systemowe/funkcjonowanie-kse/raporty-roczne-z-funkcjonowania-kse-za-rok/raporty-za-rok-2019 (accessed on 27 June 2020).
- Polityka Energetyczna Polski do 2040 Roku. Ministerstwo Klimatu i Środowiska (Energetic Policy in Poland to 2040. Ministry of Climate and Environment). Available online: https://www.gov.pl/web/klimat/polityka-energetyczna-polski (accessed on 20 September 2021).
- Raport. Energetyka, Dystrybucja i Przesył. Poznań (Report. Energetic, Distribution and Transfer). Available online: http://ptpiree.pl/raporty/2021/raport_ptpiree_2021.pdf (accessed on 8 July 2020).
- Wróblewski, P.; Kupiec, J.; Drożdż, W.; Lewicki, W.; Jaworski, J. The economic aspect of using different plug-in hybrid driving techniques in urban conditions. Energies 2021, 14, 3543. [Google Scholar] [CrossRef]
- Available online: https://www.autautobaza.pl/page/portal/news/norms-exhaust-emissions-euro-6/ (accessed on 12 October 2021).
- Karczewski, M.; Szczęch, L.; Polak, F.; Brodowski, S. Analysis of electric vehicles efficiency and their influence on environmental pollution. J. Kones 2019, 26, 97–104. [Google Scholar] [CrossRef]
- Wróblewski, P.; Lewicki, W. A Method of Analyzing the Residual Values of Low-Emission Vehicles Based on a Selected Expert Method Taking into Account Stochastic Operational Parameters. Energies 2021, 14, 6859. [Google Scholar] [CrossRef]
- Available online: https://pl.wikipedia.org/wiki/Elektrownia_wiatrowa (accessed on 12 October 2021).
- Available online: https://pl.wikipedia.org/wiki/Farma_Wiatrowa_Zagórze (accessed on 12 October 2021).
- Lenarczyk, J. Wyniki sezonowych badań wydajności energetycznej instalacji fotowoltaicznej o mocy szczytowej 668 W (Results of seasons investigation of energatic efficiency of photovoltaic installation with 668 W peak power). Probl. Inżynierii Rol. 2013, 1, 151–160. [Google Scholar]
- Available online: www.teraz-srodowisko.pl/aktualności/recycling-lopaty-turbin-wiatrowych-raport-8792.html (accessed on 13 September 2021).
- Available online: www.syntezaoze.pl/blog/lifetime-solar-panels (accessed on 13 September 2021).
- Available online: www.panergiaplanergia.pl/post/kasakad-dolnej-wisły-mogla-by-dawac-nawet-4-twh-energii-rocznie-2212 (accessed on 13 September 2021).
- Zdulski, W.; Kosiński, J. Hydropower potential of the Vistula. Acta Energetica 2013, 15, 38–47. [Google Scholar] [CrossRef]
- Szydłowski, M.; Gąsiorowski, D.; Szymkiewicz, R.; Zima, P.; Hakiel, J. Hydropower potential in the lower Vistula. Acta Energetica 2015, 1/22, 18–25. [Google Scholar] [CrossRef]
- Hoffmann, M. Present State and prospects of development of water-power engineering in Poland with special regard paid to demand for water turbines. Prace Instututu Masz. Przepływowych 1989, 90, 51–60. [Google Scholar]
- Zimny, J.; Michalak, P.; Bielik, S.; Szczotka, K. Directions in development of hydropower in the world, in Europe and Poland in the period 1995–2011. Renew. Sustain. Energy Rev. 2013, 21, 117–130. [Google Scholar] [CrossRef]
- Kubiak-Wójcicka, K.; Szczęch, L. Exploitation of Rivers in Poland for Electricity Production—Current Condition and Perspectives for Development. In Management in Water Resources in Poland; Zelenakova, M., Kubiak-Wójcicka, K., Negm, A.M., Eds.; Springer International Publishing: New York, NY, USA, 2021; pp. 327–355. [Google Scholar] [CrossRef]
- Kubiak-Wójcicka, K.; Szczęch, L. Dynamics of Electricity Production against the Backdrop of Climate Change: A Case Study of Hydropower Plants in Poland. Energies 2021, 12, 3427. [Google Scholar] [CrossRef]
- Steller, J. Hydropower and its development. Acta Energetica 2013, 3/16, 7–20. [Google Scholar] [CrossRef]
- Hawkins, T.; Gausen, O.; Stromman, A. Environmental Impacts of Hybrid and Electric Vehicles—A Review. Int. J. Life Cycle Assess. 2012, 8, 997–1014. [Google Scholar] [CrossRef]
- Bochenek, B.; Jurasz, J.; Jaczewski, A.; Stachura, G.; Sekuła, P.; Strzyżewski, T.; Wdowikowski, M.; Figurski, M. Day-Ahead Wind Power Forecasting in Poland Based on Numerical Weather Prediction. Energies 2021, 14, 2164. [Google Scholar] [CrossRef]
- Kubiak-Wójcicka, K.; Machula, S. Influence of climate changes on the state of water resources in Poland and their usage. Geosciences 2020, 8, 312. [Google Scholar] [CrossRef]
- Kubiak-Wójcicka, K. Variability of air temperature, precipitation and outflows in the Vistula basin (Poland). Resources 2020, 9, 103. [Google Scholar] [CrossRef]
- Ajanovic, A.; Haas, R. On the Environmental Benignity of Electric Vehicles. J. Sustain. Dev. Energy Water Environ. Syst. 2019, 3, 416–431. [Google Scholar] [CrossRef]
Publisher’s Note: MDPI stays neutral with regard to jurisdictional claims in published maps and institutional affiliations. |
© 2022 by the authors. Licensee MDPI, Basel, Switzerland. This article is an open access article distributed under the terms and conditions of the Creative Commons Attribution (CC BY) license (https://creativecommons.org/licenses/by/4.0/).