Article

Effect of Chordwise Struts and Misaligned Flow on the Aerodynamic Performance of a Leading-Edge Inflatable Wing

Faculty of Aerospace Engineering, Delft University of Technology, 2629 HS Delft, The Netherlands
*
Author to whom correspondence should be addressed.
These authors contributed equally to this work.
Energies 2022, 15(4), 1450; https://doi.org/10.3390/en15041450
Submission received: 4 November 2021 / Revised: 11 February 2022 / Accepted: 14 February 2022 / Published: 16 February 2022
(This article belongs to the Special Issue Airborne Wind Energy Systems)

Abstract

:
Leading-edge inflatable (LEI) kites use a pressurized tubular frame to structurally support a single skin membrane canopy. The presence of the tubes on the pressure side of the wing leads to characteristic flow phenomena for this type of kite. In this paper, we present steady-state Reynolds-Averaged Navier-Stokes (RANS) simulations for a LEI wing for airborne wind energy applications. Expanding on previous work where only the leading-edge tube was considered, eight additional strut tubes that support the wing canopy are now included. The shape of the wing is considered to be constant. The influence of the strut tubes on the aerodynamic performance of the wing and the local flow field is assessed, considering flow configurations with and without side-slip. The simulations show that the aerodynamic performance of the wing decreases with increasing side-slip component of the inflow. On the other hand, the chordwise struts have little influence on the integral lift and drag of the wing, irrespective of the side-slip component. The overall flow characteristics are in good agreement with previous studies. In particular, it is confirmed that at a low Reynolds number of Re = 10 5 , a laminar separation bubble exists on the suction side of this hypothetical rigid wing shape with perfectly smooth surface. The destruction of this bubble at low angles of attack impacts negatively on the aerodynamic performance.

1. Introduction

Wind energy will be a key enabler for the global energy transition in the years to come [1,2]. To meet the climate goals that many nations have set, wind power will have to grow at an unprecedented rate and will need to be harnessed at new locations. This also drives the development of new concepts that are low cost, resource efficient, and fast to deploy and that have a low environmental impact. Airborne wind energy (AWE) is one of these emerging technologies, using flying devices that are tethered to the ground, to harness wind energy at higher altitudes [3].
One prominent implementation of the technology uses the pulling force of a wing that is tethered to a ground-based drum-generator module. For continuous power generation, the wing is operated in pumping cycles, alternating between tether reel-out and reel-in phases. During reel out, the wing flies fast crosswind manoeuvres and the torque acting on the rotating drum is converted into electrical power. To maximise the generated power, a high angle of attack of the wing is maintained. For reel-in, the crosswind maneuvers are discontinued and the wing depowered, for example, by lowering the angle of attack. As consequence, the wing is subjected to a wide range of operational conditions during pumping cycle operation. For a leading-edge inflatable (LEI) wing flying figure-of-eight crosswind manoeuvres, typical variations of the angle of attack are 6 α 16 during the reel-out phases and 8 α 4 during the reel-in phases [4,5]. The sideslip angle, which is measured between the wing heading and the actual inflow, varies between 10 and 10 . For an accurate prediction of the power output, it is important to know the aerodynamic performance of the wing over the entire operation cycle.
The aerodynamic characteristics of LEI wings for airborne wind energy applications have been studied both numerically and experimentally in the past. So far, experimental work was mainly focused on in-flight measurements, either by executing flight manoeuvres tethered to a fixed ground station [5,6,7,8,9] or by towing the wing with a vehicle [10,11,12]. Wind tunnel tests are only of limited use because of the inherent difficulty to down-scale the inflatable membrane structure and at the same time maintain its aero-elastic properties. Whilst in-flight measurements are useful to understand the overall behaviour of the wing under realistic conditions, they do not easily allow for isolating the effects of different parameters on the aerodynamic performance. Numerical simulations, by contrast, are well suitable for a systematic investigation of different inflow conditions with varying parameters, one at a time.
Numerical studies can be classified according to the level of model fidelity. Potential flow methods, such as the lifting line method or the vortex lattice method (VLM), are computationally efficient and particularly suitable for quick design iterations. Methods based on solving the Navier-Stokes equations, on the other hand, are generally more accurate, because they are able to inherently resolve flow separation and turbulence, but the effort to generate a high-quality volume mesh is also much higher.
In [13], the classic lifting line method was adapted to kite wings with variable dihedral and sweep angles. The direct solution is based on a collocation method which can not account for a non-linear behaviour of the lift coefficient, limiting the use to small angles of attack. In [14], an extension to a three-dimensional non-linear lifting line method was presented to account for the non-linearity of the lift coefficient. Using a conventional NACA2412 airfoil, the method was compared to Reynolds-Averaged Navier-Stokes (RANS) simulations. The global results of the lifting line method agreed well with the more accurate RANS simulations, however, because the wing cross section was a conventional airfoil, the use of this validation for LEI wings with characteristic flow separation and reattachment on the pressure side is limited. In [15], a vortex lattice method (VLM) with additional corrections to account for suction side flow separation and wing thickness was presented. The computed lift coefficient was in agreement with RANS simulations, whereas the drag coefficient showed some deviations at higher angles of attack and sideslip angles. Also this study used a conventional airfoil to describe the wing cross section.
In [16], the aerodynamics of LEI wings with characteristic tube-canopy airfoil was investigated by two-dimensional RANS simulations of spanwise wing sections. The shape of the airfoils was parametrised by airfoil camber, airfoil thickness and angle of attack. The computed load distribution was used to analyse the aero-elastic response of different LEI wings, represented by multi-body models. Three-dimensional flow effects were however not taken into account. In [17], the flow around a complete LEI wing was computed with a multiple-wake VLM with the aim to also include three-dimensional flow effects with a limited computational effort. However, the method failed to capture the reattachment of the flow that separates from the leading edge tube on the pressure side. In [18], the flow around a LEI airfoil was investigated using a steady-state k ω SST RANS framework for the Reynolds number range 10 5 Re 5 × 10 7 . A γ Re ˜ θ t transition model was included such that the simulation results could be compared with wind tunnel measurements of a scaled wing model made of polished metal. In [19,20], this two-dimensional simulation set-up was extended to investigate the aerodynamics of a complete LEI wing, the TU Delft V3A kite, but without modelling the strut tubes. Similarly to the two-dimensional analysis, it was found that the laminar-turbulent transition model is needed to predict stall accurately for the perfectly smooth geometry up to at least Re = 3 × 10 6 . The work highlighted the presence of a laminar separation bubble at low Re and a non-monotonic variation of the maximum lift coefficient with Re . Experimental results for the aerodynamics of this specific wing were provided in [5,7,21,22].
The present study builds on the work of [19,20] with the focus on two effects that were not considered before. Firstly, the influence of the chordwise struts on the local flow development and aerodynamic performance will be assessed by adding these geometrical features to the wing. Secondly, the influence of a non-zero sideslip angle will be investigated. The manuscript is organised as follows. The methodology is presented in Section 2, describing the local adjustment of the design geometry to make it suitable for CFD analysis, the generation of the surface and volume meshes and the setup of the CFD simulations. Results are discussed in Section 3. First, flows without side-slip are considered and the results with struts are compared to those without struts. Second, the influence of the side-slip angle is analysed for one specific value of Reynolds number and angle of attack. Finally, the conclusions are presented in Section 4.

2. Methodology

The description of the methodology is divided into three parts: the required local adjustments of the design geometry, the meshing of the wing surface and the surrounding flow volume, and the setup of the CFD simulations.

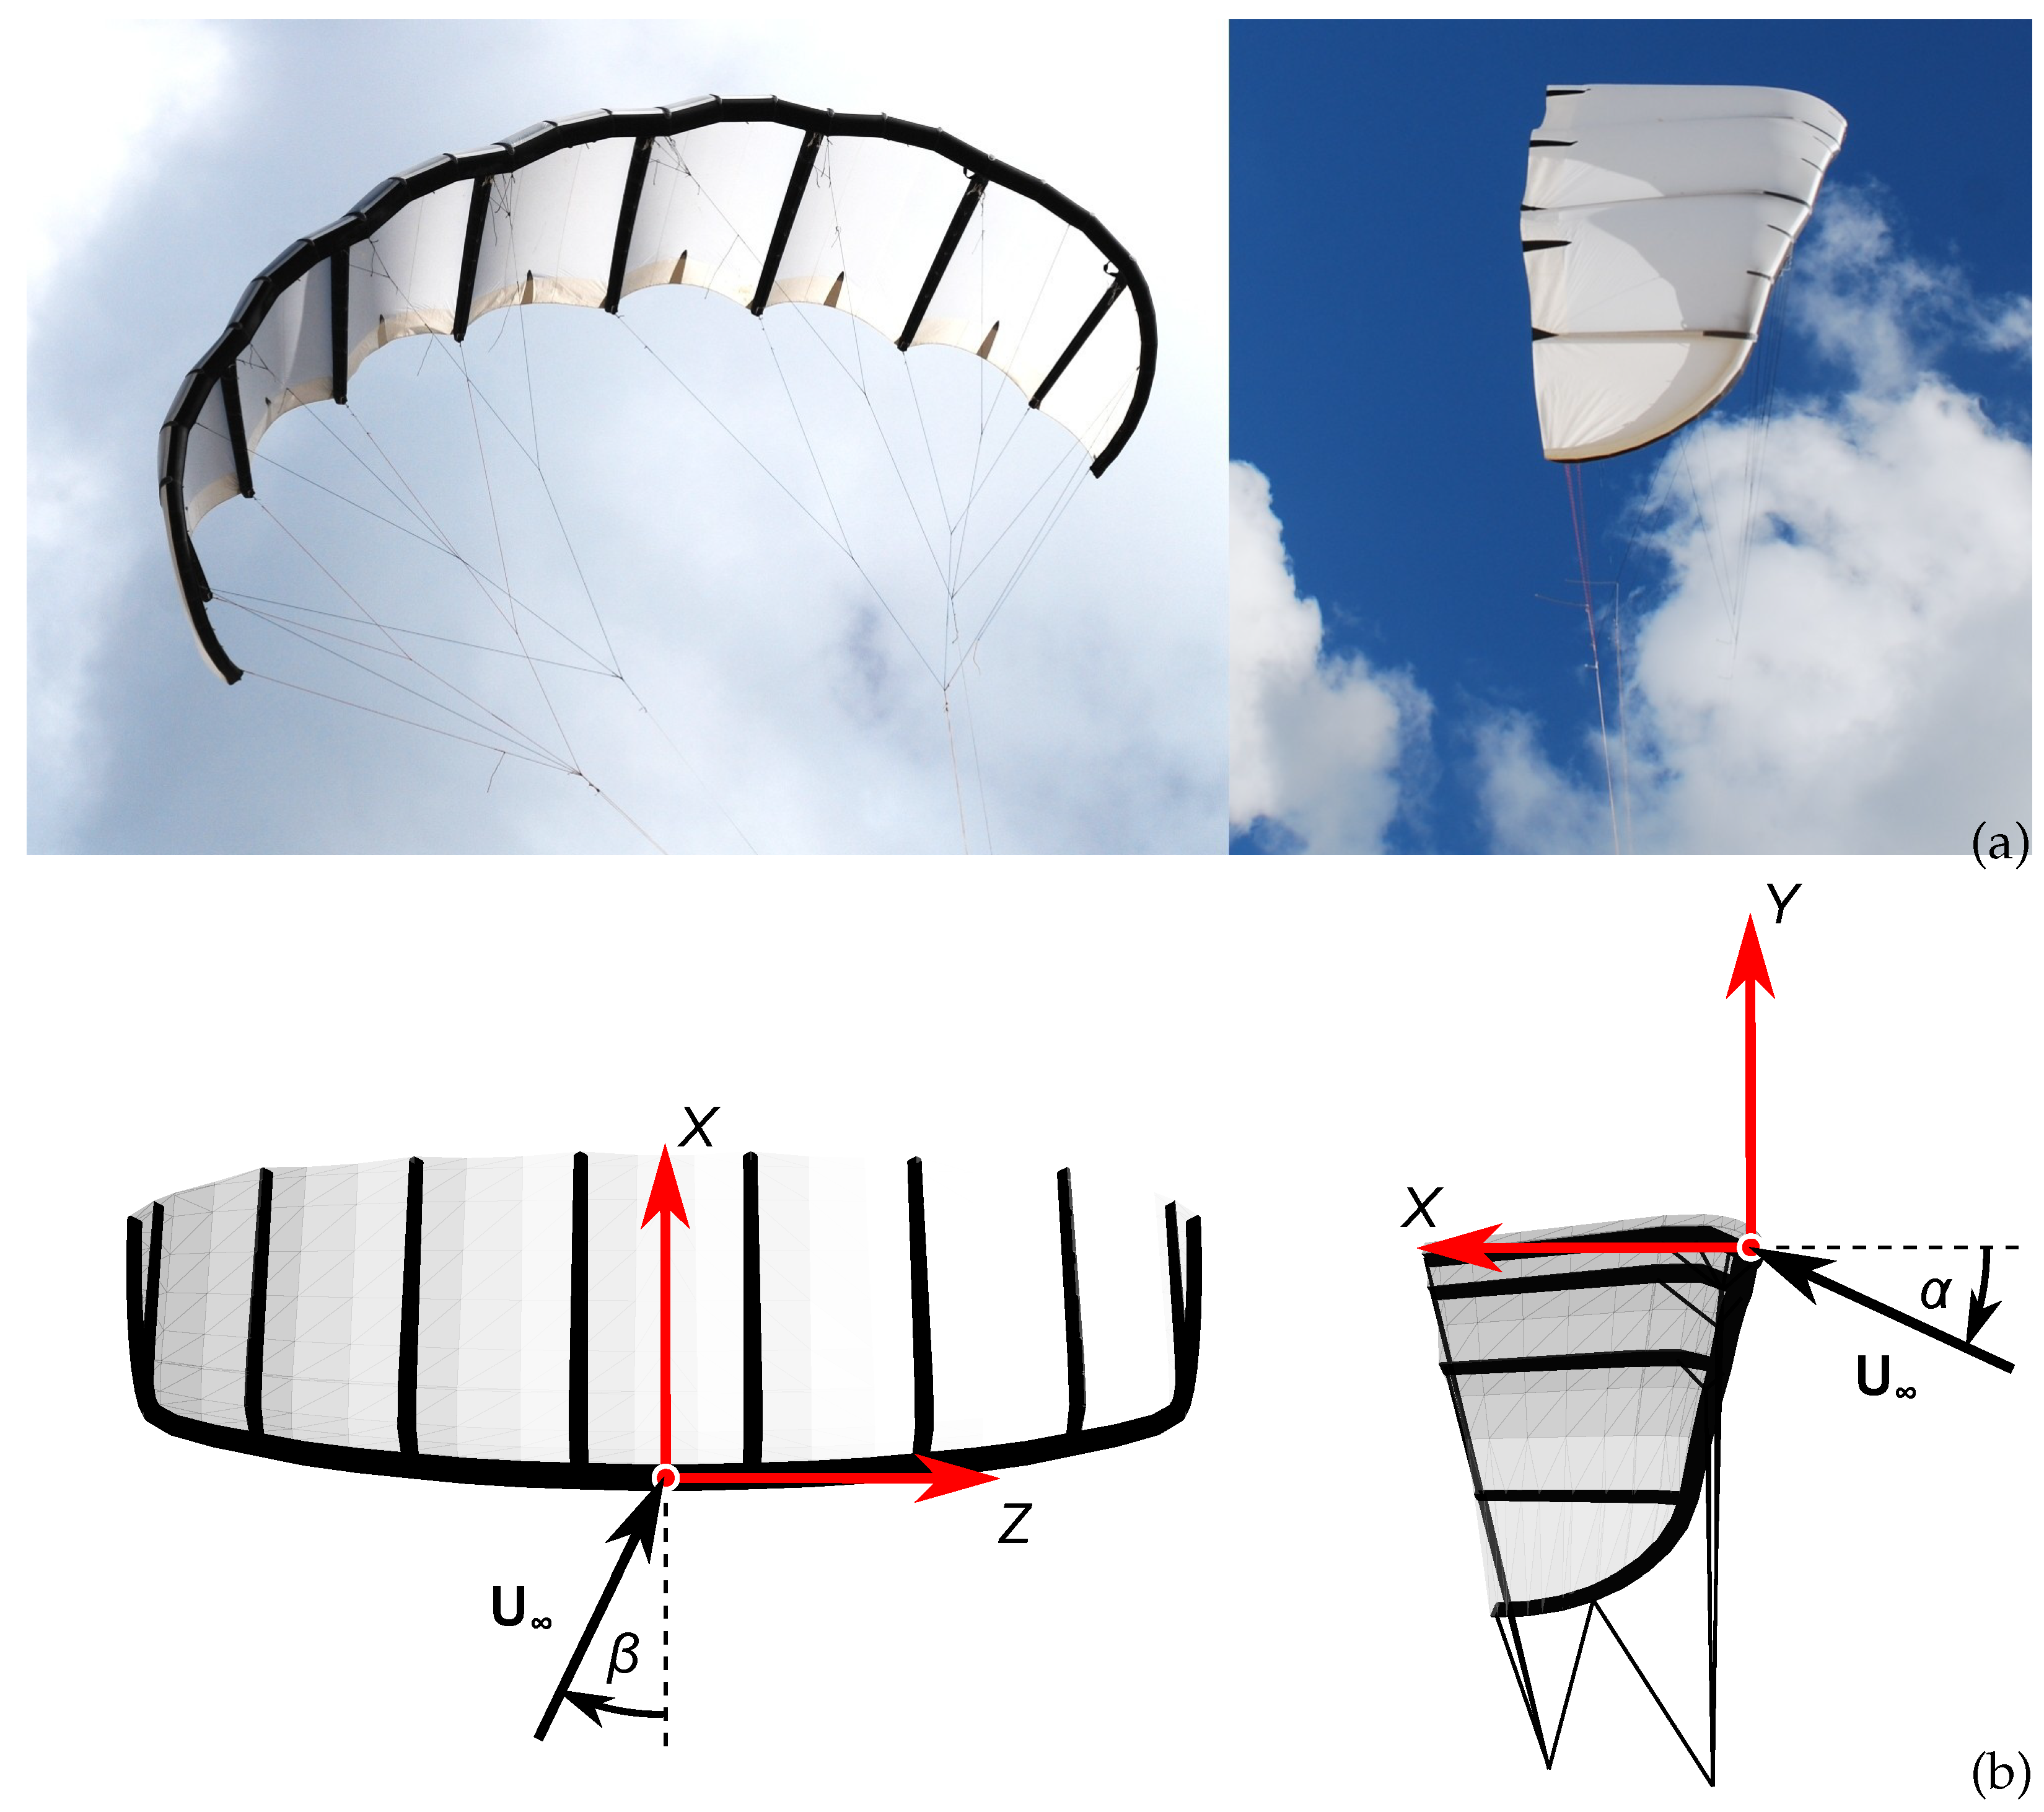
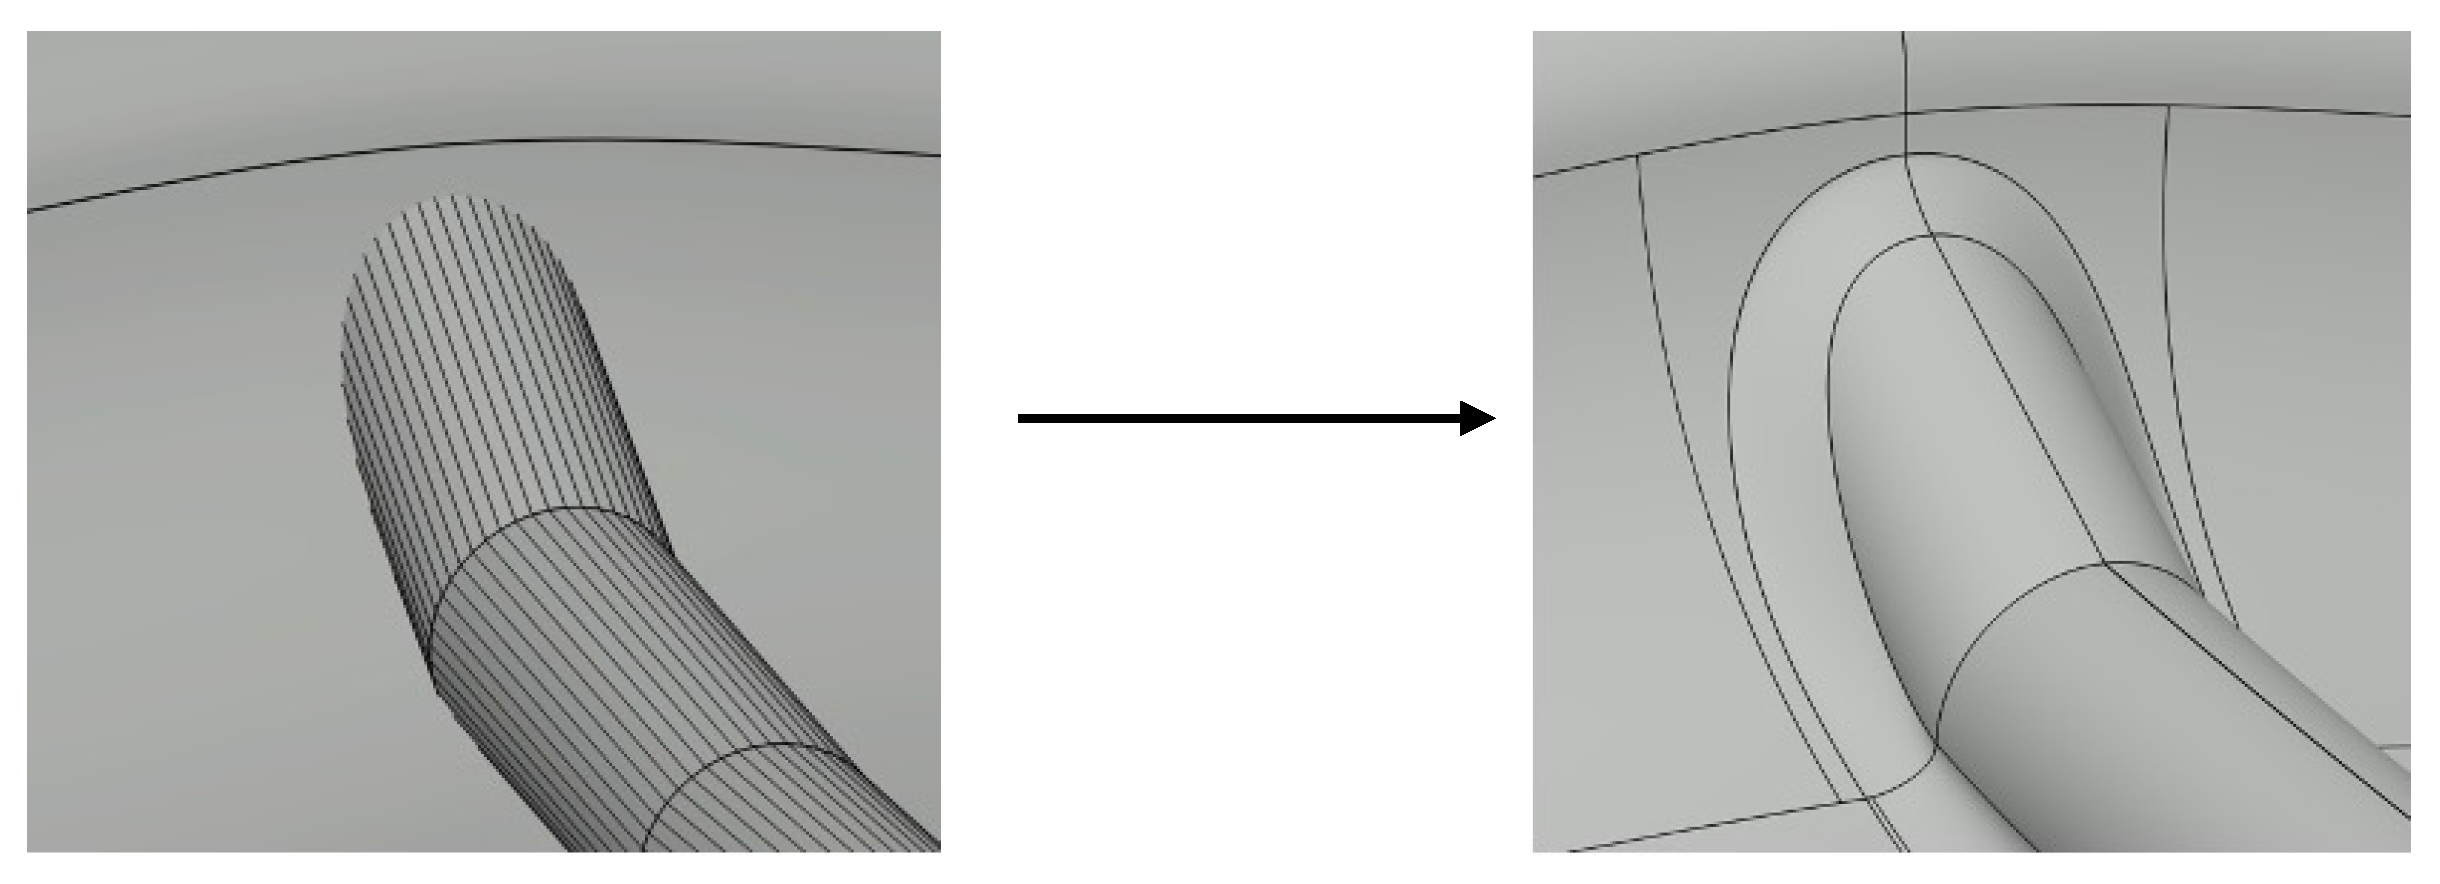
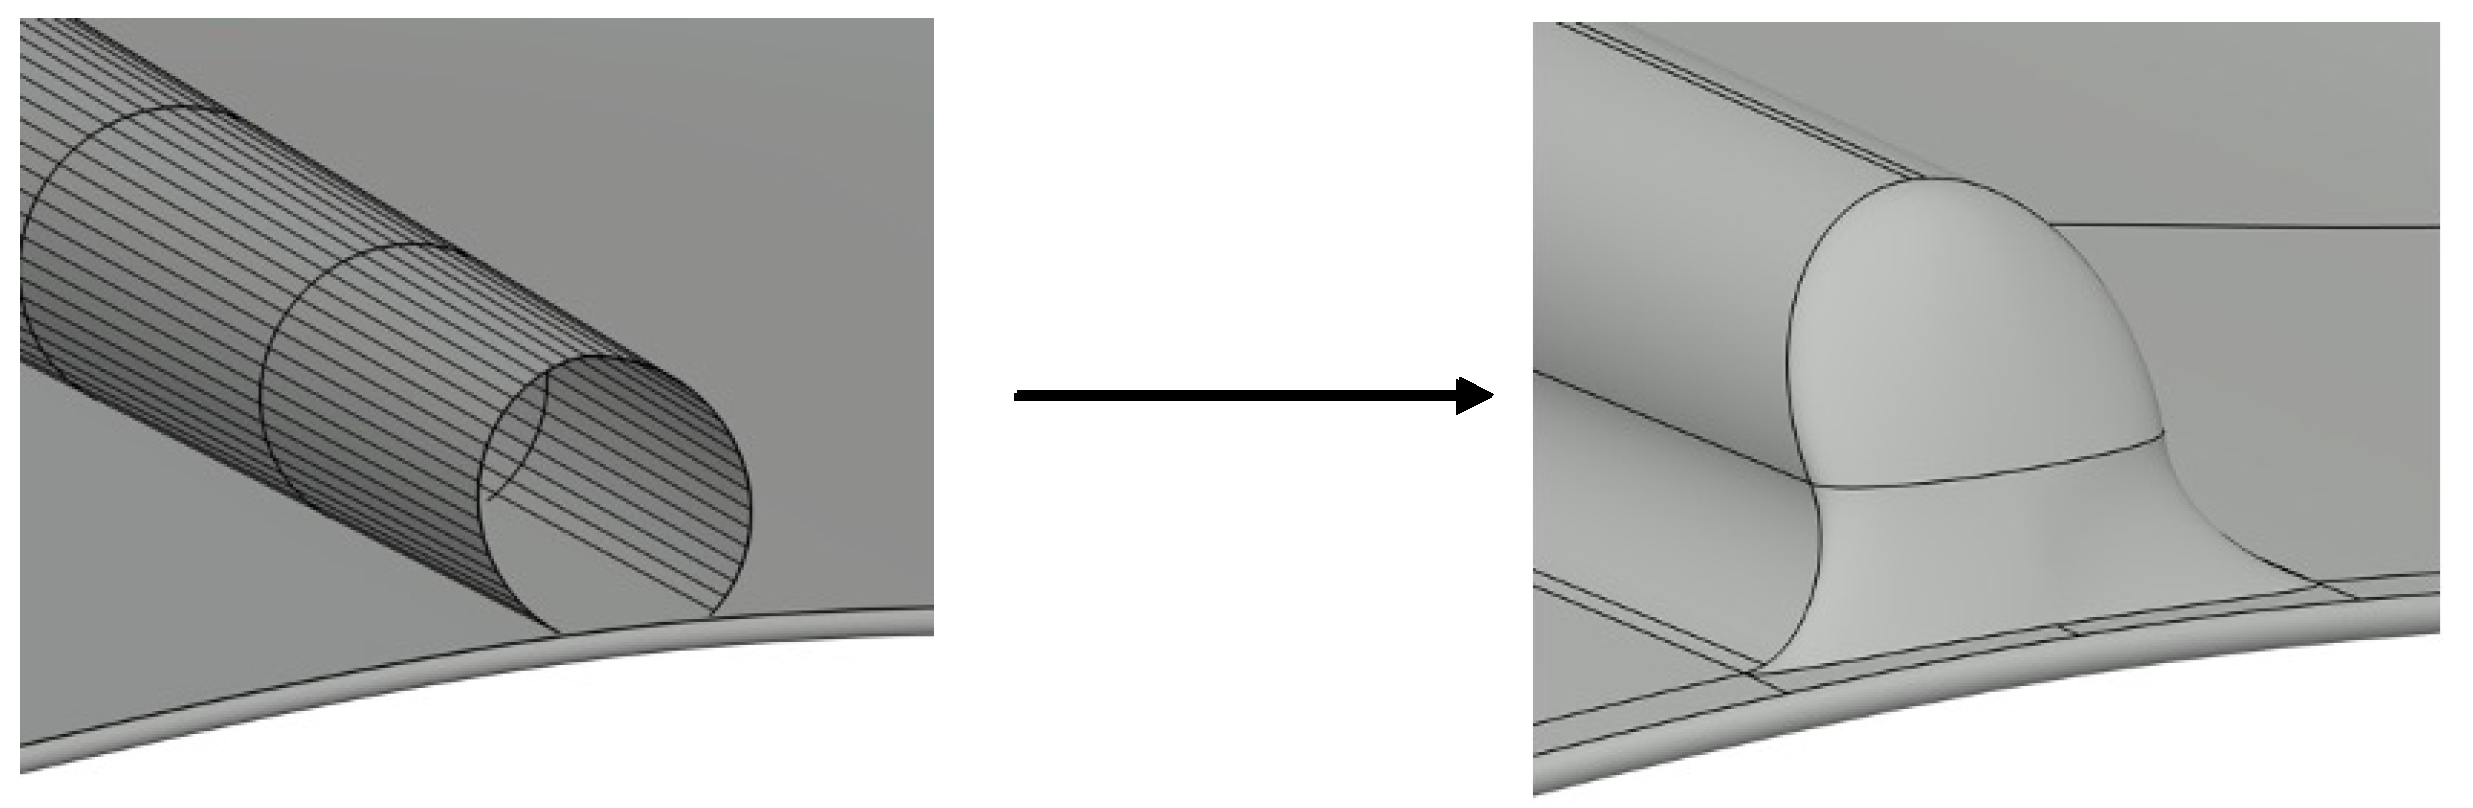
2.1. Geometric Model of the Wing

The investigated LEI wing is illustrated in Figure 1. It consists of a thin membrane canopy (white) supported by an inflatable leading edge tube and eight inflatable strut tubes (black).
The aerodynamic load distribution generated by the flying wing is collected by fans of bridle lines that attach to the leading edge and strut tubes. The bridle lines are not taken into account in this study. More information about the specific kite and its use for energy harvesting is provided in [5].
As discussed in the previous section, the aerodynamics of this specific wing was already analysed numerically in previous studies. However, struts were so far omitted, to simplify the mesh generation and reduce the computational effort. In this work, the eight strut tubes of the original design geometry used in [19,20] are taken into account. A number of modifications are required to prepare the mesh generation process. Firstly, the original struts made of polyline cross sections are re-created using circular cross sections. Secondly, the regions where the tubes attach to the canopy are smoothed by fillets, as shown in Figure 2. Thirdly, the open strut tubes of the original geometry are closed to provide a water-tight closed surface geometry of the wing, as shown in Figure 3.
Because the objective of this study is a non-dimensional flow analysis, the wing is scaled such that the chord length in the symmetry plane is equal to one. Results are accordingly presented in terms of non-dimensional variables.

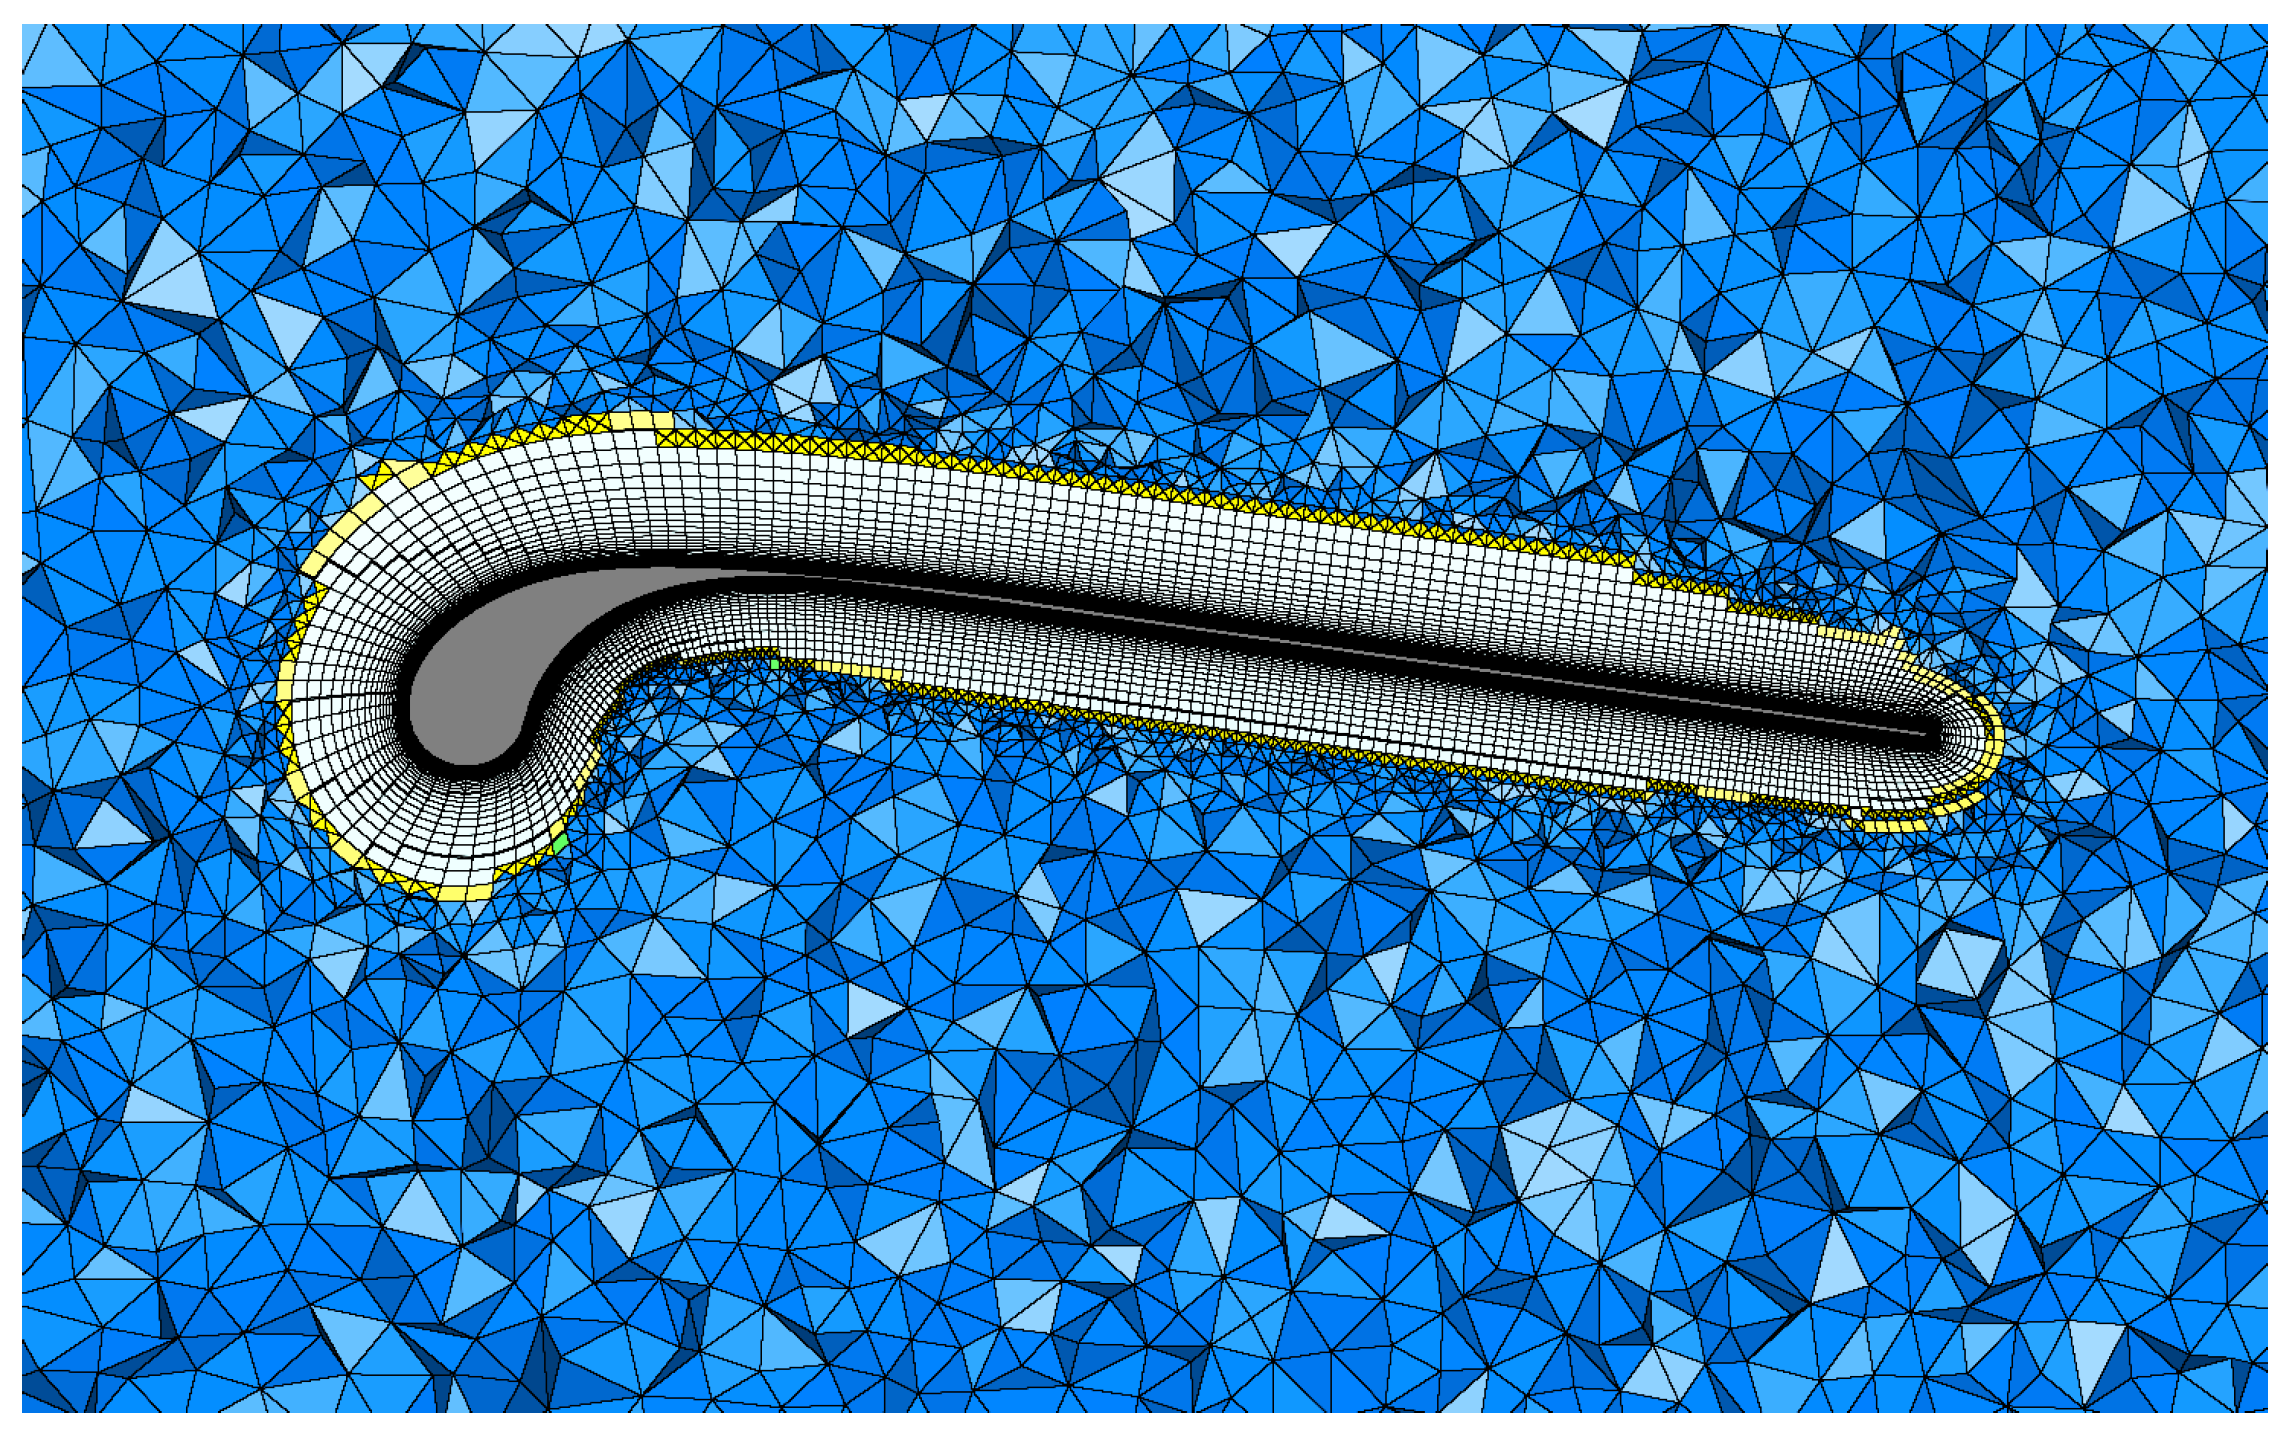
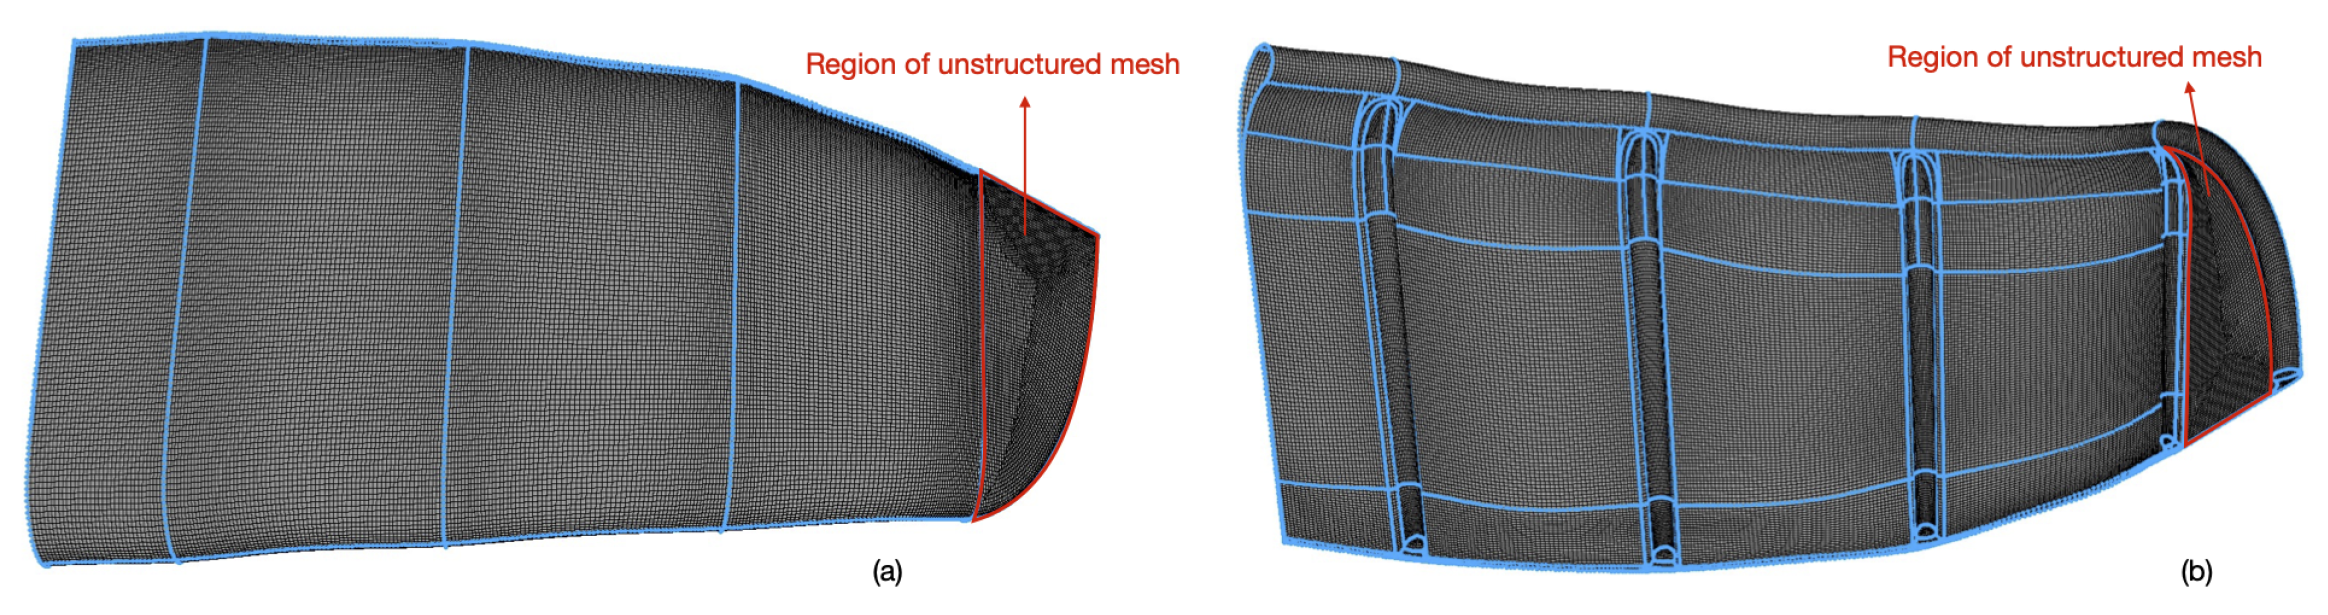
2.2. Meshing of the Wing Geometry

The mesh is generated with the commercial software PointWise. First, the entire wing surface is subdivided into regions to facilitate the generation of a structured surface mesh, except for the tip region, where unstructured meshing is used. The regions of unstructured mesh are delimited by the red lines in Figure 4.
For simulations without side-slip component of the inflow, only half of the wing is considered as the steady-state flow is expected to be symmetric. This was confirmed by an exemplary flow simulation for the full wing. For flow cases without side-slip, the wing is placed in a domain whose far field boundary is a hemisphere with a radius of 84 chord lengths from the wing. For flow cases with side-slip, the domain is a complete sphere. In both cases, the volume mesh is generated with the T-Rex algorithm of PointWise, which first extrudes the wing surface mesh with hexahedral cell fronts. The extrusion is stopped when one of the following criteria is met: cell isotropy is reached, cell fronts collide, quality of cells is below threshold, or the maximum number of hexahedral cell layers is reached. The latter is an input parameter which is set to 100 in this work. The minimum number of extruded layers is set to 5. Additionally, the growth rate of the extruded layers equals 1.15. When the hexahedral cell layers stop, the mesh algorithm generates tetrahedral cells in the rest of the domain. In this study, the boundary layer mesh at the wing surface uses a non-dimensional height y + 1 of the first cell. Good mesh qualities were obtained without hard constraints on the level of skewness of the mesh cells. The maximum cell angle was set to 170 . A slice through the volume mesh in the symmetry plane is shown in Figure 5.
A mesh convergence study was performed on five different meshes with cell counts on the wing surface ranging from 10.9 × 10 6 down to 5.67 × 10 6 . Coarser meshes of good quality were difficult to generate. The computed lift and drag coefficients of the wing were nearly constant across these mesh resolutions. For example, for a Reynolds number of 3 × 10 6 , an angle of attack α = 12 and a side-slip angle β = 0 , the lift and drag coefficients varied by less than 1% and 2.9%, respectively. The Reynolds number is defined here as Re = U c / ν , and the lift and drag coefficients as C L = 2 L / ( ρ U 2 A r e f ) and C D = 2 D / ( ρ U 2 A r e f ) , respectively, where U is the undisturbed flow velocity, c the chord length in the symmetry plane, ν the kinematic viscosity, L the lift force, D the drag force, ρ the fluid density, and A r e f the projected area of the design geometry of the wing onto the X Z -plane illustrated in Figure 1 (bottom left). Taking into account the findings of the mesh convergence study, the mesh used for the simulations without side-slip (hemispherical flow domain) had a total cell count of 8.1 × 10 6 on the wing surface and 16.3 × 10 6 in the whole computational volume.

2.3. Fluid Dynamic Solver

The CFD simulations are performed with the open-source solver OpenFOAM v2006. The model uses a finite-volume discretisation of the incompressible steady-state RANS equations for a Newtonian fluid. Here, these equations are solved using a k ω SST turbulence model [24] including also a γ Re ˜ θ t transition model [25]. The model setup and parameters are identical to those considered in [20] and are therefore not repeated here. With these choices of settings and numerical schemes, all the simulations were stable and converged for the whole range of Reynolds number, angle of attack and sideslip angle considered here. The models have also been thoroughly validated in [18].
Two sets of simulations are performed for a range of Reynolds numbers between Re = 10 5 and Re = 15 × 10 6 . In a first set, the side-slip angle β is kept constant at zero and the angle of attack is varied in the range 5 α 24 . In a second set, the angle of attack is fixed at α = 12 and three values of the side-slip angle, β = 4 , 8 , 12 , are chosen. The steady-state solver is run for 4000 iterations in the absence of side-slip and 6000 iterations with side-slip, respectively. This was found to be sufficient for all the residuals to fall well below a value of 10 5 . The results are shown in the next section.

3. Results

First, the simulation results without side-slip ( β = 0 ) are discussed and the influence of the strut tubes on the aerodynamic performance of the wing is analysed. Second, the impact of non-zero side-slip angles is assessed for the wing, with and without strut tubes. The results are presented in terms of non-dimensional variables.

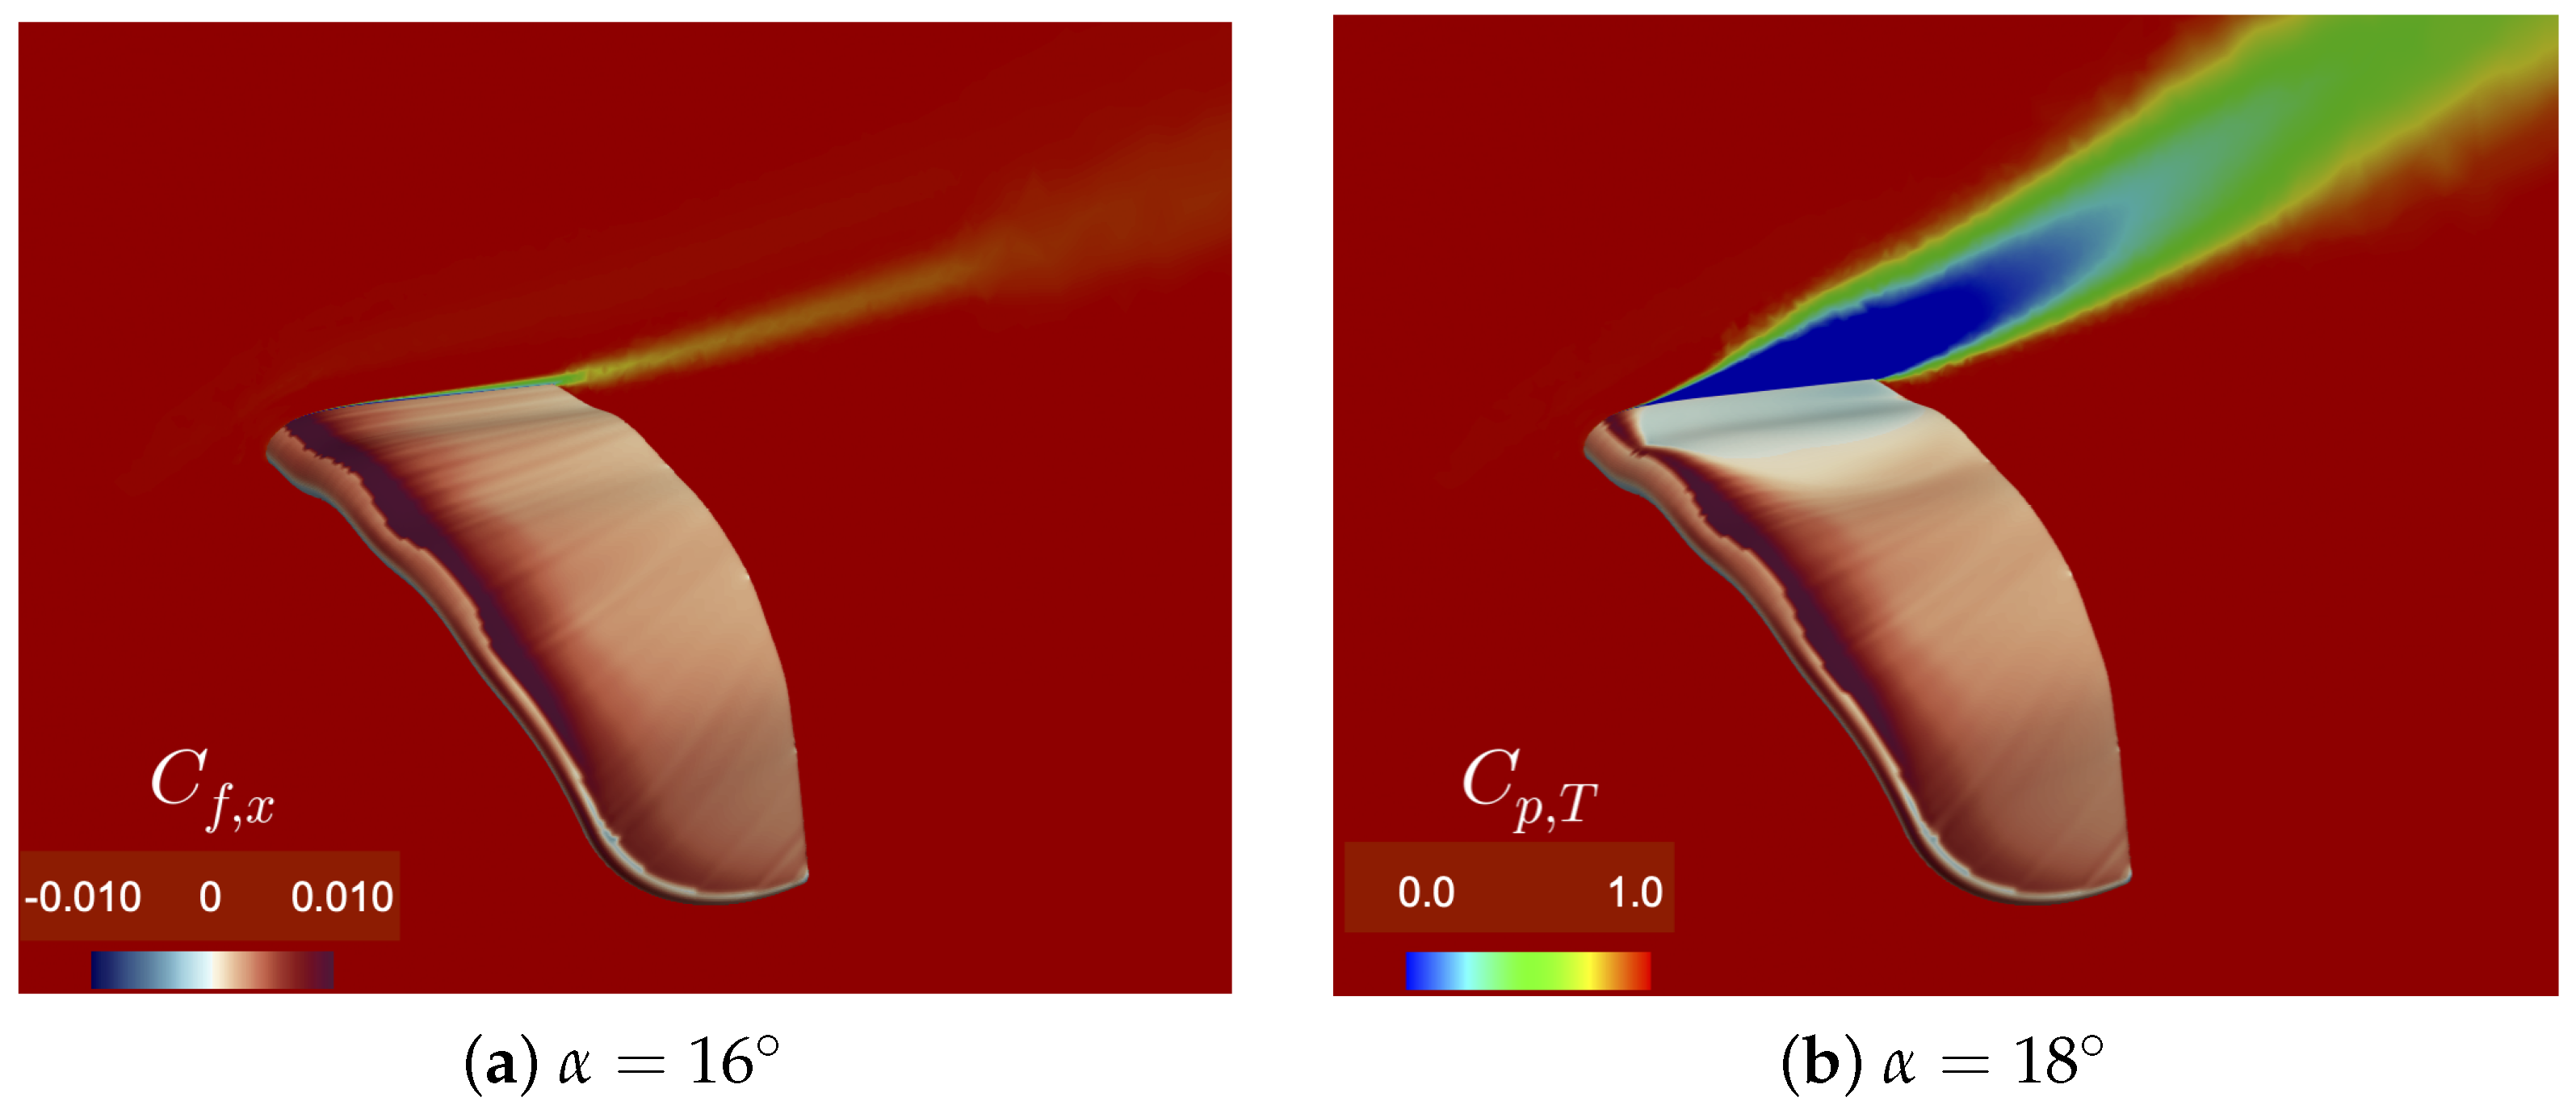
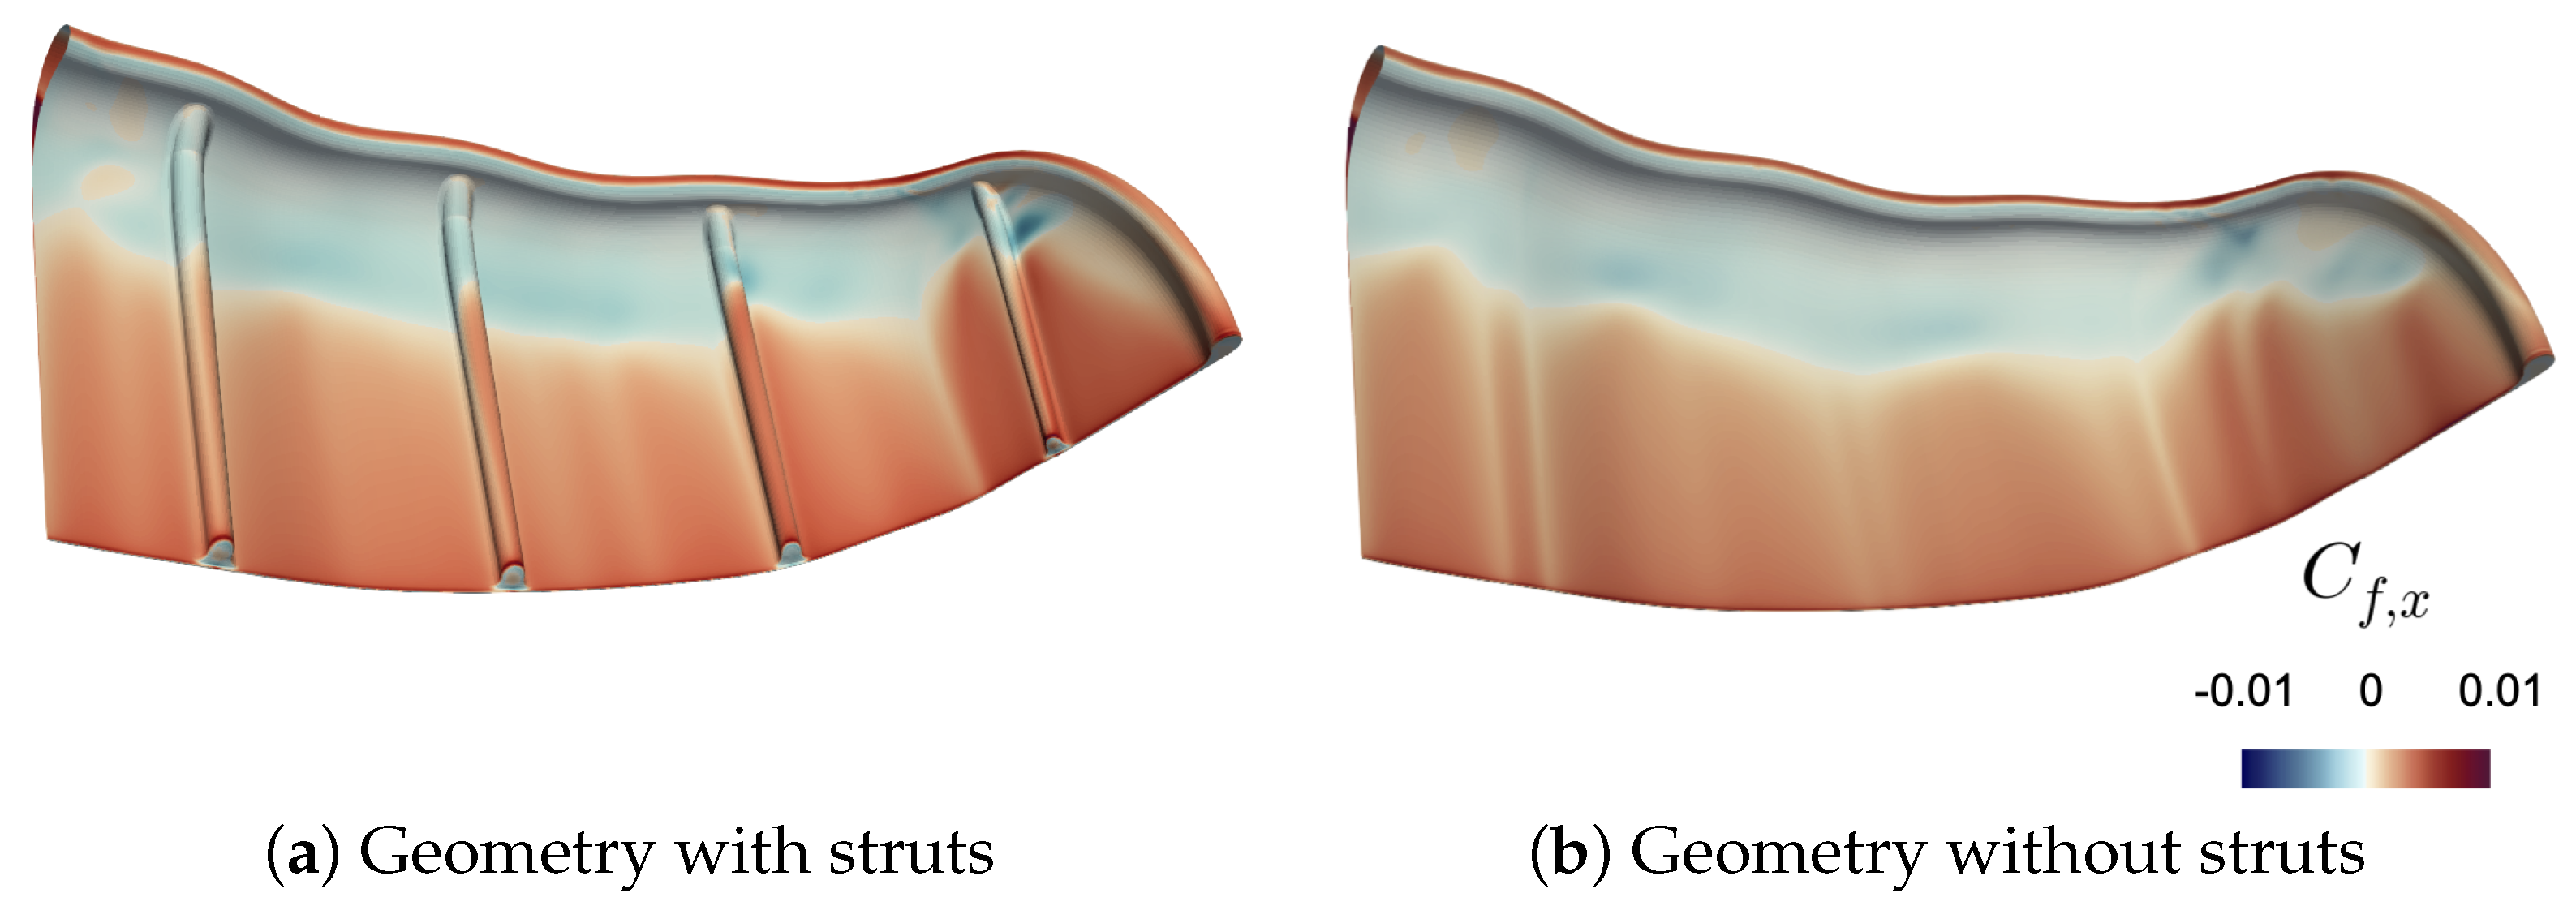
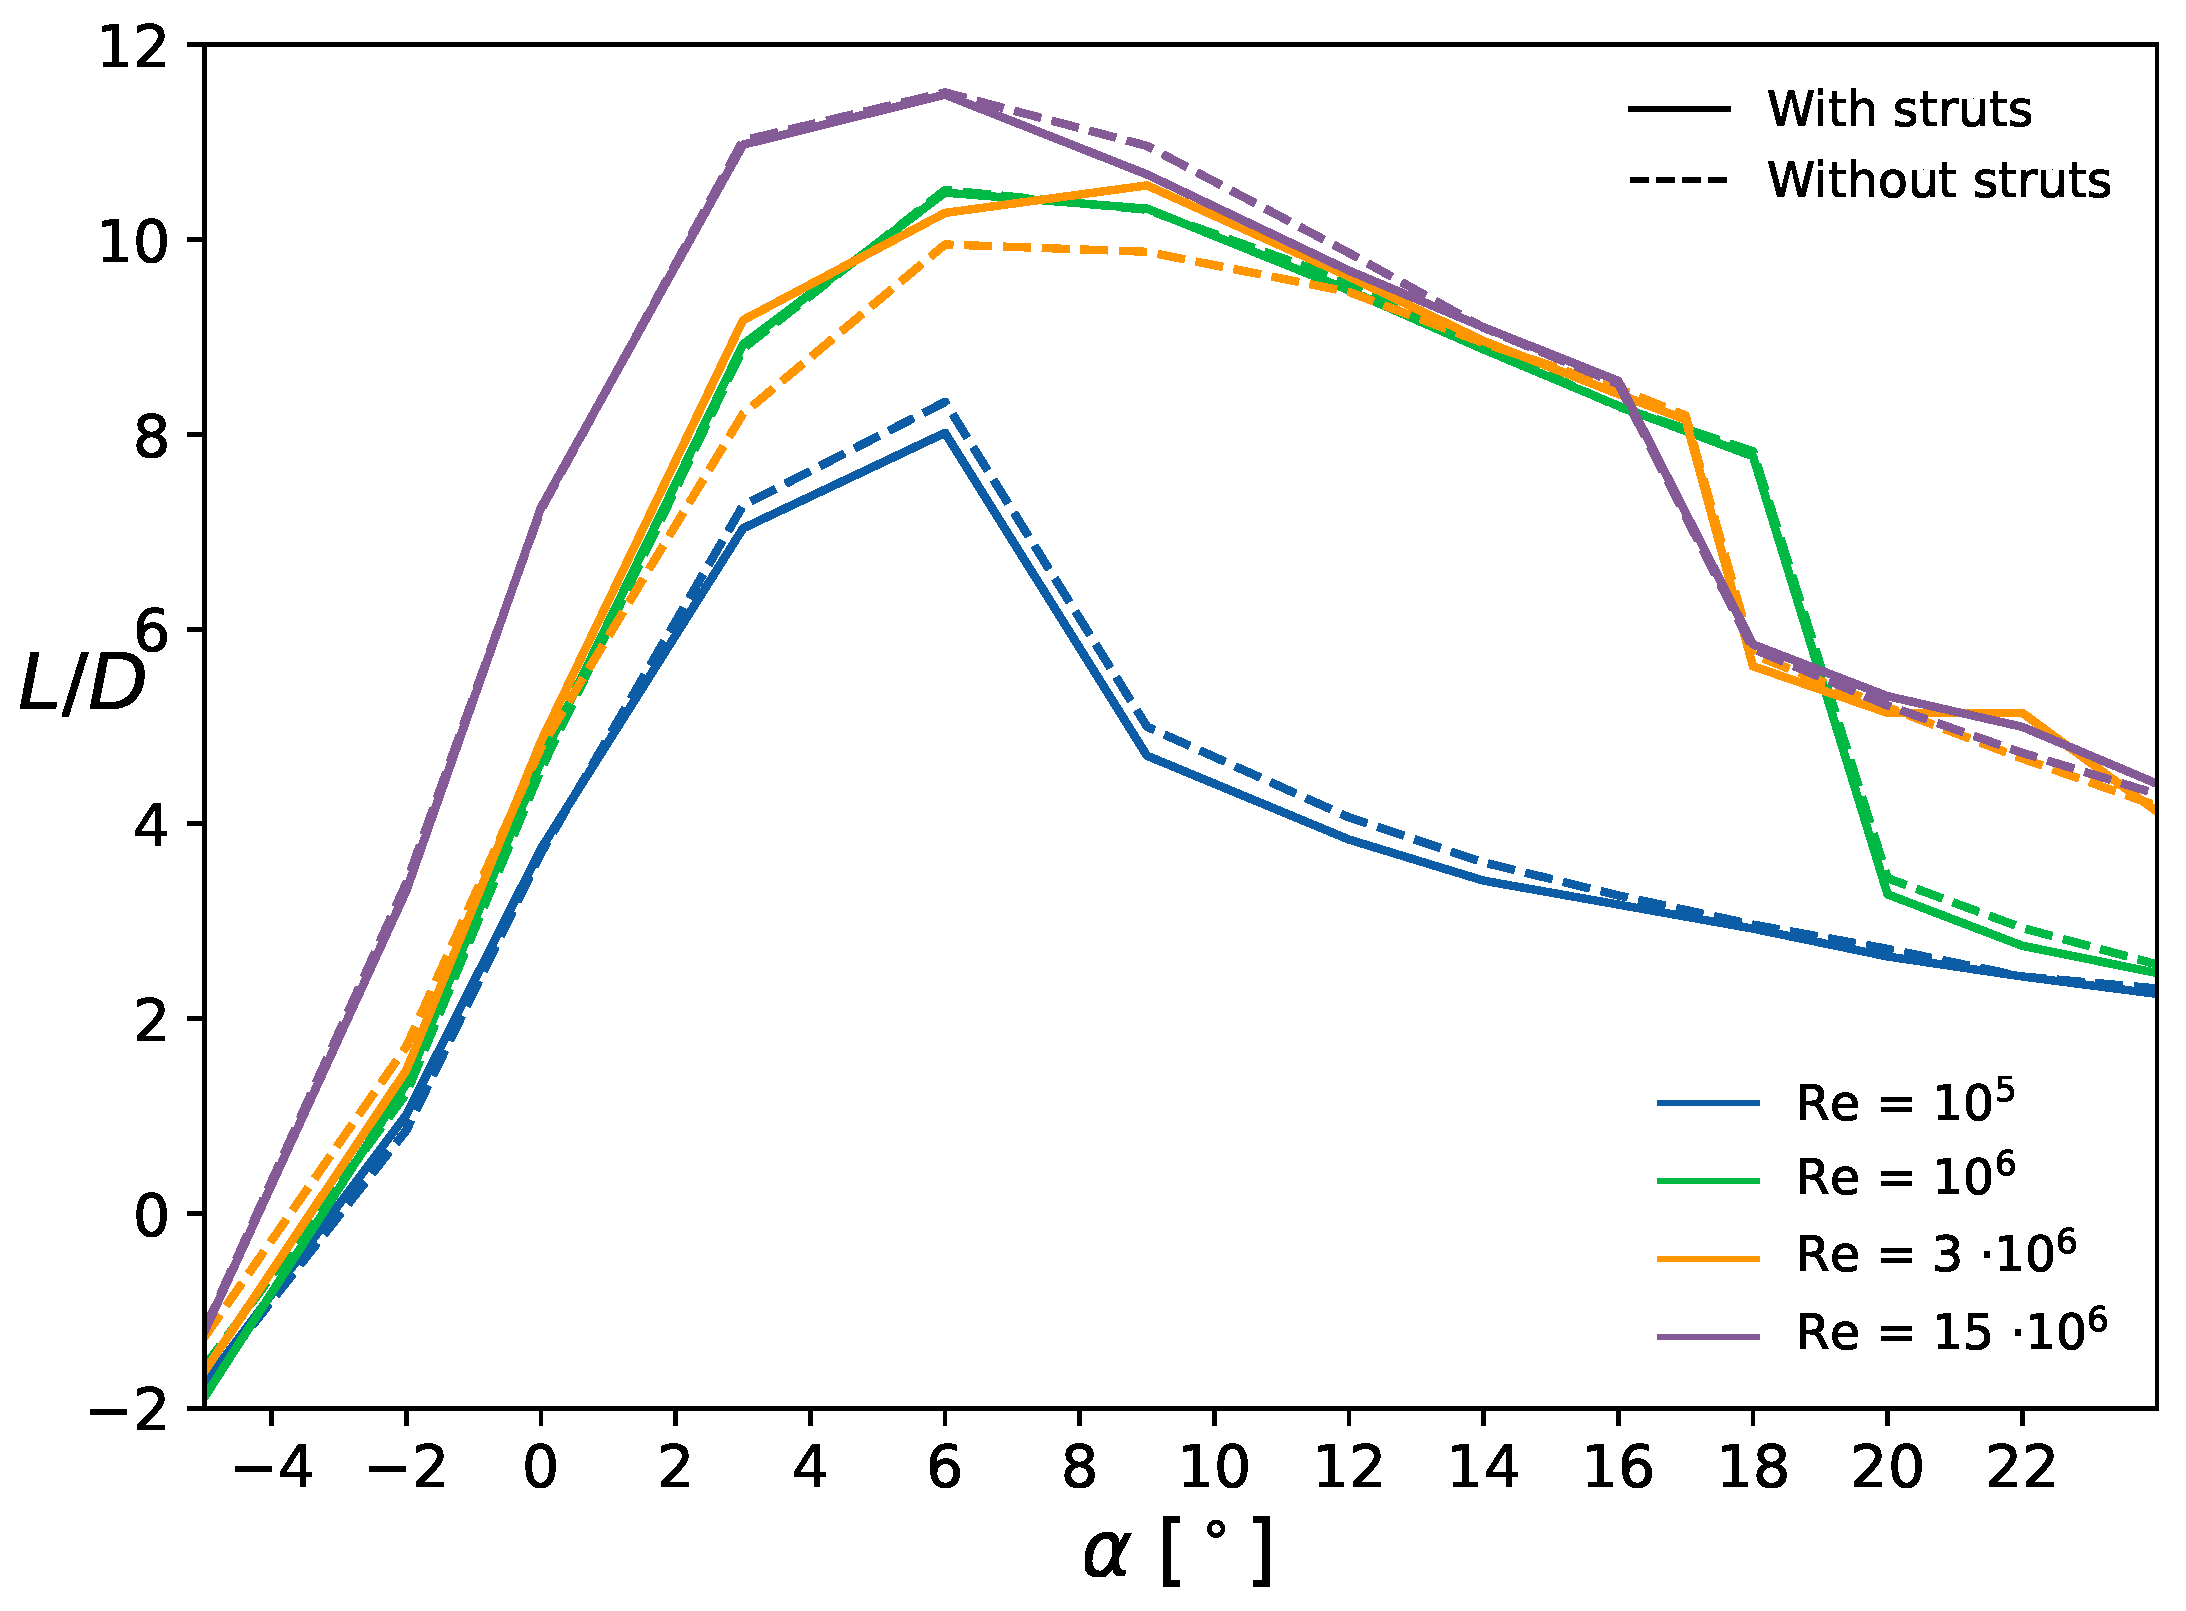
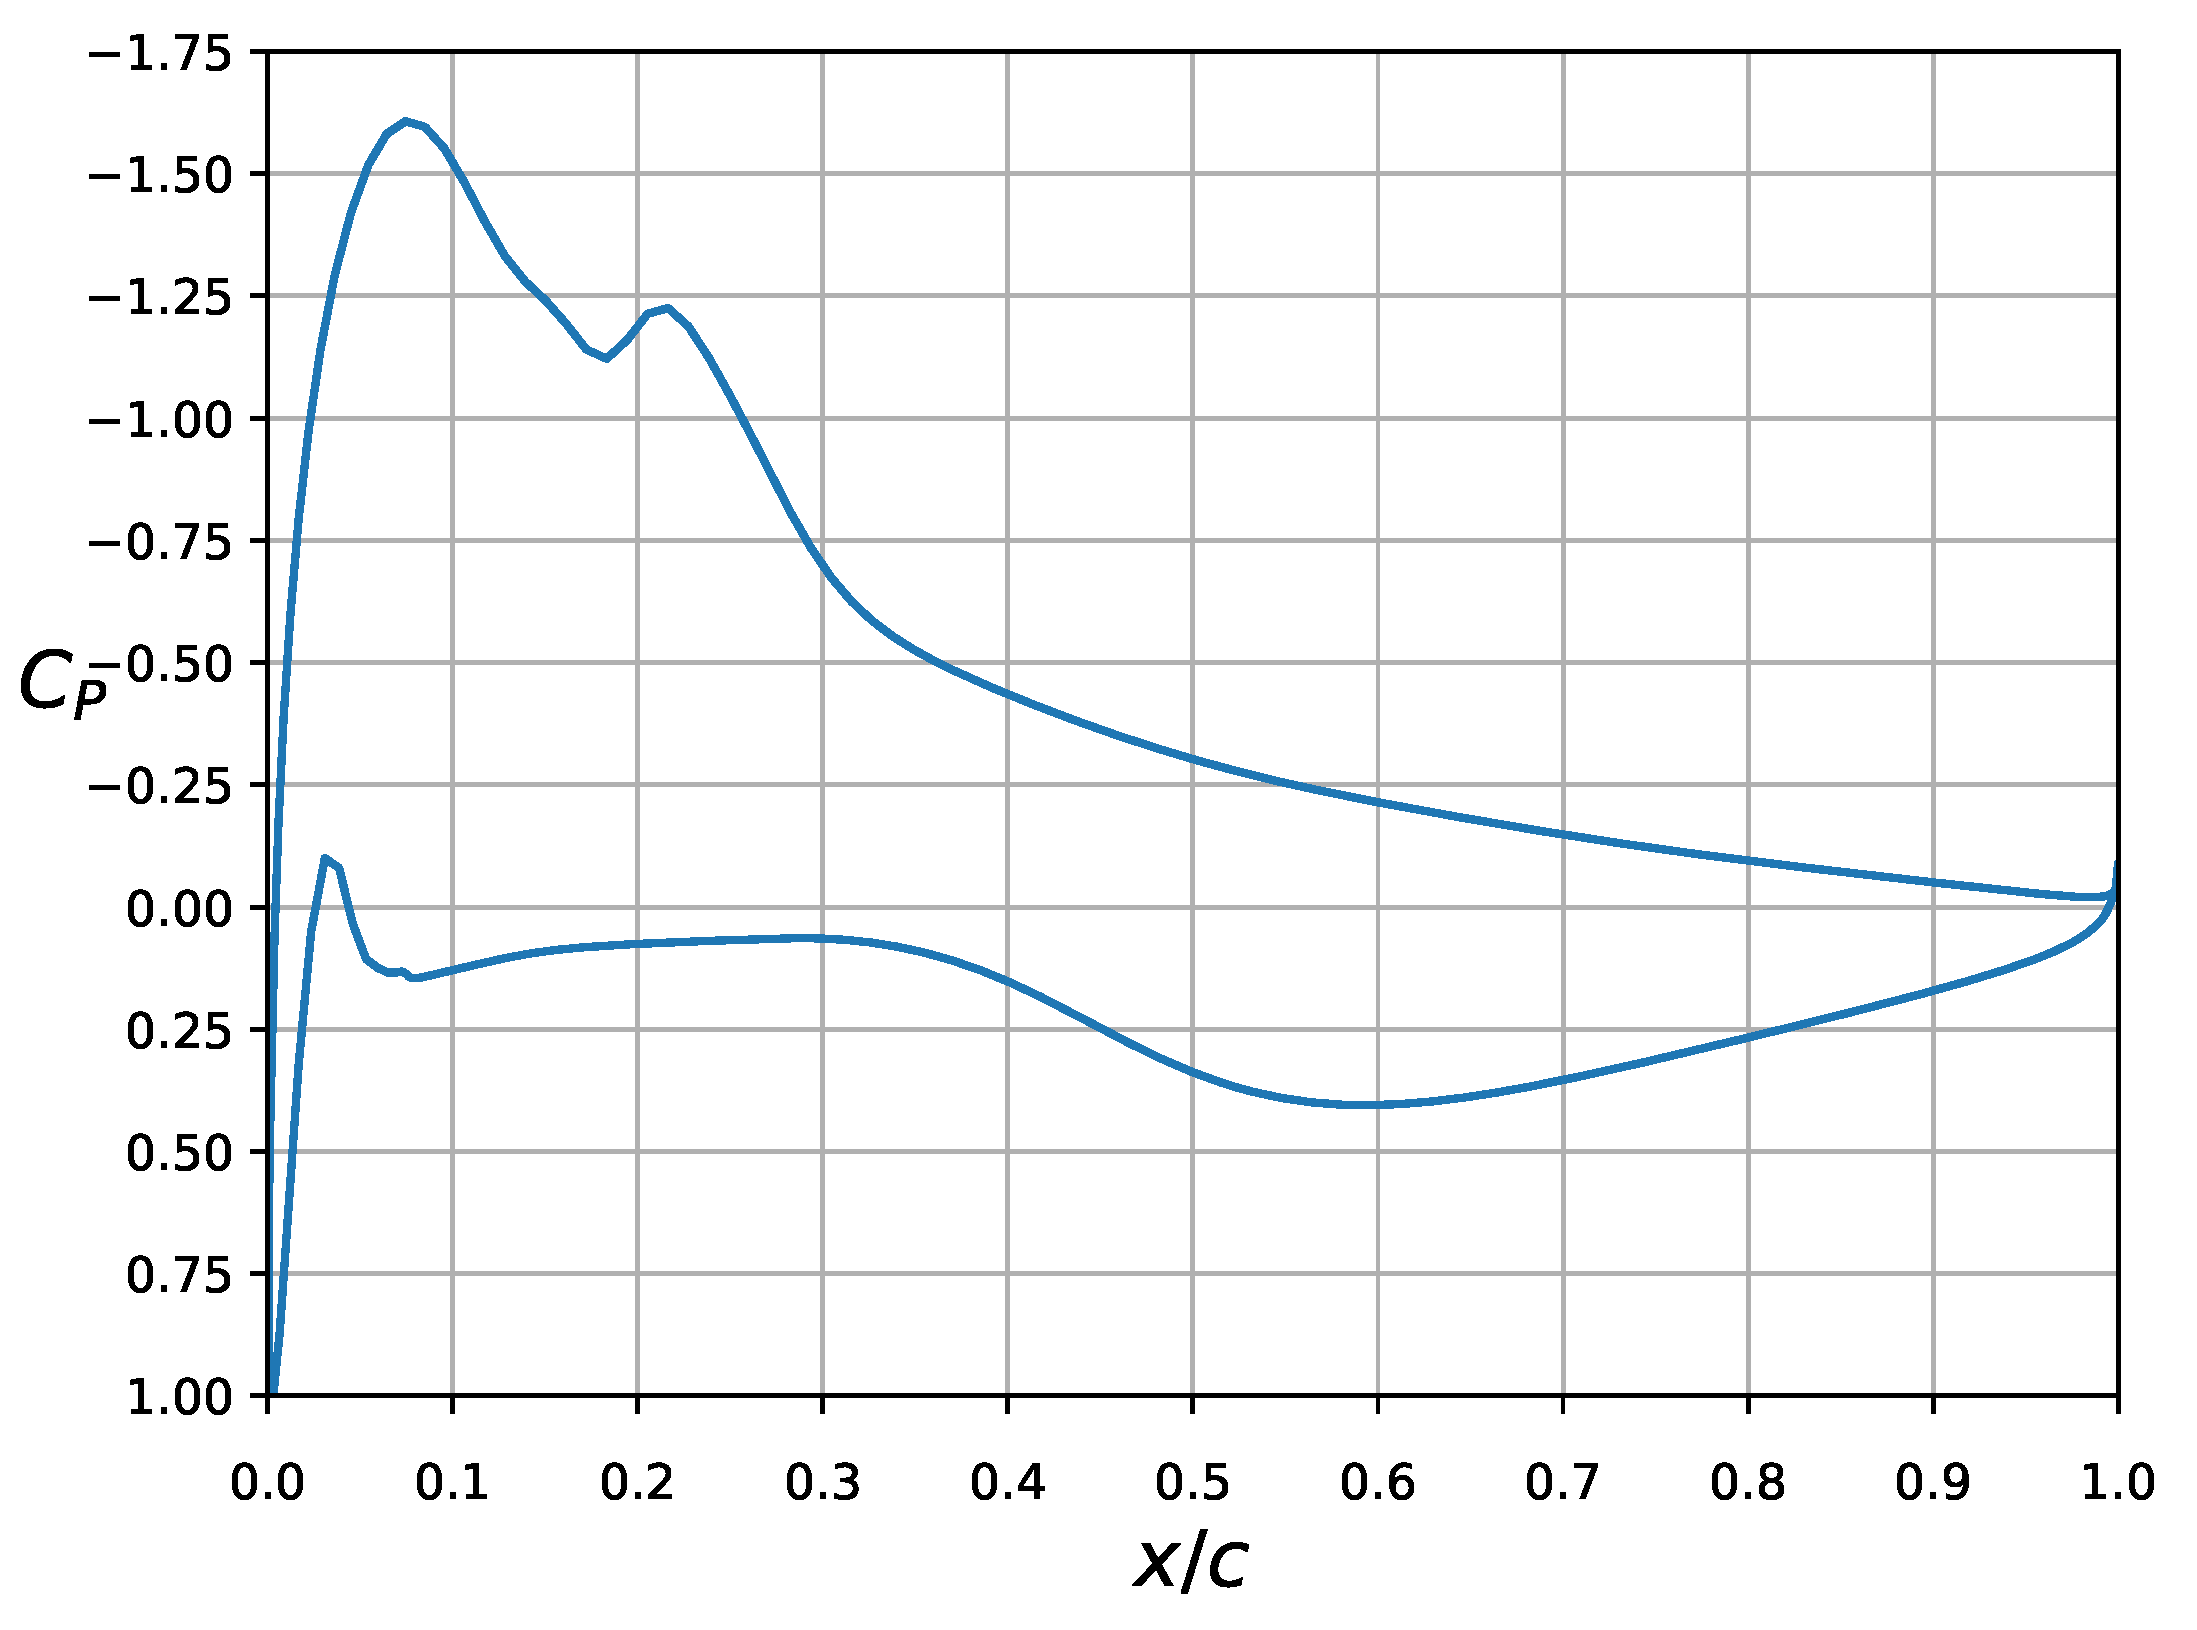
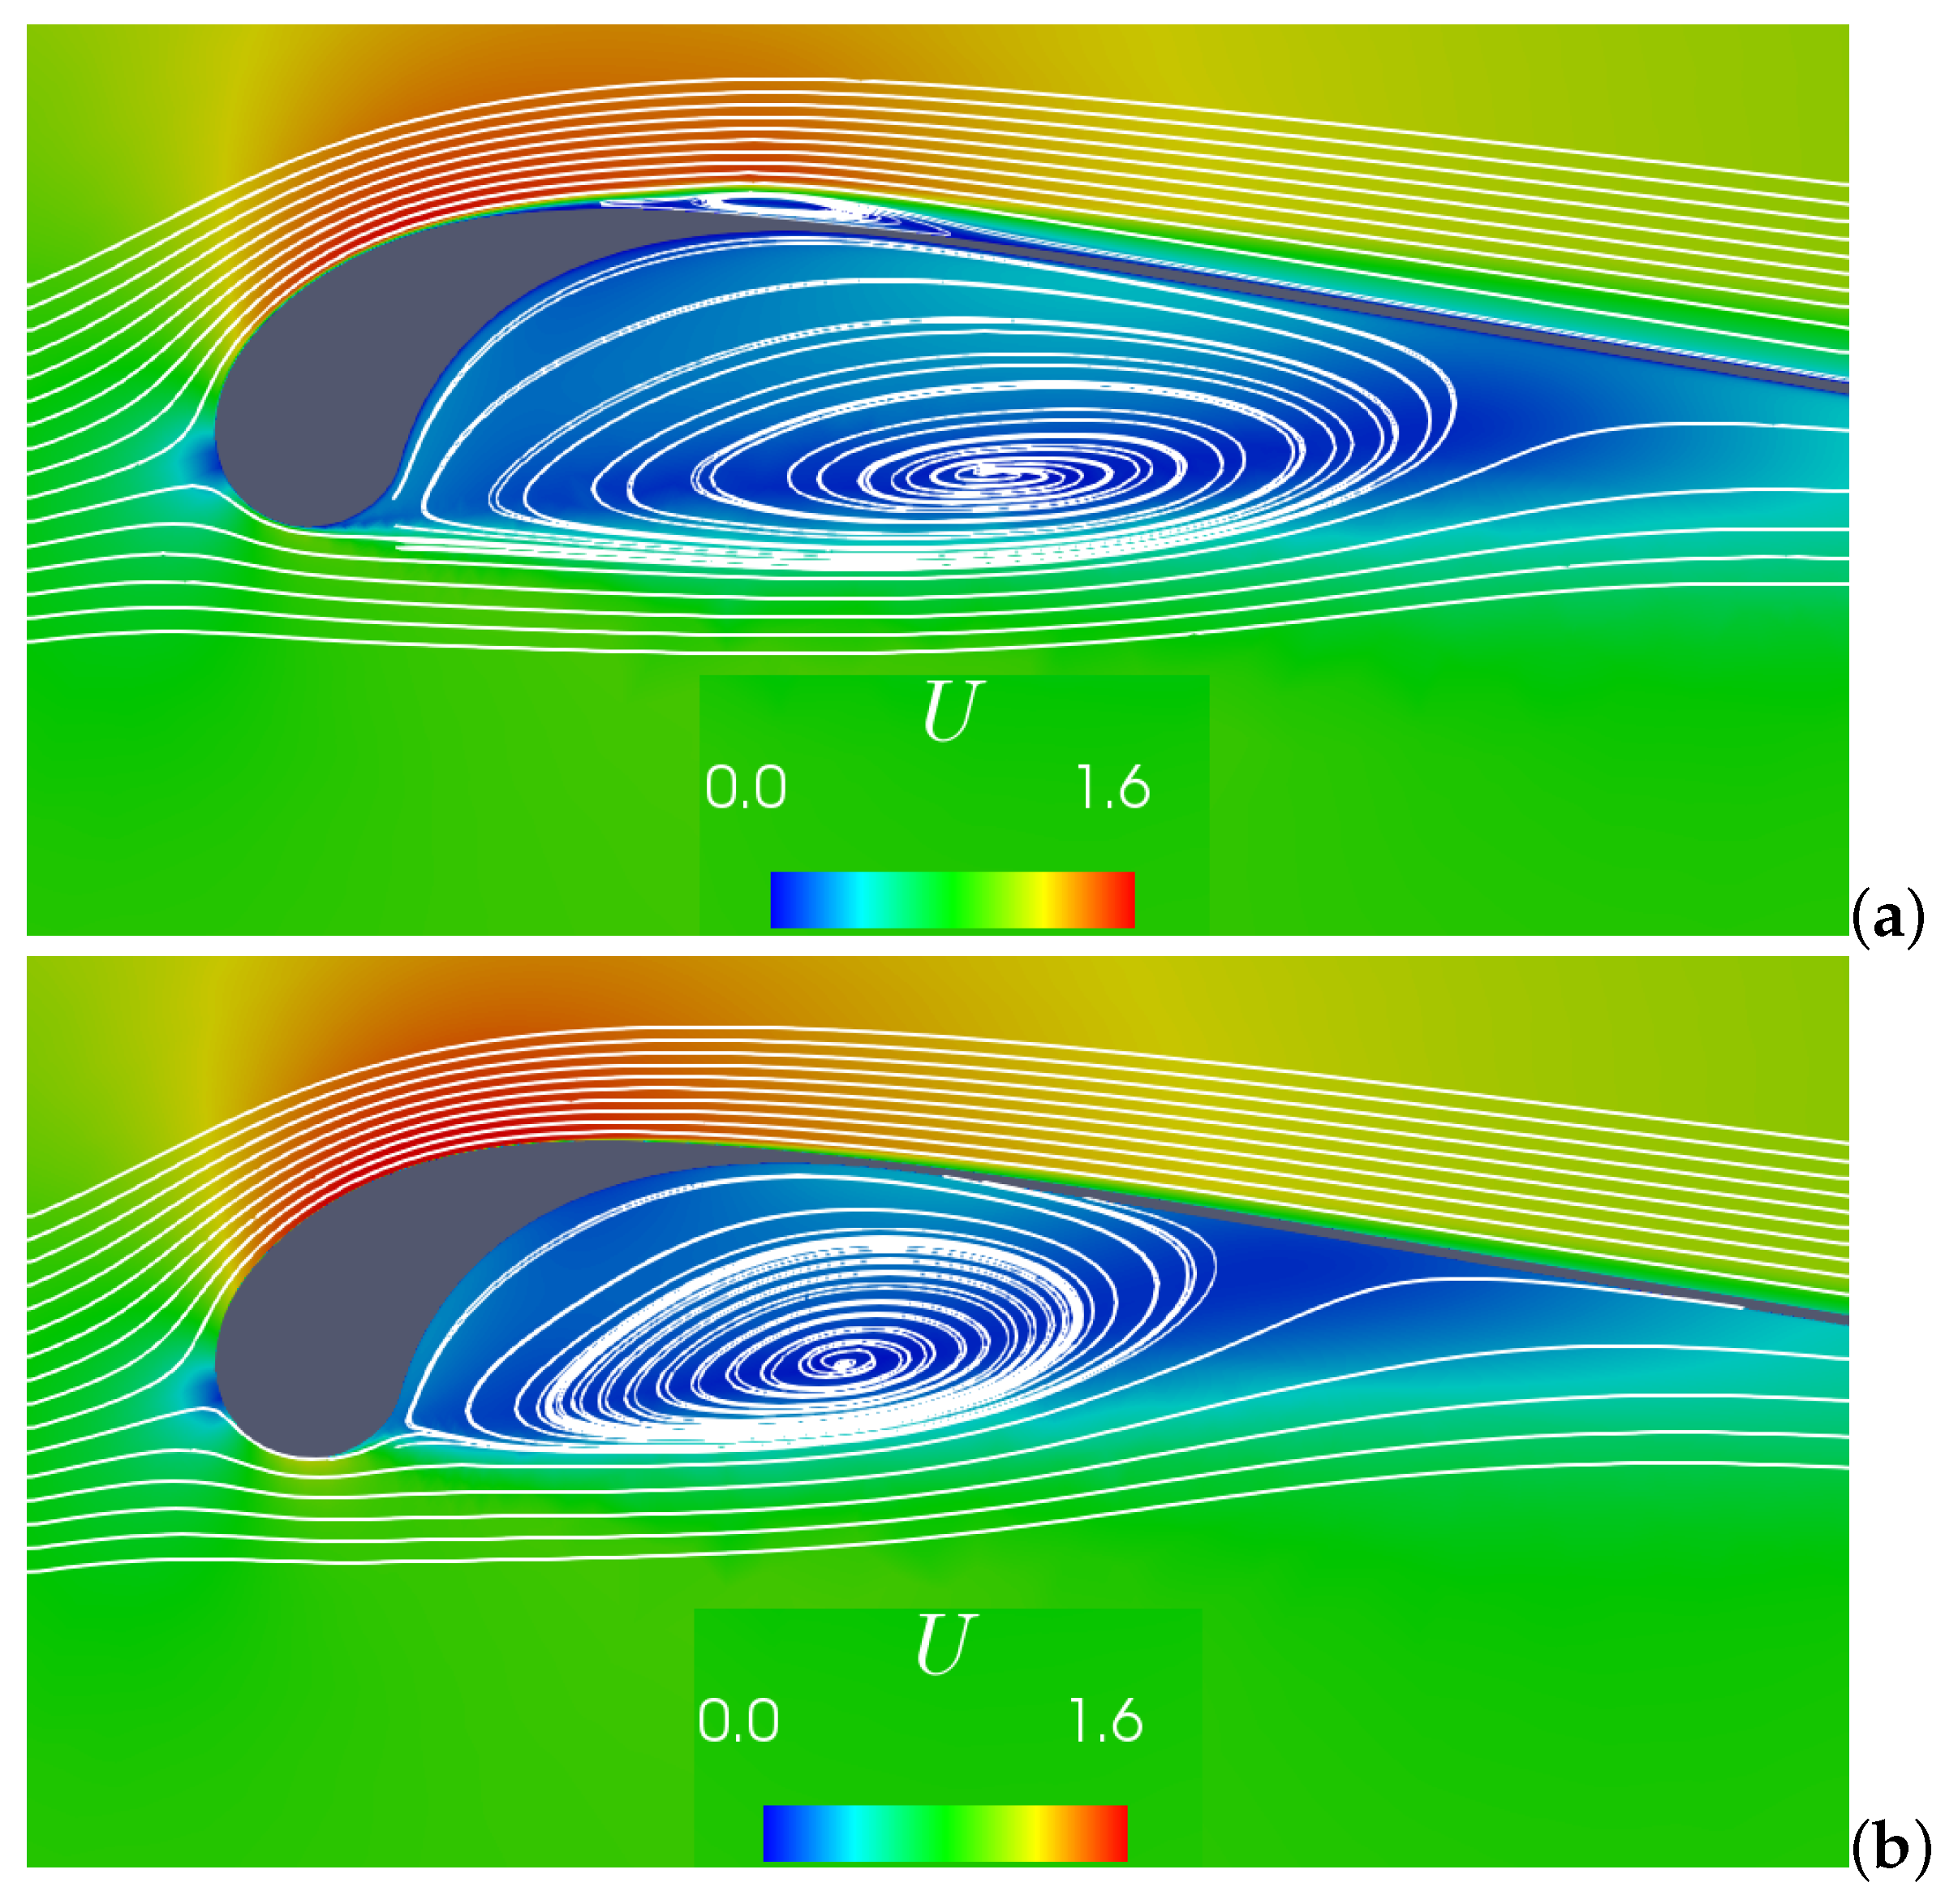
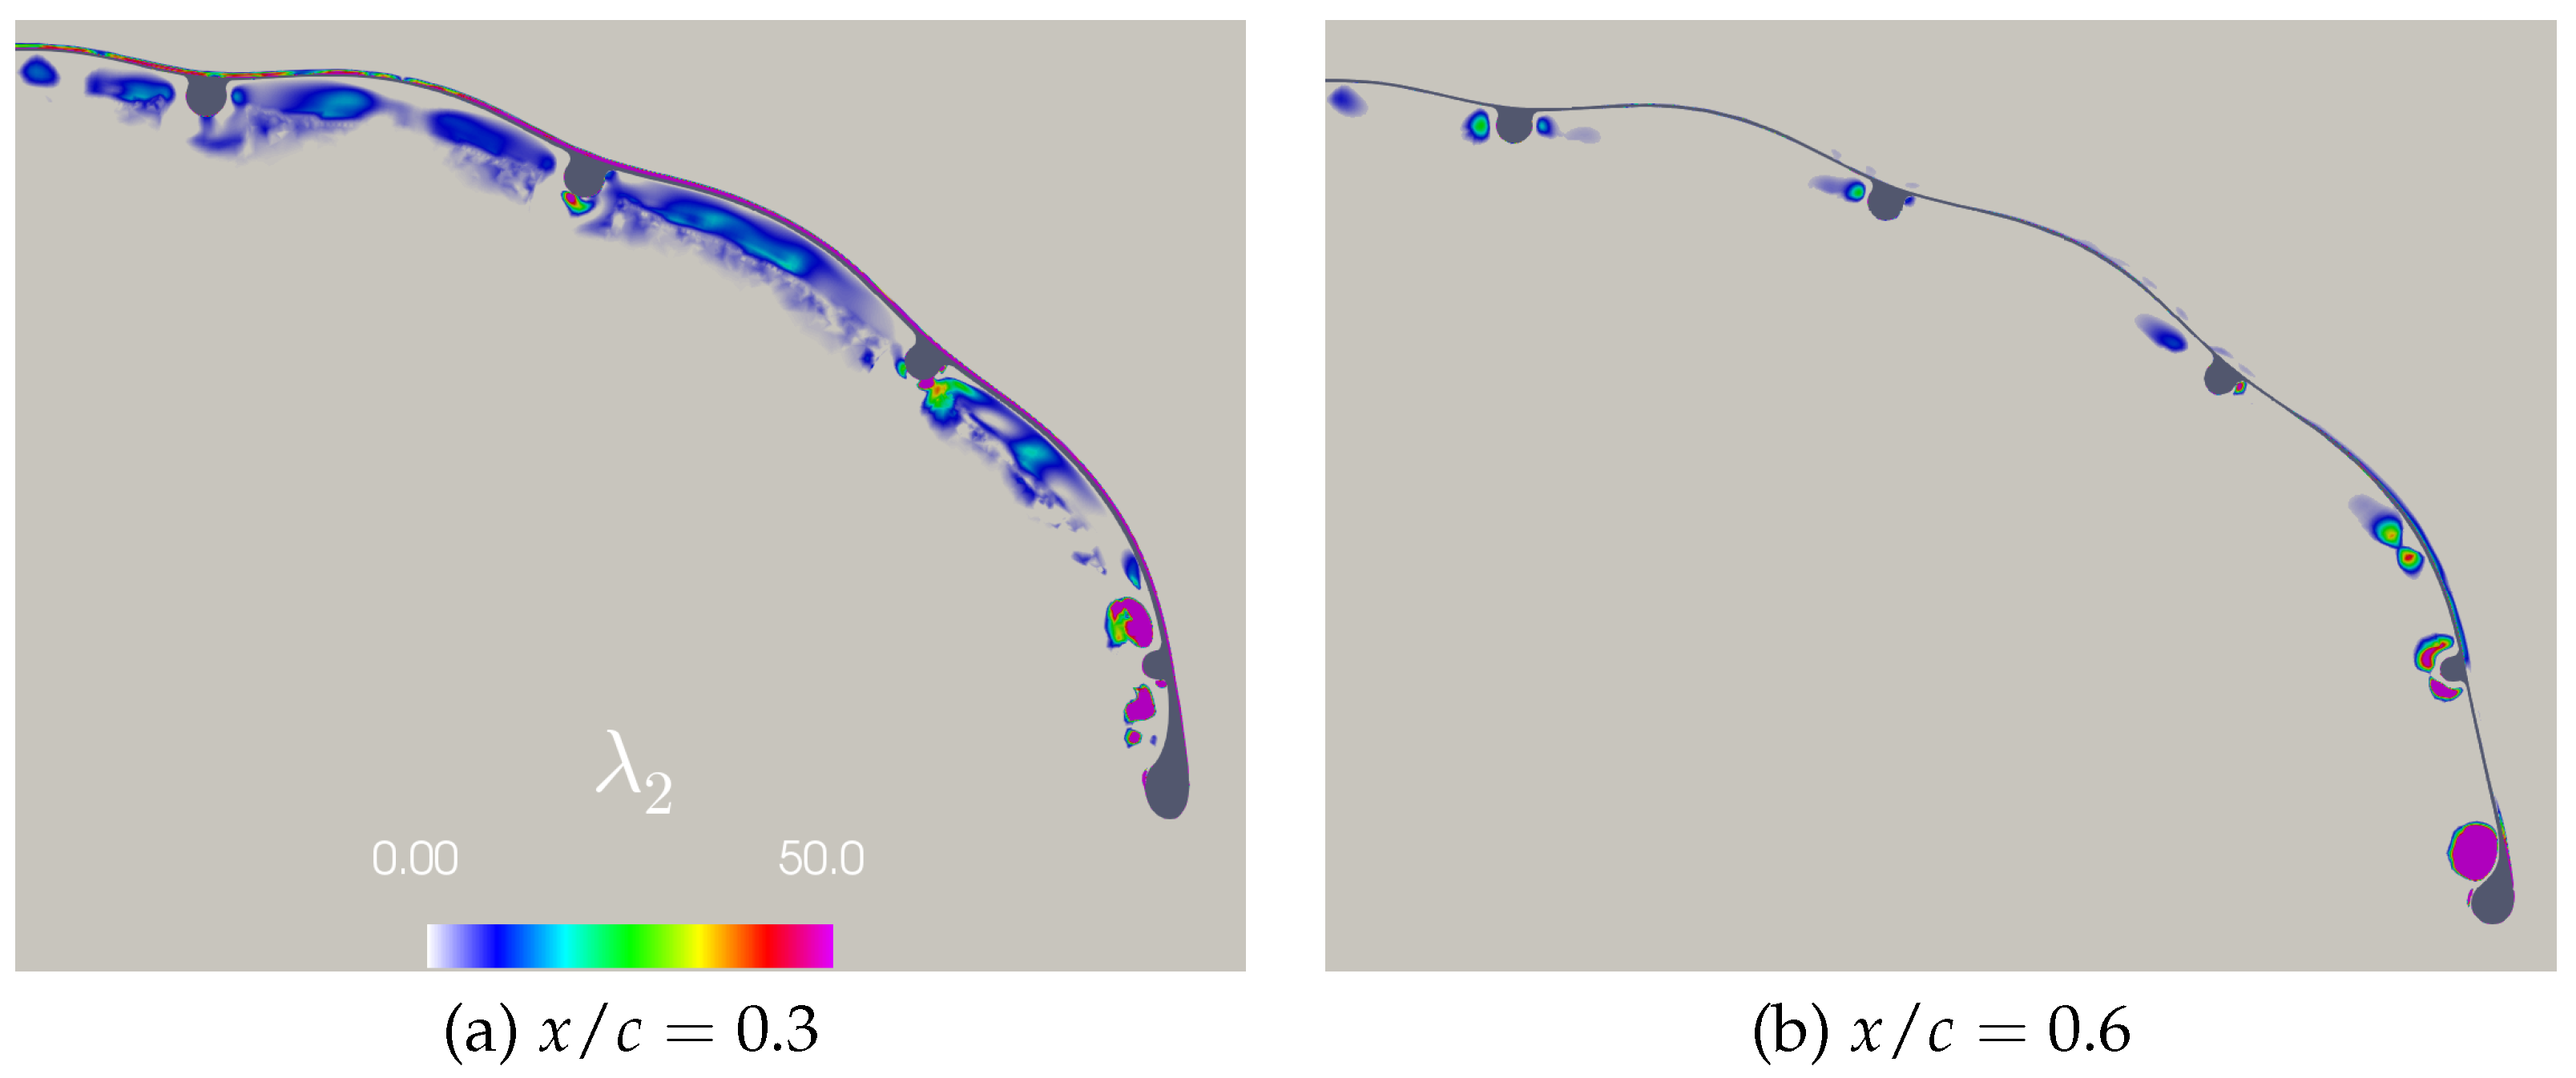
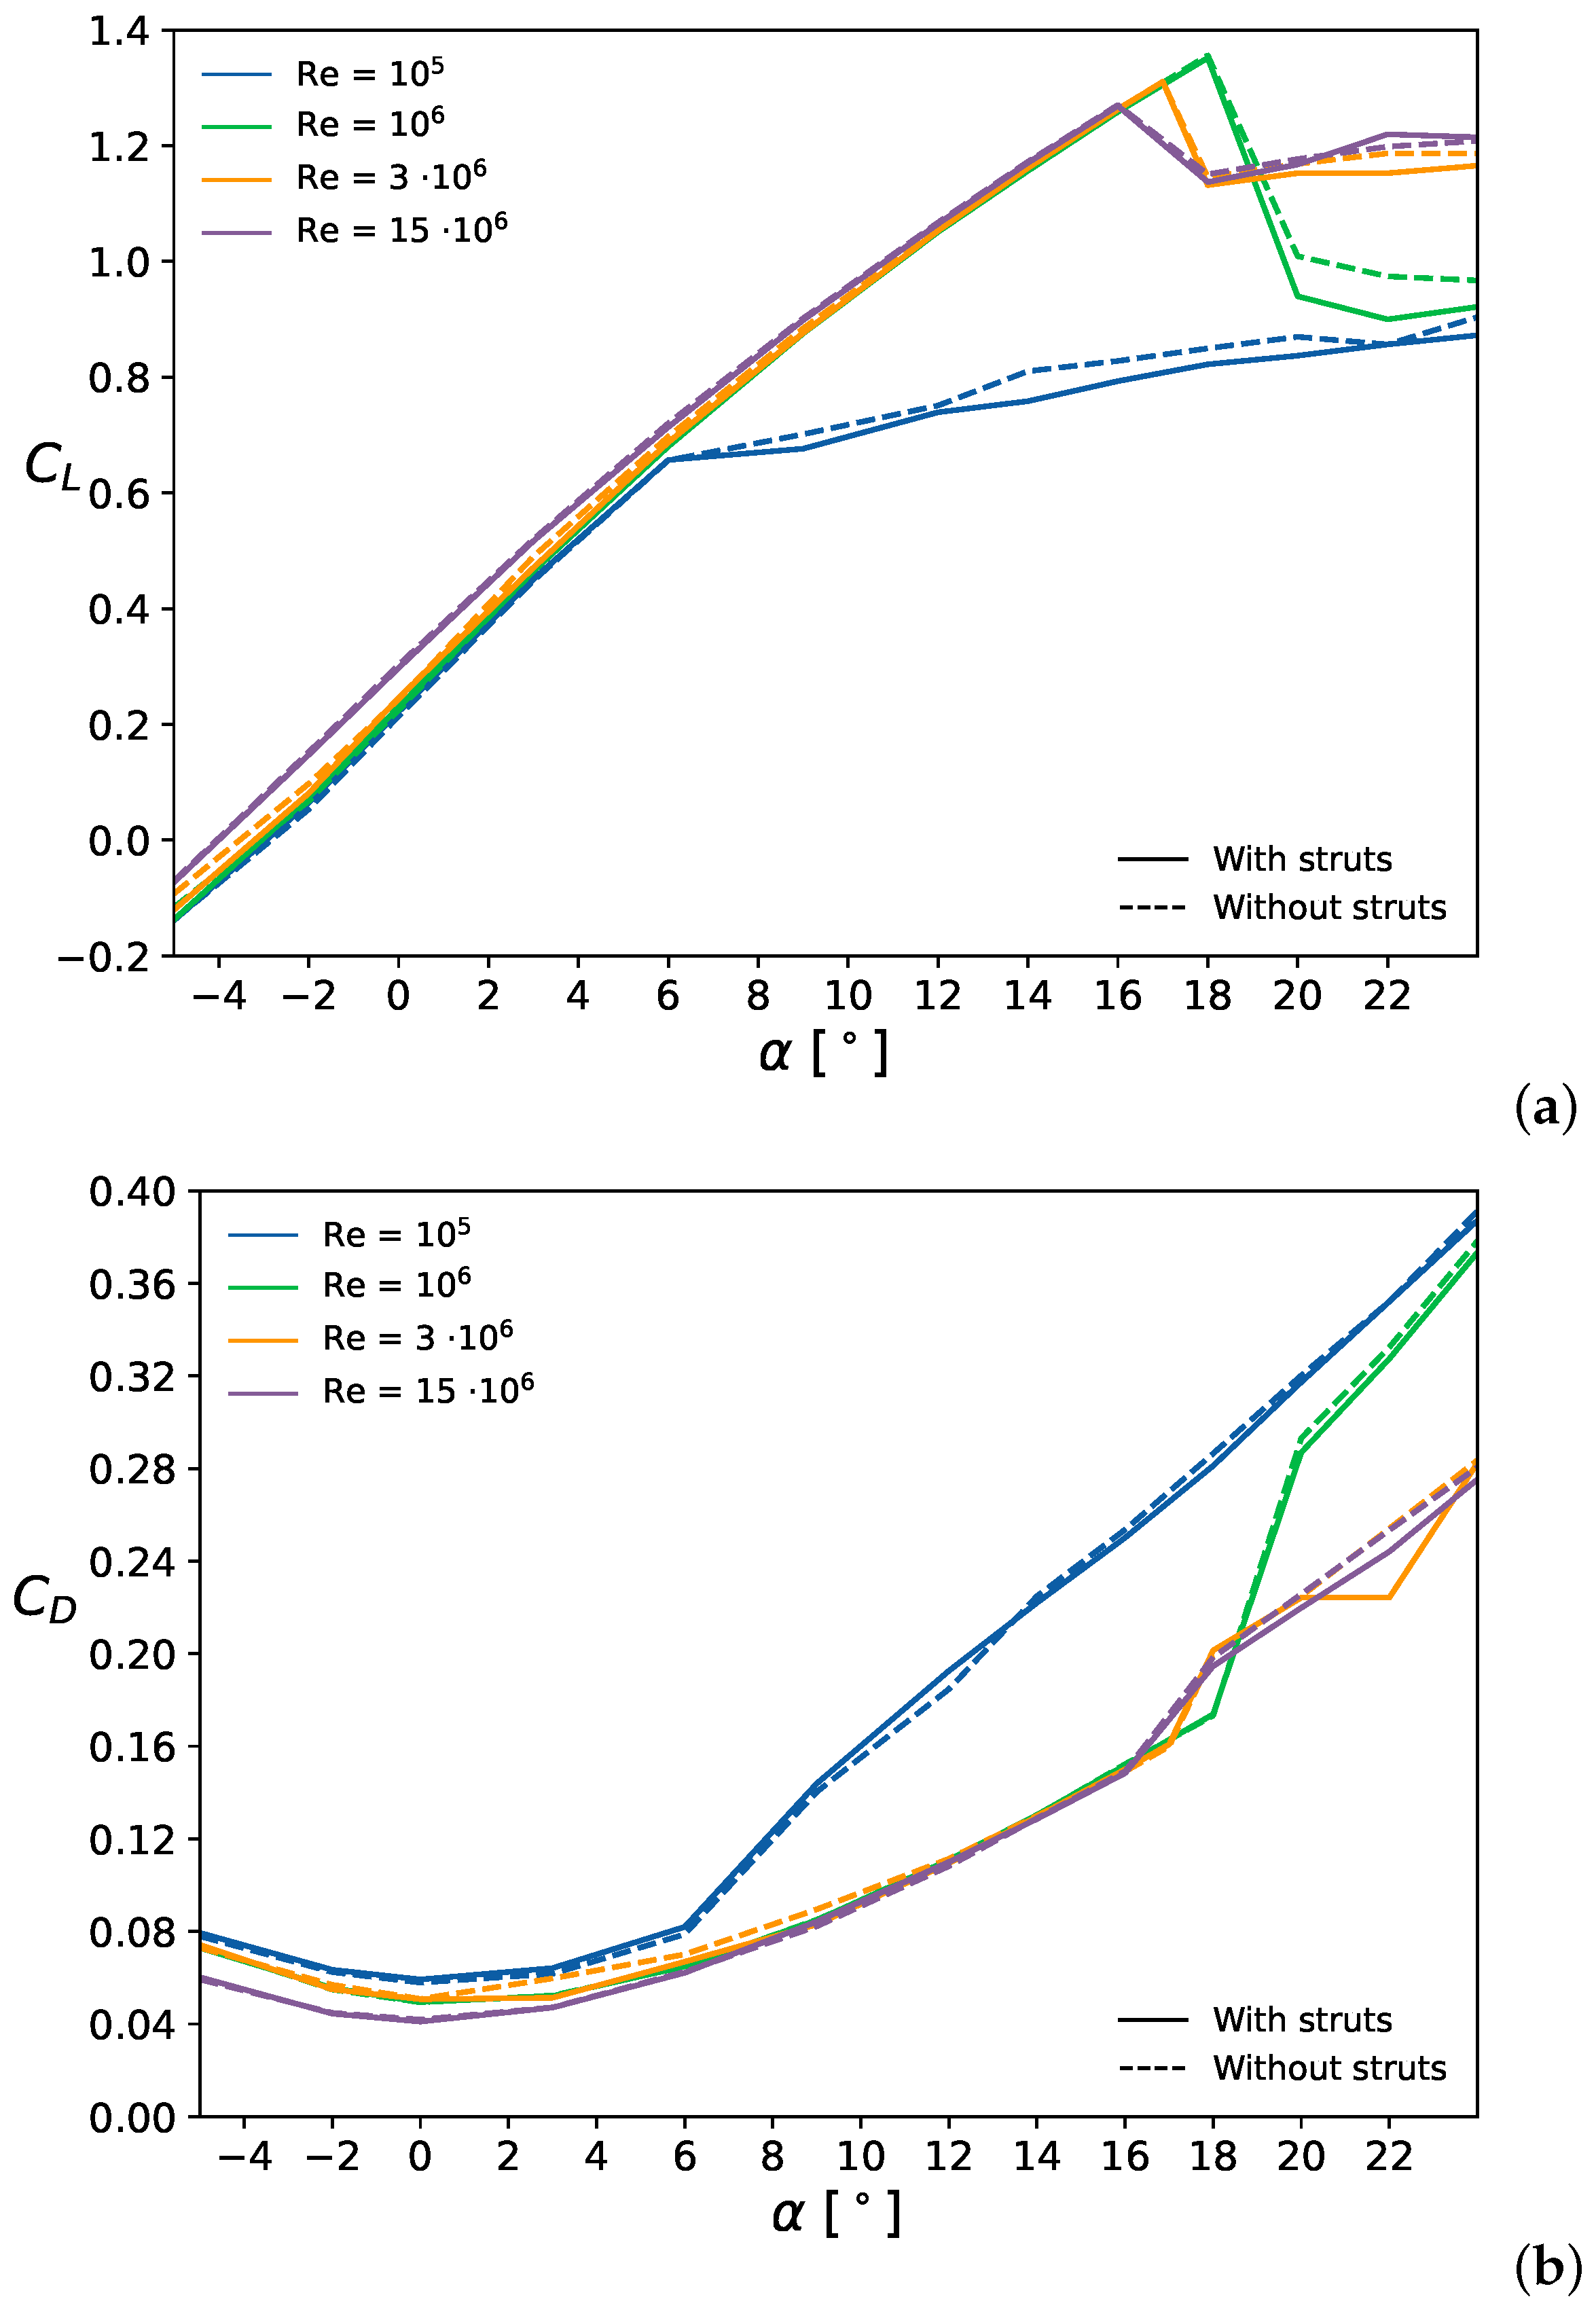
3.1. Aerodynamics without Side-Slip

The flow configuration without side-slip is representative for the kite flying on straight path segments, during figure-of-eight manoeuvres when reeling out, or during reel-in of the tether [5]. In Figure 6, the computed flow field is visualised by a rake of streamlines and a contour plot of the aerodynamic pressure distribution on the wing.
Since only half of the flow field is computed, the other half is mirrored along the symmetry plane ( Z = 0 ) for visualisation purposes. The streamlines are coloured by the transverse component of the flow velocity U , and indicate the typical three-dimensional flow features expected for a finite wing: the pressure difference between pressure and suction sides induces a crossflow component away from the wing centre, for the pressure side, and towards the centre, for the suction side. Associated with this is the shedding of vorticity from the trailing edge and the wing tip vortex, which is visualised by a single streamline emanating from the wing tip. The contour plot of the pressure coefficient indicates that the leading edge at the wing centre experiences the highest loading.
Figure 7 illustrates the effect of flow separation from the suction side of the airfoil, when approaching the stall condition at higher angle of attack.
In both diagrams, the wing surface is coloured by the streamwise component of the skin friction coefficient
C f , x = 2 ν U 2 U x y y = 0 ,
where y denotes the coordinate locally normal to the wing surface. The symmetry plane is coloured by the total pressure coefficient C p , T . The flow separates first from the surface regions with highest aerodynamic load, which is the centre of the wing. For the depicted flow case, this happens between α = 16 and α = 18 , and is indicated in Figure 7b by the surface region of low streamwise skin friction and the flow region in the symmetry plane with substantial loss of total pressure.
Figure 8 details the flow around the wing for two different Reynolds numbers. The most obvious difference to conventional wings is the extended recirculation zone on the pressure side of the LEI wing, behind the leading edge tube, and characterised by relatively low flow velocities.
The length of the recirculation zone decreases with increasing Reynolds number. For the lower Reynolds number ( Re = 10 5 ) a small laminar separation bubble can be recognised on the suction side of the wing. This bubble is absent for the larger Reynolds number ( Re = 3 × 10 6 ), and has a significant effect on the aerodynamic properties of this wing, as will be discussed below. It should be noted, that a real LEI wing is made of textile material with stitched seams along the tube. Because surface features such as these will force transition from laminar to turbulent flow, the present results at low Reynolds number are of limited practical relevance, and mostly for the purpose of comparison with experimental studies based on perfectly smooth wind tunnel models.
Figure 9 shows the streamwise component of the friction coefficient on the pressure side of the wing, for geometries with and without strut tubes.
One can clearly recognise the size of the extended recirculation region from the negative value of C f , x (coloured in light blue). Although some local differences can be recognised around the struts, the overall behaviour of the friction coefficient is similar for both cases. This confirms the negligible influence of the struts on the aerodynamic characteristics of the wing.
The effect of the strut tubes on the local flow is further illustrated in Figure 10 by contour plots of the λ 2 -criterion. This criterion can be used to identify vortex cores in three-dimensional space [26].
At α = 12 , the flow over the suction side is still attached and vorticity is thus limited to only a thin boundary layer. The increased λ 2 -values on the pressure side at x / c = 0.3 clearly indicate the presence of the recirculation zone. At x / c = 0.6 , the flow is again reattached (see also Figure 9) and the λ 2 -values accordingly low, except for the direct vicinity of the strut tubes and the tip region, from where the characteristic wing tip vortex originates.
Figure 11 shows the computed lift (a) and drag (b) coefficients as functions of the angle of attack, for different Reynolds numbers, Figure 12 the resulting lift-over-drag ratio.
Continuous lines correspond to the wing with struts, whilst dashed lines are for the wing without struts.
The lines are coloured according to the value of the Reynolds number. One can recognise that the effect of the struts on the aerodynamic performance of the wing is minimal, whereas the Reynolds number has a significant influence. First, the maximum value of the lift coefficient increases with the Reynolds number until Re = 10 6 , beyond which it decreases when Re increases. This is also observed for the wing without struts and is in line with the computational results of previous studies [18,20]. Second, at the lowest Reynolds number considered ( Re = 10 5 ), the lift and drag coefficients for α > 6 significantly differ from the ones at larger Re . In particular, beyond this angle of attack, the lift coefficient continues to increase with the angle of attack but with a reduced slope, and the drag coefficient is also larger, leading to a lower lift-to-drag ratio. Overall, the lift-to-drag ratio tends to decrease with decreasing Reynolds number.
For larger values of Re , C L increases with the angle of attack until stall, which occurs between 16 and 18 , depending on the Reynolds number (see also Figure 7). It is important to note that the use of steady-state RANS simulation limits the accuracy of the results beyond flow separation. Therefore, results for α > 6 at Re = 10 5 and α 16 for larger Re should be taken with caution. For these flow conditions, it is recommended to rely on higher-fidelity turbulence models implemented with unsteady solvers, e.g., unsteady RANS (URANS) or large eddy simulation (LES). The change in slope in C L and C D for Re = 10 5 can be explained by the presence of a small laminar separation bubble on the suction side of the wing, as visualised in Figure 8a. For α > 6 , this bubble dissolves, leading to a decrease in C L and an increase in C D . Figure 8b shows that this bubble is absent at larger Re . The presence of a laminar separation bubble at low Re can also be seen in the pressure coefficient C P and the streamwise component of the friction coefficient C f , x The chordwise distributions of C P and C f , x are shown in Figure 13 and Figure 14, respectively, for Re = 10 5 and α = 6 . The negative value of C f , x for 0.13 < x / c < 0.32 is associated with the presence of the laminar separation bubble on the suction side of the wing. This also corresponds to a secondary peak in C P and is in line with the observations made in the literature for this type of airfoil and wing [18,20].
Overall, it can be concluded that although the chordwise struts influence the local flow, they have a negligible impact on the wing loading.

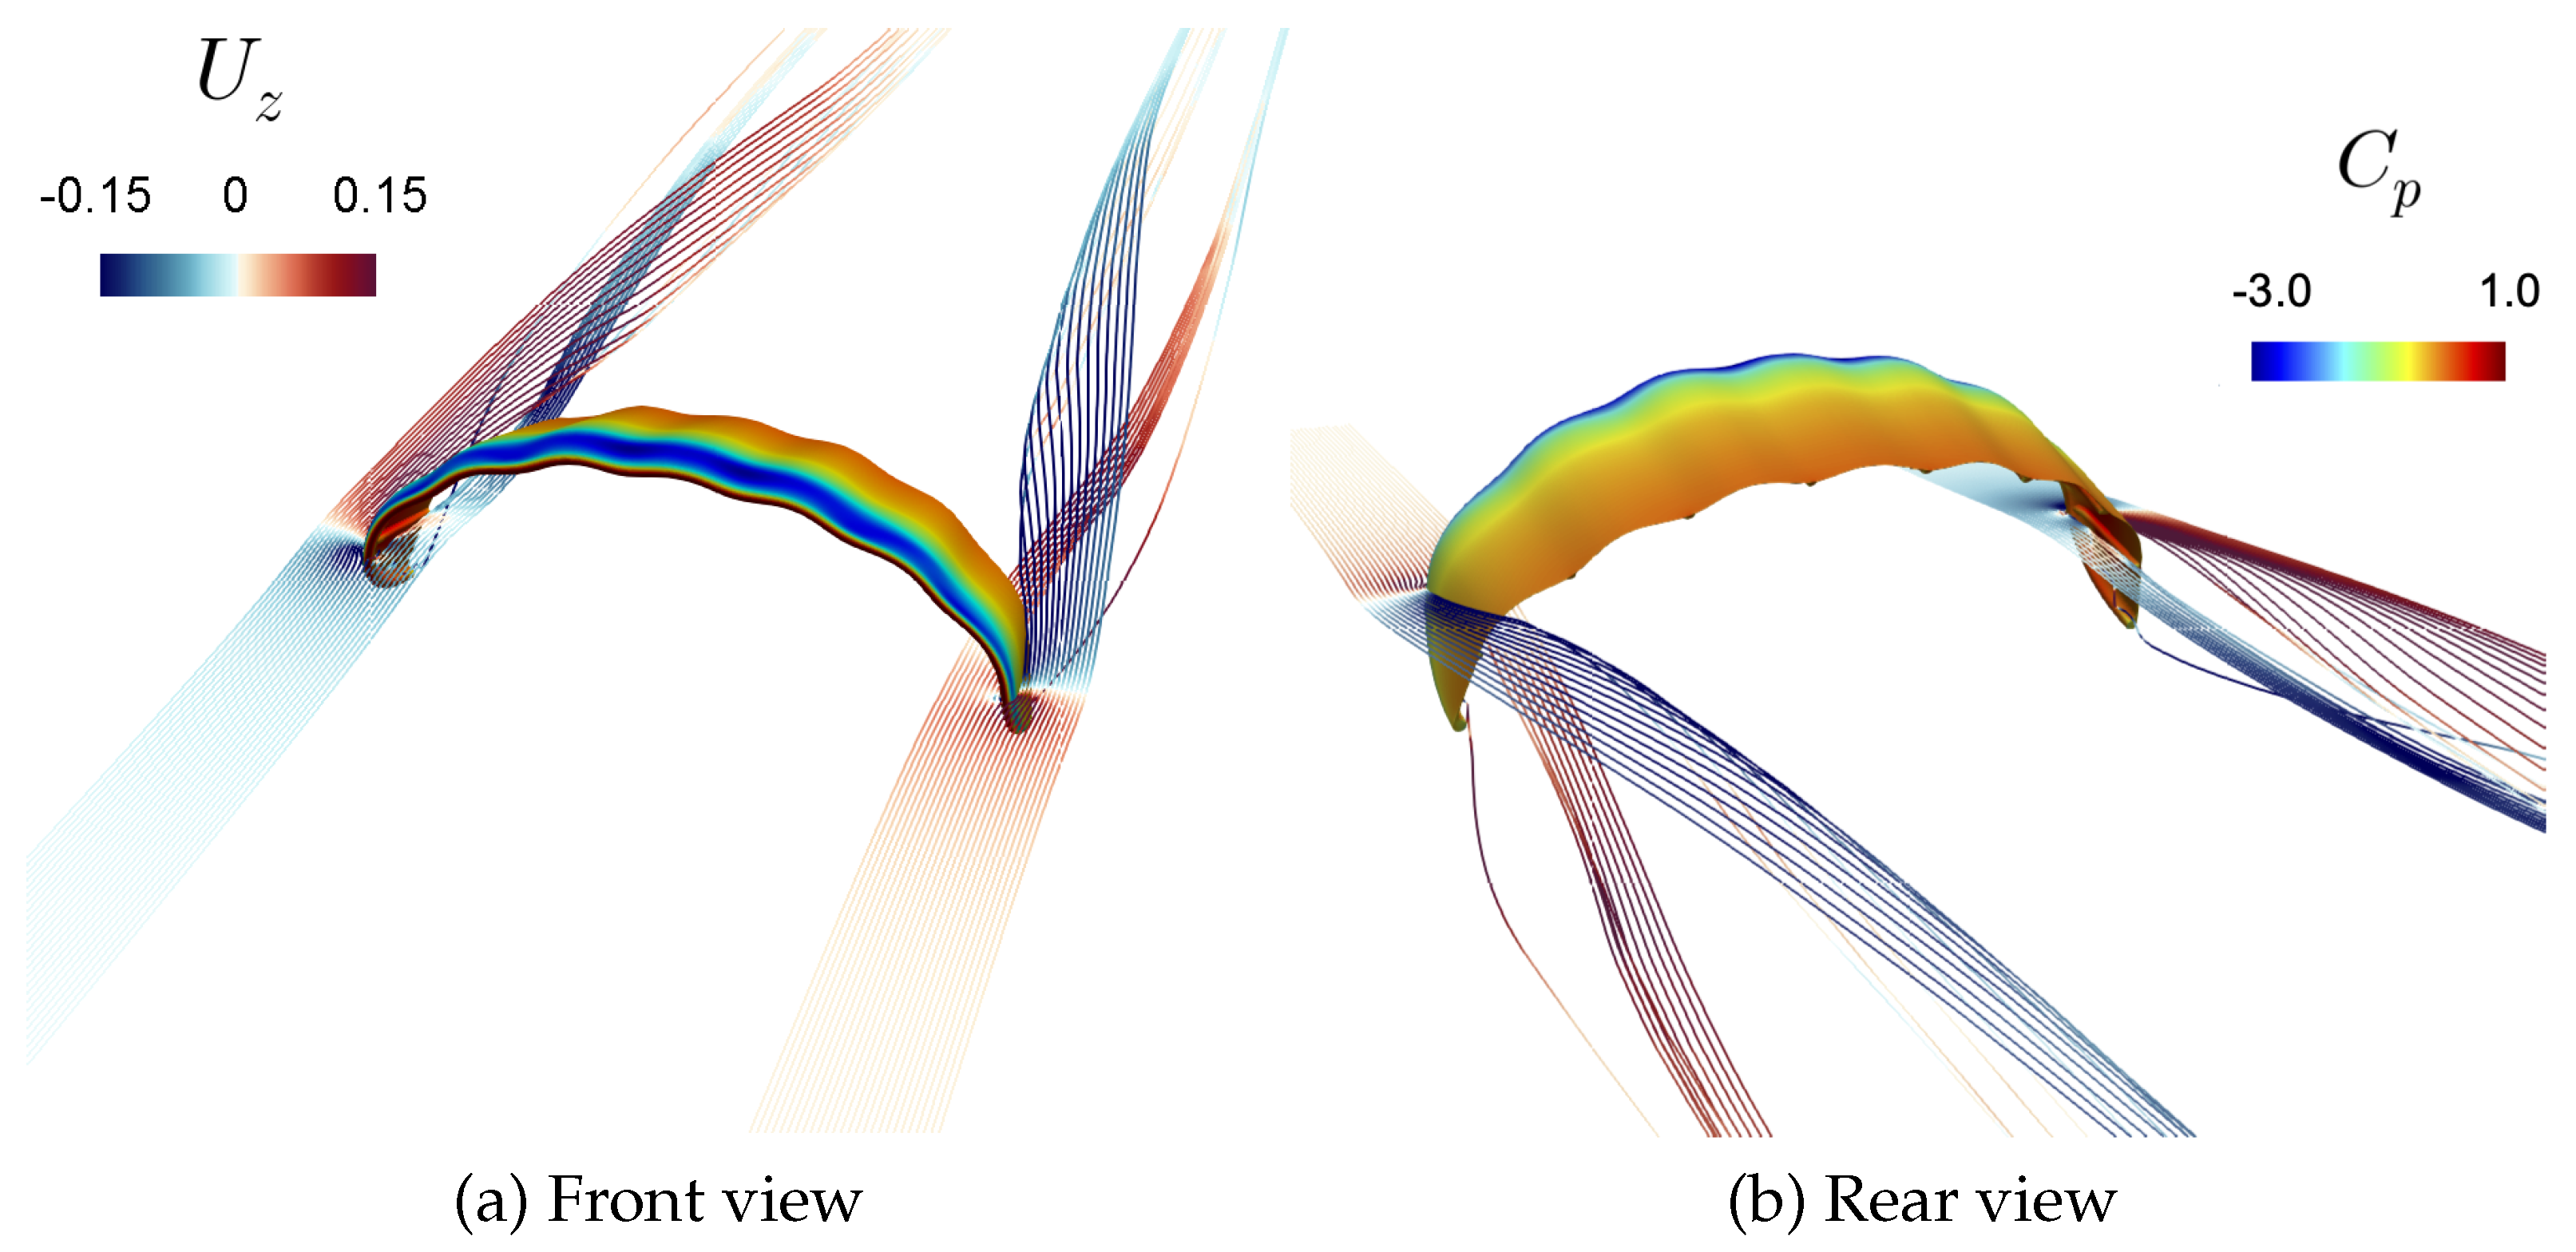
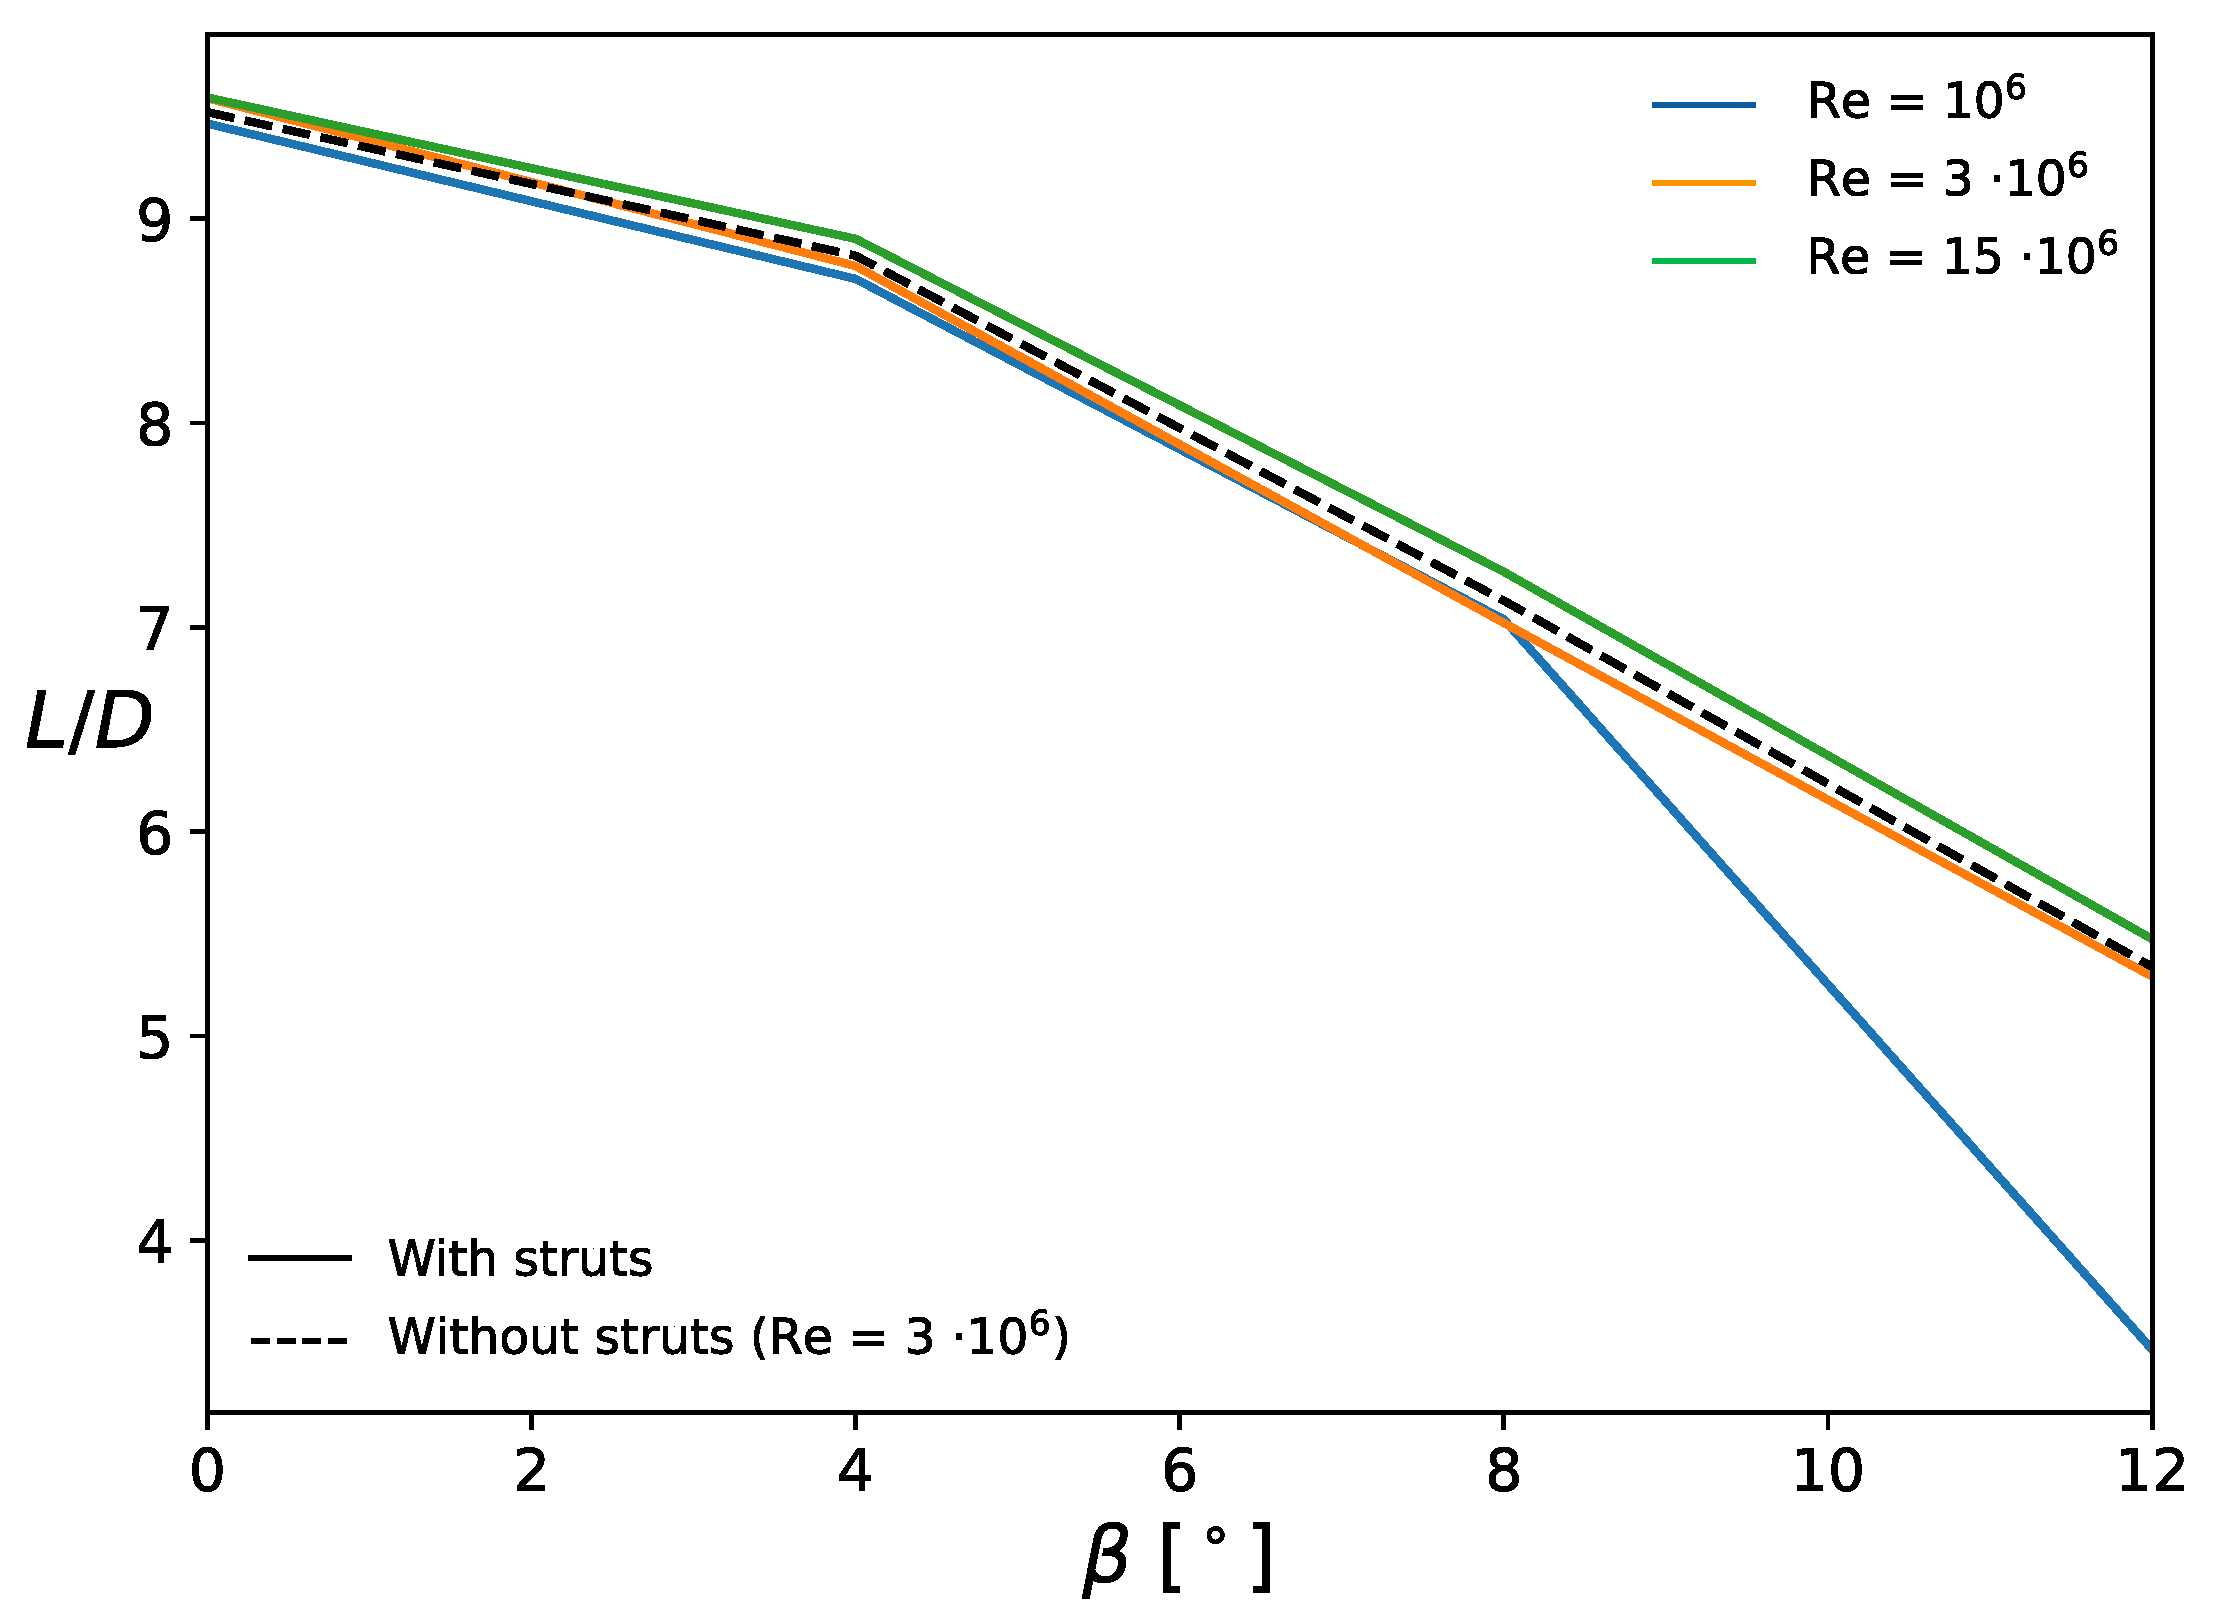
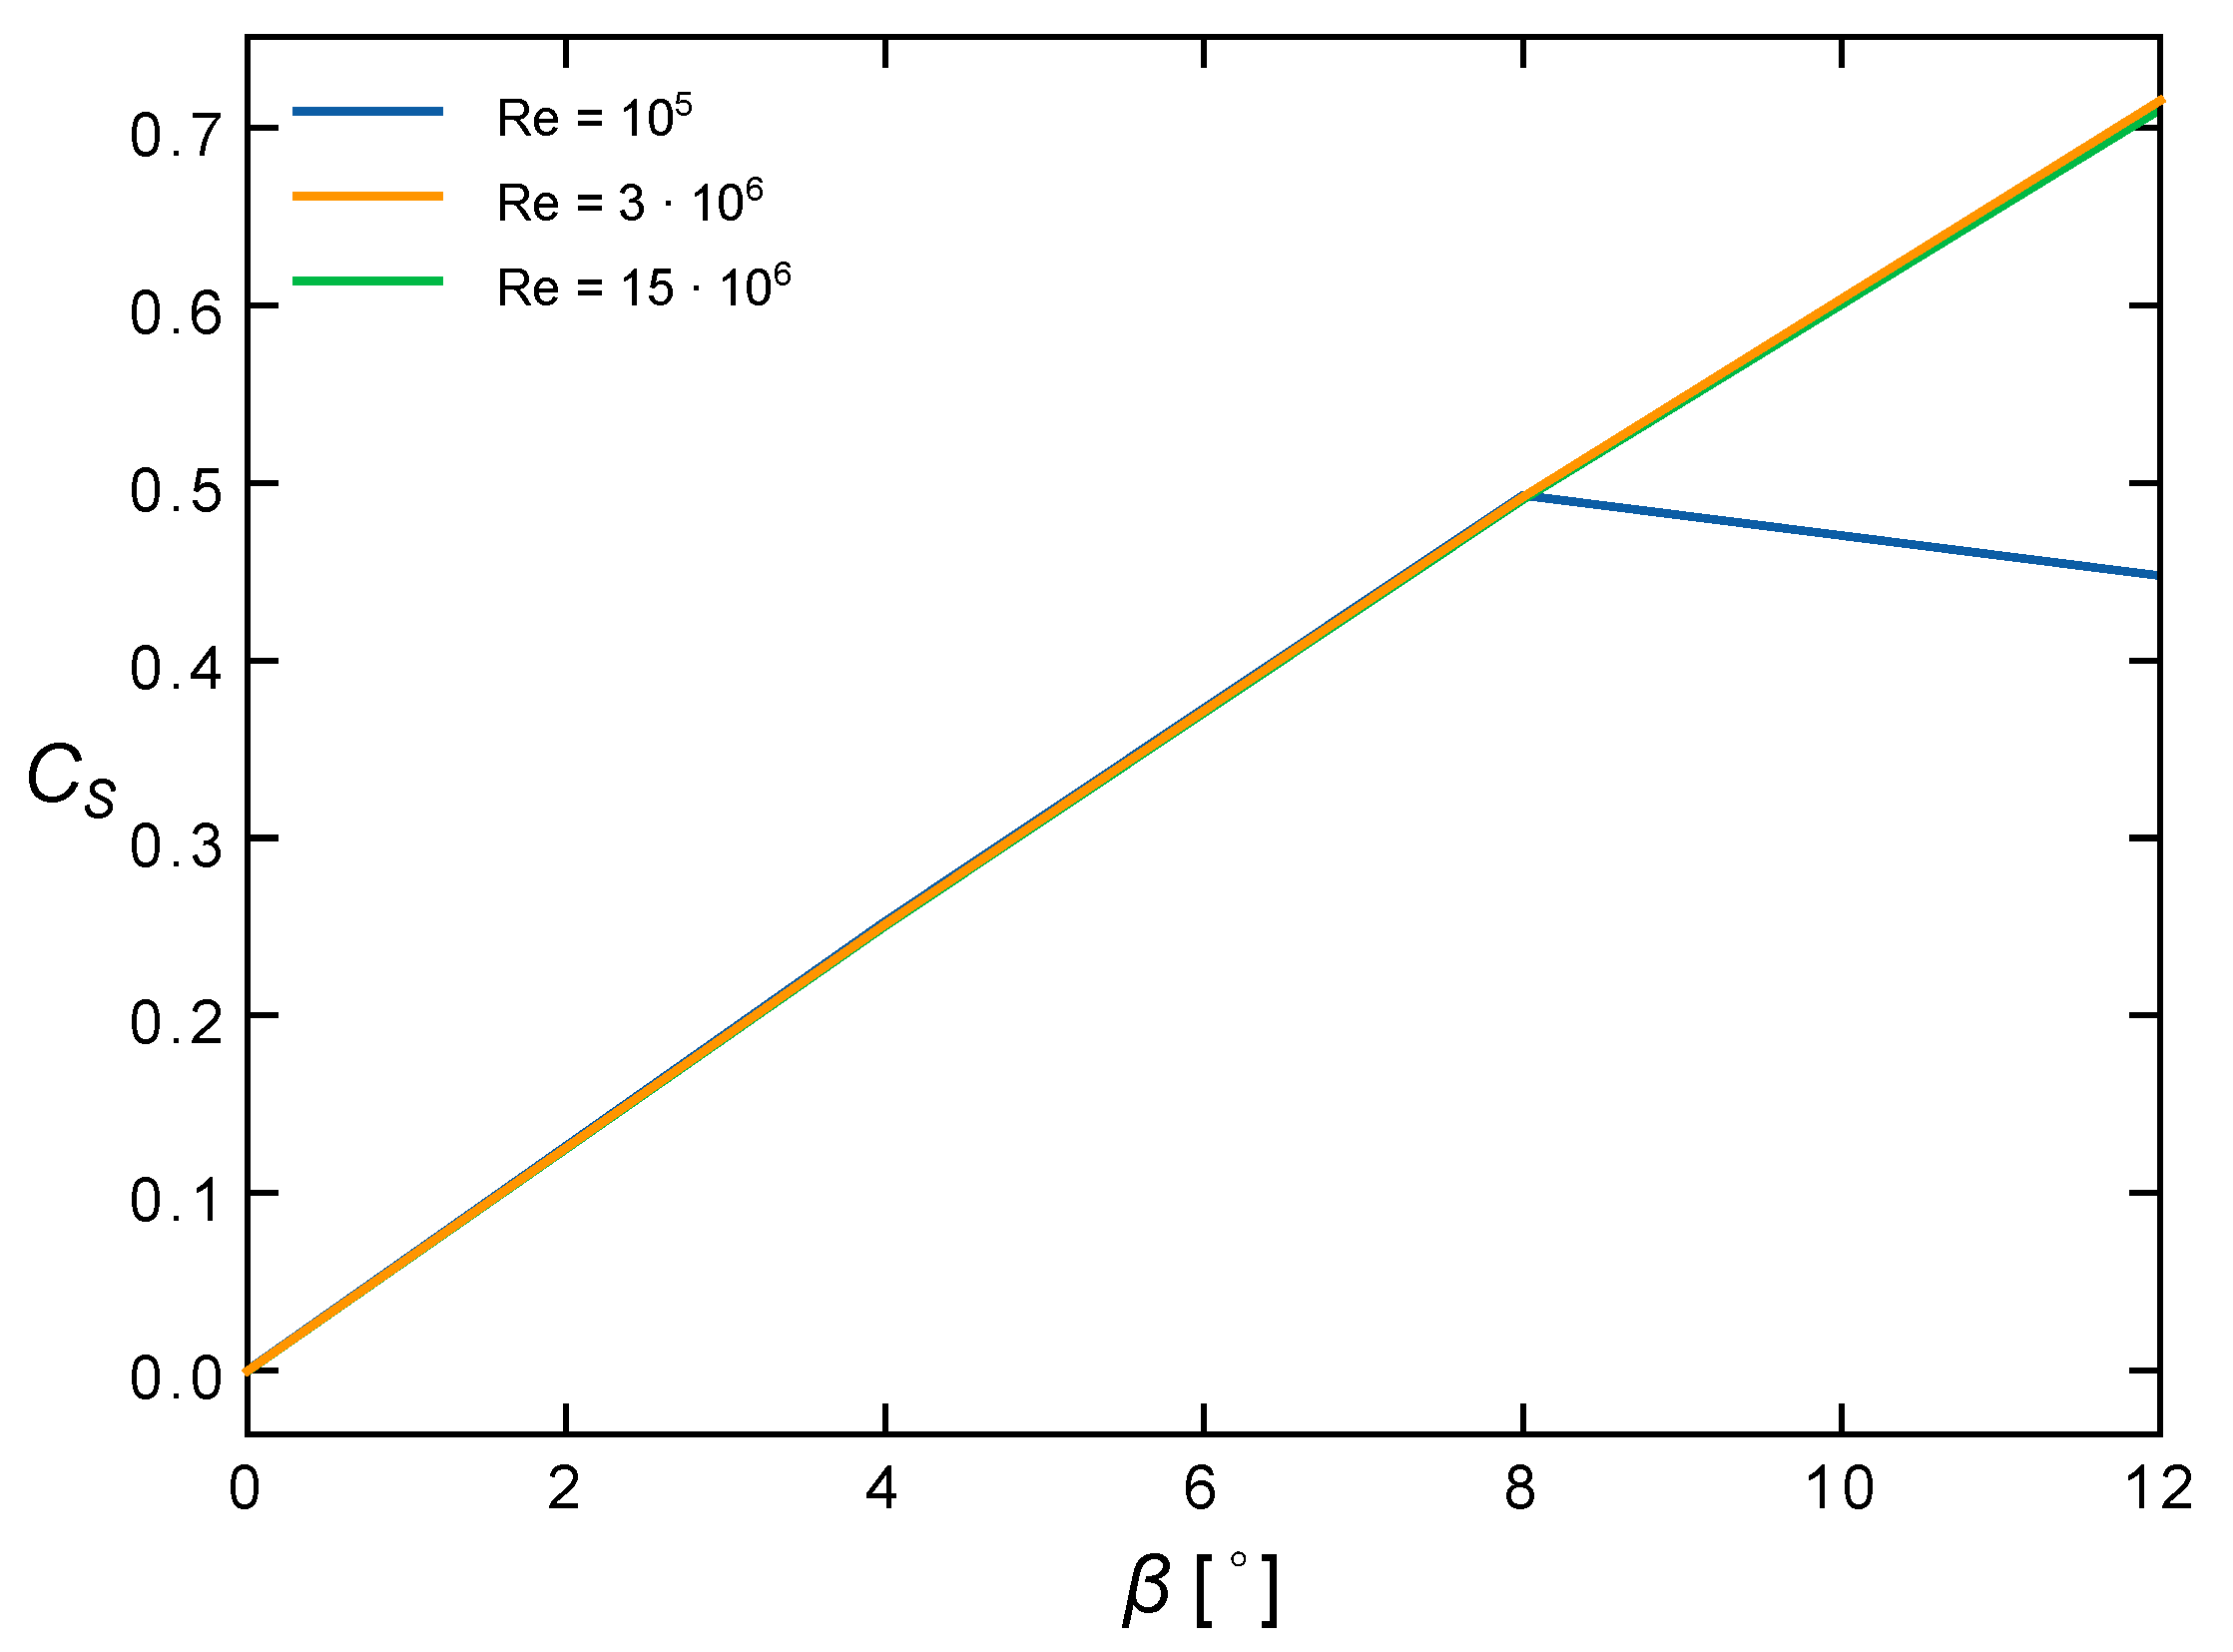
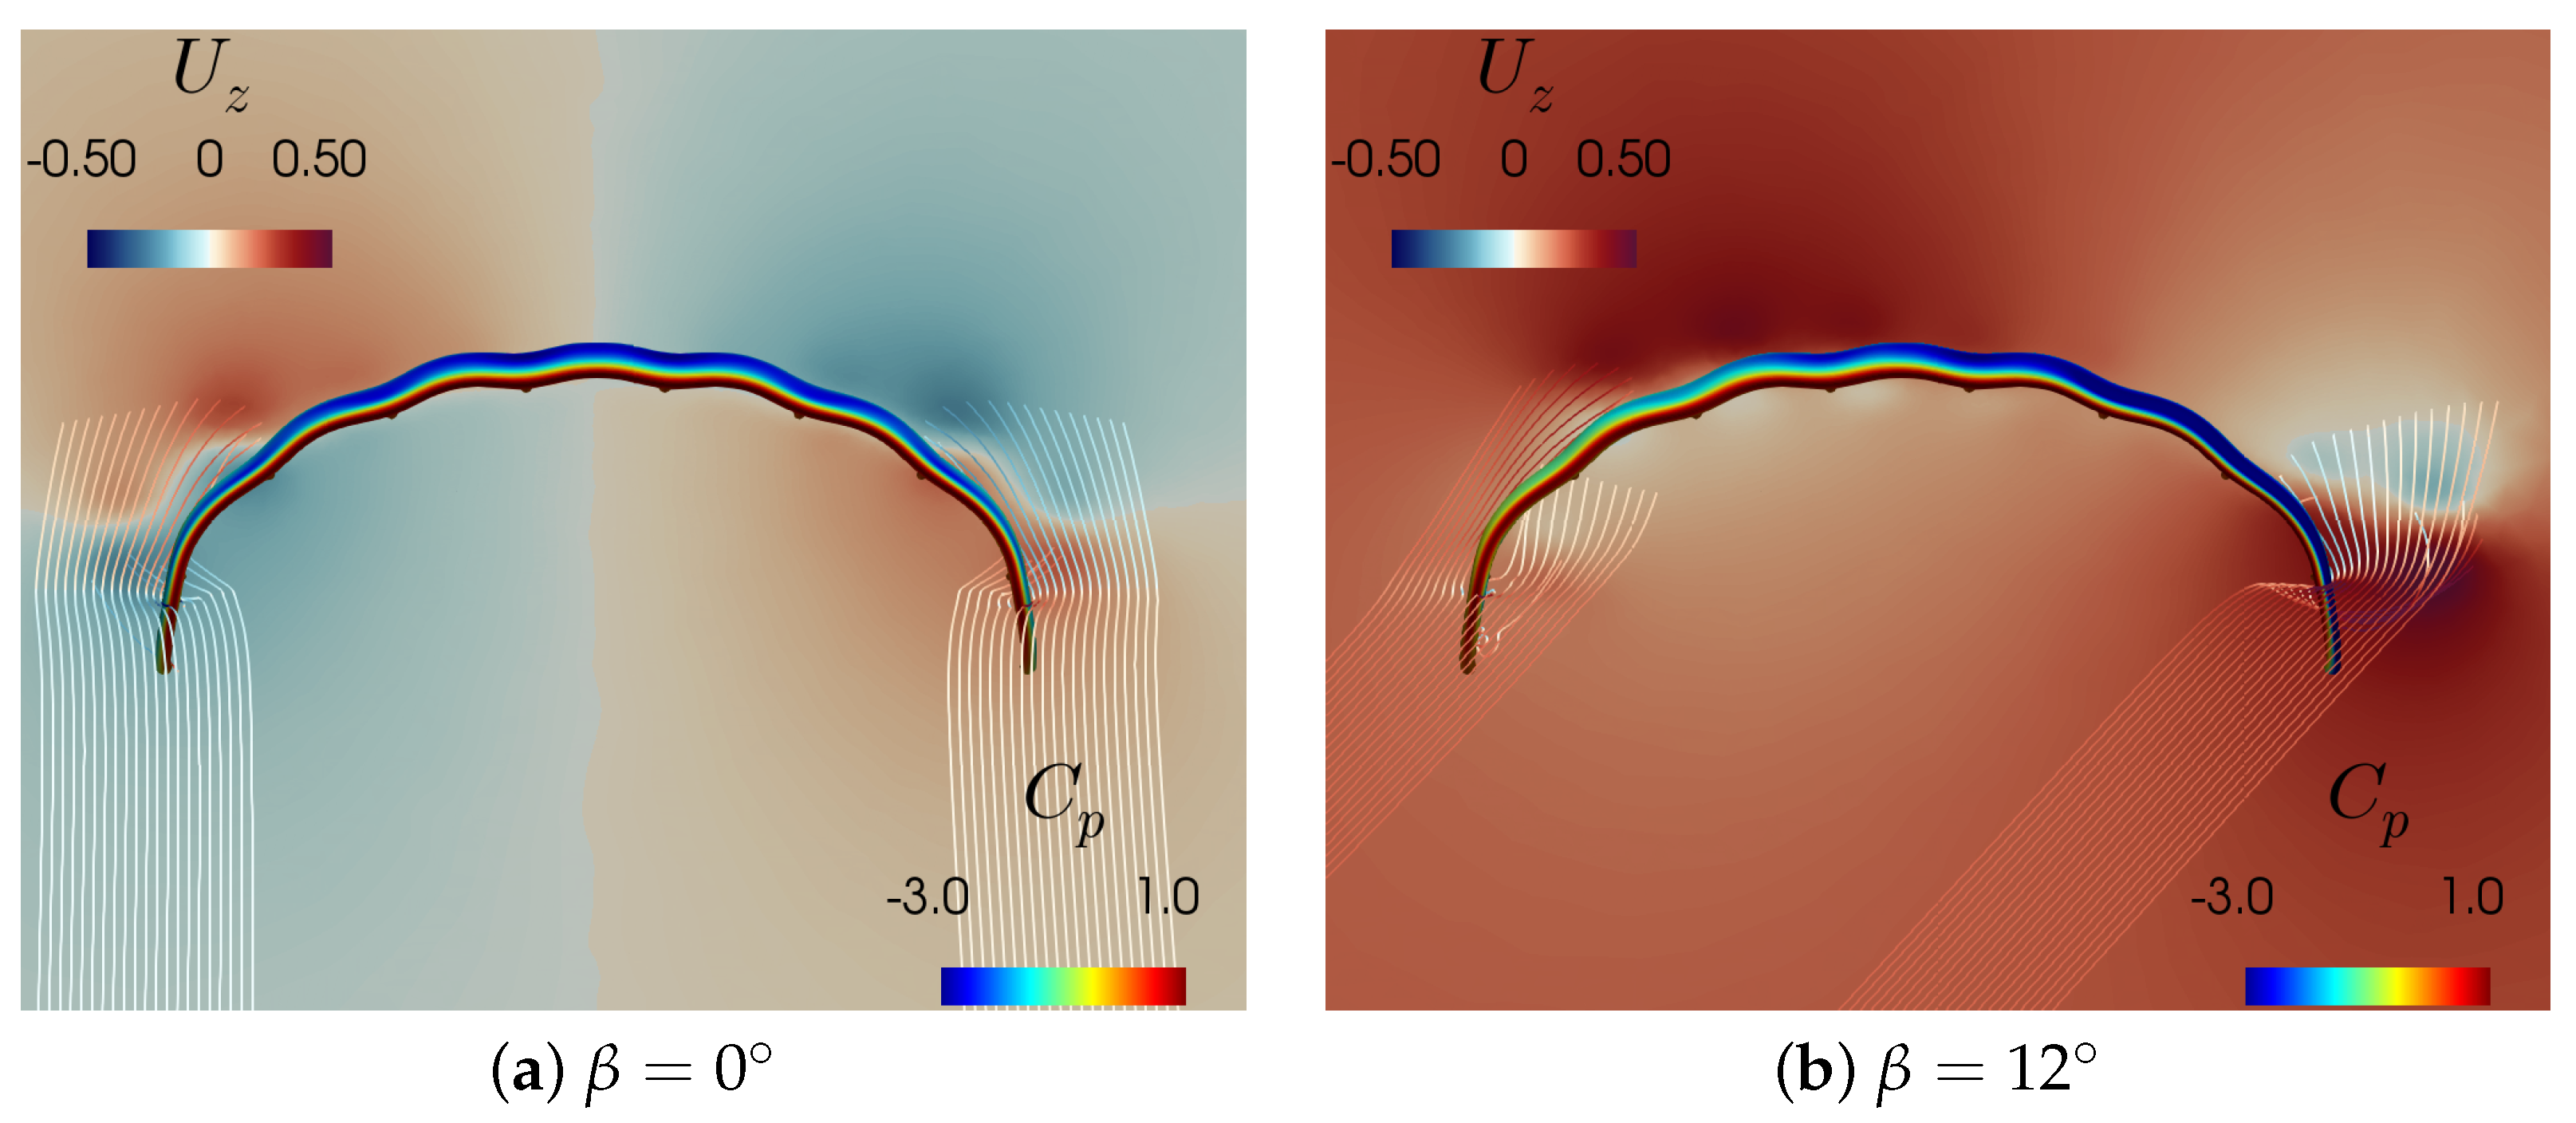
3.2. Aerodynamics with Side-Slip

The flow configuration with side slip is characteristic for the kite flying turns during figure-of-eight manoeuvres [5]. In this section, the angle of attack is fixed at α = 12 to investigate the influence of the side-slip angle β on the flow field and the aerodynamic performance of the wing. The side-slip angle ranges from 0 to 12 in intervals of 4 . This range has been chosen based on the experimental data of [5]. In contrast to the simulations for symmetrical inflow ( β = 0 ), the complete flow domain is used to capture the asymmetry of the flow field. Figure 15 illustrates the differences in pressure coefficient and spanwise component of the flow velocity for Re = 3 × 10 6 , without and with maximum side-slip. The additional streamlines visualise the interaction of the flow around the tips and the propagation downstream in the wake.
The contour plot of U z in the wake flow indicates a strong change in inwash and outwash behaviour. For β = 0 the upper portions of the wake tend the turn inwards, whereas the lower portions of the wake move outwards with respect to the centre of the wing. For β = 12 , the regions were positive U z was seen for β = 0 have become stronger, whereas the negative U z regions have become more positive.
In Figure 16, the influence of the side-slip flow on the lift-to-drag ratio of the wing is analysed.
The continuous lines show the results for the wing with struts at different Re and the dashed line highlights the results for the wing without struts at Re = 3 × 10 6 . It is apparent that the side-slip flow significantly decreases the lift-to-drag ratio of the wing for all the Reynolds numbers considered, with the largest decrease being observed for the smallest values of Re . For maximum side-slip angle ( β = 12 ) the lift-to-drag ratio at higher Reynolds numbers and α = 12 decreases by almost 50 % compared to symmetric inflow. Because the lift decreases stronger than the drag increases with increasing side-slip angle, the behaviour of L / D is non-linear. Another observation is that, as for the results without side-slip, the struts do not impact on the results with side-slip flow.
Figure 17 shows the side force coefficient C S = 2 S / ( ρ U 2 A r e f ) , with S denoting the resultant side force, as a function of the side-slip angle.
The relationship seems to be linear.
Inflow with a side-slip component is generally correlated with steering of the kite [5]. While the asymmetric steering input leads to a roll of the entire wing, it also results in a spanwise twist deformation, as evident from photographic footage. The degree of this aero-elastic phenomenon strongly depends on the design of the wing and its bridle line system. For this reason, the original design geometry can only be used as a rough approximation for inflow with a side-slip component. The effect of an asymmetric actuation of the bridle lines on the aero-elastic deformation of the wing is subject to current research [27].

4. Conclusions

The computational study investigated the effect of chordwise strut tubes and inflow with a side-slip component on the flow around a leading-edge inflatable wing for airborne wind energy applications. The shape of the wing was considered to be constant and its surface perfectly smooth. Accordingly, the effect of aero-elastic deformation was neglected and a steady-state RANS flow solver with transition model was used. The results show that the struts have little influence on the overall aerodynamic performance of the wing, independent of the degree of side-slip. Therefore, for analysing performance in the flow regime investigated here, these geometrical characteristics of the wing can be omitted without a noticable loss of accuracy. This decrease in complexity is favourable for the meshing process. It also reduces the computational cost of the simulations, as flow separation around the struts does not need to be captured accurately when assessing the overall aerodynamic performance of the wing. The chordwise struts do have some influence on the local flow around the wing, for example through the increased vortex shedding around the struts. This could have some influence on small-scale local wing deformations (not investigated here), although this is not expected to be significant as these flow differences are localised around the struts which is where the structural stiffness is maximum. The study also shows that an increasing side-slip angle is detrimental to the aerodynamic performance of the wing, with the lift-over-drag ratio decreasing by a factor of about 1.7 from zero side-slip to a side-slip angle of 12 , which is typical during turning manoeuvres. It is therefore very important to consider these flow configurations when designing such wings. Finally, the present findings related to the dependency of the aerodynamic performance on the Reynolds number and the presence of a laminar separation bubble at Re = 10 5 are in line with previously published results, which is to be expected as the numerical models used in these aforementioned studies are identical to the ones used in this paper.
This work provides a computational framework that can be used to better understand the flow behaviour and aerodynamic performance of leading-edge inflatable wings. It can also help identify the range of applicability of engineering design tools for airborne wind energy wings. Future work could incorporate aero-elastic effects by coupling the steady-state solver with a structural model of the wing, hence modelling wing deformations that are occurring during real flight. It is also recommended using an unsteady flow solver at large angles of attack to compare with the present results under large flow separation.

Author Contributions

Conceptualization, A.V., G.L., M.F. and R.S.; methodology, A.V., G.L., M.F. and R.S.; validation, G.L; formal analysis, G.L.; investigation, G.L.; resources, A.V. and R.S.; data curation, A.V. and G.L.; writing—original draft preparation, A.V.; writing—review and editing, A.V., G.L., M.F. and R.S.; visualization, A.V. and G.L.; supervision, A.V., M.F. and R.S.; project administration, A.V. All authors have read and agreed to the published version of the manuscript.

Funding

This research received no external funding.

Institutional Review Board Statement

Not applicable.

Informed Consent Statement

Not applicable.

Acknowledgments

The authors would like to thank Patryk Demkowicz for advising the second author, especially at the beginning of the work.

Conflicts of Interest

The authors declare no conflict of interest.

References

  1. IRENA. Future of Wind—Deployment, Investment, Technology, Grid Integration and Socio-Economic Aspects (A Global Energy Transformation Paper); Technical report; International Renewable Energy Agency: Abu Dhabi, United Arab Emirates, 2019. [Google Scholar]
  2. IRENA. Global Energy Transformation: A Roadmap to 2050, 2019th ed.; Technical Report; International Renewable Energy Agency: Abu Dhabi, United Arab Emirates, 2019. [Google Scholar]
  3. IRENA. Offshore Renewables: An Action Agenda for Deployment; Technical Report; International Renewable Energy Agency: Abu Dhabi, United Arab Emirates, 2021. [Google Scholar]
  4. Van der Vlugt, R.; Peschel, J.; Schmehl, R. Design and Experimental Characterization of a Pumping Kite Power System. In Airborne Wind Energy; Ahrens, U., Diehl, M., Schmehl, R., Eds.; Green Energy and Technology; Springer: Berlin/Heidelberg, Germany, 2013; Chapter 23; pp. 403–425. [Google Scholar] [CrossRef]
  5. Oehler, J.; Schmehl, R. Aerodynamic Characterization of a Soft Kite by in Situ Flow Measurement. Wind Energy Sci. 2019, 4, 1–21. [Google Scholar] [CrossRef] [Green Version]
  6. Oehler, J.; van Reijen, M.; Schmehl, R. Experimental investigation of soft kite performance during turning maneuvers. J. Phys. Conf. Ser. 2018, 1037. [Google Scholar] [CrossRef]
  7. Van der Vlugt, R.; Bley, A.; Schmehl, R.; Noom, M. Quasi-Steady Model of a Pumping Kite Power System. Renew. Energy 2019, 131, 83–99. [Google Scholar] [CrossRef]
  8. Borobia-Moreno, R.; Ramiro-Rebollo, D.; Schmehl, R.; Sánchez-Arriaga, G. Identification of Kite Aerodynamic Characteristics Using the Estimation Before Modeling Technique. Wind Energy 2021, 24, 596–608. [Google Scholar] [CrossRef]
  9. Schmidt, E.; De Lellis Costa de Oliveira, M.; Saraiva da Silva, R.; Fagiano, L.; Trofino Neto, A. In-Flight Estimation of the Aerodynamics of Tethered Wings for Airborne Wind Energy. IEEE Trans. Control Syst. Technol. 2020, 28, 1309–1322. [Google Scholar] [CrossRef] [Green Version]
  10. Wood, T.A.; Hesse, H.; Smith, R.S. Predictive Control of Autonomous Kites in Tow Test Experiments. IEEE Control Syst. Lett. 2017, 1, 110–115. [Google Scholar] [CrossRef]
  11. Hummel, J.; Göhlich, D.; Schmehl, R. Automatic Measurement and Characterization of the Dynamic Measurands of Tethered Flexible Wings. Wind Energy Sci. 2019, 4, 41–55. [Google Scholar] [CrossRef] [Green Version]
  12. Rushdi, M.A.; Rushdi, A.A.; Dief, T.N.; Halawa, A.M.; Yoshida, S.; Schmehl, R. Power Prediction of Airborne Wind Energy Systems Using Multivariate Machine Learning. Energies 2020, 13, 2367. [Google Scholar] [CrossRef]
  13. Leloup, R.; Roncin, K.; Bles, G.; Leroux, J.B.; Jochum, C.; Parlier, Y. Estimation of the Lift-to-Drag Ratio Using the Lifting Line Method: Application to a Leading Edge Inflatable Kite. In Airborne Wind Energy; Ahrens, U., Diehl, M., Schmehl, R., Eds.; Green Energy and Technology; Springer: Berlin/Heidelberg, Germany, 2013; Chapter 19; pp. 339–355. [Google Scholar] [CrossRef]
  14. Duport, C. Modeling with Consideration of the Fluid-Structure Interaction of the Behavior under Load of a Kite for Auxiliary Traction of Ships. Ph.D. Thesis, ENSTA Bretagne, Brest, France, 2018. [Google Scholar]
  15. Gaunaa, M.; Paralta Carqueija, P.F.; Réthoré, P.E.M.; Sørensen, N.N. A Computationally Efficient Method for Determining the Aerodynamic Performance of Kites for Wind Energy Applications. In Proceedings of the European Wind Energy Association Conference, Brussels, Belgium, 14–17 March 2011; EWEA: Brussels, Belgium, 2011. [Google Scholar]
  16. Breukels, J. An Engineering Methodology for Kite Design. Ph.D. Thesis, Delft University of Technology, Delft, The Netherlands, 2011. [Google Scholar]
  17. Leuthold, R.C. Multiple-Wake Vortex Lattice Method for Membrane-Wing Kites. Master’s Thesis, Delft University of Technology, Delft, The Netherlands, 2015. [Google Scholar]
  18. Folkersma, M.; Schmehl, R.; Viré, A. Flow transition modeling on two-dimensional circular leading edge airfoils. Wind Energy 2019, 22, 908–921. [Google Scholar] [CrossRef] [PubMed]
  19. Demkowicz, P. Numerical Analysis of the Flow Past a Leading Edge Inflatable Kite Wing Using a Correlation-Based Transition Model. Master’s Thesis, Delft University of Technology, Delft, The Netherlands, 2019. [Google Scholar]
  20. Viré, A.; Demkowicz, P.; Folkersma, M.; Roullier, A.; Schmehl, R. Reynolds-Averaged Navier-Stokes Simulations of the Flow Past a Leading Edge Inflatable Wing for Airborne Wind Energy Applications. J. Phys. Conf. Ser. 2020, 1618, 032007. [Google Scholar] [CrossRef]
  21. Schelbergen, M.; Schmehl, R. Validation of the Quasi-Steady Performance Model for Pumping Airborne Wind Energy Systems. J. Phys. Conf. Ser. 2020, 1618, 032003. [Google Scholar] [CrossRef]
  22. Vermillion, C.; Cobb, M.; Fagiano, L.; Leuthold, R.; Diehl, M.; Smith, R.S.; Wood, T.A.; Rapp, S.; Schmehl, R.; Olinger, D.; et al. Electricity in the Air: Insights From Two Decades of Advanced Control Research and Experimental Flight Testing of Airborne Wind Energy Systems. Annu. Rev. Control 2021, 52, 330–357. [Google Scholar] [CrossRef]
  23. Lebesque, G. Steady-State RANS Simulation of a Leading Edge Inflatable Wing with Chordwise Struts. Master’s Thesis, Delft University of Technology, Delft, The Netherlands, 2020. [Google Scholar]
  24. Menter, F. Two-equation eddy-viscosity turbulence models for engineering applications. AIAA J. 1994, 32, 1598–1605. [Google Scholar] [CrossRef] [Green Version]
  25. Langtry, R.; Menter, F. Correlation-Based Transition Modeling for Unstructured Parallelized Computational Fluid Dynamics Codes. AIAA J. 2009, 47, 2894–2906. [Google Scholar] [CrossRef]
  26. Jeong, J.; Hussain, F. On the identification of a vortex. J. Fluid Mech. 1995, 285, 69–94. [Google Scholar] [CrossRef]
  27. Jonard, S. In-Flight Measurement of Kite Deformations with Inertial Sensors. Master’s Thesis, Delft University of Technology, Delft, The Netherlands, 2021. [Google Scholar]
Figure 1. TU Delft V3A kite with 25 m 2 wing surface area: (a) during flight and (b) design geometry with body-fixed reference frame ( X , Y , Z ) and definition of the side-slip angle β and angle of attack α to describe the direction of the undisturbed inflow velocity U relative to the wing.
Energies 15 01450 g001
Figure 2. Smoothing the attachment of strut tubes and canopy: wing geometry before (left) and after (right) the filleting. In the original CAD geometry the strut tubes are attached to the leading edge tube. Because the connection of the leading edge tube with the canopy is also smoothed by a fillet [20], the strut tubes connect to this fillet surface and not anymore to the original leading edge tube.
Energies 15 01450 g002
Figure 3. Closure of the open tube geometry: original CAD model on the (left) and closed geometry on the (right).
Energies 15 01450 g003
Figure 4. Surface mesh of the wing, adapted from [23]: (a) upper surface, (b) lower surface.
Energies 15 01450 g004
Figure 5. Volume mesh in the symmetry plane ( Z = 0 ), taken from [23].
Energies 15 01450 g005
Figure 6. Contour plot of the pressure coefficient C p on the wing surface and streamlines around the tip regions coloured by the transverse velocity component U z for Re = 3 × 10 6 , α = 12 and β = 0 , taken from [23].
Energies 15 01450 g006
Figure 7. Contour plots of streamwise skin friction coefficient C f , x on the surface and total pressure coefficient C p , T in the symmetry plane ( Z = 0 ) for Re = 3 × 10 6 and β = 0 , taken from [23].
Energies 15 01450 g007
Figure 8. Streamlines and magnitude of the velocity field in the wing symmetry plane ( Z = 0 ) for α = 6 , taken from [23]: (a) Re = 10 5 and (b) Re = 3 × 10 6 .
Energies 15 01450 g008
Figure 9. Contour plot of the streamwise component of the friction coefficient on the pressure side of the wing, for Re = 3 × 10 6 and α = 12 , taken from [23].
Energies 15 01450 g009
Figure 10. λ 2 -criterion for Re = 3 × 10 6 and α = 12 in slices perpendicular to the incoming flow, taken from [23].
Energies 15 01450 g010
Figure 11. Aerodynamic force coefficients as functions of the angle of attack, without side-slip: (a) lift coefficient C L and (b) drag coefficient C D .
Energies 15 01450 g011
Figure 12. Lift-over-drag ratio as a function of the angle of attack without side-slip.
Energies 15 01450 g012
Figure 13. Chordwise C P distribution at the symmetry plane for Re = 10 5 and α = 6 .
Energies 15 01450 g013
Figure 14. Chordwise C f , x distribution at the symmetry plane for Re = 10 5 and α = 6 .
Energies 15 01450 g014
Figure 15. Pressure coefficient C P (colouring of wing surface) and transverse component U z of the flow velocity (colouring of an Y Z -plane in the wake flow) for Re = 3 × 10 6 and α = 12 , taken from [23].
Energies 15 01450 g015
Figure 16. Lift-over-drag ratio as a function of the side-slip angle for α = 12 .
Energies 15 01450 g016
Figure 17. Side force coefficient as a function of the side-slip angle for α = 12 , taken from [23].
Energies 15 01450 g017
Publisher’s Note: MDPI stays neutral with regard to jurisdictional claims in published maps and institutional affiliations.

