
Impact on the Power Grid Caused via Ultra-Fast Charging Technologies of the Electric Buses Fleet


 and
and 
Abstract
:1. Introduction
1.1. Literature Review
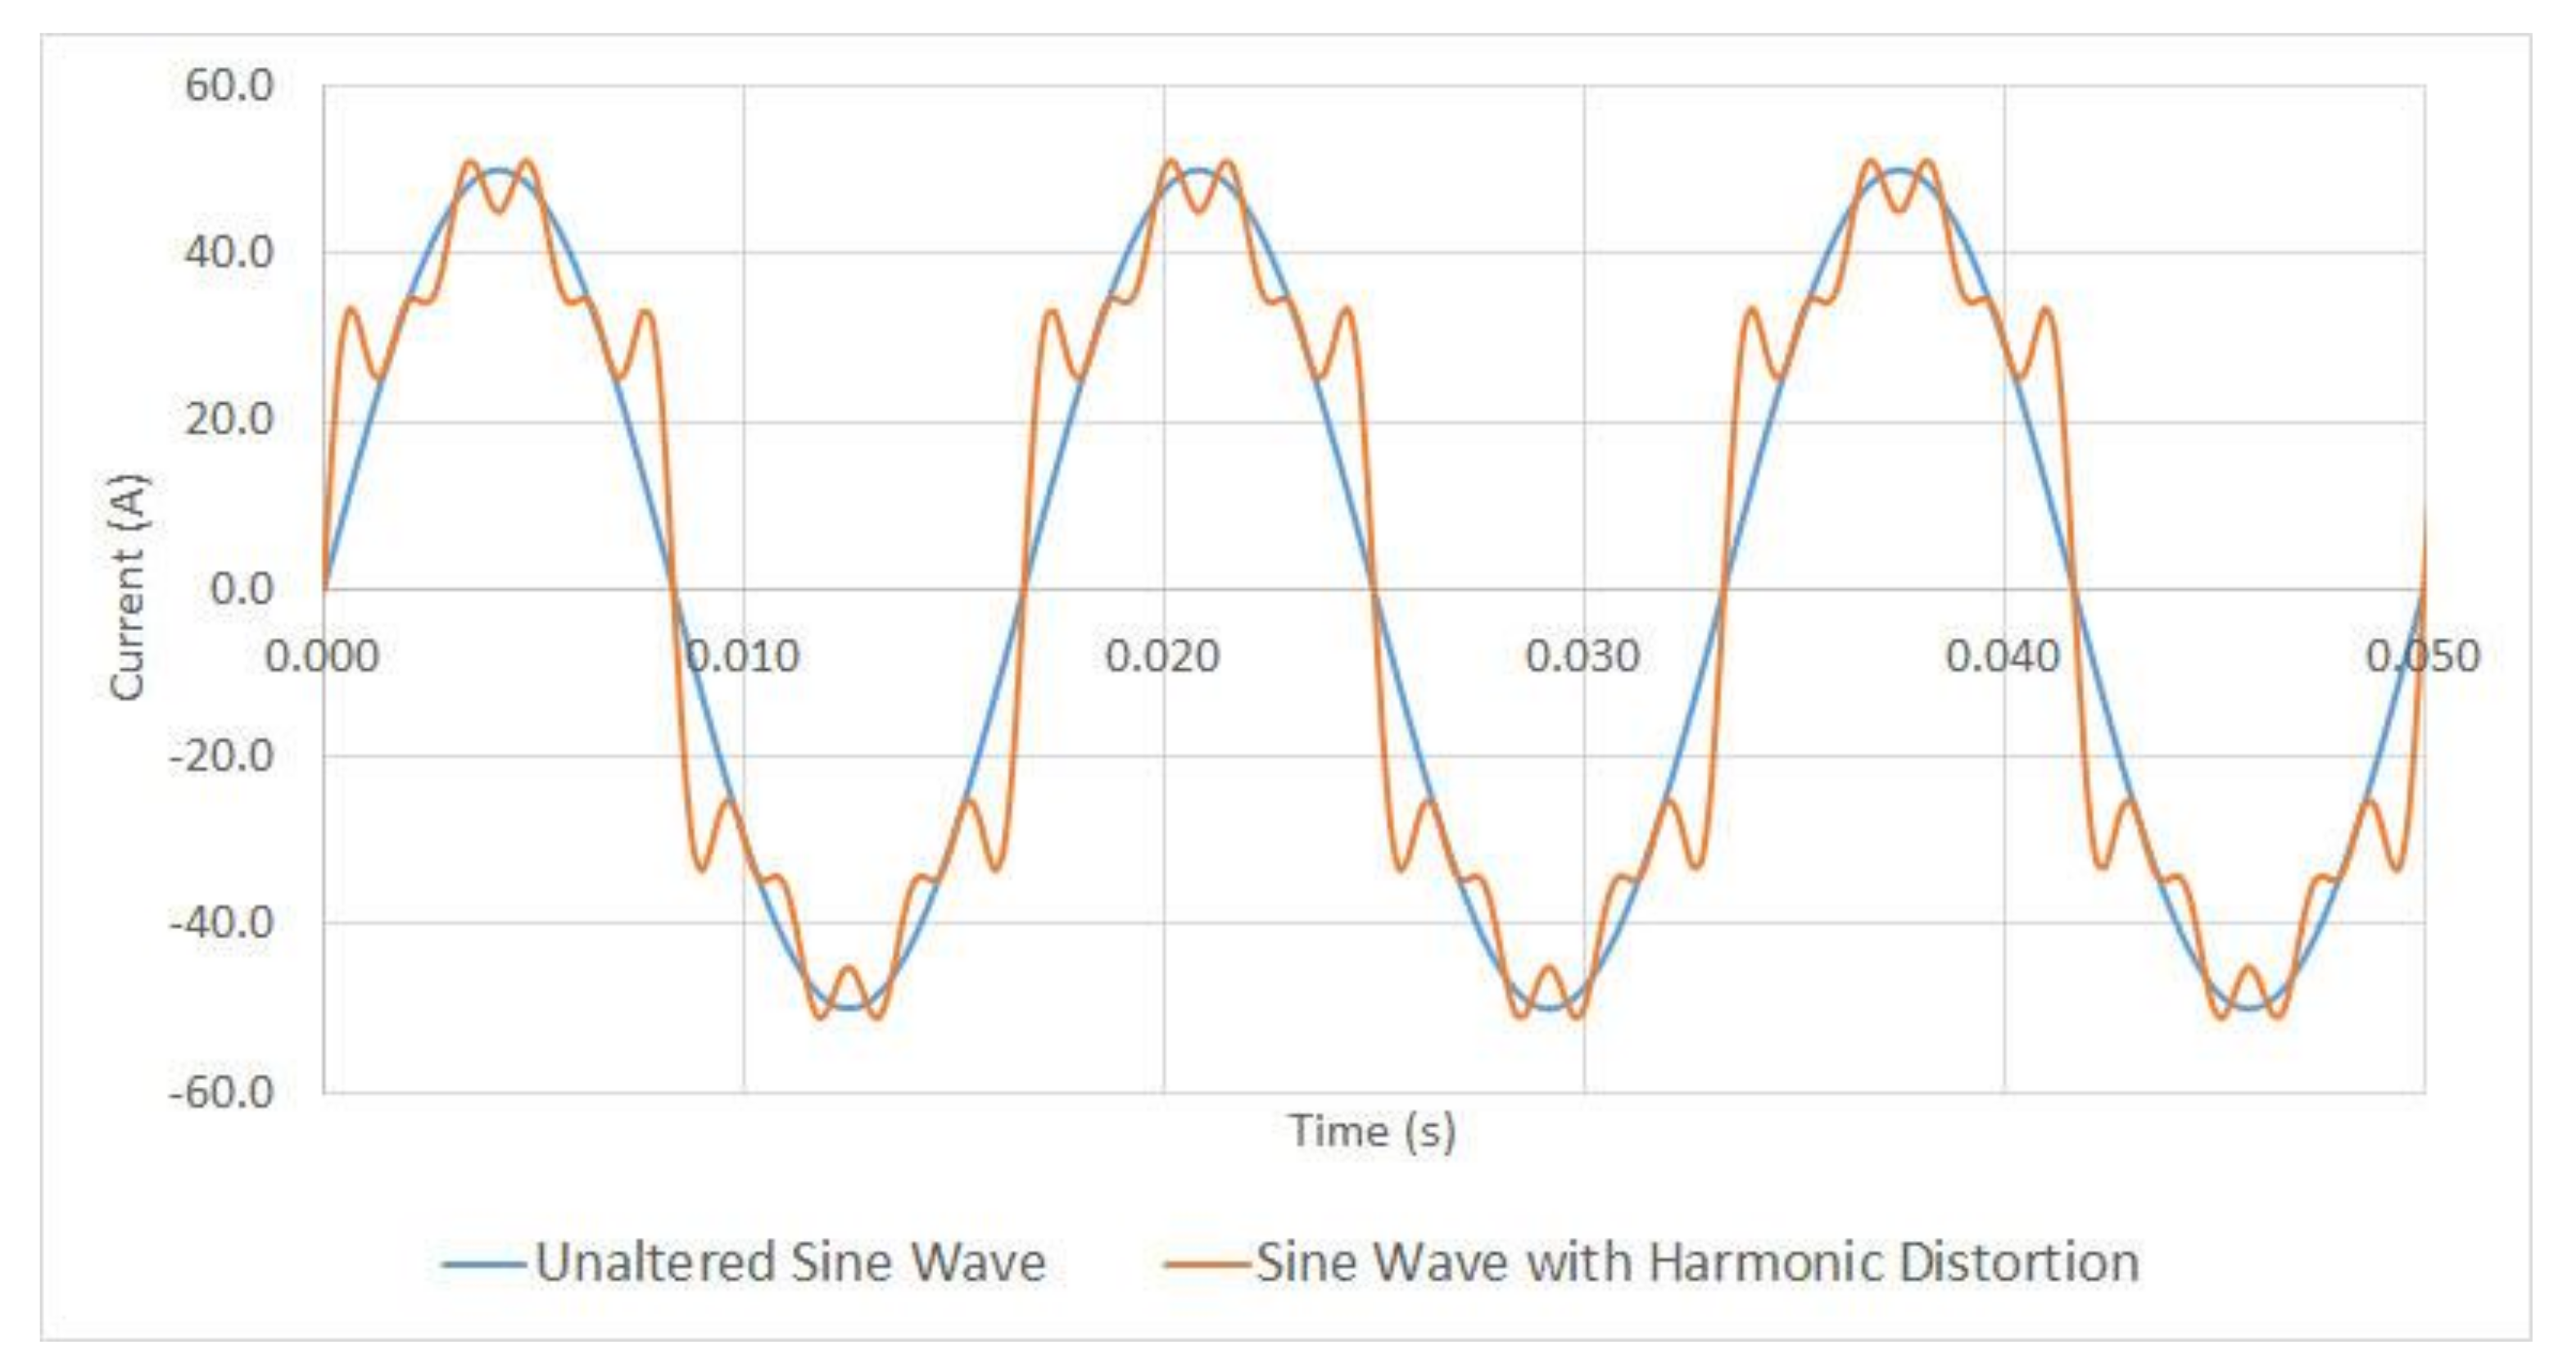
- Individually, by their relative amplitude Uh related to the fundamental voltage U1, where h is the order of the harmonic;
- Globally, usually by the Total Harmonic Distortion of Voltage (THDV).
1.2. Research Gap
1.3. Contribution
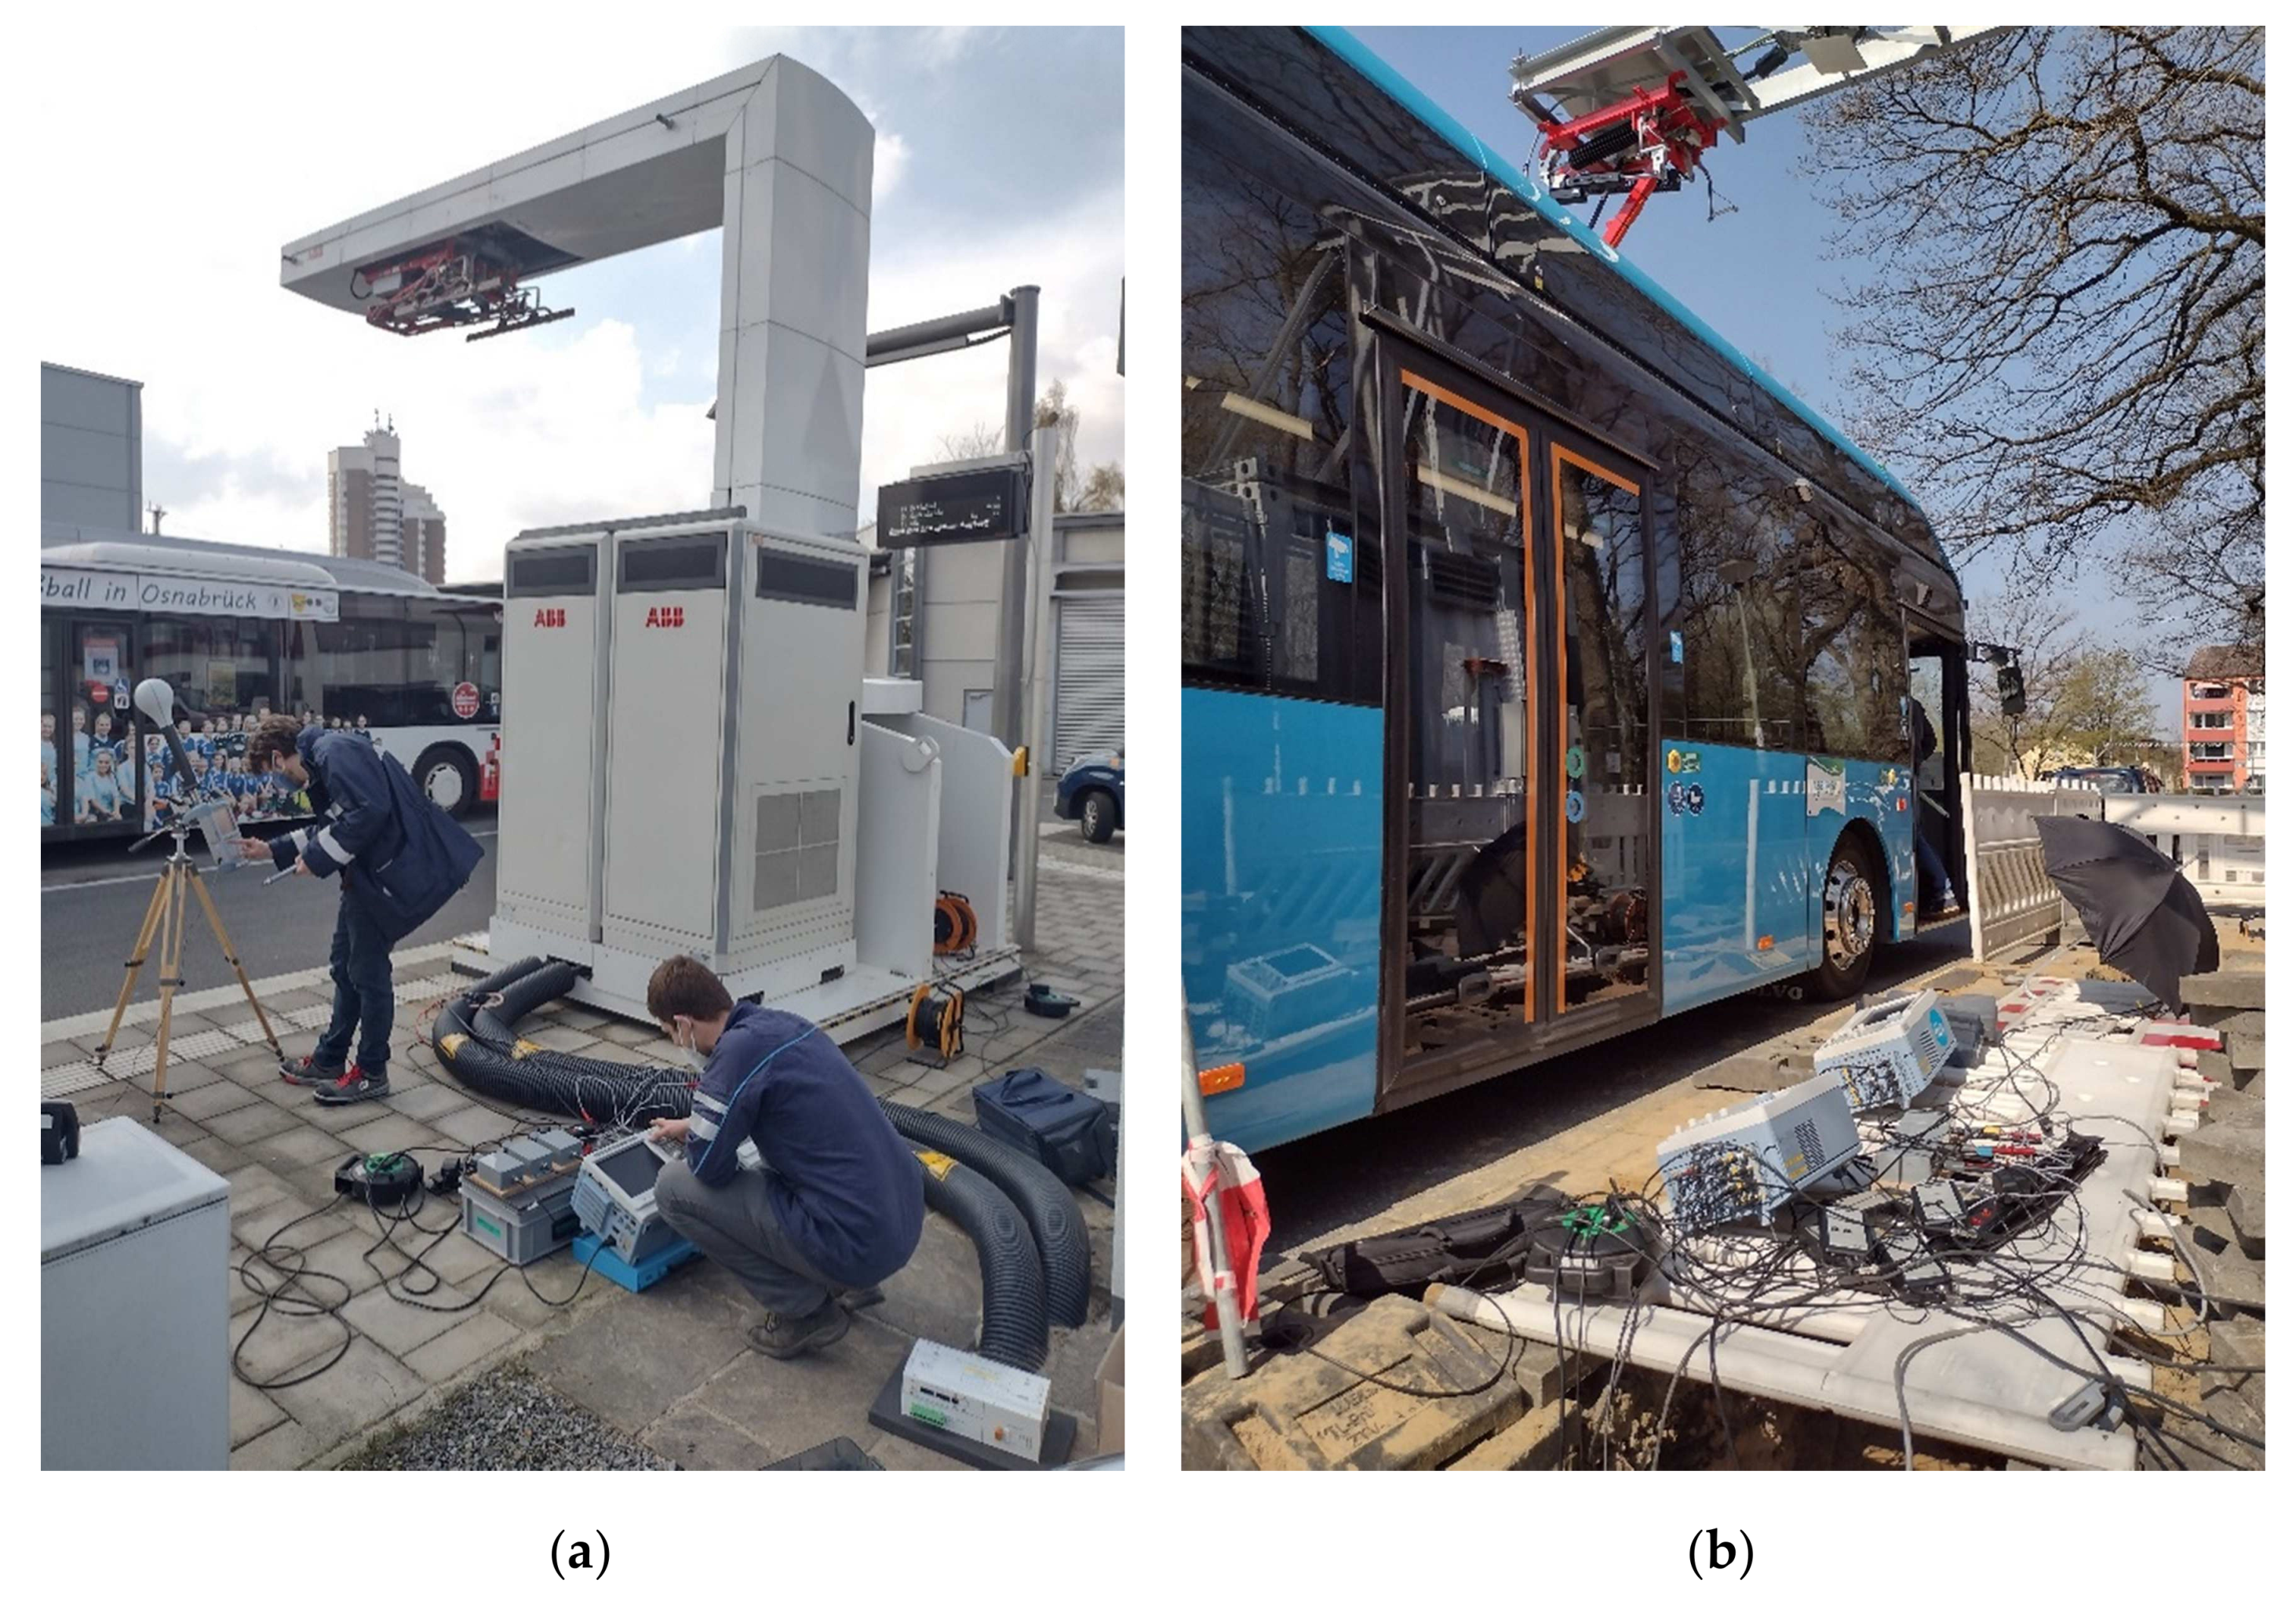
- UC1 takes place in Osnabrück, Germany, and includes two pantograph chargers of 300 kW and 350 kW, respectively, to charge an BEB with a battery capacity of 196 kWh;
- UC2 takes place in Eindhoven, Netherlands, and includes 10 fast-chargers of 300 kW and 22 slow-chargers of 50 kW.
2. Depot and Opportunity Charging Solutions
- Slow-charging (overnight charging);
- Opportunity charging at central points;
- Opportunity charging along the routes.
- 100–200 km each day and 14–16 h journey;
- Average speed of 15–30 km/h;
- Depot charging (3–8 h) at medium power level 50–150 kW. Mandatory for battery balancing and aging effect minimization. There is also the possibility of pantograph charging on the depot;
- Stop and go (opportunity) pantograph charging (2–5 min) at high power level 300–600 kW.
3. Use Case1
3.1. Objectives
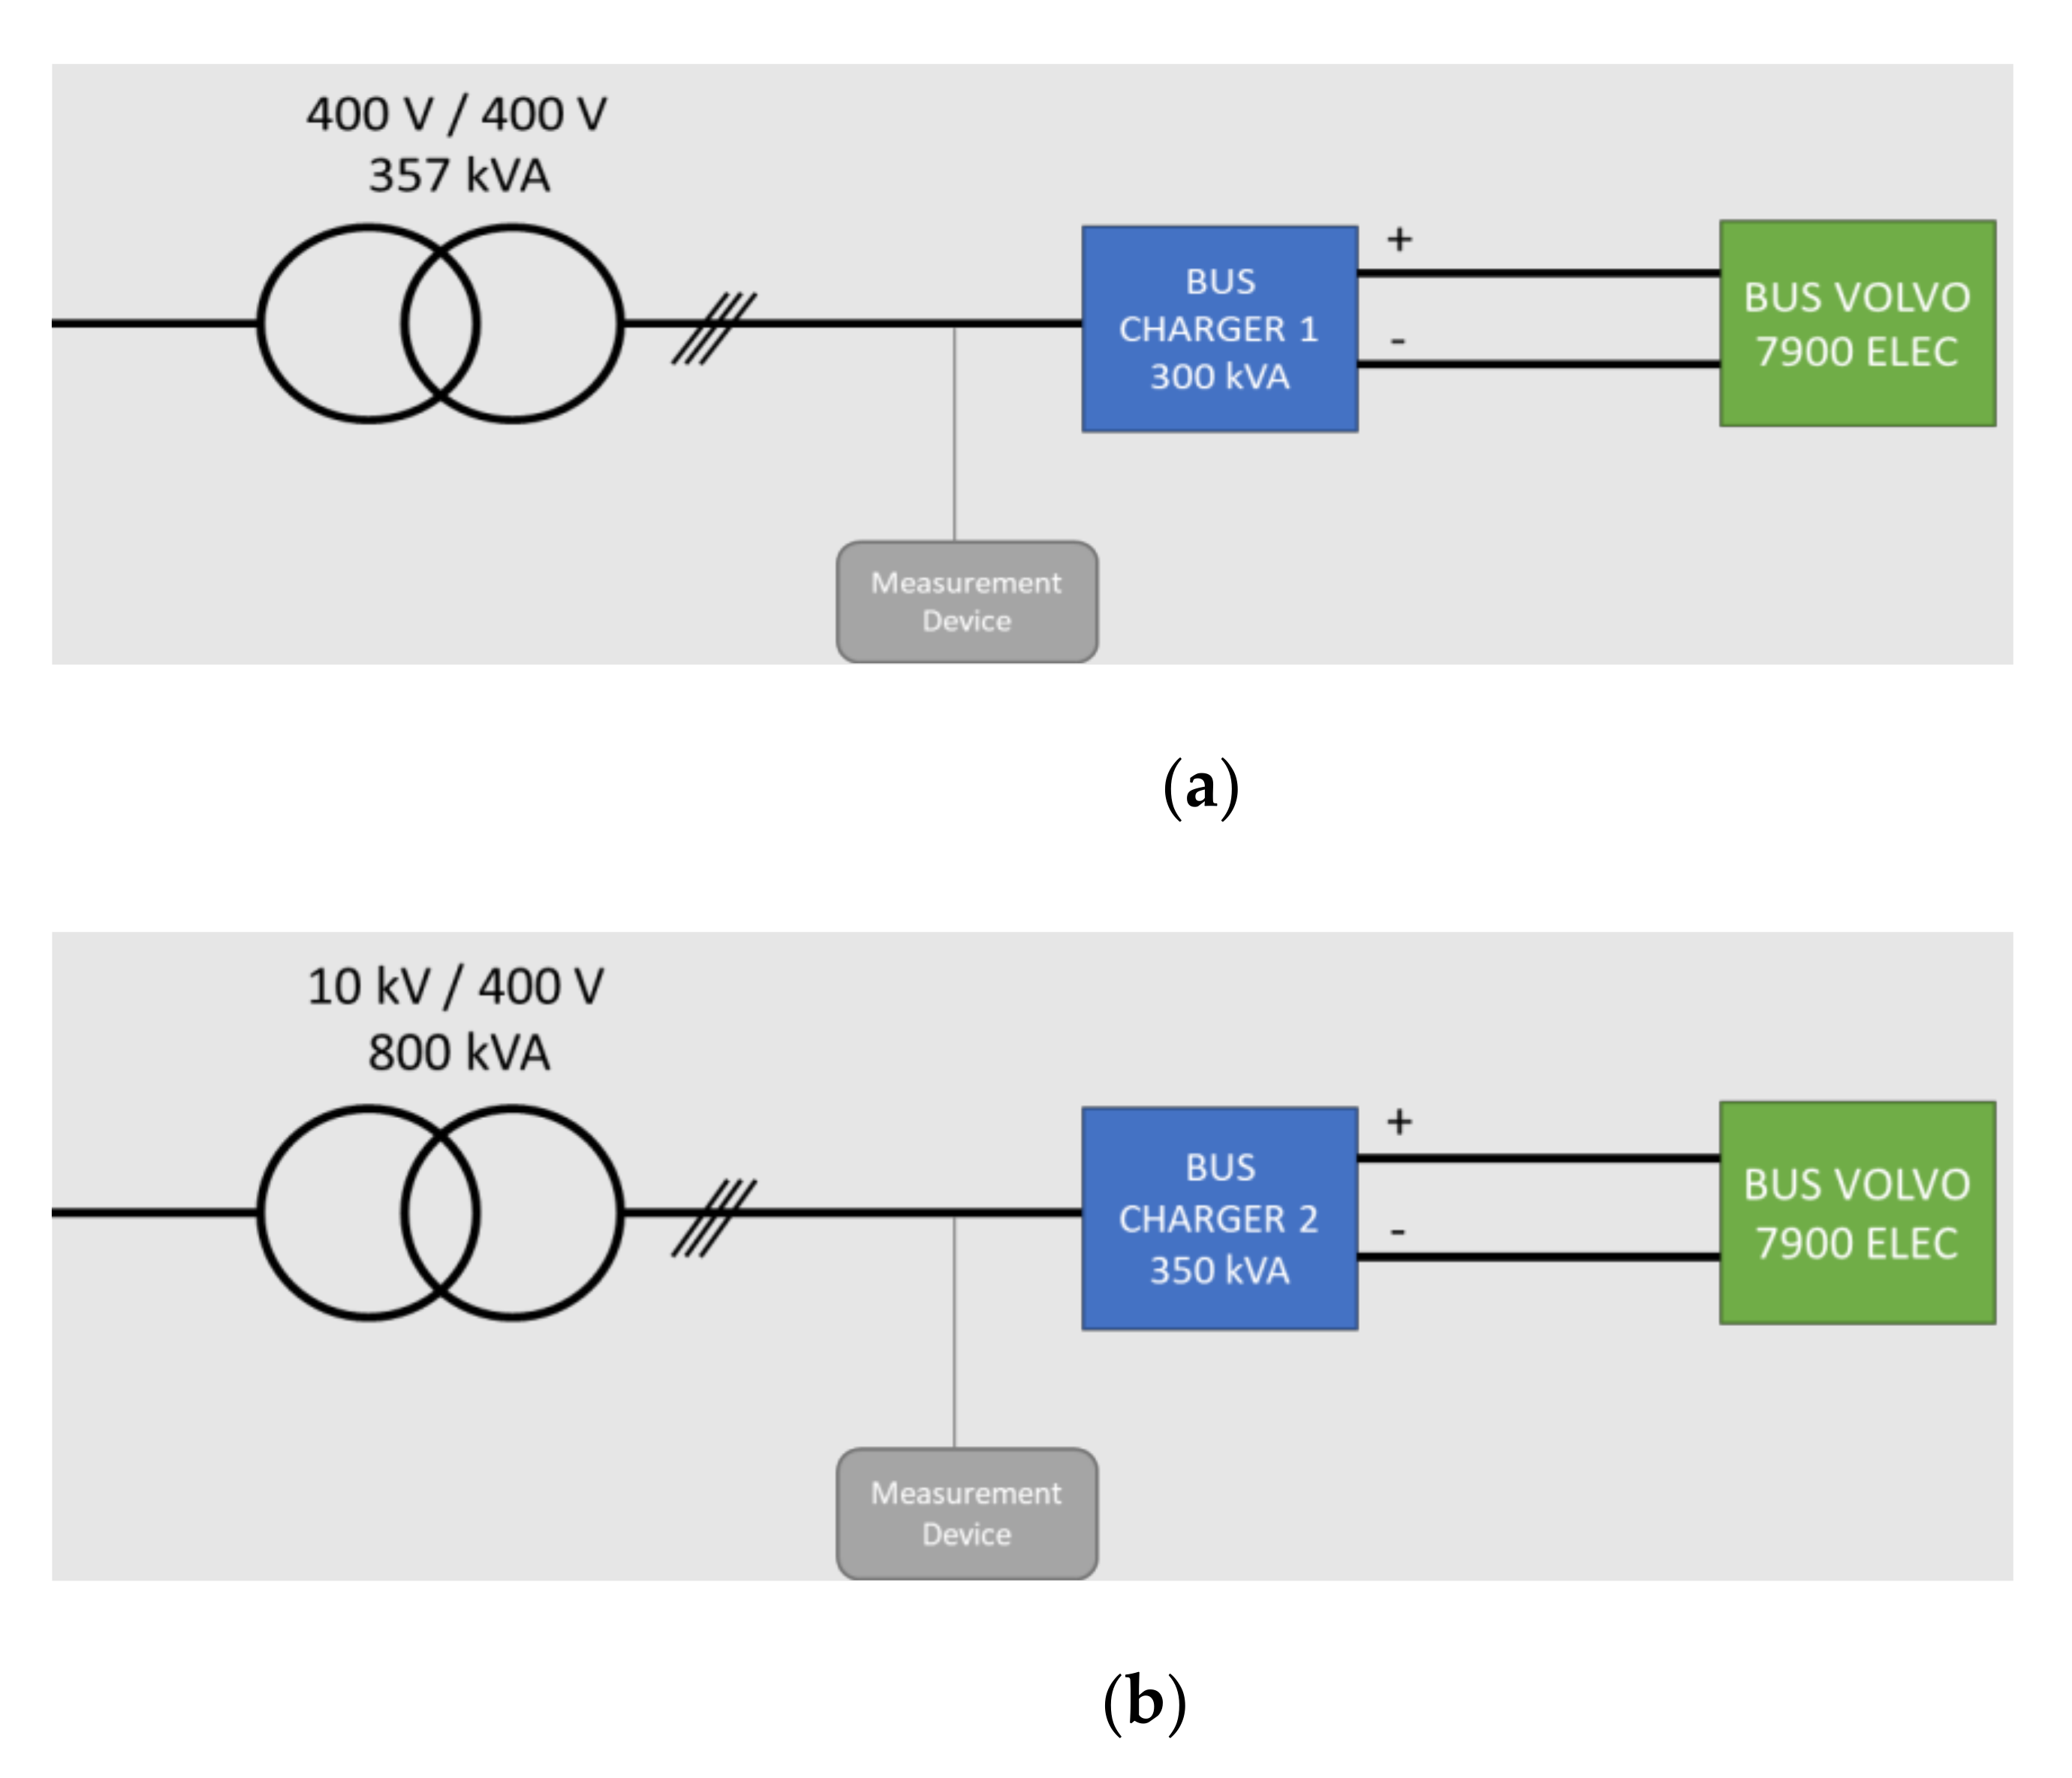
- For charger 1, the e-bus used for the tests was the Volvo 7900 Electric with a battery capacity of 196 kWh. Its SoC was reduced to 48% before the initiation of the charging to full capacity. The charger is an opportunity charger with a maximum power of 300 kW composed of two units of 150 kW each. During the measurements, the power had to be limited to 150 kW due to the low sizing of the transformer;
- Similarly, for charger 2, the bus used for the tests was the Volvo 7900 Electric with a battery capacity of 196 kWh. Its state of charge was reduced to 48% before the initiation of the charging to full capacity. The charger is an opportunity charger with a maximum power of 350 kW.
3.2. Measuring Setup/Methodology
3.2.1. Norms
- The EN 50160 describes and specifies the minimum voltage quality that the distribution system operator must provide to the end-user, but does not apply to limit a device emission itself;
- The IEC 6100-3-12 specifies the current harmonics limit for devices below 75 A. These limits are required to get the CE mark on a specific product. However, this norm does not apply to fast bus chargers as the rated current is above 75 A;
- The IEEE 519 provides some recommended practices for the current harmonics; however, this standard is not normative.
3.2.2. Measurement Setup
- The feeding transformer is not the same. This means that the equivalent grid impedance seen from both chargers is not the same;
- The rated power of the fast-charger is different 300 kVA and 350 kVA;
- The same e-bus has been used for both measurement setups with the scope recorder. For the entire week’s measurement with the power quality analyzers, there is no view on the type of bus used;
- There is only one bus charger connected to the transformer.
- The power quality analyzers have been used to test the compliance with the EN 50160 standard; one full week for the two charging sites have been recorded;
- The scope recorder has been used to record one full bus charge (from a low state of charge to full charge) for the two bus chargers.
4. Results
4.1. PQ Analysis According to EN 50160
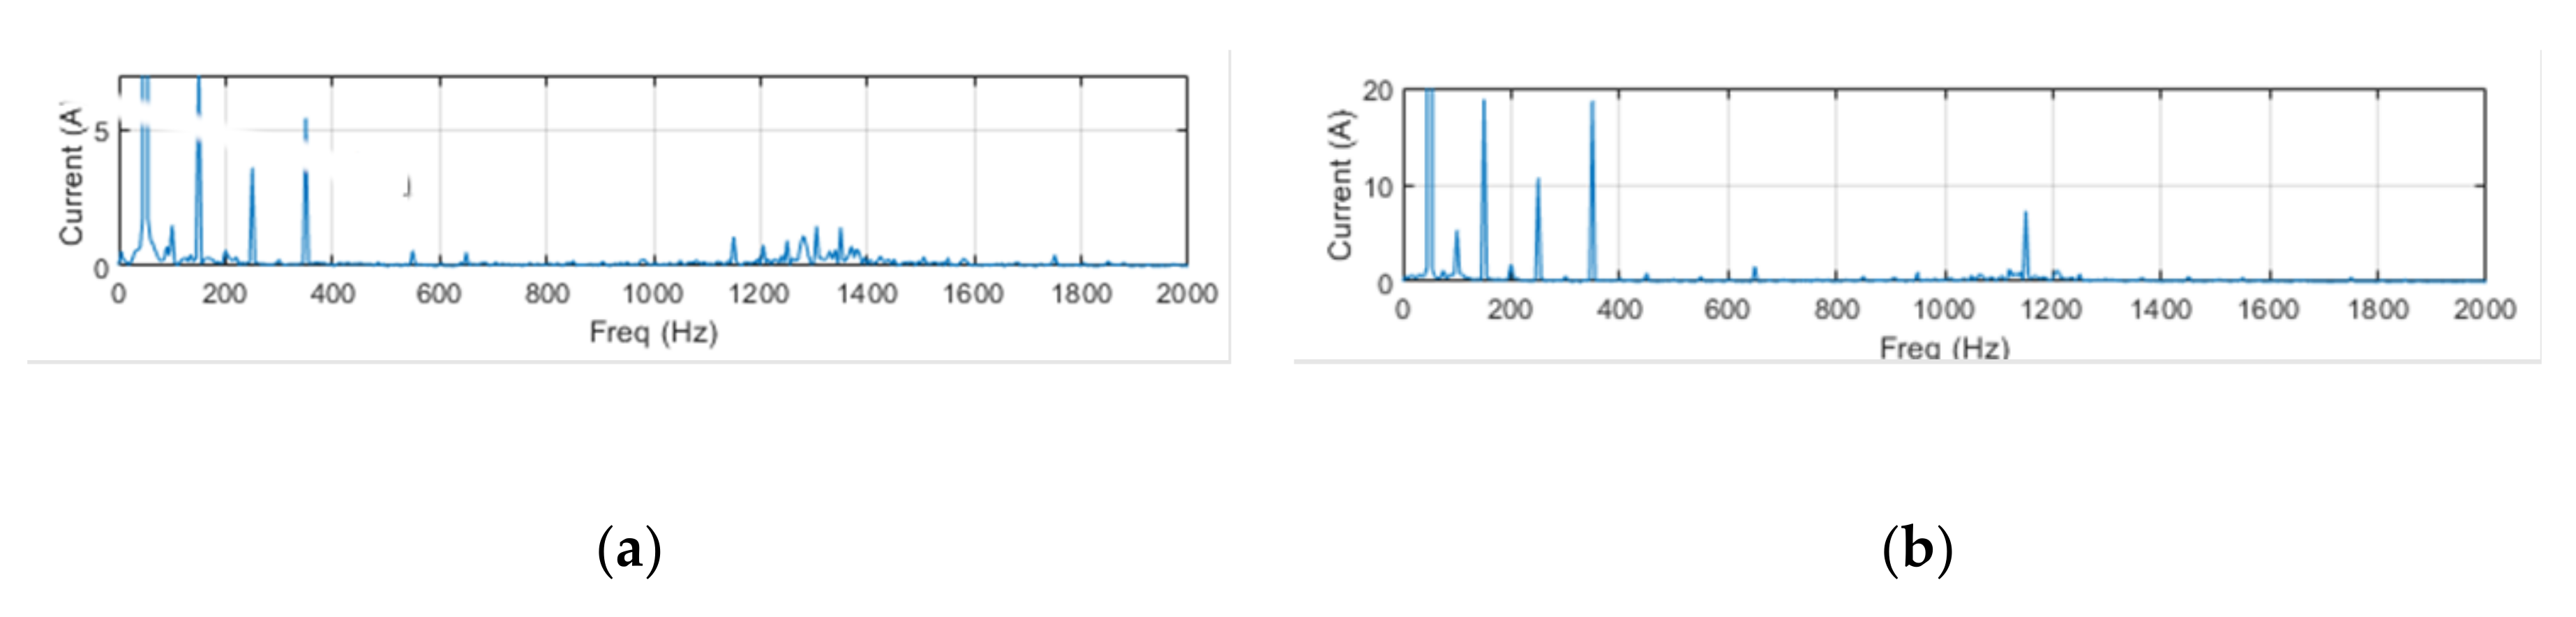
4.2. Current Harmonics according to IEEE 519
5. Use Case 2
5.1. Objectives
5.2. Measuring Setup/Methodology
- 10 × 300 kW × 300 kW “fast” chargers (opportunity charging);
- 22 × 50 kW “slow” chargers (Depot Charger).
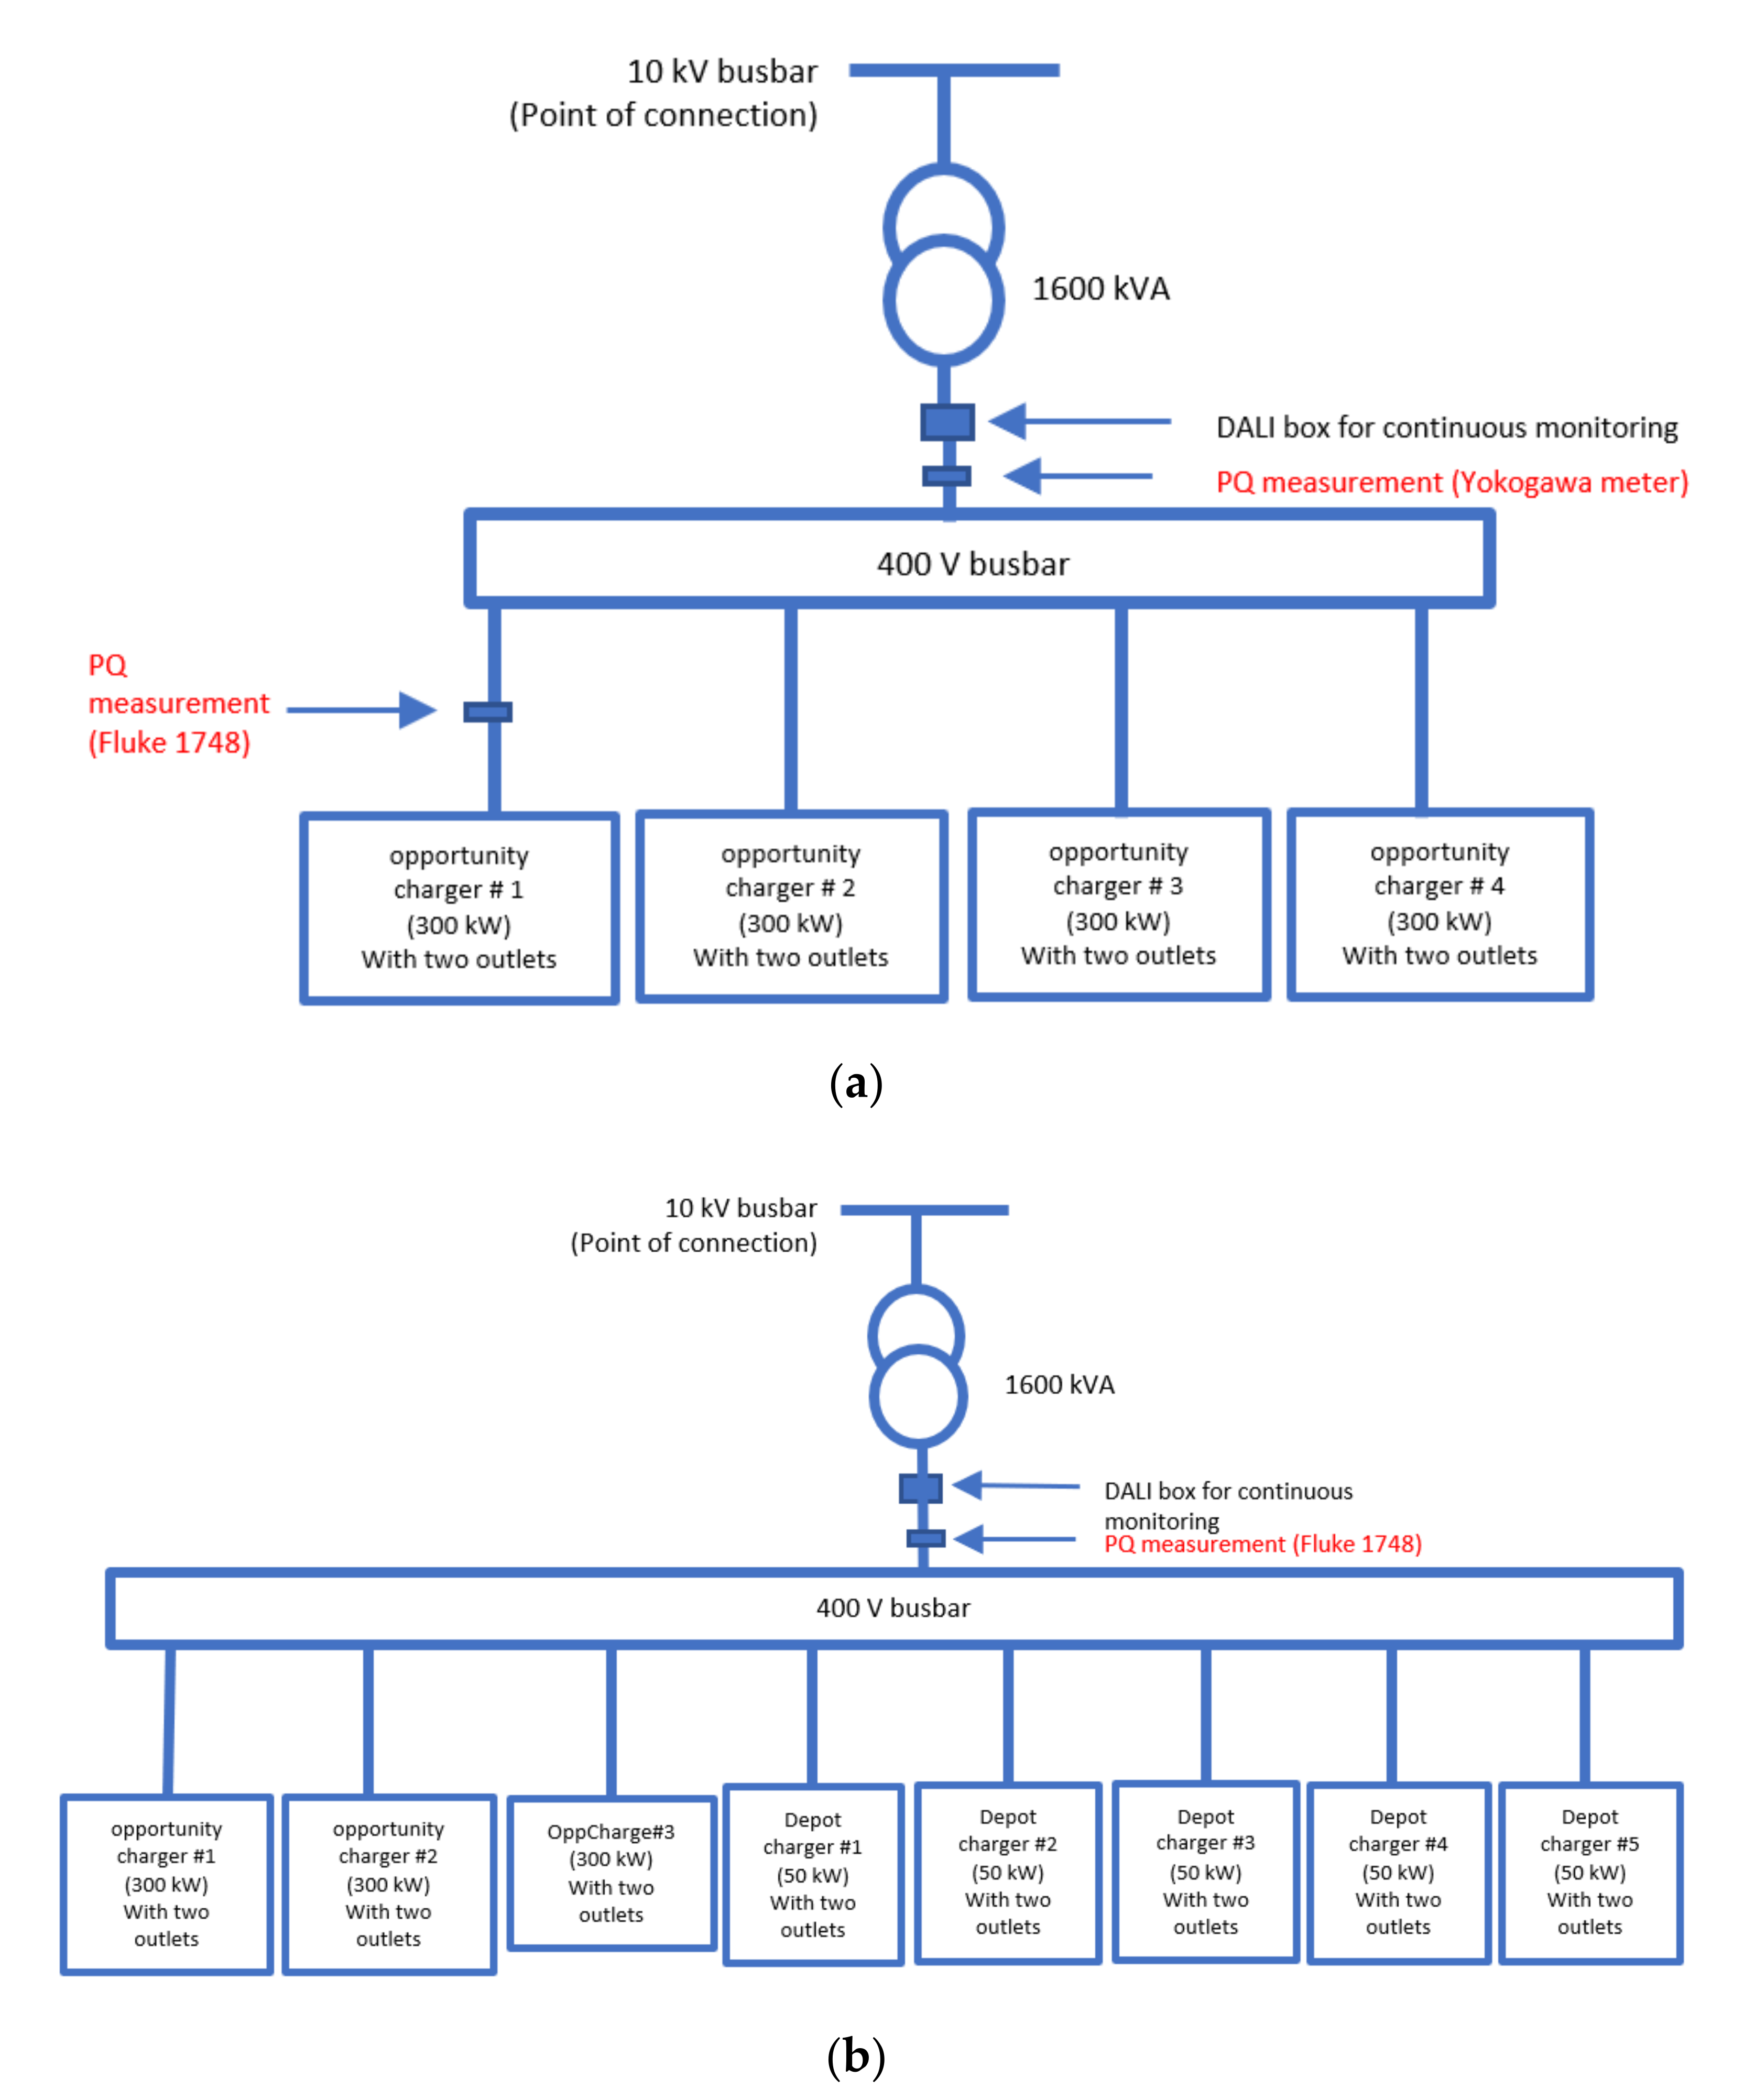
- The transformer #1 of the bus depot supplies to four opportunity charging chargers, each of 300 kW, as shown in Figure 5a;
- The second and third transformers supplies power to both fast (300 kW) and slow (50 kW) chargers and have almost identical configurations;
- The second transformer (#2) feeds three fast-charging points and five slow-charging points (also known as depot chargers), as shown in Figure 5b.
- Similarly, the third transformer (#3) is connected to three fast-charging points and six slow-charging points.
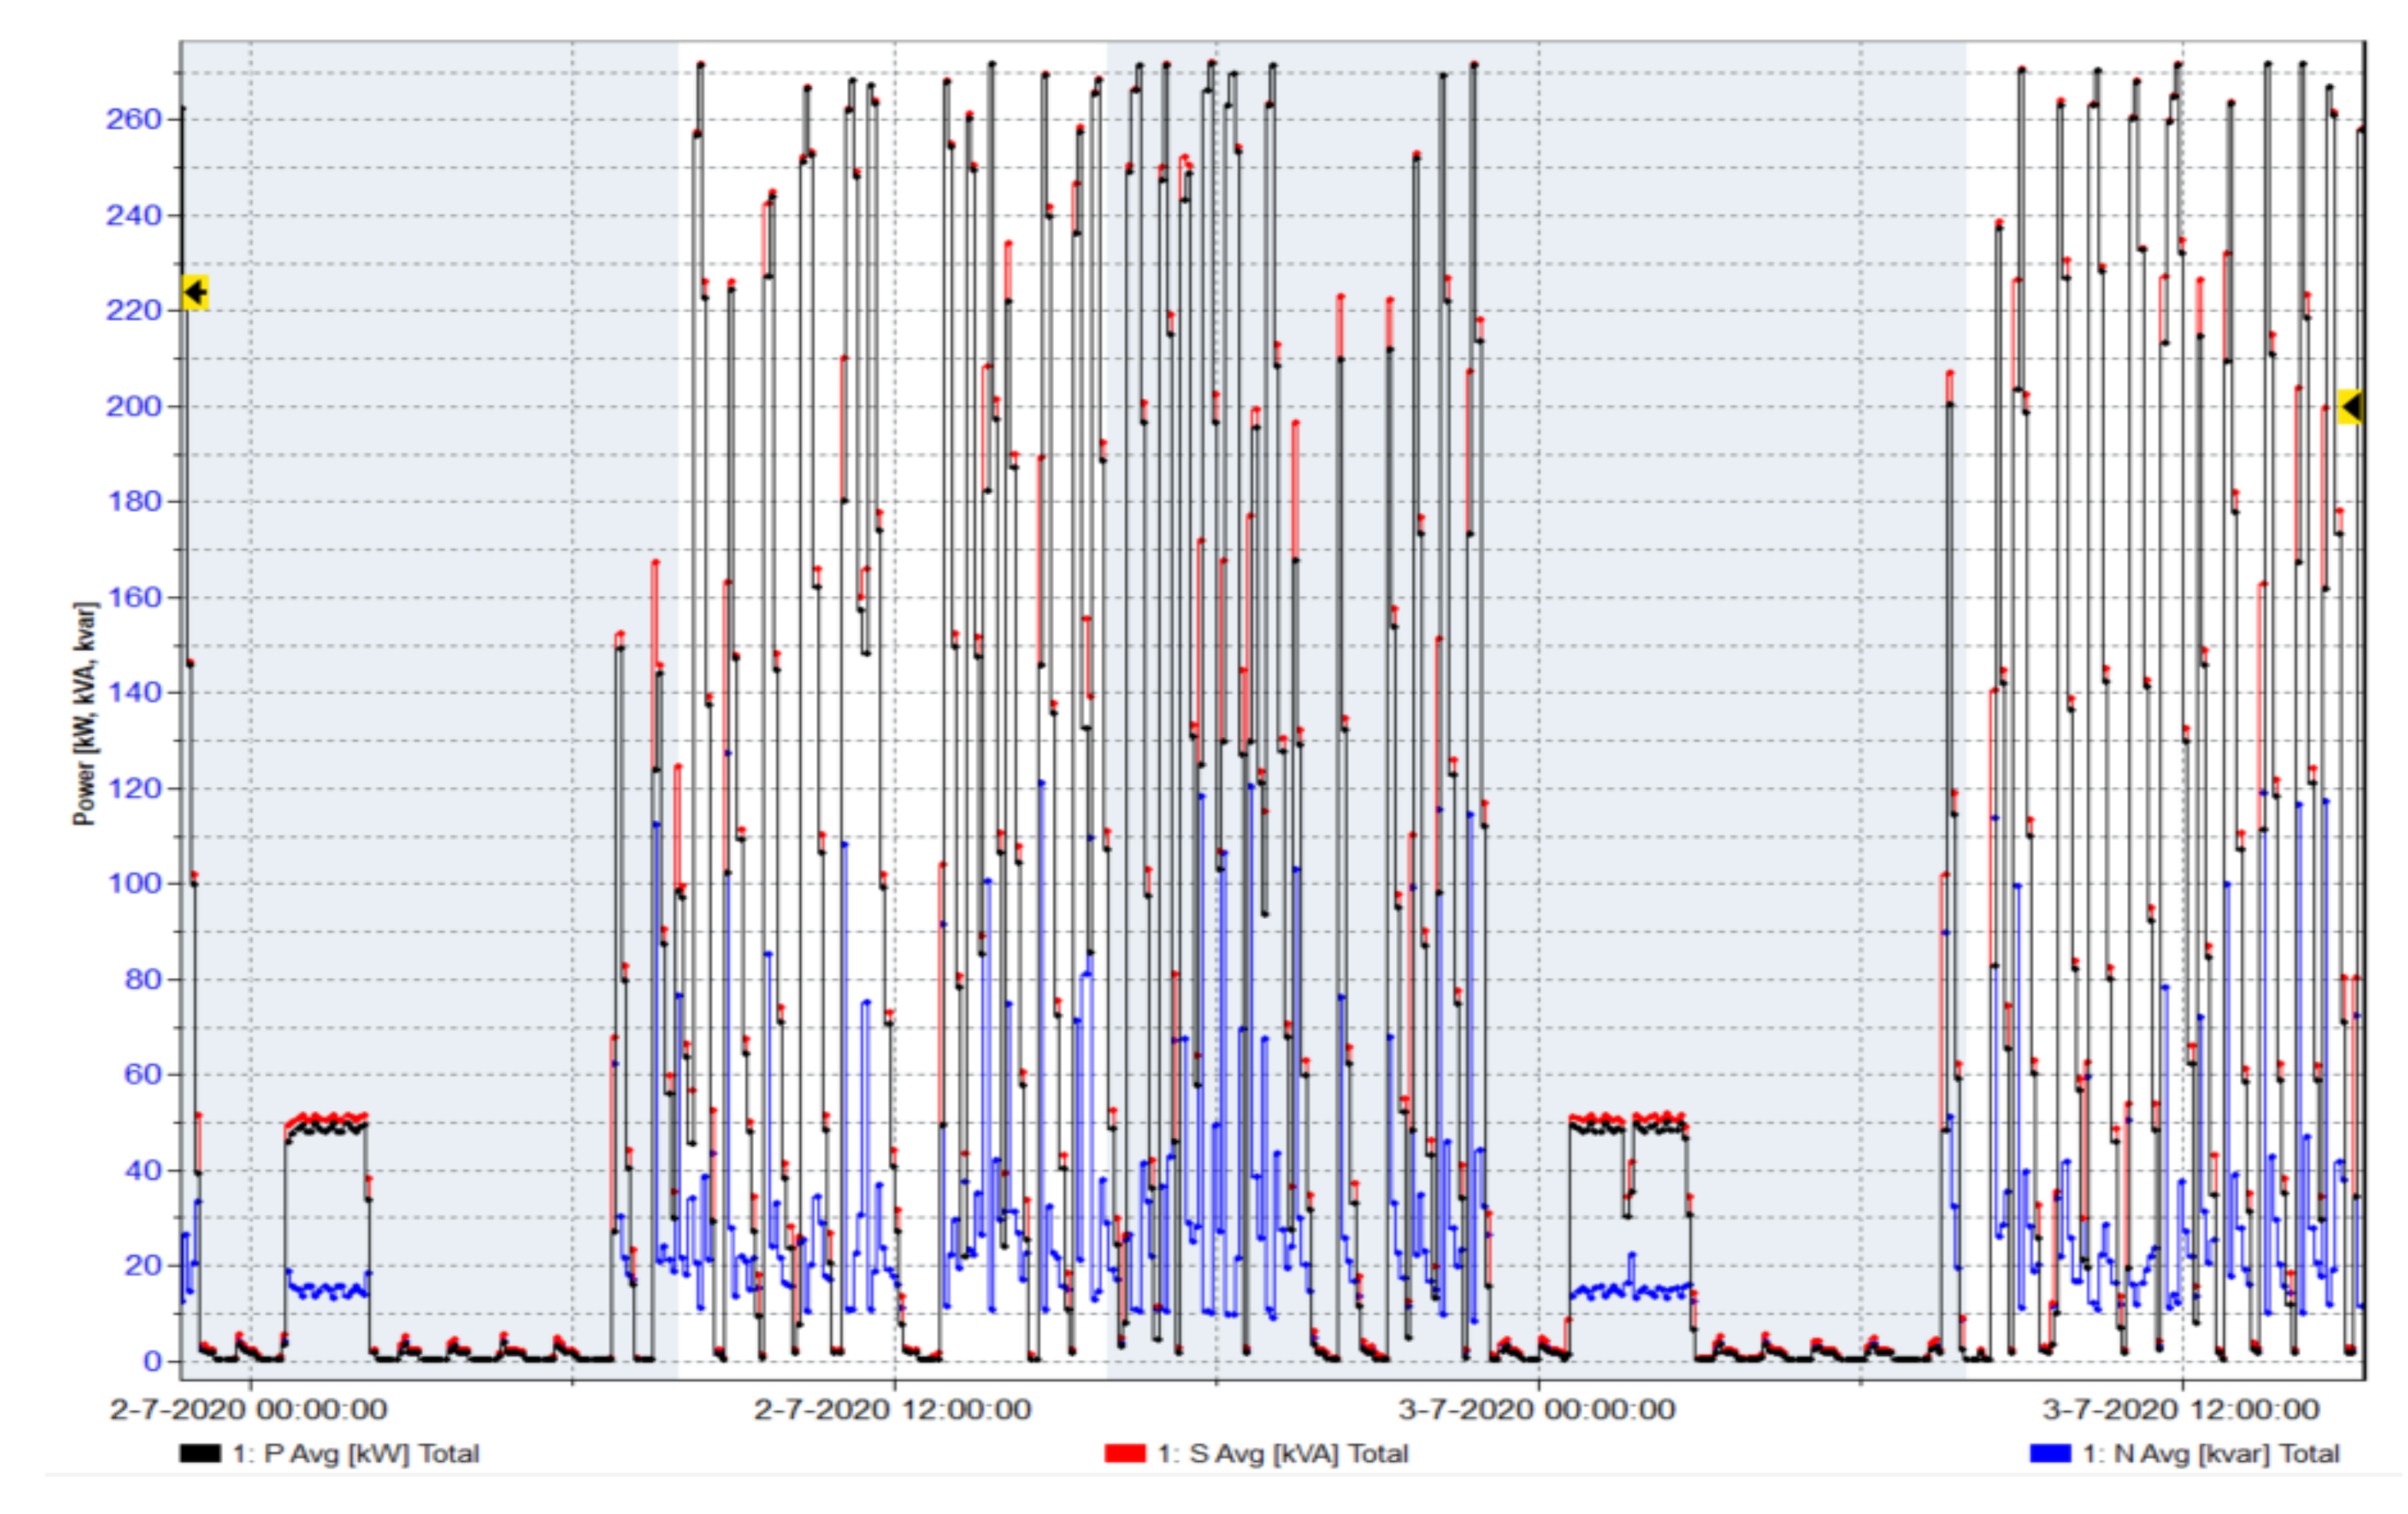
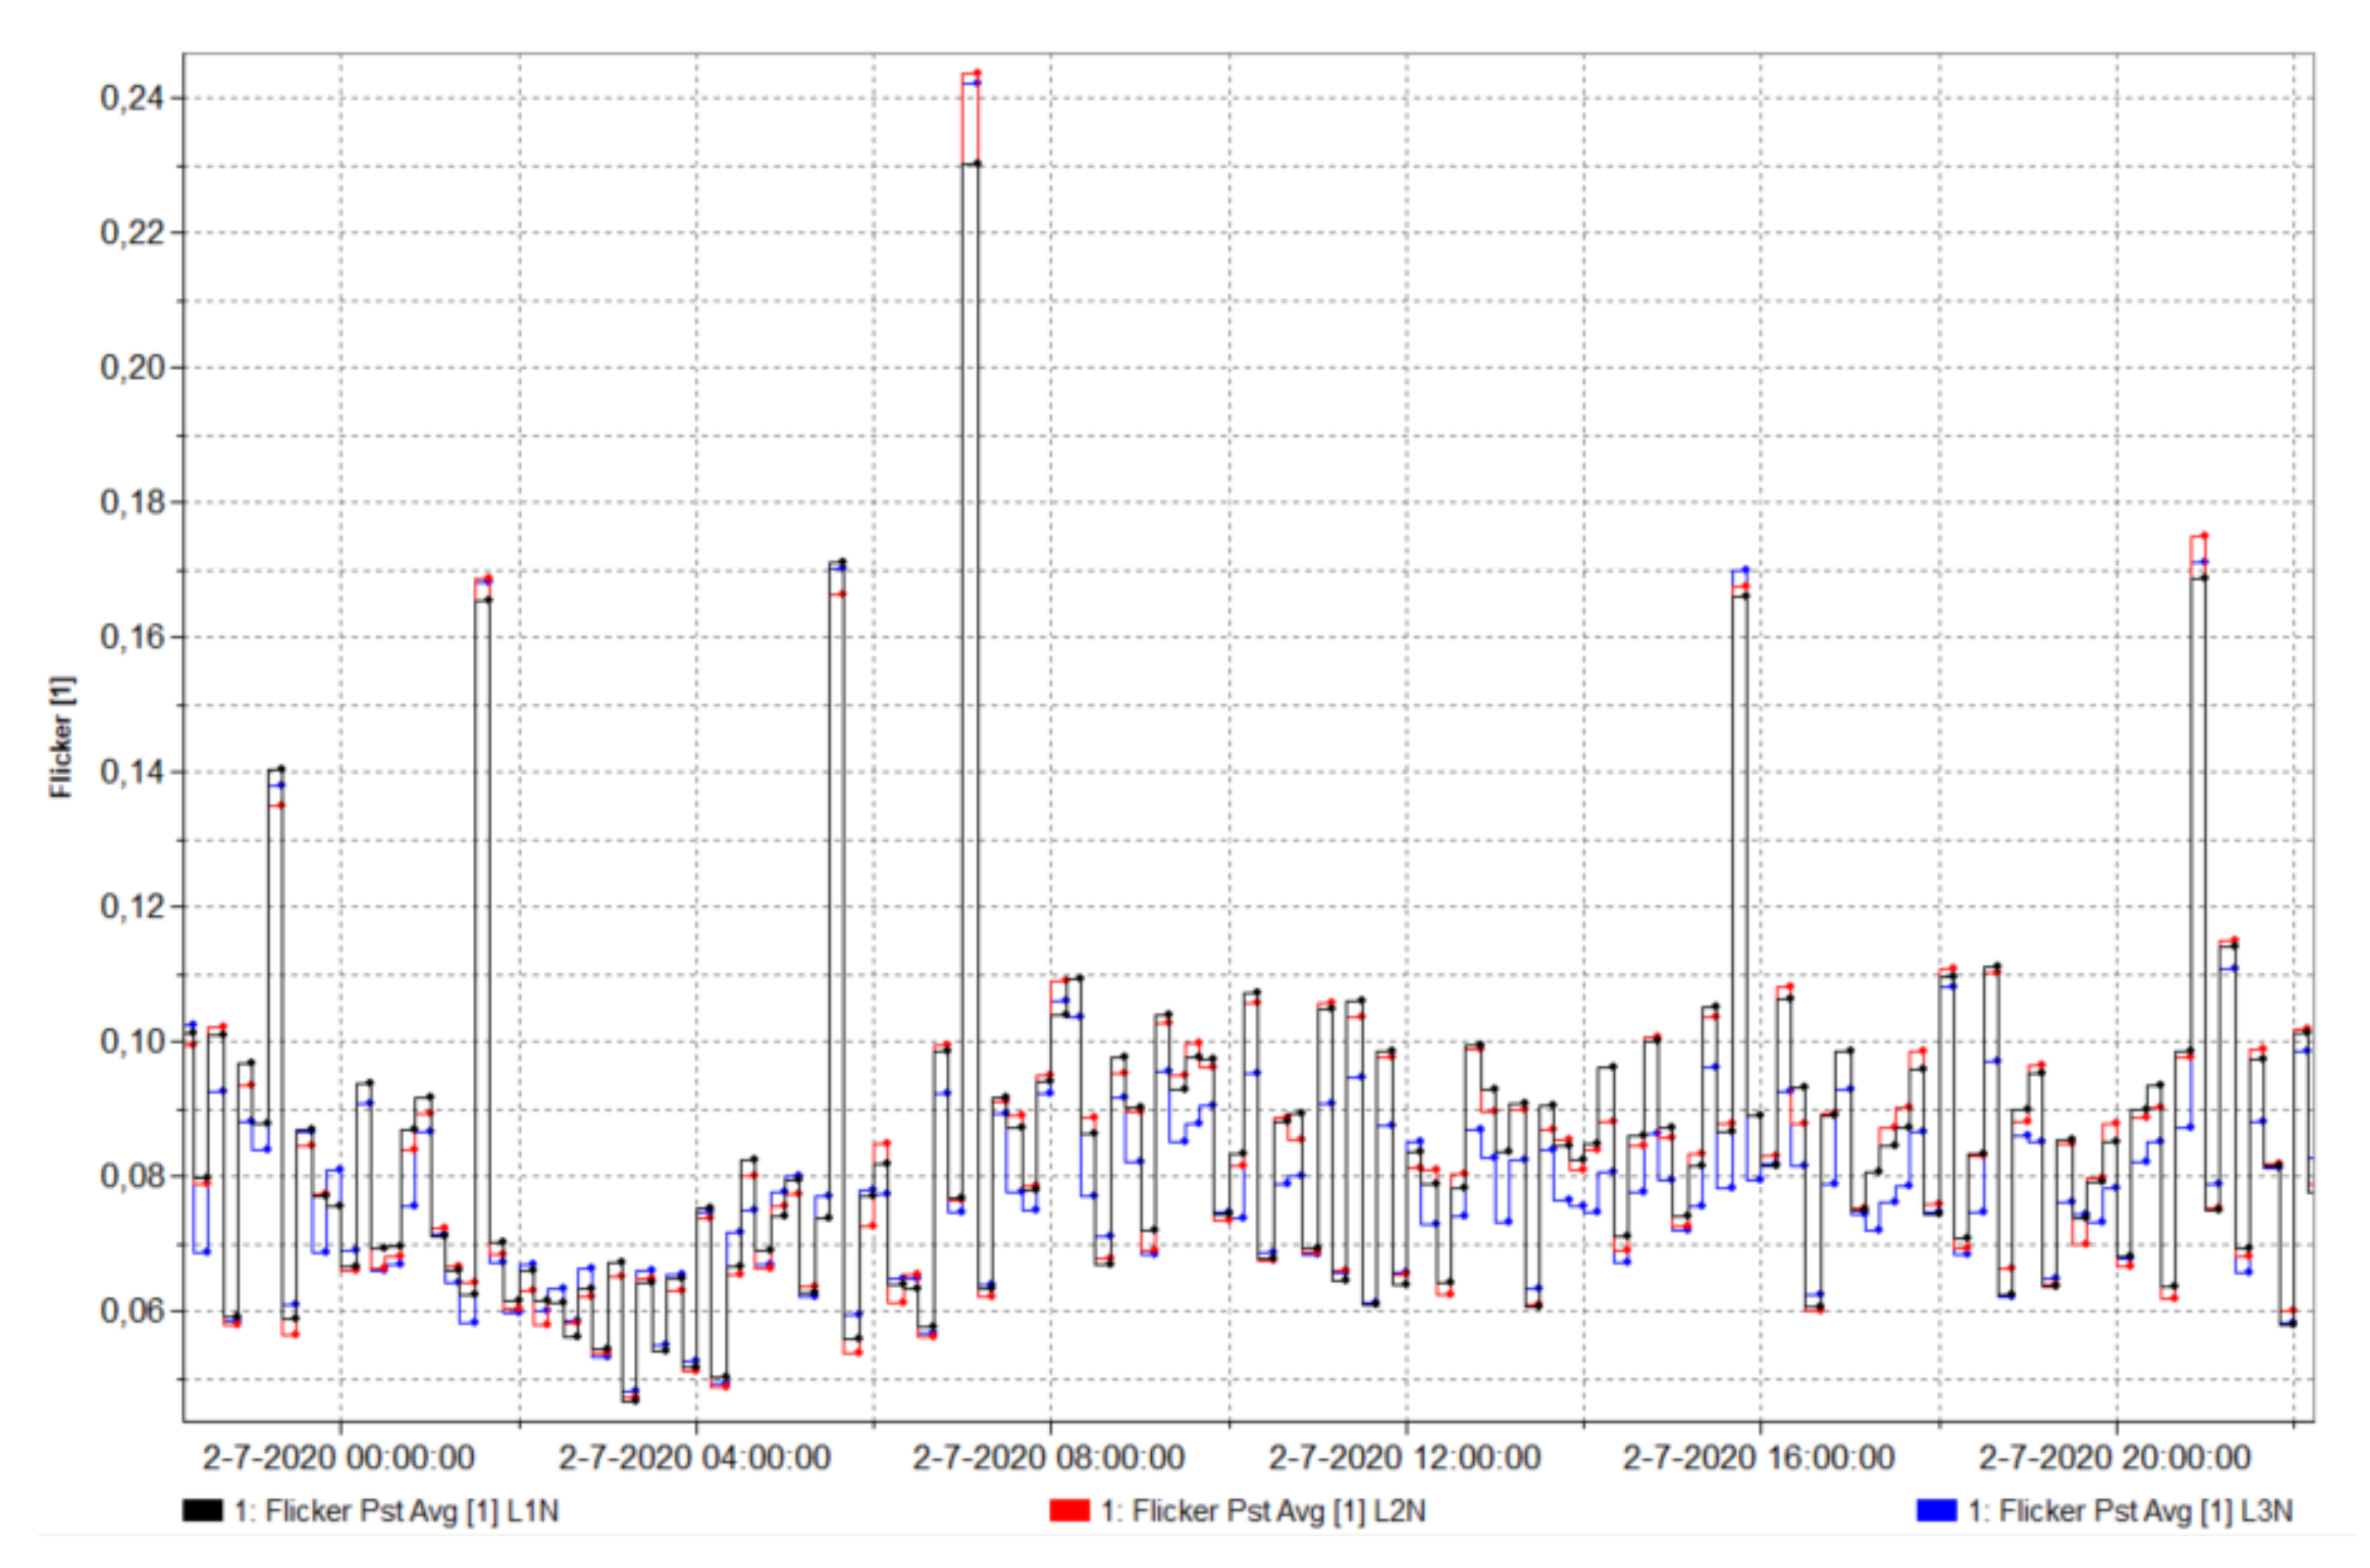
5.3. Results
6. Conclusions
- Pantograph;
- Slow-charging based on CCS2.
Author Contributions
Funding
Institutional Review Board Statement
Informed Consent Statement
Data Availability Statement
Acknowledgments
Conflicts of Interest
References
- Jesús, V.S. Deliverable 2.2. Specification of Grid Constraints. 2018. Available online: https://assured-project.eu/storage/files/assuredd-22-specification-of-grid-constraints-final_1.pdf (accessed on 10 December 2021).
- Longo, M.; Leone, C.; Lorenz, L.; Strada, A.; Yaici, W. Electrification of a Bus Line in Savona Considering Depot and Opportunity Charging. Adv. Sci. Technol. Eng. Syst. J. 2021, 6, 213–221. [Google Scholar] [CrossRef]
- Bayliss, C.R.; Bayliss, C.; Hardy, B. Transmission and Distribution Electrical Engineering; Elsevier: Amsterdam, The Netherlands, 2012. [Google Scholar]
- Lopez de Briñas Gorosabel, O. Assessing the Construction of Charging Stations for Electric Buses: A Case Study for Stockholm Inner City. 2017. Available online: https://www.diva-portal.org/smash/get/diva2:1158086/FULLTEXT01.pdf (accessed on 10 December 2021).
- Standard, B. “Voltage Characteristics of Electricity Supplied by Public Distribution Networks” BS EN. 2007. Available online: http://fs.gongkong.com/files/technicalData/201110/2011100922385600001.pdf (accessed on 10 December 2021).
- Slangen, T.; Bhattacharyya, S. Determining the impacts of fast-charging of electric buses on the power quality based on field measurements. In Proceedings of the CIRED 2021-The 26th International Conference and Exhibition on Electricity Distribution, Online Conference, 20–23 September 2021; pp. 20–23. [Google Scholar]
- Rogge, M.; Wollny, S.; Sauer, D.U. Fast charging battery buses for the electrification of urban public transport—A feasibility study focusing on charging infrastructure and energy storage requirements. Energies 2015, 8, 4587–4606. [Google Scholar] [CrossRef] [Green Version]
- de Filippo, G.; Marano, V.; Sioshansi, R. Simulation of an electric transportation system at The Ohio State University. Appl. Energy 2014, 113, 1686–1691. [Google Scholar] [CrossRef]
- Hussain, S.; Lee, K.-B.; Ahmed, M.A.; Hayes, B.; Kim, Y.-C. Two-stage fuzzy logic inference algorithm for maximizing the quality of performance under the operational constraints of power grid in electric vehicle parking lots. Energies 2020, 13, 4634. [Google Scholar] [CrossRef]
- Clairand, J.M.; Gonzalez-Roriguez, M.; Teran, P.G.; Cedenno, I.; Escriva-Escriva, G. The impact of charging electric buses on the power grid. In Proceedings of the 2020 IEEE Power & Energy Society General Meeting (PESGM), Montreal, QC, Canada, 2–6 August 2020. [Google Scholar] [CrossRef]
- Zagrajek, K.; Paska, J.; Kłos, M.; Pawlak, K.; Marchel, P.; Bartecka, M.; Michalski, Ł.; Terlikowski, P. Impact of electric bus charging on distribution substation and local grid in Warsaw. Energies 2020, 13, 1210. [Google Scholar] [CrossRef] [Green Version]
- Hussain, S.; Ahmed, M.A.; Kim, Y.-C. Efficient power management algorithm based on fuzzy logic inference for electric vehicles parking lot. IEEE Access 2019, 7, 65467–65485. [Google Scholar] [CrossRef]
- Mohamed, M.; Farag, H.; El-Taweel, N.; Ferguson, M. Simulation of electric buses on a full transit network: Operational feasibility and grid impact analysis. Electr. Power Syst. Res. 2017, 142, 163–175. [Google Scholar] [CrossRef]
- Andersson, M. Energy Storage Solutions for Electric Bus Fast Charging Stations: Cost Optimization of Grid Connection and Grid Reinforcements. Master’s Thesis, Uppsala University, Uppsala, Sweden, 2017. [Google Scholar]
- Fast and Smart Charging Solutions for Full Size Urban Heavy Duty Applications, ASSURED. Available online: https://assured-project.eu/ (accessed on 10 December 2021).


| Model | Measurements | Origin/Location |
|---|---|---|
| Power Quality Analyzer ALPTEC 3000 DIN | Input voltages | Point of Connection |
| Scope recorder YOKOGAWA DL850 + Rogoski coils | Input voltages and currents | Point of Connection |
| Charger 1 | |||||||||||
| From | To | Characteristics | Availability | Compliancy | CP 95(V) | ||||||
| P1 | P2 | P3 | P1 | P2 | P3 | P1 | P2 | P3 | |||
| 4/21/2021 10:10 | 4/28/2021 10:10 | Plt | 100 | 100 | 100 | y | y | y | 0.561 | 0.583 | 0.541 |
| 4/21/2021 10:10 | 4/28/2021 10:10 | THD (%) | 100 | 100 | 100 | y | y | y | 3.003 | 3.368 | 3.225 |
| 4/21/2021 10:10 | 4/28/2021 10:10 | H3 (%) | 100 | 100 | 100 | y | y | y | 0.205 | 0.16 | 0.238 |
| 4/21/2021 10:10 | 4/28/2021 10:10 | H5 (%) | 100 | 100 | 100 | y | y | y | 1.916 | 2.215 | 2.365 |
| 4/21/2021 10:10 | 4/28/2021 10:10 | H7 (%) | 100 | 100 | 100 | y | y | y | 2.253 | 2.436 | 2.09 |
| 4/21/2021 10:10 | 4/28/2021 10:10 | H9 (%) | 100 | 100 | 100 | y | y | y | 0.069 | 0.103 | 0.114 |
| 4/21/2021 10:10 | 4/28/2021 10:10 | H11 (%) | 100 | 100 | 100 | y | y | y | 0.698 | 1.008 | 0.781 |
| 4/21/2021 10:10 | 4/28/2021 10:10 | H13 (%) | 100 | 100 | 100 | y | y | y | 0.396 | 0.481 | 0.45 |
| 4/21/2021 10:10 | 4/28/2021 10:10 | H15 (%) | 100 | 100 | 100 | y | y | y | 0.054 | 0.057 | 0.038 |
| 4/21/2021 10:10 | 4/28/2021 10:10 | H17 (%) | 100 | 100 | 100 | y | y | y | 0.209 | 0.263 | 0.294 |
| 4/21/2021 10:10 | 4/28/2021 10:10 | H19 (%) | 100 | 100 | 100 | y | y | y | 0.215 | 0.274 | 0.226 |
| 4/21/2021 10:10 | 4/28/2021 10:10 | H21 (%) | 100 | 100 | 100 | y | y | y | 0.055 | 0.091 | 0.069 |
| 4/21/2021 10:10 | 4/28/2021 10:10 | H23 (%) | 100 | 100 | 100 | y | y | y | 0.655 | 0.959 | 0.615 |
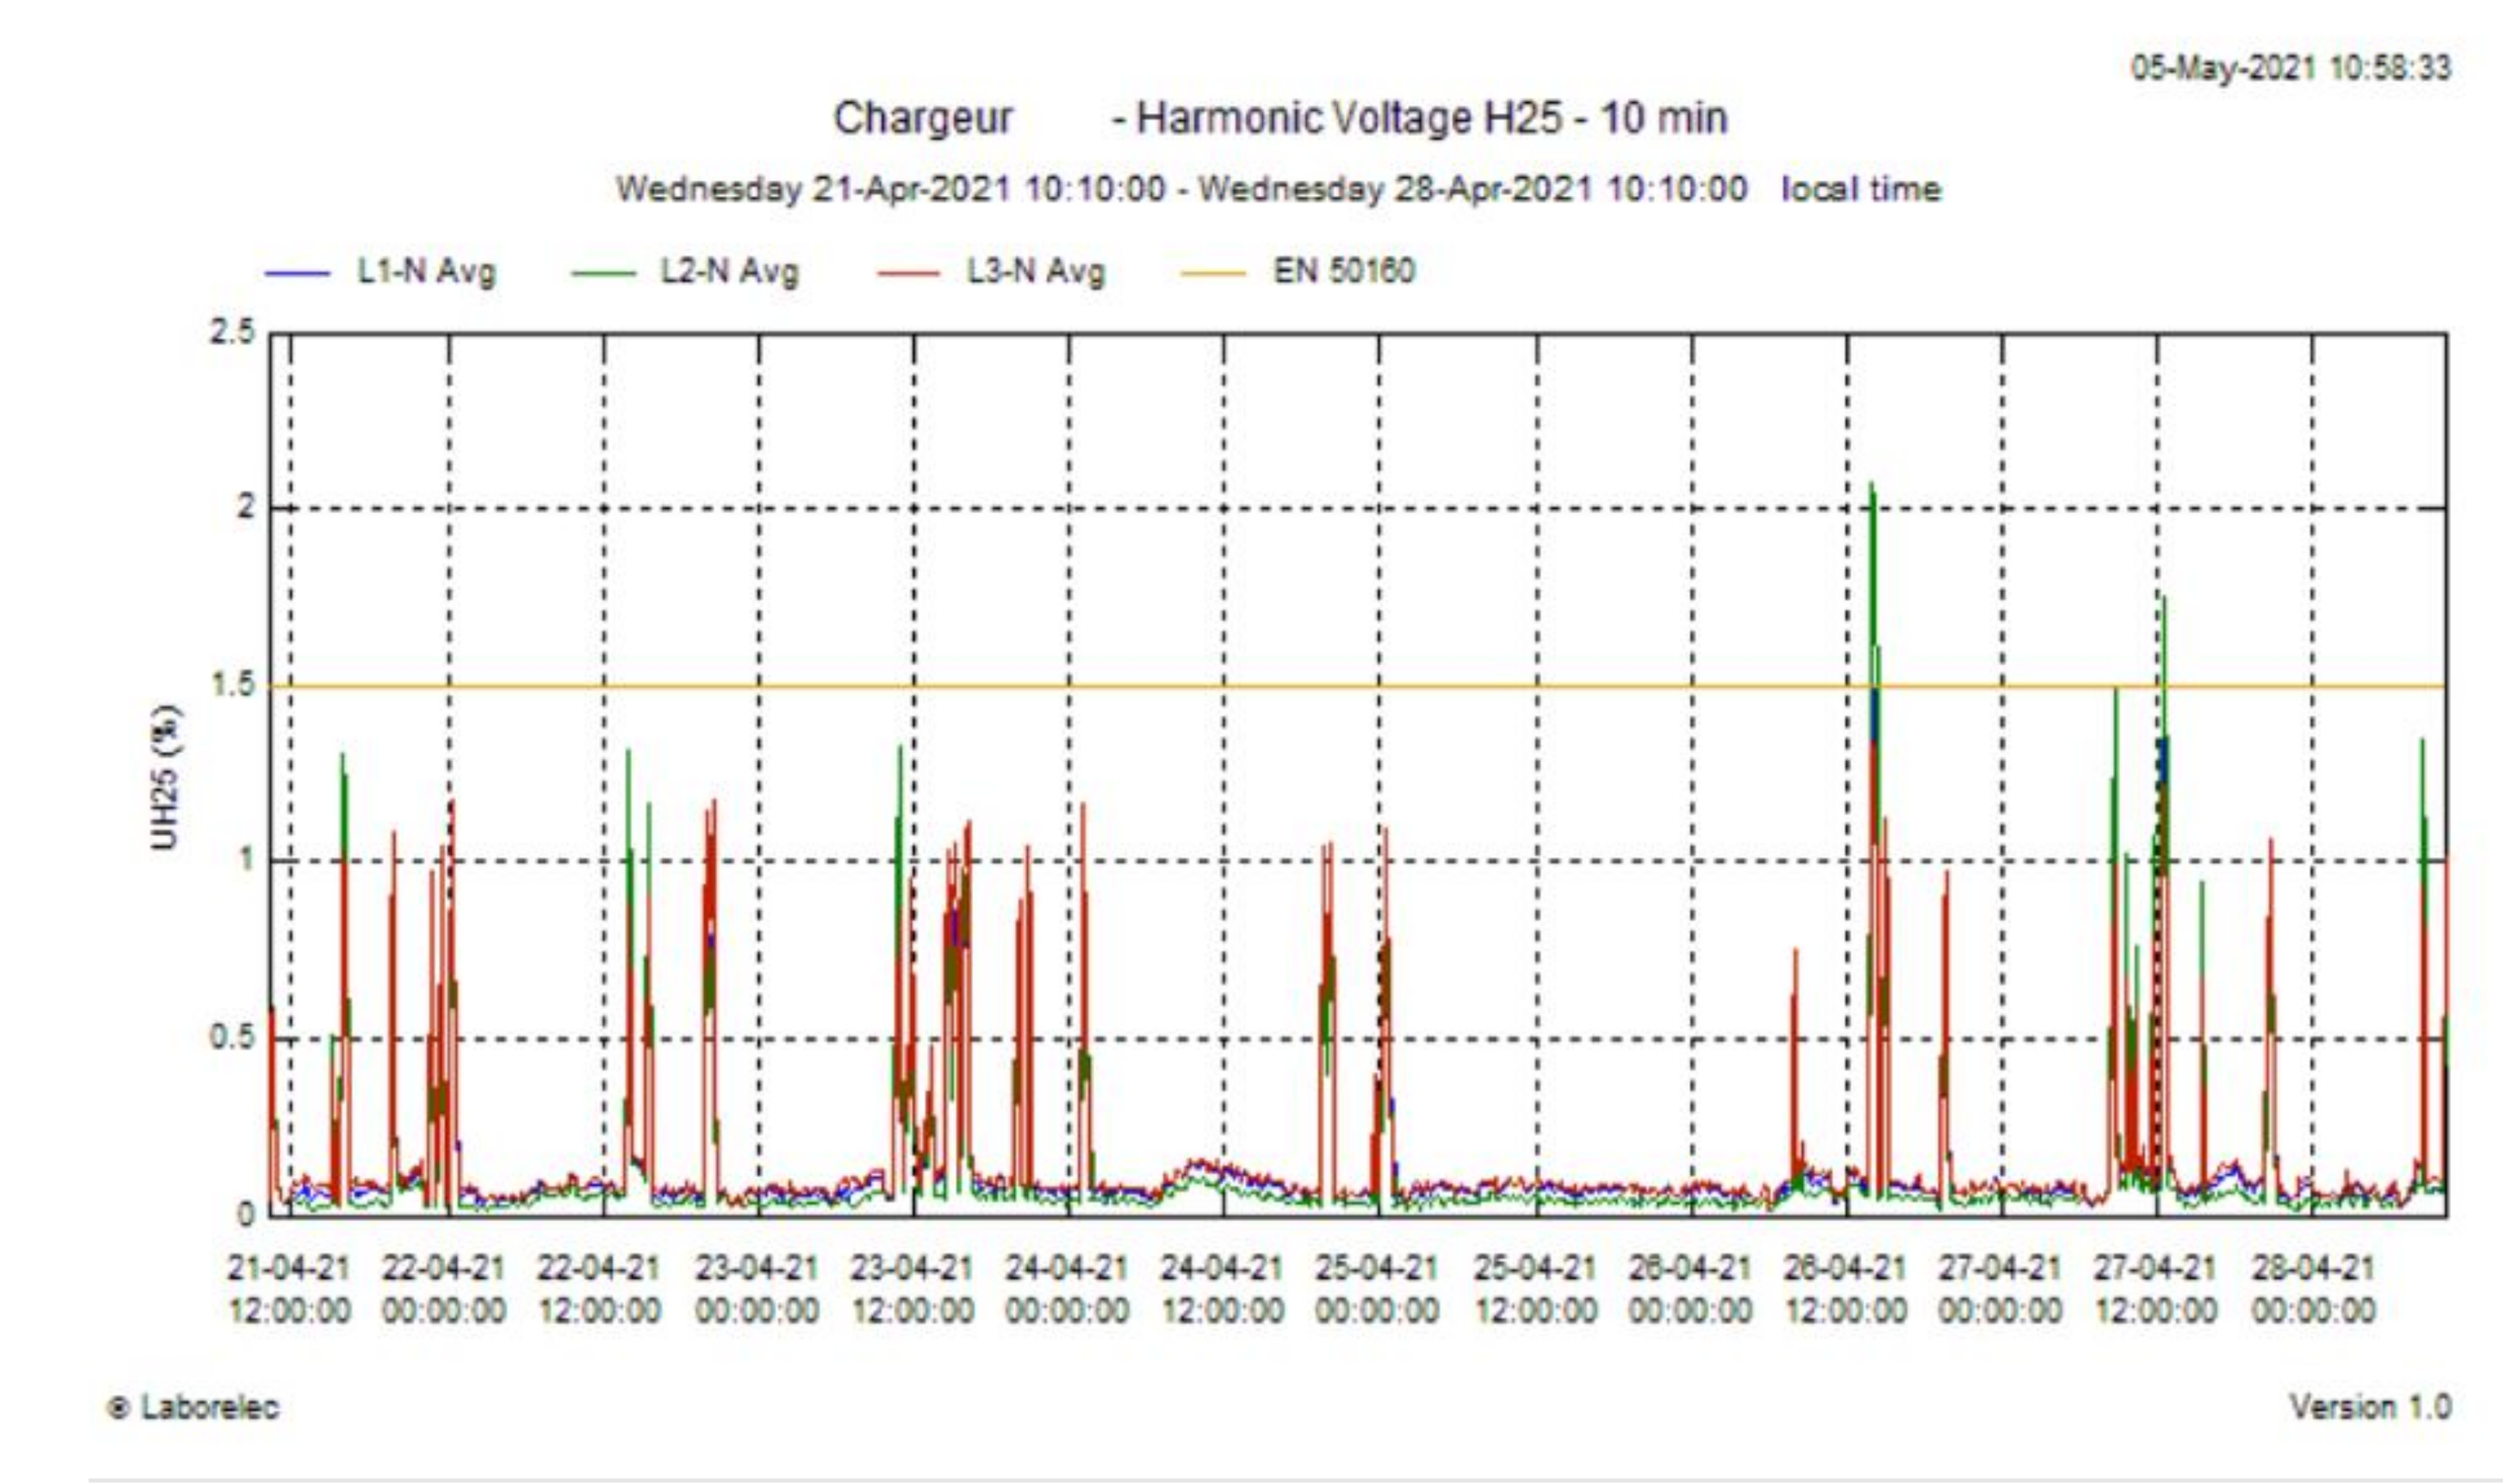
| 4/21/2021 10:10 | 4/28/2021 10:10 | H25 (%) | 100 | 100 | 100 | y | y | y | 0.646 | 0.627 | 0.712 |
| Charger 2 | |||||||||||
| From | To | Characteristics | Availability | Compliancy | CP 95(V) | ||||||
| P1 | P2 | P3 | P1 | P2 | P3 | P1 | P2 | P3 | |||
| 4/21/2021 10:10 | 4/28/2021 10:10 | Plt | 90.5 | 90.5 | 90.5 | y | y | y | 0.548 | 0.564 | 0.537 |
| 4/21/2021 10:10 | 4/28/2021 10:10 | THD (%) | 93.5 | 93.5 | 93.5 | y | y | y | 2.642 | 2.588 | 2.508 |
| 4/21/2021 10:10 | 4/28/2021 10:10 | H3 (%) | 93.5 | 93.5 | 93.5 | y | y | y | 0.073 | 0.141 | 0.129 |
| 4/21/2021 10:10 | 4/28/2021 10:10 | H5 (%) | 93.5 | 93.5 | 93.5 | y | y | y | 1.705 | 1.762 | 1.561 |
| 4/21/2021 10:10 | 4/28/2021 10:10 | H7 (%) | 93.5 | 93.5 | 93.5 | y | y | y | 1.963 | 1.825 | 1.944 |
| 4/21/2021 10:10 | 4/28/2021 10:10 | H9 (%) | 93.5 | 93.5 | 93.5 | y | y | y | 0.061 | 0.080 | 0.056 |
| 4/21/2021 10:10 | 4/28/2021 10:10 | H11 (%) | 93.5 | 93.5 | 93.5 | y | y | y | 0.715 | 0.735 | 0.682 |
| 4/21/2021 10:10 | 4/28/2021 10:10 | H13 (%) | 93.5 | 93.5 | 93.5 | y | y | y | 0.236 | 0.210 | 0.242 |
| 4/21/2021 10:10 | 4/28/2021 10:10 | H15 (%) | 93.5 | 93.5 | 93.5 | y | y | y | 0.018 | 0.016 | 0.022 |
| 4/21/2021 10:10 | 4/28/2021 10:10 | H17 (%) | 93.5 | 93.5 | 93.5 | y | y | y | 0.104 | 0.104 | 0.103 |
| 4/21/2021 10:10 | 4/28/2021 10:10 | H19 (%) | 93.5 | 93.5 | 93.5 | y | y | y | 0.048 | 0.043 | 0.049 |
| 4/21/2021 10:10 | 4/28/2021 10:10 | H21 (%) | 93.5 | 93.5 | 93.5 | y | y | y | 0.009 | 0.008 | 0.007 |
| 4/21/2021 10:10 | 4/28/2021 10:10 | H23 (%) | 93.5 | 93.5 | 93.5 | y | y | y | 0.025 | 0.023 | 0.022 |
| 4/21/2021 10:10 | 4/28/2021 10:10 | H25 (%) | 93.5 | 93.5 | 93.5 | y | y | y | 0.023 | 0.024 | 0.026 |
| Harmonics | IEEE 519 Limits Distortion Currents (%) | Charger 1 (300 kW) | Charger 2 (350 kW) | ||||||
|---|---|---|---|---|---|---|---|---|---|
| IEEE 519 Limits Distortion Current (A) | MIN | AVE | MAX | IEEE 519 Limits Distortion Current (A) | MIN | AVE | MAX | ||
| H1 | 0 | 0 | 107.14 | 217.09 | 221.76 | 0 | 39.51 | 303.12 | 473.46 |
| H2 | 1 | 4.33 | 0.12 | 0.65 | 2.70 | 5.05 | 0.15 | 0.61 | 1.67 |
| H3 | 4 | 17.32 | 2.71 | 7.64 | 9.77 | 20.21 | 0.21 | 1.16 | 3.09 |
| H4 | 1 | 4.33 | 0.11 | 0.51 | 1.24 | 5.05 | 0.11 | 0.54 | 1.34 |
| H5 | 4 | 17.32 | 6.45 | 7.82 | 9.47 | 20.21 | 7.70 | 9.39 | 10.82 |
| H6 | 1 | 4.33 | 0.12 | 0.49 | 1.22 | 5.05 | 0.13 | 0.50 | 1.26 |
| H7 | 4 | 17.32 | 10.83 | 12.29 | 13.80 | 20.21 | 4.68 | 6.03 | 7.14 |
| H8 | 1 | 4.33 | 0.12 | 0.49 | 1.33 | 5.05 | 0.11 | 0.47 | 1.17 |
| H9 | 4 | 17.32 | 1.08 | 1.93 | 2.96 | 20.21 | 0.11 | 0.49 | 1.17 |
| H10 | 1 | 4.33 | 0.10 | 0.47 | 1.18 | 5.05 | 0.09 | 0.48 | 1.13 |
| H11 | 2 | 8.66 | 4.76 | 6.55 | 8.36 | 10.10 | 0.19 | 0.80 | 1.56 |
| H12 | 0.5 | 2.17 | 0.10 | 0.45 | 1.10 | 2.53 | 0.11 | 0.49 | 1.18 |
| H13 | 2 | 8.66 | 1.57 | 2.69 | 3.83 | 10.10 | 0.14 | 0.53 | 1.36 |
| H14 | 0.5 | 2.17 | 0.08 | 0.46 | 1.16 | 2.53 | 0.11 | 0.47 | 1.12 |
| H15 | 2 | 8.66 | 0.17 | 0.80 | 1.67 | 10.10 | 0.11 | 0.48 | 1.26 |
| H16 | 0.5 | 2.17 | 0.11 | 0.45 | 1.04 | 2.53 | 0.15 | 0.64 | 1.41 |
| H17 | 1.5 | 6.5 | 0.58 | 1.49 | 2.55 | 7.58 | 0.13 | 0.57 | 1.32 |
| H18 | 0.375 | 1.62 | 0.09 | 0.45 | 1.03 | 1.89 | 0.17 | 0.70 | 1.57 |
| H19 | 1.5 | 6.5 | 0.25 | 0.98 | 1.97 | 7.58 | 0.14 | 0.59 | 1.39 |
| H20 | 0.375 | 1.62 | 0.13 | 0.45 | 1.16 | 1.89 | 0.12 | 0.47 | 1.14 |
| H21 | 1.5 | 6.5 | 0.11 | 0.51 | 1.28 | 7.58 | 0.12 | 0.49 | 1.18 |
| H22 | 0.375 | 1.62 | 0.10 | 0.45 | 1.12 | 1.89 | 0.11 | 0.49 | 1.13 |
| H23 | 0.6 | 2.60 | 1.09 | 2.05 | 3.11 | 0.03 | 0.10 | 0.56 | 1.58 |
| H24 | 1.5 | 0.65 | 0.09 | 0.45 | 1.15 | 0.76 | 0.11 | 0.63 | 1.45 |
| H25 | 0.6 | 2.60 | 1.06 | 2.56 | 4.02 | 3.03 | 0.15 | 0.80 | 2.09 |
| Model | Measurements | Origin/Location |
|---|---|---|
| Power Quality Analyzer- Fluke 1748 | Input voltages | (1) Fast-charger terminal (2) At the low voltage side of transformer #2 |
| Scope recorder YOKOGAWA DL850 + Rogoski coils | Input voltages and currents | At the low voltage side of transformer |
| DALI measuring boxes | Input voltages and currents | At the low voltage side of transformer #1, #2 and #3 |
| PQ Parameter | EN50160 Standard Limit Value | Value Found in the PQ Measurement |
|---|---|---|
| Long-term flicker severity indicator (Plt) | 1 | 0.12 |
| Rapid voltage changes | 3% | << 3% |
| Voltage unbalance | 2% | 0.46% |
| Voltage variations (high) | +10% (both for 95 and 100% values) | 0.97% (95% value); 2.51% (100% value) |
| Voltage variations (low) | −10% (for 95%); −15% (for 100%) | −1.86% (95% value); −2.18% (100% value) |
| Total harmonic distortion of voltage (THDv) | 8% | 2.7% |
| Harmonic Order | Voltage Harmonics Compliance Test with EN 50160 Standard | Current Harmonics Compliance Test with IEEE 519 Standard | ||
|---|---|---|---|---|
| Standard Limit (95%) (Nominal Voltage 230 V) | Maximum Value Measured in Volts | Standard Limit(Based on Charger’s Nominal Current) | Maximum Value Measured in Amps | |
| 3rd | 11.5 V (5%) | 0.75 V | 20.2 A (4%) | 7.8 A |
| 5th | 13.8 V (6%) | 5.3 V | 20.2 A (4%) | 4.1 A |
| 7th | 11.5 V (5%) | 3.5 V | 20.2 A (4%) | 6.9A |
| 9th | 3.45 V (1.5%) | 0.4 V | 20.2 A (4%) | 0.6 A |
| 11th | 8.05 V (3.5%) | 0.7 V | 10.1 A (2%) | 0.8 A |
| 13th | 6.9 V (3%) | 0.9 V | 10.1 A (2%) | 0.6 A |
| 15th | 2.3 V (1%) | 0.1 V | 10.1 A (2%) | 0.2 A |
| 17th | 4.6 V (2%) | 0.4 V | 7.6 A (1.5%) | 0.3 A |
| 19th | 3.45 V (1.5%) | 0.3 V | 7.6 A (1.5%) | 0.3 A |
| 21st | 1.72 V (0.75%) | 1.2 V | 7.6 A (1.5%) | 0.9 A |
| 23rd | 3.45 V (1.5%) | 1.75 V | 3 A (0.6%) | 2.5 A |
| 25th | 3.45 V (1.5%) | 1.3 V | 3 A (0.6%) | 2.8 A |
| THD | 8% | 2.7% | - | 10% |
Publisher’s Note: MDPI stays neutral with regard to jurisdictional claims in published maps and institutional affiliations. |
© 2022 by the authors. Licensee MDPI, Basel, Switzerland. This article is an open access article distributed under the terms and conditions of the Creative Commons Attribution (CC BY) license (https://creativecommons.org/licenses/by/4.0/).
Share and Cite
Al-Saadi, M.; Bhattacharyya, S.; Tichelen, P.V.; Mathes, M.; Käsgen, J.; Van Mierlo, J.; Berecibar, M. Impact on the Power Grid Caused via Ultra-Fast Charging Technologies of the Electric Buses Fleet. Energies 2022, 15, 1424. https://doi.org/10.3390/en15041424
Al-Saadi M, Bhattacharyya S, Tichelen PV, Mathes M, Käsgen J, Van Mierlo J, Berecibar M. Impact on the Power Grid Caused via Ultra-Fast Charging Technologies of the Electric Buses Fleet. Energies. 2022; 15(4):1424. https://doi.org/10.3390/en15041424
Chicago/Turabian StyleAl-Saadi, Mohammed, Sharmistha Bhattacharyya, Pierre Van Tichelen, Manuel Mathes, Johannes Käsgen, Joeri Van Mierlo, and Maitane Berecibar. 2022. "Impact on the Power Grid Caused via Ultra-Fast Charging Technologies of the Electric Buses Fleet" Energies 15, no. 4: 1424. https://doi.org/10.3390/en15041424
APA StyleAl-Saadi, M., Bhattacharyya, S., Tichelen, P. V., Mathes, M., Käsgen, J., Van Mierlo, J., & Berecibar, M. (2022). Impact on the Power Grid Caused via Ultra-Fast Charging Technologies of the Electric Buses Fleet. Energies, 15(4), 1424. https://doi.org/10.3390/en15041424