Article

The Influence of Frequency Containment Reserve on the Operational Data and the State of Health of the Hybrid Stationary Large-Scale Storage System

by
Kevin Jacqué
1,2,3,*,
Lucas Koltermann
1,2,3,
Jan Figgener
1,2,3,
Sebastian Zurmühlen
1,2,3 and
Dirk Uwe Sauer
1,2,3,4
1
Institute for Power Electronics and Electrical Drives (ISEA), RWTH Aachen University, D-52066 Aachen, Germany
2
Institute for Power Generation and Storage Systems (PGS), E.ON ERC, RWTH Aachen University, D-52074 Aachen, Germany
3
Jülich Aachen Research Alliance, JARA-Energy, D-52425 Jülich, Germany
4
Forschungszentrum Jülich GmbH, Institute of Energy and Climate Research Helmholtz-Institute Münster, Ionics in Energy Storage (IEK-12), D-52425 Jülich, Germany
*
Author to whom correspondence should be addressed.
Energies 2022, 15(4), 1342; https://doi.org/10.3390/en15041342
Submission received: 14 December 2021 / Revised: 5 February 2022 / Accepted: 11 February 2022 / Published: 13 February 2022

Abstract

:
The expansion of renewable energy with its volatile feed-in character places higher demands on the power grid of the future. Large-scale storage systems (LSS) are a promising option for supporting the electricity grid and have been gaining importance in the last years, both on the market for frequency containment reserve (FCR) and in research. The majority of publications investigating the interaction between storage and FCR are based on simulations rather than on field measurements. This paper presents the analyses of multi-year, high-resolution field measurements of the hybrid 6 MW/7.5 MWh battery storage “M5BAT” to address this issue. The influence of FCR operation on the operation and degradation of the hybrid LSS and the individual battery technologies is investigated via a statistical evaluation of the historical operating data between 2017 and 2021. The data-based analysis of the LSS and the individual battery technologies reveals a high availability of the LSS of over 96.5%. Furthermore, the FCR operation results in an average SOC of the LSS of 50.5% and an average C-rate of the battery units of 0.081 C. A capacity test after four years of operation exposes that the lead-acid batteries have experienced a loss of energy capacity of up to 36%, whereas the lithium batteries have only experienced a loss of up to 5%. The calendar ageing predominates in this context. The presented results can be used to investigate and model the influence of FCR on the operation and battery degradation of the LSS and its different battery technologies.

1. Introduction

Europe’s aim of climate neutrality until 2050 leads to an increased expansion of renewable energy installation [1]. Due to their dependency on external environmental factors, the feed-in of renewable energies has a higher volatility, which they pass on to the electricity grid. The frequency containment reserve (FCR) market for balancing the grid frequency fluctuations is gaining in importance. While in the past, reserve power was primarily offered by conventional power plants, in recent years large-scale storage systems (LSS) have increasingly entered the reserve market with their high efficiency and fast response time. At the end of 2019, storage systems with an energy storage capacity of 269 MWh and a power capacity of 243 MW were active on the FCR market in Germany [2,3].
The impact of participation in the FCR market on the performance of a LSS are examined in various scientific publications. Most of the studies are limited to simulations and do not refer to real field applications. Ref. [4], for example, examines the provision of FCR in combination with other applications (multi-use) for LSS. Ref. [5] restricts the analysis to the participation of the storage in the FCR market, but considers the combination of a hybrid storage systems of lead-acid and lithium technologies with a power-to-heat coupling. Ref. [6] simulates the provision of FCR by a LSS under Eastern Denmark’s regulations.
Another possibility for modelling LSS is the aggregation and clustering of small storage units. The potential of battery home storage for the provision of FCR is analysed in the papers [7,8]. Ref. [7] considers in addition the combination of home storage with heat pumps. Other articles analyse the provision of FCR by a fleet of electric vehicles [9] or by second life batteries [10].
The majority of the studies, as well as the previously described contributions, are mainly limited to simulations and have no reference to real applications. A few publications validate their simulation models using laboratory tests. Refs. [11,12], for example, investigate the second life potential of lithium-based battery units from electric vehicles. For this purpose, predefined stationary power profiles of various products, such as arbitrage, peak load shaving and participation in the primary reserve market are applied to new and old battery cells in the laboratory and analysed with regard to ageing and efficiency. Ref. [13] conducts similar laboratory investigations, but focuses on different stationary battery technologies, such as lithium ion battery, redox flow battery and sodium-nickel chloride battery. Ref. [14] investigates the ageing and efficiency of home storage systems under laboratory conditions.
Publications and analyses of the operating data of LSS with direct reference to real field applications on the electricity and reserve market are rarely available. A literature review on LSS with reference to field measurements is provided in Table 1.
The comparison of LSS provided in Table 1 demonstrates that the few scientific contributions in this research field primarily examine storage systems of a specific cell chemistry. Discussions of the interaction of a hybrid LSS from five different battery technologies as well as with a long-term participation in the FCR market are missing. An exception are the previously published papers on the LSS “M5BAT” [21,22].
The outstanding questions regarding the influence of participation in the FCR market on the operation data and the SOH of LSSs and its components are examined and answered in this paper, as shown in Figure 1 on the basis of several years of high-resolution field data of the hybrid LSS “M5BAT”, participating in the FCR market since 04/2017. For this reason, Section 2 and Section 3 explain the basics of the LSS “M5BAT” as well as the methodology of the analysis procedures, in order to subsequently examine and compare the operation of the hybrid LSS and the individual battery technologies in detail. Section 4 summarises and gives an outlook.

2. Materials and Methods
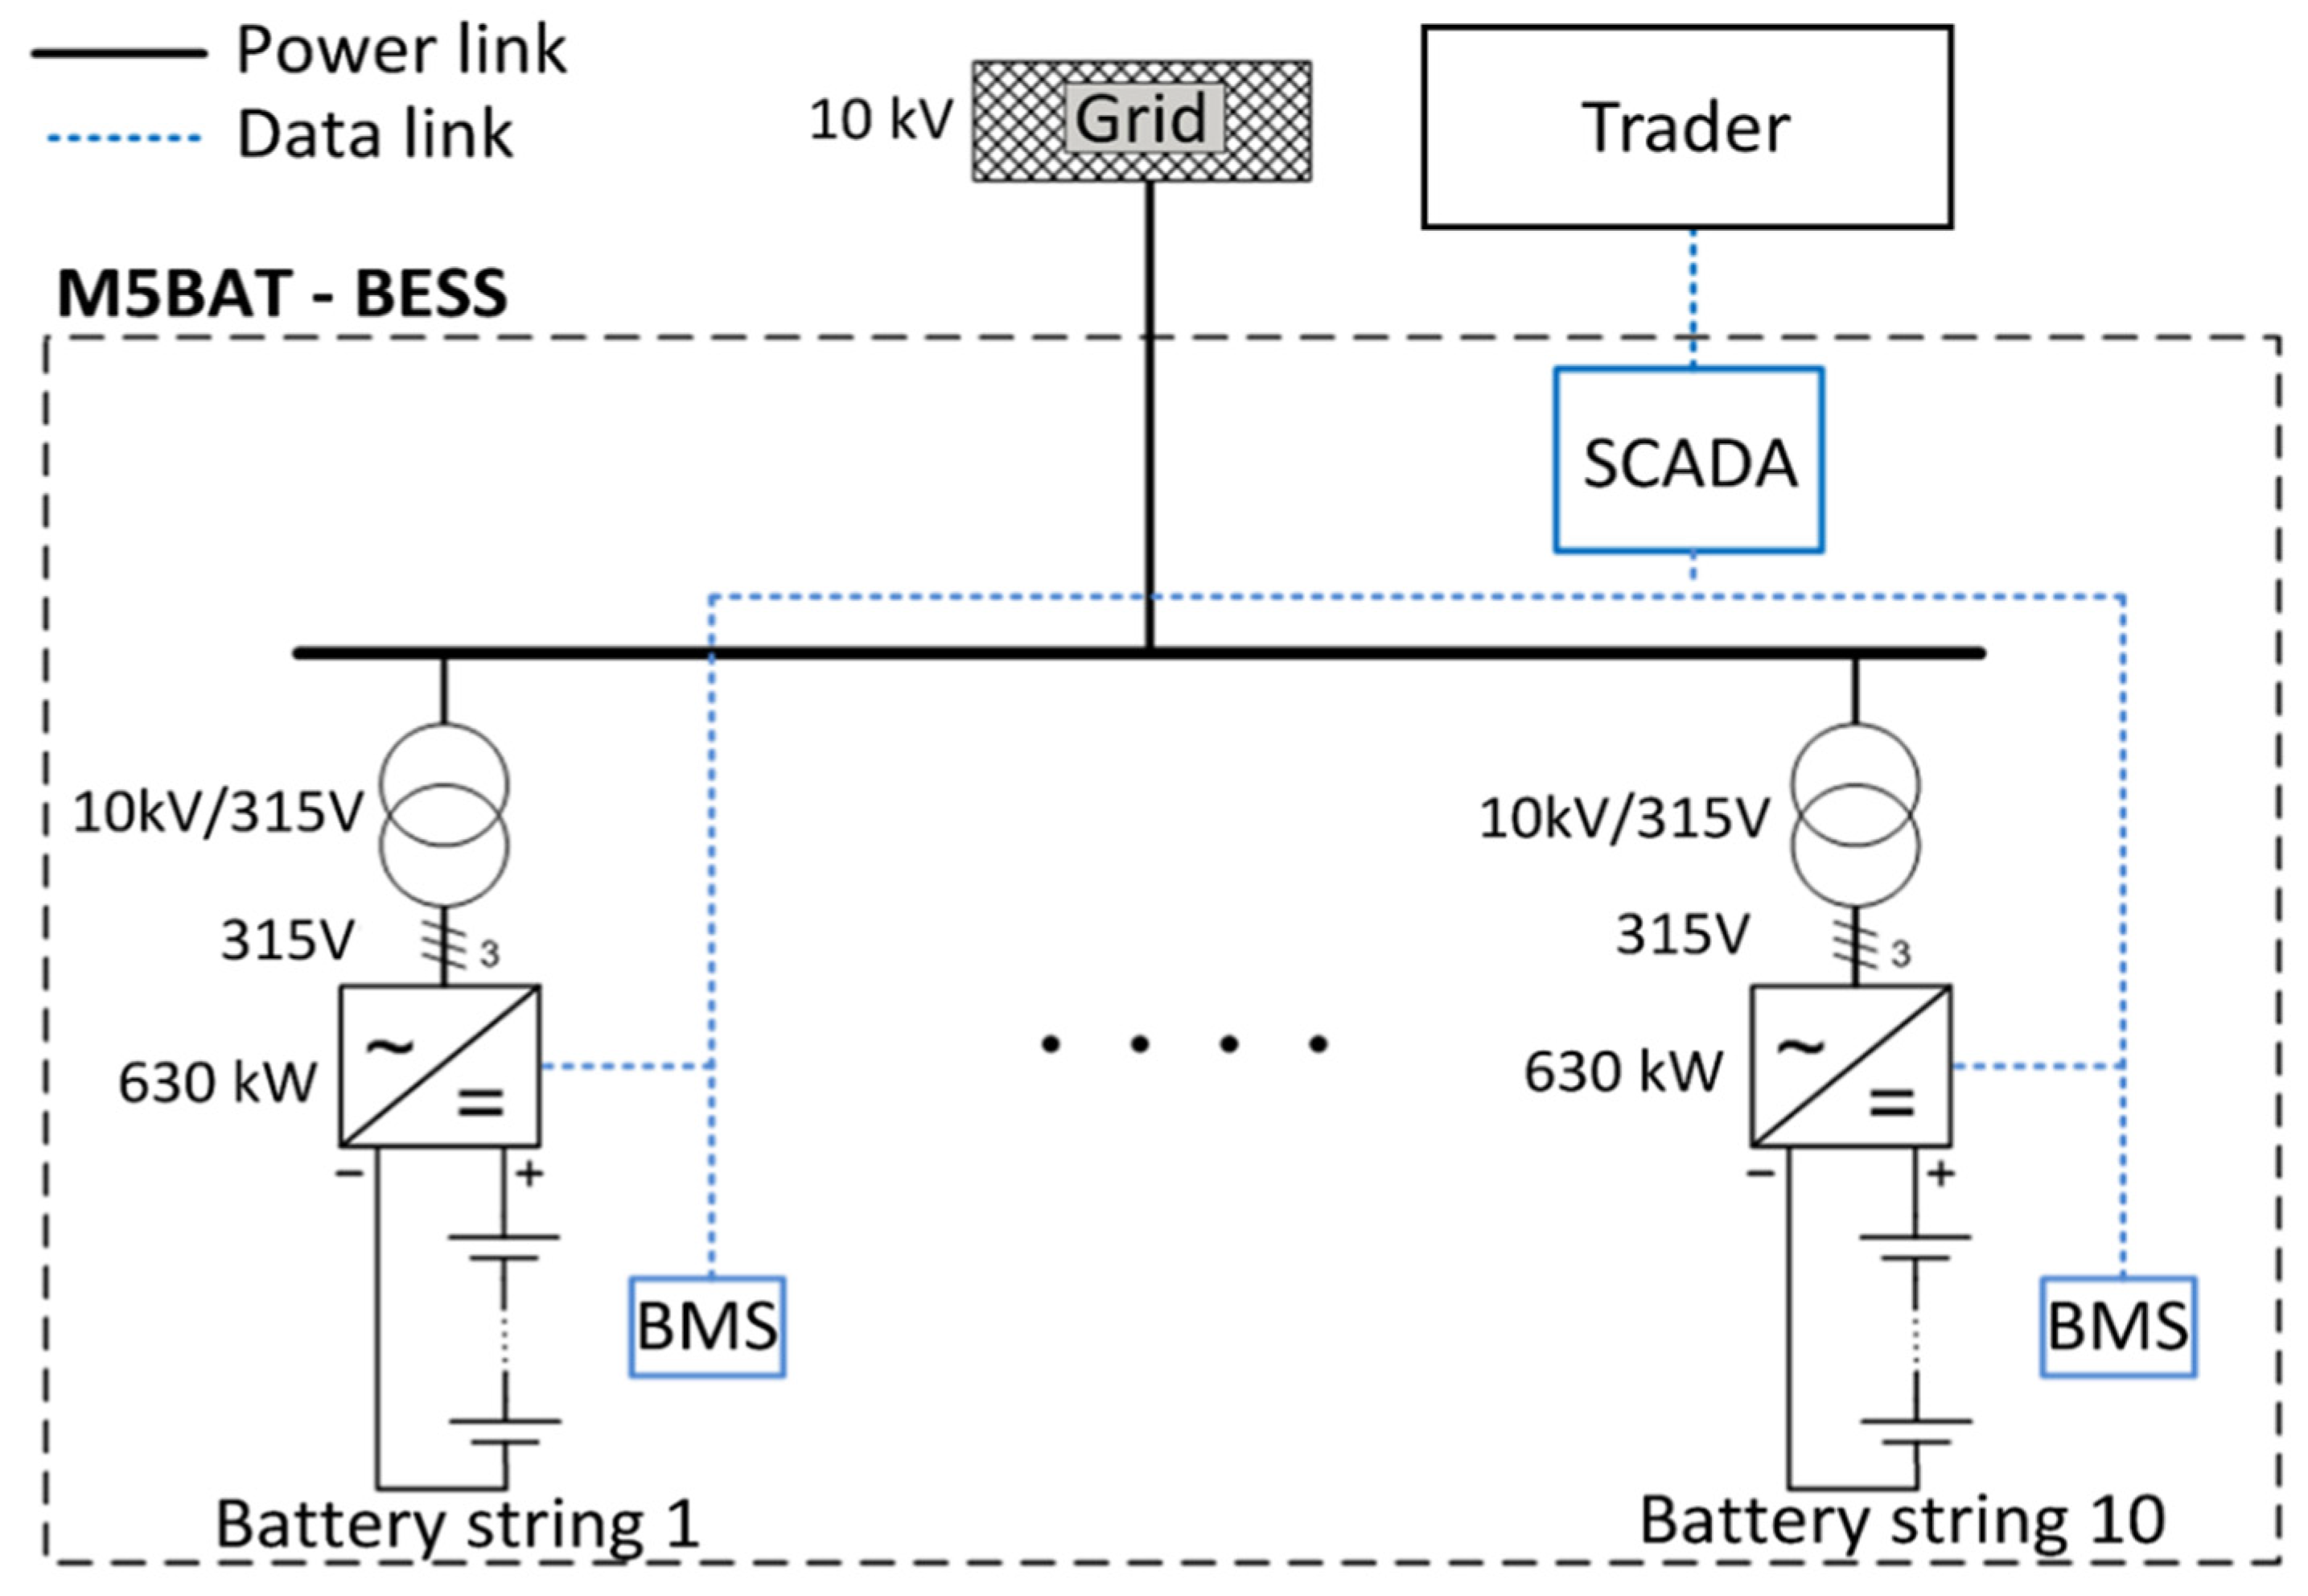
The analysis of the different battery technologies in the hybrid LSS “M5BAT” requires a fundamental understanding of the structure and deployment of the storage system as well as the individual technologies. This section explains the battery composition, the connection scheme and the data basis of the LSS.

2.1. M5BAT

The acronym M5BAT stands for “Modular Multi-Megawatt Medium Voltage Battery Storage System”. The hybrid LSS was built in 2016 as part of a publicly funded project [23]. The aim is to analyse the operation and aging of different battery technologies under real applications in the German electricity market. Operational experience should provide insights into the economic conception and design of LSS as well as their operating strategy.

2.1.1. Structure

The structure and the technical functionality of the hybrid LSS “M5BAT” are depicted in an electrical equivalent circuit diagram in Figure 2.
The LSS consists of 10 battery units installed in parallel with a voltage between 0.5 kV and 1 kV. Each battery unit is connected to an inverter (SMA Sunny Central 630 CP XT from SMA Solar Technology AG—Niestetal, Germany) with a maximum output power of 630 kVA [24]. Two inverters are connected to one transformer (Schneider HSGX 1260F from J. Schneider Elektrotechnik GmbH—Offenburg, Germany) [25]. The transformer limits the maximum output power of the inverters to 630 kW-each. The voltage level between the inverters and the transformers is about 315 V, while the upper voltage level of the transformers is 10 kV. A measuring device is installed behind the transformers, at the grid connection point, and the LSS is connected to the power grid.
Each battery unit has its own battery management system (BMS) for monitoring, control and communication. Each inverter has a battery system controller (BSC) for the same purpose. Both the BMS and BSC communicate via the Modbus TCP/IP transmission protocol with the energy management system (EMS), which runs on a central programmable logic controller (PLC). In addition, a data logger is linked to the data backbone, which stores all data transmitted via the bus. Moreover, the PLC has a communication interface to the external trader [23].

2.1.2. Technology

The M5BAT storage contains five different battery storage technologies that can be used as 10 independent battery units [21,22]. The LSS disposes of battery units of two different lead-acid technologies and three different lithium-ion technologies. The lead-technology batteries can be separated in lead-acid batteries with liquid electrolyte (OCSM) and sealed lead-acid batteries with gelled electrolyte (OPzV). The installed lithium batteries are batteries based on a blend cell chemistry with Li-ion manganese oxide and nickel-cobalt-manganese (LMO/NMC), lithium-ion iron phosphate (LFP) and lithium-ion titanate oxide (LTO) [23]. The various battery units differ not only in their cell technology, but also in their power, energy capacity and the serial (s) and parallel (p) interconnection of the individual battery cells. Table 2 provides more detailed information on the battery units and technologies.
It should be noted that due to incorrectly configured operating ranges of the BMS of the LFP battery unit, only 718 kWh, 77.8% of the allocated 923 kWh, can be operated in the year of commissioning. The loss of energy capacity is not attributed to ageing, but interpreted as a design fault of the LFP storage.
The LTO battery is not taken into account in the further data analysis and evaluation because the storage is not fully functional by mid-2021 and therefore no significant data basis is available.

2.1.3. Commercial Application

Unpredictable power fluctuations in the electricity grid require the use of reserve power. The aim of reserve power is to maintain the grid frequency of 50 Hz by continuously equalizing generation and consumption. The hybrid large-scale storage M5BAT has been used exclusively in the FCR market since mid-2017. The M5BAT storage system is prequalified with 3 MW and offered by the trading partner Uniper on the FCR market [23]. The storage has been operated in the FCR market 84% of the time between mid-2017 and mid-2021. Further information on the implementation of FCR in the storage system M5BAT is provided in related publications [5,21,22].

2.1.4. Energy Management System (EMS)

The specific characteristics and requirements of the individual battery technologies necessitated the implementation of an EMS developed by ISEA with an asymmetric power distribution algorithm. The aim of the EMS is to optimise the operation and availability of the individual battery technologies as well as of the overall system. To this end, the asymmetric power distribution algorithm is designed to maximise the working capacity of the overall system and to minimise the operational losses and ageing [23]. In mid-2020, the power distribution algorithm was adapted. The adapted EMS considers in addition predefined and targeted SOC ranges of the individual battery units (Pb1–4: 45–70%, LMO1–4: 25–60%, LFP: 35–70%).

2.2. SOH

The “State of health” (SOH) provides information about the ageing condition of a battery. To calculate the SOH, a characteristic of the battery that is subject to ageing is set in relation to its state at commissioning.
The SOH of the characteristic “energy capacity” is quantified via the key figure S O H E , T and describes the age-related status of the available remaining energy capacity of the battery E D i s c h a r g i n g , T after the period T compared to the nominal energy capacity of the manufacturer’s specifications E D i s c h a r g i n g , N o m i n a l . The nominal energy capacity of the battery and the measurement of the available residual energy capacity are specified for a complete discharge cycle with a C-rate of 1/3 C. With a remaining energy capacity of less than 80%, the battery reaches the end of battery life (EOL) according to general convention [26]. The calculation of the key figure S O H E , T is based on Equation (1).
Equation (1), SOH of energy capacity:
S O H E , T [ % ] = 100 · E D i s c h a r g i n g , T [ k W h ]   E D i s c h a r g i n g , N o m i n a l [ k W h ]

2.3. Database

The results of this work are based on the adjusted operating data recorded every second from the period between 06/2017 (commissioning of the M5BAT storage system) and 06/2021. The proportion of data gaps is limited to a maximum of 3% for the individual battery technologies and for the LSS.

3. Results and Discussion
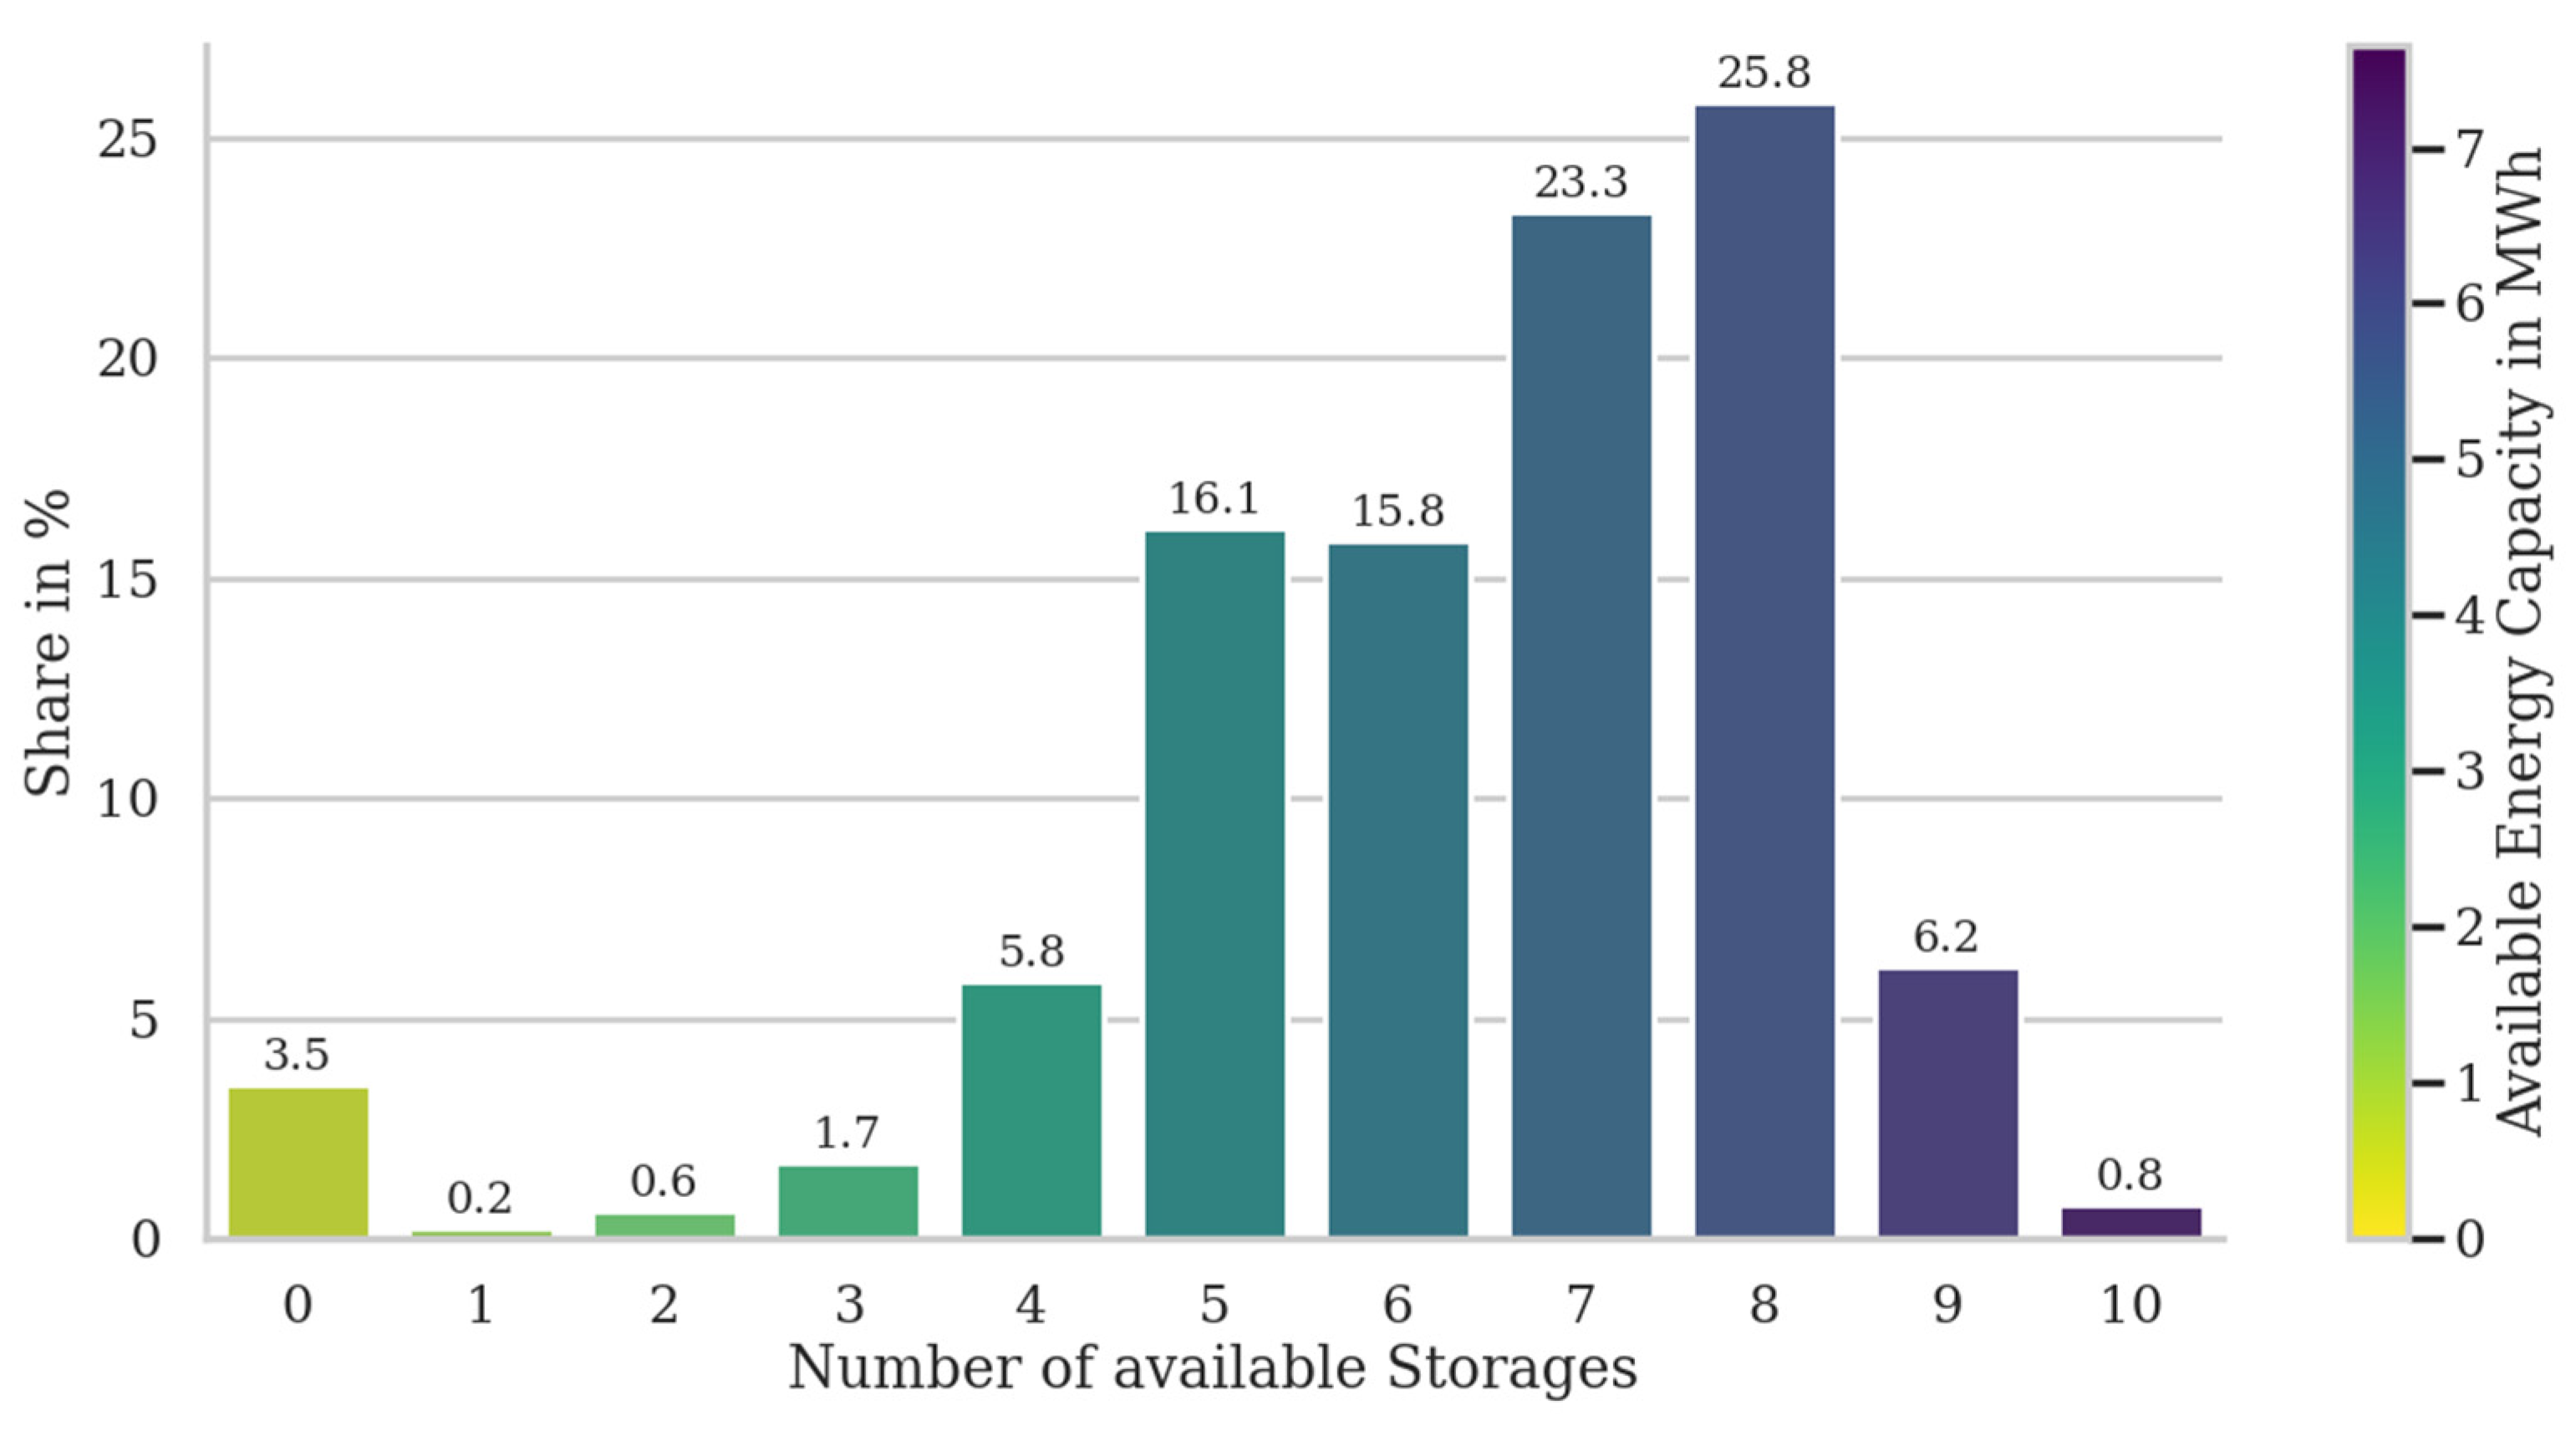
The operation of the LSS primarily in the reserve market leads to a dynamic change of the state of the LSS. In this section, four years of operating data of the LSS are examined and statistically evaluated. From the evaluation of the variables availability, SOC, voltage and C-rate, the dynamic state as well as the operating limits of the LSS and of the individual battery units are determined. The subsequent investigation of the SOH allows conclusions to be drawn about the capacity degradation of the individual battery units and therefore about its ageing. The results provide information about the state of the LSS and the individual battery units in operation and serve as a basis for further analyses.

3.1. Availability

The application of LSS in the energy market requires high reliability and availability. Failure to meet the marketed power or energy results in penalties and can lead to market exclusion [27]. To increase the availability of the LSS, the different battery units are connected in parallel. The influence of this configuration of the different battery units on the availability of the entire storage system is investigated in the following.
Figure 3 and Figure 4 present the analysis of the monthly and overall average availability of the individual battery units and the LSS. The LSS is available when at least one of the nine battery units is also available and operational. The heat map in Figure 4 displays the temporal changes of the monthly average over time. The height of the mean value is determined by the colour. If less than one day of data is available for a month, the month is skipped and the corresponding tile is marked white.
The analysis of availability shows that the LSS is available and operational 96.5% of the time. The individual battery units have an availability between 34.5% and 89.6%. On average, when weighted with energy capacity, the lithium batteries have a higher availability of 79.9% than the lead-acid batteries with 57.8%. Operational experience shows that the availability of the battery units depends primarily on the quality of the BMS. The adaptability of the BMS to changing framework parameters of the battery, such as progressive ageing, is decisive. For example, the insufficiently developed BMS of LFP and Pb1–4 in conjunction with inadequately coordinated electronics and hardware increasingly lead to unfounded error states as the battery ages. Deviations of the measured variables outside the predefined operating range of the BMS result in an alarm and a lack of operational readiness for safety reasons. Adjustments to the hardware and the BMS of the lead-acid batteries at the end of 2020 led to an increase in the availability of the battery systems, as can be seen in Figure 4.
Furthermore, it should be noted that different times of commissioning of the battery units lead to increased failure probabilities in 2017 and 2018. For example, the lead-acid batteries could not be fully commissioned until the end of 2018 and the LFP unit until the end of 2017 due to implausible SOC and power forecast calculations.
Experience in the field has shown that fast support from battery manufacturers is essential for getting a battery unit back into operation. Long delivery times of spare parts as well as insufficient support, often due to the distance of the manufacturer’s headquarters, lead to small errors in hardware and software resulting in long downtimes of several weeks.
Lead-acid batteries: The lead-acid batteries have an energy-weighted average of availability of 57.8%. The high non-availability of battery units Pb2, Pb3 and Pb4 result from hardware problems, such as a defective cell and inadequately designed ventilation systems, as well as an insufficiently developed BMS. Incomplete maintenance charges furthermore lead to higher deviations of the cell voltages. The resulting deviations in the operating parameters cannot be assessed by BMS and lead to the battery unit shutting down.
Lithium batteries: The lithium batteries have a higher energy-weighted average of availability than the lead-acid batteries with 79.9%. The non-availability of the battery units LMO1–4 as well as LFP results, apart from hardware and software problems, mainly from non-existent or immature cell voltage balancing processes. The resulting deviations of the cell voltage lead to a violation of the predefined operating limits and thus to the shutdown of the battery unit. For example, due to a defective cell voltage balancing process of the BMS, the LFP battery unit experienced high deviation of the cell voltage during operation, which resulted in a fault and a shutdown of the battery unit. Only a manual charging of the individual racks of the battery unit enabled an adjustment of the different cell voltage and thus the reconnection of the storage. However, the manual charging process is time-consuming and negatively affects the availability of the system.

Number of Available Battery Units

Figure 5 shows the results of the analysis of the share of the number of available battery units of the LSS as well as the associated, average storage energy capacity on DC side. Zero available storages represent the cases of maintenance and failures of the entire LSS due to faults. Ten available storages are only achieved when all units are entirely available.
The evaluation of the number of available battery units as well as the resulting aggregated energy capacity shows that in over 88.1% of the time, at least 5 of the 10 battery units are available and thus on average at least 3.92 MWh can be accessed. In over 96.5% of the time, at least one storage unit with on average over 0. 757 MWh is operational. The nominal energy capacity and nominal power of the M5BAT is only completely available for 0.789% of the time with an approximate value of 7.66 MWh. This is due, among other things, to the unavailability of the LTO battery unit. The parallel design of the battery units thus enables an increased availability of battery units and aggregated energy capacity, but at the same time is associated with higher losses due to a low utilisation rate of the electronic components and higher deviation from nominal operation.

3.2. SOC

The SOC provides information about the energy content of the battery and thus about the available energy in the charging and discharging direction. In this section, the SOC of the LSS as well as the individual battery units is analysed and examined.

3.2.1. LSS

Figure 6 presents the analysis results of the distribution of the SOC of LSS in a violin plot. In a violin plot, the distribution is shown vertically and mirrored around the y-axis. The 50% confidence interval is indicated by a thick black bar in the distribution, the 90% confidence interval is indicated by a narrower thin black bar in the distribution. The mean value is marked with a white cross. The outcomes of the analysis reveal that the SOC of LSS has a mean of 50.5% and a 90% confidence interval between 28.2% and 76.6%. This characteristic of the SOC is due to the marketing of the LSS on the FCR market and the reservation of energy and power in the charging and discharging direction.
Outliers in the SOC density in Figure 6 by 100% result from market-independent research projects and cannot be attributed to the FCR. Furthermore, it should be noted that the operating losses of the storage in FCR mode lead to a reduction of the energy content and thus of the SOC. For this reason, the density of lower SOCs is most significant. The course of the SOC of the LSS over time results from the energy balance of participation in the FCR market. Depending on degrees of freedom, the average frequency deviation and the operating point adjustment process, the average SOC of the LSS varies. SOC outliers are primarily due to market-independent research projects.

3.2.2. Batteries

Figure 7 illustrates the analysis results of the distribution of the SOC of the individual battery units. The graph distinguishes between lead-acid and lithium batteries. Figure 8 shows the analysis of the monthly average SOC of the individual battery units. The analysis of the SOC reveal that the SOC of the battery units is on average between 44% and 61% over the years. This SOC characteristic is derived from the marketing of the LSS on the FCR market and the reserve of energy and of power in the charging and discharging direction.
The energy reserve of the LSS is passed on to the individual battery units via the EMS. The asymmetric power distribution of the EMS strives for an equal energy content of the battery units to maximise the aggregated power forecast over time. A centring of the SOC of the battery units is the result. The introduction of predefined and individual SOC ranges for the individual battery units in the adapted EMS since the middle of 2020 leads to a tendency of the monthly mean SOC level of the lithium batteries to shift towards 45% and of the lead-acid batteries towards 60%. This situation can be observed in Figure 8. This trend will continue to prevail in the future.
Outliers in the density of the SOC result from longer periods of storage unavailability due to failures and the associated stagnation of the SOC. Regular maintenance charges of the Pb and LFP units are responsible for a tending, rather evenly distributed SOC. This link can also be seen in Figure 7. Furthermore, it should be noted that the ongoing losses of the storage in FCR operation lead to a reduction in the average SOC. This fact can be observed in Figure 7, primarily for the highly available and frequently used LMO battery units through a higher density of the distribution in lower SOC ranges. Outliers of the monthly average SOC of the battery units can be attributed to required maintenance charges (Pb1–4 and LFP), capacity tests and other research projects.
Lead-acid batteries: The energy-weighted average SOC of the lead-acid batteries is approximately 57.9%. A SOC value of almost 100% is only reached occasionally and is due to the regular maintenance charges of the lead-acid batteries. The maintenance charges consequently lead to a stretching and distortion of the SOC towards higher SOC ranges. The adjustment of the EMS in mid-2020 leads to an increase in the mean SOC of the lead-acid batteries. This is due to the implementation of predefined and individual SOC ranges, which targets a higher SOC for the lead-acid batteries.
Lithium batteries: The energy-weighted average SOC of the lithium battery units is 46.4%, 11 percentage points lower than the average SOC of the lead-acid batteries. A high participation in the FCR market resulting from a high availability and related higher operating losses as well as the lack of need for maintenance charging favour a lower SOC for the lithium batteries. The LFP battery unit is an exception. The LFP battery unit requires regular maintenance charges to initiate a voltage balancing process. For this reason, the mean SOC value of the LFP unit is higher compared to the LMO battery units. In addition, an adjustment of the EMS in mid-2020 leads to a reduction of the SOC of the lithium batteries. The new implementation of predefined and individual SOC ranges targets a lower SOC for the lithium batteries.

3.3. Voltage

Each battery has technology-specific voltage limits. A distinction is made between operating and cut-off limits of the cell voltage. The operating limits of the voltage must be ensured during operation. In exceptional circumstances, the voltage cut-off limits lead to a disconnection of the battery from the LSS and to the initiation of an alarm.
The voltage limits result from the cell chemistry and from the technology- and manufacturer-specific safety criteria of operation. Table 3 shows the operating and cut-off limits of the individual battery units as well as their nominal voltage.
Figure 9 shows the distribution of the cell voltages of the individual battery units. The graph distinguishes between lead-acid and lithium batteries. The results indicate that the operating range of the battery unit voltage is dependent on the cell chemistry. However, the average cell voltage of the battery units ranges between 20% and 70% of the permissible operating limits, regardless of cell chemistry. The energy and power reserves required for FCR operation in the charging and discharging direction lead to a centring of the voltage distribution around the nominal voltage. Furthermore, it should be noted that the ongoing losses of the storage in FCR operation lead to a reduction of the energy content and therefore the voltage. For this reason, the density of lower voltages is more distinct.
Outliers in the cell voltage result from maintenance charges or market-independent research projects and cannot be attributed to FCR operation. It should also be noted that the operating limits are met over 90% of the time. Furthermore, the shutdown limits of the individual battery technologies are not exceeded at any time. This can be seen from the extremes of the distribution in Figure 9 and the cut-off limits in Table 3.
Lead-acid batteries: The lead-acid batteries have an energy-weighted mean voltage of 2.09 V and a 90% confidence interval between 1.99 V and 2.25 V. The higher voltages up to 2.74 V result from regular maintenance charges. These are necessary to prevent the sulfation of the lead-acid battery and thus maintain its energy capacity. The voltages of 1.6 V to 1.9 V are caused by the deep discharges of the battery in capacity tests.
Lithium batteries: The LMO battery units have an energy-weighted mean voltage of 3.67 V and a 90% confidence interval between 3.54 V and 3.86 V. The operating limit of the battery cells is capped at 4.1 V to improve the lifetime of the batteries. The shutdown limits of the batteries are reached during full cycles with significant C-rate and occur exclusively during capacity tests.
The voltage distribution of the LFP battery differs from the rest of the lithium batteries. Due to the different cell chemistry, the LFP battery unit has a different voltage range. With a mean voltage of 3.29 V and a 90% confidence interval between 3.22 V and 3.34 V, the voltage of the LFP battery is lower than the voltage of the LMO battery units. The cell chemistry is characterised by a flat OCV curve in the middle voltage range with an exponential increase or decrease towards the end of the voltage range. The described characteristic OCV curve is identifiable from the percentiles of the voltage.

3.4. C-Rate

The charge and discharge rates (C-rate) of the battery units provide information about their workload. The maximum C-rate of the individual battery technologies depends on the cell chemistry and the design of the battery storage unit. During operation, the maximum C-rate of the batteries is determined by additional factors, such as the maximum power of the converters and the transformers. In the LSS, the maximum power output of a battery unit is limited to 630 kW by the transformers. Consequently, the maximum C-rate of the individual units in operation is below 1 C according to the configuration in Table 1, with the exception of LTO.
Figure 10 shows the distribution of the C-rate of the battery units. Figure 11 illustrates the mean, monthly C-rate of the battery units over time. In Figure 10, non-zero C rates are examined in order to discuss the behaviour of active batteries in more detail. The graph distinguishes between lead-acid and lithium batteries. The energy-weighted average C-rate of the battery units in operation proves to be low and amounts to 0.081 C. The 95% percentile of all battery units is below 0.4 C. This is a result of the FCR operation. The low power requirements of FCR operation on the LSS are passed on to the C-rate of the battery units via the asymmetrical power distribution. A high unavailability or poor power forecast of a battery unit leads to a low power allocation in the EMS and consequently to an average C-rate below 0.025 C. For this reason, lithium batteries have a higher average C-rate compared to lead-acid batteries. Positive outliers of the C-rate of up to 1 C are due to market-independent research projects.
It is important to note that the average monthly C rate was lower until 02/2018, see Figure 11. This is due to an adjustment in the configuration of the inverters. The modification of the inverter configuration in February 2018 allows the inverters to switch to sleep mode during inactivity and consequently prevents the inverters from drawing power from the battery systems. Until 02/2018, the inverters continued to consume power and current even during inactivity, resulting in a lower average C-rate for all battery units. From 02/2018, the energy-weighted mean monthly C-rate increases from 0.044 C to 0.098 C.
Lead-acid batteries: The lead-acid batteries have an energy-weighted average C-rate of 0.0555 C. The smaller C-rate compared to the lithium batteries results from the higher E/P ratio of the lead-acid batteries, see Table 2, as well as from low power forecasts of the BMS, on which the EMS bases its power allocation.
The lead-acid batteries also have an increased density of the C-rate of 0.2 C. This circumstance results from the monthly maintenance charge of the lead-acid batteries. The BMS of the lead-acid batteries triggers the monthly maintenance with approx. A total of 0.2 C before the C rate is further reduced during the maintenance charge. The maximum C-rate of the lead-acid batteries is 0.852 C and results from capacity tests.
Lithium batteries: The lithium batteries have an energy-weighted average C-rate of 0.106 C. The C-rate of the lithium batteries is higher compared to the lead-acid batteries. This is due to a lower E/P ratio and a more stable and higher power forecast resulting in a correspondingly higher power allocation. The maximum C-rate of the lithium batteries is 1 C and results from capacity tests.

3.5. Remaining Energy Capacity

In this section, the “State of Health” (SOH) and therefore the remaining energy capacity of the battery units in relation to the nominal energy capacity is determined and analysed. In this context, the SOH of the BMS is compared with its own capacity tests for validation purposes.

3.5.1. BMS

The BMS of the battery units calculates and transmits the SOH of the battery to the EMS. Figure 12 shows the transmitted SOH of the different battery units. The analysis of the SOH curve shows that the SOH of the lead-acid batteries starts at 100% and decreases continuously over the years. The SOH of the lithium batteries in comparison, with the exception of the LFP unit, starts with an SOH below 100% and is characterised by sudden increases and decreases, whereby the SOH remains at a similar, high level over time. The differences in the course of the transmitted SOHs result from different, not fully documented procedures for calculating the SOH.
Lead-acid batteries: The source code of the BMS of the lead-acid battery is available for research purposes and allows an insight into the applied procedure for calculating the SOH of the lead-acid batteries. According to this, the SOH of the lead-acid batteries is determined by multiplying the equivalent full cycles by a battery-specific ageing factor. For this reason, the SOH of the more stressed OCSM batteries consequently falls stronger over time than the gel-based lead-acid batteries, which are characterised by a high non-availability.
A comparison of the SOH transmitted by the BMS with the SOH of the capacity test in Section 3.5.2 shows that the SOH of the BMS of the lead-acid batteries deviates strongly from the SOH of the capacity test mainly for the gel-based lead-acid batteries. This is a consequence of the calculation basis of the SOH in the BMS. The BMS of the lead-acid batteries calculates the SOH from the equivalent full cycles and is therefore limited to the cyclic ageing of the lead-acid batteries. However, the gel-based lead-acid batteries have mainly experienced calendar ageing due to their low availability. Consequently, this ageing phenomenon cannot be detected by the BMS, which results in a SOH of the BMS of the lead-acid batteries being of low quality.
Lithium batteries: The method used in the BMS to calculate the SOH of the lithium batteries is not further known. A comparison of the SOH transmitted by the BMS with the SOH of the capacity test in Section 3.5.2 shows that the SOH of the LMO batteries is similar at 95–96% and consequently has a high quality. The BMS of the LFP battery unit transmits a constant SOH of 100 % despite noticeable ageing of the remaining energy capacity. The reason for this could be an insufficient or non-existent implementation of a SOH algorithm in the BMS. The operational experience on the quality of the BMS of the LFP units supports this theory.

3.5.2. Capacity Test

The battery units experience ageing due to operation over the years. This ageing leads to a decrease of the usable energy capacity of the battery units [28,29,30]. Capacity tests are designed to reveal the remaining energy capacity after four years of operation. The remaining energy capacity is set in relation to the nominal energy capacity to determine the state of health (SOH) in %, according to Equation (1).
The results of the capacity test and the subsequently determined SOH are shown in Figure 13. According to the results of the analysis, the battery units have experienced a decrease of energy battery of up to 36% between mid-2017 and mid-2021. The SOHs in this context are similar for identical cell chemistries. It is noticeable that the lead-acid batteries experienced a higher battery degradation compared to the lithium batteries despite lower load. On the one hand, this is due to the lower cycle stability of the lead-acid batteries in the LSS. On the other hand, the micro-cycles resulting from the low power requirements of the FCR have a subordinate influence on the battery degradation. The calendar ageing predominates [31,32]. The influence of temperature, state of charge, C-rate, cycles on ageing and battery degradation as well as the share of reversible and irreversible loss of energy capacity have not been determined so far and are to be investigated in further research work.
Lead-acid batteries: The results of the capacity test show that the gel-based lead-acid batteries have experienced the greatest ageing with decrease of the energy capacity of up to 36%. Consequently, the gel-based lead-acid batteries have already reached the usual defined end of battery life (EOL) with less than 77.5% of remaining energy capacity [26]. The OCSM lead-acid batteries have also experienced a non-negligible reduction of energy capacity of up to 10% compared to the lithium batteries. The share of reversible and irreversible loss of energy capacity of the sealed and sealed lead-acid battery has not yet been determined and is to be investigated in further research. Assuming linear ageing, the losses of the energy capacity of the lead-acid batteries are between 2.02% and 8.82% per year.
Lithium batteries: Despite a higher number of equivalent full cycles with a maximum of 5% capacity loss, the lithium batteries have experienced less ageing effects than the lead-acid batteries. This is explained on the one hand by a higher cycle stability and on the other hand by a lower calendar ageing effect. Assuming linear ageing, the capacity losses of the lithium batteries are consequently between 0.928% and 1.21% per year.

4. Conclusions and Discussion

The analysis of the operating data of the hybrid large-scale stationary storage system M5BAT operating on the FCR market reveals that the LSS has 96.5% of the time at least one available battery unit due to its parallel structure of the battery units and is therefore characterised by a high availability. In this context, the lithium batteries have a higher availability of 79.9% compared to the lead-acid batteries with 57.8%. The decisive factor for the low availability of the lead-acid batteries lies in the undeveloped BMS, which is insufficiently adjusted to the ageing processes of the battery.
The ongoing operation of FCR has a high impact on the operating variables: SOC and C-rate. The requirement to reserve power and energy in the charging and discharging directions on the FCR market is linked to a centring of the SOC of the LSS with an average of 50.5%. An adjustment of the power distribution algorithm favours a higher mean SOC of the lead-acid batteries with an approximate 57.9% compared to the lithium batteries with an average of 46.4%. The frequency-dependent power requirements of FCR for the LSS prove to be small in this context. With a C-rate of 0.081 C, the battery units are only slightly stressed on average. Due to the higher availability of the lithium batteries and the resulting stronger participation in the FCR operation, the lithium batteries are exposed to a higher average load and are therefore characterised by a higher average C-rate.
A capacity test indicates that the lead-acid batteries have lost up to 36% of their energy capacity after four years, despite lower availability and load, whereas the lithium batteries have only experienced a decrease of energy capacity of up to 5%. The calendar ageing outweighs the cyclical ageing and is identified as the cause for the strong battery degradation of the lead-acid batteries.
The analysis of the influence of FCR operation on the LSS is limited in this paper to the battery degradation and the most relevant operating parameters. A detailed elaboration of the influence factors of the ageing processes as well as a classification into calendrical and cyclical ageing remains open and is to be investigated in further research projects. The influence of the power distribution algorithm on the operation has been revealed in this work. An adjustment of the power distribution algorithm to minimise the ageing effect of the different battery technologies is not sufficiently documented and requires further investigation.

Author Contributions

K.J.: Conceptualization, Methodology, Software, Validation, Formal Analysis, Investigation, Data Curation, Visualization, Writing—Original Draft; L.K.: Conceptualization, Methodology, Investigation, Validation, Formal Analysis, Writing—Review & Editing; J.F.: Conceptualization, Validation, Writing—Review & Editing, Supervision; S.Z.: Conceptualization, Validation, Supervision, Project administration, Funding acquisition; D.U.S.: Conceptualization, Validation, Resources, Writing—Review & Editing, Supervision, Funding acquisition. All authors have read and agreed to the published version of the manuscript.

Funding

The research was funded by the German Federal Ministry of Economic Affairs and Climate Action (BMWK) and by the project partner Uniper SE as part of the public project M5BAT (FKZ: 03ESP265F) and EMMUseBat (FKZ: 03EI4034).

Institutional Review Board Statement

Not applicable.

Informed Consent Statement

Not applicable.

Data Availability Statement

The data of the large-scale storage system M5BAT in Aachen is currently not publicly accessible but will be published in the future after comprehensive pre-processing and analysis.

Acknowledgments

The authors would like to thank the industry partner Uniper SE for the support in the M5BAT and EMMUseBat project, which allows the operation and marketing of the large-scale storage system in Aachen on the energy and reserve market.

Conflicts of Interest

The authors do not have any conflict of interest that could have impacted the content presented in this paper.

Abbreviations

LSSLarge-scale storage systems
FCR Frequency containment reserve
BMSBattery management system
BSCBattery system controller
EMSEnergy management system
PLCProgrammable logic controller
OCSMLead-acid batteries with liquid electrolyte
OPzVSealed lead-acid batteries with gelled electrolyte
LMOLi-ion manganese oxide
NMCNickel-cobalt-manganese
LFPLithium-ion iron phosphate
LTOLithium-ion titanate oxide
SOHState of health
SOCState of charge
SOEState of energy
EOLEnd of life
C-rateCharge and discharge rate

References

  1. European Commission, Klima- und Energiepolitischer Rahmen bis 2030. Available online: https://ec.europa.eu/clima/eu-action/climate-strategies-targets/2030-climate-energy-framework_de (accessed on 12 February 2022).
  2. Figgener, J.; Stenzel, P.; Kairies, K.-P.; Linßen, J.; Haberschusz, D.; Wessels, O.; Angenendt, G.; Robinius, M.; Stolten, D.; Sauer, D.U. The development of stationary battery storage systems in Germany—A market review. J. Energy Storage 2020, 29, 101153. [Google Scholar] [CrossRef]
  3. Figgener, J.; Stenzel, P.; Kairies, K.-P.; Linßen, J.; Haberschusz, D.; Wessels, O.; Angenendt, G.; Robinius, M.; Stolten, D.; Sauer, D.U. The development of stationary battery storage systems in Germany—status 2020. J. Energy Storage 2021, 33, 101982. [Google Scholar] [CrossRef]
  4. Englberger, S.; Jossen, A.; Hesse, H. Unlocking the Potential of Battery Storage with the Dynamic Stacking of Multiple Applications. Cell Rep. Phys. Sci. 2020, 1, 100238. [Google Scholar] [CrossRef]
  5. Muenderlein, J.; Ipers, G.; Steinhoff, M.; Zurmuehlen, S.; Sauer, D.U. Optimization of a hybrid storage system and evaluation of operation strategies. Int. J. Electr. Power Energy Syst. 2020, 119, 105887. [Google Scholar] [CrossRef]
  6. Filippa, A.; Hashemi, S.; Træholt, C. Economic Evaluation of Frequency Reserve Provision using Battery Energy Storage. In Proceedings of the 2019 IEEE 2nd International Conference on Renewable Energy and Power Engineering (REPE), Toronto, ON, Canada, 2–4 November 2019; pp. 160–165. [Google Scholar]
  7. Angenendt, G.; Zurmühlen, S.; Figgener, J.; Kairies, K.P.; Sauer, D.U. Providing frequency control reserve with photovoltaic battery energy storage systems and power-to-heat coupling. Energy 2020, 194, 116923. [Google Scholar] [CrossRef]
  8. Steber, D.B. Integration of Decentralized Battery Energy Storage Systems into the German Electrical Power System. Ph.D. Thesis, University of Erlangen–Nürnberg, Nürnberg, Germany, 2018. [Google Scholar]
  9. Figgener, J.; Tepe, B.; Rücker, F.; Schoeneberger, I.; Hecht, C.; Jossen, A.; Sauer, D.U. The Influence of Frequency Containment Reserve Flexibilization on the Economics of Electric Vehicle Fleet Operation. arXiv 2021, arXiv:2107.03489. [Google Scholar]
  10. Janota, L.; Králík, T.; Knápek, J. Second Life Batteries Used in Energy Storage for Frequency Containment Reserve Service. Energies 2020, 13, 6396. [Google Scholar] [CrossRef]
  11. Elliott, M.; Swan, L.G.; Dubarry, M.; Baure, G. Degradation of electric vehicle lithium-ion batteries in electricity grid services. J. Energy Storage 2020, 32, 101873. [Google Scholar] [CrossRef]
  12. Podias, A.; Pfrang, A.; Di Persio, F.; Kriston, A.; Bobba, S.; Mathieux, F.; Messagie, M.; Boon-Brett, L. Sustainability Assessment of Second Use Applications of Automotive Batteries: Ageing of Li-Ion Battery Cells in Automotive and Grid-Scale Applications. World Electr. Veh. J. 2018, 9, 24. [Google Scholar] [CrossRef] [Green Version]
  13. Benato, R.; Dambone Sessa, S.; Musio, M.; Palone, F.; Polito, R.M. Italian Experience on Electrical Storage Ageing for Primary Frequency Regulation. Energies 2018, 11, 2087. [Google Scholar] [CrossRef] [Green Version]
  14. Bila, M.; Opathella, C.; Venkatesh, B. Grid connected performance of a household lithium-ion battery energy storage system. J. Energy Storage 2016, 6, 178–185. [Google Scholar] [CrossRef]
  15. Koller, M.; Borsche, T.; Ulbig, A.; Andersson, G. Review of grid applications with the Zurich 1MW battery energy storage system. Electr. Power Syst. Res. 2015, 120, 128–135. [Google Scholar] [CrossRef]
  16. Schiavo, L.L.; Benini, M. In Proceedings of the 2018 AEIT International Annual Conference (AEIT), Bari, Italy, 3–5 October 2018. IEEE: Piscataway, NJ, USA, 2018. Available online: http://ieeexplore.ieee.org/servlet/opac?punumber=8556143 (accessed on 12 February 2022).
  17. Swierczynski, M.; Stroe, D.I.; Stan, A.I.; Teodorescu, R.; Laerke, R.; Kjaer, P.C. Field tests experience from 1.6MW/400kWh Li-ion battery energy storage system providing primary frequency regulation service. In Proceedings of the IEEE PES ISGT Europe 2013, Lyngby, Denmark, 6–9 October 2013; pp. 1–5. [Google Scholar]
  18. Dubarry, M.; Tun, M.; Baure, G.; Matsuura, M.; Rocheleau, R.E. Battery Durability and Reliability under Electric Utility Grid Operations: Analysis of On-Site Reference Tests. Electronics 2021, 10, 1593. [Google Scholar] [CrossRef]
  19. Consiglio, L.; Di Lembo, G.; Noce, C.; Eckert, P.; Rasic, A.; Schuette, A. Performances of the first electric storage system of ENEL distribuzione. In Proceedings of the 22nd International Conference and Exhibition on Electricity Distribution (CIRED 2013), Stockholm, Sweden, 10–13 June 2013; p. 781. [Google Scholar]
  20. Karoui, F.; Ha, D.L.; Delaplagne, T.; Bouaaziz, M.F.; Eudier, V.; Lévy, M. Diagnosis and prognosis of complex energy storage systems: Tools development and feedback on four installed systems. Energy Procedia 2018, 155, 61–76. [Google Scholar] [CrossRef]
  21. Thien, T.; Schweer, D.; vom Stein, D.; Moser, A.; Sauer, D.U. Real-world operating strategy and sensitivity analysis of frequency containment reserve provision with battery energy storage systems in the german market. J. Energy Storage 2017, 13, 143–163. [Google Scholar] [CrossRef]
  22. Muenderlein, J.; Steinhoff, M.; Axelsen, H.; Sauer, D.U. Planning, building, efficiency measurement and determination of forecast data of a grid-scale hybrid 5 MW / 5 MWh battery storage system. In Proceedings of the 2017 IEEE International Telecommunications Energy Conference (INTELEC), Broadbeach, QLD, Australia, 22–26 October 2017; pp. 314–320. [Google Scholar]
  23. Institute for Power Generation and Storage Systems (RWTH Aachen). Modularer multi-Megawatt multi-Technologie Mittelspannungs-batteriespeicher (M5BAT): Abschlussbericht, Datenblätter sowie weiteres Aktenarchiv; Aachen University: Aachen, Germany, 2018. [Google Scholar]
  24. SMA Solar Technology AG. Betriebsanleitung—SUNNY CENTRAL STORAGE 500 / 630/720/760/800/850/900/1000. Available online: https://files.sma.de/downloads/SCS500-1000-DDE1610-V21web.pdf (accessed on 12 February 2022).
  25. J. Schneider Elektrotechnik GmbH. Data Sheet, “HSGX 1260F-1605T06001 Dreiphasen—Hochspannungstransformator”; J. Schneider Elektrotechnik GmbH: Offenburg, Germany, February 2016. [Google Scholar]
  26. Ecker, M.; Nieto, N.; Käbitz, S.; Schmalstieg, J.; Blanke, H.; Warnecke, A.; Sauer, D.U. Calendar and cycle life study of Li(NiMnCo)O2-based 18650 lithium-ion batteries. J. Power Sources 2014, 248, 839–851. [Google Scholar] [CrossRef]
  27. regelleistung.net: Internetplattform zur Vergabe von Regelleistung. Available online: https://www.regelleistung.net/ (accessed on 12 February 2022).
  28. Schmalstieg, J.; Käbitz, S.; Ecker, M.; Sauer, D.U. “From accelerated aging tests to a lifetime prediction model: Analyzing lithium-ion batteries. In Proceedings of the 2013 World Electric Vehicle Symposium and Exhibition (EVS27), Barcelona, Spain, 17–20 November 2013; pp. 1–12. [Google Scholar]
  29. Sabet, P.S.; Warnecke, A.J.; Meier, F.; Witzenhausen, H.; Martinez-Laserna, E.; Sauer, D.U. Non-invasive yet separate investigation of anode/cathode degradation of lithium-ion batteries (nickel–cobalt–manganese vs. graphite) due to accelerated aging. J. Power Sources 2020, 449, 227369. [Google Scholar] [CrossRef]
  30. Sauer, D.U. Optimierung des Einsatzes von Blei-Säure-Akkumulatoren in Photovoltaik-Hybrid-Systemen unter spezieller Berücksichtigung der Batteriealterung. Ph.D. Thesis, Universität Ulm, Ulm, Germany, 2009. [Google Scholar]
  31. Fleer, J.; Zurmühlen, S.; Badeda, J.; Stenzel, P.; Hake, J.-F.; Sauer, D.U. Model-based Economic Assessment of Stationary Battery Systems Providing Primary Control Reserve. Energy Procedia 2016, 99, 11–24. [Google Scholar] [CrossRef] [Green Version]
  32. Fleer, J.; Zurmühlen, S.; Meyer, J.; Badeda, J.; Stenzel, P.; Hake, J.F.; Sauer, D.U. Price development and bidding strategies for battery energy storage systems on the primary control reserve market. Energy Procedia 2017, 135, 143–157. [Google Scholar] [CrossRef]
Figure 1. Structural design of the battery system, the field test and the evaluation process.
Energies 15 01342 g001
Figure 2. M5BAT structure and connection diagram (own design according to [23]).
Energies 15 01342 g002
Figure 3. Average availability of the battery units and the LSS.
Energies 15 01342 g003
Figure 4. Monthly mean availability of battery units and LSS.
Energies 15 01342 g004
Figure 5. Share of the number of available battery units of the LSS with the associated, average storage energy capacity in MWh.
Energies 15 01342 g005
Figure 6. Distribution of the SOC of the LSS.
Energies 15 01342 g006
Figure 7. Distribution of the SOC for the different battery units.
Energies 15 01342 g007
Figure 8. Monthly average SOC of the battery units.
Energies 15 01342 g008
Figure 9. Distribution of the cell voltage for the different battery units.
Energies 15 01342 g009
Figure 10. Distribution of C-rate for the different battery units.
Energies 15 01342 g010
Figure 11. Monthly average C-rate of the battery units.
Energies 15 01342 g011
Figure 12. Development of the SOH transmitted by the BMS for the different battery units.
Energies 15 01342 g012
Figure 13. SOH of the battery units after four years according to capacity tests.
Energies 15 01342 g013
Table 1. Literature review on LSS with reference to field measurements.
SourceFCROther ApplicationsTechnologyHybridP (kW)E (kWh)
Koller et al. [15]Yespeak shaving, islanded operationLithiumNo1000580
Lo Schiavo et al. [16]YesAutomatic Frequency Restoration Reserve, Reduction of curtailed wind energyLithium basedYes52804640
YesNaNiCl222006150
YesLithium basedYes39003740
YesNaNiCl212004150
Swierczynski et al. [17]YesWind smoothingLFPYes400100
YesLTO1200300
Dubarry et al. [18]YesWind smoothingLTONo1000250
Eckert et al. [19]NoVoltage regulation, black start, islanding operationLMONo1000500
Karoui et al. [20]NoSelf-consumption maximisation, Peak ShavingLithiumNo9461196
NoLithiumNo44004308
NoNaNiCl2No49956336
NoNaNiCl2No100188
Thien, Muenderlein et al. [21,22]Yes/LMO, LFP, LTO, Lead-AcidYes59126455
Table 2. Technical information on the different battery units and technologies [23].
Battery UnitTechnologyAcronymWiringDCAC
Capacity in Ah 1Energy in kWh 1Energy in kWh 2Power in kW 2
1OCSMPb1300s1p177610661030617
2OCSMPb2300s1p177610661030617
3OPzVPb3308s2p1368843814617
4OPzVPb4306s1p1209740715512
5LMO/NMCLMO1192s16p1088774748617
6LMO/NMCLMO2192s16p1088774748617
7LMO/NMCLMO3192s16p1088774748617
8LMO/NMCLMO4192s16p1088774748617
9LFP LFP240s10p933738713617
10LTO LTO312s32p320230222617
1 Specified for a C-rate of 1/3; 2 Including average transformer and inverter losses.
Table 3. Voltage limits and nominal voltage of the battery units according to the manufacturer’s specifications [23].
Battery UnitOperating Limits in VCut-Off Limits in VNominal Voltage in V
Pb11.72.41.432
Pb21.72.41.432
Pb31.72.41.42.92
Pb41.72.351.42.92
LMO134.12.74.123.7
LMO234.12.74.123.7
LMO334.12.74.123.7
LMO434.12.74.123.7
LFP2.83.452.53.653.2
Publisher’s Note: MDPI stays neutral with regard to jurisdictional claims in published maps and institutional affiliations.

