1. Introduction
With the Paris Climate Agreement and the goal of limiting the global annual temperature increase to 1.5 °C, the EU and Germany have now set themselves the goal of being climate-neutral by 2050 [
1,
2,
3]. In order to achieve this goal, both the EU and the German government have a hydrogen (H
2) strategy for the integration of CO
2-neutral—in long-term only renewable—H
2 [
4,
5]. The transfer of climate-neutral, renewable energy (RE) produced by sources such as solar or wind power to the consumption sectors is made possible by sector coupling [
6,
7,
8]. Power-to-gas (PtG) technology is of central importance for a systemic solution, as it fulfils the functions of a flexibility option and a long-term storage option for electricity and can provide CO
2-neutral substitutes for gas and fuels in the form of H
2 or methane for usage in other consumption sectors [
6,
9]. Thus, green H
2 enables the defossilization of power production, as well as the reduction in emissions in other sectors, such as heat, industry and transportation [
10,
11,
12,
13,
14]. H
2 will play an important role in reaching climate goals in some sectors and applications [
15]. Therefore, PtG technologies—as one sector-coupling technology—will play a crucial role in the defossilization of the energy system [
16]. However, the use of H
2 from PtG has also drawbacks. For example, direct electrification is more efficient [
17], and the optimal system design remains unclear. Given these aspects, this paper helps to assess possible operation modes of electrolysis and whether changes in the regulatory, market or technical framework can support the realization of the necessary contribution of PtG to the energy transition.
1.1. Definition of Power-to-Gas
The term PtG is used to refer to several different concepts and processes. PtG technology is based on the electrolysis process. Electrolysis for converting electricity into H
2 is the core technology of PtG. Some concepts include further processes in which H
2 is processed into methane (synthetic natural gas (SNG/CH
4)) or into fuels (synthetic fuels (SF)) [
9,
16,
18]. An overview of PtG technologies and its concepts is shown in
Figure 1, according to Zapf (2017) and Adolf et al. (2017) [
19,
20]. In the following, the term PtG refers only to the conversion of renewable electricity into H
2. To align with the goals of sector coupling, it is assumed that electricity consumed from the grid is renewable from a balanced perspective in the base year. For the year 2050, we assume a 100% renewable electricity supply.
In theory, PtG can take on different functions. The technology can be used as a flexibility option to balance fluctuating RE generation or to produce large quantities of H
2 to replace fossil fuels. In practice, the function of PtG lies between the two extremes [
21].
As a flexibility option, PtG offers an advantage for the energy system regarding the higher fluctuation of energy production in a renewable power sector. The necessary flexibility is provided by the demand side through PtG. In this context, PtG as a flexibility option also offers a storage option for electricity. PtG can offer the opportunity to use chemical storage to shift energy into periods with low supply of RE sources both in the short and long term. Thus, PtG is a flexibility option for fluctuating RE sources in cases of high power production but low demand and/or in cases of local power-grid congestion [
22,
23]. The flexible operation mode allows for the storage of H
2. In of higher demand than can be met by renewable power production (e.g., dark doldrums), a reconversion to electricity is possible.
Produced H
2 can be exported [
9], and PtG is used for the defossilization of sectors beyond the power sector. It is possible to feed PtG as admixture into the gas network or to export pure H
2. In addition, produced H
2 can be used to meet an existing or future demand for H
2. The latter results from potential use in the sectors such as heating, industry or traffic. The demand can be material or energetic [
9,
24,
25].
Given these facts, a need for H2 exists. The necessity can be explained by the necessary defossilization, as well as the increasing need for flexibility in the energy system. However, the respective regional deployment and operation mode must be investigated.
The regional expansion of electricity generation based on renewable energies causes a change in the regional energy balance. Regions with high installed renewable-energy (RE) generation capacity have energy quantities that exceed their local energy demand. In Germany, for example, this is the case in regions with high wind-energy potential in the north. The German federal state of Mecklenburg-Vorpommern (MV) in the northeast had the highest share of RE in gross electricity consumption of 147% among the German states in 2016 [
26]. Due to the volatile feed-in, there are deviations between RE supply and energy demand during the year, with the extent of these differences varying from region to region. As one consequence, the resulting operating mode for electrolyzers may differ between an urban region and a rural region. In addition to the difference in demand quantity and structure, the installed RE power capacity and generation in each region must also be considered [
27].
1.2. Power-to-Gas in the Energy System
There is extensive literature on PtG in energy systems. Most studies address the potential of PtG at the global or national level of energy-system analysis. In contrast, the analysis of local, decentralized energy systems is less prominent and is mostly based on one concrete, local use case (see
Table 1 and
Table 2).
Sterchele et al. (2020) examined the development of the German energy system to achieve the 2050 emission-reduction targets. Technical feasibility, costs and change in societal behavior were considered, showing that climate targets can be achieved. Green H
2 is a key energy carrier in an RE system [
37].
Further energy-system studies for Germany come to comparable conclusions. The energy-system analysis by Kelch et al. (2019) focused on potential energy autarky by 2030 in two exemplary communities. The focus lay on the electricity and heat sectors. The authors showed that an autarky level of 80% can be achieved with an energy system based on RE. Sector coupling is an important part. However, PtG was not part of the analysis [
38].
Prognos et al. (2020) [
32], Fraunhofer ISI et al. (2021) [
29], Robinius et al. (2020) [
30], Dena (2018) [
31], Fraunhofer ISI et al. (2017) [
28] and RLI (2013) [
40] also have in common that they analyzed long-term greenhouse-gas reductions. Electrolyzers play an essential role in ambitious reduction scenarios. The reconversion of H
2 into electricity to provide flexibility for the system is also seen as central element in the future. H
2 based on electrolysis as a chemical-energy carrier is the starting point for the defossilization of further sectors in the case of greenhouse-gas-neutral scenarios. Thus, two roles for PtG are addressed in system studies: on the one hand, the permanent provision of H
2 as an energy carrier; on the other hand, PtG enables provision of the required flexibility for the system. The exact role in decentralized energy systems remains without detailed analysis in all studies. Changes in the legal and policy framework are rarely (or only in very general terms) considered, without specifically addressing PtG.
In its potential atlas for PtG, Dena (2016) examined existing utilization options. In addition, the authors discussed the short- and medium-term market development of the technology. Market opportunities for PtG were identified in all consumption sectors. Necessary recommendations for action were made, especially in the regulatory area. Concrete approaches for regional implementation or the value creation in the decentralized energy system were missing [
33].
The potential study by Zdrallek et al. (2018) goes into detail about the potentials in distribution networks. The study aimed to estimate the potential of current and future installation and operation of PtG plants in German electricity- and gas-distribution networks. Nine municipal classes are analyzed with regard to their typical supply tasks of electricity and gas networks. Increasing gas consumption results in greater technical potential and savings in network-expansion costs. Economic revenue potential was found to exist in only one of the municipal classes, and possible regulatory changes were addressed. No statements were made on the specific role or function of the PtG system at the decentralized level [
34].
Schröer et al. (2015) investigated PtG technology in a model-based manner at the decentralized level. Different configurations and autarky lines of supply were considered. The use of H
2 storage, fuel cells or direct H
2 injection into the gas grid, as well as power exchange across the system boundary of the model region, were not considered in the model. PtG was identified as an important system component in distributed energy systems [
35].
Hey (2012) also dealt with another concrete PtG use case. He investigated storage options for surplus electricity and components of demand-side management. He considered to what extent a PtG plant is capable of providing control energy as a system service. In addition, he also analyzed the contribution to balancing forecast deviations in wind -energy feed-in. The integration of PtG plants into an energy system was not included in the model [
36].
Andresen and Schmitz (2016) investigated the suitability of PtG as a storage option using an application in Hamburg. The focus lay on the design and the technical simulation of a PtG plant. The investigation showed that the dimension of a PtG plant strongly depends on given boundary conditions and restrictions. H
2 storage was identified as a necessary component. Repercussions and interactions with the (local) energy system were not part of the analysis [
39].
In summary, the focus of all investigations was either energy-system analysis or PtG technology. In energy-system analyses, the focus was rarely on distributed generation. PtG was not the exclusive focus in any case and was not even considered in some analyses. The modelling of PtG only addressed specific use cases. They are short-term-oriented and only refer to the long-term time horizon up to 2050 in some studies. Only the study by Zdrallek (2018) [
34] and the work of Schröer et al. (2015) [
35] focused on both distributed energy systems and PtG. Furthermore, it is unclear how the legal, policy, and technical framework will affect the deployment of PtG in regional energy systems.
In this context, this paper investigates which operation mode of PtG (H2 generation or system flexibility) is primarily realized and whether there could be a profitable use case. In addition, the influence of the regulatory market and technical framework on the use of PtG must be considered. The regional consideration of municipalities enables a more detailed analysis of specific operating modes and the impact of the regulatory market and technical framework on PtG. This will be analyzed in the context of different regional supply tasks, which are defined by the exploitation of regional RE potentials, regional electricity demand and potential H2 demand. This question will be answered by using the operating modes of PtG in the local energy system.
For this purpose, this paper is structured in the following way:
Section 2 provides an overview of the methods used. In
Section 3, the database used for analysis is discussed. The results of the investigated scenarios are presented in
Section 4. The operation mode of PtG in regional energy systems is presented in
Section 4.1, and the effect of regulatory measures is addressed in
Section 4.2. The results are then interpreted and discussed in
Section 5 and
Section 6, where the question of profitable use cases will be addressed, with our conclusions provided in
Section 7.
2. Method
The research questions are answered based on the modeling of decentralized energy systems. For this purpose, we focused on municipalities (the different regions) in Nordwestmecklenburg (NWM) county in the federal state of MV. The selection of representative municipalities within NWM was realized by applying a cluster algorithm.
The research question was then answered in the next three steps (
Figure 2) by modelling the different decentralized energy systems at different points in time (status quo and 2050 scenario) and by a criteria-based (key performance indicators) comparison of the regions. The open-source framework OEMOF was used for the modeling [
41]. We referred to levelized cost of H
2 (LCOH
2) to assess the potential profitability of the regional PTG system. Together with the operations hours and the use of local negative residual load, this was used as an indicator for the operation mode. The impact of the regulatory, market and technical framework was determined by varying the corresponding input parameters. The results provide information on the influence of specific measures discussed in the literature.
2.1. Cluster Analysis
The first step of analyzing and deriving basic statements about decentralized energy systems is the identification of representative municipalities. For this purpose, a cluster analysis of municipalities in NWM was carried out.
The literature presents examples of cluster analyses in which regions in Germany are clustered according to different criteria [
42,
43,
44,
45,
46]. To analyze decentralized energy systems, the studies use technoeconomic energy indicators at the municipal level [
47,
48]. With regard to decentralized energy systems, a wide range of possible parameters can be used. Typical data of decentralized energy systems are, for example, electricity, heat or fuel demand by consumption sectors; installed electricity or heat generation capacities; as well as social and geographic data, such as area, population or number of households [
42,
43,
47]. We also included information about the potential role of hydrogen for the municipalities in NWM in our analysis (see
Section 3.1).
First, a correlation analysis was carried out to identify independent indicators. This was to avoid bias due to overestimation of certain parameters. A strong correlation was assumed for a correlation coefficient above 0.9 [
42,
49,
50]. For the cluster analysis, only the independent indicators were used.
The aim of the clustering analysis was to identify clusters that that are heterogeneous among themselves and homogeneous within the cluster. In
Table 3, the relevant information about the cluster analysis is listed.
The Ward method was chosen as the cluster algorithm. It is a hierarchical-agglomerative method. The two clusters that produce the minimum increase in variance in the new cluster are merged. The aim is to minimize the loss of homogeneity that occurs by merging two clusters. The algorithm produces very homogeneous groups and is therefore considered the most powerful among the agglomerative procedures [
49,
51]. To verify the results, the clusters are checked with the K-Means algorithm in a final step [
51]. In both cases, the quadratic Euclidean distance is used to determine the similarity of objects based on the distance between two objects. Thus, the used statistic measure of similarity is one of the most frequently used approaches [
51].
Based on the cluster result, it was finally necessary to determine the number of clusters for further analysis of the decentralized energy systems. The elbow criteria and the test of Mojena were used to determine the number of clusters [
51]. For this purpose, the standardized fusion coefficient per fusion level was used. In conclusion, the representative examples for each cluster were selected.
2.2. Energy-System Modeling
An H
2-model was developed using the OEMOF framework, employing the oemof.solph module. OEMOF is a generic graph-based representation of the energy system. The model framework is modular, based on a linear optimization approach and designed for flexible modeling tasks [
41]. The framework is based on the Pyomo package. Pyomo is an open-source Python software package for optimization models [
52,
53]. Further information on the mathematical model formulations and the modular structure can be found in the documentation of OEMOF [
54]. Thus, OEMOF allows for a simple representation of energy systems (see
Figure 3).
We use the investment option to model the individual regional energy systems. The energy systems were optimized for the time horizon of the investigated year (status quo or 2050) in hourly resolution. The linear problem was solved by using the Gurobi solver [
55].
The applied energy-system model minimizes the total system costs over one year and takes seasonal fluctuations on the demand and supply side into account. According to Löffler et al. (2017) [
56] and Zerrahn and Schill (2017) [
57], we considered annuities for the investment costs, annual fixed costs and variable costs (e.g., fuel costs) for each component to determine the system costs. The mapped components include RE capacities, biomass combined heat and power (CHP) capacities, electricity import, PtG capacities, H
2 storage, reconversion and transport capacities for H
2 export. For each time increment, a price-inelastic demand for electricity and H
2 must be met. A description of the sets, parameters, scalars and variables used is given in the Appendix.
2.3. Key Performance Indicators
Further energy-related key performance indicators can be determined in post-processing of the model outputs. The analysis of the results included the following variables: full-load hours, installed capacity and the share of used negative residual load by the electrolyzers to indicate the operation mode. High full-load hours indicate a constant production of H2, and low full-load hours suggest a flexible operation mode. The installed capacity was used to further specify the result, as it is possible to indicate whether power peak-load situation of RE should be reduced by PtG. The share of used negative residual load also supports, in combination with the other two parameters, the analysis of the operation mode. A low share, together with a high installed capacity and few full load hours, bolsters the conclusion of a flexible operation mode. However, the same conditions, in combination with a high use of negative residual load, suggest a constant operation of H2.
We also focused on LCOH
2 to assess costs and, in a second step, the possible economic profitability. LCOH
2 enables the comparison of different production options or locations. Comparatively, low LCOH
2 means that H
2 can be produced at low cost. Such a location or production option has an advantage over others [
58,
59]. This allowed us to compare the regions with one another and to assess changes in the regulatory, market and technical framework. The calculated LCOH
2 values were also compared with values from other studies for further assessment.
LCOH
2 (Equation (1)) was calculated from the sum of the annuity costs of the investment and the annual fixed costs (
) of the PtG plant and the sum of the variable costs (
) divided by the annual H
2 production (
). We assumed that the variable cost and the production amount were constant over the years following the modelled year.
The annuity of the investment results from the investment module in OEMOF. In this case, the variable operating costs of the electrolyzer can be calculated from the local electricity costs. The electricity price (Equation (2)) (determined on a weighted basis according to the locally existing sources (
,
,
)). The electricity can be obtained from the upstream grid (electricity exchange price—
), the RE plants (
) or a biomass CHP unit (
).
This price time series represents the hourly local electricity costs. The local variable costs for the electrolyzer (Equation (3)) were derived by a multiplication of the hourly electricity demand of the electrolyzer and the hourly local electricity costs. For this purpose, the efficiency (
) of the electrolyzer was included.
2.4. Parameters to Assess Changes in the Regulatory, Market and Technical Framework
To answer the research question, the status quo and 2050 scenarios were used for each region. The input data are described below. In addition to the two observation points, further sensitivities were considered. The influence of parameters on the results of the status quo and 2050 scenario can be determined in this way (see
Table 4 for the varied parameters.) Thus, we can show whether the different possible operation strategies are robust solutions. Furthermore, this allows for the assessment of the regulatory framework.
Short-term H2 demand is a crucial parameter for investment in electrolysis capacities. An increase or decrease in the size of the sales market can significantly affect the profitability of PtG. From a political point of view, given quotas could boost the demand for H2. The variation of H2 export in the model allows for an assessment of the role of the current incentives for H2 export. Effects of subsidies were analyzed using a variation of the sales price.
Another influencing factor is electricity price components. We focused primarily on levies, such as grid-utilization fees or the EEG-Umlage (levy to promote renewable energy sources based on the German Renewables Act (EEG)) as crucial parameters. The variation has an influence on the exchange with the upstream electricity network and the electricity source of electrolysis. In addition, we looked at the influence of the electricity price in general by a manipulation of the variation of the applied wholesale electricity prices.
From a technical point of view, the operating strategy can be influenced by transportation networks. H2 demand is probably limited by demand and not by export facilities. Therefore, our focus was on measures in the electricity grid. Grid-expansion measures can have an impact on local capacity and operation.
3. Input Data
The input data are made up of three components.
Section 3.1 presents the regional energy-related data on the level of municipalities. These were initially included in the clustering and form the basis for the modelling of the energy systems in the representative municipalities. The data of the representative municipalities will be discussed in more detail after the presentation of the cluster results in
Section 4.2. General energy-market data are presented in
Section 3.2 and include information about electricity wholesale prices and potential hydrogen prices. The last component of the input data is technoeconomic data, which are presented in
Section 3.3 and include investment and operational cost information about the technologies used in the decentralized energy systems.
3.1. Regional Data
The subjects of this study were the municipalities in the region of NWM in the federal state of MV, Germany. For the modelling of decentralized municipal energy systems, data with high spatial resolution are necessary. The data basis is shown in
Table 5. The data consist of sociodemographic data and data concerning local demand and supply of energy for the year 2016 [
60]. All sectors (households, industry, commercial and mobility) were included. In addition, installed capacity and potential for decentralized (renewable) power plants were included in the dataset. The basis of the dataset was a bottom-up modelling for all municipalities in NWM [
61].
For the cluster analysis, all indicators shown in
Table 5 were used. For the OEMOF model of the different decentralized energy systems, the indicators for electricity and hydrogen systems were used. Energy-system modeling focuses on the electricity sector, as the electricity supply is crucial for the operation of an electrolyzer (as described above). Local energy supply was represented by the installed capacities of wind, solar energy (PV) and biomass. For the status quo, the installed capacities in 2016 were used. For the year 2050, we assumed a complete utilization of local RE potentials.
The feed-in profiles for wind and PV were based on weather data from Germany provided by the Open Power System Data (OPSD) platform [
62]. The same profiles were used for the status quo and 2050.
H2 demand was aggregated from the heat, industry and transport sectors. There are currently no standard load profiles for H2 supply. Thus, the distribution over time was based on sector-specific assumptions. The demand time revenues were also passed on to the model in hourly resolution.
To derive the H
2 demand in the heat sector, the heat demand of the household and the commercial sectors was used [
62]. Here, it is possible to derive the demand based on existing load profiles for gas. As these sectors are supplied via the gas grid, we considered the current limit between 2% and 20% of the gas-volume flow for the H
2 feed-in [
63,
64]. The feasibility of higher feed-in quotas was assumed for the future scenario.
The future annual H
2 demand in transport was developed based on the studies by e-mobil BW et al. (2013) and Prognos and thinkstep (2019) [
65,
66]. The energy demand can be determined based on the current number of inhabitants, the regional vehicle fleet, the expected share of H
2-based vehicles and the predicted annual mileage [
67,
68]. The temporal distribution of demand was based on Grüger et al. (2018) [
69]. In the first step, an H
2 demand profile for vehicle types was derived, which was transferred to the demand of H
2 filling stations in the second step. Based on this, it was assumed there is 20% less freight transport on Saturdays and none on Sundays due to the ban on non-essential truck driving on Sundays and public holidays in Germany (according to § 30 para. 3,4 StVO). For buses, 20% less traffic was assumed during weekends. The H
2 consumption of vehicles is also temperature dependent, considered a seasonal factor [
70,
71]. The sum of the demand groups results in the H
2 demand at petrol stations. It was assumed that supply is delivered by trailer.
Industry H
2 demand is made up of feedstock demand and energy demand. Feedstock H
2 demand mainly consists of refineries, ammonia and methanol production. Livestock fields are not located in the investigated regions. Thus, feedstock use was not considered in the aggregated H
2 demand The energy demand is to more than 85% driven by process heat [
72]. Thus, we concentrated on process heat in industry. The demand was estimated based on Naegler et al. (2016), Blesl and Kessler (2017) and Sterchele et al. (2020). The share of industrial process heat substituted with H
2- or H
2-based gases in the future (2050) was estimated at 40%. For the hourly resolution, a constant demand in the industrial sector was assumed, and a band-load profile of the local network operator, E.DIS Netz (2020), was used for the hourly resolution [
73].
3.2. General Energy-Related Data for All Decentralized Energy Systems
The costs for imported electricity and revenues for exported electricity were based on the day-ahead price for the German bidding zone. The price was stored as a time series (see
Figure 4). A trading surcharge of 10 €/MWh was applied to electricity exports in order to exclude arbitrage opportunities [
74]. The electricity price time series for Germany in the status quo was taken from the POMMES model [
75]. The mean price for the status quo was 28.98 €/MWh
el. For the year 2050, this time series was scaled with an assumed mean value of 40 €/MWh and a standard deviation of 1.9. Current demand was also taken from “ENavi” data [
76]. The temporal resolution was modelled using the standard load profiles (SLP) of the grid operator in the region, E.DIS Netz [
73].
In addition to the electricity price, regional electricity-grid capacities are also relevant. The local electricity demand can be covered by local RES or by imports from the transmission grid. A limitation was made for the estimated regional grid capacity. This was based on the maximal value of either the local load or the local RES generation supplied via the grid without congestion. In addition, a security surcharge of 60% was applied.
Imports and exports of H
2 in and out of a region were also considered. The results can be used to determine whether a region can supply itself with H
2 or act as an exporter. Filling-station prices for H
2 are currently 9.50 €/kg
H2, which corresponds to a price of 275 €/MWh
H2. Sterchele et al. (2020b) were in agreement with this number and stated that taxes and levies were included. Thus, we used this price for the import of H
2. For 2050, a reduction of around 54% was assumed [
77,
78,
79]. The export price was more complex, as only profit was considered. Thus, current levies, such as grid-usage fees or the EEG-Umlage and taxes must be subtracted [
80]. This results in income of 52 €/MW
H2 for the status quo. In the future, a reduction of around 54% was also assumed for export revenues. These values are also in line with other studies on future costs of H
2 products [
77,
81].
3.3. Technoeconomic Data
The cost of electricity from local wind and PV capacities was assumed to be zero. The biomass CHP plant was also represented by the existing capacity, based on the energy atlas [
60]. Electricity and heat generation were set at a ratio of 50:50 of the installed capacity, with electrical and thermal efficiency of 45% each. The variable costs of the CHP result from the fuel input. The required biomass was set at 30 €/MWh [
37,
77]. Other variable operating costs were neglected.
The electrolysis used in the model was based on PEMEL electrolysis. The byproducts of electrolysis, such as oxygen and waste heat, were neglected. The efficiency was assumed to be 67%. Based on Sterchele et al. (2020b), an efficiency increase to 73% was taken into account by 2050 [
77,
82]. For dimensioning of the electrolyzer, investment costs of 738 €/kW
el and 495 €/kW
el were assumed for the status quo and the future scenario, respectively [
37]. The annual fixed operating costs (OPEX) were set at a share of 3.5% and 3.9% [
77] of the total investment. In the literature lifetime ranges between 20 and 30 years [
36,
77], depending on the year under consideration. A life span of 20 years was assumed for the status quo and 30 years for the future scenario. assumptions of the weighted average cost of capital (WACC) range between 5 and 7% [
36,
37,
83], which is why a uniform WACC of 6% was chosen for all investment components.
The second investment component in our model is H
2 storage. The dimensioning of the storage tank has an influence on the dimensioning and operation of the electrolyzer and can therefore also be determined by an endogenous investment. In addition to the storage capacity, maximum injection and withdrawal rate, annual loss rate and initial maximum and minimum storage levels were considered. Injection and withdrawal were assumed to be ideal due to small losses in reality [
84,
85]. The ratio between the injection and withdrawal capacity and the storage capacity is another relevant parameter. An injection and withdrawal ratio of 0.5 was assumed for the modelling [
86]. The investment parameters of the H
2 storage system were taken from Sterchele et al. (2020b) [
77].
The third investment component is the reconversion option, the dimension of which also has an influence on the dimensioning of the electrolyzer. A gas turbine was applied, with an efficiency of 40%. The investment parameters were also based on the data from Sterchele et al. (2020b) [
77]. Information about the basic data for the investment components is provided in
Table 6.
4. Clustering
First, the results of the cluster analysis are presented, followed by a detailed description of the selected regions.
4.1. Results of the Cluster Analysis
In the correlation analysis, eight independent indicators were determined from the 25 indicators shown in
Table 5. The indicators used in the cluster analysis are shown in
Table 7.
Figure 5 shows the solution space for the choice of the number of clusters. Using the elbow criteria, the number of clusters is between five and eleven (red lines in
Figure 5). According to the test of Mojena, the optimal number of clusters is 15 (black line in
Figure 5).
However, it is also important that the differences between the final clusters can be described verbally. After further analyses of the data and the different numbers of clusters, the five-cluster solution was selected for the following analysis. It should be noted that the selected municipality-level spatial resolution is of a higher level of differentiation than in comparable cluster analyses [
47].
Figure 6 shows the municipalities in NWM, with different colors representing the clusters of the five-cluster solution.
Cluster 1 is, by far, the cluster with the most municipalities (58), including Zierow, a rural region with no wind power and low PV capacity, as representative municipality. Cluster 2 and 3 contain 12 and 14 regions, respectively. Cluster 2 is represented by Schildetal, a rural municipality with high wind-power capacity. Cluster 3 is represented by Grevesmühlen, a comparable urban municipality with some industrial demand, mean wind-power capacity and high PV (potential). There are two clusters with only one municipality each. Both regions are clearly differentiated from the other clusters. Cluster 5, the municipality Wismar, is clearly differentiated, as it is the only larger city with high demand in NWM. Cluster 4, Selmsdorf, is characterized by high installed wind-power capacities (like other rural regions) but with some electricity demand from the industrial sector.
The two single-region clusters could be regarded as outliers. To test whether the cluster result were stable, we repeated the cluster analysis without these two municipalities. In this case, the other clusters remained comparable to and homogeneous with the first result. This outcome of the cluster analysis corresponds with the results reported by Weinand et al. (2019) [
47]. In their study, the NWM region was also considered as a rather homogeneous region with only small differences between municipalities, supporting our choice of five representative regions.
4.2. Description of the Representative Municipalities
For further analysis, the municipalities shown in
Table 8 were considered. These are the representative municipalities of the five clusters (for more details see
Supplementary Materials).
Grevesmühlen and Wismar are two rather urban regions or regions with urban structures. In contrast, Schildetal, Selmsdorf and Zierow are rural regions with fewer inhabitants. Wismar has a comparatively high demand for electrical energy in the industrial sector. Grevesmühlen and Selmsdorf have comparatively average demand for electrical energy in the industrial sector, and Schildetal and Zierow have no noteworthy demand from industry. Compared with the rural region of Schildetal, there are neither existing nor potential capacities for wind power in Zierow.
In the following section, essential parameters for modelling the decentralized energy systems are presented. Existing capacity and potential for wind is higher in rural municipalities, such as Schildetal or Selmsdorf. In contrast, the installed capacity and potential for PV is higher in urban areas, such Wismar and Grevesmühlen. The rural municipality of Zierow is an exception, as wind power is non-existent, and the existing and potential capacities of solar power are small. The shares of installed and potential capacities of renewable energies in the municipalities are shown in
Figure 7.
The limitation for imports from the transmission grid and the estimated regional grid capacity are shown in
Table 9. As described in
Section 3.2, the maximal load in a municipality was used to assume the local transmission-grid capacity. In three of the five municipalities, installed RE drives grid capacities. In the city of Wismar, the load of electricity consumption is the critical factor that determines grid capacity. This is also the case in the rural municipality of Zierow; however, due to low electricity consumption, the required grid capacity is, by far, the lowest.
The hydrogen demand in the representative municipalities was calculated based on the information provided in
Section 3.1. In urban areas, such as Wismar and Grevesmühlen, with more demand from the industrial sector or the building sector, H
2 demand is higher than in rural municipalities (see
Figure 8).
5. Results
In the first step, the results (for details see
Supplementary Materials) of the operation mode were presented for the status quo and the year 2050. In the second step, the results of variation of the considered parameters were analyzed.
5.1. Operation Modes of Power to Gas
The operation mode differs between regions and the investigated years. Changes are observed in all the used key performance indicators.
5.1.1. Operation Modes in the Status Quo
In case of the status quo, the realized capacity of electrolysis does not significantly exceed the minimum capacity of 1 MW (see
Table 10). Only the regions of Selmsdorf and Schildetal, with the highest wind-power capacities, have a slightly higher capacity. The full-load hours are close to 6000 h or significantly higher. The municipality of Zierow shows a clear difference, the whole available capacity cannot be used. This is caused by the low grid capacity, in combination with low installed solar-power potential. The complete electrolysis capacity cannot be supplied by sufficient electricity.
Another aspect is that the entire negative residual load is not consumed by electrolysis in all municipalities. This effect can be explained by the option to export electricity for wholesale market prices. Prices for RE electricity are often higher than the price for H2.
Concerning the operation mode, the following can be concluded for the status quo: High full-load hours suggest that continuous production of H2 seems most attractive under current conditions. The main driver is the possible export of H2, as local demand is very low. However, an electrolysis operation does not appear to be sufficiently attractive, as only two regions have slightly more than 1 MW of capacity installed, and one region does not even use the whole 1 MW capacity. This region is Zierow, where 100% of the negative RL is used. Thus, is seems that under current conditions, a flexible operation mode can only be realized if grid capacity is low, and the electrolyzer depends on hours with cheap local RE surplus.
5.1.2. Operation Modes in 2050
The situation changes for the year 2050. In all regions, except Zierow, installed capacity is considerably greater than in the status quo (see
Table 11). Differences are shown in full-load hours and the produced amount of H
2. The increase in electrolysis capacity is caused by the increase in regional demand for H
2. Larger peaks of RE production also contribute to higher installed capacity.
In 2050, local H2 demand has a greater impact on the operation mode. In regions with high H2 demand in 2050, production is drastically higher than in the status quo (see Wismar and Grevesmühlen). More rural regions show an equal or even lower H2 production in 2050. In addition, the share of the used negative residual load is significantly lower in these regions.
The operation mode is still represented by constant production in three out of five regions. Only the rural region of Schildetal shows another operation mode and is the region with the second largest installed capacity (12.7 MW) but by far the lowest full-load hours (840). The operation is flexible in that most of the electricity (94.3%) for electrolysis is provided by the negative residual load of local RE sources. In 2050, the municipality of Zierow is still limited by low RE potential and low grid capacity. Thus, the local electricity supply limits the operation of electrolysis and causes a rather flexible operation mode, as hydrogen is produced by PV at times with local supply peaks.
5.1.3. LCOH2 in the Status Quo and the Year 2050
A more detailed look at LCOH
2 (see
Table 12) shows differences depending on the electricity and H
2 demand. In regions with high electricity and H
2 demand, PtG is used for local H
2 production, and parts of the negative RL are absorbed by the electrolyzer. Operation is based on H
2 demand and is less influenced by electricity prices. Local production is not always the cost-optimal solution, and H
2 imports are more relevant. On the other hand, if local electricity demand can be completely covered by RE, cheaper H
2 production is possible. This is only the case in Selmsdorf and Schildetal, where H
2 demand and export possibilities can be completely covered by local RE. This is demonstrated by the lower LCOH
2 compared to the average electricity price (
Section 3.1). If, in contrast, the local demand for H
2 is very low, the possibility of short-term export is limited, and high load peaks occur. PtG is only used to minimize costs in the event of negative or low electricity-exchange prices. In extreme cases, this results in the entire electrolysis capacity not being used, as is the case in Zierow, which is why LCOH
2 values are particularly high there.
In the Selmsdorf region, demand is low, and increased electricity prices in 2050 lead to a preferential export of RE surpluses. In this region, LCOH2 values are lower. Simultaneously, it is the only region with LCOH2 values that are lower than the average electricity price. Likewise, there is no use for H2 in Schildetal and Zierow due to a lack of local H2 demand and limited export potential. Therefore, electrolysis is used exclusively for total system-cost minimization when electricity prices are negative or low. In the case of Schildetal, this operation mode results in only a few full-load hours, which is why the local LCOH2 values increase to 90.23 €/MWhH2. The decrease in the case of Zierow can be explained by the fact that in 2050, the whole capacity of electrolysis is used, and no overcapacity exists.
5.2. Variations of the Parameters
The results of the base scenario show that a constant production is the best operation mode in most cases. In addition, under current conditions, there seems to be no incentive to build large H2 capacities.
5.2.1. Local H2 Demand
Variation of the (local) H2 demand indicates a change in the operation mode. Electrolysis is used with a higher number of full-load hours if the LCOH2 is below the import price of H2. More full-load hours also cause a reduction in LCOH2. This is driven by the increased use of local RE generation instead of exporting the electricity. It should be noted that this would reduce the yields of local RE generation, but electrolysis can be operated more profitably. Consequently, export opportunities, which act as demand drivers, have a particular impact.
5.2.2. H2 Price Subsidization
This leads to another relevant driver of the operating mode: the achievable price for H2. An increase in the assumed sales price of 52 €/MWH2 in the status quo and 24 €/MWH2 in 2050 increases the incentive for the model to produce H2. Its influence depends on the original LCOH2 level compared to the original H2 and electricity wholesale price. As long as the profit margin for exchange sales is greater than the difference between LCOH2 and H2 price, the model favors selling the electricity. In regions with already low LCOH2, these costs will only start to decrease when it becomes more attractive to purchase local renewable electricity for PtG. In regions with high LCOH2, the H2 price must at least compensate the electricity price. This is reasoned by the fact that before this threshold is reached, the sale of H2 results in losses.
The exact H2 price at which the penny-switching effect occurs varies from region to region due to varying local LCOH2. An increase in H2 price of 50% increases the operating time of the electrolyzer and, because of longer operating hours, LCOH2 decreases, on average, by 42.9%.
5.2.3. Electricity Price Components
It should be noted that electricity consumption in the status quo and in 2050 was initially modelled without regard to the variation in electricity price components. Thus, quasi-ideal conditions were assumed, and the variation focused on the impact of assuming higher electricity prices. For example, grid charges for importing electricity increase the incentives to use local RE electricity. This is the case in all regions, as the complete local negative residual load is not consumed by PtG. However, the effect only occurs if local RE electricity is not charged with electricity price components. In this case, the LCOH2 declines. However, if local RE cannot fully replace previously imported electricity, LCOH2 increases, as it cannot offset the higher electricity-import costs.
5.2.4. Electricity Price Variation
Fluctuations in exchange electricity prices are also a relevant variable influencing the operation and the function of PtG. This is particularly evident in low-demand but high-supply communities, where PtG is increasingly used as an arbitrage device in response to price signals. Consequently, underlying electricity prices and prominent fluctuations are central to the operation and local LCOH2.
5.2.5. Electricity Grid
The capacity of the electricity grid was the last influencing factor that we investigated. The capacities for exchange with the transmission grid have an influence on the local use of the RE sources and thus on the utilization of electrolysis and LCOH2. It was found that depending on regional renewable capacities and energy demand within the energy system, either electricity import or electricity export is decisive for the change in LCOH2.
In regions such as Zierow, limited grid capacity causes high LCOH2, as local RE capacities are rather scarce. Thus, electrolysis cannot be supplied with sufficiently cheap electricity from the wholesale market, and the investment costs are not justified by high-capacity utilization. In the case of a 50% higher grid capacity, LCOH2 drops to 78.81 €/MWh in the status quo. The decline to 72.99 €/MWh in 2050 is rather small, since local RE capacity in 2050 is almost sufficient to supply electrolysis with cheap electricity.
In contrast, Schildetal, with a large surplus of renewable electricity, is affected by export restriction of the grid. The restriction of export possibility leads to an increased use of renewable electricity in local electrolysis. Consumption of cheap electricity and increased full-load hours lead to a drop in LCOH2 and can improve the economic efficiency of the plant. However, this effect is counteracted by increased capacity of electrolysis and higher investment costs in the case of increased availability of cheap energy. Thus, in Schildetal, with a reduction in export capacity by 50% of regional electricity consumption, the installed PtG capacity increases by a factor of 6.4 in the status quo and 3.5 in the year 2050. Thus, LCOH2 doubles in the status quo to 56.99 €/MWh due to the higher investment cost and falls to almost one-third of the original cost (33.54 €/MWh) in 2050, when the renewable electricity surplus is significantly higher.
In regions with low renewable generation and high demand, such as Grevesmühlen, restriction on the import side causes this change. Regarding regions with high electricity demand, limitation of electricity purchase is primarily used to meet local electricity demand and is not available to optimize the operation of electrolysis. Consequently, increased H2 imports are necessary to meet local H2 demand, and the local use of electrolysis becomes unattractive. In the status quo, the capacity of the electrolysis is not changed, and maintains a minimal capacity of 1 MW. In the year 2050, a reduction in import capacity by 50% leads to a capacity of 63.7% of the original capacity. Nevertheless, LCOH2 is not much affected and increases in the status quo by 7% to 41.3 €/MWh and decline significantly in the year 2050, by 17.5% to 34.91 €/MWh.
6. Discussion
The discussion interprets the results of the decentralized energy systems for the five exemplary regions. First, we look at the operation modes. Secondly, we focus on the influences of the key performance indicators. Thirdly, we discuss limitations regarding the chosen method.
6.1. Operation Modes of Power to Gas
The prevailing mode is constant H2 production. In 2050, all but one region exhibit constant H2 production. This effect is mainly driven by H2 demand, with regional H2 demand increasing in the future. In regions such as Wismar and Grevesmühlen, with the highest demand for H2, the dimensioning of the electrolyzer is larger, although operation requires additional and more expensive electricity imports. The running costs increase, and the investment costs of PtG are higher. This consequence cannot be fully compensated for by increased utilization, which is why LCOH2 is above average wholesale electricity price in both scenarios for Wismar and Grevesmühlen. In Zierow, limited RE and grid capacities drive the dimensioning of the electrolyzer and storage. Additionally, the local sales potential and export opportunities for H2 are low, and the profits are higher when most of the renewable electricity is sold.
The constant operation mode can be also be evaluated based on the key performance indicator of LCOH2. In the status quo, LCOH2 is comparably low in all regions. The higher cost in Wismar (55.63 €/MWhH2) can be explained by low RE capacities and considerable import of electricity. The LCOH2 in 2050 also supports the assumption of a constant H2 production in most of the regions.
Only in Schildetal we can observe a flexible operation of PtG due to high LCOH2, in combination with low full-load hours and a small share of used negative RL. Additionally, the key performance indicator of full-load hours only indicates a flexible operation mode in the region Schildetal in 2050. Thus, the impact of local RE generation and electricity prices, which should cause a rather flexible operation mode, is low. This can be explained by the fact that local negative residual load is not completely consumed by local electrolysis capacity, even if it is available at zero cost. This conclusion is also supported by the key performance indicator, share of negative RL. On the one hand, this is due to the revenue opportunities associated with exporting surplus RE electricity, especially when exchange electricity prices are high. On the other hand, in the case of very high load peaks (e.g., in Schildetal), investments for the expansion of electrolysis capacity and other components cannot be covered by the possible income.
6.2. Variations of the Parameters
Nevertheless, the future energy system of Germany needs flexibility options. PtG is supposed to be one of them; however, the results suggest that the existing incentives do not promote it realization in regional energy systems. In both investigated years, just one region shows a flexible operation mode. Variation of the regulatory, market and technical framework in
Section 4.2 indicated that specific changes in parameters promote a flexible constant operation mode.
Firstly, increasing H2 demand and subsidized H2 price promote constant production, as they foster the importance of H2. Nevertheless, both options promote the profitability of PtG, as they support an increase in full-load hours, thereby reducing LCOH2.
Secondly, a change in electricity price components is suitable to support a flexible operation mode. This is shown by a variation of constant price components, as well as variation of electricity prices. Higher price components, such as grid-usage fees, support the use of local RE and, if set right (e.g., in a flexible way), they can lead to the use of local RE peaks for electrolysis instead of exporting the power or ending RE power production. Thus, an adaptation of a grid-fee design may help to realize the necessary flexibility for energy systems at a local level. Higher price peaks on the electricity market work in a similar way. A wider spread of power prices offers an arbitrage option in response to price signals. Thus, price peaks (positive and negative) can be seen as a possibility to encourage a flexible operation mode.
Thirdly, the capacity of the electricity grid has a greater impact on LCOH2 than on the operation mode. Grid-capacity restrictions tend to use more local RE and foster constant production. The capacity of the electrolyzer is increased to absorb more power. It is worth mentioning that grid capacity is not likely to be reduced. However, the analysis can be seen in the context of constant grid capacity with increasing RE generation. A prerequisite for the use of local RE in PtG is that the power can be used at low cost and without grid-usage fees. The latter assumption was made based on the analysis of increasing electricity price components. In the case of low local RE cost for PtG and high RE generation, LCOH2 decreases. This contributes to better economic viability of PtG.
Finally, the question of profitable use cases is addressed. Green H
2 from PtG competes with H
2 from fossil sources. The main source of H
2 is currently steam reformation from methane at production prices between 2 and 3 €/kg [
87], with prices at fuel stations at 9.5 €/kg, including taxes and levies (see
Section 3.1). Given these facts, H
2 for PtG is still too expensive, as our LCOH
2 does not include further costs, such as transportation or storage. In the future, PtG could create a profitable application when the price of carbon leads to more expensive fossil H
2. Additionally, the analysis shows that competition with local RE generation also has an impact. PtG becomes more profitable if cheap and locally existing RE are used. However, if sales via the stock exchange are more attractive, this option will not be realized. Analysis of the electricity price components shows that changes in the regulatory framework could improve the economic situation in the future by decreasing LCOH
2.
6.3. Limitations and Further Research
One limitation of the presented model concerns LCOH
2. Real, local LCOH
2 differs from that used in the model due to the chosen system boundaries and assumptions. However, the calculated LCOH
2 is within the range or below that repored in other publications [
88,
89], and differences can be explained by our modeling approach, as we did not include all the cost components, and local electricity can be used at a variable cost of zero [
59,
90]. For 2050, the results are better than the best-case scenarios, which is due to increasing import-electricity prices, as electricity price is the main driver of LCOH
2 in the case of high full-load hours [
24]. Local RE generation is not consumed by PtG, as electricity export is more attractive economically. Thus, for the comparison of municipalities between time points, the key performance indicator of LCOH
2 is sufficient to provide information about which municipalities have more favorable conditions for H
2 production, as well as the resulting operating mode.
Variable RE costs represent a further limitation, as they were modelled at marginal costs of zero. In the model, local RE production can be sold (exported) at any time at the market price. In reality, operators of electrolyzers compete with the wholesale market and do not get local RE for free. This could be covered by implementing local electricity prices for every region.
Another approach could be to consider the levelized cost of electricity (LCOE) [
91] for local RE. This approach would change the picture provided in
Table 12 (see
Table 13). In this case, LCOH
2 increases in all regions in both cases: the status quo and the year 2050. Especially in regions with high RE consumption by the electrolyzer, the effect is crucial. Higher LCOH
2 would affect the competitiveness of PtG in a negative way.
However, the current electricity market is not designed to secure the earning of RE with respect to investment cost and to fund the LCOE. In a future energy system, this must be ensured to guarantee the necessary expansion of RE [
92,
93]. Future defossilized energy systems must cover this issue either on the electricity side, e.g., with further feed-in tariffs, or on the hydrogen side by an adequate consideration for the design of future hydrogen markets.
Furthermore, the model used fixed RE capacities. The future scenario did not consider any investment decision for the expansion of RE, as our focus was not on optimal expansion from the perspective of plant operators but on the operating strategy of electrolysis under given conditions. The mutual influence could be considered in a common investment model.
Lastly, the data availability for H
2 demand and transport capacities had an influence on the model results. There is a lack of appropriately resolved data at the local level, so assumptions were made. The influence was considered by analyzing the results with varying parameters in
Section 4.2. Nevertheless, specific data with good spatial and temporal resolution would lead to more accurate results. The addressed points can be improved in further studies and must be considered in the interpretation of the presented results.
7. Conclusions
The energy transition and the shift towards a climate-neutral energy system is a major challenge. Sector-coupling technologies, such as PtG, can play a curial role regarding the transfer of climate-neutral energy produced by sources such as solar or wind power to consumption sectors. In decentralized energy systems, PtG can play a crucial role by offering flexibility to the system and acting as a greenhouse-gas-neutral energy carrier. In this paper, the two possible operating modes of flexibility or constant H2 production, as well as factors influencing the operation mode, were investigated
Investigation of the operation modes in decentralized energy systems was realized by a linear optimization model in OEMOF for the status quo and the year 2050 in five municipalities. The results were analyzed by using key performance indicators: levelized cost of hydrogen, full-load hours, used share of negative RL and installed capacity. Furthermore, changes in the regulatory, market and technical framework were investigated to observe possible changes in the operation mode of H2 production. To assess the impact of regulatory, market and technical framework, we focused on H2 prices, electricity prices and price components, as well as H2 demand and the demand affecting electricity exchange capacities.
In the status quo, the dominant operating mode is a constant H2 production, and in one region, a flexible operation mode is observed. The operation mode is driven by H2 demand, and low electrolysis capacities are sufficient to fulfill the demand. Higher demand leads to lower LCOH2, as the demand incentives higher full-load hours. This only applies if local RE provide sufficient power at low cost. In this context, electrolysis can also enable the local use of parts of the negative RL. The flexible operation mode is only realized if both electricity grid and local RE capacities are too small but local negative RL is available and can be used to reduce system costs.
In the year 2050, demand is higher, and this results in higher installed electrolysis capacities. The prevailing operation mode is constant H2 production, but under certain conditions, a flexible operation mode is observed. This is particularly the case in regions with relatively high RE capacities and low demand for electricity and H2.
The results show that determinants of the operation modes and LCOH2 in the different energy systems are local H2 demand, regional RE capacities, short-term export opportunities and arbitrage opportunities that exist through electricity wholesale prices. Depending on their interdependencies and the opposing income from electricity exports, local RE surpluses are used for local H2 production.
However, the LCOH2 is not competitive under current market conditions, even in regions that have better conditions for economic H2 production. Possible business models would probably not be viable under current market conditions, including all the neglected price components or cheaper H2 production pathways. H2 production costs are, in most cases, above the expected market prices for H2, especially for the year 2050. To enable profitable business models, locally generated renewable electricity must be available cheaply, or the price of H2 needs to be sufficiently high. The investigated variation of the regulatory, market and technical framework conditions shows that subsidized H2 price and changes in electricity price components, such as more flexible grid-usage fees, are good options. In this context, flexible grid-usage fees would also contribute to more flexibility, and we assume that adjustments towards flexible grid-usage fees are more likely to be realized than fundamental changes in the design of the electricity market. In contrast, the new market for green hydrogen should offer more opportunities to design it accordingly in order to realize defossilization, secure RE funding and support business cases for H2. Thus, the market will play a crucial role in the success of PtG. In order to realize profitable use cases in the future and to enable the potential of PtG to contribute to the energy transition, it is important to stimulate the identified parameters accordingly to fully utilize the local H2 potential of the regions. This requires a suitable incentive structure and the implementation of a new market design for green hydrogen. However, further research is needed to determine a suitable market design.
Supplementary Materials
The following are available online at
https://www.mdpi.com/article/10.3390/en15041322/s1. The folder of the Supplementary Materials consists of the part. In the first folder (Input_OEMOF) are the prepared inputs for the calculation of the municipalities in OEMOF. The second folder (Modell) contains the OEMOF code. The results can be found in the third folder (Output_OEMOF) of the Supplementary Materials folder.
Author Contributions
C.J., P.J. and J.G. developed the concept and the approach. C.J. built the model for the decentralized energy systems with support of J.G. and P.J. P.J. derived the different clusters and representative municipalities. C.J., J.H. and J.G. reviewed the literature. The structure of the paper was designed by J.G. and P.J. with the support of J.H. The main parts were written by J.G. and C.J with support of P.J. and J.H. Visualizations were created by C.J. and P.J., together with J.G. and J.H. J.G. managed the editing process. The final version was mainly revised by J.G. and P.J. and J.G. was responsible for responding to the reviewers’ comments and the editing process. All authors have read and agreed to the published version of the manuscript.
Funding
This article was written within the Copernicus project “Systemintegration: Energiewende-Navigationssystem (ENavi)” (funding code 03SFK4N0 and 03SFK4Y0 (BBHC)), funded by the German Federal Ministry of Education and Research (BMBF).
Informed Consent Statement
Not applicable.
Data Availability Statement
Not applicable.
Acknowledgments
We thank our colleagues, as well as reviewers for useful discussions and suggestions. The usual disclaimer applies. We would also like to thank Friederike Dobler, Flora v. Mikulicz-Radecki and Yannick Werner for contributing to the development of the approach and the paper in earlier stages, as well as Joachim Müller-Kirchenbauer for the input to the conceptualization and funding of the paper.
Conflicts of Interest
The authors declare no conflict of interest. The funders had no role in the design of the study; in the collection, analyses, or interpretation of data, in the writing of the manuscript, or in the decision to publish the results.
Abbreviations
| CHP | Combined heat and power |
| EEG | German Renewables Act |
| H2 | Hydrogen |
| MV | Mecklenburg-Vorpommern (federal state) |
| NWM | Nordwestmecklenburg (county) |
| LCOE | Levelized cost of electricity |
| LCOH2 | Levelized cost of hydrogen |
| OPEX | Operational expenditures |
| OPSD | Open power system data |
| PtG | Power to gas |
| PV | Solar energy/photovoltaics |
| RE | Renewable energy |
| SLP | Standard load profiles |
| SF | Synthetic fuels |
| SNG/CH4 | Synthetic natural gas |
| WACC | Weighted average cost of capital |
References
- Paris Agreement, UN. 2015. Available online: http://unfccc.int/files/essential_background/convention/application/pdf/english_paris_agreement.pdf (accessed on 13 July 2021).
- Bundesregierung, Bundes-Klimaschutzgesetz (KSG). Bundesesgesetzblatt Jahrgang 2019, Teil I Nr. 48, Bonn. 2019. Available online: https://www.bgbl.de/xaver/bgbl/start.xav?startbk=Bundesanzeiger_BGBl&start=//*%5B@attr_id=%27bgbl119s2513.pdf%27%5D#__bgbl__%2F%2F*%5B%40attr_id%3D%27bgbl119s2513.pdf%27%5D__1644300986728 (accessed on 13 July 2021).
- European Parliament. European Parliament Resolution of 15 January 2020 on the European Green Deal (2019/2956(RSP)). 2020. Available online: https://www.europarl.europa.eu/doceo/document/TA-9-2020-0005_EN.html (accessed on 13 July 2021).
- Bundesregierung, Die Nationale Wasserstoffstrategie. Bundesministerium für Wirtschaft und Energie (BMWi), Berlin. 2020. Available online: https://www.bmwi.de/Redaktion/DE/Publikationen/Energie/die-nationale-wasserstoffstrategie.pdf?__blob=publicationFile&v=20 (accessed on 13 July 2021).
- European Commission. A Hydrogen Strategy for a Climate-Neutral Europe, COM (2020) 301 Final, Brussels. 2020. Available online: https://ec.europa.eu/energy/sites/ener/files/hydrogen_strategy.pdf (accessed on 13 July 2021).
- Robinius, M.; Otto, A.; Heuser, P.; Welder, L.; Syranidis, K.; Ryberg, D.; Grube, T.; Markewitz, P.; Peters, R.; Stolten, D. Linking the Power and Transport Sectors—Part 1: The Principle of Sector Coupling. Energies 2017, 10, 956. [Google Scholar] [CrossRef] [Green Version]
- Hansen, K.; Breyer, C.; Lund, H. Status and Perspectives on 100% Renewable Energy Systems. Energy 2019, 175, 471–480. [Google Scholar] [CrossRef]
- Fridgen, G.; Keller, R.; Körner, M.-F.; Schöpf, M. A Holistic View on Sector Coupling. Energy Policy 2020, 147, 111913. [Google Scholar] [CrossRef]
- Sterner, M.; Stadler, I. Energiespeicher: Bedarf, Technologien, Integration; Springer: Berlin/Heidelberg, Germany, 2014; ISBN 978-3-642-37380-0. [Google Scholar]
- Bhaskar, A.; Assadi, M.; Nikpey Somehsaraei, H. Decarbonization of the Iron and Steel Industry with Direct Reduction of Iron Ore with Green Hydrogen. Energies 2020, 13, 758. [Google Scholar] [CrossRef] [Green Version]
- Chapman, A.; Itaoka, K.; Hirose, K.; Davidson, F.T.; Nagasawa, K.; Lloyd, A.C.; Webber, M.E.; Kurban, Z.; Managi, S.; Tamaki, T.; et al. A Review of Four Case Studies Assessing the Potential for Hydrogen Penetration of the Future Energy System. Int. J. Hydrog. Energy 2019, 44, 6371–6382. [Google Scholar] [CrossRef]
- McDonagh, S.; Deane, P.; Rajendran, K.; Murphy, J.D. Are Electrofuels a Sustainable Transport Fuel? Analysis of the Effect of Controls on Carbon, Curtailment, and Cost of Hydrogen. Appl. Energy 2019, 247, 716–730. [Google Scholar] [CrossRef]
- Zier, M.; Stenzel, P.; Kotzur, L.; Stolten, D. A Review of Decarbonization Options for the Glass Industry. Energy Convers. Manag. 2021, 10, 100083. [Google Scholar] [CrossRef]
- Salvi, B.L.; Subramanian, K.A. Sustainable Development of Road Transportation Sector Using Hydrogen Energy System. Renew. Sust. Energ. Rev. 2015, 51, 1132–1155. [Google Scholar] [CrossRef]
- Van Renssen, S. The Hydrogen Solution? Nat. Clim. Chang. 2020, 10, 799–801. [Google Scholar] [CrossRef]
- Götz, M.; Lefebvre, J.; Mörs, F.; McDaniel Koch, A.; Graf, F.; Bajohr, S.; Reimert, R.; Kolb, T. Renewable Power-to-Gas: A Technological and Economic Review. Renew. Energy 2016, 85, 1371–1390. [Google Scholar] [CrossRef] [Green Version]
- Mortensen, A.W.; Mathiesen, B.V.; Hansen, A.B.; Pedersen, S.L.; Grandal, R.D.; Wenzel, H. The Role of Electrification and Hydrogen in Breaking the Biomass Bottleneck of the Renewable Energy System—A Study on the Danish Energy System. Appl. Energy 2020, 275, 115331. [Google Scholar] [CrossRef]
- Schiebahn, S.; Grube, T.; Robinius, M.; Tietze, V.; Kumar, B.; Stolten, D. Power to Gas: Technological Overview, Systems Analysis and Economic Assessment for a Case Study in Germany. Int. J. Hydrog. Energy 2015, 40, 4285–4294. [Google Scholar] [CrossRef]
- Zapf, M. Stromspeicher und Power-to-Gas im Deutschen Energiesystem: Rahmenbedingungen, Bedarf und Einsatzmöglichkeiten; Springer: Wiesbaden, Germany, 2017; ISBN 978-3-658-15073-0. [Google Scholar]
- Adolf, J.; Balzer, C.; Louis, J.; Schabla, U.; Fischedick, M.; Arnold, K.; Pastowski, A.; Schüwer, D. Shell Hydrogen Study—Energy of the Future? Sustainable Mobility through Fuel Cells and H2. 2017. Available online: https://www.researchgate.net/publication/321332623_Shell_Hydrogen_Study_Energy_of_the_Future_Sustainable_Mobility_through_Fuel_Cells_and_H2 (accessed on 13 July 2021).
- Lehner, M.; Tichler, R.; Steinmüller, H.; Koppe, M. Power-to-Gas: Technology and Business Models, 1st ed.; SpringerBriefs in Energy; Springer International: Cham, Switzerland, 2014; ISBN 978-3-319-03995-4. [Google Scholar]
- Xiong, B.; Predel, J.; Crespo del Granado, P.; Egging-Bratseth, R. Spatial Flexibility in Redispatch: Supporting Low Carbon Energy Systems with Power-to-Gas. Appl. Energy 2021, 283, 116201. [Google Scholar] [CrossRef]
- Shu, K.; Ai, X.; Fang, J.; Yao, W.; Chen, Z.; He, H.; Wen, J. Real-Time Subsidy Based Robust Scheduling of the Integrated Power and Gas System. Appl. Energy 2019, 236, 1158–1167. [Google Scholar] [CrossRef]
- IEA. The Future of Hydrogen, Seizing Today’s Opportunities; Report prepared by the IEA for the G20, Japan; IEA: Paris, France, 2019. [Google Scholar]
- Kovač, A.; Paranos, M.; Marciuš, D. Hydrogen in Energy Transition: A Review. Int. J. Hydrog. Energy 2021, 46, 10016–10035. [Google Scholar] [CrossRef]
- Agentur für Erneuerbare Energien, Bundesländer-Übersicht Zu Erneuerbaren Energien. 2021. Available online: http://www.foederal-erneuerbar.de/uebersicht/kategorie/top%2010 (accessed on 28 May 2021).
- Möst, D.; Fichtner, W. Energiesystemanalyse: Tagungsband des Workshops “Energiesystemanalyse” vom 27. November 2008 am KIT Zentrum Energie, Karlsruhe; Universitätsverlagl: Karlsruhe, Germany, 2009; ISBN 978-3-86644-389-1. [Google Scholar]
- Fraunhofer ISI; consentec; ifeu; TU Wien; M-Five. TEP Energy GmbH Langfristszenarien für die Transformation des Energiesystems in Deutschland, Modul 0: Zentrale Ergebnisse und Schlussfolgerungen; Fraunhofer ISI: Karlsruhe, Germany, 2017. [Google Scholar]
- Fraunhofer ISI; consentec; ifeu. Technische Universität Berlin Langfristszenarien Für Die Transformation des Energiesystems in Deutschland 3—Kurzbericht: 3 Hauptszenarien; Fraunhofer ISI: Karlsruhe, Germany, 2021. [Google Scholar]
- Robinius, M.; Markewitz, P.; Lopion, P.; Kullmann, F.; Heuser, P.-M.; Syranidis, K.; Cerniauskas, S.; Schöb, T.; Reuß, M.; Ryberg, S.; et al. Wege für die Energiewende Kosteneffiziente und Klimagerechte Transformationsstrategien für das Deutsche Energiesystem bis zum Jahr 2050; ResearchGate: Berlin, Germany, 2020; ISBN 978-3-95806-483-6. [Google Scholar]
- Dena. Dena-Leitstudie Integrierte Energiewende, Impulse Für Die Gestaltung Des Energiesystems Bis 2050; Deutsche Energie Agentur: Berlin, Germany, 2018. [Google Scholar]
- Prognos; Öko-Institut; Wuppertal-Institut. Klimaneutrales Deutschland; Agora Verkehrswende und Stiftung Klimaneutralität: Berlin, Germany, 2020. [Google Scholar]
- Dena. Potenzialatlas Power to Gas. Klimaschutz Umsetzen, Erneuerbare Energien Integrieren, Regionale Wertschöpfungermöglichen; Deutsche Energie Agentur: Berlin, Germany, 2016. [Google Scholar]
- Zdrallek, M.; Krause, H.; Albus, R.; Moser, A. Potenzialstudie von Power-to-Gas-Anlagen in Deutschen Verteilungsnetzen—Abschlussbericht; DVGW: Bonn, Germany, 2018. [Google Scholar]
- Schröer, R.; Kötter, E.; Schneider, L. Die Rolle von Power-to-Gas in Der Zukünftigen Stromversorgung—Das Optimierte Stromversorgungsystem Bei Hohen Anteilen Erneuerbarer Energien Am Beispiel Der Modellregion Trier-Amprion 5—Abschlussbericht—BMWi-Verbundförderprojekt, 100%EE Durch PtG”; Reiner Lemoine Institute: Berlin, Germany, 2015. [Google Scholar]
- Hey, B. Power-to-Gas Als Möglichkeit zur Speicherung eines Energieüberangebots und als Bestandteil eines flexiblen Demand Side Managements. Master’s Thesis, Hamburg University of Applied Science, Hamburg, Germany, 2012. [Google Scholar]
- Sterchele, P.; Brandes, J.; Heilig, J.; Wrede, D.; Kost, C.; Schlegl, T.; Bett, A.; Henning, H.H. Wege Zu Einem Klimaneutralen Energiesystem—Die Deutsche Energiewende Im Kontext Gesellschaftlicher Verhaltensweisen; Fraunhofer ISE: Freiburg, Germany, 2020. [Google Scholar]
- Kelch, J.; Neumann, C.; Orozaliev, J.; Rusack, M.; Schnitzlbaumer, M.; Loessl, M.v.; Werner, F.; Wilkens, I.; Zass, K. Endbericht Forschungsprojekt Energieautarke Siedlung; Universität Kassel: Kassel, Germany, 2019. [Google Scholar]
- Andresen, L.; Schmitz, G. Bewertung von Power-to-Gas-Anlagen Mittels Dy-Namischer Systemsimulation. gwf-Gas + Energie 2016, 9, 682–689. [Google Scholar]
- Reiner Lemoine Institut. Vergleich und Optimierung von Zentral und Dezentral Orientierten Ausbaupfaden zu Einer Stromversorgung aus Erneuerbaren Energien in Deutschland; RLI: Berlin, Germany, 2013. [Google Scholar]
- Hilpert, S.; Kaldemeyer, C.; Krien, U.; Günther, S.; Wingenbach, C.; Plessmann, G. The Open Energy Modelling Framework (Oemof)—A New Approach to Facilitate Open Science in Energy System Modelling. Energy Strategy Rev. 2018, 22, 16–25. [Google Scholar] [CrossRef] [Green Version]
- Hammerschmidt, T. Entwicklung und Bewertung effizienter Netzkonzepte für Stromverteilnetze auf der Basis einer systematischen Analyse der Versorgungsaufgaben bis 2030; Reihe ie3—Institut für Energiesysteme, Energieeffizienz und Energiewirtschaft, 1st ed.; Sierke: Göttingen, Germany, 2013; ISBN 978-3-86844-543-5. [Google Scholar]
- Kühnbach, M.; Bekk, A.; Weidlich, A. Prepared for Regional Self-Supply? On the Regional Fit of Electricity Demand and Supply in Germany. Energy Strategy Rev. 2021, 34, 100609. [Google Scholar] [CrossRef]
- Wall, W. Energetisch Vergleichbare Städtegruppen—Eine Gesamtheitliche Clusteranalyse Und Clusterauswahl Deutscher Kreisfreier Städte Auf Basis Der Typischen Verbrauchssektoren Und Sozio-Energetischer Indikatoren; Schriftenreihe des Lehrstuhls für Energiesysteme und Energiewirtschaft; Selbstverlag des Lehrstuhls Energiesysteme und Energiewirtschaft; Ruhr-Universität Bochum: Bochum, Germany, 2016; Volume 37, ISBN 978-3-934951-41-9. [Google Scholar]
- Schultz, A.; Brandt, P. Demographietypisierung Für Kommunen. Methodisches Vorgehen Und Empirische Befunde—Berichtsjahr 2013; Bertelsmann Stiftung: Gütersloh, Germany, 2016. [Google Scholar]
- Kronthaler, F. A Study of the Competitiveness of Regions Based on a Cluster Analysis: The Example of East Germany; Institut für Wirtschaftsforschung Halle: Halle, Germany, 2003. [Google Scholar]
- Weinand, J.M.; McKenna, R.; Fichtner, W. Developing a Municipality Typology for Modelling Decentralised Energy Systems. Util. Policy 2019, 57, 75–96. [Google Scholar] [CrossRef] [Green Version]
- Scaramuzzino, C.; Garegnani, G.; Zambelli, P. Integrated Approach for the Identification of Spatial Patterns Related to Renewable Energy Potential in European Territories. Renew. Sust. Energ. Rev. 2019, 101, 1–13. [Google Scholar] [CrossRef] [Green Version]
- Kacperska, E.; Łukasiewicz, K.; Pietrzak, P. Use of Renewable Energy Sources in the European Union and the Visegrad Group Countries—Results of Cluster Analysis. Energies 2021, 14, 5680. [Google Scholar] [CrossRef]
- Sambandam, R. Cluster Analysis Gets Complicated—Collinearity Is a Natural Problem in Clustering. So How Can Researchers Get around It? Mark. Res. 2003, 15, 16–21. [Google Scholar]
- Backhaus, K.; Erichson, B.; Plinke, W.; Weiber, R. Multivariate Analysemethoden: Eine anwendungsorientierte Einführung, 14th ed.; Springer: Berlin/Heidelberg, Germany, 2016; ISBN 978-3-662-46076-4. [Google Scholar]
- Hart, W.E.; Watson, J.-P.; Woodruff, D.L. Pyomo: Modeling and Solving Mathematical Programs in Python. Math. Prog. Comp. 2011, 3, 219–260. [Google Scholar] [CrossRef]
- Hart, W.E.; Laird, C.D.; Watson, J.-P.; Woodruff, D.L.; Hackebeil, G.A.; Nicholson, B.L.; Siirola, J.D. Pyomo—Optimization Modeling in Python, 1st ed.; Springer International Publishing: Cham, Switzerland, 2017; Volume 67, ISBN 978-3-319-58819-3. [Google Scholar]
- Oemof Developer Group. Oemof.Solph—A Model Generator for Energy Systems—v0.4.1. 2020. Available online: https://zenodo.org/record/3906081#.Yf-znPgxk2w (accessed on 13 December 2021).
- Gurobi Optimization LLC. Gurobi Optimizer Reference Manual. 2020. Available online: https://www.gurobi.com/wp-content/plugins/hd_documentations/documentation/9.0/refman.pdf (accessed on 21 May 2021).
- Löffler, K.; Hainsch, K.; Burandt, T.; Oei, P.-Y.; Kemfert, C.; von Hirschhausen, C. Designing a Model for the Global Energy System—GENeSYS-MOD: An Application of the Open-Source Energy Modeling System (OSeMOSYS). Energies 2017, 10, 1468. [Google Scholar] [CrossRef] [Green Version]
- Zerrahn, A.; Schill, W.-P. Long-Run Power Storage Requirements for High Shares of Renewables: Review and a New Model. Renew. Sust. Energ. Rev. 2017, 79, 1518–1534. [Google Scholar] [CrossRef]
- Touati, K.; Tadeo, F.; Chae, S.H.; Kim, J.H.; Alvarez-Silva, O. Pressure Retarded Osmosis: Renewable Energy Generation and Recovery; Touati, K., Ed.; Academic Press: London, UK; San Diego, CA, USA, 2017; ISBN 978-0-12-812103-0. [Google Scholar]
- Demir, M.E.; Dincer, I. Cost Assessment and Evaluation of Various Hydrogen Delivery Scenarios. Int. J. Hydrog. Energy 2018, 43, 10420–10430. [Google Scholar] [CrossRef]
- Gemeindedaten Für Die Landkreise Nordwestmecklenburg Und Ludwigslust-Parchim, Sowie Der Stadt Schwerin, Regionaler Planungsverband Westmecklenburg. 2019. Available online: https://www.atlas-energie-wm.de/gemeindedaten.html (accessed on 13 December 2021).
- Dr.-Ing. Grüttner Energie Umwelt Strategie UG (haftungsbeschränkt). Aktualisierung Der Energie- Und Klimabilanz Für Westmecklenburg. Projektbericht. Im Auftrag Des Regionalen Planungsverbandes Westmecklenburg/Amt Für Raumordnung Und Landesplanung Westmecklenburg; Hohen Luckow: Schwerin, Germany, 2019. [Google Scholar]
- OPSD. Open Power Syste Data—A Free and Open Data Platfrom for Power System Modelling. 2020. Available online: https://open-power-system-data.org/ (accessed on 4 December 2021).
- DVGW. Mehr Wasserstoff technisch sicher verankern, Deutscher Verein des Gas- und Wasserfaches; DVGW: Bonn, Germany, 2019. [Google Scholar]
- Deutscher Bundestag. Grenzwerte für Wasserstoff (H2) in der Erdgasinfrastruktur; Deutscher Bundestag: Berlin, Germany, 2019. [Google Scholar]
- prognos; thinkstep. Potenziale für Wasserstoff in der Metropolregion Rhein-Neckar. 2019. Available online: https://www.thinkstep.com (accessed on 28 May 2021).
- e-mobil BW GmbH, Landesagentur für Elektromobilität und Brennstoffzellen-technologie; Fraunhofer-Institut für Solare Energiesysteme (ISE); Ministerium für Umwelt, Klima und Energiewirtschaft Baden-Württemberg; Ministerium für Finanzen und Wirtschaft Baden-Württemberg; Ministerium für Verkehr und Infrastruktur Baden-Württemberg. Wasserstoff-Infrastruktur für eine nachhaltige Mobilität—Entwicklungsstand und Forschungsbedarf; e-mobil BW GmbH: Stuttgart, Germany, 2013. [Google Scholar]
- Kraftfahrt-Bundesamt, Statistik Verkehr in Kilometern (VK)—Revisionsbericht, Flensburg, Germany. 2019. Available online: https://www.kba.de/DE/Statistik/Kraftverkehr/VerkehrKilometer/vk_revisionsbericht_2019_pdf.pdf;jsessionid=0B6735E0579338A810566E3FC2700121.live11313?__blob=publicationFile&v=1 (accessed on 28 May 2021).
- Statistisches Amt Mecklenburg-Vorpommern. Bevölkerungsstand der Kreise, Ämter und Gemeinden in Mecklenburg-Vorpommern, Statistische Berichte, Schwerin, Germany. 2018. Available online: https://www.statistischebibliothek.de/mir/receive/MVHeft_mods_00007963 (accessed on 28 May 2021).
- Grüger, F.; Dylewski, L.; Robinius, M.; Stolten, D. Carsharing with Fuel Cell Vehicles: Sizing Hydrogen Refueling Stations Based on Refueling Behavior. Appl. Energy 2018, 228, 1540–1549. [Google Scholar] [CrossRef]
- Wu, T.; Han, X.; Zheng, M.M.; Ou, X.; Sun, H.; Zhang, X. Impact Factors of the Real-World Fuel Consumption Rate of Light Duty Vehicles in China. Energy 2020, 190, 116388. [Google Scholar] [CrossRef]
- Lohse-Busch, H.; Stutenberg, K.; Duoba, M.; Liu, X.; Elgowainy, A.; Wang, M.; Wallner, T.; Richard, B.; Christenson, M. Automotive Fuel Cell Stack and System Efficiency and Fuel Consumption Based on Vehicle Testing on a Chassis Dynamometer at Minus 18 °C to Positive 35 °C Temperatures. Int. J. Hydrog. Energy 2020, 45, 861–872. [Google Scholar] [CrossRef]
- AGEB. Anwendungsbilanzen zur Energiebilanz Deutschland: Endenergieverbrauch nach Energieträgern und Anwendungszwecken; Detaillierte Anwendungsbilanzen der Endenergiesektoren für 2018 Und 2019 sowie zusammenfassende Zeitreihen zum Endenergieverbrauch nach Energieträgern und Anwendungszwecken für Jahre von 2009 bis 2019; AGEB: Berlin, Germany, 2020. [Google Scholar]
- Lastprofilverfahren, E. DIS Netz. 2020. Available online: https://www.e-dis-netz.de/de/energie-anschliessen/netznutzung-strom/lastprofilverfahren.html (accessed on 20 October 2021).
- Glenk, G.; Reichelstein, S. Synergistic Value in Vertically Integrated Power-to-Gas Energy Systems. Prod. Oper. Manag. 2020, 29, 526–546. [Google Scholar] [CrossRef]
- Pommesdispatch. A Bottom-up Fundamental Power Market Model for the German Electricity Sector. Kochems, J., Werner, Y., Giehl, J., Grosse, B., Eds.; 2021. Available online: https://github.com/pommes-public/pommesdispatch (accessed on 20 October 2021).
- Renn, O.; Grunwald, A.; Staiß, F.; Edenhofer, O.; Pahle, M.; Hufendiek, K.; Rodi, M.; Knodt, M.; Mack, B.; Matthies, E. Wegbeschreibungen Zum Klimaneutralen Energiesystem; Abschlussbericht 2019. Kopernikus-Projekt Energiewende-Navigationssystem|ENavi; Institute for Advanced Sustainibility Studies e. V. (IaSS): Potsdam, Germany, 2019. [Google Scholar]
- Sterchele, P.; Brandes, J.; Heilig, J.; Wrede, D.; Kost, C.; Schlegl, T.; Bett, A.; Henning, H.H. Wege Zu Einem Klimaneutralen Energiesystem—Die Deutsche Energiewende im Kontext gesellschaftlicher Verhaltensweisen, Anhang (Separate Appendix) Zur Studie 2020; Fraunhofer ISE: Freiburg, Germany, 2020. [Google Scholar]
- Möller, C.; Rosenberger, S.; Faulstich, M. Speicherbedarf in Energieregionen unter Berücksichtigung verschiedener Autarkiegrade. In Proceedings of the IEWT 2015, Wien, Austria, 11–13 February 2015. [Google Scholar]
- Fragen Zu H2-Kosten, Bezahlung & Rechnungen, H2 Mobility. Available online: https://h2.live/faq (accessed on 28 May 2021).
- BNetzA. Bundeskartellamt Monitoringbericht 2020, Monitoringbericht Gemäß § 63 Abs. 3 i. V. m. § 35 EnWG Und § 48 Abs. 3 i. V. m. § 53 Abs. 3 GWB, Stand: 27 January 2017. 2020. Available online: https://www.clearingstelle-eeg-kwkg.de/politisches-programm/5898 (accessed on 20 October 2021).
- Agora Verkehrswende; Agora Energiewende; frontier Economics. Die Zukünftigen Kosten Strombasierter Synthetischer Brennstoffe. 2018. Available online: https://www.agora-verkehrswende.de/veroeffentlichungen/die-zukuenftigen-kosten-strombasierter-synthetischer-brennstoffe/ (accessed on 20 October 2021).
- Milanzi, S.; Spiller, C.; Grosse, B.; Hermann, L.; Müller-Kirchenbauer, J. Technischer Stand und Flexibilität des Power-to-Gas-Verfahrens; Technische Universität Belrin: Berlin, Germany, 2018. [Google Scholar] [CrossRef]
- Matthes, F.; Heinemann, C.; Hesse, T.; Kasten, P.; Mendelevitch, R.; Seebach, D.; Timpe, C.; Cook, V. Wasserstoff sowie Wasserstoffbasierte Energieträger und Rohstoffe; Eine Überblicksuntersuchung: Berlin, Germany, 2020. [Google Scholar]
- Gabrielli, P.; Poluzzi, A.; Kramer, G.J.; Spiers, C.; Mazzotti, M.; Gazzani, M. Seasonal Energy Storage for Zero-Emissions Multi-Energy Systems via Underground Hydrogen Storage. Renew. Sust. Energ. Rev. 2020, 121, 109629. [Google Scholar] [CrossRef]
- Noack, C.; Burggraf, F.; Hosseiny, S.S.; Lettenmeier, P.; Kolb, S.; Belz, S.; Kallo, J.; Friedrich, A.; Pregger, T.; Cao, K.-K. Studie über die Planung einer Demonstrationsanlage zur Wasserstoff-Kraftstoffgewinnung Durch Elektrolyse mit Zwischenspeicherung in Salzkavernen unter Druck; DLR: Stuttgart, Germany, 2015. [Google Scholar]
- Klell, M.; Eichlseder, H.; Trattner, A. Wasserstoff in der Fahrzeugtechnik: Erzeugung, Speicherung, Anwendung, 4th ed.; ATZ/MTZ-Fachbuch; Springer: Wiesbaden, Germany, 2018; ISBN 978-3-658-20447-1. [Google Scholar]
- Jovan, D.J.; Dolanc, G. Can Green Hydrogen Production Be Economically Viable under Current Market Conditions. Energies 2020, 13, 6599. [Google Scholar] [CrossRef]
- IRENA. Hydrogen: A Renewable Energy Perspective, Report Prepared for the 2nd Hydrogen Energy Ministerial Meeting in Tokyo, Japan; International Renewable Energy Agency: Abu Dhabi, United Arab Emirates, 2019; ISBN 978-92-9260-151-5. [Google Scholar]
- Department for Business, Energy & Industrial Strategy. Hydrogen Production Costs 2021; Government Digital Service: London, UK, 2021. [Google Scholar]
- Parkinson, B.; Balcombe, P.; Speirs, J.F.; Hawkes, A.D.; Hellgardt, K. Levelized Cost of CO2 Mitigation from Hydrogen Production Routes. Energy Environ. Sci. 2019, 12, 19–40. [Google Scholar] [CrossRef]
- Kost, C.; Shammungam, S.; Fluri, V.; Peper, D.; Memar, A.D.; Schlegl, T. Stromgestehungskosten Erneuerbare Energien; Fraunhofer-Institut für Solare Energiesysteme ISE: Freiburg, Germany, 2021. [Google Scholar]
- Hu, J.; Harmsen, R.; Crijns-Graus, W.; Worrell, E.; van den Broek, M. Identifying Barriers to Large-Scale Integration of Variable Renewable Electricity into the Electricity Market: A Literature Review of Market Design. Renew. Sust. Energ. Rev. 2018, 81, 2181–2195. [Google Scholar] [CrossRef]
- Zipp, A. The Marketability of Variable Renewable Energy in Liberalized Electricity Markets—An Empirical Analysis. Renew. Energy 2017, 113, 1111–1121. [Google Scholar] [CrossRef]
Figure 1.
Power-to-gas concepts according to Zapf (2017) ad Adolf et al. (2017).
Figure 1.
Power-to-gas concepts according to Zapf (2017) ad Adolf et al. (2017).
Figure 2.
Four steps to answer the research questions.
Figure 2.
Four steps to answer the research questions.
Figure 3.
Components and structure of the regional energy-system model.
Figure 3.
Components and structure of the regional energy-system model.
Figure 4.
Electricity price in the modelled years.
Figure 4.
Electricity price in the modelled years.
Figure 5.
Coefficients as a function of the number of clusters.
Figure 5.
Coefficients as a function of the number of clusters.
Figure 6.
Illustration of the municipalities in NWM, color-coded according to cluster allocation, with the number of municipalities in the clusters (in parentheses), and representative municipalities (big dots).
Figure 6.
Illustration of the municipalities in NWM, color-coded according to cluster allocation, with the number of municipalities in the clusters (in parentheses), and representative municipalities (big dots).
Figure 7.
Shares of installed and potential capacities of renewable energies in the municipalities.
Figure 7.
Shares of installed and potential capacities of renewable energies in the municipalities.
Figure 8.
H2 demand by sector in the status quo (top) and in 2050 (bottom).
Figure 8.
H2 demand by sector in the status quo (top) and in 2050 (bottom).
Table 1.
General information of investigated literature.
Table 1.
General information of investigated literature.
| Author (Year) | Energy-System Analysis | Spatial Resolution | Model (Methodology) |
|---|
| Fraunhofer ISI et al. (2017) [28] | Yes | Input regionalized, calculation with six regions for Germany | Enertile (optimization of dispatch and investment),
combined with detailed grid and demand models |
| Fraunhofer ISI et al. (2021) [29] | Yes | Input regionalized, calculation with six regions for Germany | Enertile (optimization of dispatch and investment),
combined with detailed grid and demand models |
| Robinius et al. (2020) [30] | Yes | Input regionalized, calculation with Germany as one node | FINE-NESTOR (optimization of dispatch and investment), combined with detailed grid and demand models |
| Dena (2018) [31] | Yes | Input regionalized, calculation with Germany as one node | DIMENSION + (optimization of dispatch and investment) |
| Prognos et al. (2020) [32] | Yes | Input regionalized based on reference regions, calculation with Germany as one node | System model based on model combination (optimization and simulations) |
| Dena (2016) [33] | No | Analysis of four cluster regions | No simulation or optimization |
| Zdrallek et al. (2018) [34] | No focus | Modelling based on nine reference municipalities | Dispatch simulation |
| Schröer et al. (2015) [35] | No focus | Using one reference region with 17 sub regions | P2IONEER (simulation) |
| Hey (2012) [36] | No | Reference use case | Matlab/Simulink (simulation) |
| Sterchele et al. (2020) [37] | Yes | Germany as one node | REMod (simulation and optimization) |
| Kelch et al. (2019) [38] | Yes | Modelling counties and municipalities | Ren-Model (Simulation) |
| Andresen and Schmitz (2016) [39] | No | Using Hamburg as a reference municipality | TransiEnt.EE (simulation) |
| RLI (2013) [40] | Yes | Germany represented by 14 nodes | Optimization model for dispatch and investment |
Table 2.
Representation of power-to-gas, electrolysis operation and influencing factors in investigated literature.
Table 2.
Representation of power-to-gas, electrolysis operation and influencing factors in investigated literature.
| Authors (year) | Power-to-Gas Types | Electricity/Gas/Heating Sector | Electrolysis Operation | Influencing Factors |
|---|
| Fraunhofer ISI et al. (2017) [28] | CH4, E-Fuels, H2 | +/+/+ | No | Legal and political framework, technological development, grid expansion |
| Fraunhofer ISI et al. (2021) [29] | CH4, E-Fuels, H2 | +/+/+ | No | Legal and political framework, technological development, grid expansion |
| Robinius et al. (2020) [30] | CH4, E-Fuels, H2 | +/-/+ | Yes | Legal and political framework, technological development, renewable expansion |
| Dena (2018) [31] | CH4, E-Fuels, H2 | +/+/+ | Yes | Legal and political framework, technological development, social acceptance |
| Prognos et al. (2020) [32] | CH4, E-Fuels, H2 | +/+/+ | Yes | Technological development, carbon price |
| Dena (2016) [33] | H2, CH4 | +/+/+ | Yes | - |
| Zdrallek et al. (2018) [34] | H2, CH4 | +/+/- | Yes | Legal and political framework, technological development |
| Schröer et al. (2015) [35] | H2, CH4 | +/+/+ | Yes | Legal and political framework, technological development |
| Hey (2012) [36] | H2, CH4 | +/-/- | Yes | Legal and political framework |
| Sterchele et al. (2020) [37] | CH4, E-Fuels, H2 | +/-/+ | Yes | Social acceptance |
| Kelch et al. (2019) [38] | - | +/-/+ | No | Legal and political framework, technological development |
| Andresen and Schmitz (2016) [39] | H2 | -/+/- | Yes | Variation of possible admixture in gas grids |
| RLI (2013) [40] | - | +/-/- | No | Technological development |
Table 3.
Overview of the aspects of the cluster analysis.
Table 3.
Overview of the aspects of the cluster analysis.
| Characteristics | Attribute |
|---|
| Method: | Hierarchical-agglomerative, partitioning |
| Cluster algorithm: | Ward, K-Means |
| Distance measures: | Squared Euclidean distance |
| Variables/indicators | 25 indicators (see Section 3.1) |
| Objects: | 86 municipalities in Germany |
| Criteria: | Elbow criteria, test of Mojena |
Table 4.
Manipulated input parameters in the status quo and in 2050.
Table 4.
Manipulated input parameters in the status quo and in 2050.
| Parameter | Framework Parameter | Change/Measure |
|---|
| H2 demand | Market | Change in demand |
| H2 price | Market | Subsidization |
| Electricity price components | Regulatory | Considering levies |
| Electricity price variation | Market/Regulatory | Wholesale price |
| Electricity grid | Technical | Grid capacity |
Table 5.
Data basis for the cluster analysis and energy-system modelling.
Table 5.
Data basis for the cluster analysis and energy-system modelling.
| Socio-Demographic | Energy Demand | RE |
|---|
| Area | Electricity demand—households (MWh) | Capacity wind (MW) |
| Population | Electricity demand—industry (MWh) | Capacity pv (MW) |
| Number of households | Electricity demand—commercial (MWh) | Capacity—bioenergy (MW) |
| Number of flats | Electricity demand—mobility (MWh) | Capacity—energy (other) (MW) |
| | Heat demand—households (MWh) | Wind potential (MW) |
| | Heat demand—industry (MWh) | PV roof potential (MW) |
| | Heat demand—commercial (MWh) | PV open-space potential (MW) |
| | Hydrogen demand—household (MWh) | Biomass potential (MWh) |
| | Hydrogen demand—industry (MWh) | Biogas potential (MWh) |
| | Hydrogen demand—commercial (MWh) | Emission (tCO2eq) |
| | Hydrogen demand—mobility (MWh) | |
Table 6.
Input parameters of the investment components.
Table 6.
Input parameters of the investment components.
| Input Parameter | Unit | Value (2050) | Source |
|---|
| Electrolyzer investment | €/kWel | 738 (495) | Sterchele et al. (2020b) |
| Electrolyzer operational cost | €/kWa | 3.5% of investment | Sterchele et al. (2020b) |
| Electrolyzer lifetime | a | 20 | Sterchele et al. (2020b) |
| H2 storage investment | €/kW | 163 | Sterchele et al. (2020b) |
| H2 storage operational cost | €/kWa | 2.5% of investment | Sterchele et al. (2020b) |
| H2 storage lifetime | a | 30 | Sterchele et al. (2020b) |
| H2 storage yearly loss rate | % | 1 | Sterchele et al. (2020b) |
| Hydrogen turbine investment | €/kW | 500 (385) | Sterchele et al. (2020b) |
| Hydrogen turbine operational cost | €/kWa | 2.5% of investment | Sterchele et al. (2020b) |
| Hydrogen turbine lifetime | a | 40 | Sterchele et al. (2020b) |
Table 7.
Indicators for the cluster analysis.
Table 7.
Indicators for the cluster analysis.
| Input Parameter | Description | Unit |
|---|
| population_s | Population | Number per km2 |
| dem_elec_Ind_s | Electricity consumption— industrial sector | MWh/km2 |
| cap_WEA_s | Installed capacity—wind | MW/km2 |
| cap_PV_s | Installed capacity—PV | MW/km2 |
| cap_Bio_s | Installed capacity—bioenergy | MW/km2 |
| cap_other_s | Installed capacity—other | MW/km2 |
| pot_cap_WEA_s | Wind potential | MW/km2 |
| pot_cap_PVarea_s | PV potential | MW/km2 |
Table 8.
Characteristics of the analyzed municipalities.
Table 8.
Characteristics of the analyzed municipalities.
| Municipality | Cluster | Population (Number) | Electricity Demand Industry (GWh/a) | Installed Capacity (MW) | Additional Potential (MW) |
|---|
| | Wind | PV | Wind | PV |
|---|
| Grevesmühlen | 3 | 10,440 | 20.6 | 9.2 | 4.8 | 0 | 21.7 |
| Schildetal | 2 | 753 | 0.7 | 32.2 | 0.5 | 40.6 | 2.7 |
| Selmsdorf | 4 | 2906 | 18.4 | 27.5 | 2 | 15.5 | 8.7 |
| Wismar | 5 | 42,992 | 172.6 | 0 | 15.1 | 0 | 59.1 |
| Zierow | 1 | 791 | 1.1 | 0 | 0.4 | 0 | 3.5 |
Table 9.
Assumed capacities between transmission grid and the municipality.
Table 9.
Assumed capacities between transmission grid and the municipality.
| Municipality | Maximal Load (MW) | Grid Capacity (MW) |
| Gevesmühlen | 7.37 | 11.79 |
| Schildetal | 24.59 | 39.34 |
| Selmsdorf | 21.00 | 33.60 |
| Wismar | 22.77 | 36.44 |
| Zierow | 0.38 | 0.6 |
Table 10.
Regional results for electrolysis in the status quo.
Table 10.
Regional results for electrolysis in the status quo.
| Community | Electrolysis Capacity [MW] | Full-Load Hours [h] | H2 Production [MWh] | Share of Used Residual Load [%] |
|---|
| Grevesmühlen | 1 | 5823 | 5823 | 72.1 |
| Schildetal | 2.5 | 7109 | 17,712 | 47.3 |
| Selmsdorf | 1.7 | 6875 | 11,354 | 41.0 |
| Wismar | 1 | 7770 | 6770 | - |
| Zierow | 1 [0.48] * | 3576 | 1715 | 100.0 |
Table 11.
Regional results for electrolysis in the year 2050.
Table 11.
Regional results for electrolysis in the year 2050.
| Community | Electrolysis Capacity [MW] | Full-Load Hours [h] | H2 Production [MWh] | Share of Used Residual Load [%] |
|---|
| Grevesmühlen | 6.4 | 5629 | 36,181 | 67.4 |
| Schildetal | 12.7 | 840 | 17,712 | 12.1 |
| Selmsdorf | 3.2 | 5.697 | 11.354 | 26.9 |
| Wismar | 26.6 | 7167 | 190,898 | 99.8 |
| Zierow | 1.29 | 1494 | 1924 | 61.3 |
Table 12.
LCOH2 in the status quo and the year 2050.
Table 12.
LCOH2 in the status quo and the year 2050.
| Community | LCOH2 Status Quo [€/MWhH2] | LCOH2 2050 [€/MWhH2] |
|---|
| Grevesmühlen | 38.57 | 52.33 |
| Schildetal | 23.52 | 90.23 |
| Selmsdorf | 23.99 | 24.79 |
| Wismar | 55.63 | 66.78 |
| Zierow | 108.58 | 74.99 |
Table 13.
LCOH2 in the status quo and the year 2050, including LCOE for RE.
Table 13.
LCOH2 in the status quo and the year 2050, including LCOE for RE.
| Community | LCOH2 Status Quo [€/MWhH2] | LCOH2 2050 [€/MWhH2] |
|---|
| Grevesmühlen | 83.79 | 75.32 |
| Schildetal | 82.85 | 141.57 |
| Selmsdorf | 85.20 | 71.22 |
| Wismar | 65.88 | 76.36 |
| Zierow | 118.32 | 108.84 |
| Publisher’s Note: MDPI stays neutral with regard to jurisdictional claims in published maps and institutional affiliations. |
© 2022 by the authors. Licensee MDPI, Basel, Switzerland. This article is an open access article distributed under the terms and conditions of the Creative Commons Attribution (CC BY) license (https://creativecommons.org/licenses/by/4.0/).


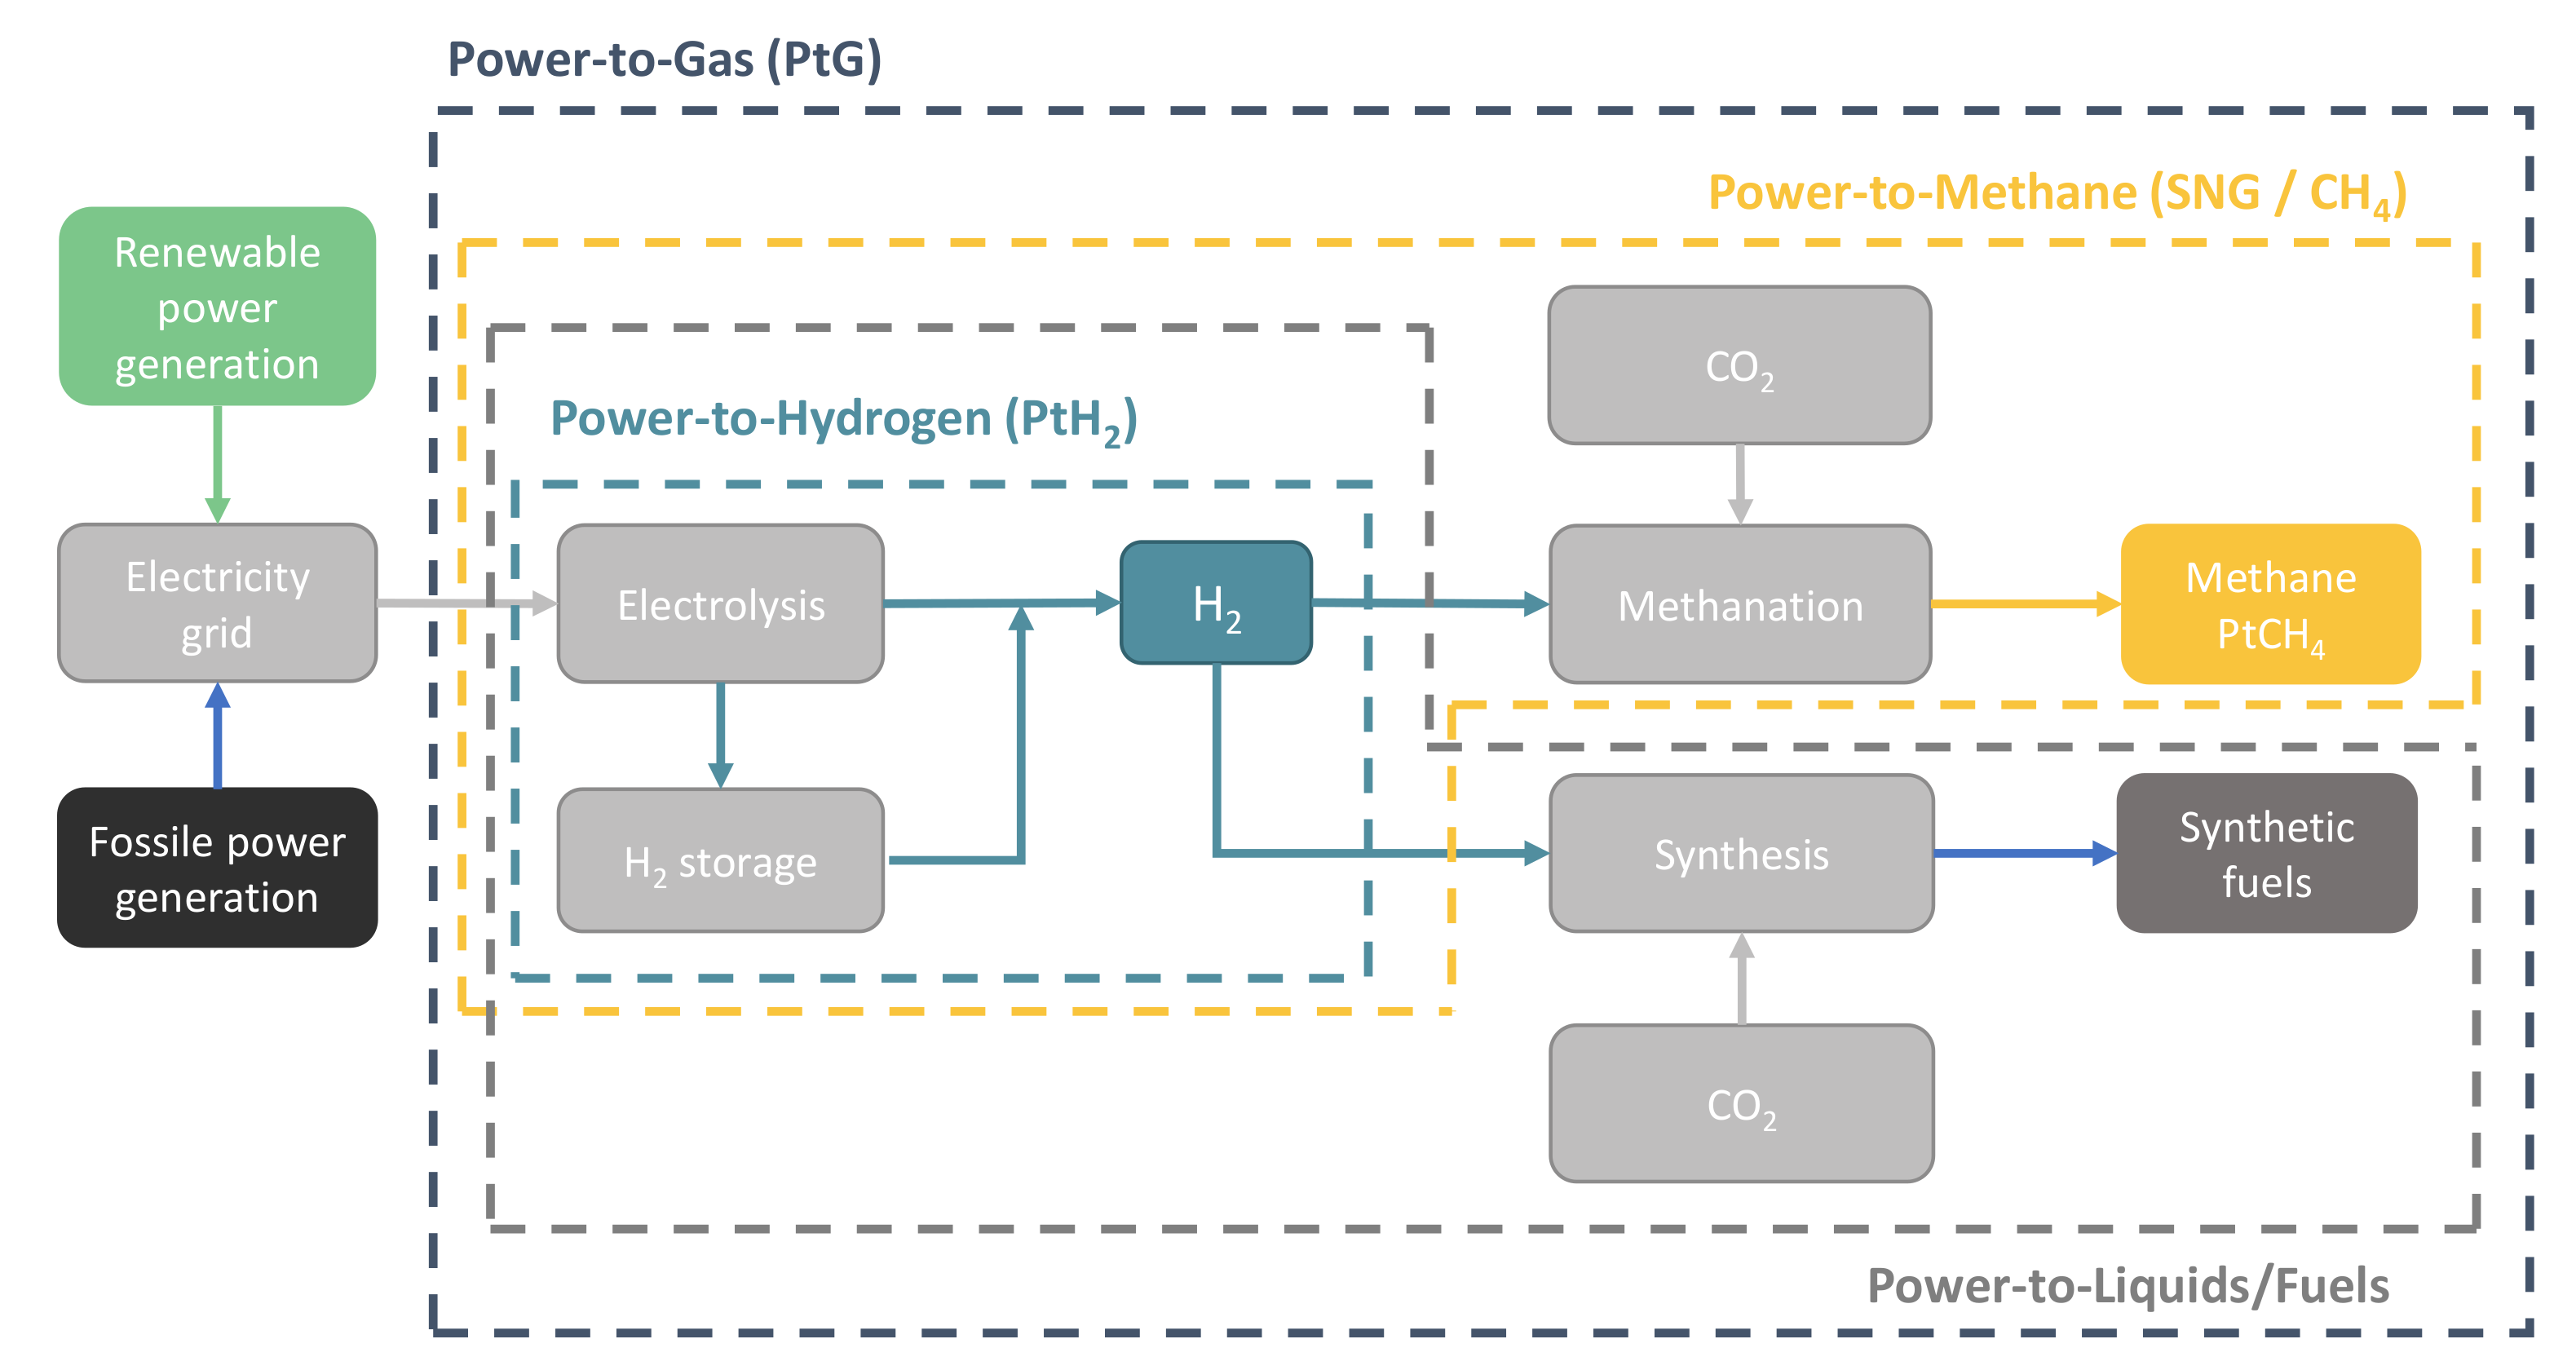


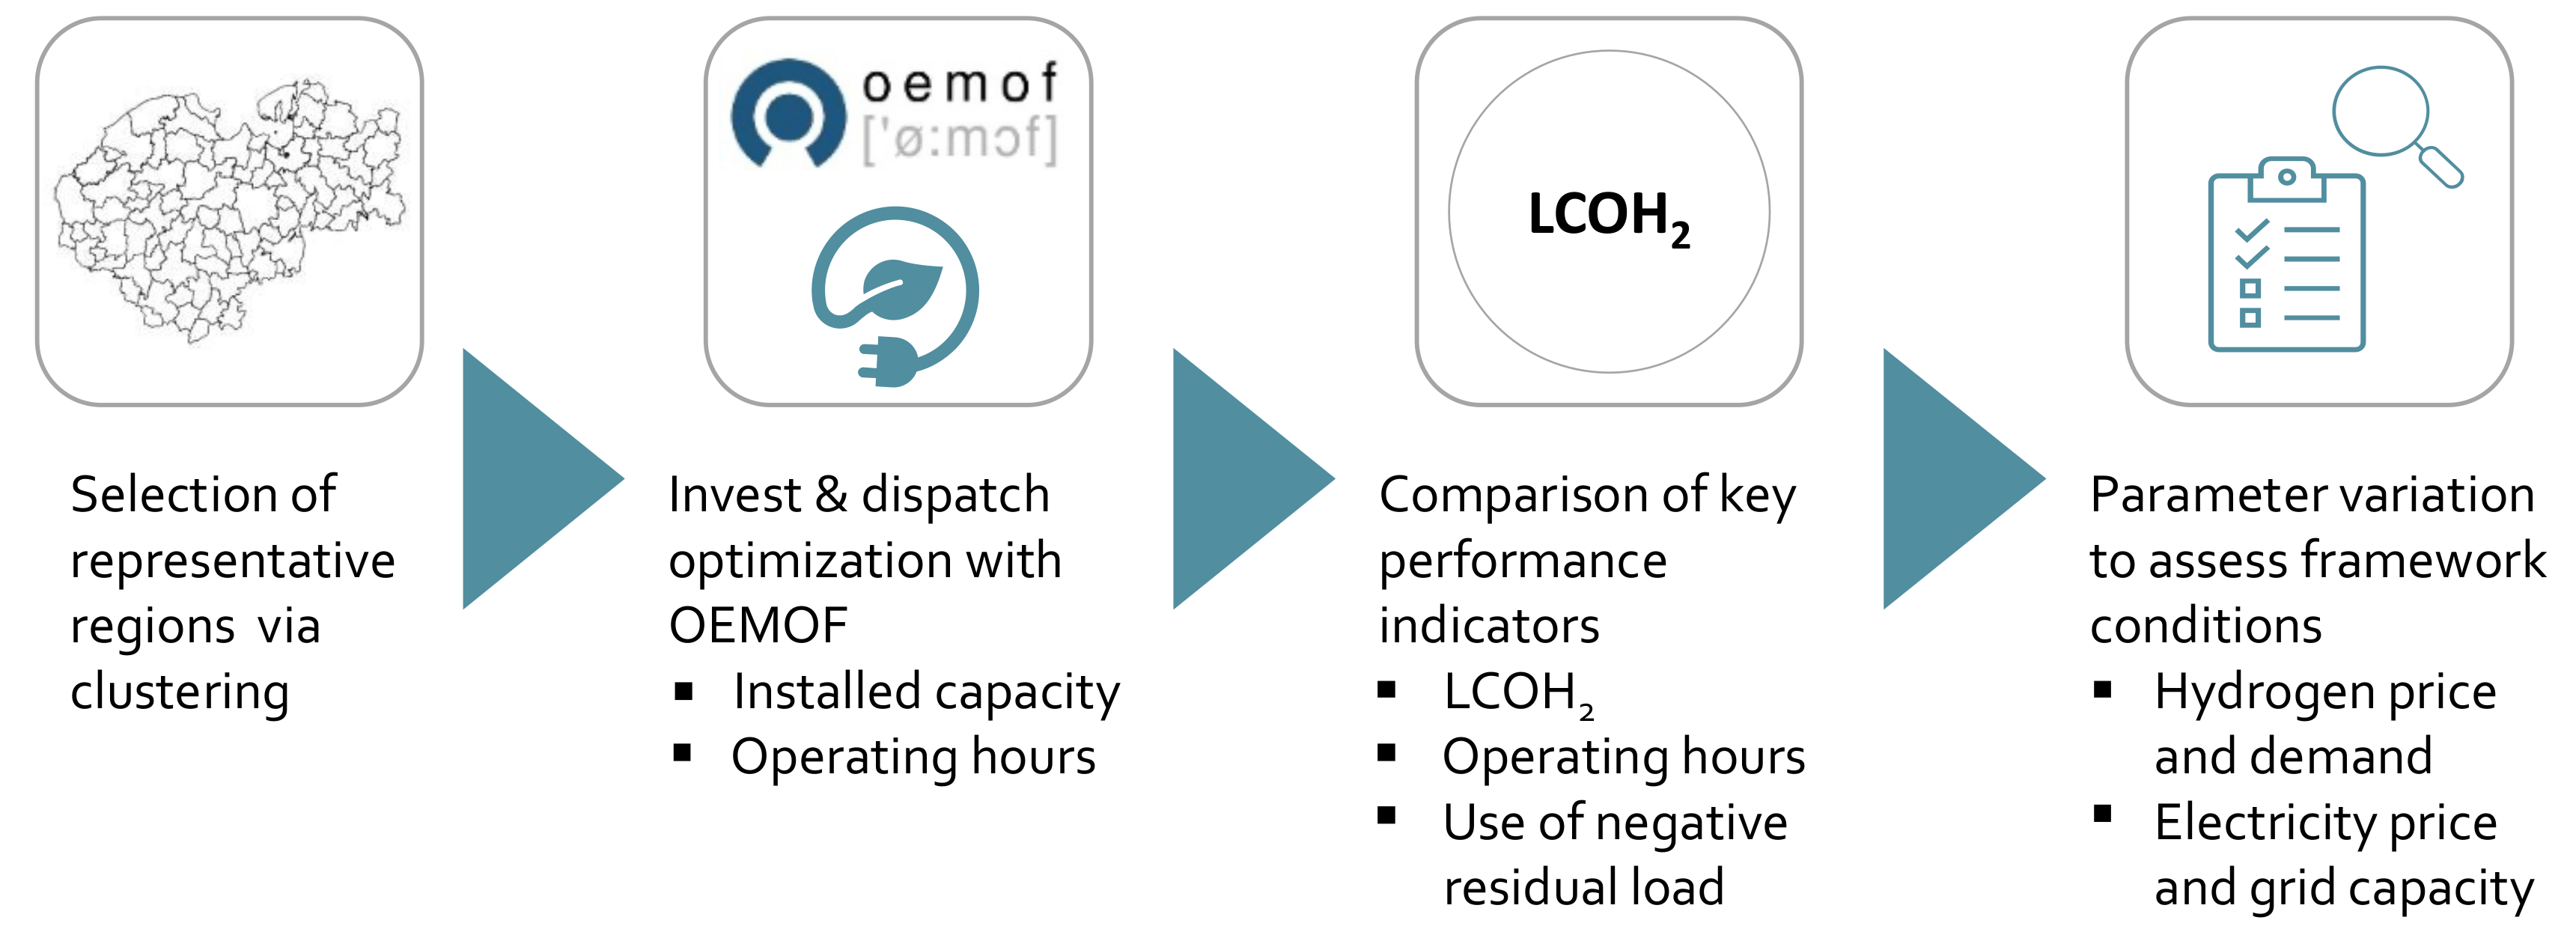
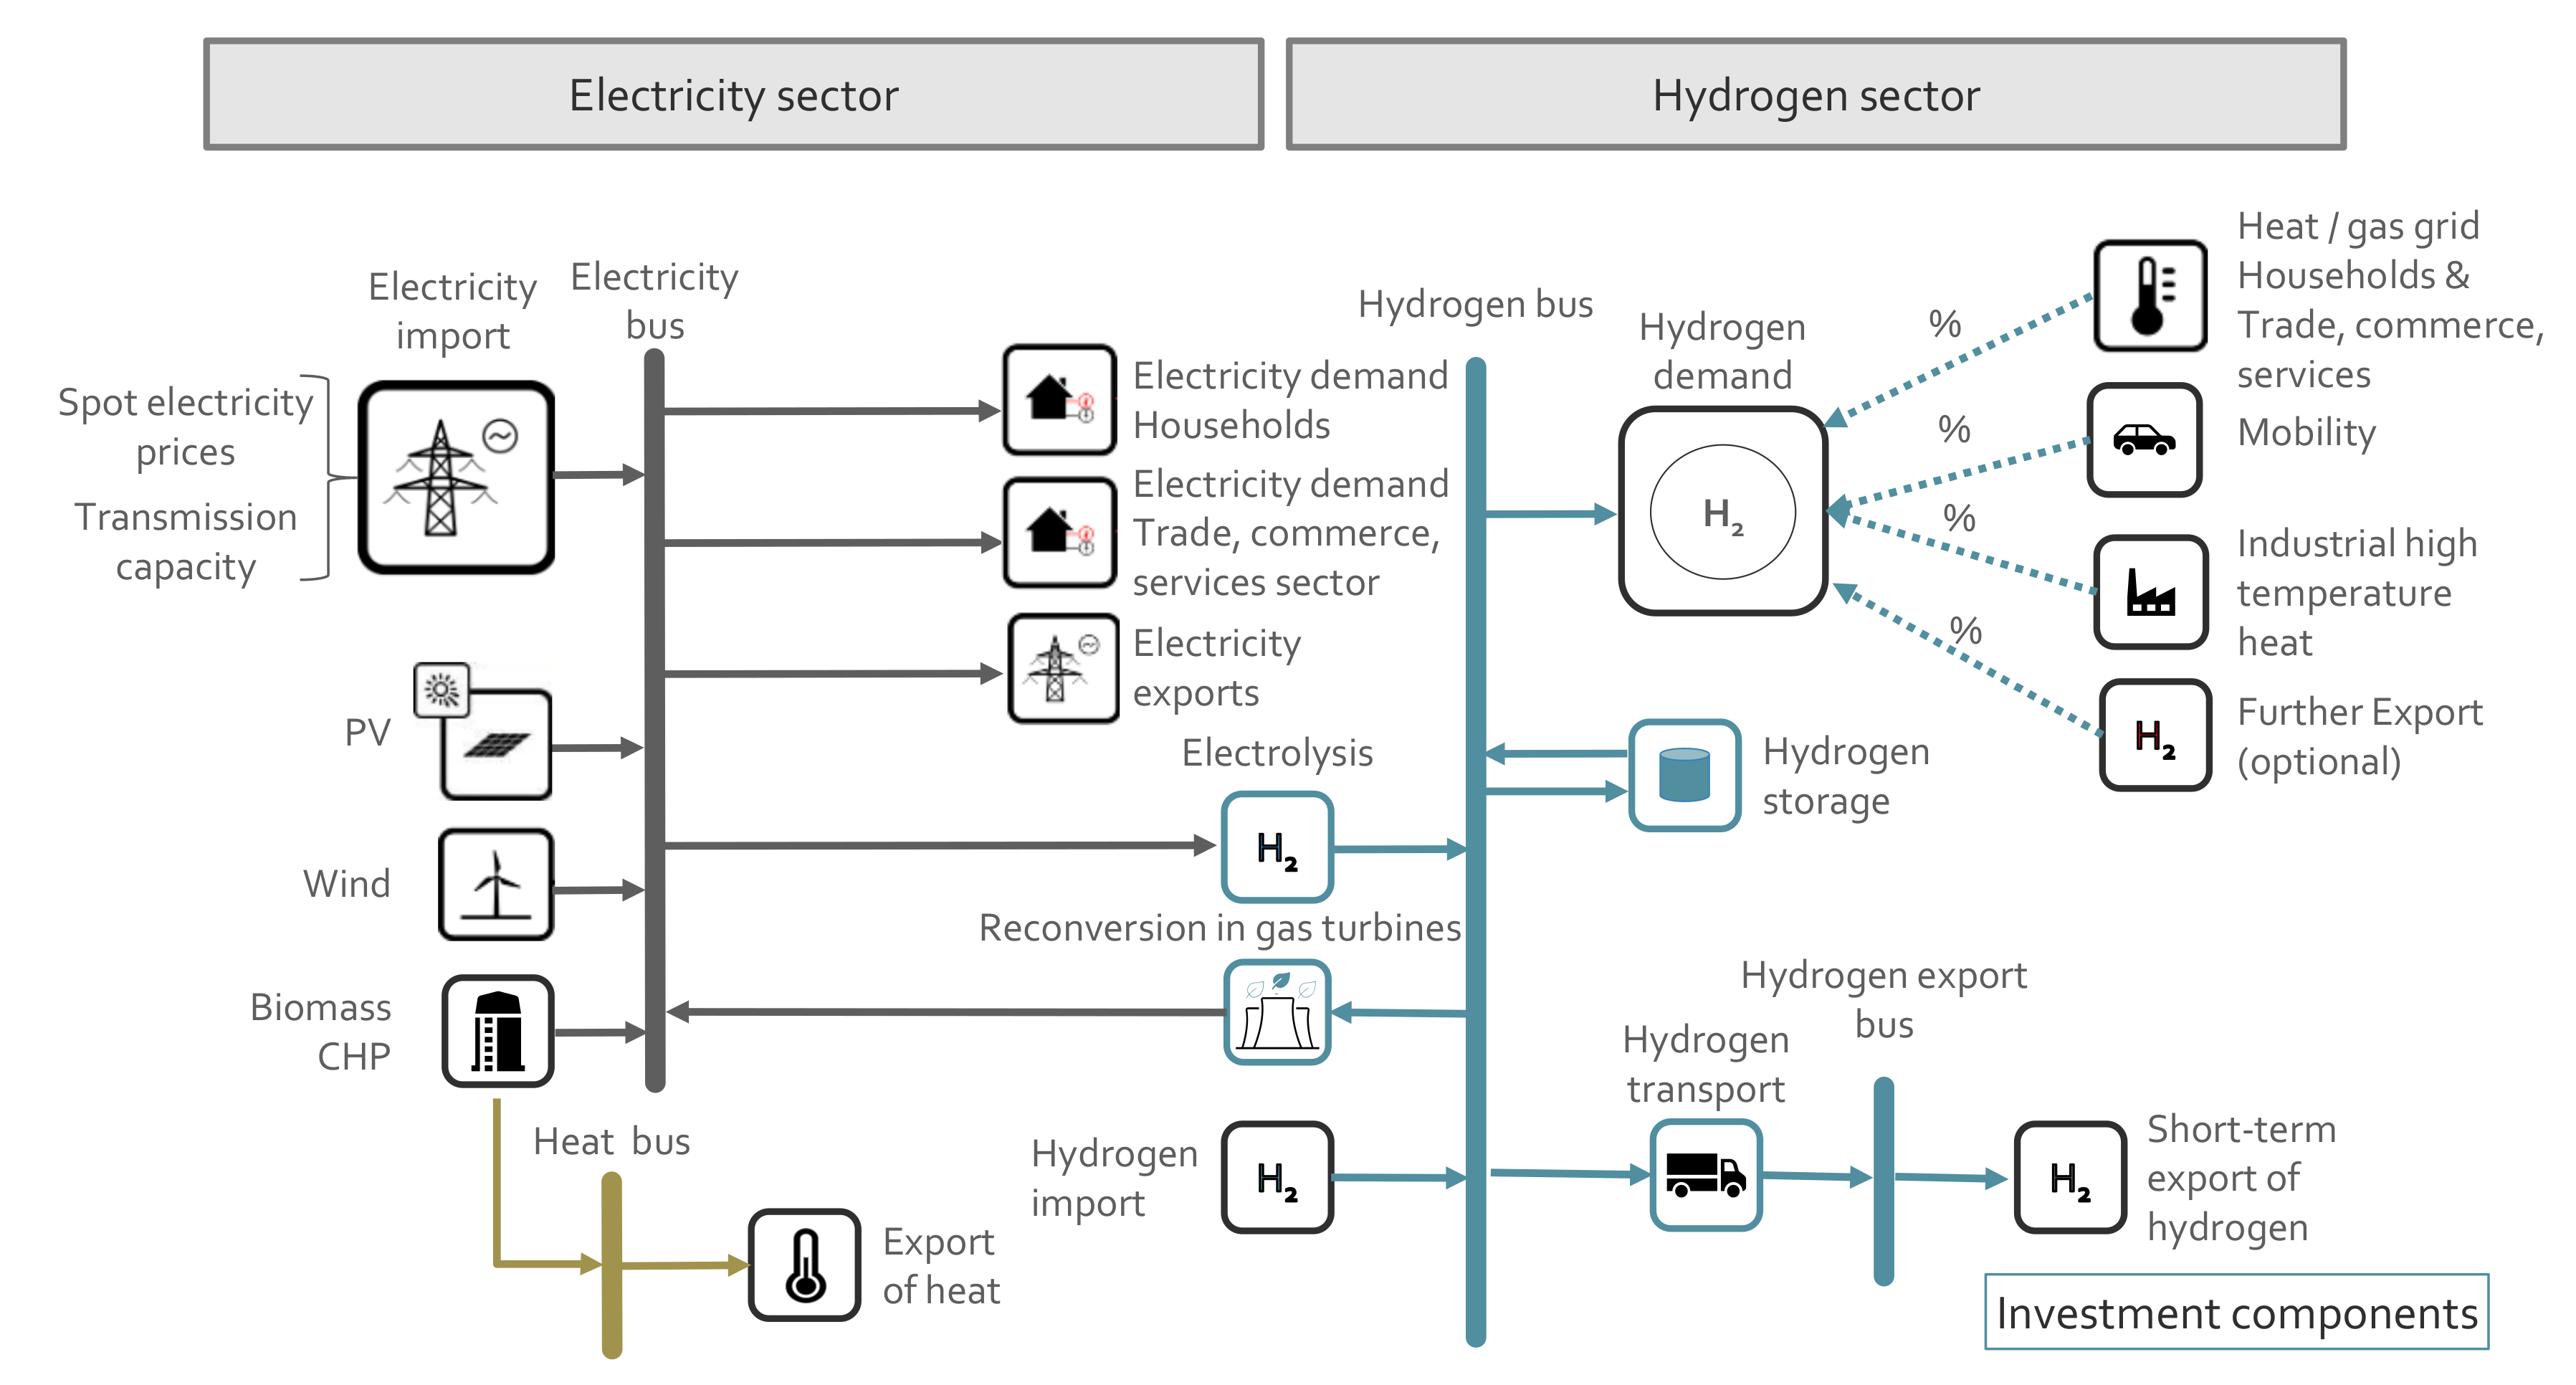
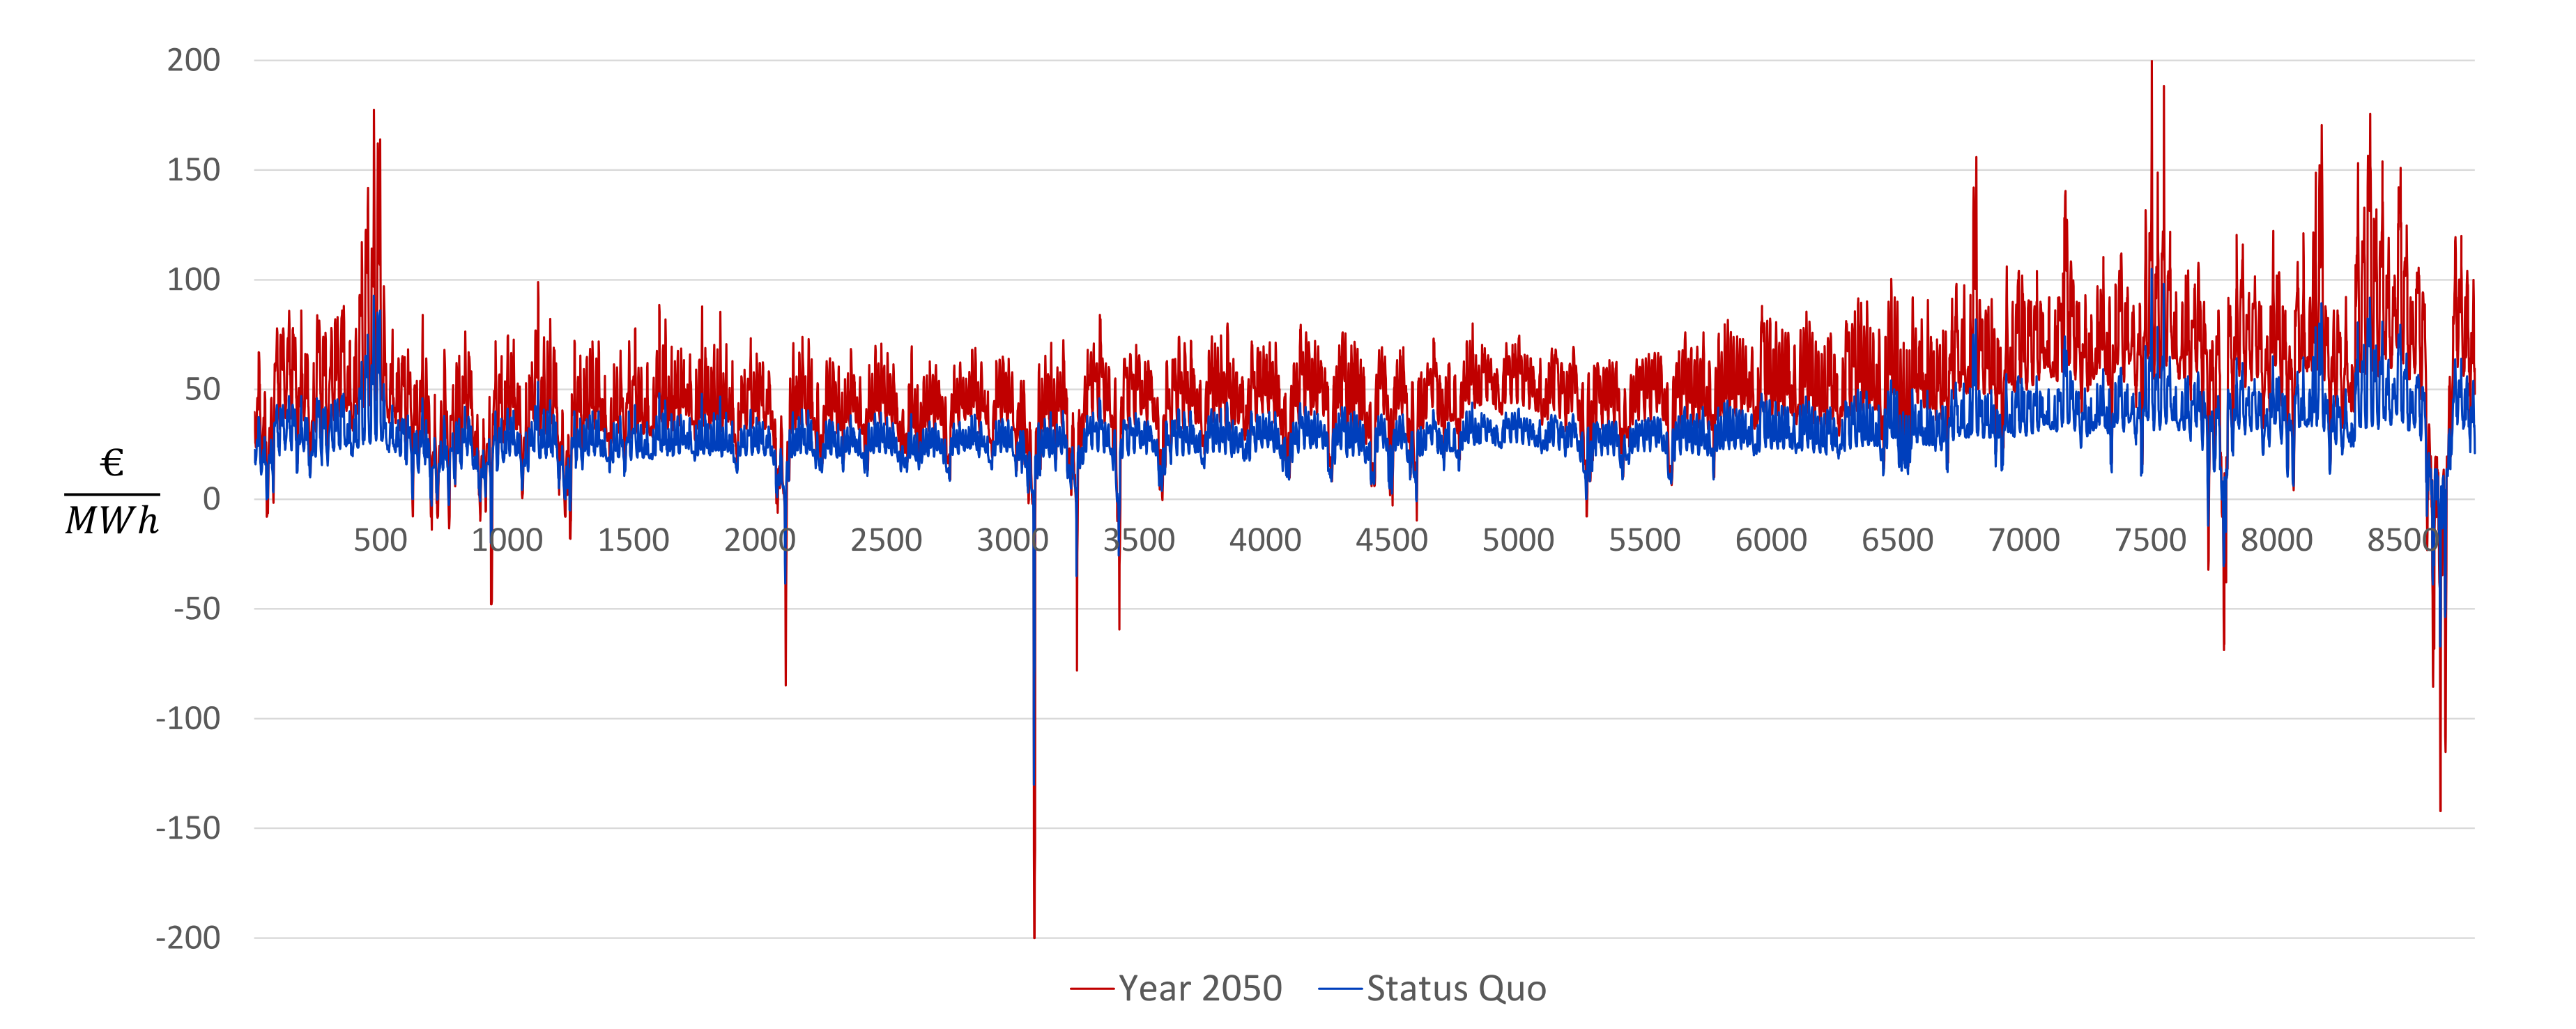
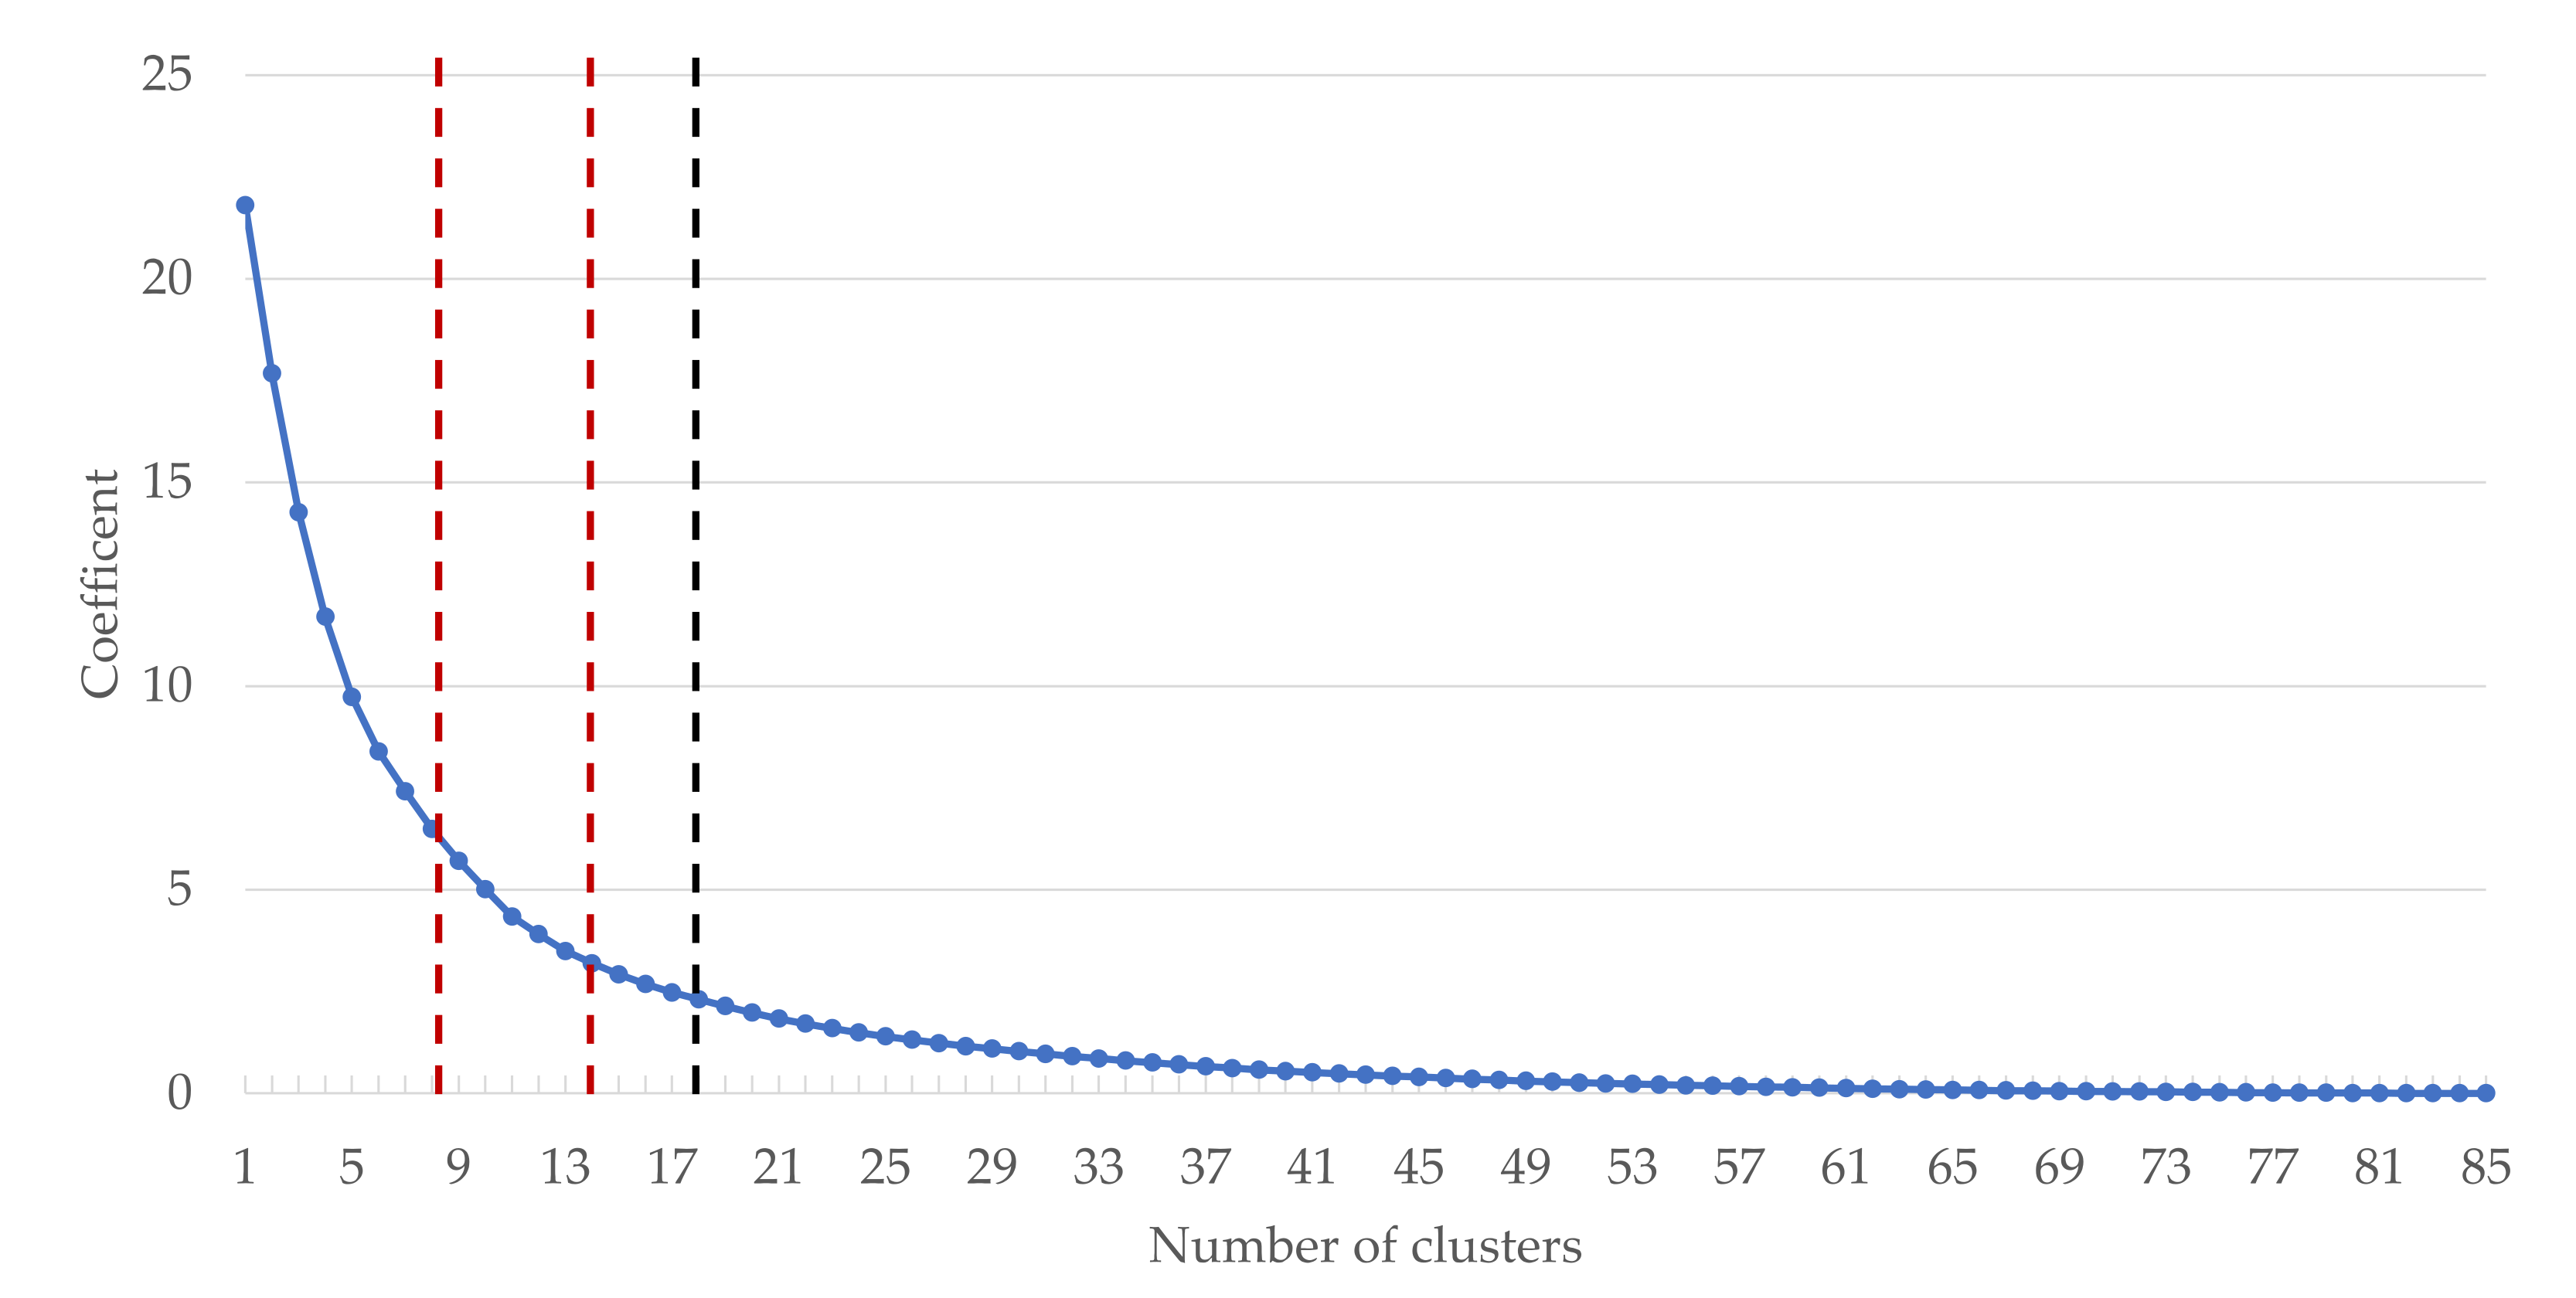
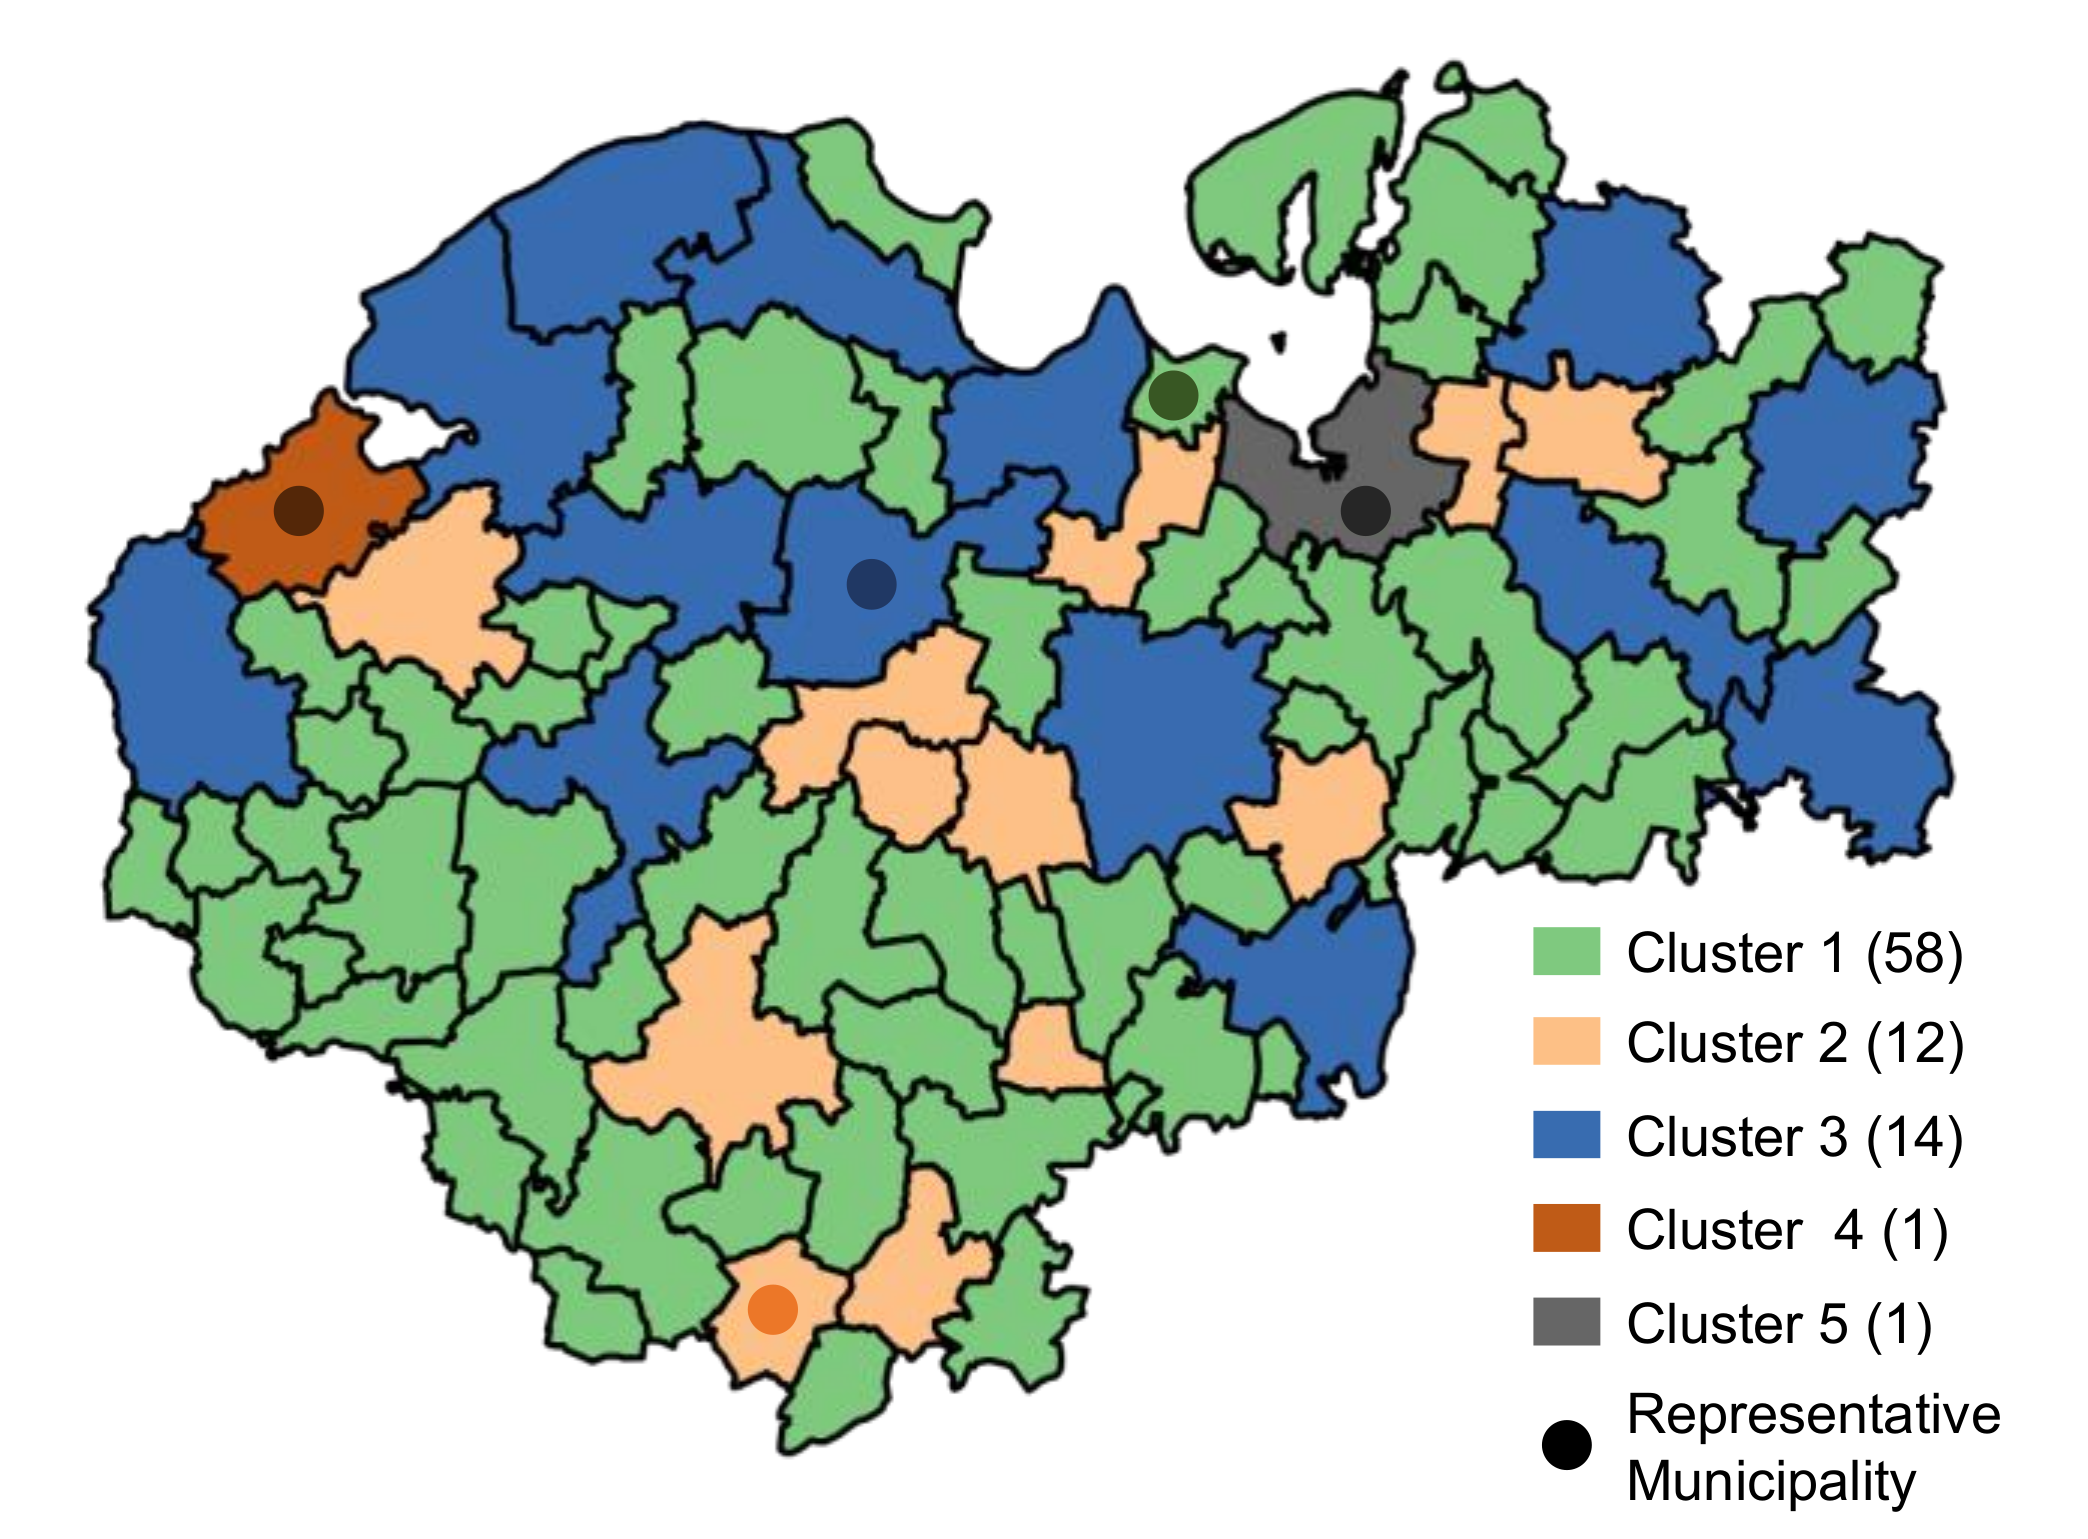
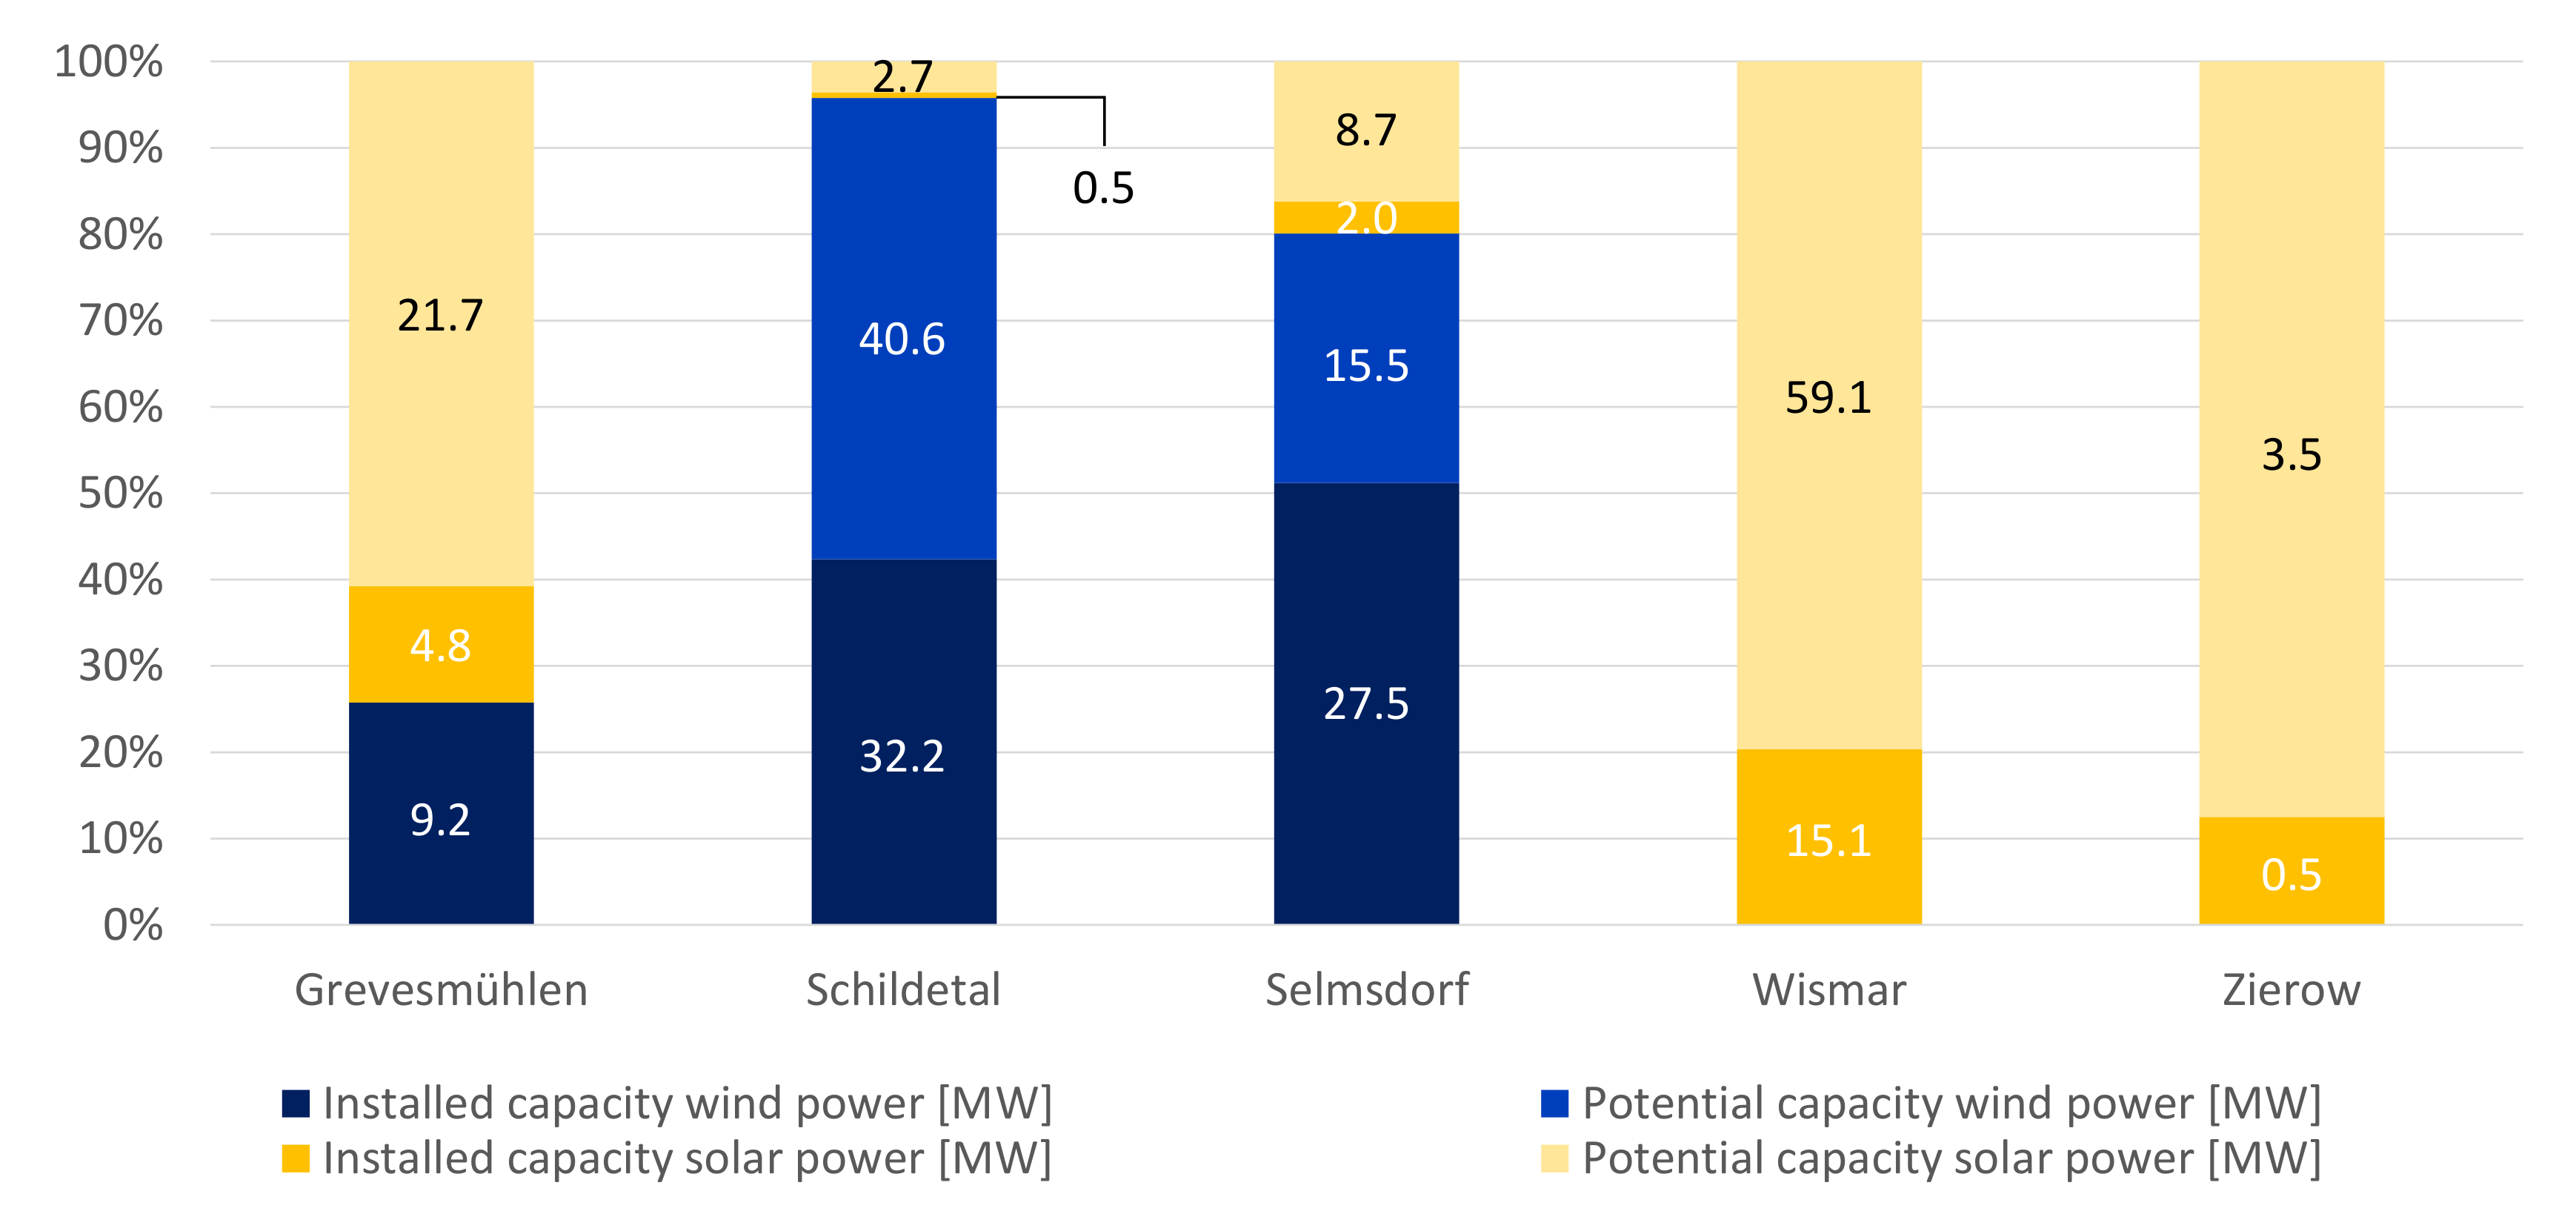
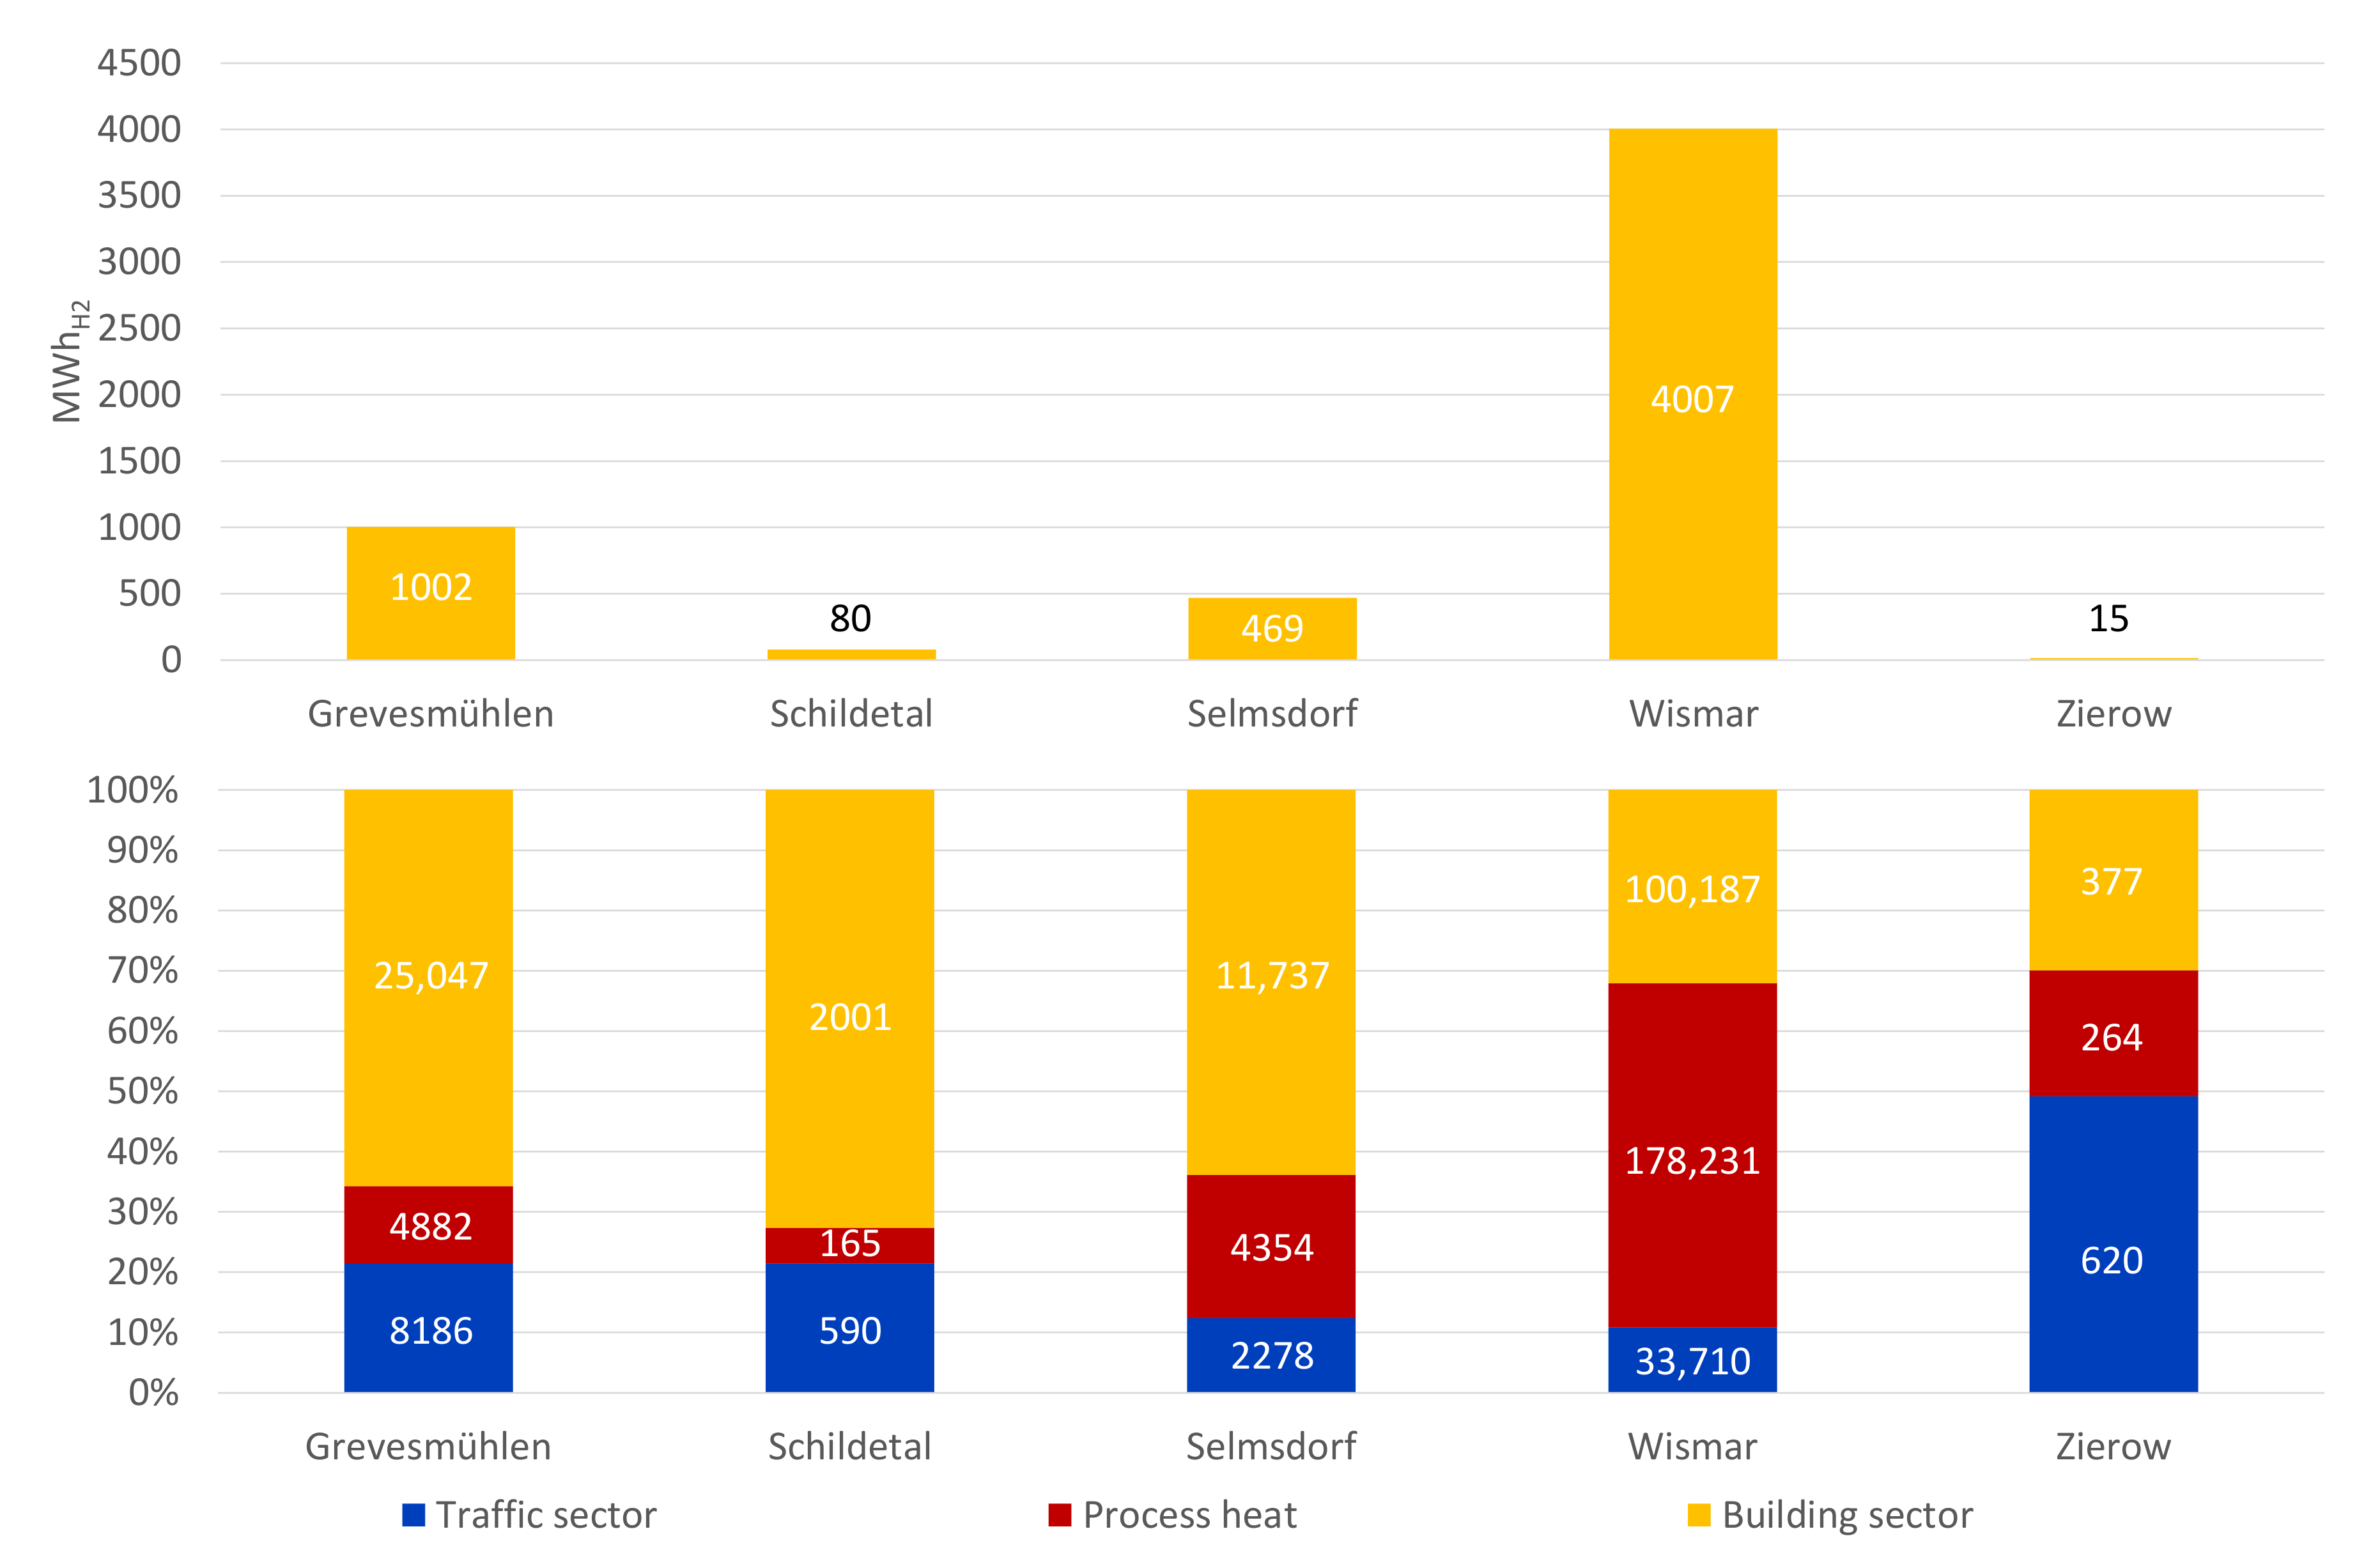