Article

The Shape Optimization and Experimental Research of Heave Plate Applied to the New Wave Energy Converter

1
College of Engineering, Qufu Normal University, Rizhao 276826, China
2
Institute of Marine Science and Technology, Shandong University, Qingdao 266237, China
*
Authors to whom correspondence should be addressed.
Energies 2022, 15(4), 1313; https://doi.org/10.3390/en15041313
Submission received: 5 January 2022 / Revised: 2 February 2022 / Accepted: 8 February 2022 / Published: 11 February 2022
(This article belongs to the Special Issue Technologies for Wave Energy Extraction)

Abstract

:
The development and utilization of wave energy is inseparable from the wave energy converter, and its stability is an important condition for operation. Heave is the biggest factor affecting the stable power generation of wave energy converters. The key method to solve this problem is to install a suitable heave plate. Therefore, the design of the heave plate is particularly important. Based on a new type of horizontal rotor wave energy converter, this paper proposes three different shapes of heave plate design schemes and completes the calculation and modeling of the engineering prototype. First, the three types of heave plate devices were numerically simulated using hydrodynamic calculation software to compare their stable performances and verify the feasibility of the scheme. Subsequently, an experimental model was made according to the parameters of the engineering prototype, and a tank experiment was carried out under the same working conditions to further study the influence of the heave plate installation distance on the stability of the wave energy generator. The results showed that when the distance was between 10 mm and 20 mm, the average amplitude change was large, and when the distance was between 20 mm and 30 mm, the average amplitude change was small. Therefore, the installation distance should be between 20 mm and 30 mm. In the case of the same heave plate area and installation distance, the average amplitude of the chamfered heave plate device was smaller than the other two types, indicating that its stability was better. The optimization of the shape and installation distance of the heave plate proposed in this study has obvious effects on improving the stability of the device and provides a reference for the design of the wave energy converter device.

1. Introduction

From the signing of the Paris Agreement in 2016 to the present, 126 countries and regions have proposed carbon peak and neutrality goals. Faced with the vision of “carbon neutral” transformation, governments around the world have introduced relevant policies to support the development of green industries [1,2]. At present, China’s power structure is still dominated by thermal power. In order to achieve their carbon peak and neutrality goals as soon as possible, the Chinese government has formulated a series of policies to accelerate the implementation of renewable energy alternatives with a focus on supporting technological breakthroughs in the fields of renewable energy, nuclear energy, and hydrogen energy and vigorously develop clean energy such as wind power, photovoltaics, and ocean energy [3,4,5,6]. At present, ocean energy is considered as a type of clean and rich renewable energy, and technological advances in this area have increased the potential of generating power from the ocean [7,8,9,10,11,12,13]. As an ocean energy source, wave energy has received increasing attention and ocean energy development, especially in wave energy converters, has begun to show benefits. Wave energy generators are gradually becoming valued by different developers of wave energy devices across the world in terms of their low cost, convenient laying, and high efficiency. Therefore, there many types of wave energy converters have been invented [12,14,15,16,17,18]. The latest survey conducted by the State Oceanic Administration shows that the ocean’s renewable reserve is approximately 1.58 × 10 6 MW and the explorable reserve is 4.3 × 10 5 MW in China [19,20,21]. China has a long coastline and many coastal islands. It has a total of 6961 islands, covering 500 m2, with a total area of 6600 km2, and people live on 433 of the islands [22,23,24,25]. Some remote islands have no fresh water or power; under such conditions new forms of energy, such as solar energy, wind energy, and ocean energy can provide energy for these islands to meet their special demands in terms of economic development and national defense construction [8,26,27,28]. Wave energy density is highest in Taiwan, followed by Zhejiang Province, Guangdong Province, and then Shandong Province [29]. The energy flow density is high in the ocean east of the Shandong Peninsula, the ocean around the remote islands in Penglai, the eastern part of Rongcheng, China’s southeast coast, and the middle part of the Bohai Sea. Thus, these areas are ideal for wave energy development. The energy flow density reaches 5000 W/m on the eastern coast of Chengshantou, Weihai, and can be classified as a Class One Rich Energy Area [30,31]. The north coast of Weihai is the location of the first national offshore wave energy converter and an experimental energy site currently under construction. These coasts are suitable for developing small- and middle-scale wave energy generators and power supply units [32,33,34,35].
Buoy-type wave energy-generating devices float on the sea and heave, swing, and shift as a result of wind and waves. Their heaving and pitching are key factors that constrain the efficiency of generating devices. Currently, the study of heaving plate performance is focused mainly on floating wind turbine platforms [36,37,38,39] and semi-submersible platforms [40,41,42,43]. Wave converters are a new field; therefore, studies on the heaving plates of wave energy converters are rare [44]. The horizontal rotor wave energy power generation device designed in this paper is based on the principle of water resonance. Through the optimized design of the involute horizontal rotor and arc plate flow channel, it can capture most of the wave energy in the main frequency range, belonging to the direct drive form. In this paper, first, the basic principles of power generation and mooring methods are introduced. Secondly, in reference to other floating structures in the ocean, the AQWA software is used to perform a mooring coupled numerical analysis of the heave and pitch directions of the device with three different shapes of heave plates based on the environmental parameters of wind, waves, and currents. Finally, a scaled-down model is created according to the principle of similarity and results are obtained through a sink test using a combination of a physical model test and theoretical analysis. In addition, simulation and experimental data are analyzed to provide design data for prototyping.

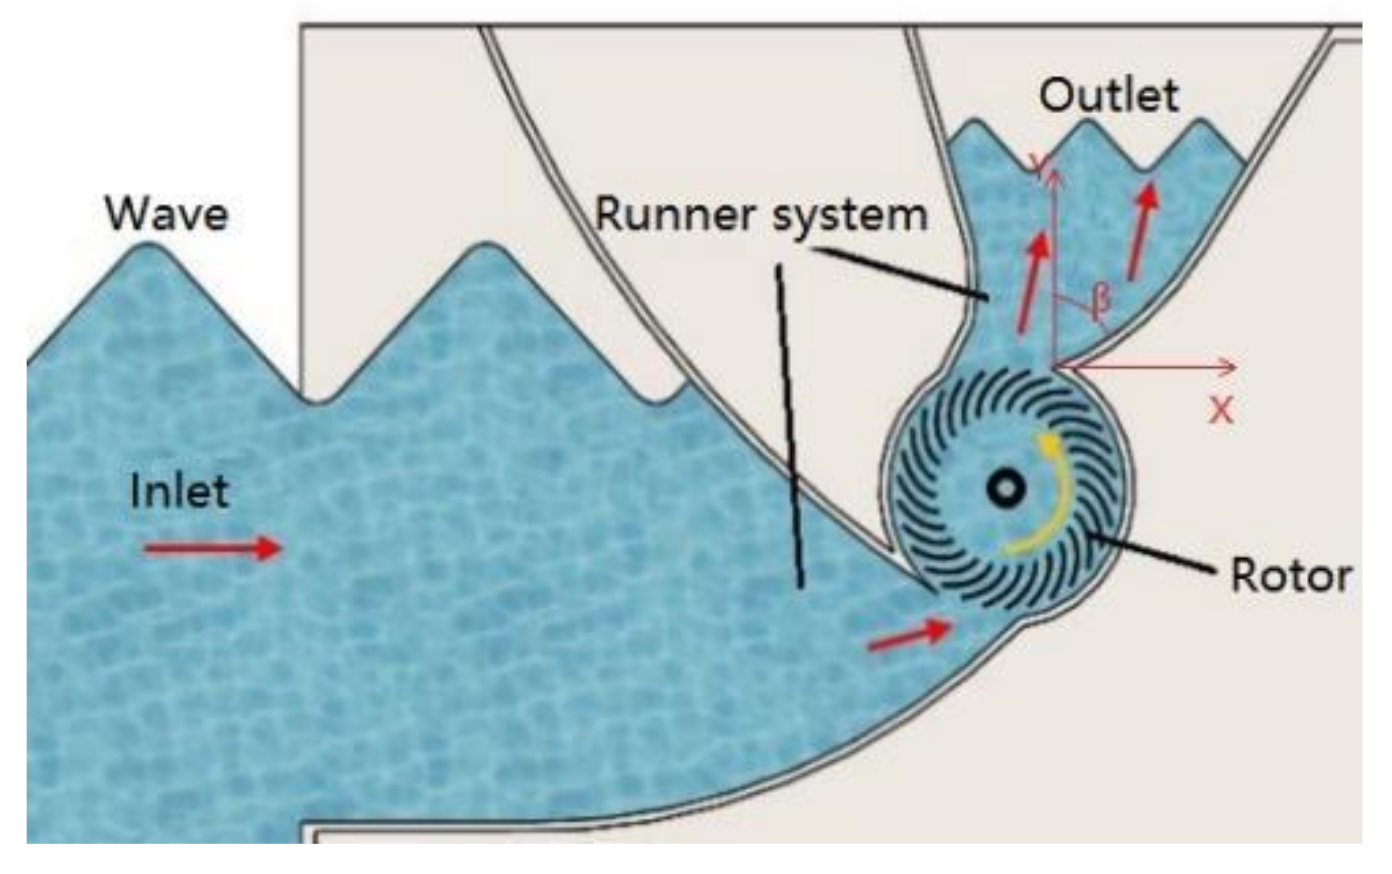
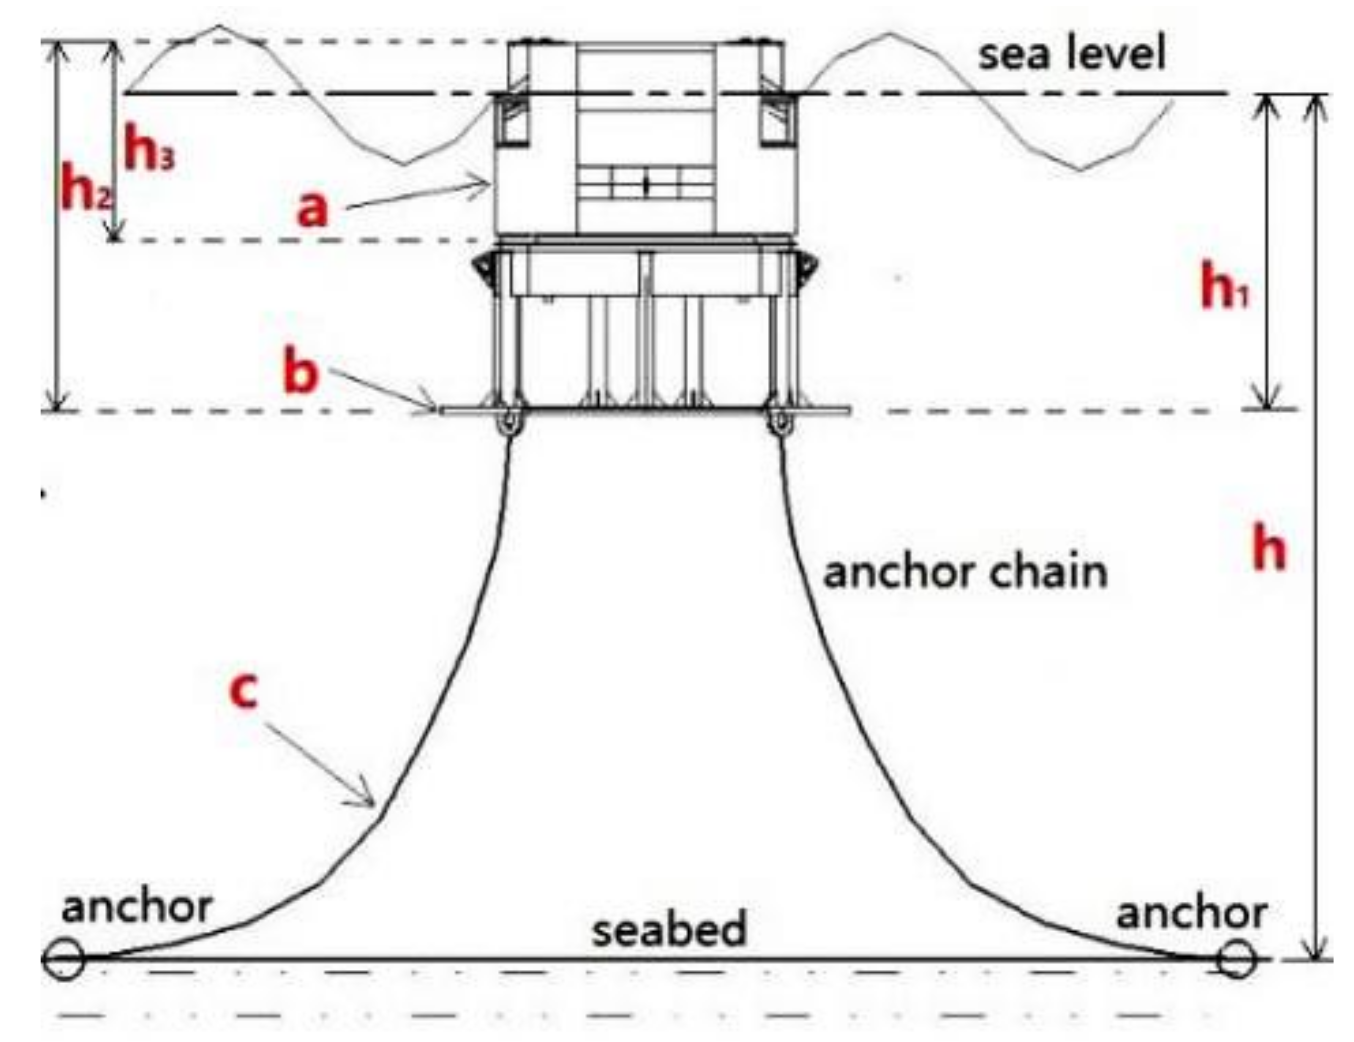
2. Structure and Power Generation Principle

In the ocean, the significant heaving movement of buoyant hulls is an important cause of low generation efficiency and fatigue damage. Therefore, reducing the heaving movement of buoyant hulls is an important way to improve wave-energy-capturing devices. In general, buoyant hulls employ a heaving plate to increase the vertical damping, added mass, and inherent period, thereby reducing the degree of heaving movement to improve the movement stability of the generating device. Therefore, the geometric characteristics and motion laws of the heave plate have an important influence on the wave energy power generation device. The results of this paper will provide a reference for the structural design and hydraulic analysis of swing rotor wave energy converters. This paper is based on a new type of horizontal rotor wave energy converter jointly developed by the China Institute of Water Resources and Hydropower and Shandong University to optimize and test the heave plate. The results of this research will provide a reference for the structural design and hydrodynamic analysis of the horizontal rotor wave energy converter. The torque and speed of the turbine were simulated and the number of blades was determined by comparing the speed, torque, and power. It was found that, in theory, the use of involute horizontal rotors has a higher absorption of wave energy. Figure 1 shows the generating principle. This device was divided into three parts, as shown in Figure 2: a generating part (a), heaving plate (b), and mooring system (c) [45,46,47,48,49]. The water depth, h, of the test area was approximately 15 m, and the submerged water depth, h1, of the wave energy conversion device was approximately 4.75 m. The overall height, h2, of the device was 5.443 m, and the height, h3, of the generating part was 2.948 m. Catenary mooring can restrict the motion of the platform with the gravity of catenaries, so this method is usually adopted by marine-energy-generating devices.
The channel was open and connected to the ocean, and it passed power to the generating device through the turbine and the coupling and lifting speed box. This device was moored by an anchor chain and floating at sea. It had few exposed parts, which would have enhanced its survivability. The working process of the sea trial prototype is detailed as follows: Seawater influences the swing rotor to cause it to rotate anticlockwise when entering the device, thus converting the kinetic energy to the mechanical energy of the rotor, and water not overflowing from the exit drops again from the exit, rotating the turbine in the same direction and realizing the secondary reuse of energy. The turbine then directly drives the generating device to convert the mechanical energy into power, thus realizing the secondary conversion of energy. The engineering sample’s installed capacity was 6 kW, the rated power was 1.1 kW, and the weight was approximately 28 tons. According to the experimental conditions and similar design bases of the experimental model with the given engineering background and experimental tank conditions, the model scale was 1:10 and it weighed 28 kg. The engineering prototype and model prototype are shown in Figure 3, and their dimensions are shown in Table 1.

3. Motion Simulation

Heaving is an up-and-down motion that has a large effect on device stability and wave energy capture efficiency, which is a direct reason for enhancing heaving plates. The swing will affect the area between the device inlet and wave, thus influencing the wave energy capture efficiency. To ensure generation efficiency and stability, it is necessary to perform a frequency domain analysis in the heave and swing directions (roll and pitch). After the selection of the heaving plate, three different shapes of heaving plates under the same area will be considered in terms of their mechanical manufacture. A simulation comparison was conducted for three different shapes of heaving plates in the AQWA software to analyze the excitation force, additional damping, added mass, and response amplitude operator in the heave and swing directions, as well as the effect of the use of a heaving plate with better performance on these parameters. The wave energy converter was divided after the whole modeling process was finished. In the AQWA software module, there is an inherent limitation between the grid size and the wave frequency. When the mesh size becomes larger, the wave frequency allowed by the simulation is expected to become smaller. If the simulation of high-frequency waves is required, the grid size needs to be refined. Scheme 1 was divided into 21,832 grids, scheme 2 was divided into 21,412 grids, and scheme 3 was divided into 21,504 grids, as shown in Figure 4. In the simulation, the regular wave height was approximately 0.75 m, the regular wave period was approximately 3.9 s, and the water was 15 m deep.

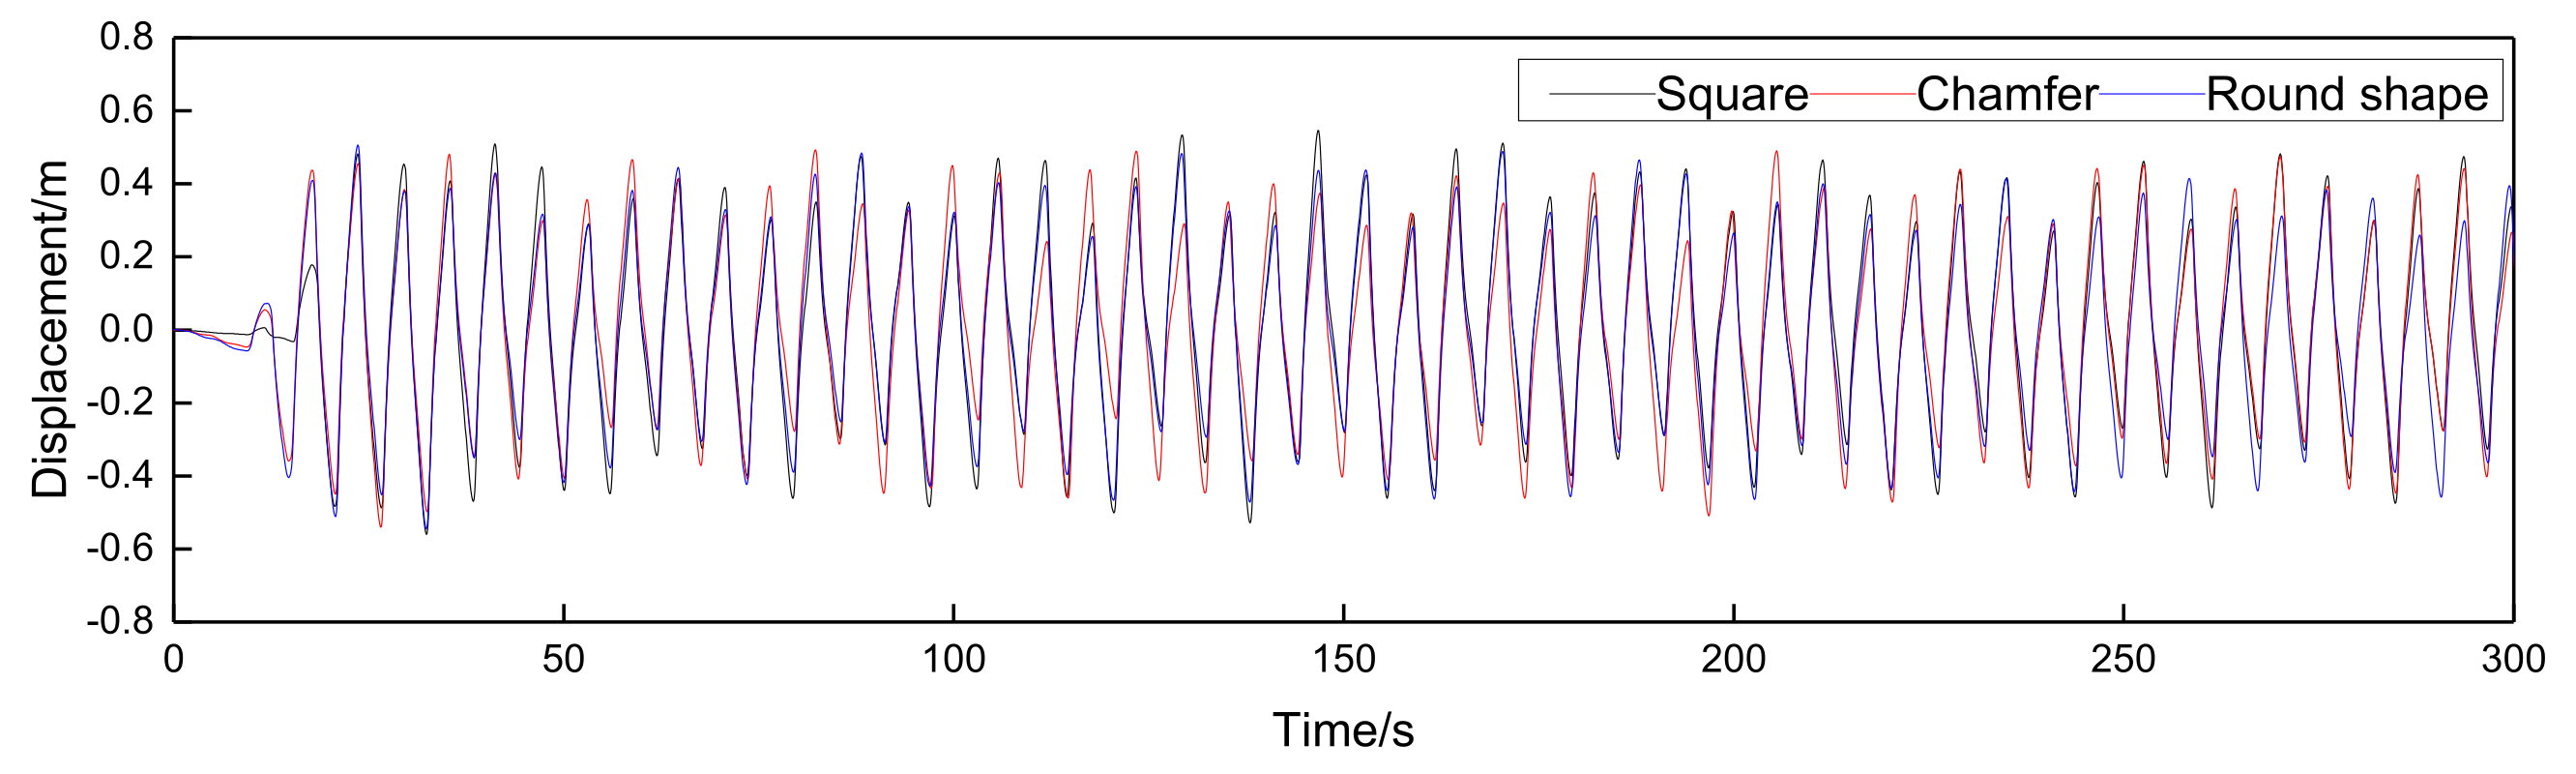
3.1. Horizontal Movement Analysis

According to the setting of the wind, wave, and current load parameters, we observed the time history of the device’s trajectory within 300 s, as shown in Figure 5. We observed the movement trajectory time duration within 300 s longitudinally, as shown in Figure 6. This was a comprehensive analysis of the displacement limiting performance of the mooring system. The device produced a positive or negative movement displacement with wind, wave, and current loads, and reached a stable state under a certain movement amplitude after a period of continuous drift. In this state, the balance was adjusted after a short period of oscillation. At this time, the two anchor chains on the wave-facing surface of the device were in an intermittently tensioned state, causing the device to oscillate with a small amplitude at this position—that is, the movement of the device was restricted to within a specific area. Through the motion analysis of three different types of heave plate devices, it can be seen that the lateral movement amplitude of the device with chamfered heave plates is approximately 0.40 m. After the device reaches a stable state in the longitudinal direction, the motion amplitude in this direction is approximately 0.20 m, which is smaller than the motion amplitude of the other two heave plate devices, and the horizontal limit effect is the best.

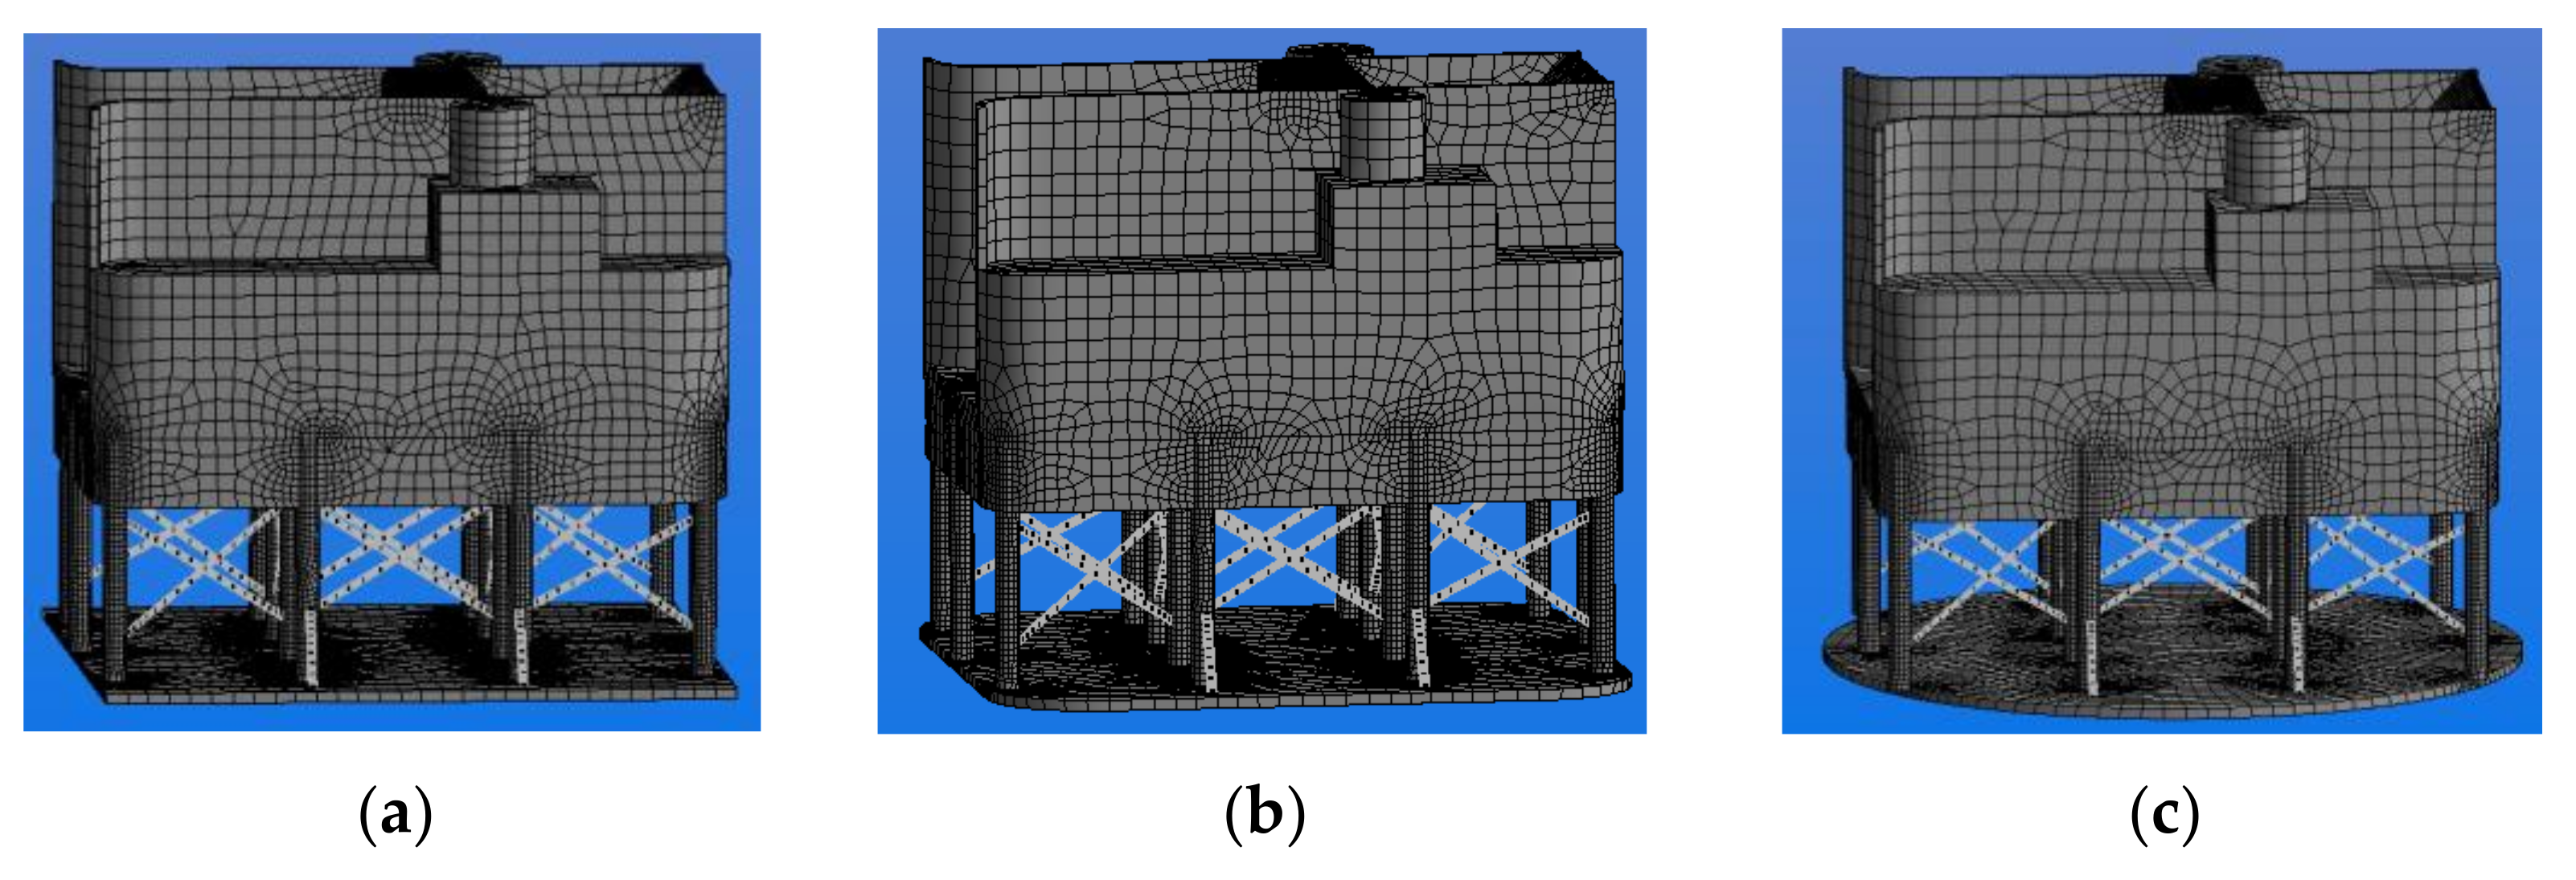
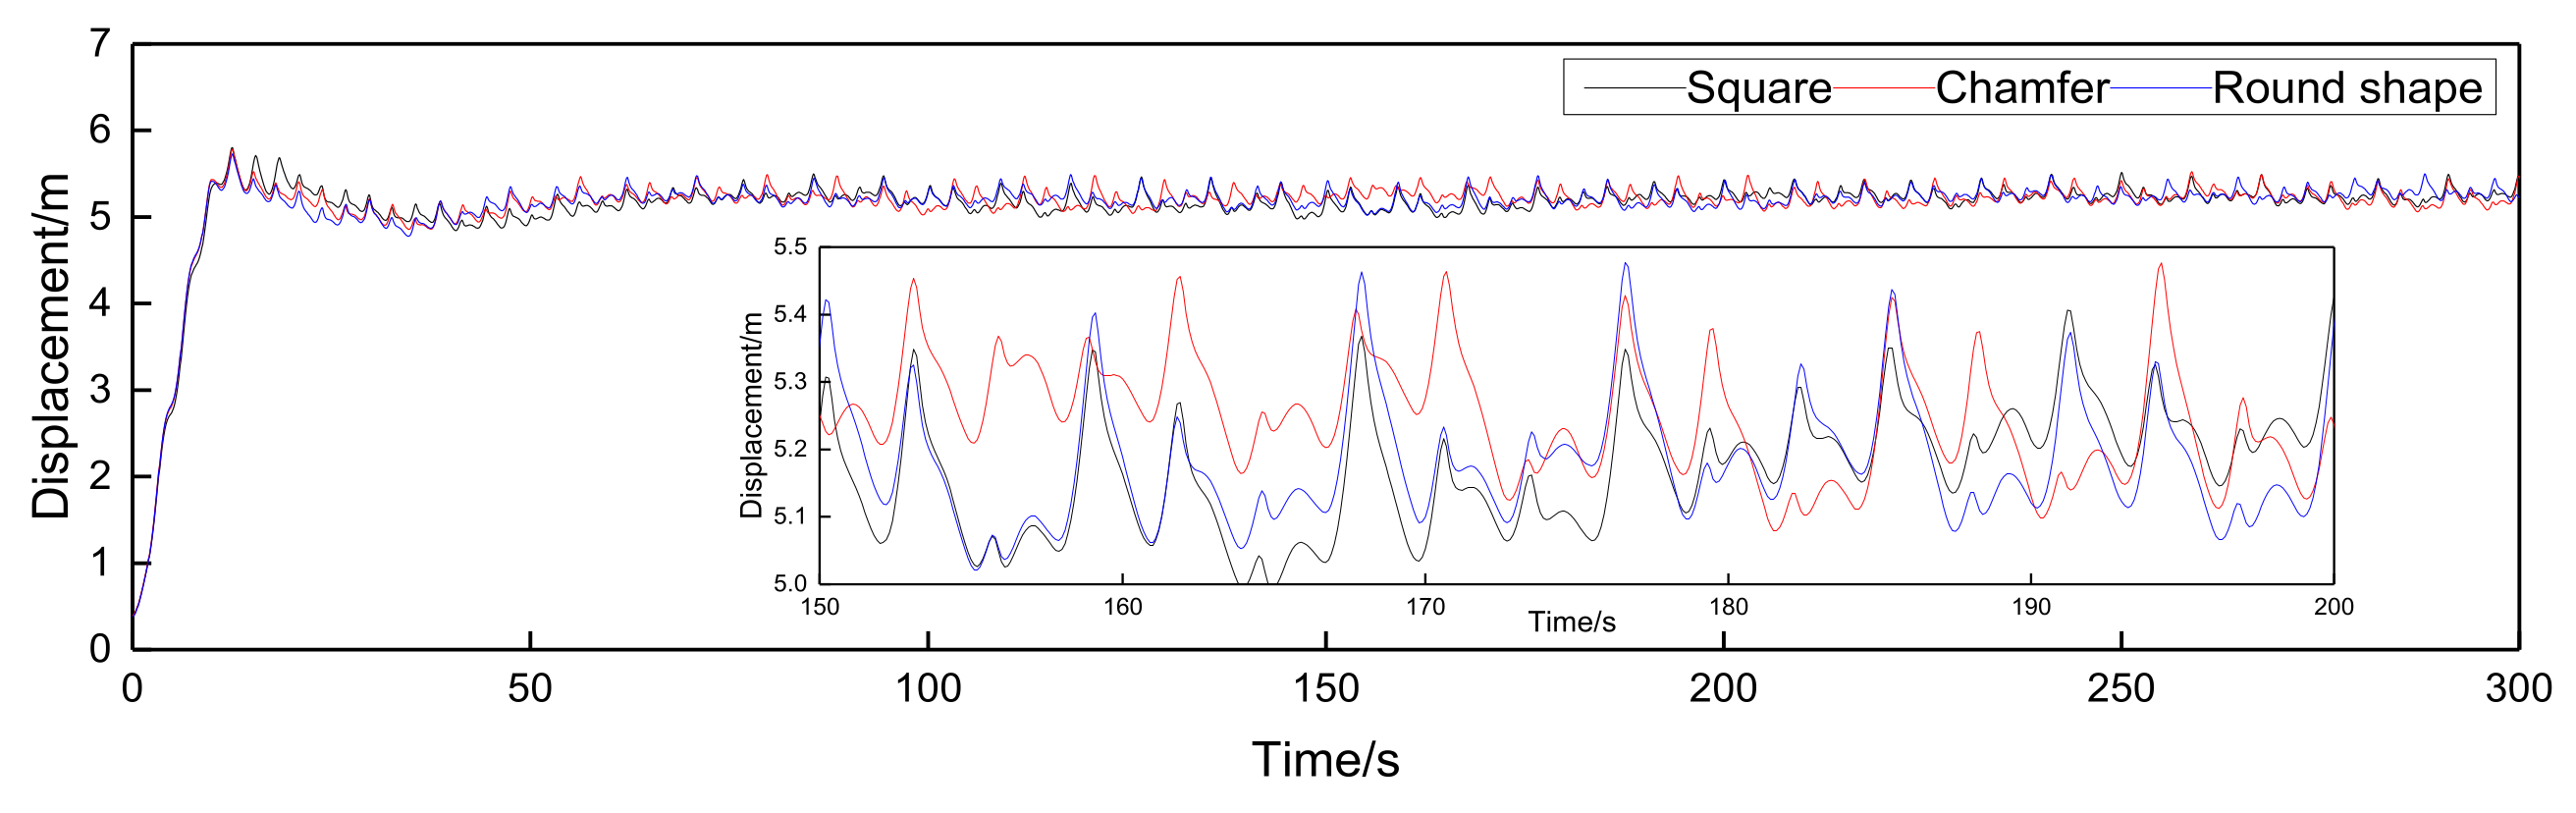
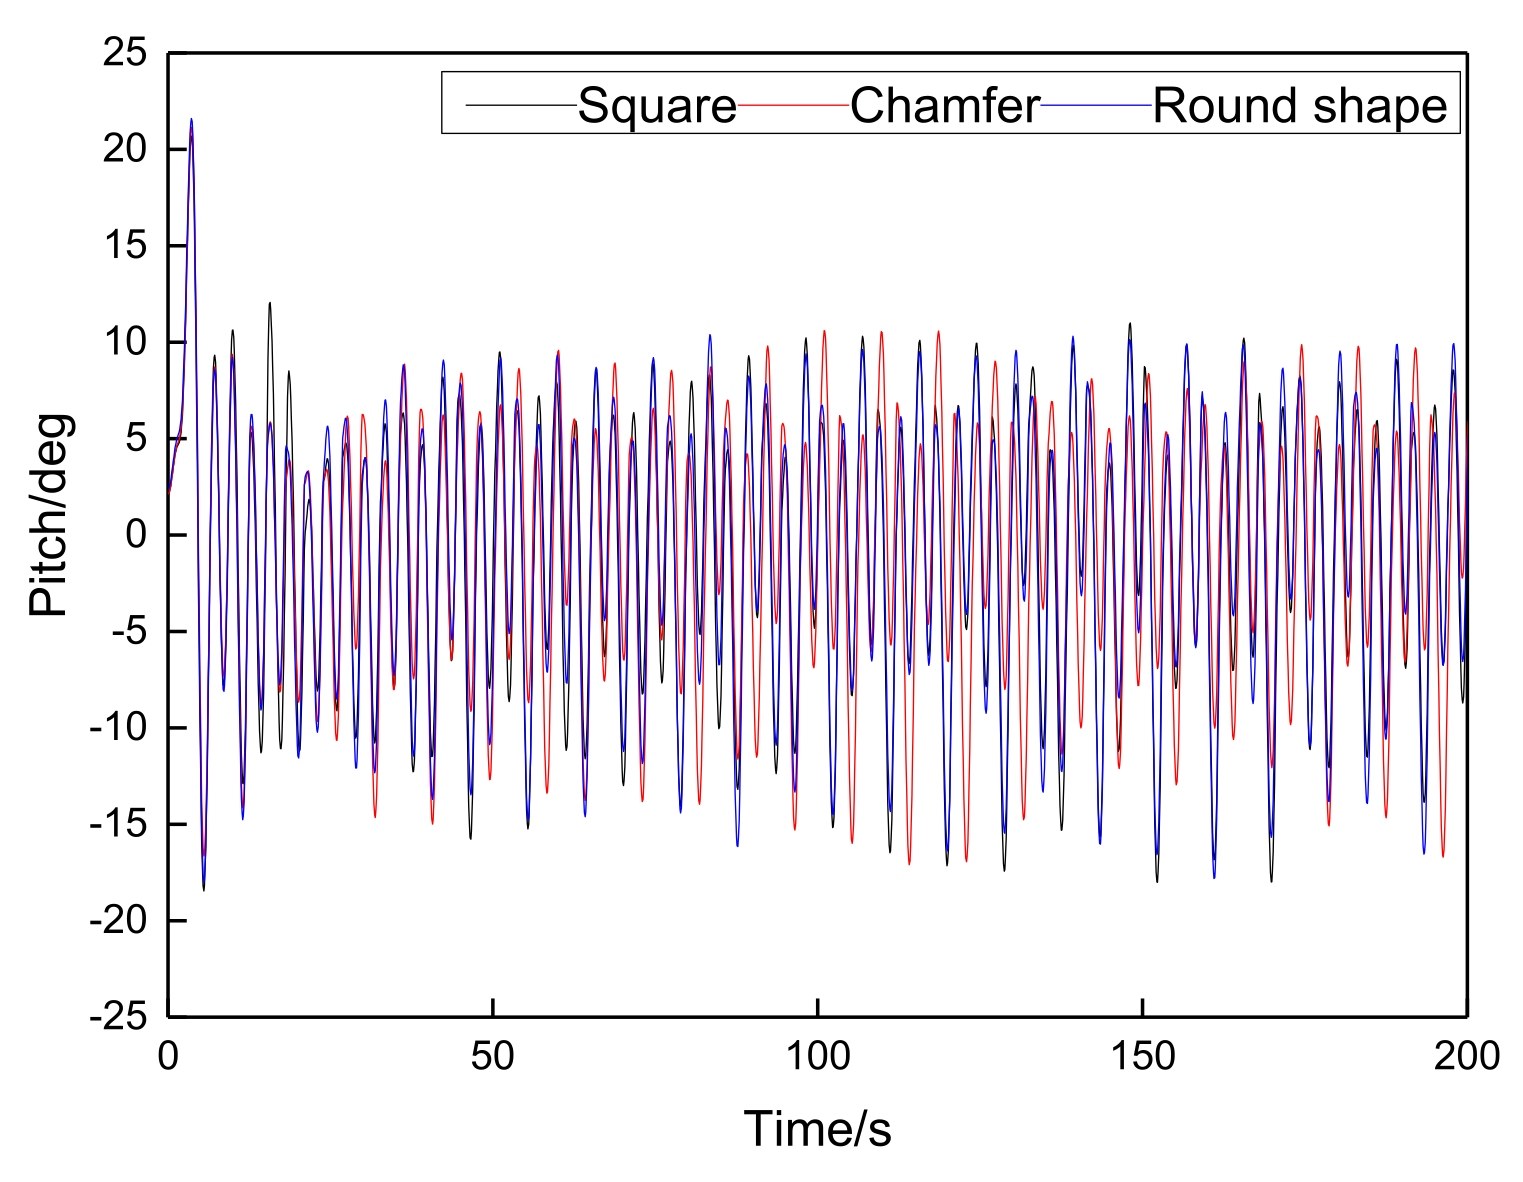
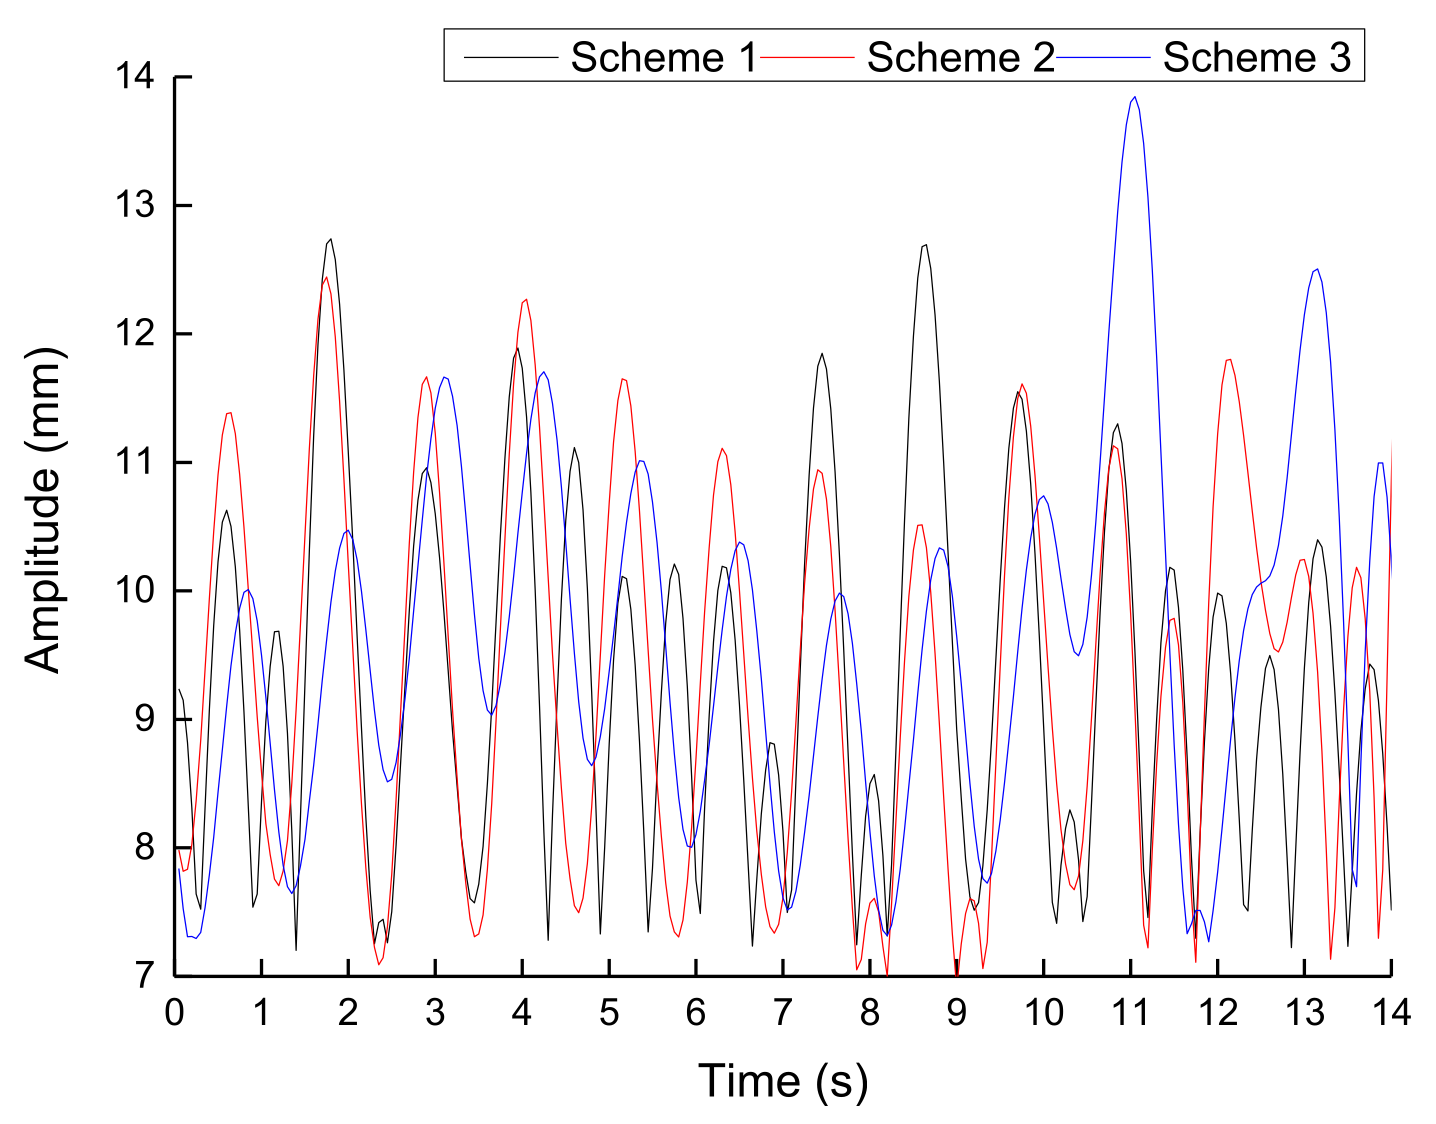
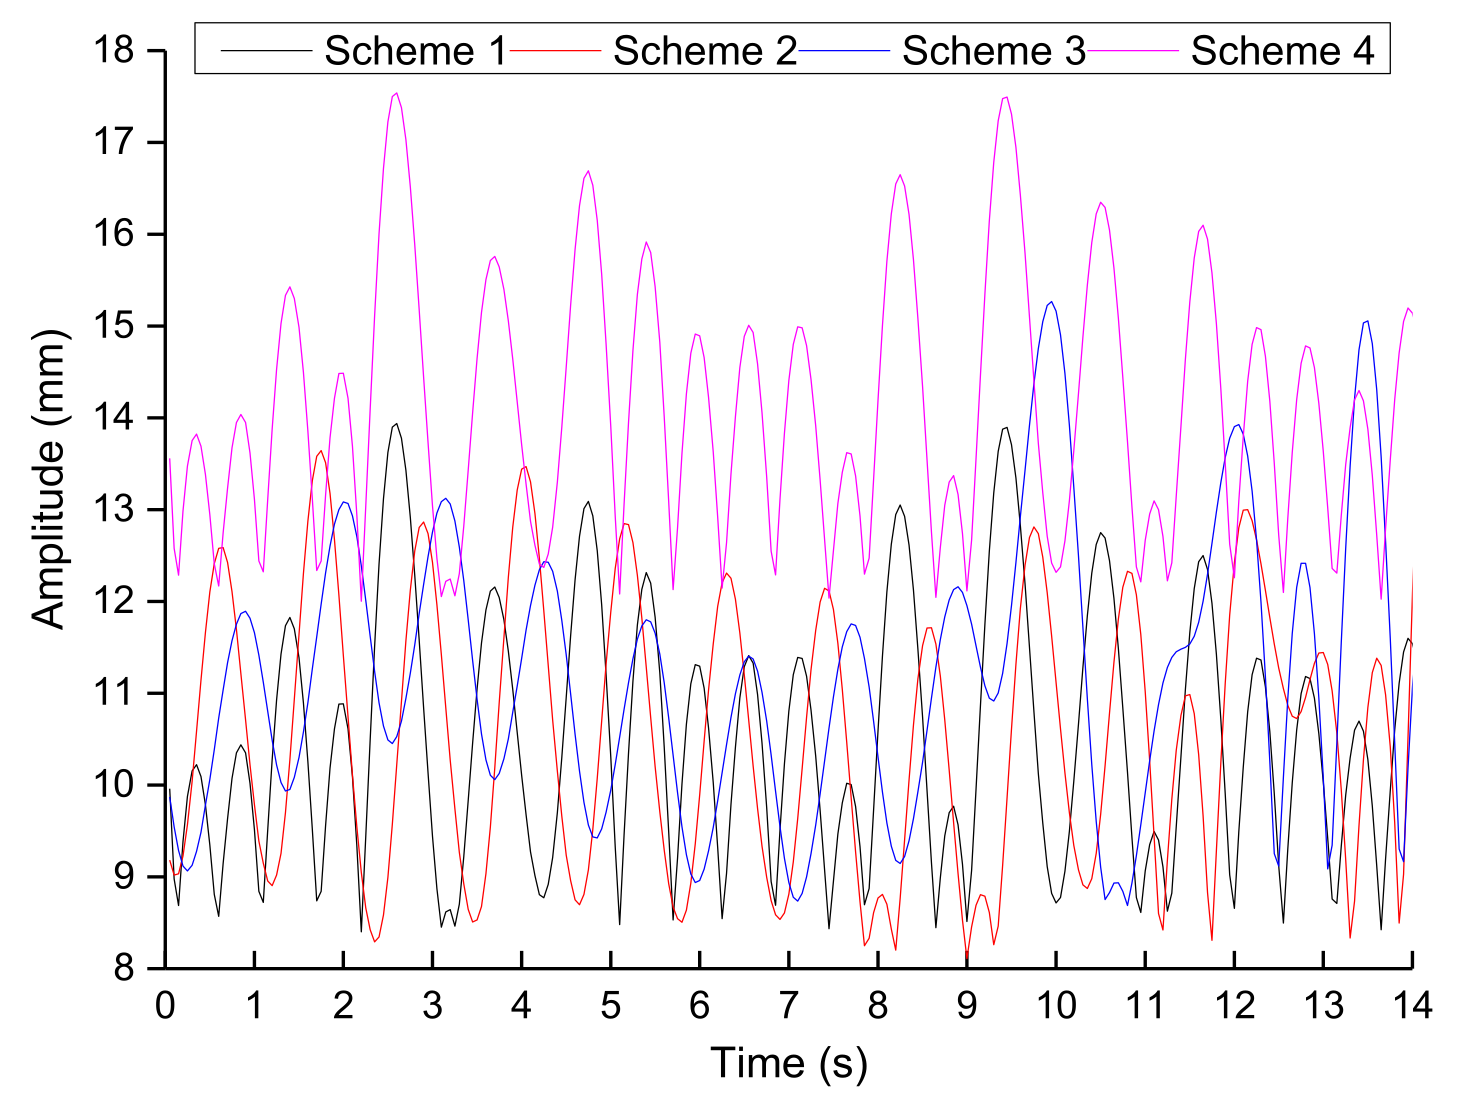
3.2. Heave and Pitch Motion Analysis

During the movement of the device, heave motion and pitch motion have the greatest impact on the wave energy capture efficiency of the device. Therefore, it is necessary to analyze the heave and pitch motion response of the device in the mooring state. Figure 7 shows the trajectory of the device’s center of mass in the heave direction (the center of mass is below the horizontal plane). It can be seen from Figure 7 that the amplitude of the circular heave plate device in the heave direction was the largest, approximately 0.3 m. The amplitude of the square heave plate device in the heave direction was approximately 0.25 m. The amplitude of the chamfered heave plate device in the heave direction was approximately 0.23 m. It was observed that the chamfered heave plate had a relatively good restraining effect on the movement of the device in the heave direction. Figure 8 shows the shaking angles of three different shapes of heave plate devices in the pitch direction. The average pitch angle of the circular heave plate device was approximately 10°. The average pitch angles of the square and chamfered heave plates were approximately 8°. Therefore, it can be seen that in regard to the pitch direction, the stability of the square and chamfered heave plates was better than that of the round heave plates. Through the analysis of the responses of different shapes of heave plate devices in the heave and pitch directions under the mooring state, it was observed that under the same area and same working conditions that the stability of the device with the chamfered heave plate was best, while that of the square plate was second.

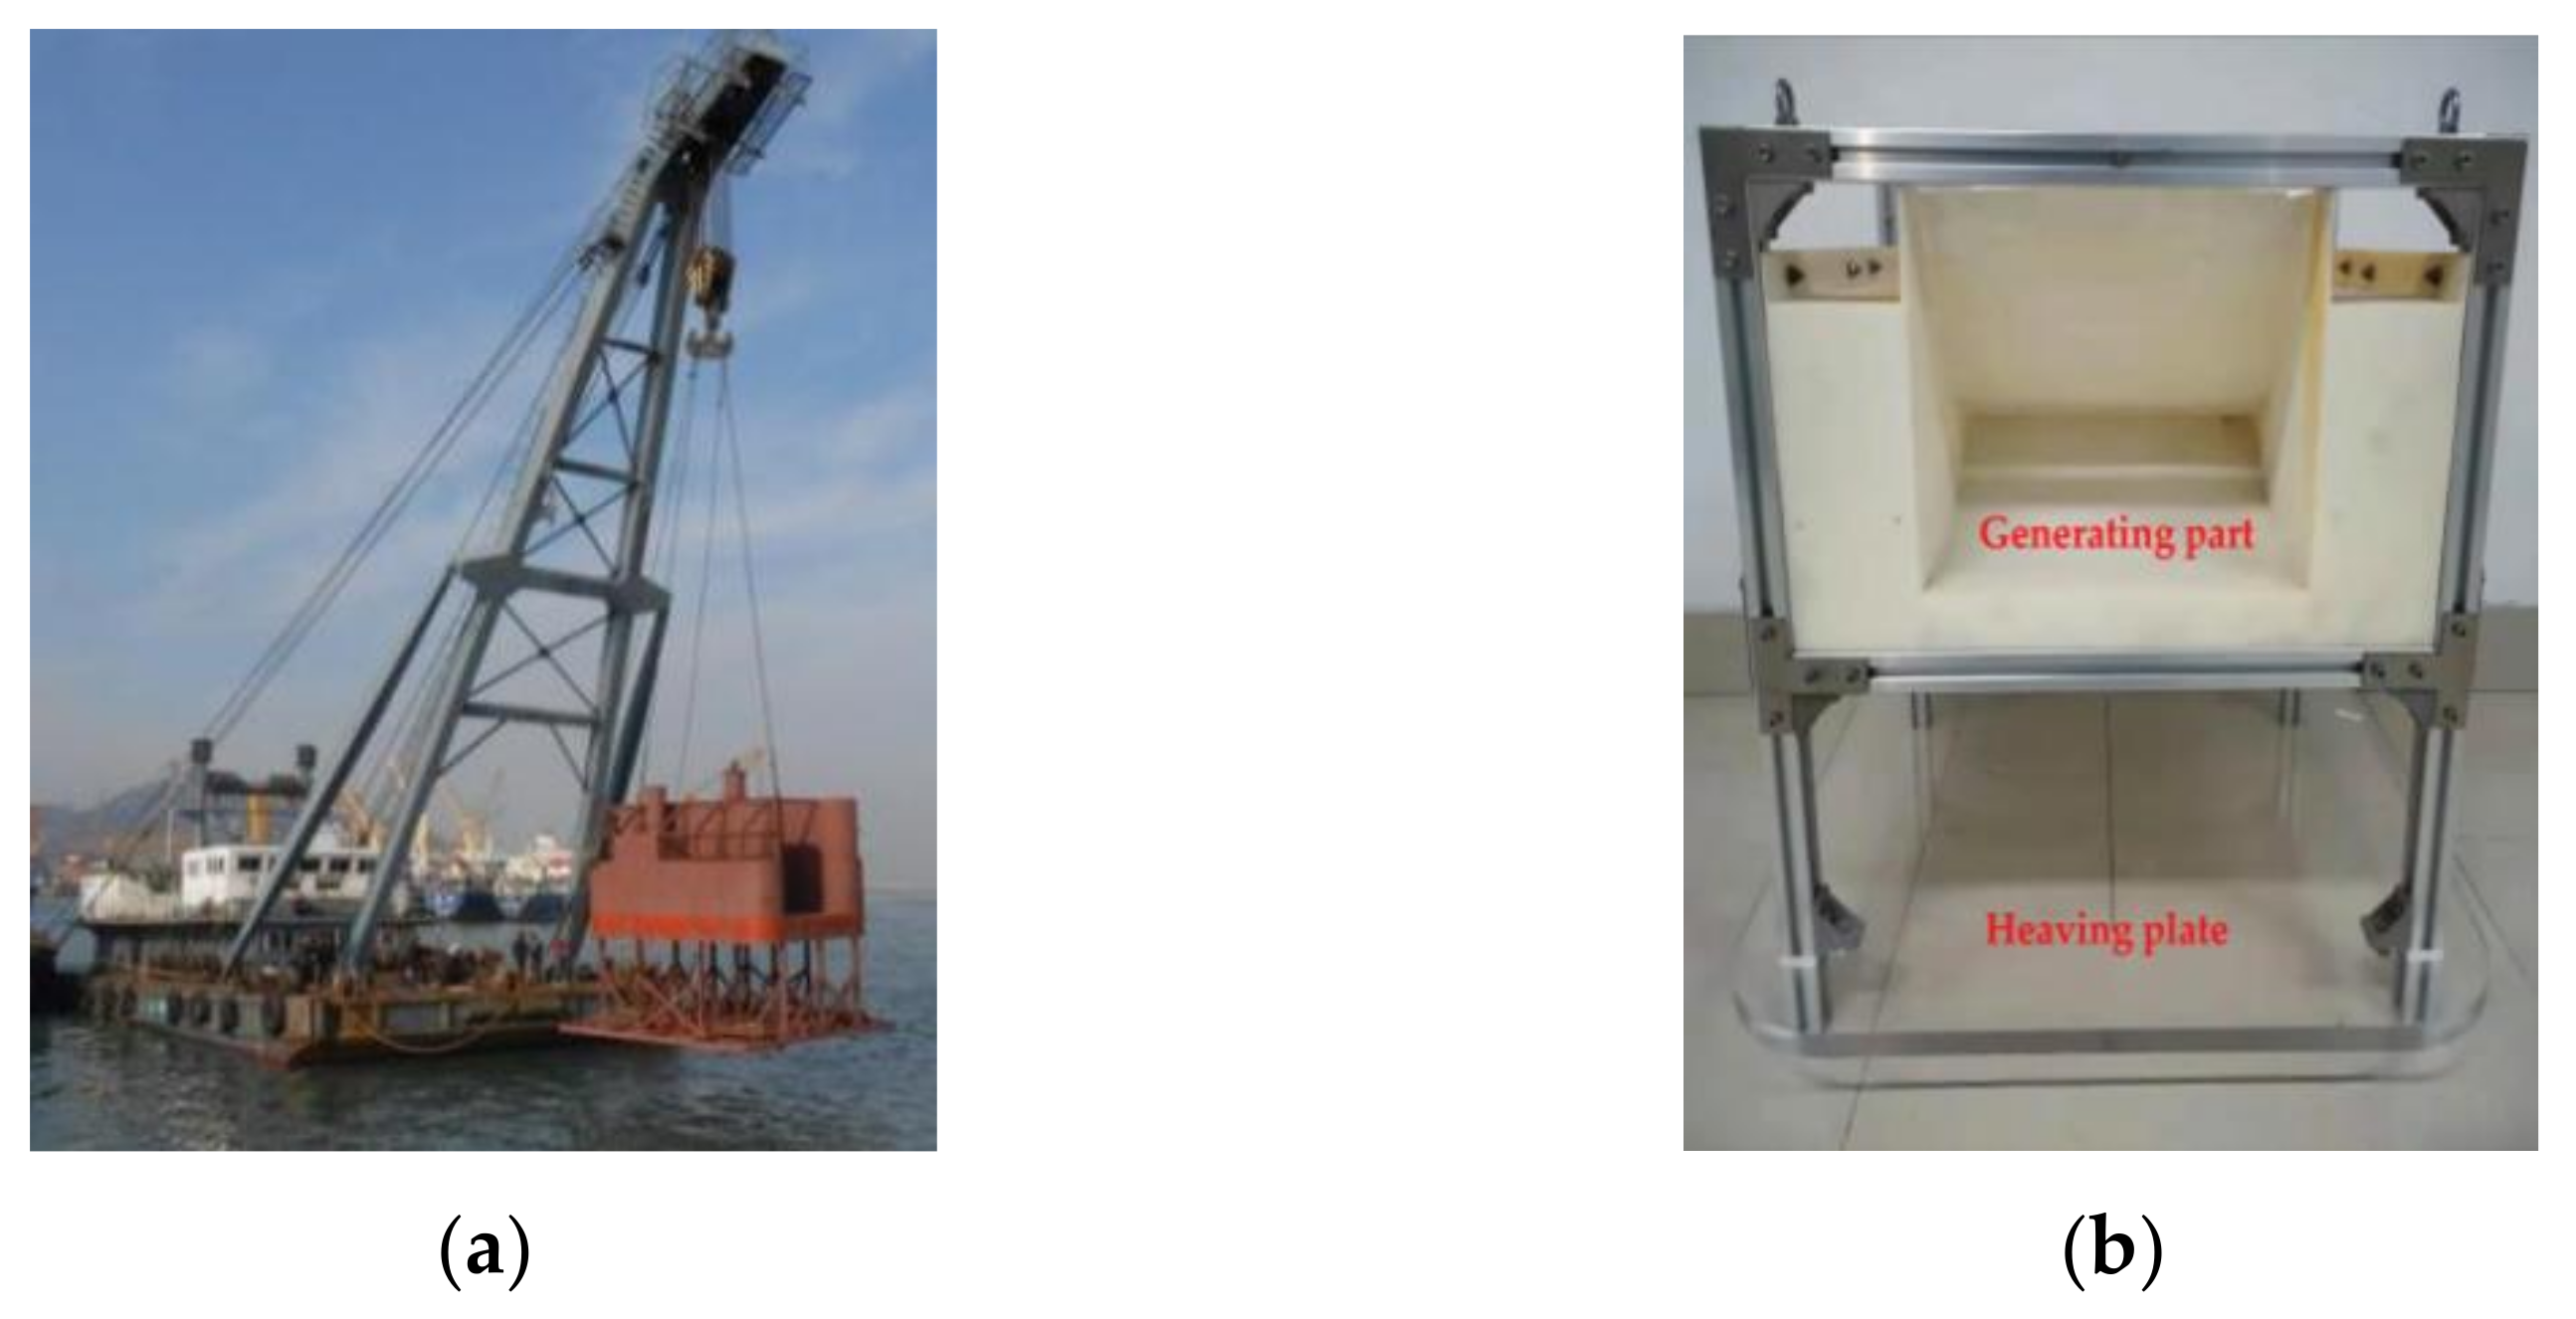
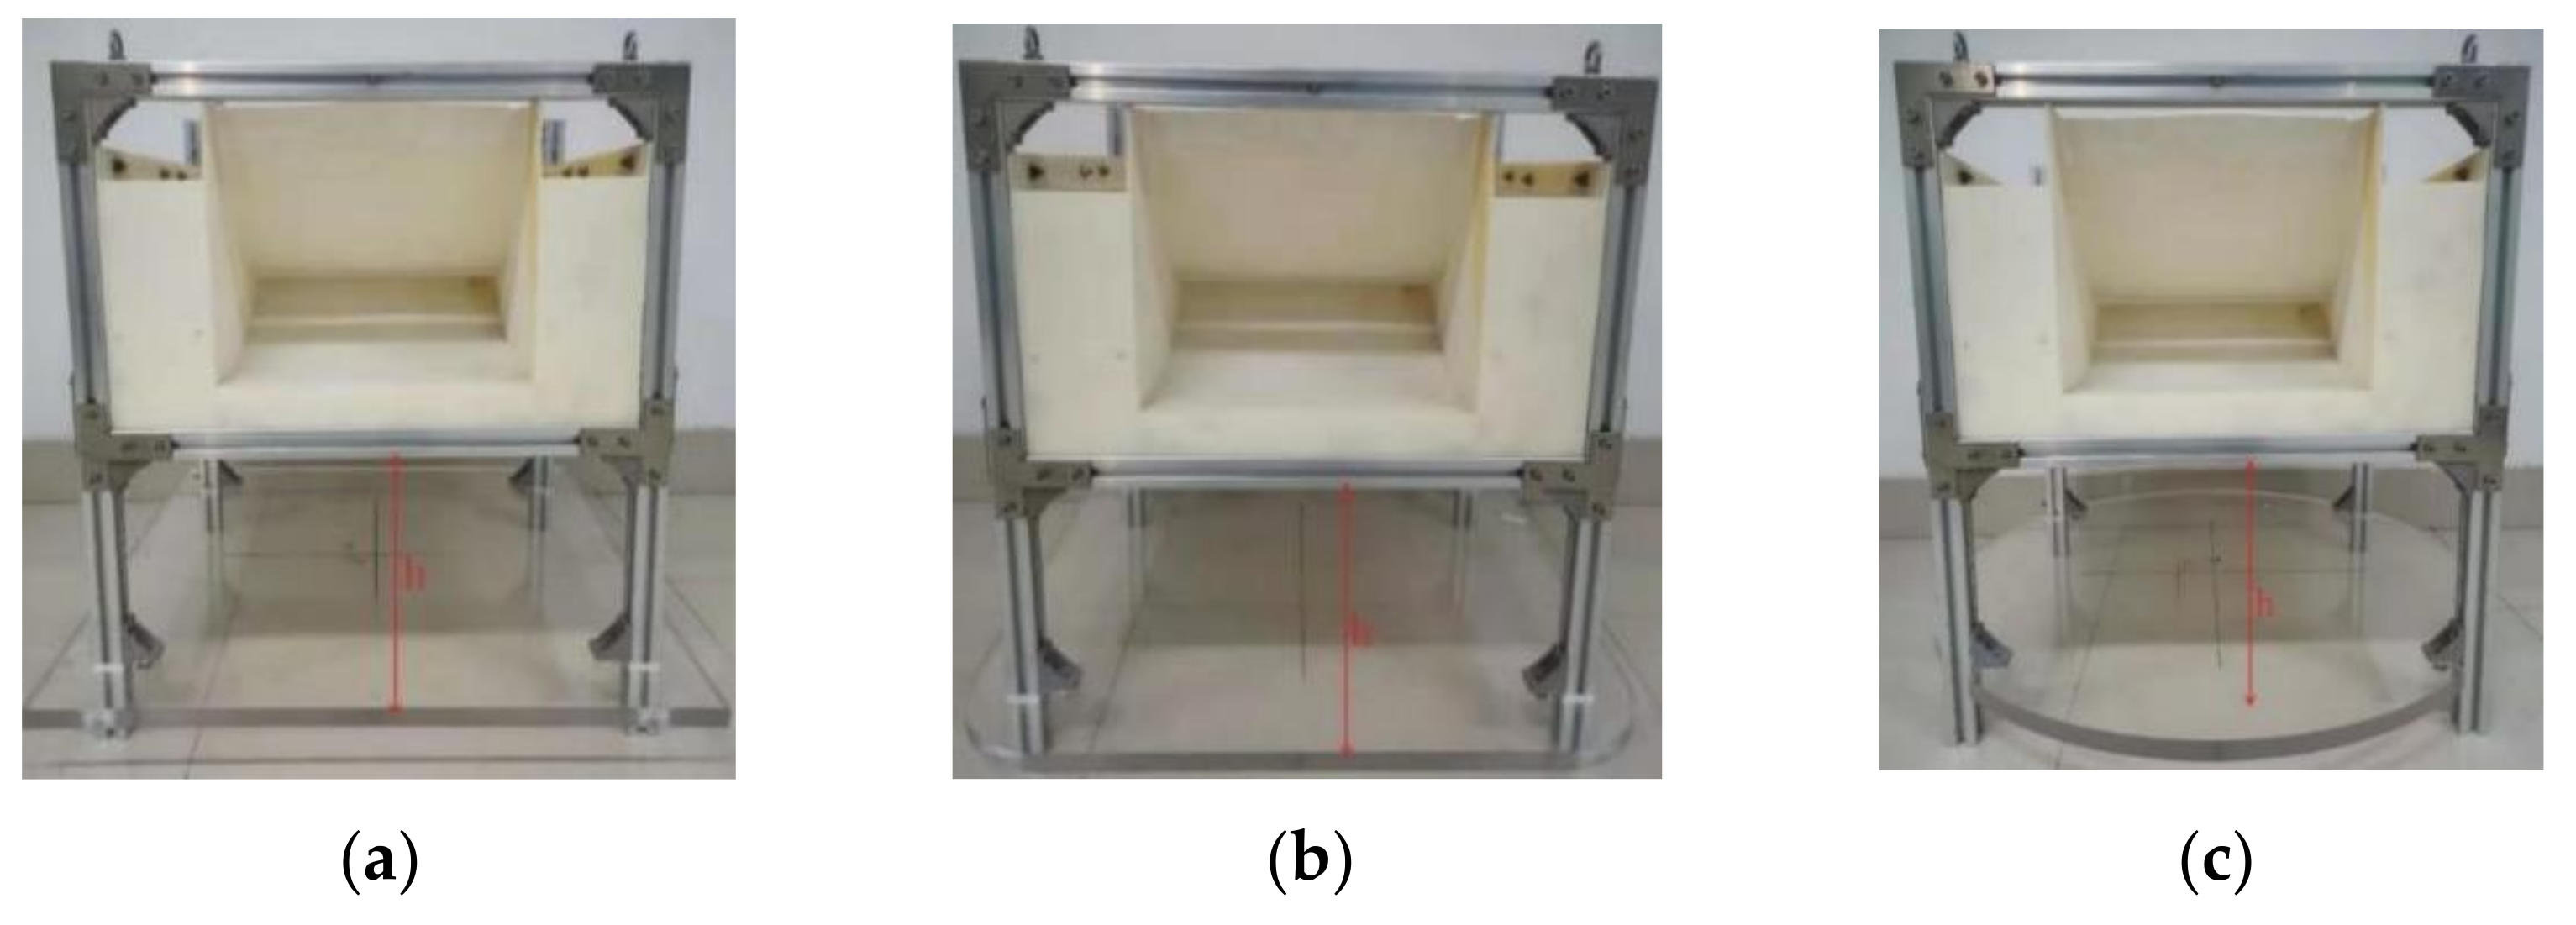
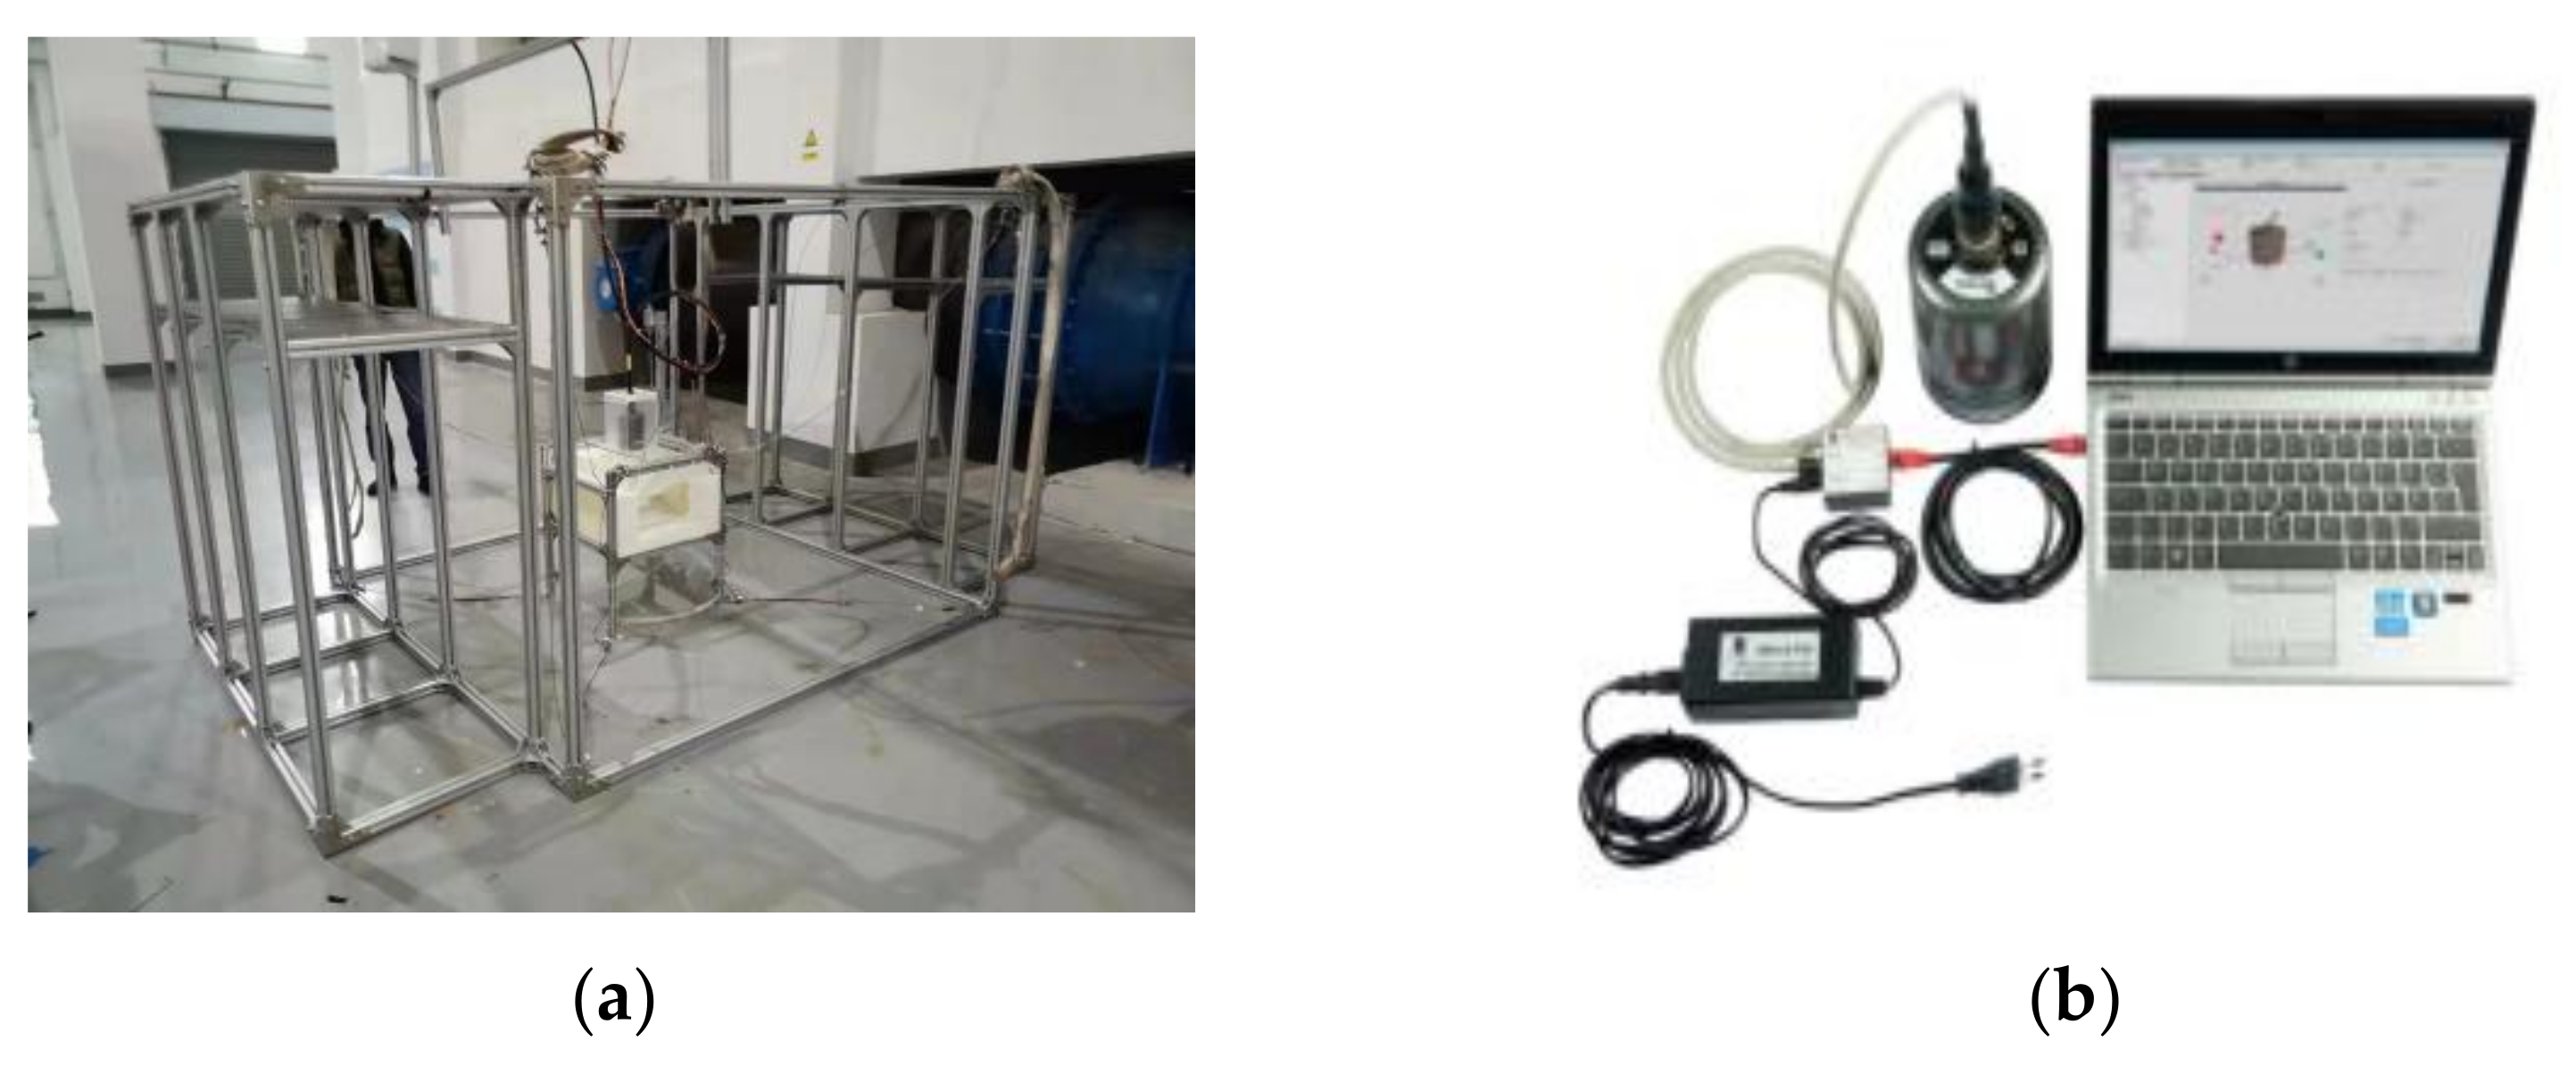
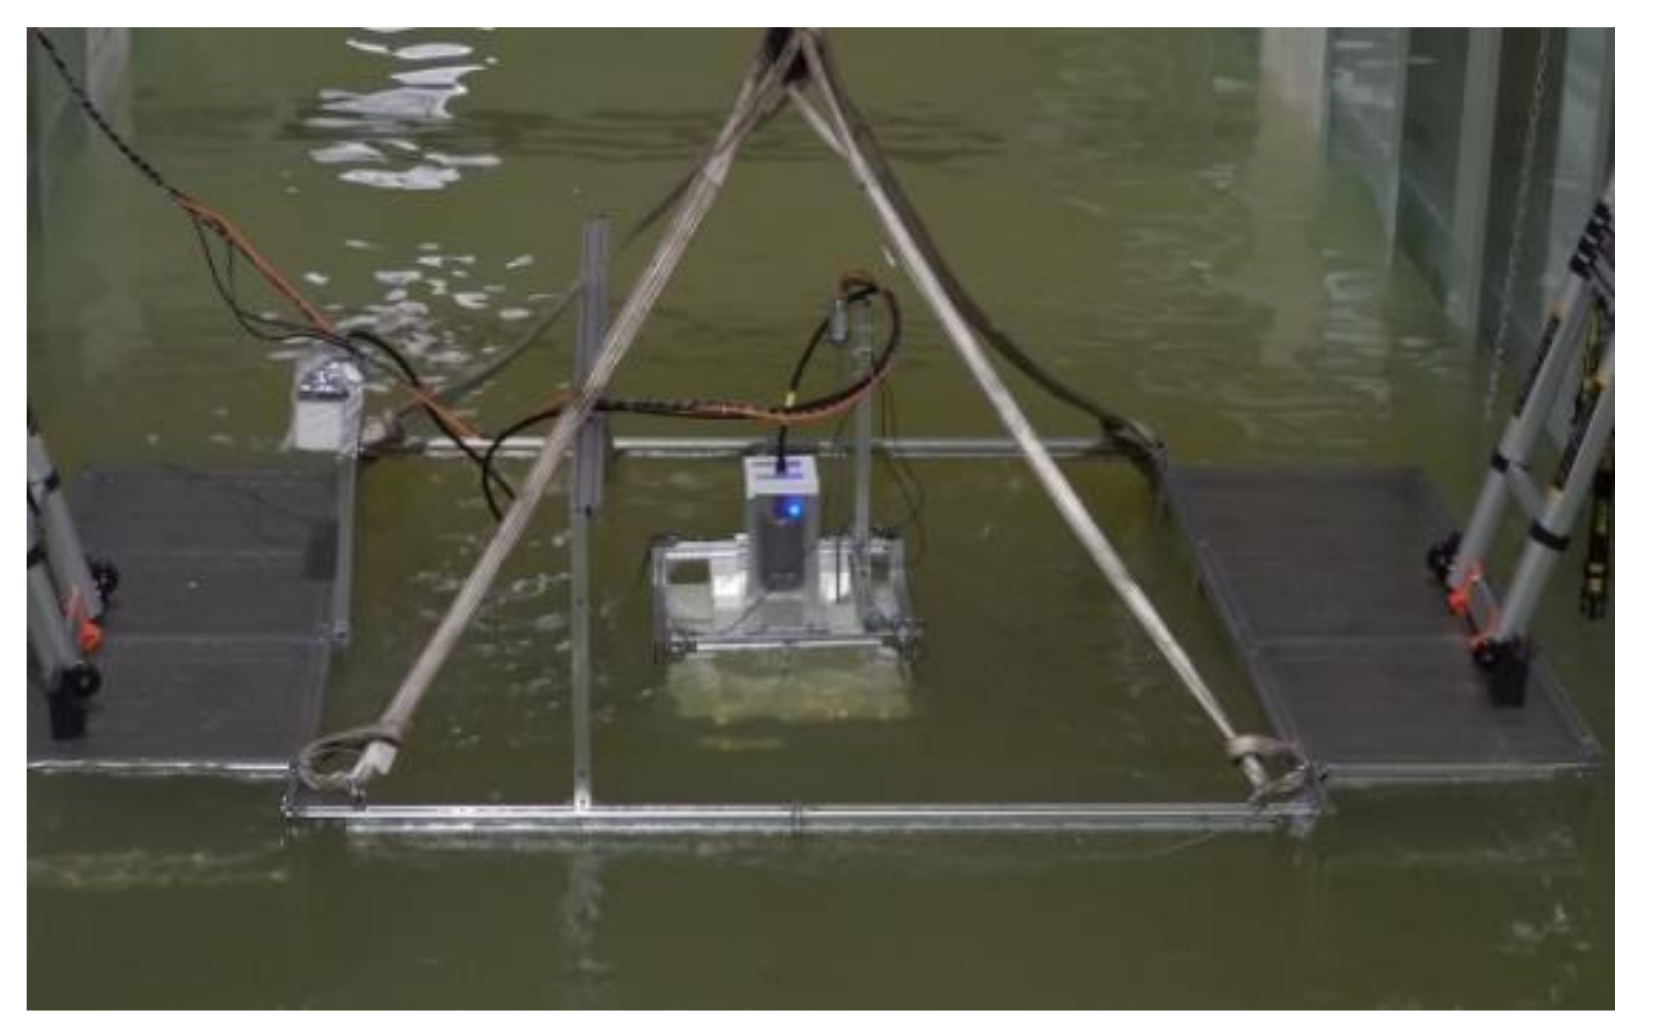
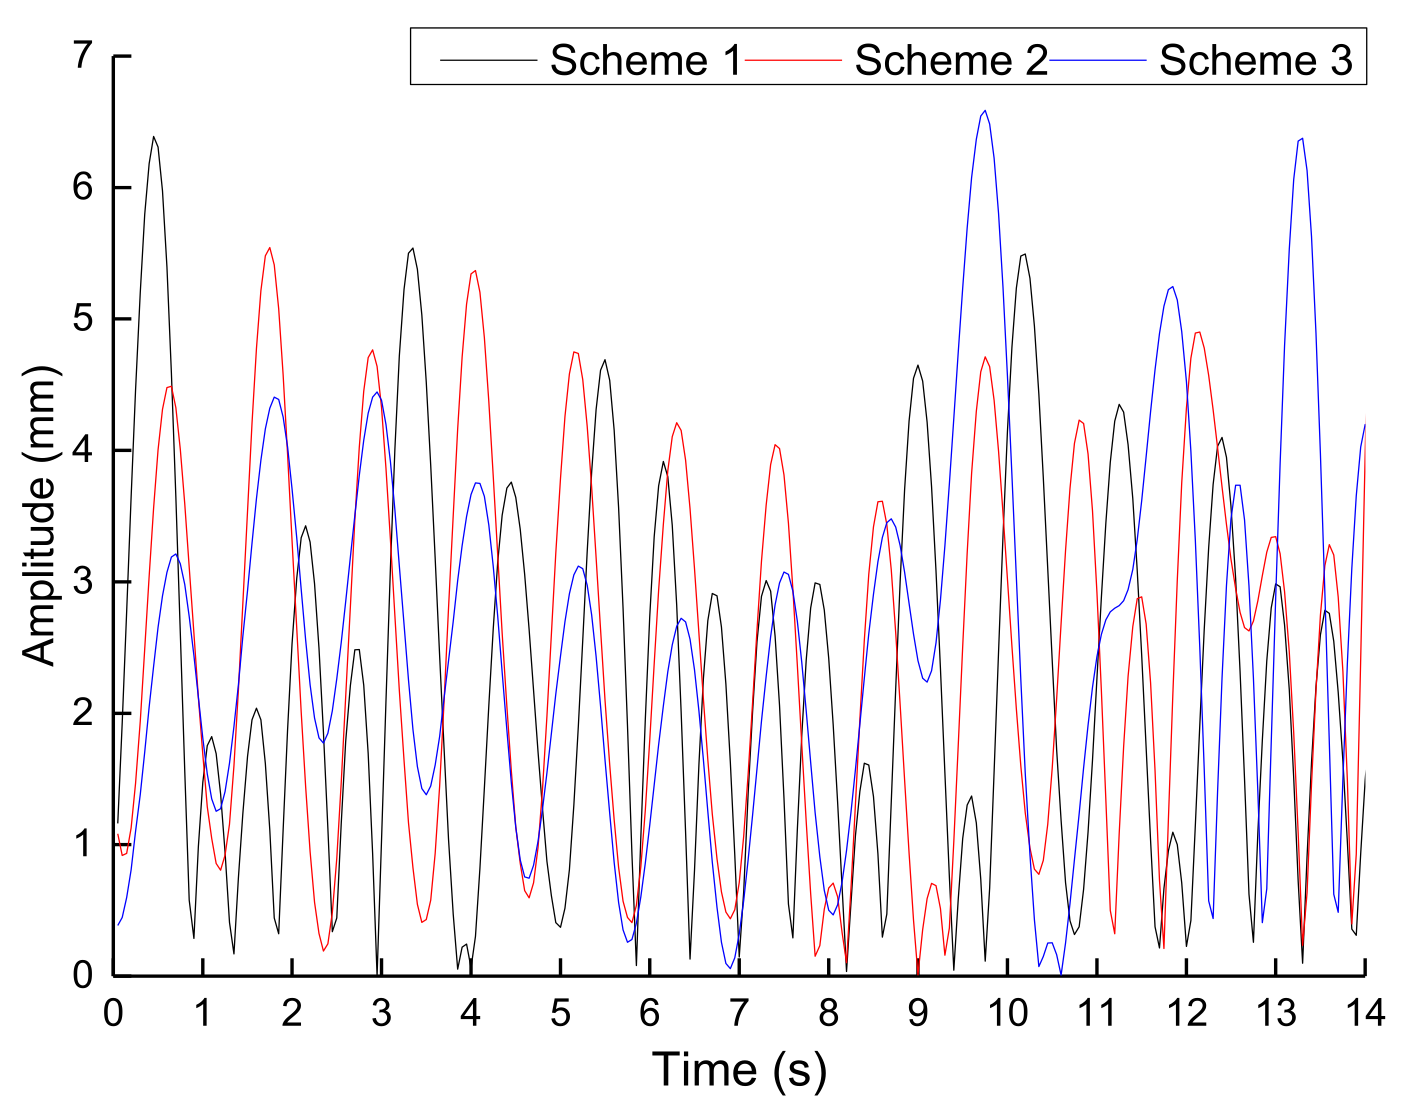
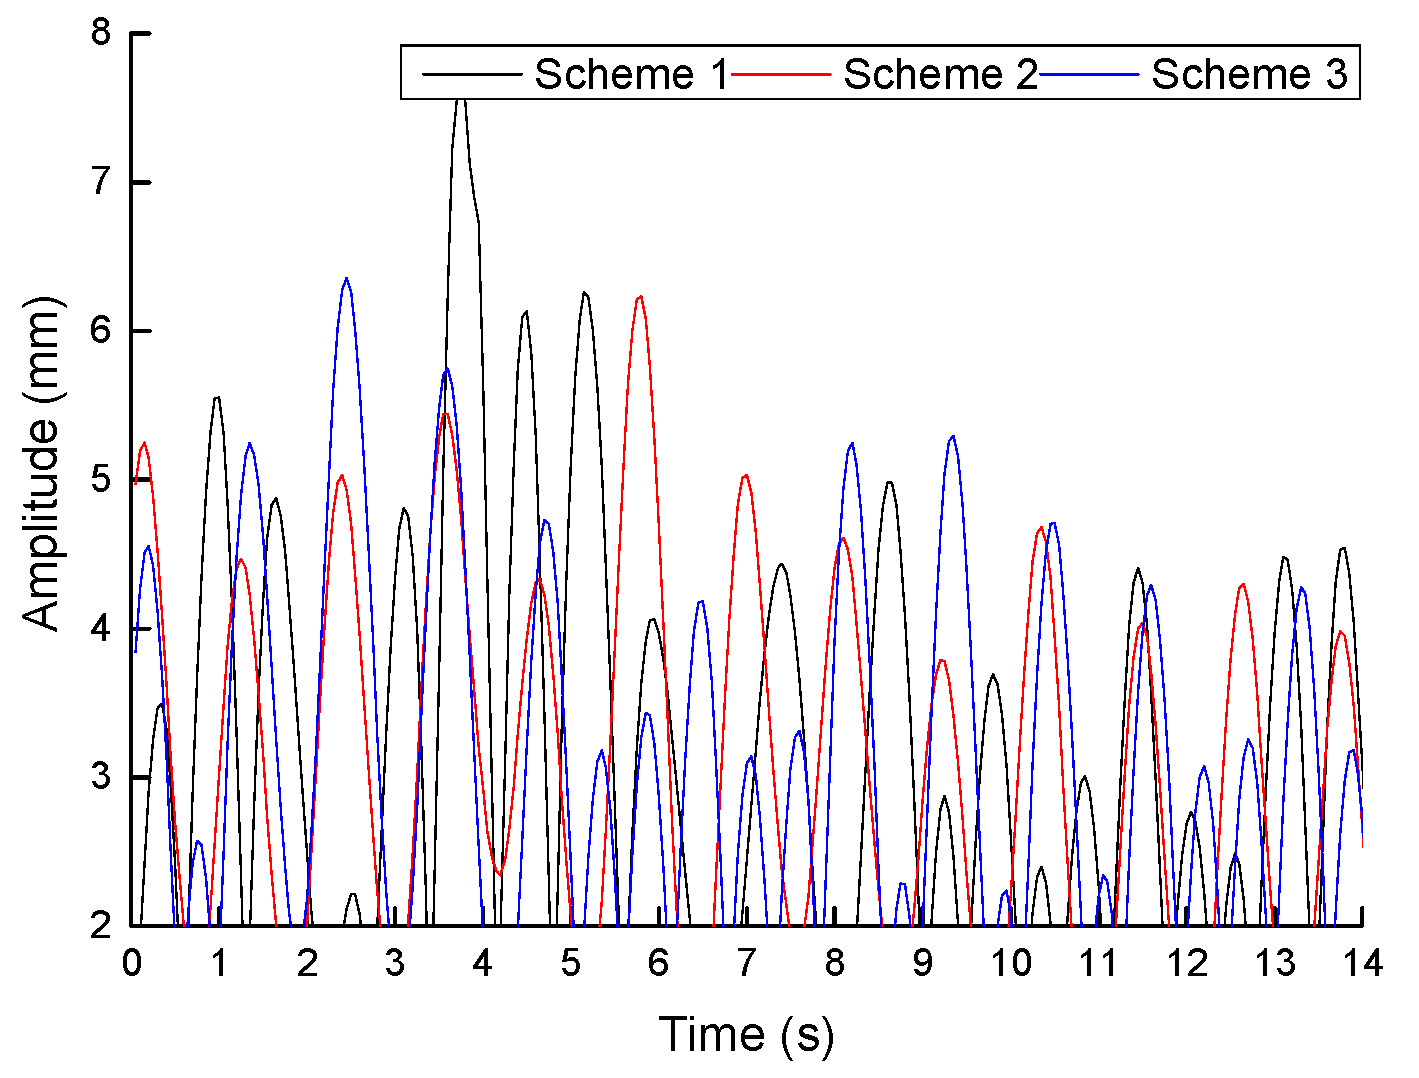
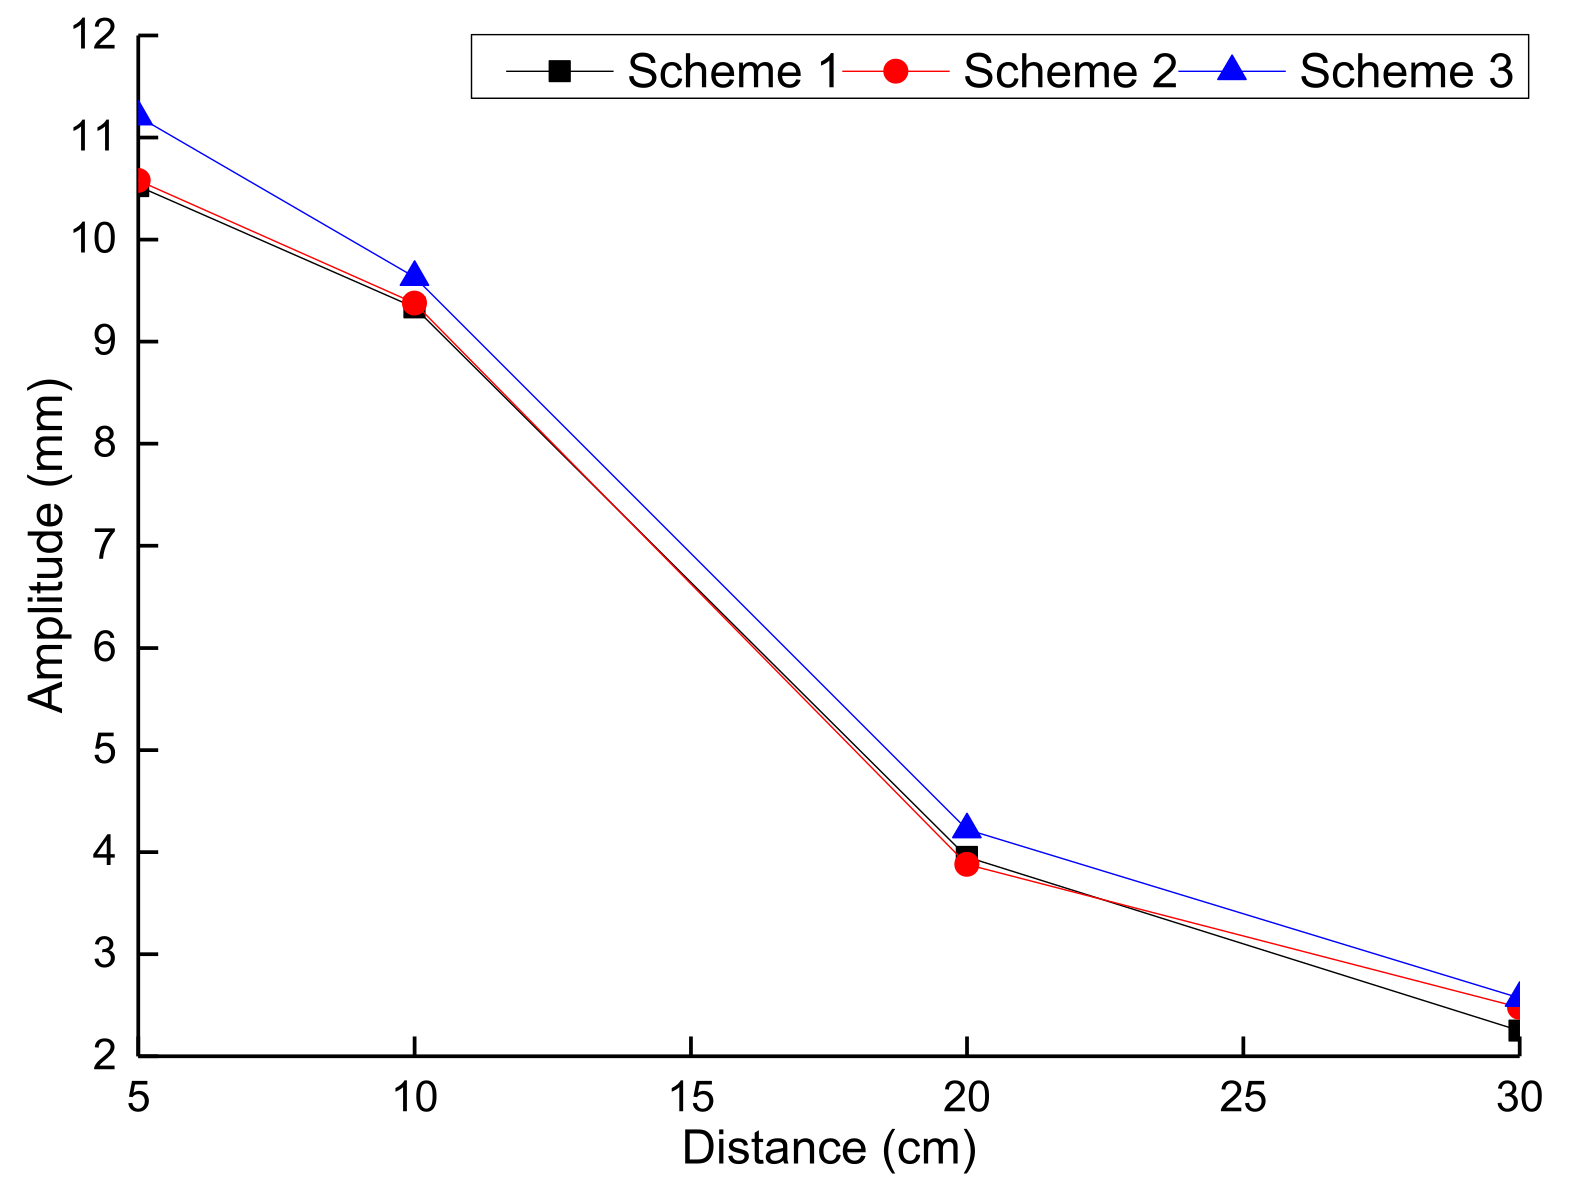
4. Regular Wave Experiment

Heaving is the largest factor that affects device stability. The model test was limited to the analysis of regular wave conditions in the swing direction. The model and mooring arrangement was narrowed by 1:10 according to the similar principles of the engineering prototype. Figure 9 shows three different shapes of the heaving plate mode. The heaving plates were the same at approximately 407,044 mm2. Scheme 1 is a square with a side length of 638 mm, scheme 2 is a rectangular chamber with a side length of 645 mm and chamber of 100 mm, and scheme 3 is a circle with a radius of 360 mm. In scheme 4, there is no heaving plate. The distances between the heaving plate and the generating part of the model were 5 cm, 10 cm, 20 cm, and 30 cm. Then, a regular wave test under the same conditions was conducted.
The model test was conducted in a wave current coupling tank in the National Engineering Laboratory. The tank was 30 m long, 4 m wide, and 3 m high. The model was divided into three parts, as shown in Figure 10a. These three parts were the model body, reorientation tester, and bracket. The main body of the model was reduced according to the principle of similarity, and then printed using 3D technology to ensure the shape of the flow channel. The model’s bracket was made of aluminum alloy. The reorientation tester was used to collect the heaving movement data. The lower part of the model body was moored to the bottom of the anchor with an anchor chain. This model was installed in approximately 10 m away from the direction of wave generation and was lifted by a bridge crane. The bottom of the anchor was fixed by the clump weight, which stabilized the entire part and prevented the movement of the anchor under the wave impact from influencing the test. The model acquisition system is shown in Figure 10b. The regular wave experimentation conditions are shown in Table 2.
The data acquisition device was a fifth-generation reorientation tester made by Kongsberg Maritime in Norway. It had an inertia reference system with dynamic linear movement and could dynamically test the change in six degrees of freedom and the angular velocity vector of the model. Under regular wave experimental conditions, the device moved stably after 10 s of wave generation. The data acquisition time was 25 s and the sampling period was 0.04 s. This test was conducted according to the experimental procedure to ensure the effectiveness of the data. The model test is shown in Figure 11. Movement data were acquired constantly after the device was set to the initial state. Then, the experimental data at 14 s were used for a comparative analysis, and the absolute value of all the amplitudes was mapped.
Figure 12 shows the amplitude change when the distance of the heaving plate, h, was 30 cm. The maximum value of scheme 1 was approximately 6.4 mm, with an average amplitude of 2.25 mm. The maximum value of scheme 2 was approximately 5.5 mm, with an average amplitude of 2.47 mm. The maximum value of scheme 3 was approximately 6.6 mm, with an average amplitude of 2.57 mm. The heaving amplitude of scheme 3 was the largest, while that of scheme 2 was the smallest, and the amplitude was relatively even. The average movement amplitudes, in order from largest to smallest, were as follows: scheme 3 > scheme 1 > scheme 2. When the distance was 30 cm, scheme 2 is preferred, followed by scheme 1.
Figure 13 shows the amplitude change when the distance of the heaving plate, h, was 20 cm. The maximum value of scheme 1 was approximately 12.7 mm, with an average amplitude of 3.95 mm. The maximum value of scheme 2 was 12.5 mm, with an average amplitude of 3.88 mm. The maximum value of scheme 3 was 13.8 mm, with an average amplitude of 4.22 mm. The heaving amplitude of scheme 3 was the largest, and the average movement amplitudes were as follows: scheme 3 > scheme 1 > scheme 2.
Figure 14 shows the amplitude change when the distance of the heaving plate, h, was 10 cm. The amplitude maximum value of scheme 1 was approximately 12.8 mm, with an average amplitude of 9.33 mm. The amplitude maximum value of scheme 2 was approximately 12.5 mm, with an average amplitude of 9.38 mm. The amplitude maximum value of scheme 3 was approximately 13.9 mm, with an average amplitude of 9.63 mm. The heaving amplitude of scheme 3 was the largest, and the averages were as follows: scheme 3 > scheme 2 > scheme 1.
Figure 15 shows the amplitude change when the distance of the heaving plate, h, was 5 cm. The amplitude maximum value of scheme 1 was approximately 13.9 mm, with an average amplitude of 10.52 mm. The amplitude maximum value of scheme 2 was approximately 13.5 mm, with an average amplitude of 10.58 mm. The amplitude maximum value of scheme 3 was approximately 15 mm, with an average amplitude of 11.20. The amplitude maximum value of scheme 4 was approximately 17.5 mm, with an average amplitude of 14.12 mm. The maximum amplitudes, in order from largest to smallest, were as follows: scheme 4 > scheme 3 > scheme 1 > scheme 2, and the average movement amplitudes were as follows: scheme 4 > scheme 3 > scheme 2 > scheme 1.
Figure 16 shows the change in the average amplitude of the heaving plate as the installation distance changes. The average amplitudes of the three different shapes of heaving plates decreased with an increasing installation distance. When the distance was between 10 mm and 20 mm, the average amplitude changed significantly, and when the distance was between 20 mm and 30 mm, the average amplitude changed relatively little. Therefore, the installation distance under this regular wave condition should be more than 20 mm. When the areas were the same, the average amplitude of the circular heaving plate was greater than that of the square heaving plate and chamber heaving plate.

5. Conclusions

The principle and structure of a new type of wave energy converter were introduced in this paper. Three different shapes of heaving plates were chosen to analyze the largest factor, i.e., heaving, which will affect the wave energy stability, and a motion simulation was performed in the heaving direction and swing direction. The research results show that when the area of the heave slab is the same, scheme 2 is better than scheme 1 and scheme 3. The water tank experiment on the heaving plate with different installation distances under regular wave conditions showed that the average amplitudes of three different shapes of heaving plates decreased with increasing installation distance. When the distance was between 10 mm and 20 mm, the average amplitude changed significantly, and when the distance was between 20 mm and 30 mm, the average amplitude changed relatively little. Therefore, the installation distance under this regular wave condition should be greater than 20 mm and less than 30 mm. The experimental data showed that when the areas were the same, the average amplitude of the circular heaving plate was greater than that of the square heaving plate and chamber heaving plate. Therefore, the rectangular chamber heaving plate was preferred, followed by the square heaving plate. Based on the above analysis, it can be concluded that the motion amplitude of the new wave energy conversion device in the heave direction mainly depends on two factors: the shape of the heave plate and the installation distance. This result fills in the void of experimental research on the mooring of small wave energy generators.

Author Contributions

Conceptualization, software, methodology, data curation, writing original draft preparation and validation, Z.M.; conceptualization, supervision and funding acquisition S.L. and Y.C.; supervision, Y.C.; writing—review and editing, Z.M. and Y.C.; project administration, Y.C. and Z.M. All authors contributed to the design of the study. All authors discussed, read, edited and approved the article. All authors have read and agreed to the published version of the manuscript.

Funding

This research received financial support from the National Nature Science Foundation of China under Grant No. U1706230 and from the Shandong Outstanding Youth Fund under Grant No. ZR2020YQ37.

Institutional Review Board Statement

Not applicable.

Informed Consent Statement

Not applicable.

Data Availability Statement

Not applicable.

Acknowledgments

Thank you very much for the support provided by the cooperation project of the China Institute of Water Resources and Hydropower Research.

Conflicts of Interest

The authors declare no conflict of interest.

References

  1. Li, F.; Di, H. Analysis of the Financing Structure of China’s Listed New Energy Companies under the Goal of Peak CO2 Emissions and Carbon Neutrality. Energies 2021, 14, 5636. [Google Scholar] [CrossRef]
  2. Wang, Q.; Xu, X. Research on development path of modern coal chemical industry under background of “emission peak” and “carbon neutrality”. Mod. Chem. Ind. 2021, 41, 1–3. [Google Scholar]
  3. Fang, K.; Li, C.; Tang, Y.; He, J.; Song, J. China’s pathways to peak carbon emissions: New insights from various industrial sectors. Appl. Energy 2021, 306, 118039. [Google Scholar] [CrossRef]
  4. Cui, X.; Shaojun, E.; Niu, D.; Wang, D.; Li, M. An Improved Forecasting Method and Application of China’s Energy Consumption under the Carbon Peak Target. Sustainability 2021, 13, 8670. [Google Scholar] [CrossRef]
  5. Wang, F.; Gao, C.; Zhang, W.; Huang, D. Industrial Structure Optimization and Low-Carbon Transformation of Chinese Industry Based on the Forcing Mechanism of CO2 Emission Peak Target. Sustainability 2021, 13, 4417. [Google Scholar] [CrossRef]
  6. Li, Q.; Yu, W.; Zhao, J. Key Technologies for the Safe Operation of Wind and Solar Power Generation Equipment in Support of the Peak CO2 Emissions and Carbon Neutrality Policy. High Volt. Eng. 2021, 47, 3047–3060. [Google Scholar]
  7. VanZwieten, J.H.; Rauchenstein, L.T.; Lee, L. An assessment of Florida’s ocean thermal energy conversion (OTEC) resource. Renew. Sustain. Energy Rev. 2017, 75, 683–691. [Google Scholar] [CrossRef] [Green Version]
  8. Nguyen, H.; Wang, C.; Tay, Z.; Luong, V. Wave energy converter and large floating platform integration: A review. Ocean Eng. 2020, 213, 107768. [Google Scholar] [CrossRef]
  9. Guillou, N.; Lavidas, G.; Chapalain, G. Wave Energy Resource Assessment for Exploitation—A Review. J. Mar. Sci. Eng. 2020, 8, 705. [Google Scholar] [CrossRef]
  10. Nilsson, E.; Rutgersson, A.; Dingwell, A.; Björkqvist, J.-V.; Pettersson, H.; Axell, L.; Nyberg, J.; Strömstedt, E. Characteriza-tion of Wave Energy Potential for the Baltic Sea with Focus on the Swedish Exclusive Economic Zone. Energies 2019, 12, 793. [Google Scholar] [CrossRef] [Green Version]
  11. Farkas, A.; Degiuli, N.; Martić, I. Assessment of Offshore Wave Energy Potential in the Croatian Part of the Adriatic Sea and Comparison with Wind Energy Potential. Energies 2019, 12, 2357. [Google Scholar] [CrossRef] [Green Version]
  12. O’Connell, R.; de Montera, L.; Peters, J.L.; Horion, S. An updated assessment of Ireland’s wave energy resource using satellite data assimilation and a revised wave period ratio. Renew. Energy 2020, 160, 1431–1444. [Google Scholar] [CrossRef]
  13. Waters, S.; Aggidis, G. Tidal range technologies and state of the art in review. Renew. Sustain. Energy Rev. 2016, 59, 514–529. [Google Scholar] [CrossRef] [Green Version]
  14. Cheung, N.; Cross, P. Numerical wave modeling for operational and survival analyses of wave energy converters at the US Navy Wave Energy Test Site in Hawaii. Renew. Energies 2020, 161, 240–256. [Google Scholar]
  15. Vieira, F.; Cavalcante, G.; Campos, E.; Taveira-Pinto, F. Wave energy flux variability and trend along the United Arab Emirates coastline based on a 40-year hindcast. Renew. Energy 2020, 160, 1194–1205. [Google Scholar] [CrossRef]
  16. Reddy, K.; Prajwal, K.; Satwik, T.S. A Review on the Gradiation Towards Pelamis Wave Energy Converter. In Proceedings of the 2020 4th International Conference on Trends in Electronics and Informatics (ICOEI) (48184), Tirunelveli, India, 15–17 June 2020; pp. 130–136. [Google Scholar] [CrossRef]
  17. Zabala, I.; Henriques, J.; Blanco, J.M.; Gomez, A.; Gato, L.; Bidaguren, I.; Falcão, A.; Amezaga, A.; Gomes, R. Wave-induced real-fluid effects in marine energy converters: Review and application to OWC devices. Renew. Sustain. Energy Rev. 2019, 111, 535–549. [Google Scholar] [CrossRef]
  18. Mavrakos, A.S.; Konispoliatis, D.N.; Ntouras, D.G.; Papadakis, G.P.; Mavrakos, S.A. Hydrodynamics of Moonpool-Type Floaters: A Theoretical and a CFD Formulation. Energies 2022, 15, 570. [Google Scholar] [CrossRef]
  19. Li, Y.; Pan, D.-Z. The ebb and flow of tidal barrage development in Zhejiang Province, China. Renew. Sustain. Energy Rev. 2017, 80, 380–389. [Google Scholar] [CrossRef]
  20. Wang, X.; Jia, N.; Xue, C.; Wang, J.; Ma, C. Thoughts on the Industrial Development of my country’s Marine Renewable En-ergy. Ocean Dev. Manag. 2019, 36, 14–18. [Google Scholar]
  21. Liu, W.; Liu, L.; Chen, F.; Ma, C.; Ge, Z.; Peng, J. China’s Marine Renewable Energy Technology Progress. Sci. Technol. Rev. 2020, 38, 27–39. [Google Scholar]
  22. Peng, C. A Preliminary Study on the Sustainable Development of my country’s Islands. Ph.D. Thesis, Ocean University of China, Qingdao, China, 2006. [Google Scholar]
  23. Qiu, S.; Liu, K.; Wang, D.; Ye, J.; Liang, F. A comprehensive review of ocean wave energy research and development in China. Renew. Sustain. Energy Rev. 2019, 113, 109271. [Google Scholar] [CrossRef]
  24. Doyle, S.; Aggidis, G.A. Development of multi-oscillating water columns as wave energy converters. Renew. Sustain. Energy Rev. 2019, 107, 75–86. [Google Scholar] [CrossRef] [Green Version]
  25. Feng, F.; Ning, G.; Huang, L.; Fang, B. Research on the Development and Utilization of Wave Energy in the South China Sea Islands. Eng. Technol. Res. 2020, 5, 216–217. [Google Scholar]
  26. Wan, Y.; Fan, C.; Dai, Y.; Li, L.; Sun, W.; Zhou, P.; Qu, X. Assessment of the Joint Development Potential of Wave and Wind Energy in the South China Sea. Energies 2018, 11, 398. [Google Scholar] [CrossRef] [Green Version]
  27. Aderinto, T.; Li, H. Ocean Wave Energy Converters: Status and Challenges. Energies 2018, 11, 1250. [Google Scholar] [CrossRef] [Green Version]
  28. Roy, A.; Auger, F.; Dupriez-Robin, F.; Bourguet, S.; Tran, Q.T. Electrical Power Supply of Remote Maritime Areas: A Review of Hybrid Systems Based on Marine Renewable Energies. Energies 2018, 11, 1904. [Google Scholar] [CrossRef] [Green Version]
  29. Hou, J.; Zhu, X.; Liu, P. Current situation and future projection of marine renewable energy in China. Int. J. Energy Res. 2018, 43, 662–680. [Google Scholar] [CrossRef]
  30. Wang, Z.; Dong, S.; Li, X.; Soares, C.G. Assessments of wave energy in the Bohai Sea, China. Renew. Energy 2016, 90, 145–156. [Google Scholar] [CrossRef]
  31. Wan, Y.; Fan, C.; Dai, Y.; Li, L.; Sun, W.; Zhou, P. Study on the development potential of wave energy in the coastal waters around Shandong Peninsula. Acta Energy Sol. Sin. 2018, 39, 3311–3318. [Google Scholar]
  32. Liu, S. Assessment of Wave Energy Resources in the Sea Area Around Shandong Province. Acta Oceanol. Sin. 2015, 37, 108–122. [Google Scholar]
  33. Han, L.; Wang, J.; Gao, J.; Wang, X.; Wu, H. Analysis of Wave Energy Resources in the Northern Sea of Chu Island, Shan-dong. Acta Energy Sol. Sin. 2020, 41, 165–171. [Google Scholar]
  34. Li, D. Numerical Evaluation of Wind Energy and Wave Energy Resources in the Blue and Yellow Regions of Shandong Pen-insula. Master’s Thesis, Ocean University of China, Qingdao, China, 2015. [Google Scholar]
  35. NCNA. China plans to build three Marine energy test sites. Power Syst. Autom. 2015, 39, 158. [Google Scholar]
  36. Wang, B.; Xu, Z.; Li, C.; Wang, D.; Ding, Q. Hydrodynamic characteristics of forced oscillation of heave plate with fractal characteristics based on floating wind turbine platform. Ocean Eng. 2020, 212, 107621. [Google Scholar] [CrossRef]
  37. Thiagarajan, K.; Moreno, J. Wave Induced Effects on the Hydrodynamic Coefficients of an Oscillating Heave Plate in Off-Shore Wind Turbines. J. Mar. Sci. Eng. 2020, 8, 622. [Google Scholar] [CrossRef]
  38. Stansby, P.; Moreno, E.C.; Apsley, D.; Stallard, T. Slack-moored semi-submersible wind floater with damping plates in waves: Linear diffraction modelling with mean forces and experiments. J. Fluids Struct. 2019, 90, 410–431. [Google Scholar] [CrossRef]
  39. Jang, H.; Park, S.; Kim, M.; Kim, K.; Hong, K. Effects of heave plates on the global performance of a multi-unit floating off-shore wind turbine. Renew. Energ. 2019, 134, 526–537. [Google Scholar] [CrossRef]
  40. Ma, R.; Bi, K.; Hao, H. Using inerter-based control device to mitigate heave and pitch motions of semi-submersible platform in the shallow sea. Eng. Struct. 2020, 207, 110248. [Google Scholar] [CrossRef]
  41. Ma, R.; Bi, K.; Hao, H. Heave motion mitigation of semi-submersible platform using inerter-based vibration isolation system (IVIS). Eng. Struct. 2020, 219, 110833. [Google Scholar] [CrossRef]
  42. Ma, R.; Bi, K.; Hao, H. Mitigation of heave response of semi-submersible platform (SSP) using tuned heave plate inerter (THPI). Eng. Struct. 2018, 177, 357–373. [Google Scholar] [CrossRef]
  43. Bae, Y.; Kim, M.; Kim, H. Performance changes of a floating offshore wind turbine with broken mooring line. Renew. Energy 2016, 101, 364–375. [Google Scholar] [CrossRef]
  44. Liu, J. Hydrodynamic Analysis and Design of Heave Damping Plate. Master’s Thesis, Shandong University, Jinan, China, 2014. [Google Scholar]
  45. Guo, X. Theory and Practice of Double Double Turbine Wave Power Generation Device; China Water Resources and Hydropower Press: Beijing, China, 2017; pp. 23–25. [Google Scholar]
  46. Guo, X.; Tan, S.; Wu, Y. Study on the Wave Capture Device in the Flow Channel of a Double Double Turbine. J. Ocean Technol. 2014, 33, 17–24. [Google Scholar]
  47. Guo, X.; Wu, Y. Power Bandwidth Design Method for Direct Drive Hydraulic Turbine Wave Energy Utilization Device. J. Hydrog. Eng. 2013, 32, 197–203. [Google Scholar]
  48. Meng, Z.; Liu, Y.; Qin, J.; Sun, S. Mooring Angle Study of a Horizontal Rotor Wave Energy Converter. Energies 2021, 14, 344. [Google Scholar] [CrossRef]
  49. Meng, Z.; Liu, Y.; Qin, J.; Chen, Y. Mathematical Modeling and Experimental Verification of a New Wave Energy Converter. Energies 2020, 14, 177. [Google Scholar] [CrossRef]
Figure 1. Cutaway view of the device [45,49].
Energies 15 01313 g001
Figure 2. Wave energy converter composition.
Energies 15 01313 g002
Figure 3. (a) Engineering prototype, (b) model prototype.
Energies 15 01313 g003
Figure 4. Grid division: (a) Scheme 1, (b) Scheme 2, (c) Scheme 3.
Energies 15 01313 g004
Figure 5. Device’s lateral movement trajectory.
Energies 15 01313 g005
Figure 6. Device’s longitudinal movement trajectory.
Energies 15 01313 g006
Figure 7. The trajectory of the device in the heave direction.
Energies 15 01313 g007
Figure 8. The angle change of the device in the pitch direction.
Energies 15 01313 g008
Figure 9. Three different shapes of heaving plate models: (a) Scheme 1, (b) Scheme 2, (c) Scheme 3.
Energies 15 01313 g009
Figure 10. The whole model: (a) model composition, (b) motion reference unit 5th generation [48].
Energies 15 01313 g010
Figure 11. Model test of regular wave.
Energies 15 01313 g011
Figure 12. Amplitude change when h = 30 cm.
Energies 15 01313 g012
Figure 13. Amplitude change when h = 20 cm.
Energies 15 01313 g013
Figure 14. Amplitude change when h = 10 cm.
Energies 15 01313 g014
Figure 15. Amplitude change when h = 5 cm and no heaving plate is installed.
Energies 15 01313 g015
Figure 16. Average amplitude change with the installation distance.
Energies 15 01313 g016
Table 1. Engineering prototype and model prototype dimensions.
Device ParameterEngineering PrototypeModel PrototypeUnit
Device total height (h2)5443544mm
Length of generating part6000600mm
Width of generating part4412441mm
Height of generating part (h3)2948295mm
Mass280,00028.0kg
Table 2. Experiment condition.
Experiment ConditionPrototype ValueModel Value
ParameterSignificant wave
height (m)
Significant wave
Period (s)
Regular Wave height H (m)Regular wave period T (s)
Case0.93.60.091.15
Publisher’s Note: MDPI stays neutral with regard to jurisdictional claims in published maps and institutional affiliations.

