
Fast Charging Impact on the Lithium-Ion Batteries’ Lifetime and Cost-Effective Battery Sizing in Heavy-Duty Electric Vehicles Applications


 ,
,  ,
,  and
and 
Abstract
:1. Introduction
1.1. Electric Vehicles Overview
1.2. Battery System
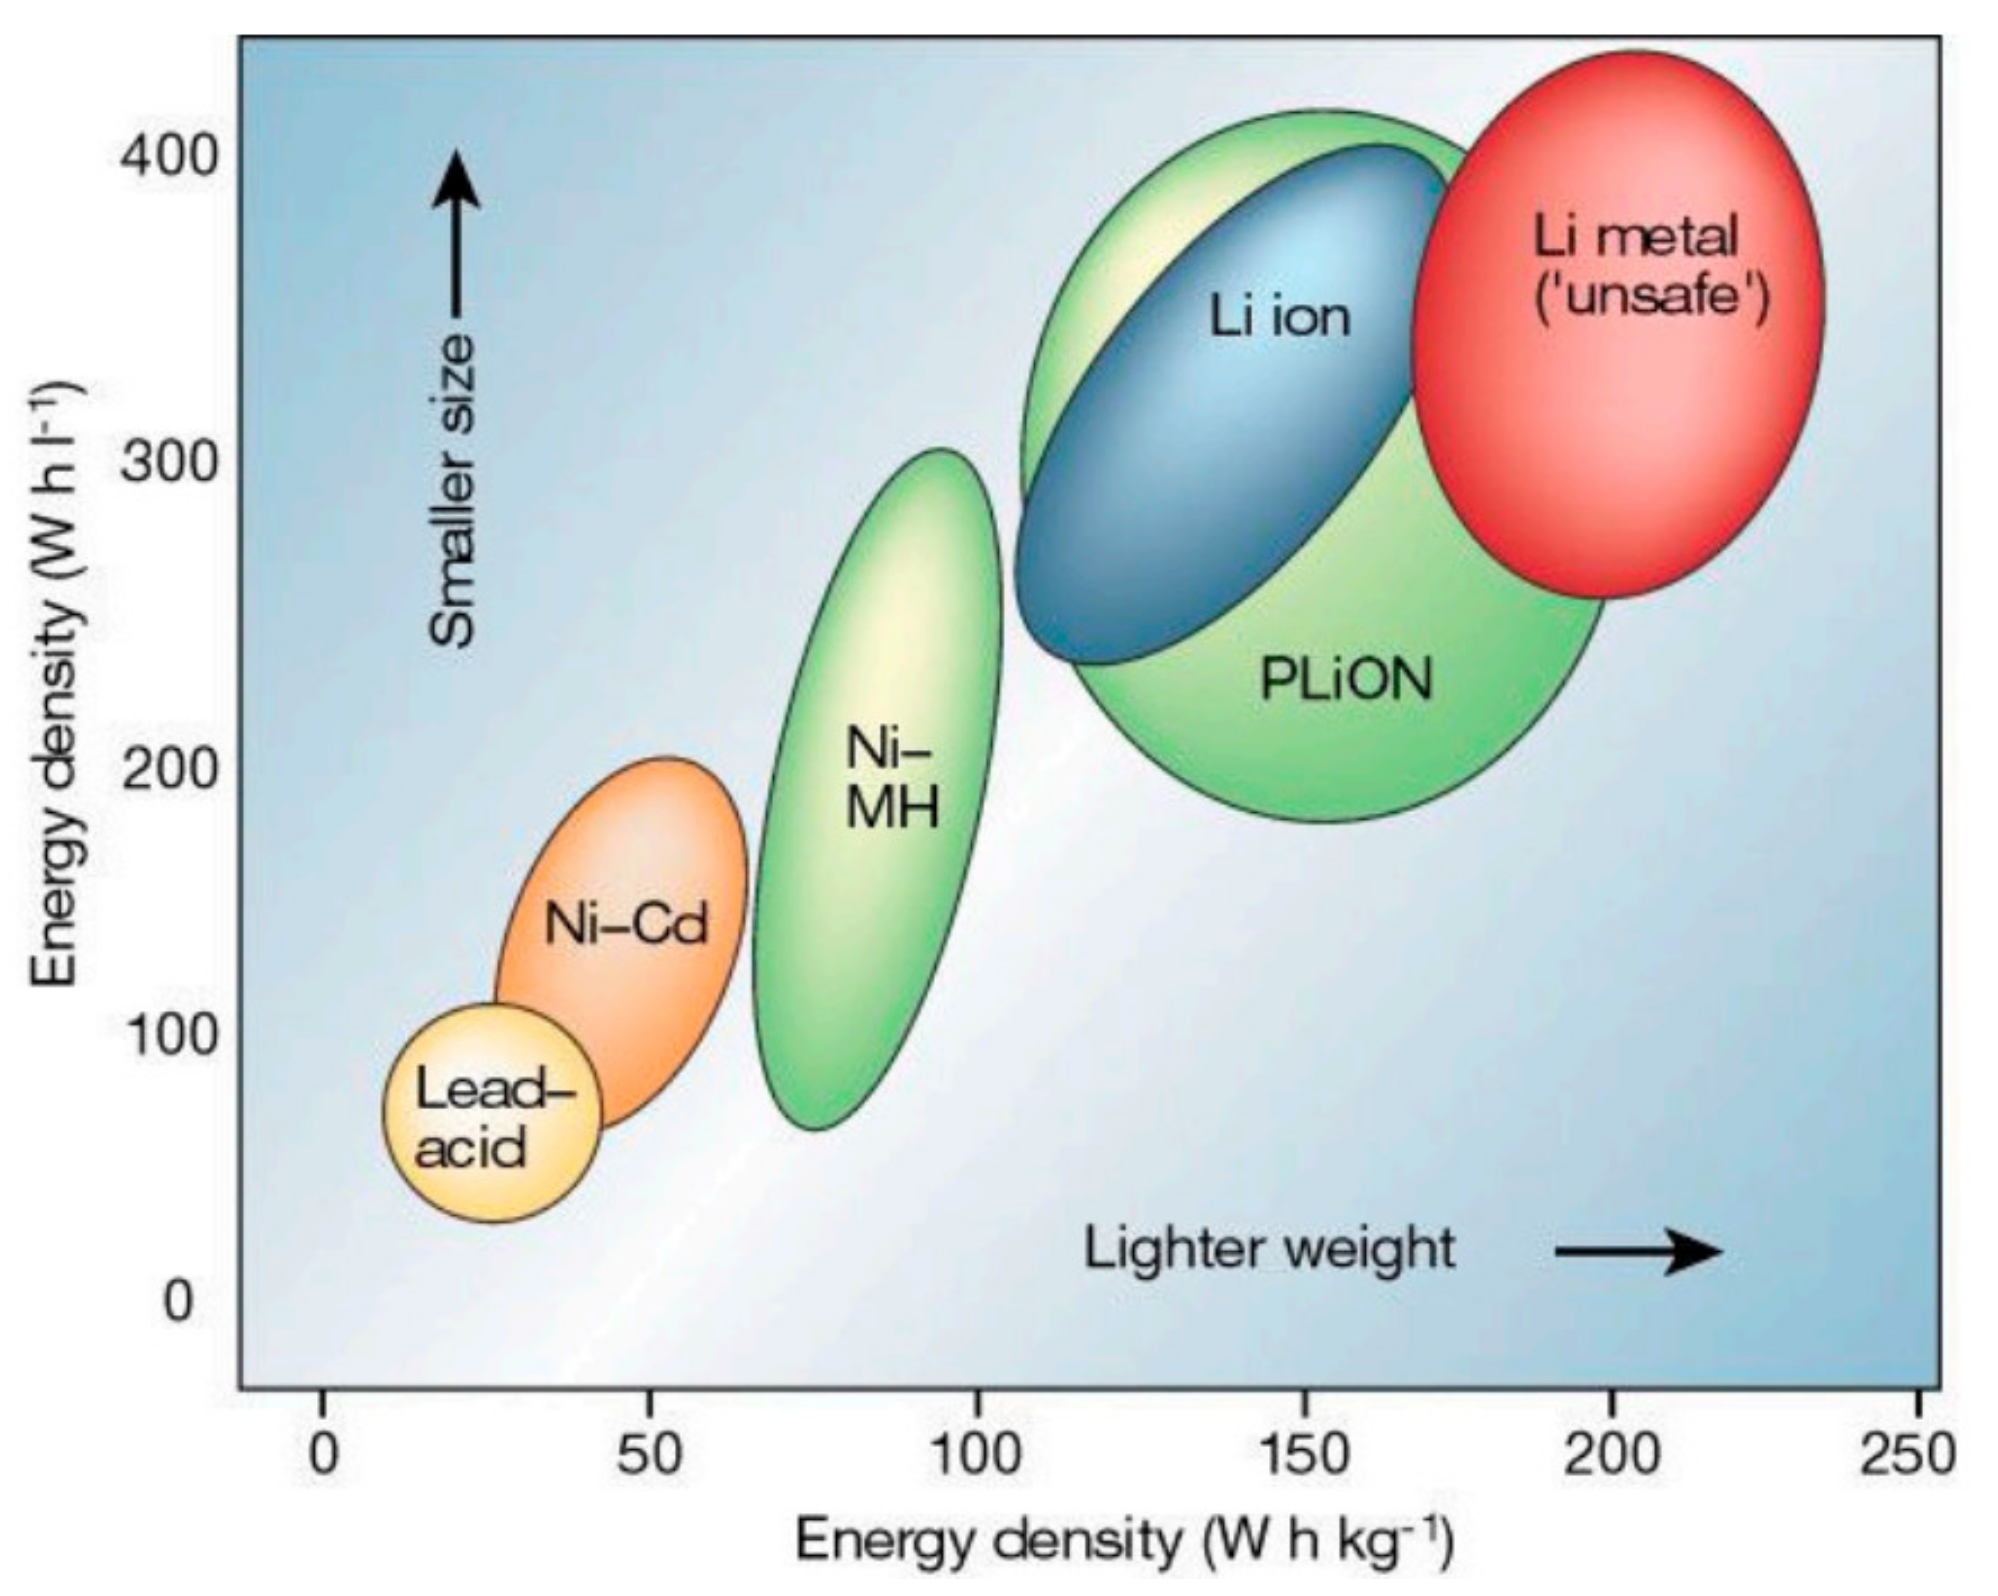
1.2.1. Technologies
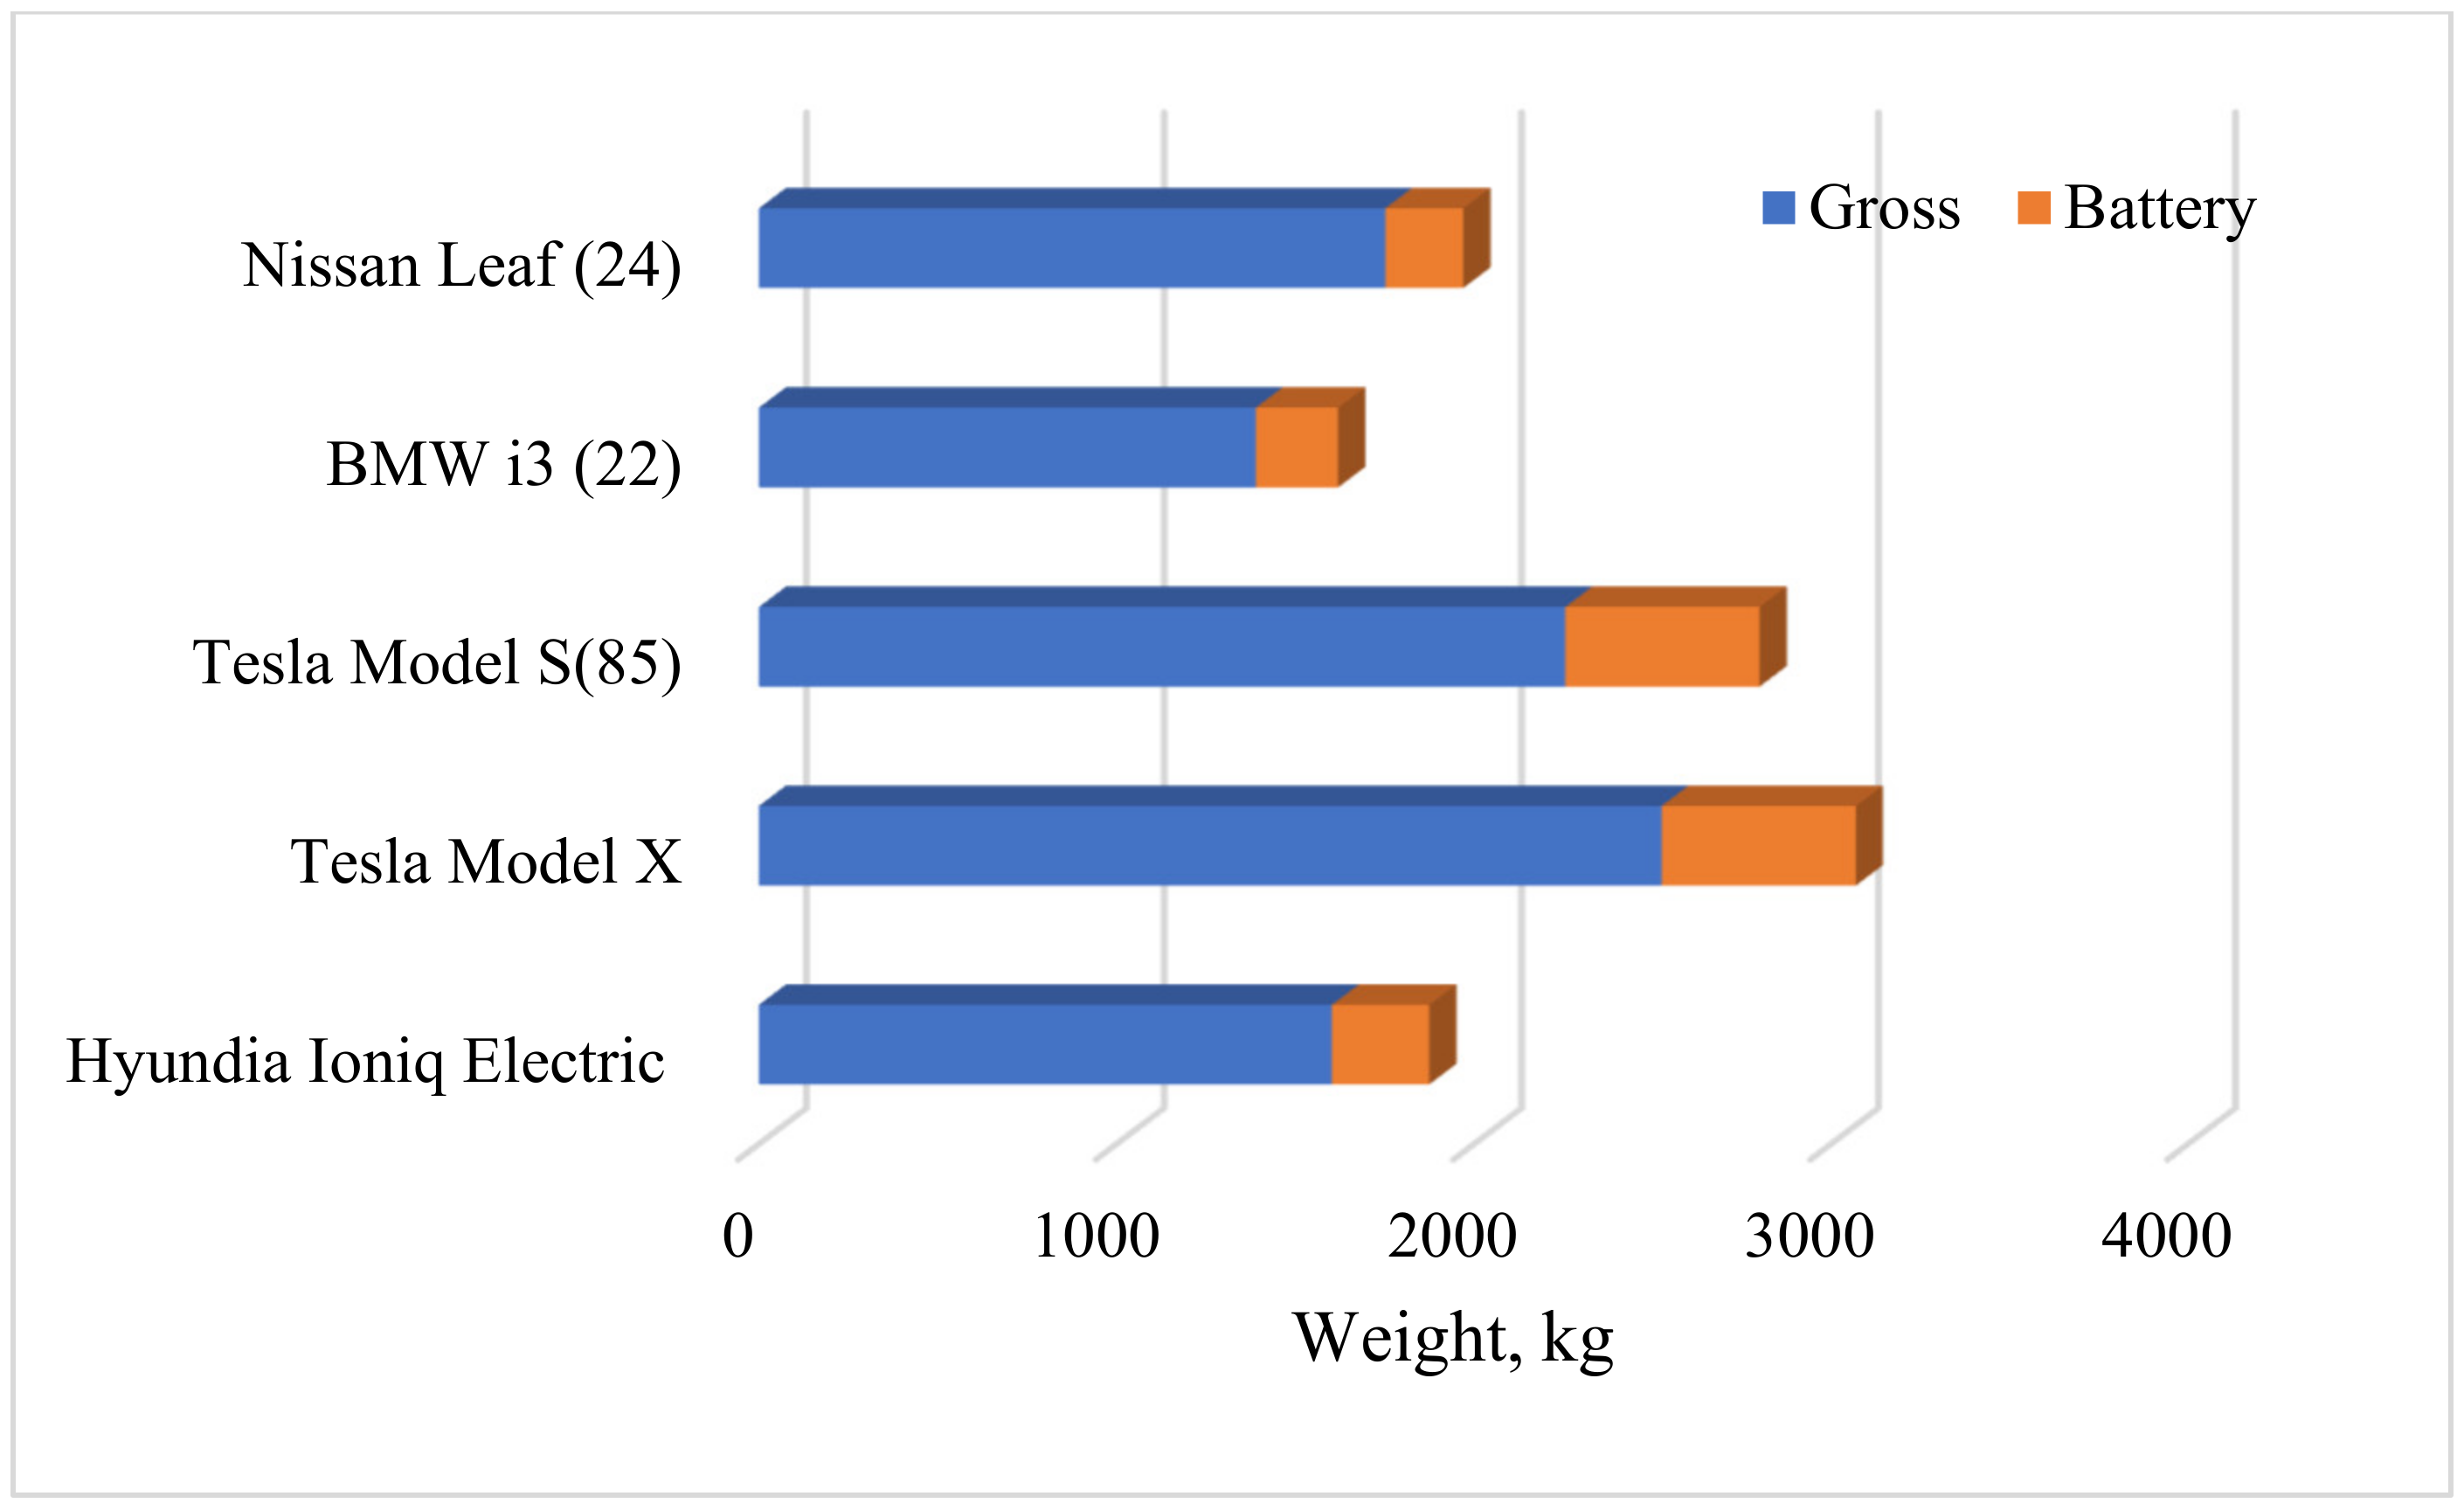
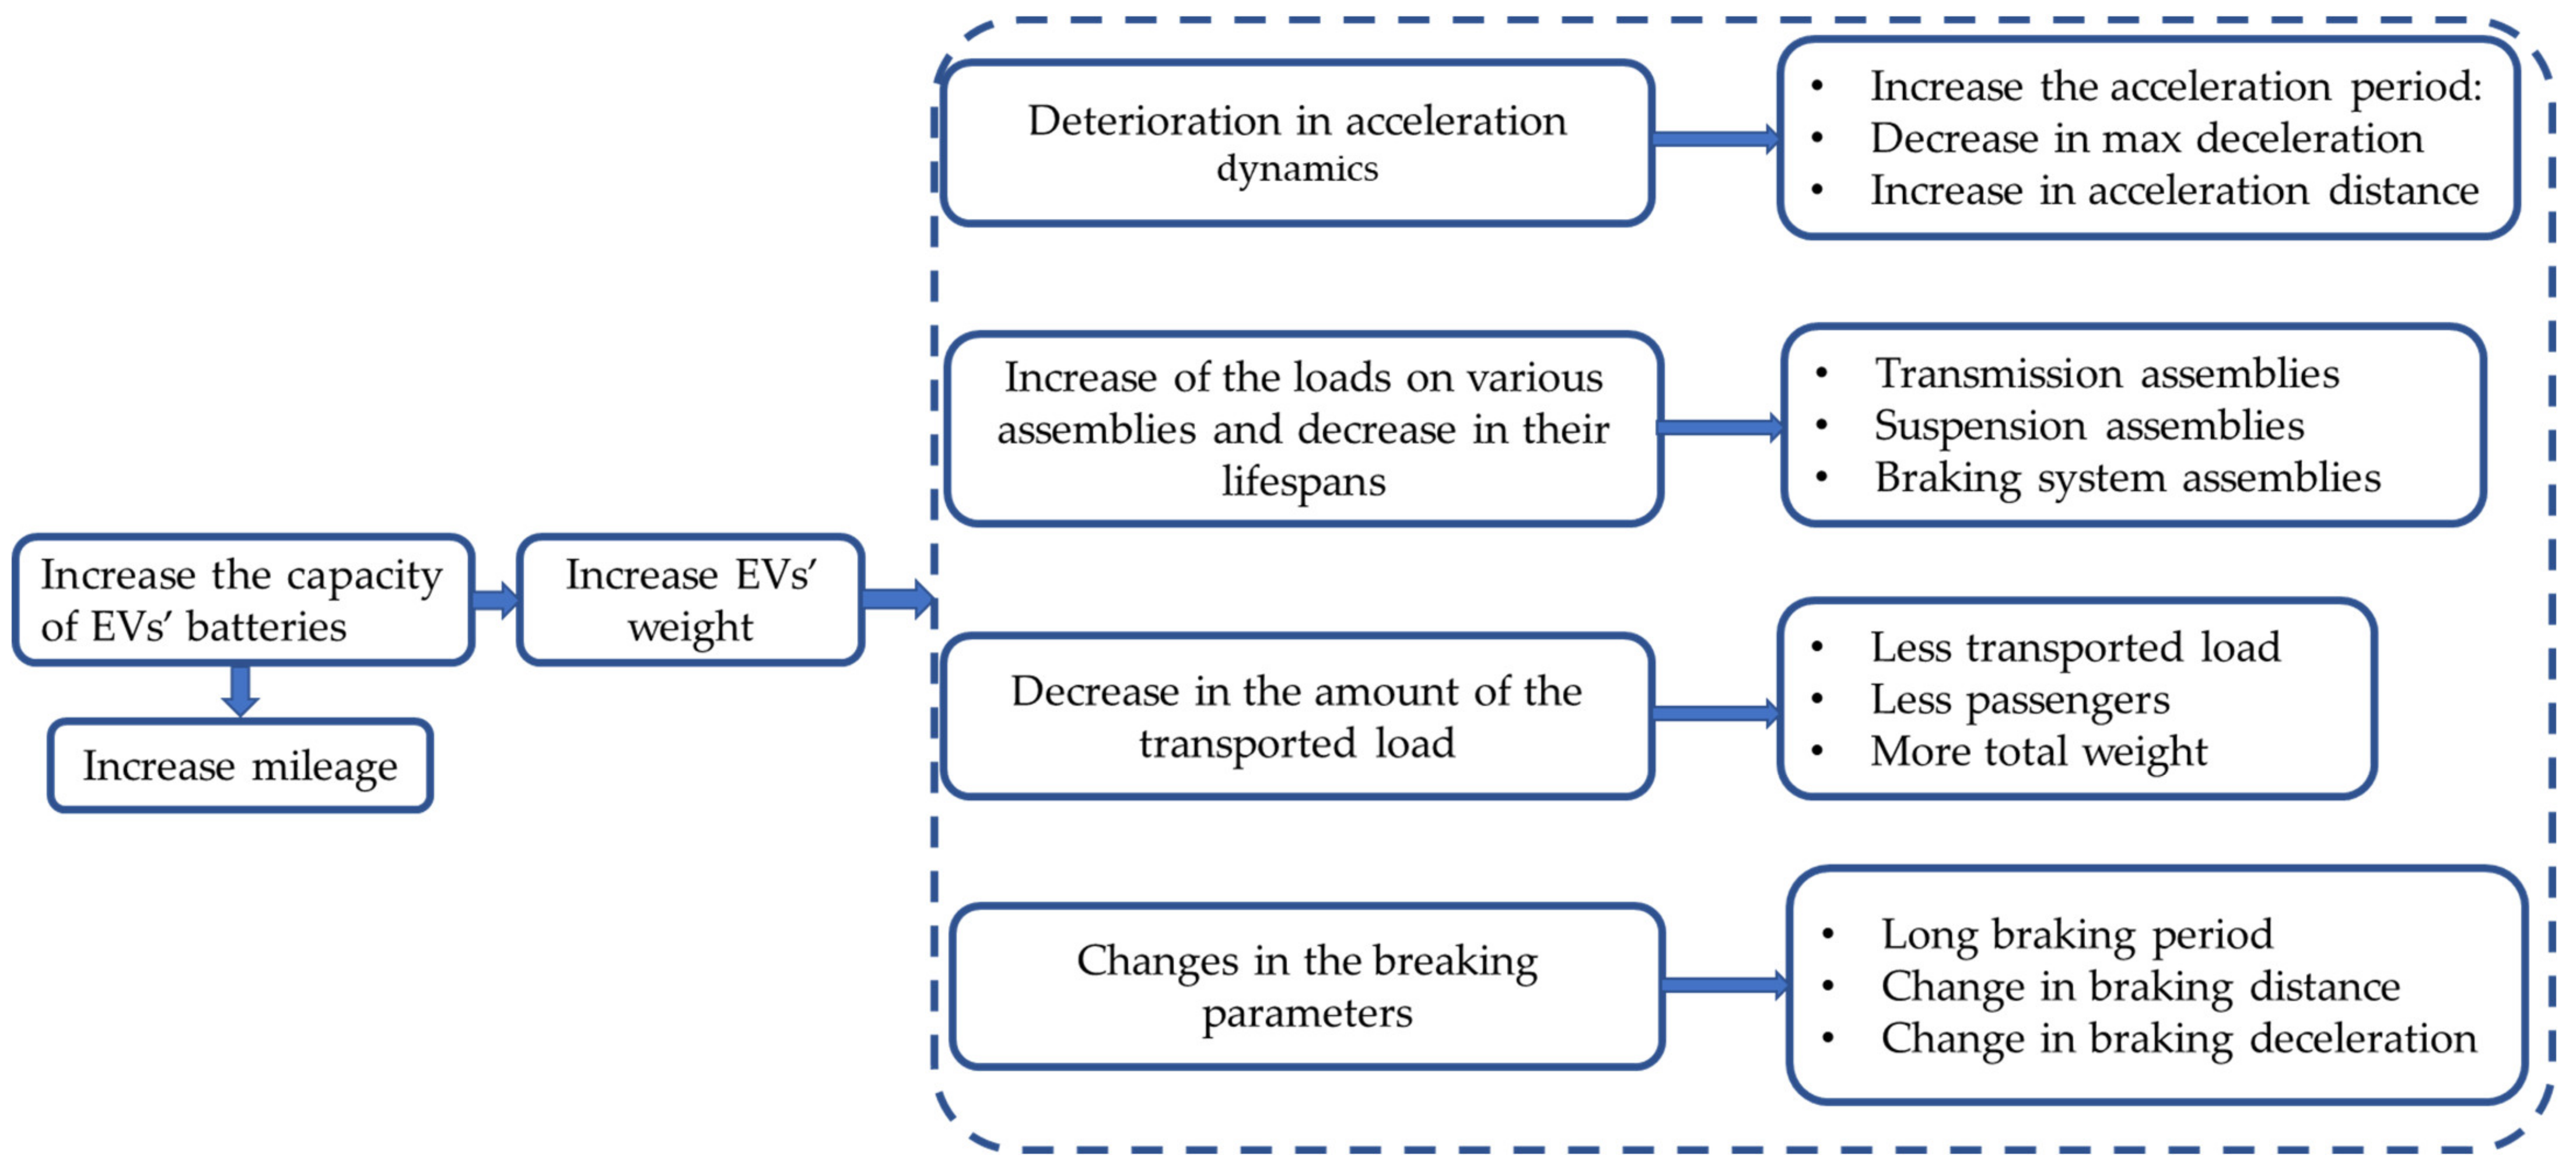
1.2.2. Impact of Battery System on the EVs Operation
1.3. Research Gap
1.4. Contributions
2. Materials and Methods
2.1. Battery Model
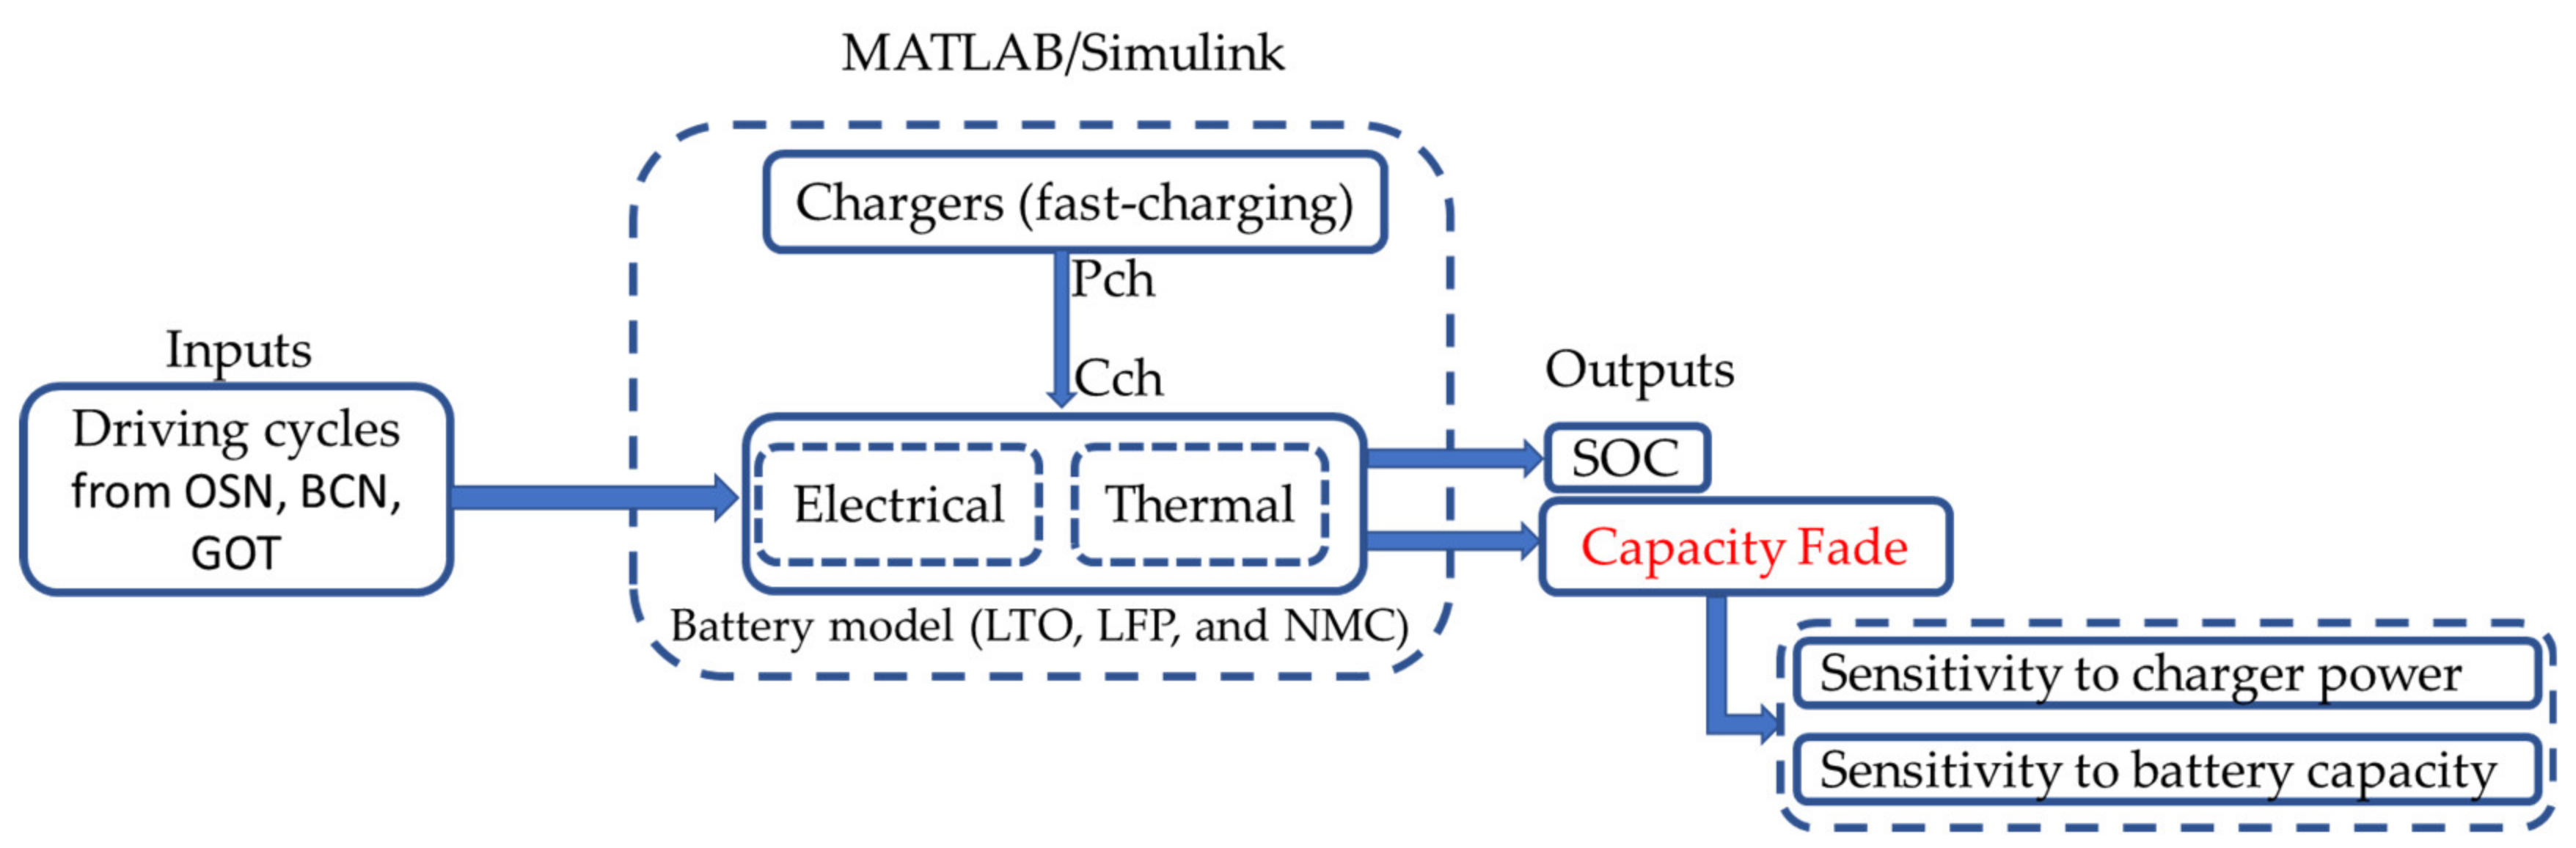
2.2. Methodology for Fast Charging Evaluation
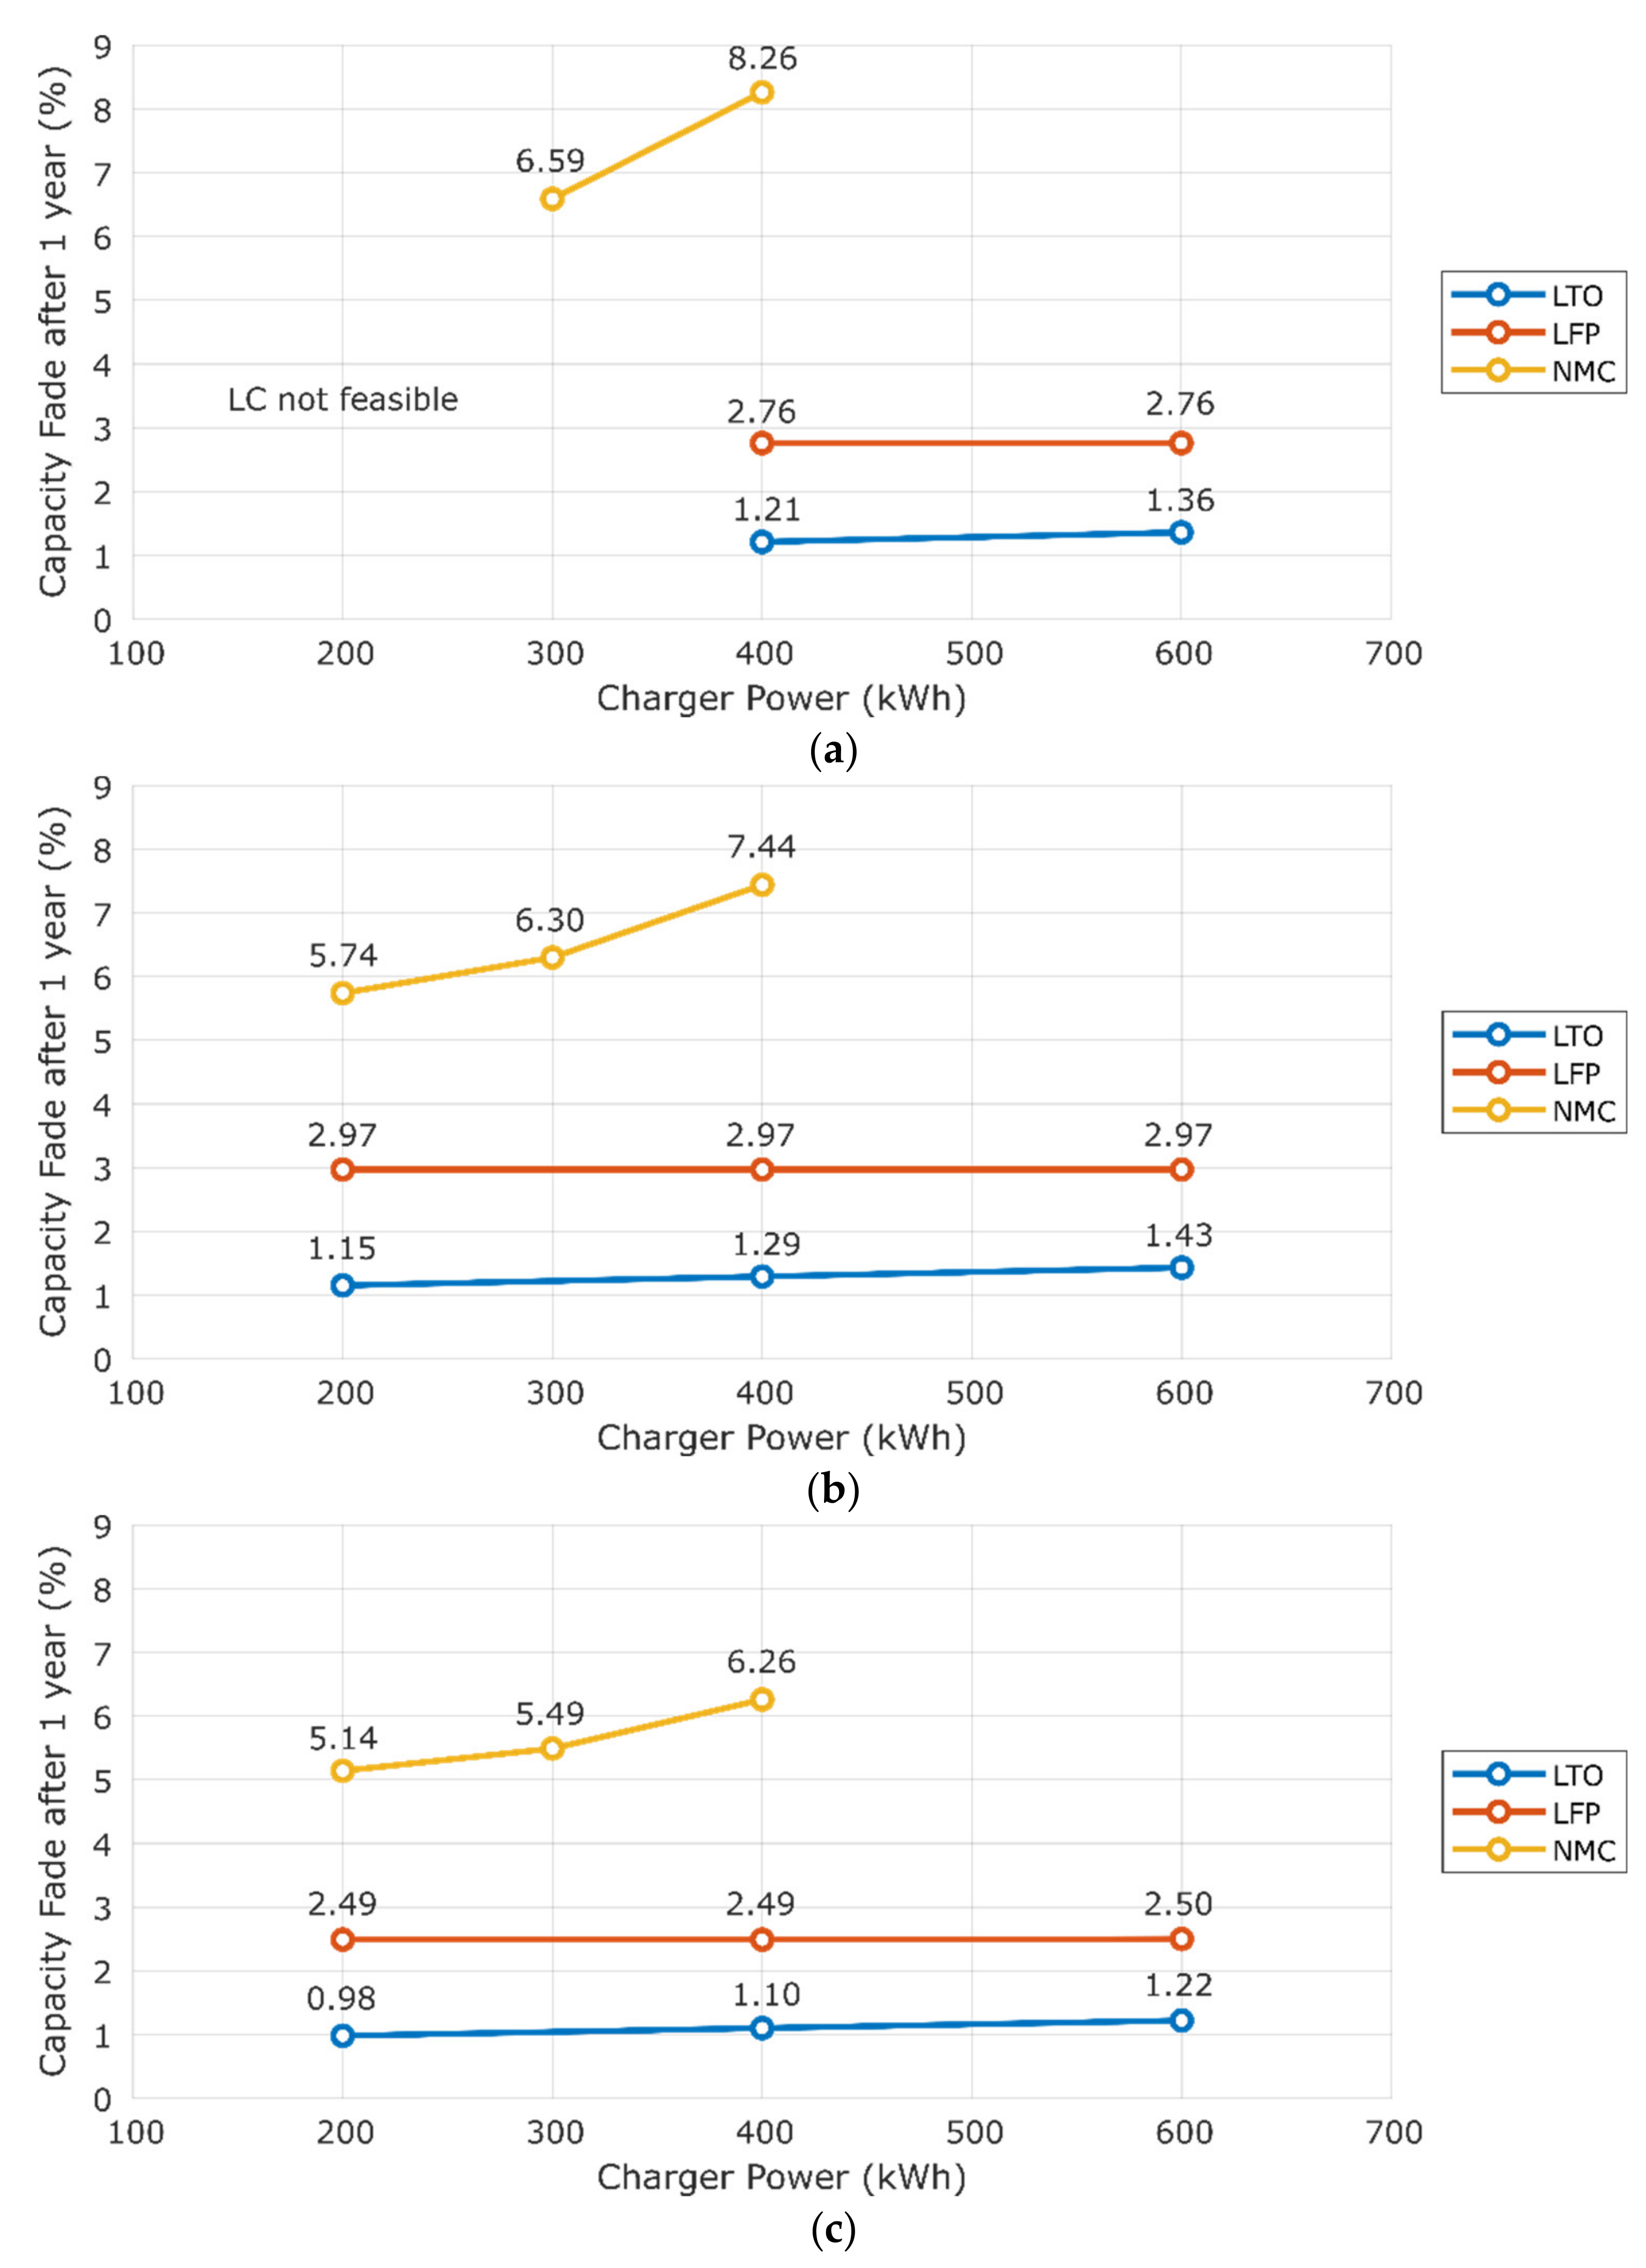
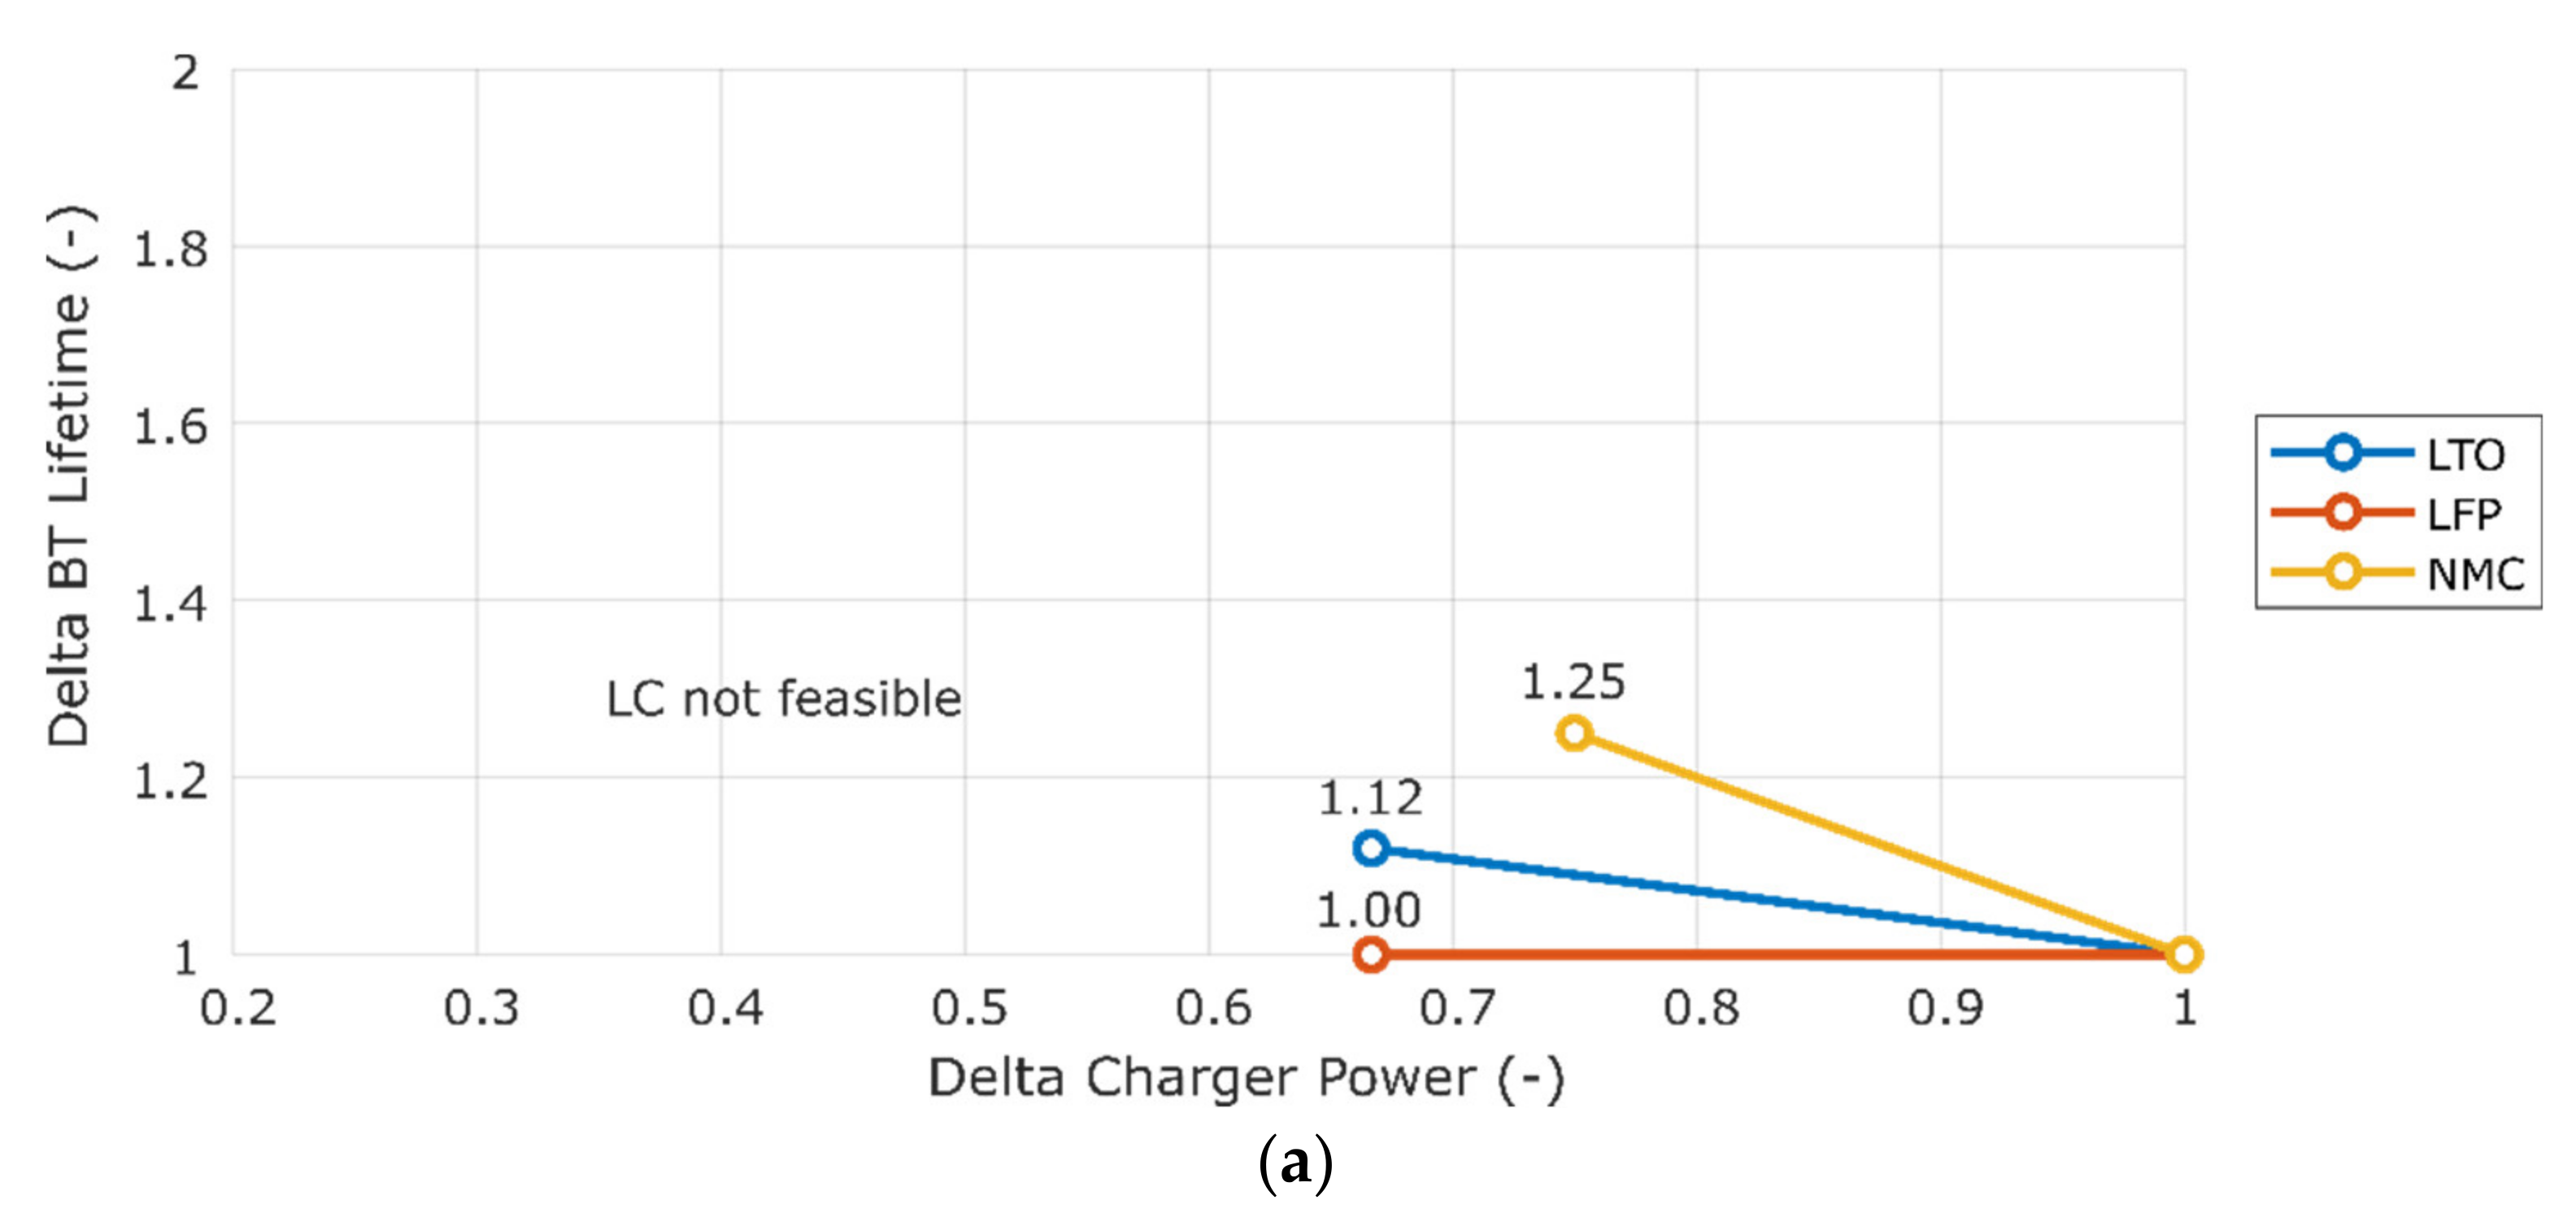
- Charger power (Pch). Considering a scenario with fixed charging points and fixed battery capacity, the power provided by the charger defines the C-rate at which the battery is charged (Cch). Therefore, at higher charger power, the battery is expected to be degraded faster. The minimum charger power is constrained by the route demand (which specifies the amount of energy required to recover the initial battery SoC) and the feasible charging time (time in which the bus is stopped).
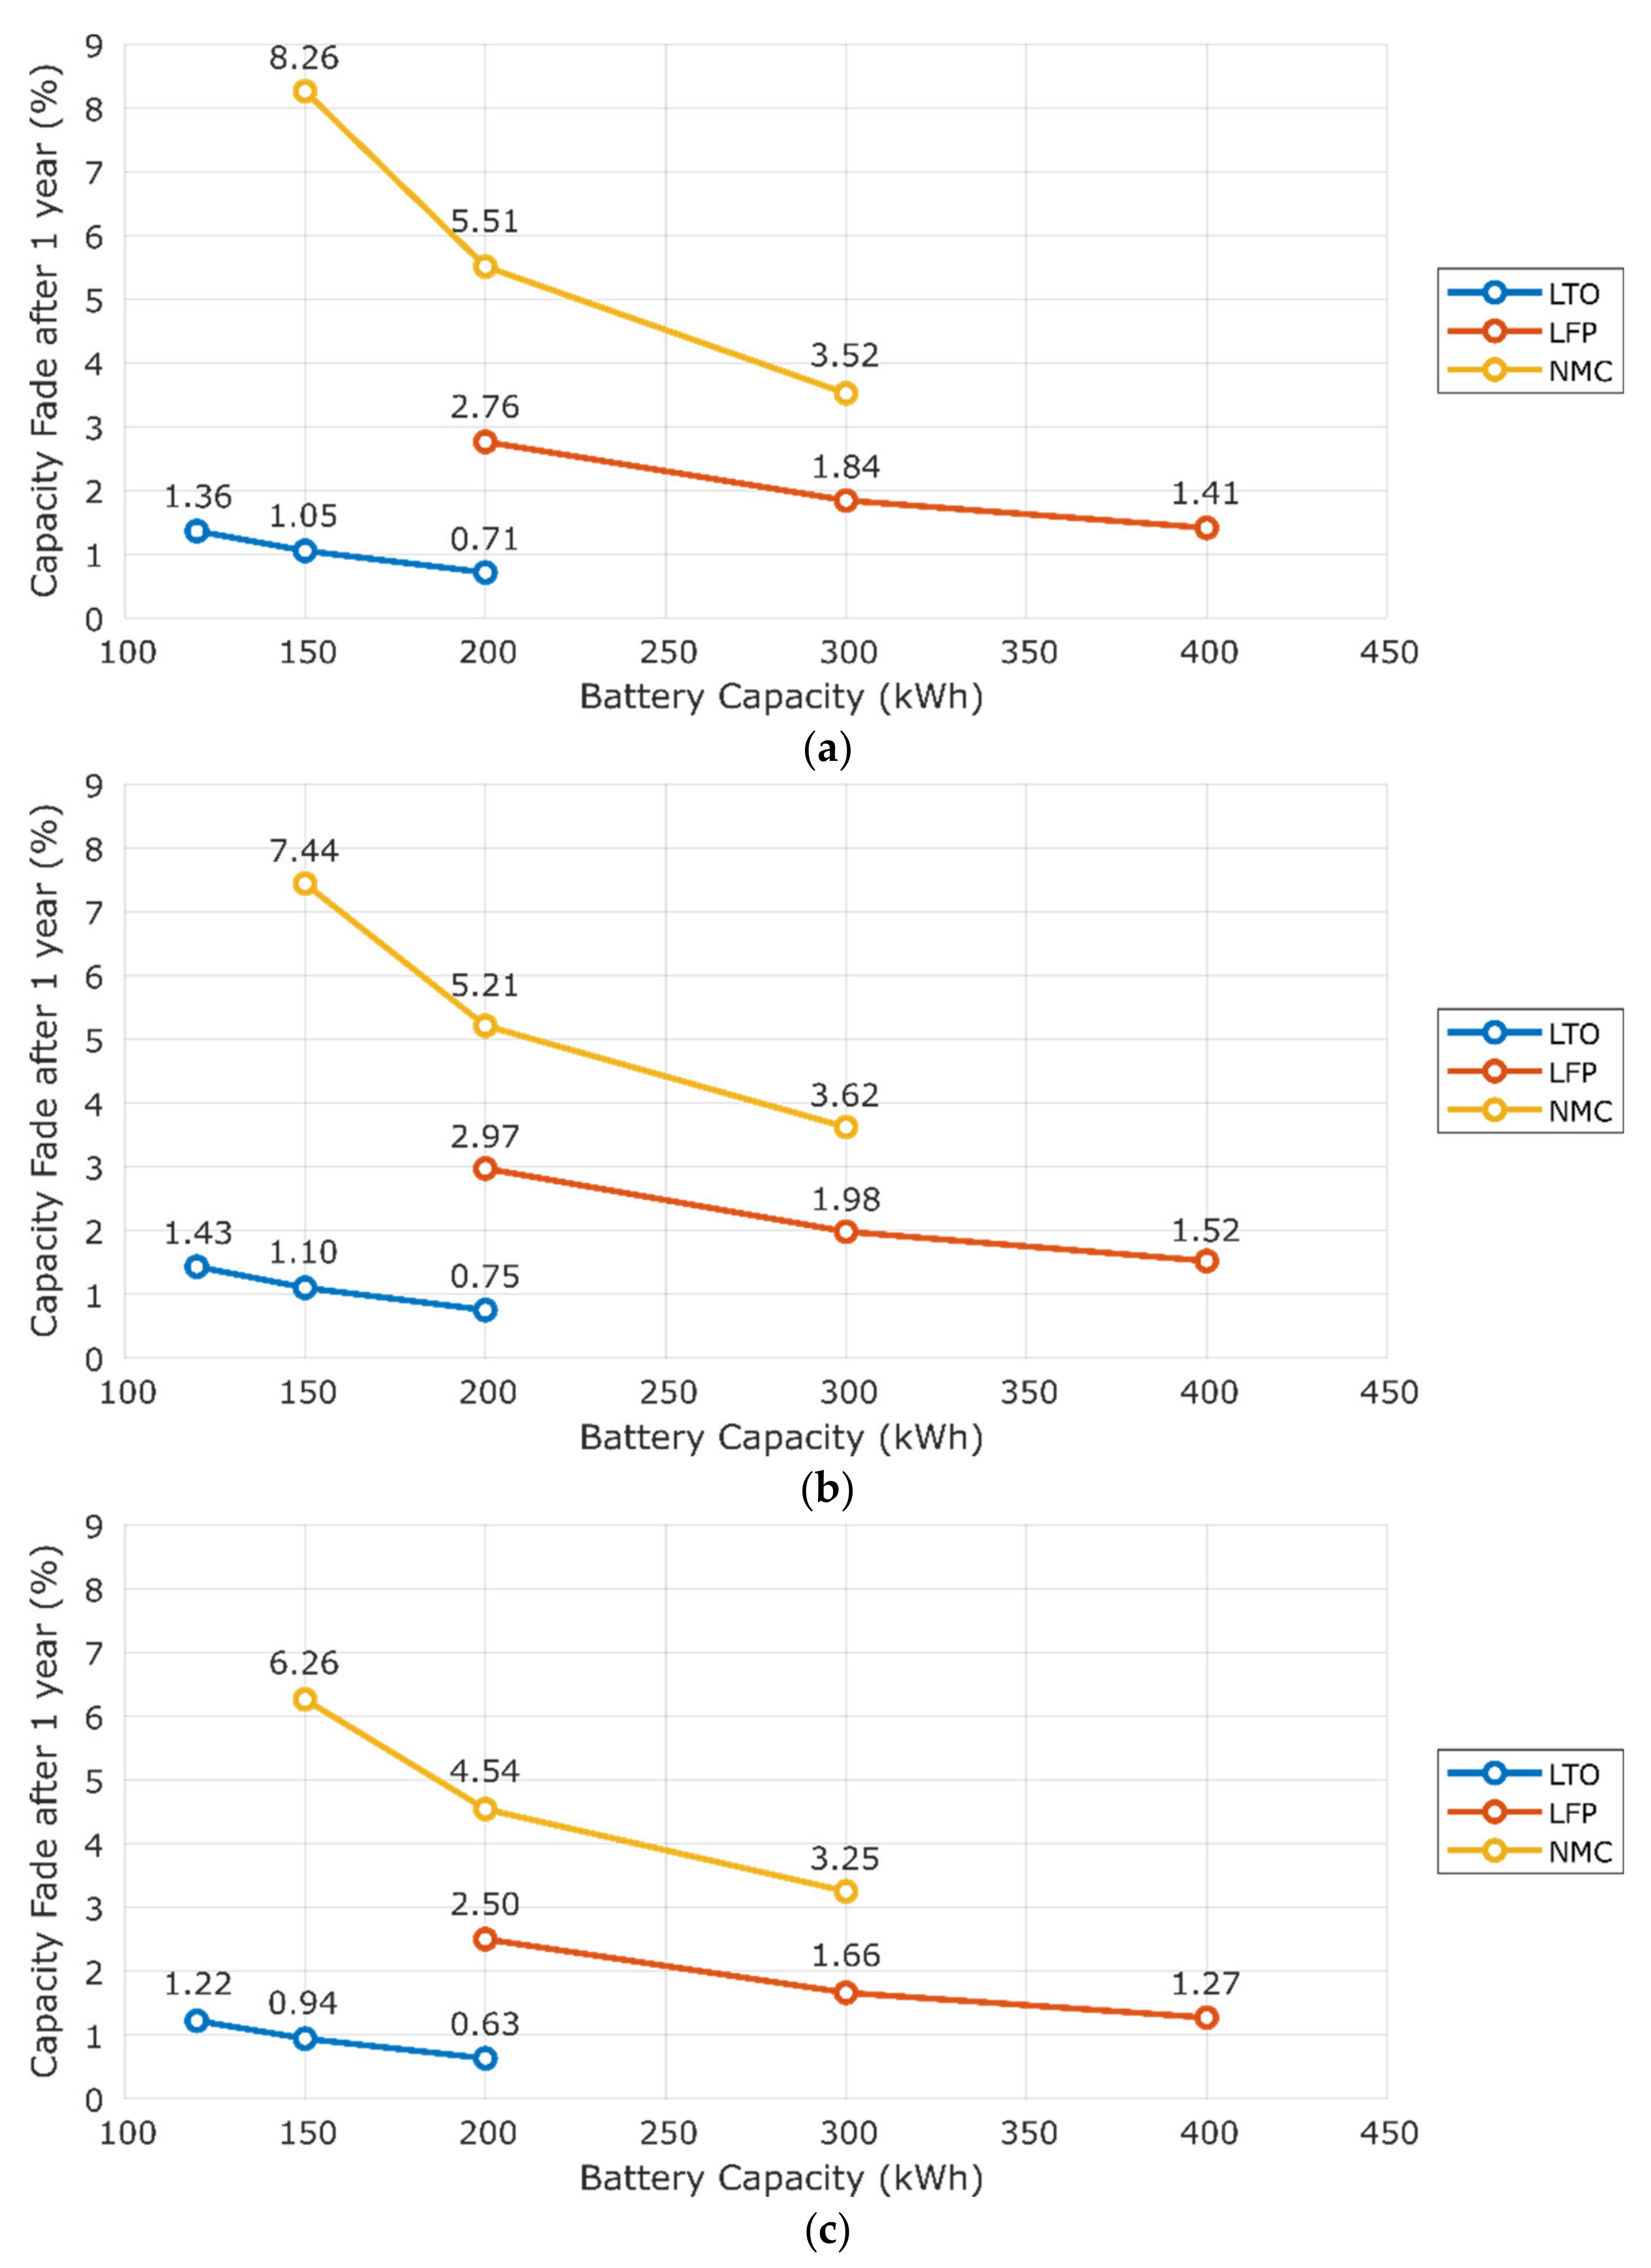
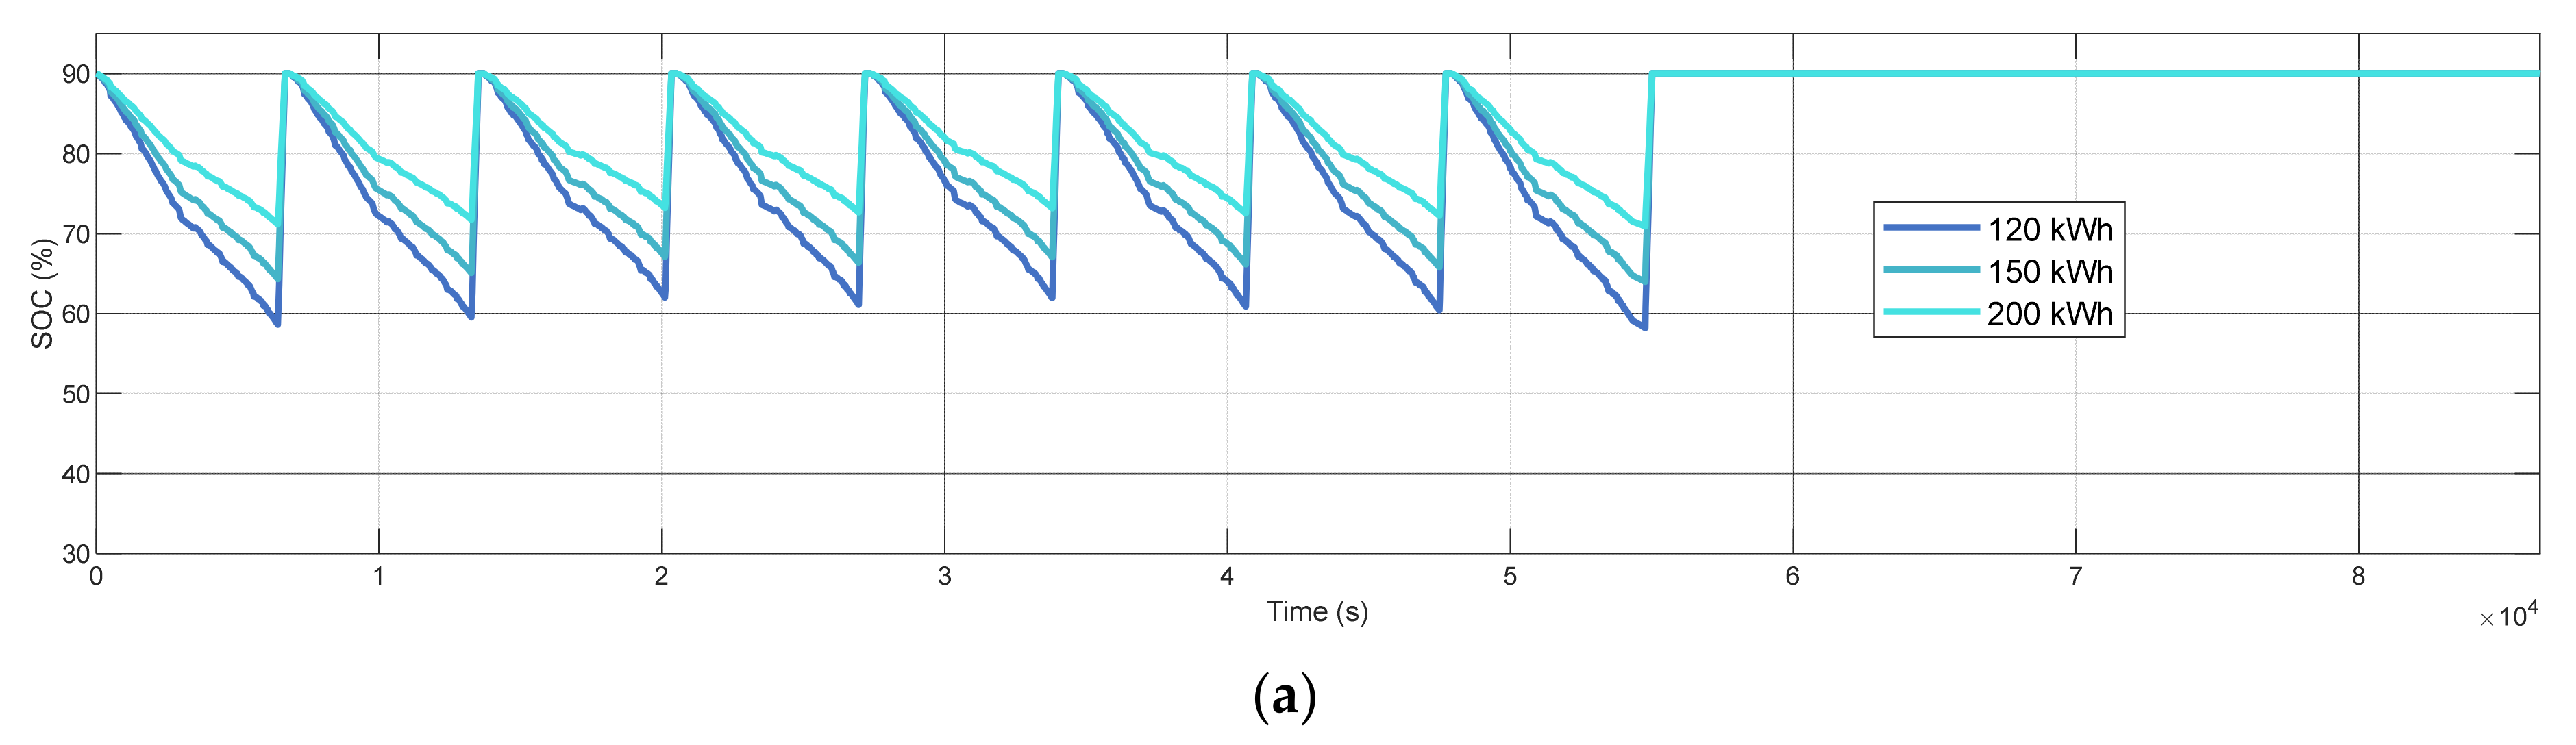
- Battery capacity (EBT). Considering a scenario with fixed charging points and fixed charger capacity, varying the battery capacity may affect the depth-of-discharge (DOD) it may accomplish and the C-rate (Cch) in which it is operated. At higher battery capacity, lower DOD and C-rate values are obtained, which are expected to reduce battery degradation. Depending on the saved capacity fade, increasing the battery capacity may or may not be cost-efficient.
2.3. Study Cases
3. Results and Discussion
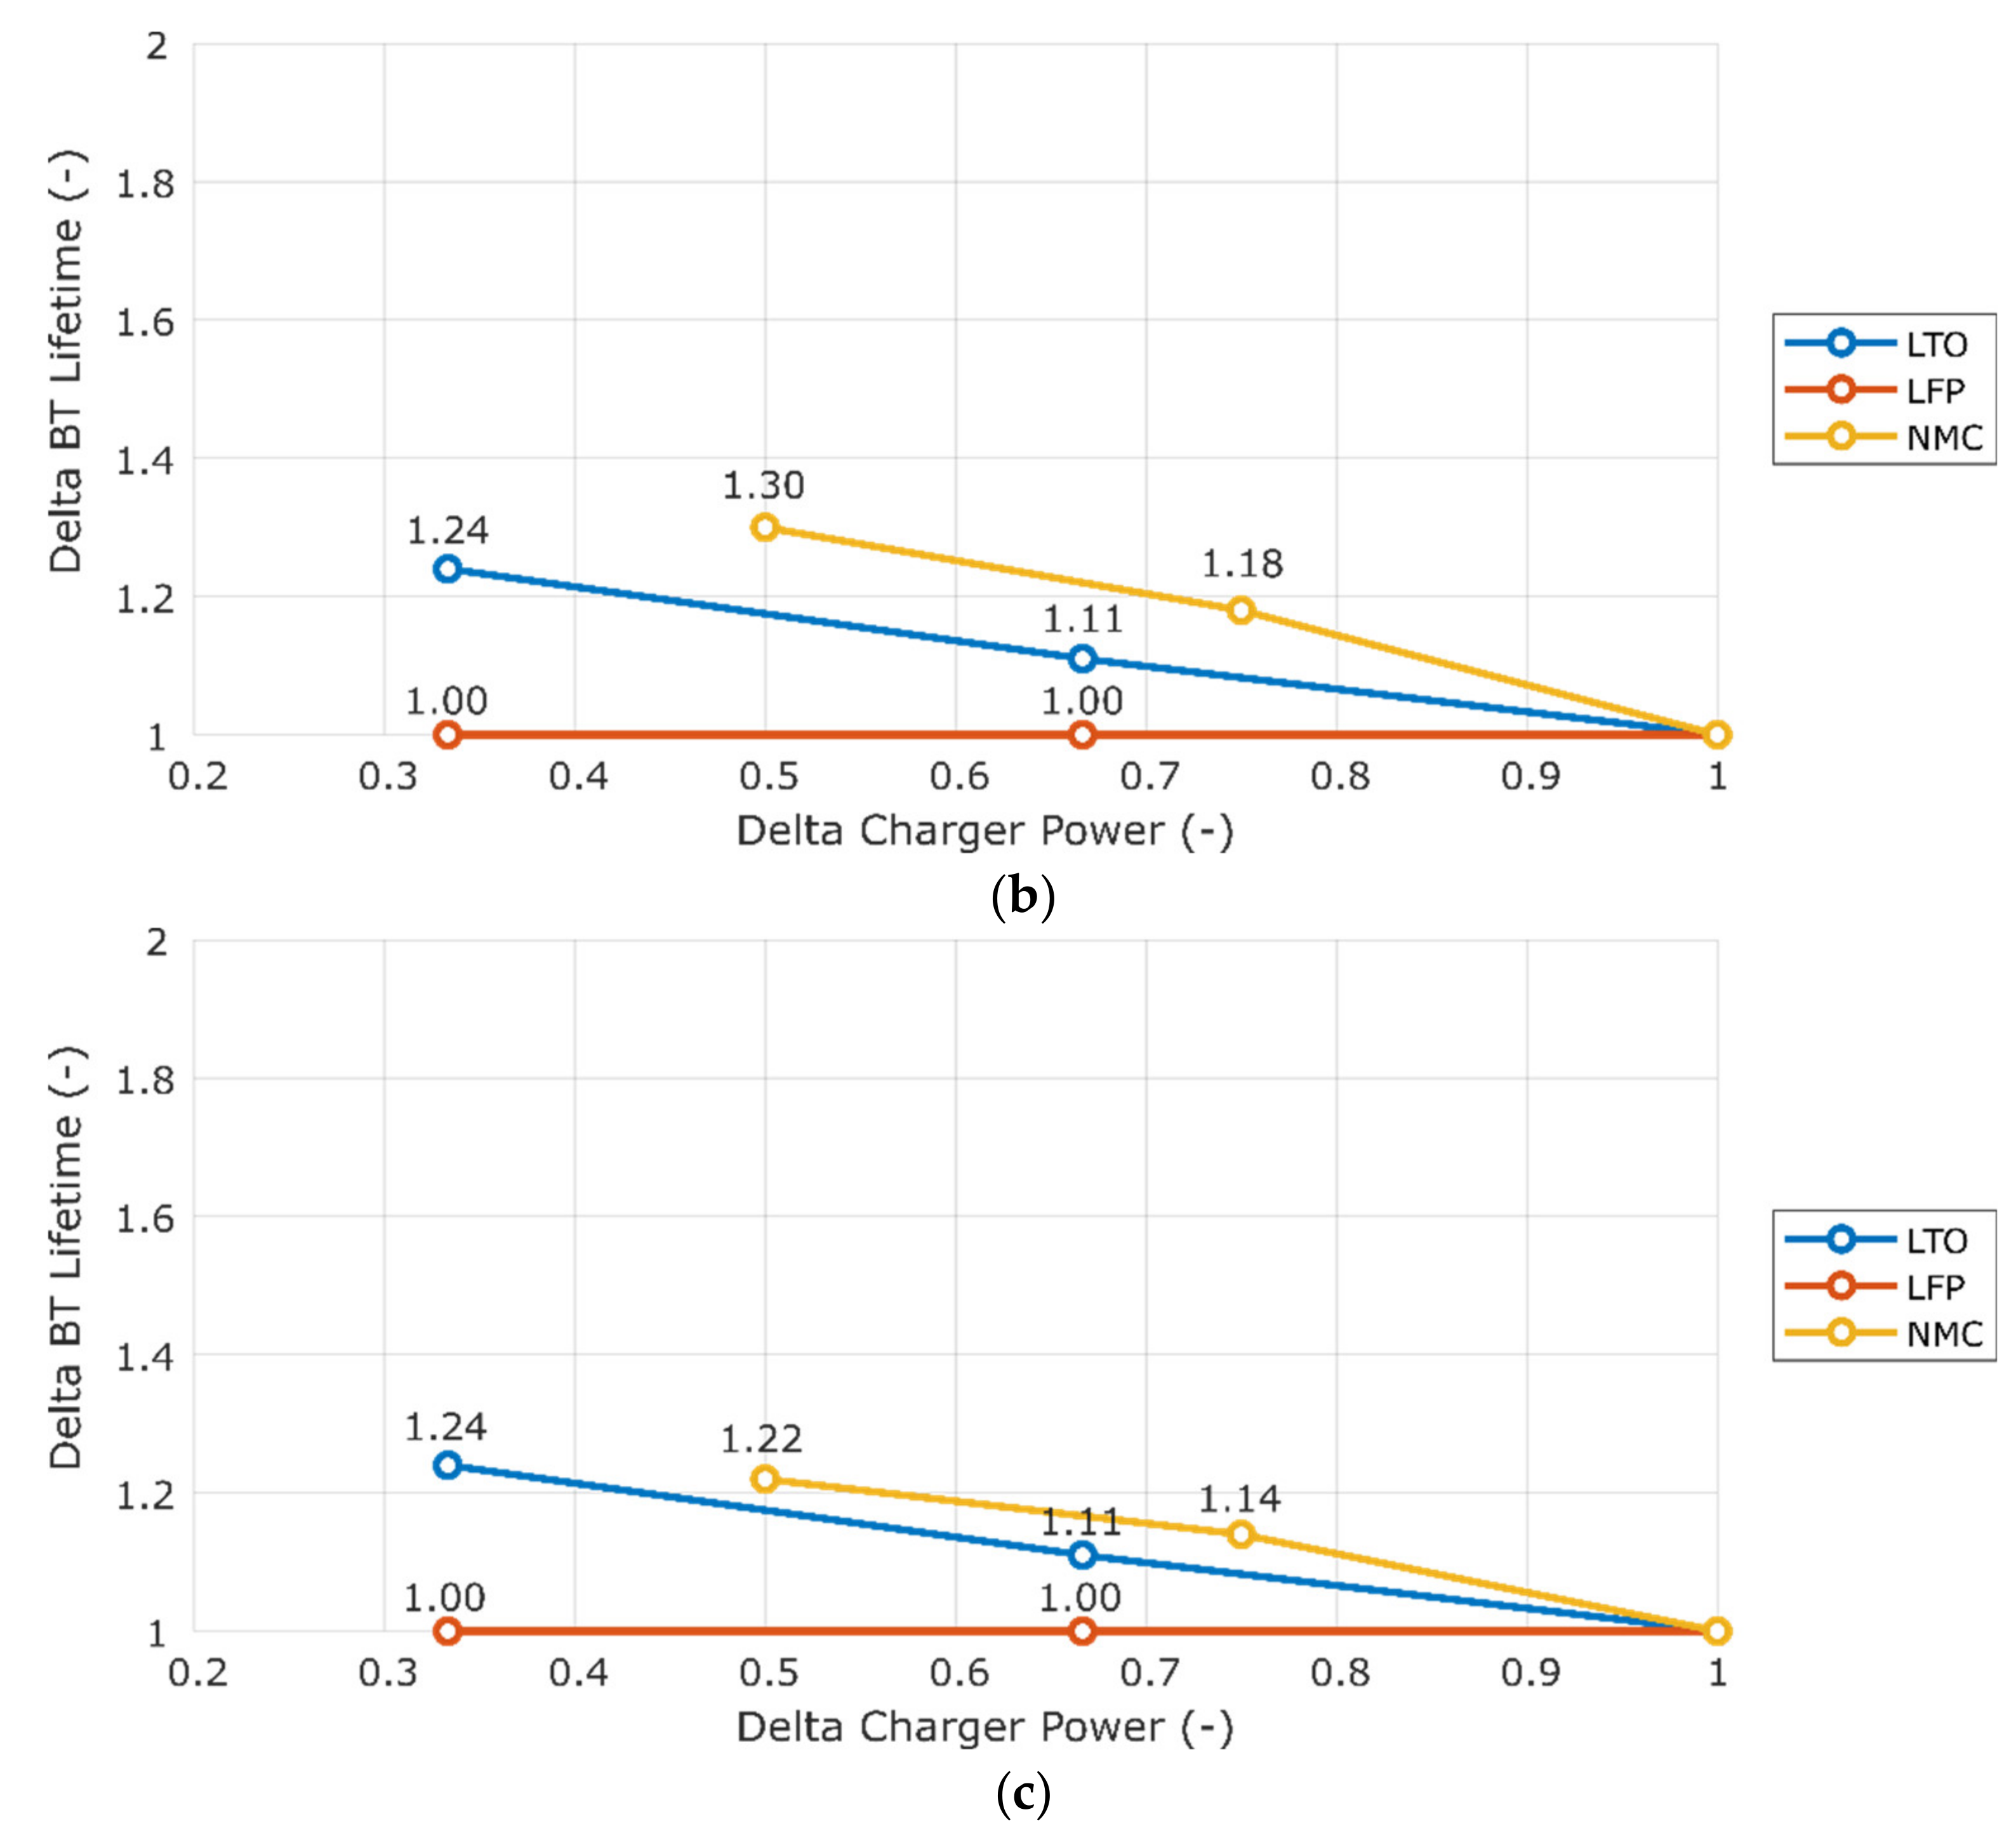
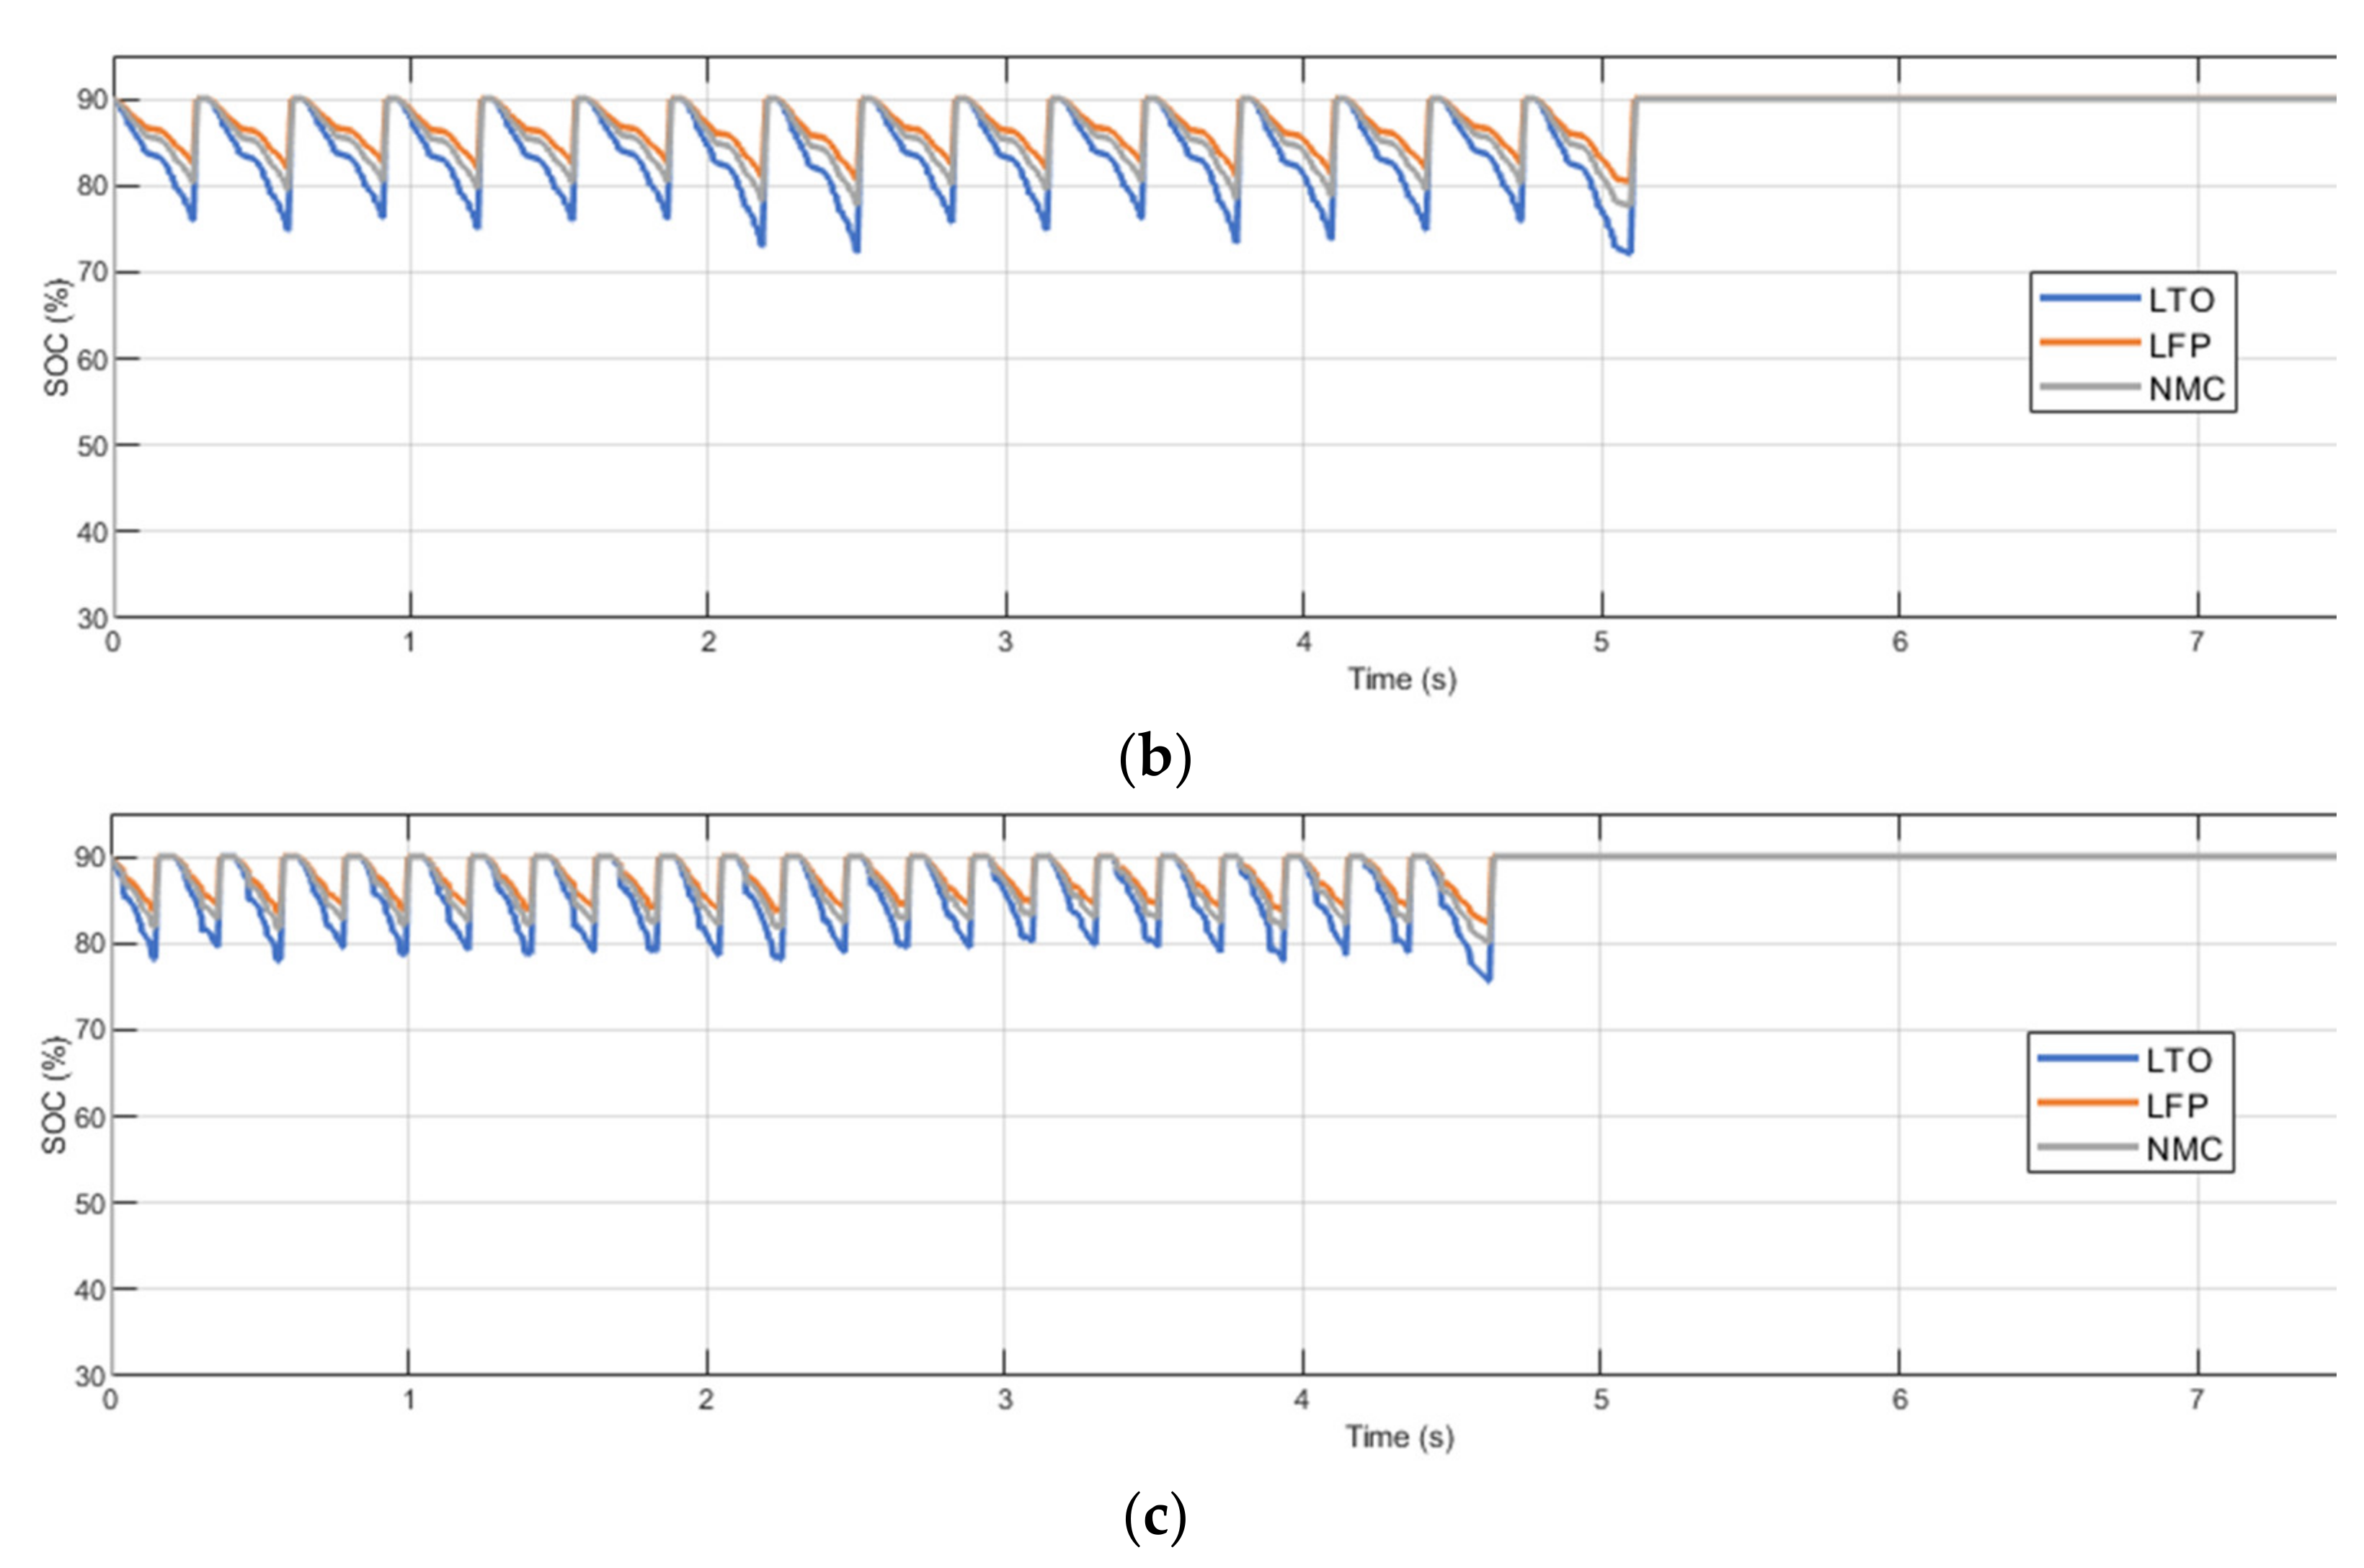
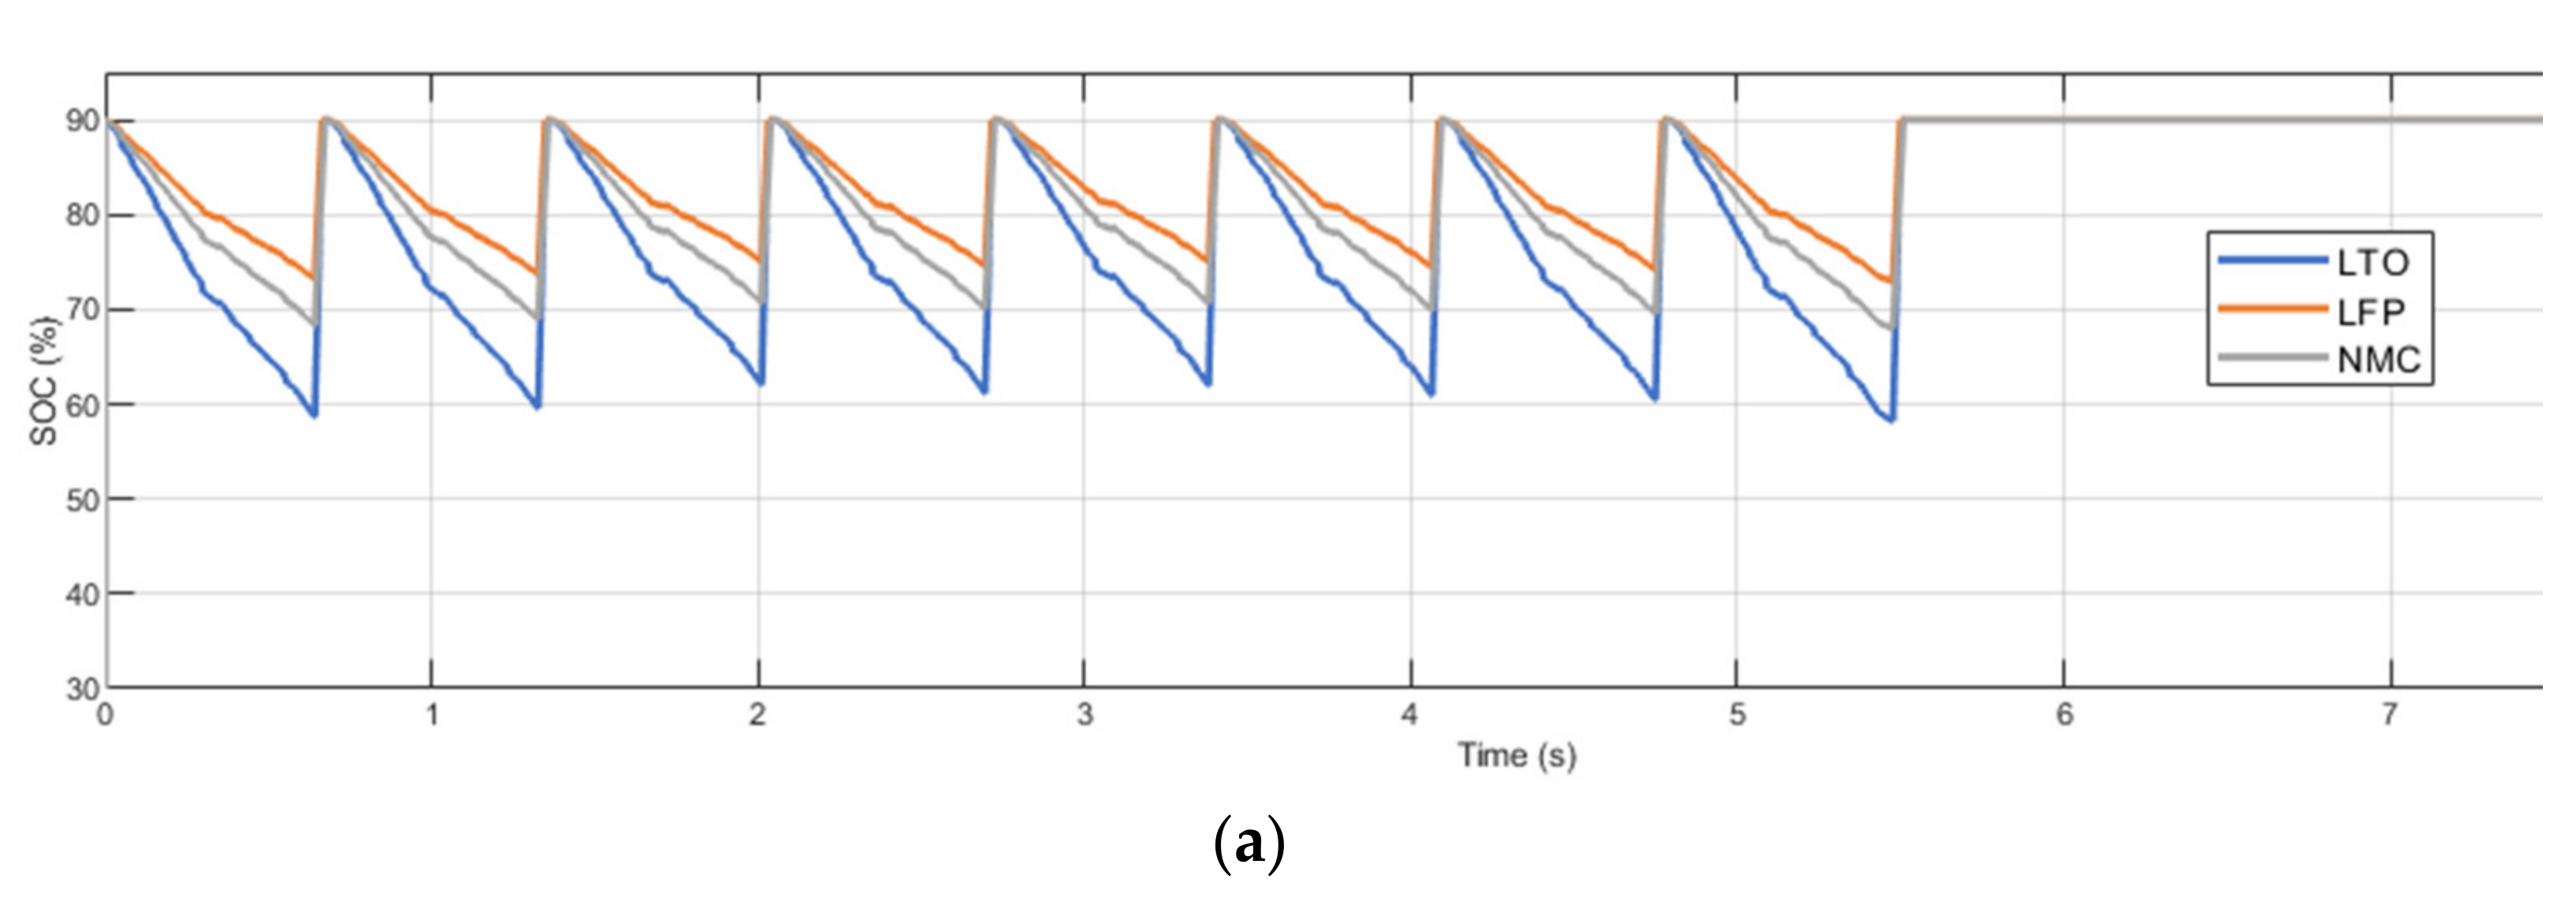
3.1. Sensitivity to Charger Power
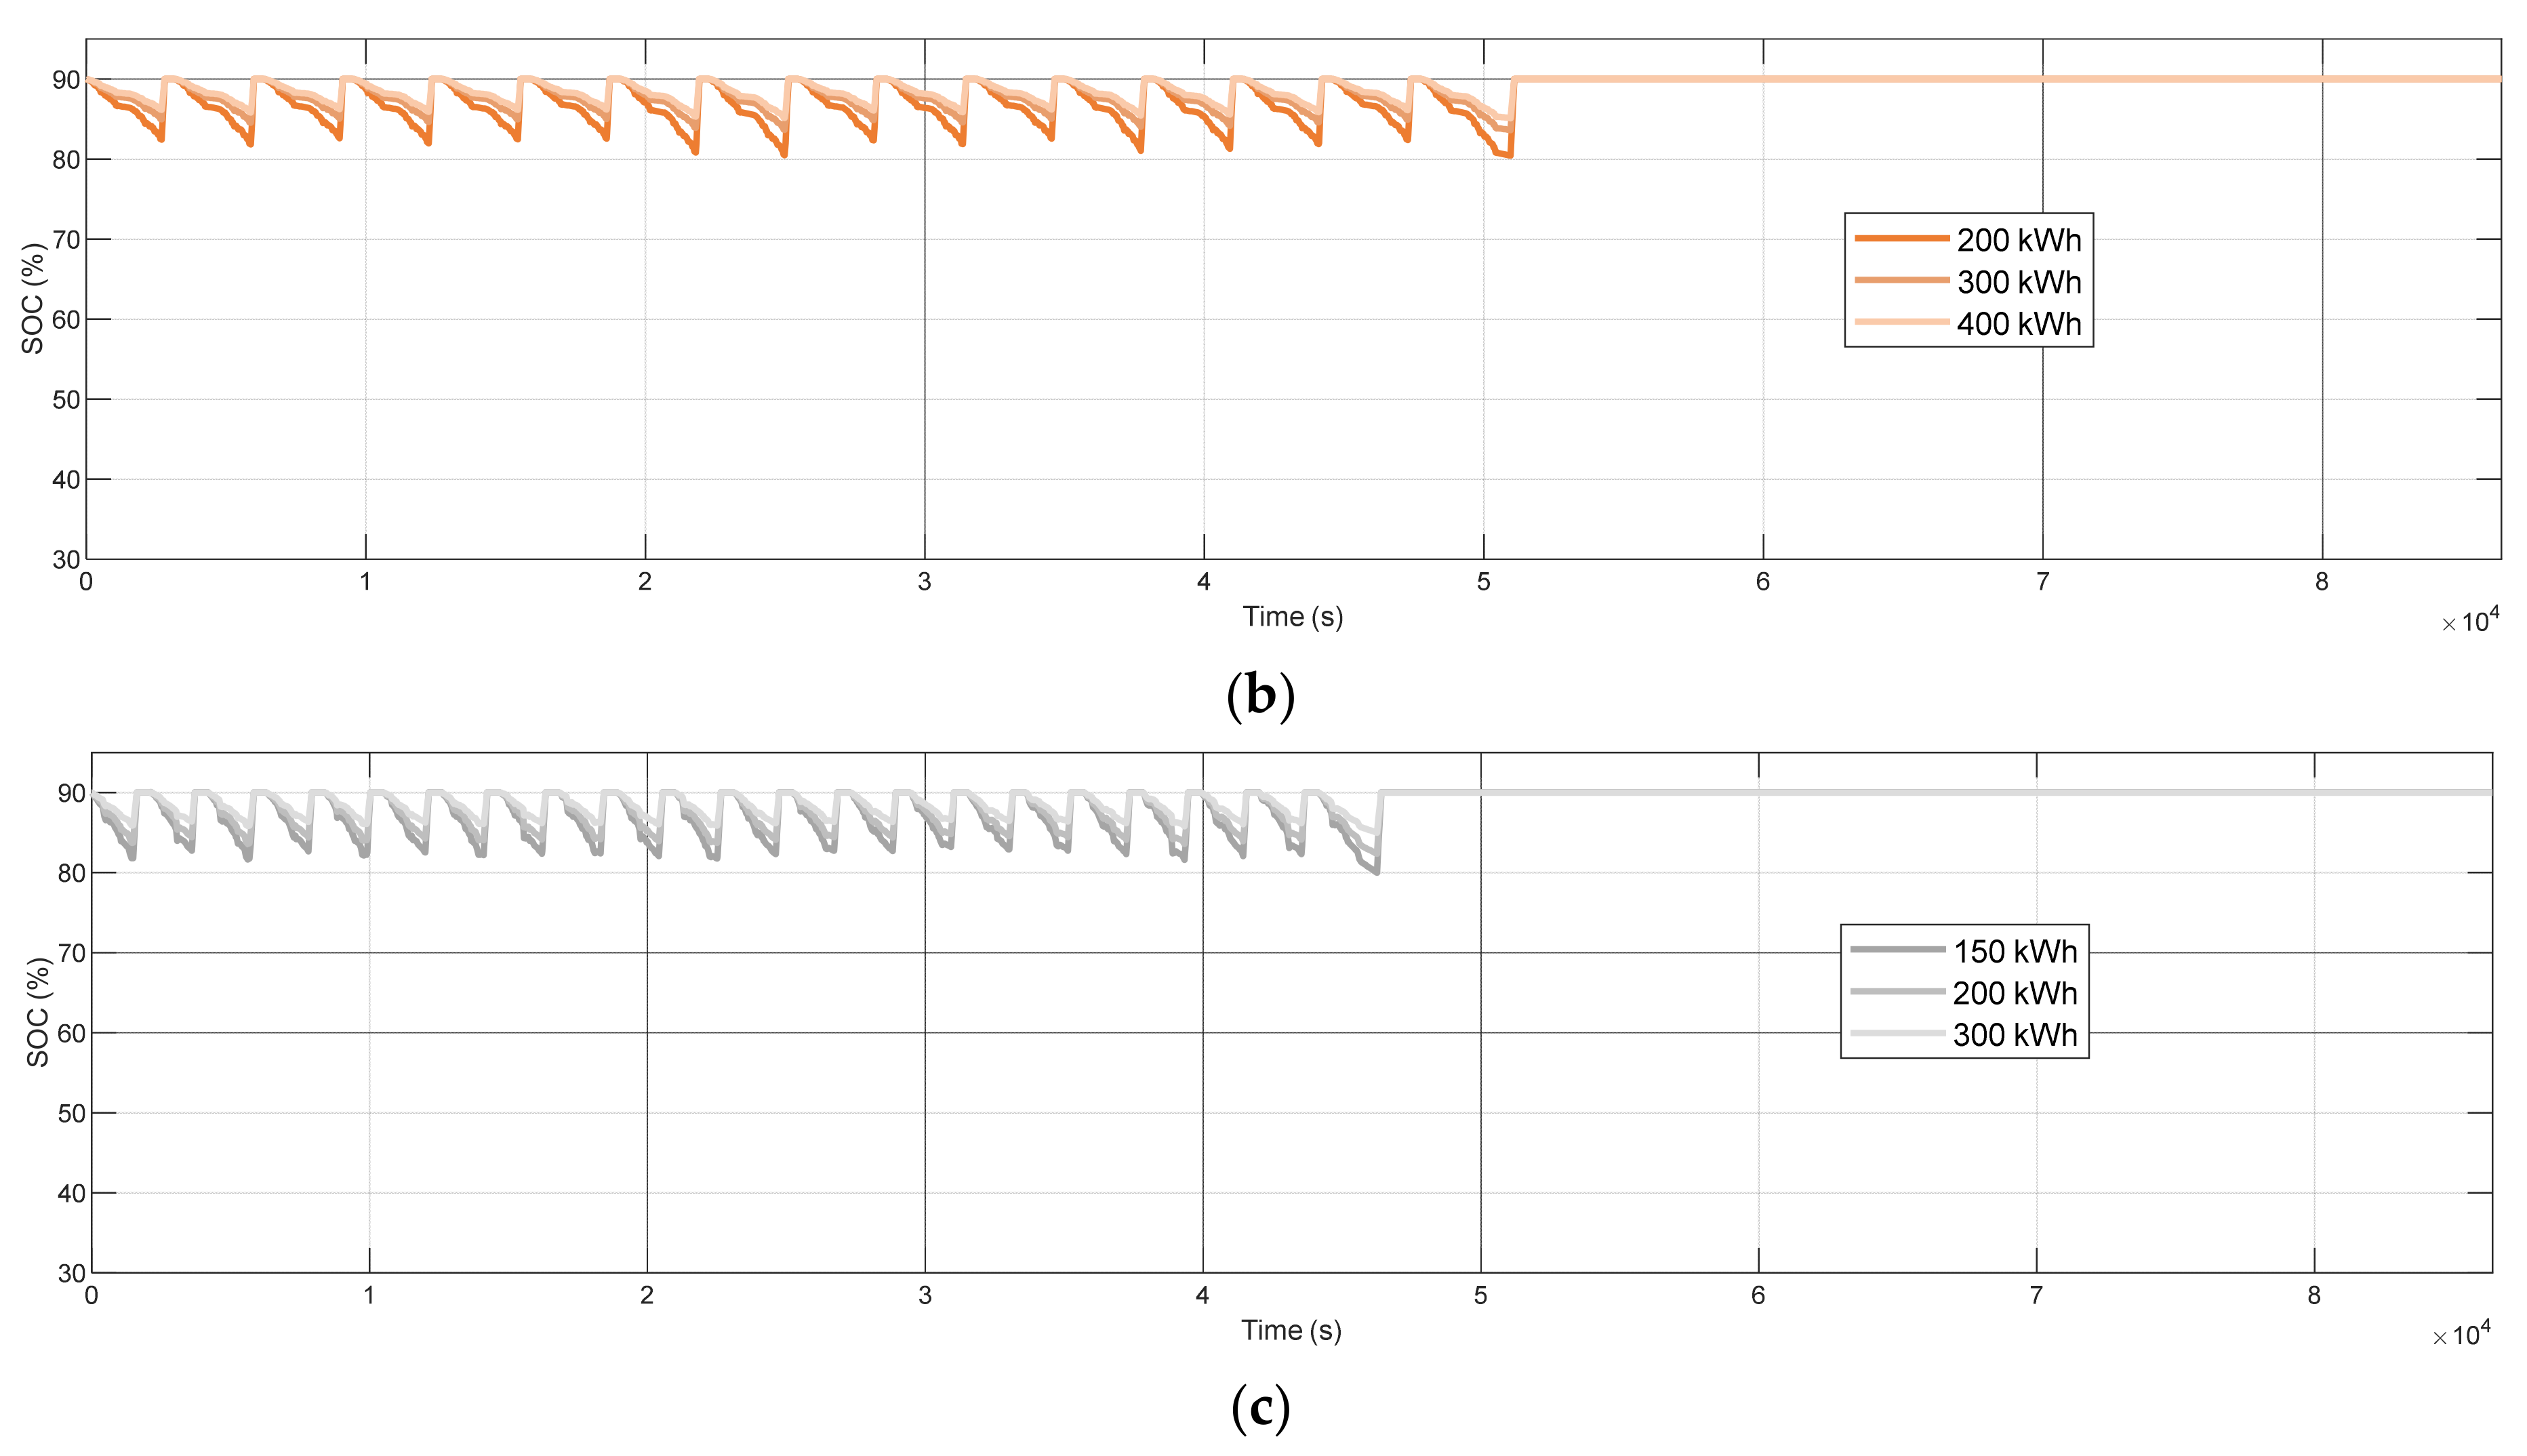
3.2. Sensitivity to Battery Capacity
4. Conclusions
Author Contributions
Funding
Institutional Review Board Statement
Informed Consent Statement
Data Availability Statement
Acknowledgments
Conflicts of Interest
References
- I. E. A. (IEA). Tracking Transport 2020. Available online: https://www.iea.org/reports/tracking-transport-2020 (accessed on 20 July 2020).
- Sustainable Development Solution Network. Available online: https://www.unsdsn.org/european-commission-launches-proposals-to-reach-55-emissions-reduction-by-2030 (accessed on 30 July 2021).
- Sanguesa, J.; Torres-Sanz, V.; Garrido, P.; Martinez, F.; Marquez-Barja, J. A Review on Electric Vehicles: Technologies and Challenges. Smart Cities 2021, 4, 22. [Google Scholar] [CrossRef]
- ASSURED Project. Available online: https://assured-project.eu/ (accessed on 6 July 2018).
- ZeEus, Zero Emission Urban Bus System. Available online: https://zeeus.eu/ (accessed on 22 December 2019).
- ORCA. Available online: https://www.2zeroemission.eu/research-project/orca/ (accessed on 21 May 2020).
- ACEA. ACEA Position Paper Heavy-Duty Vehicles: Charging and Refuelling Infrastructure Requirements; ACEA: Brussels, Belgium, 2021. [Google Scholar]
- Omar, N.; Daowd, M.; Hegazy, O.; Mulder, G.; Timmermans, J.-M.; Coosemans, T.; Bossche, P.V.D.; Van Mierlo, J. Standardization Work for BEV and HEV Applications: Critical Appraisal of Recent Traction Battery Documents. Energies 2012, 5, 138–156. [Google Scholar] [CrossRef]
- Miao, Y.; Hynan, P.; Von Jouanne, A.; Yokochi, A. Current Li-Ion Battery Technologies in Electric Vehicles and Opportunities for Advancements. Energies 2019, 12, 1074. [Google Scholar] [CrossRef] [Green Version]
- Iclodean, C.; Varga, B.; Burnete, N.; Cimerdean, D.; Jurchiş, B. Comparison of Different Battery Types for Electric Vehicles; IOP Publishing: Bristol, UK, 2017; Volume 252, p. 012058. [Google Scholar]
- Cardenas, A.; Guzman, C.; Martinez, W. EV Overnight Charging Strategy in Residential Sector: Case of Winter Season in Quebec. Vehicles 2021, 3, 34. [Google Scholar] [CrossRef]
- Berjoza, D.; Jurgena, I. Influence of batteries weight on electric automobile performance. Eng. Rural Dev. 2017, 16, 1388–1394. [Google Scholar] [CrossRef]
- Wang, Q.; Liu, X.; Du, J.; Kong, F. Smart Charging for Electric Vehicles: A Survey from the Algorithmic Perspective. IEEE Commun. Surv. Tutor. 2016, 18, 1500–1517. [Google Scholar] [CrossRef] [Green Version]
- UITP. The Impact of Electric Buses on Urban Life; UITP: Brussels, Belgium, 2019; pp. 1–12. [Google Scholar]
- Hasan, M.; Avramis, N.; Ranta, M.; Saez-De-Ibarra, A.; El Baghdadi, M.; Hegazy, O. Multi-Objective Energy Management and Charging Strategy for Electric Bus Fleets in Cities Using Various ECO Strategies. Sustainability 2021, 13, 7865. [Google Scholar] [CrossRef]
- Mathieu, R.; Briat, O.; Gyan, P.; Vinassa, J.-M. Comparison of the impact of fast charging on the cycle life of three lithium-ion cells under several parameters of charge protocol and temperatures. Appl. Energy 2020, 283, 116344. [Google Scholar] [CrossRef]
- Dubarry, M.; Devie, A.; McKenzie, K. Durability and reliability of electric vehicle batteries under electric utility grid operations: Bidirectional charging impact analysis. J. Power Sources 2017, 358, 39–49. [Google Scholar] [CrossRef]
- Keil, P.; Jossen, A. Impact of Dynamic Driving Loads and Regenerative Braking on the Aging of Lithium-Ion Batteries in Electric Vehicles. J. Electrochem. Soc. 2017, 164, A3081–A3092. [Google Scholar] [CrossRef]
- Keil, P.; Jossen, A. Charging protocols for lithium-ion batteries and their impact on cycle life—An experimental study with different 18650 high-power cells. J. Energy Storage 2016, 6, 125–141. [Google Scholar] [CrossRef]
- Monem, M.A.; Trad, K.; Omar, N.; Hegazy, O.; Mantels, B.; Mulder, G.; Bossche, P.V.D.; Van Mierlo, J. Lithium-ion batteries: Evaluation study of different charging methodologies based on aging process. Appl. Energy 2015, 152, 143–155. [Google Scholar] [CrossRef]
- Anseán, D.; Dubarry, M.; Devie, A.; Liaw, B.; García, V.; Viera, J.; Gonzalez, M. Fast charging technique for high power LiFePO4 batteries: A mechanistic analysis of aging. J. Power Sources 2016, 321, 201–209. [Google Scholar] [CrossRef]
- Mussa, A.S.; Klett, M.; Behm, M.; Lindbergh, G.; Lindström, R.W. Fast-charging to a partial state of charge in lithium-ion batteries: A comparative ageing study. J. Energy Storage 2017, 13, 325–333. [Google Scholar] [CrossRef]
- Xie, W. Degradation identification of LiNi0. 8Co0. 1Mn0. 1O2/graphite lithium-ion batteries under fast charging conditions. Electrochim. Acta. 2021, 392, 138979. [Google Scholar] [CrossRef]
- Tanim, T.R.; Shirk, M.G.; Bewley, R.L.; Dufek, E.J.; Liaw, B.Y. Fast charge implications: Pack and cell analysis and comparison. J. Power Sources 2018, 381, 56–65. [Google Scholar] [CrossRef]
- Wang, D.; Coignard, J.; Zeng, T.; Zhang, C.; Saxena, S. Quantifying electric vehicle battery degradation from driving vs. vehicle-to-grid services. J. Power Sources 2016, 332, 193–203. [Google Scholar] [CrossRef] [Green Version]
- Liu, H.; Chen, F.; Tong, Y.; Wang, Z.; Yu, X.; Huang, R. Impacts of Driving Conditions on EV Battery Pack Life Cycle. World Electr. Veh. J. 2020, 11, 17. [Google Scholar] [CrossRef] [Green Version]


| EVs Manufactured | Battery Technology | Battery Capacity |
|---|---|---|
| Renault Twizzy | LIB | 6.1 |
| Hyundai Ioniq | LIB | 28 |
| Nissan Leaf | LIB | 30 |
| VW E-Golf | LIB | 24.2 |
| Tesla Model S | LIB | 100 |
| EV Model (Release) | Range EPA (km) | Battery Capacity (kWh) | Motor Power (kW) | Charging Power, kW, AC (DC Fast) |
|---|---|---|---|---|
| SAIC Roewe Ei5 (2020) | 261 | 52.5 | 86 | 7 (50) |
| Peugeot e-208 (2020) | 200 | 50 | 100 | 7 (100) |
| Porsche Taycan TurboS (2020) | 192 | 93.4 | 560 | 22(270) |
| Lexus UX 300 e (2020) | 250 | 54.3 | 150 | 6.6 (50) |
| Jaguar I-PACE (2020) | 234 | 90 | 300 | 7 (50/100) |
| Hyundai Ioniq | 274 | 38.3 | 100 | 7.2 (44/100) |
| Mazda MX-30 (2021) | 124 | 35.5 | 105 | 7 (50) |
| Volkswagen ID.4 (2021) | 300 | 83 | 225 | (125/150) |
| Mercedes EQ EQA (2021) | 217 | 60 | 200 | 11 (100) |
| BMW i4 (2021) | 375 | 80 | 395 | (150) |
| Audi Q4 e-tron (2022) | 281 | 82 | 225 | 7 (125) |
| BMW i7 (2023) | 430 | 120 | 500 | (up to 150) |
| Li-ion Battery Technology | Energy Density (Wh) | Vehicles Range (km) |
|---|---|---|
| NCA | 250 | 130–160 |
| NMC | 200 | 160 |
| LFP | 190 | 250 |
| ZEBRA | 140 | 130–160 |
| LMP | 100 | 120–250 |
| EB Model/Brand | Bus Length (m) | Battery Capacity (kWh) |
|---|---|---|
| Irizar ieTram | 18.73 | 120 |
| Heuliez bus | 18 | 340 kWh |
| VOLVO bus | 12 | 4 × 19 kWh |
| Solaris Urbino 8.9/12/18 | 8.9/12/18 | 160/160/240 |
| LTO | LFP | NMC | |
|---|---|---|---|
| Capacity [Ah] | 20 | 14 | 20 |
| Nominal Voltage [V] | 2.4 | 3.2 | 3.6 |
| Max. C-rate (ch) [C] | 5 | 3.75 | 2.7 |
| Max. C-rate (dch) [C] | 10 | 7.5 | 5 |
| Base Case-High Case | Medium Case | Low Case | |||||||
|---|---|---|---|---|---|---|---|---|---|
| LTO | LFP | NMC | LTO | LFP | NMC | LTO | LFP | NMC | |
| EBT [kWh] | 120 | 200 | 150 | 120 | 200 | 150 | 120 | 200 | 150 |
| ΔEBT | - | - | - | +0% | +0% | +0% | +0% | +0% | +0% |
| Pch [kW] | 600 | 600 | 400 | 400 | 400 | 300 | 200 | 200 | 200 |
| ΔPch | - | - | - | −33% | −33% | −25% | −67% | −67% | −50% |
| Cch [C] | 5 | 3 | 2.67 | 3.33 | 2 | 2 | 1.67 | 1 | 1.33 |
| ΔCch | - | - | - | −33% | −33% | −25% | −67% | −67% | −50% |
| Base Case-Low Case | Medium Case | High Case | |||||||
|---|---|---|---|---|---|---|---|---|---|
| LTO | LFP | NMC | LTO | LFP | NMC | LTO | LFP | NMC | |
| EBT [kWh] | 120 | 200 | 150 | 150 | 300 | 200 | 200 | 400 | 300 |
| ΔEBT | - | - | - | +25% | +50% | +33% | +67% | +100% | +100% |
| Pch [kW] | 600 | 600 | 400 | 600 | 600 | 400 | 600 | 600 | 400 |
| ΔPch | - | - | - | +0% | +0% | +0% | +0% | +0% | +0% |
| Cch [C] | 5 | 3 | 2.67 | 4 | 2 | 2 | 3 | 1.5 | 1.5 |
| ΔCch | - | - | - | −20% | −33% | −25% | −40% | −50% | −44% |
| Demo Line | Barcelona (BCN) | Osnabrück (OSN) | Gothenburg (GOT) | |
|---|---|---|---|---|
| Characteristics | ||||
| Bus Line | L33 | N5 | R55 | |
| Return trip distance [km] | 19.4 | 12.2 | 15.2 | |
| Average speed at peak hour [km/h] | 11.64 | 19.75 | 18.24 | |
| Number of return trips per day [-] | 8 | 16 | 11 | |
| Number of chargers per return trip [-] | 1 | 1 | 2 | |
| Operational time per day [h/day] | 15.33 | 14.15 | 13 | |
| Operational distance per day [km/day] | 155 | 195 | 167 | |
| Maximum/Minimum temperature [°C] | 29/9 | 23/0 | 22/−2 | |
| Main characteristics | Low demand Low ch. freq. Warm climate | High demand Mid. ch. freq. Cool climate | High demand High ch. freq. Cool climate | |
| Chemistry | Charger Power (kW) | CFy (%) | Minimum | Maximum |
|---|---|---|---|---|
| LTO | 200 | 1.0–1.2 | GOT | OSN |
| 400 | 1.1–1.3 | GOT | OSN | |
| 600 | 1.2–1.4 | GOT | OSN | |
| LFP | 200 | 2.5–3.0 | GOT | OSN |
| 400 | 2.5–3.0 | GOT | OSN | |
| 600 | 2.5–3.0 | GOT | OSN | |
| NMC | 200 | 5.1–5.7 | GOT | BCN |
| 300 | 5.5–6.6 | GOT | BCN | |
| 400 | 6.3–8.3 | GOT | BCN |
| Chemistry | Lifetime Improvement Ratio (%) | Minimum | Maximum |
|---|---|---|---|
| LTO | 0.36 | Equal in all scenarios | Equal in all scenarios |
| LFP | 0 | Equal in all scenarios | Equal in all scenarios |
| NMC | 0.4–1 | GOT | BCN |
| Chemistry | BT Capacity (kWh) | CFy (%) | Minimum | Maximum |
|---|---|---|---|---|
| LTO | 120 | 1.2–1.4 | GOT | OSN |
| 150 | 0.9–1.1 | GOT | OSN | |
| 200 | 0.6–0.7 | GOT | OSN | |
| LFP | 200 | 2.5–3.0 | GOT | OSN |
| 300 | 1.7–2.0 | GOT | OSN | |
| 400 | 1.3–1.5 | GOT | OSN | |
| NMC | 150 | 6.3–8.3 | GOT | BCN |
| 200 | 4.5–5.5 | GOT | BCN | |
| 300 | 3.3–3.6 | GOT | OSN |
| Chemistry | Lifetime Improvement Ratio (%/%) | Minimum | Maximum |
|---|---|---|---|
| LTO | 1.15–1.16 | OSN | GOT |
| LFP | 0.98–0.99 | OSN | GOT |
| NMC | 0.97–1.18 | GOT | BCN |
Publisher’s Note: MDPI stays neutral with regard to jurisdictional claims in published maps and institutional affiliations. |
© 2022 by the authors. Licensee MDPI, Basel, Switzerland. This article is an open access article distributed under the terms and conditions of the Creative Commons Attribution (CC BY) license (https://creativecommons.org/licenses/by/4.0/).
Share and Cite
Al-Saadi, M.; Olmos, J.; Saez-de-Ibarra, A.; Van Mierlo, J.; Berecibar, M. Fast Charging Impact on the Lithium-Ion Batteries’ Lifetime and Cost-Effective Battery Sizing in Heavy-Duty Electric Vehicles Applications. Energies 2022, 15, 1278. https://doi.org/10.3390/en15041278
Al-Saadi M, Olmos J, Saez-de-Ibarra A, Van Mierlo J, Berecibar M. Fast Charging Impact on the Lithium-Ion Batteries’ Lifetime and Cost-Effective Battery Sizing in Heavy-Duty Electric Vehicles Applications. Energies. 2022; 15(4):1278. https://doi.org/10.3390/en15041278
Chicago/Turabian StyleAl-Saadi, Mohammed, Josu Olmos, Andoni Saez-de-Ibarra, Joeri Van Mierlo, and Maitane Berecibar. 2022. "Fast Charging Impact on the Lithium-Ion Batteries’ Lifetime and Cost-Effective Battery Sizing in Heavy-Duty Electric Vehicles Applications" Energies 15, no. 4: 1278. https://doi.org/10.3390/en15041278
APA StyleAl-Saadi, M., Olmos, J., Saez-de-Ibarra, A., Van Mierlo, J., & Berecibar, M. (2022). Fast Charging Impact on the Lithium-Ion Batteries’ Lifetime and Cost-Effective Battery Sizing in Heavy-Duty Electric Vehicles Applications. Energies, 15(4), 1278. https://doi.org/10.3390/en15041278