Article

Integrated Energy Planning for Near-Zero Carbon Emission Demonstration District in Urban Areas: A Case Study of Meishan District in Ningbo, China

1
Tongji Architectural Design (Group) Co., Ltd., Shanghai 200092, China
2
College of Mechanical and Energy Engineering, Tongji University, Shanghai 201804, China
3
State Grid Ningbo Electric Power Supply Company, Ningbo 315016, China
4
Sino-German College of Applied Sciences, Tongji University, Shanghai 201804, China
*
Authors to whom correspondence should be addressed.
Energies 2022, 15(3), 874; https://doi.org/10.3390/en15030874
Submission received: 29 November 2021 / Revised: 7 January 2022 / Accepted: 19 January 2022 / Published: 25 January 2022
(This article belongs to the Special Issue Green Economy and Sustainable Development)

Abstract

:
Reasonable regional integrated energy planning is an important prerequisite for the construction of a Near-Zero Carbon Emission Demonstration District (NCEDD). An integrated energy planning scheme that is based on a three-step planning method with the objective of achieving an NCEDD is proposed in this paper. First, the planning objectives should be determined. After that, the planning strategies should be established. Finally, the planning approaches should be proposed according to the previously determined objectives and strategies. A case study considering the integrated energy planning of the Meishan International Near-Zero Carbon Emission Demonstration District (MINCEDD) is investigated to explain the planning method. In addition, the planning results, which are indicated as indexes, are explained, analyzed, and compared to the ones of other districts. The indexes include a proportion of renewable energy to primary energy (73% by 2030 and 108% by 2050), a proportion of renewable power to total power consumption (98% by 2030 and 111% by 2050), and CO2 emission reduction rates (70% by 2030 and 100% by 2050) and are more advanced than other districts in China. This planning scheme and method can provide a reference for the integrated energy planning of NCEDDs in developed urban areas.

1. Introduction

Strategic objectives were proposed during the 2015 United Nations Climate Conference in Paris which aimed to control the average global temperature within 2 °C of pre-industrial levels and make substantial effort to control temperature increases within 1.5 °C to achieve a peak of global greenhouse gas emissions (GHGs) as soon as possible, and achieve net-zero GHGs during the second half of this century [1].
Therefore, a series of policies have been proposed by countries to achieve carbon neutrality by 2050. For example, the European Union (EU) proposed that it would be carbon neutral by 2050 and hence released “The European Green Deal” in 2019 during the United Nations Climate Change Conference, which details key policies and core technologies in essential areas that are to be developed and the release of eight major goals [1,2]. The U.S. House of Representatives published “The Congressional Action Plan for a Clean Energy Economy and a Healthy, Resilient, and Just America” to promote the U.S. to achieve net-zero carbon emissions by 2050 [3]. Japan issued “The Green Growth Strategy”, which introduced the country’s goal to be carbon neutral by 2050 and proposed specific development goals and essential development tasks for core industries [4].
In order to contribute to the net-zero GHGs, China announced that peak CO2 emissions will be achieved by 2030 and that the nation will become as carbon neutral as possible by 2060 [5]. Additionally, tens of Chinese policies related to the reduction in carbon emissions, renewable energy, the electricity market, energy storage, etc., have been promulgated by various management departments from 2020 to 2021. One of these policies is called “Opinions of the Central Committee and the State Council on the complete, accurate and comprehensive implementation of the new development concept to achieve carbon peaking and carbon neutral”. The importance of energy planning is stressed by this policy. It is indicated that the carbon-neutral district is reaching the carbon emission limit rather than completely zero carbon emission. In the meantime, the requirements for both the supply and demand sides, as well as for multiple fields, such as energy, construction, industry, and transportation, need to be coordinated and put forward to achieve carbon neutrality [6]. Moreover, the Top Ten Actions for Carbon Peaking were announced in another Chinese policy called the “Carbon Peaking Action Plan by 2030”, which aim to promote peak carbon emissions by 2030 [7].
Cities and provinces in China are projected to reach peak CO2 emission between 2020 and 2030, while some relatively developed cities, such as Beijing, Zhenjiang, Shenzhen, etc., were projected to reach peak CO2 emissions before 2020 [8].
The definition of CO2 emission is clarified by IPCC and is defined is the sum of the GHGs that are converted into equivalent CO2 emissions by the indexes of global warming potential (GWP), global temperature potential (GTP), radiative forcing equivalence potential, etc. [9]. However, there are various definitions of CO2 emissions when defining emission targets related to carbon neutrality among countries [10]. In most western and in Asian countries, such as Demark, Slovakia, Chile, Switzerland, Portugal, Canada, the United Kingdom (UK), Singapore, Germany, Sweden, France, Finland, Japan, etc., CO2 emissions are defined as GHGs. CO2, CH4, and N2O emissions are defined as CO2 emissions in Bhutan and Uruguay. However, the definition in China and in many other countries is not clear. In this paper, CO2 emissions refer to the GHGs in equivalent amounts of CO2 based on GWP, including the emissions from fossil fuel combustions caused by transportation, electricity generation, manufacturing, building operations, etc.
Cai et al. [11] indicate that increases in carbon emissions are mainly driven by the population. In addition, over 90% of the total CO2 emission in China are from urban areas [8]. This means that reducing CO2 emissions in urban areas is significant for the total carbon reduction in the entire country, and conducting near-zero carbon emission programs is one of the current strategies in China that is being implemented to reduce carbon emissions in urban areas.
The Near-Zero Carbon Emission Demonstration District (NCEDD) project was first proposed in the China’s 13th Five-Year Plan. This project is one of the 12 projects of the 13th Five-Year Plan and has caused widespread concern in the community. Moreover, the 13th Five-Year Plan proposed that GHG control measures in mature areas, which are subject to restricted and prohibited development, ecological functional areas, industrial mining areas and towns, etc., should be selected to carry out the NCEDD project and that 50 demonstration projects should be built by 2020.
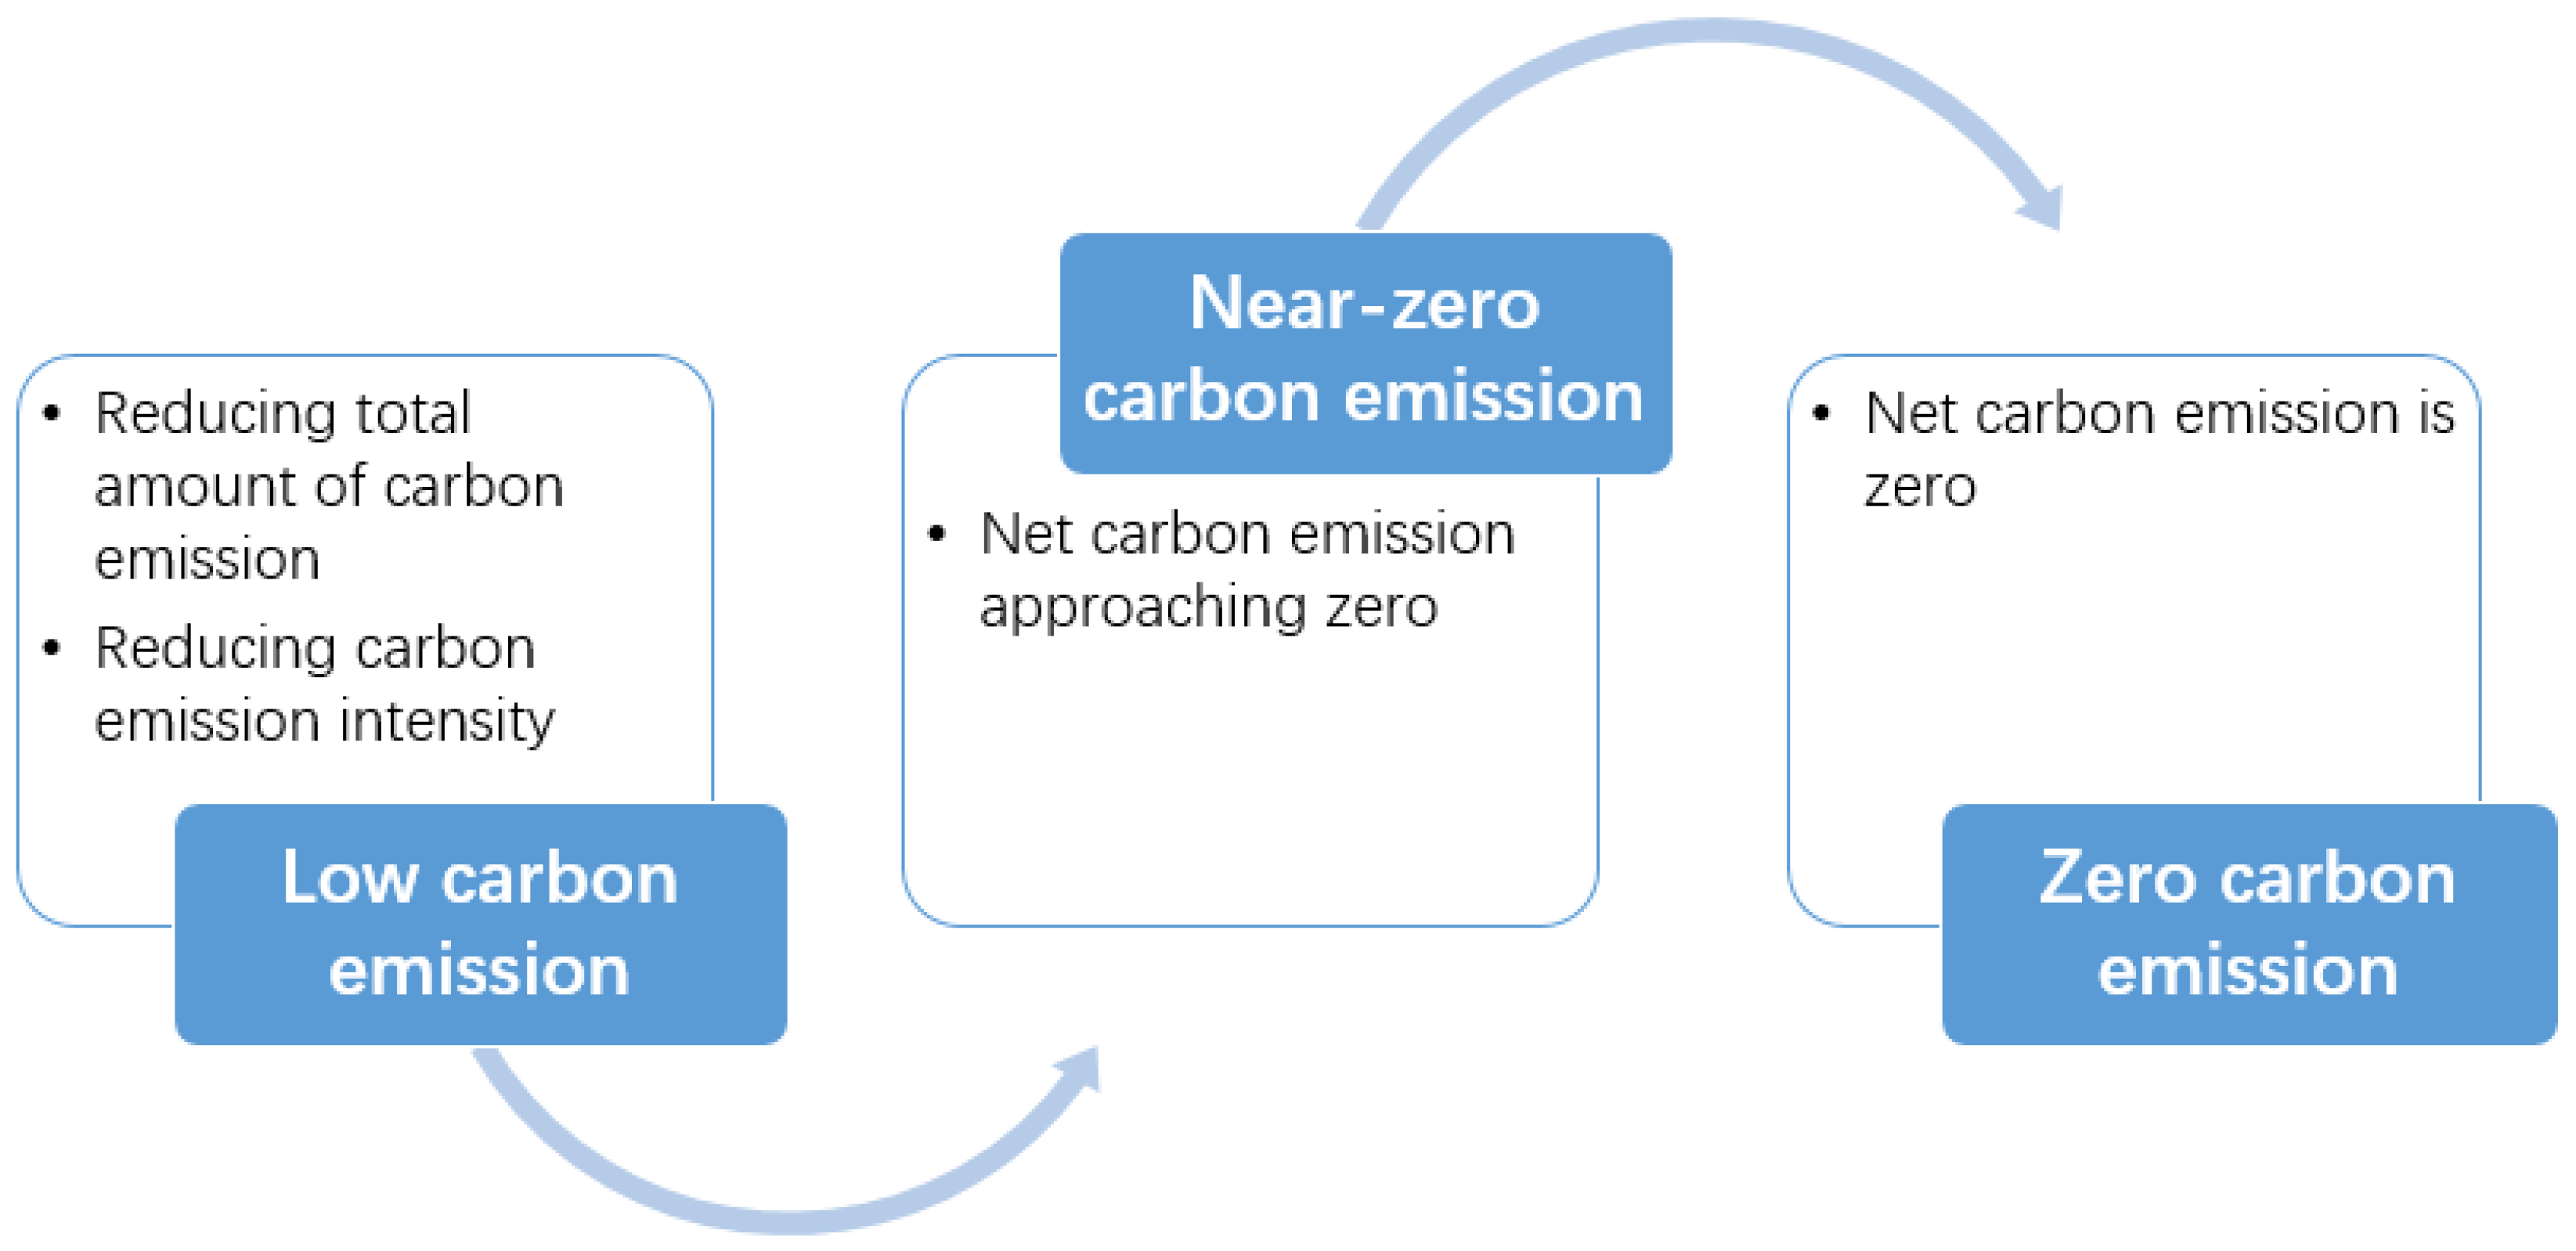
In order to carry out the NCEDD, researchers, such as the IPCC, have mainly discussed near-zero carbon emissions in terms of its connotations. The IPCC indicates that carbon neutrality or net-zero CO2 emissions are achieved when annual CO2 emissions are considered to be balanced by decarburization technologies [9]. Near-zero carbon emissions are defined as being achieved when the net carbon emissions are approaching zero in a specific area. The relationship among near-zero carbon emissions, low carbon emissions, and zero carbon emissions is shown in Figure 1. Zero carbon emissions is the final objective for low-carbon community construction, while low carbon emissions and zero carbon emissions are necessary in the process to achieve zero carbon emissions. The net carbon emissions of a specific district can be decreased to zero gradually by reducing carbon emissions from the supply, contributing to zero carbon energy, etc. Moreover, near-zero carbon emissions refer to contexts that are approaching zero carbon emission situations.
The definition of an NCEDD can be explained based on the meaning of near-zero carbon emissions. Demonstration districts represent typical districts that are developed and constructed in advance. The development mode can play a demonstration role, and the experience can be replicated and promoted. Li et al. [12] define NCEDDs with near-zero carbon emission as follows: A typical district where the objective net carbon emissions approaching zero is achieved using approaches that reduce source carbon emissions, increase carbon sequestration, or contribute zero carbon energy, etc., within the boundaries of the county’s (county-level city/district) administrative divisions and where the carbon-emission-reducing methods are replicable and can be promoted. Furthermore, two quantitative indexes are proposed for NCEDDs and are as follows: (1) It is possible for the total net carbon emissions to reach levels closer to zero by offsetting source carbon emissions and carbon sequestration or by offsetting source carbon emissions and by contributing zero carbon energy; (2) absolute carbon emissions reach their peak value. These quantitative indexes are also important integrated energy planning objectives for NCEDDs.
Liu [13] concludes four types of NCEDDs. The first type is 100% renewable energy demonstration districts, which are applicable to less developed areas with plentiful renewable energy resources. The second type is carbon-neutral demonstration districts, which are applicable for scenic areas with large amounts of forests and pastoral areas. The third type of NCEDD is partial demonstration in the industry, for example, near-zero carbon emission buildings. The fourth type of NCEDD is low carbon emission upgrades, which is further decarburized on the basis of current low carbon emission pilot projects. The first and second types are constrained by regional and resource issues, and they are not able to be promoted in developed urban areas. The third and fourth types only consider near-zero carbon emissions in a narrow sense. It is necessary to determine how to build NCEDDs in developed urban areas.
Reasonable district-integrated energy planning is an important part of constructing urban NCEDDs. Recently, the commonly used methods for energy planning are demand-side energy planning and supply-side energy planning. In Chinese urban planning systems, urban power planning, gas planning, and centralized cooling and heating planning mostly belong to supply-side energy planning, i.e., top-down planning. However, demand-side energy planning starts from the demand side, pays attention to the effective integration and reasonable application of various energy resources in urban areas, and is a bottom-up process. In recent years, demand-side energy planning has been utilized more and more often in district-integrated energy planning.
Recently, there has been increasing amounts of research into demand-side planning, a large amount of which has been conducted by Long [14,15,16,17], Jelić [18], Wang [19], and Yu [20] et al. Most of these researches proposed reducing energy demand, utilizing renewable energy sources instead of fossil fuels, and capturing and storing carbon (CCS). These are solutions also indicated by Khalilpour [21] as specific technical approaches for the reduction in carbon emissions. However, developed urban areas lack carbon sequestration resources, such as forests and pastoral areas, which makes it even more difficult for them to achieve near-zero carbon emissions. Apart from reducing energy demand and applying renewable energy, Dobbelsteen et al. [22] proposed seeking energy synergy rather than CCS in urban energy planning. In addition, energy cascade utilization, the reuse of waste heating, energy storage, etc., are ways in which energy synergy can be implemented, which can provide heating and cooling network connections at different temperature levels.
In existing research, there is generally no clear planning method for district energy planning and few implementation conditions for energy schemes [23,24,25,26,27]. There have been numerous limitations in the research that has been carried out recently. The Shenzhen Academy of Building Research Co., Ltd. [23] conducted a green and ecological district in Ya’an by energy demand forecasting and energy resources analysis. The renewable energy and heat pump systems are planned to take place after evaluation. Cheng et al. [24] proposed four available energy station schemes with integrated energy utilization and energy micro-grid in a northern district. Tang et al. [25] developed energy schemes for a district in Guilin by determining planning objectives and analyzing energy demand and energy resources. The Tianjin Architectural Design Institute et al. [26] utilized a planning method that consisted of project investigation, demand forecasting, the proposal of energy schemes, the evaluation and comparison of energy schemes, and the determination of recommended schemes. The energy schemes for the university park in Tianjin were proposed and determined by the HVAC, electrical, water supply, and drainage energy consumption sectors. Although this method is relatively clear, it is only suitable for building sector districts rather than industrial and traffic sectors. Zhejiang Zheneng Energy Service Co., Ltd. et al. [27] proposed an integrated energy planning scheme for a district called Xiangbao in Ningbo. The distributed energy stations are planned for buildings and industries. Additionally, special planning for solar energy, electricity, water source, and utility tunnels is proposed based on local conditions. However, there are limitations for the above researches in terms of the absence of clear planning methods, planning objectives, and integrated and implementable energy schemes. The limitations of the above mentioned researches are listed in Table 1.
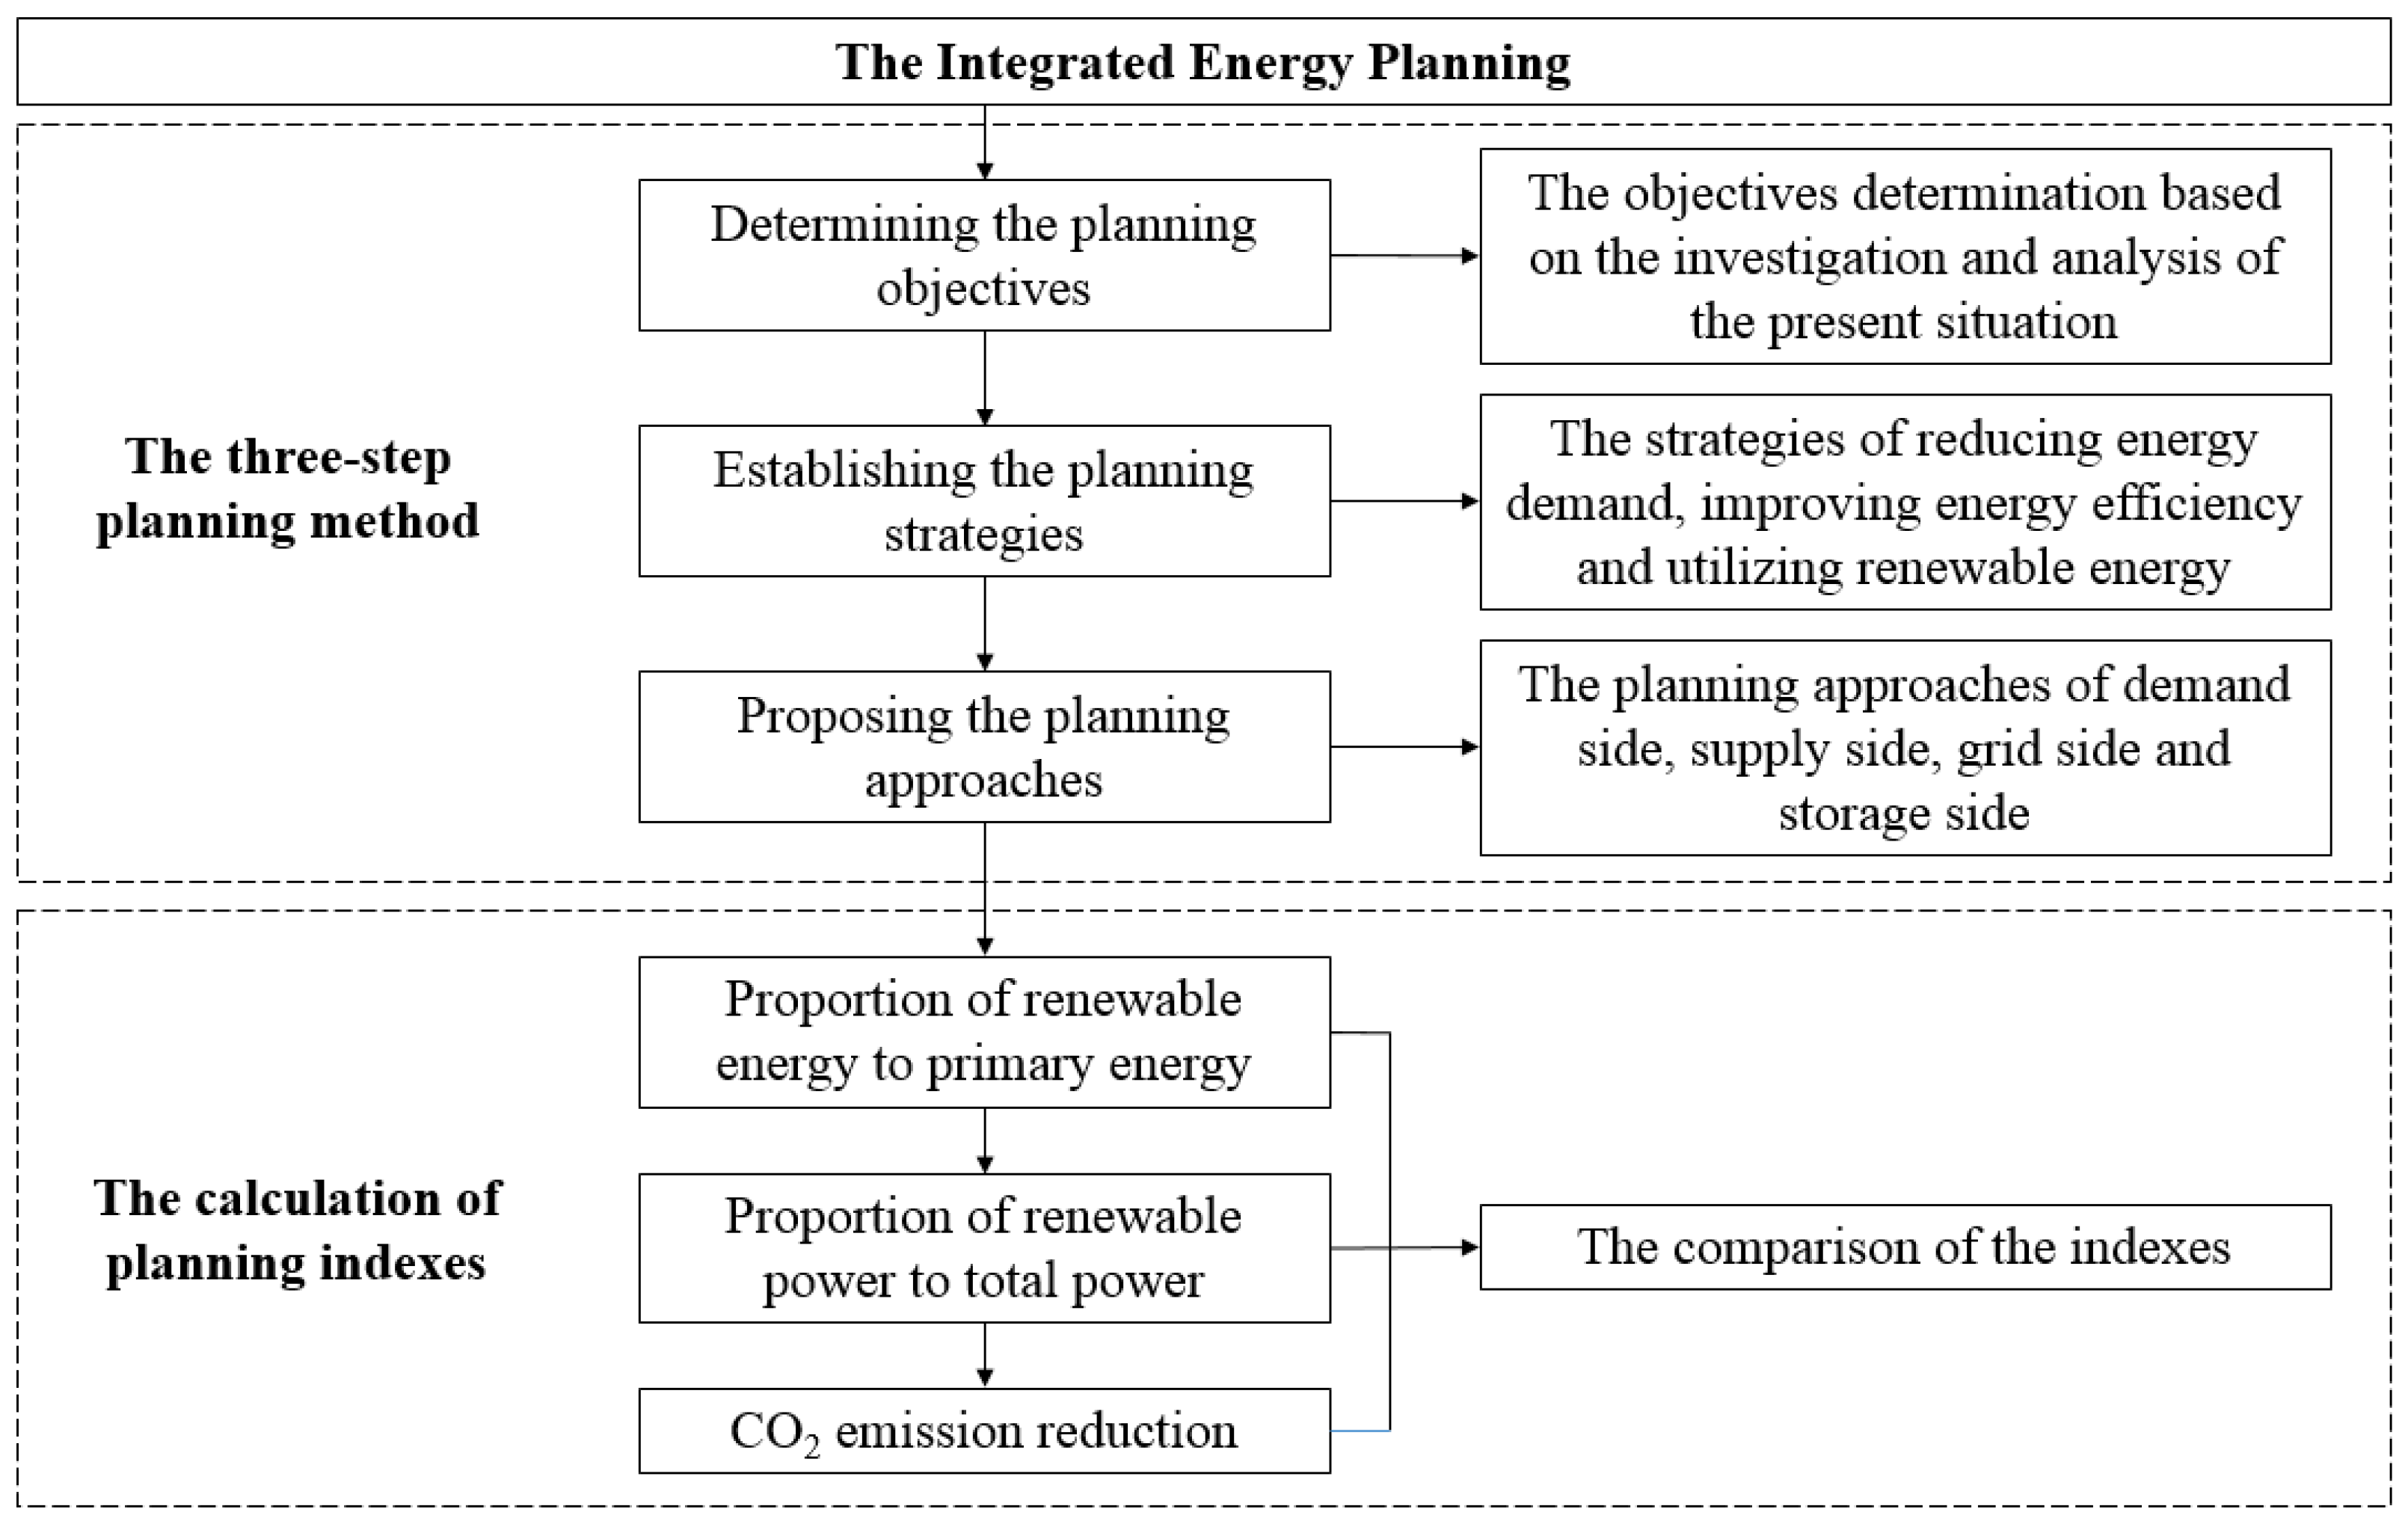
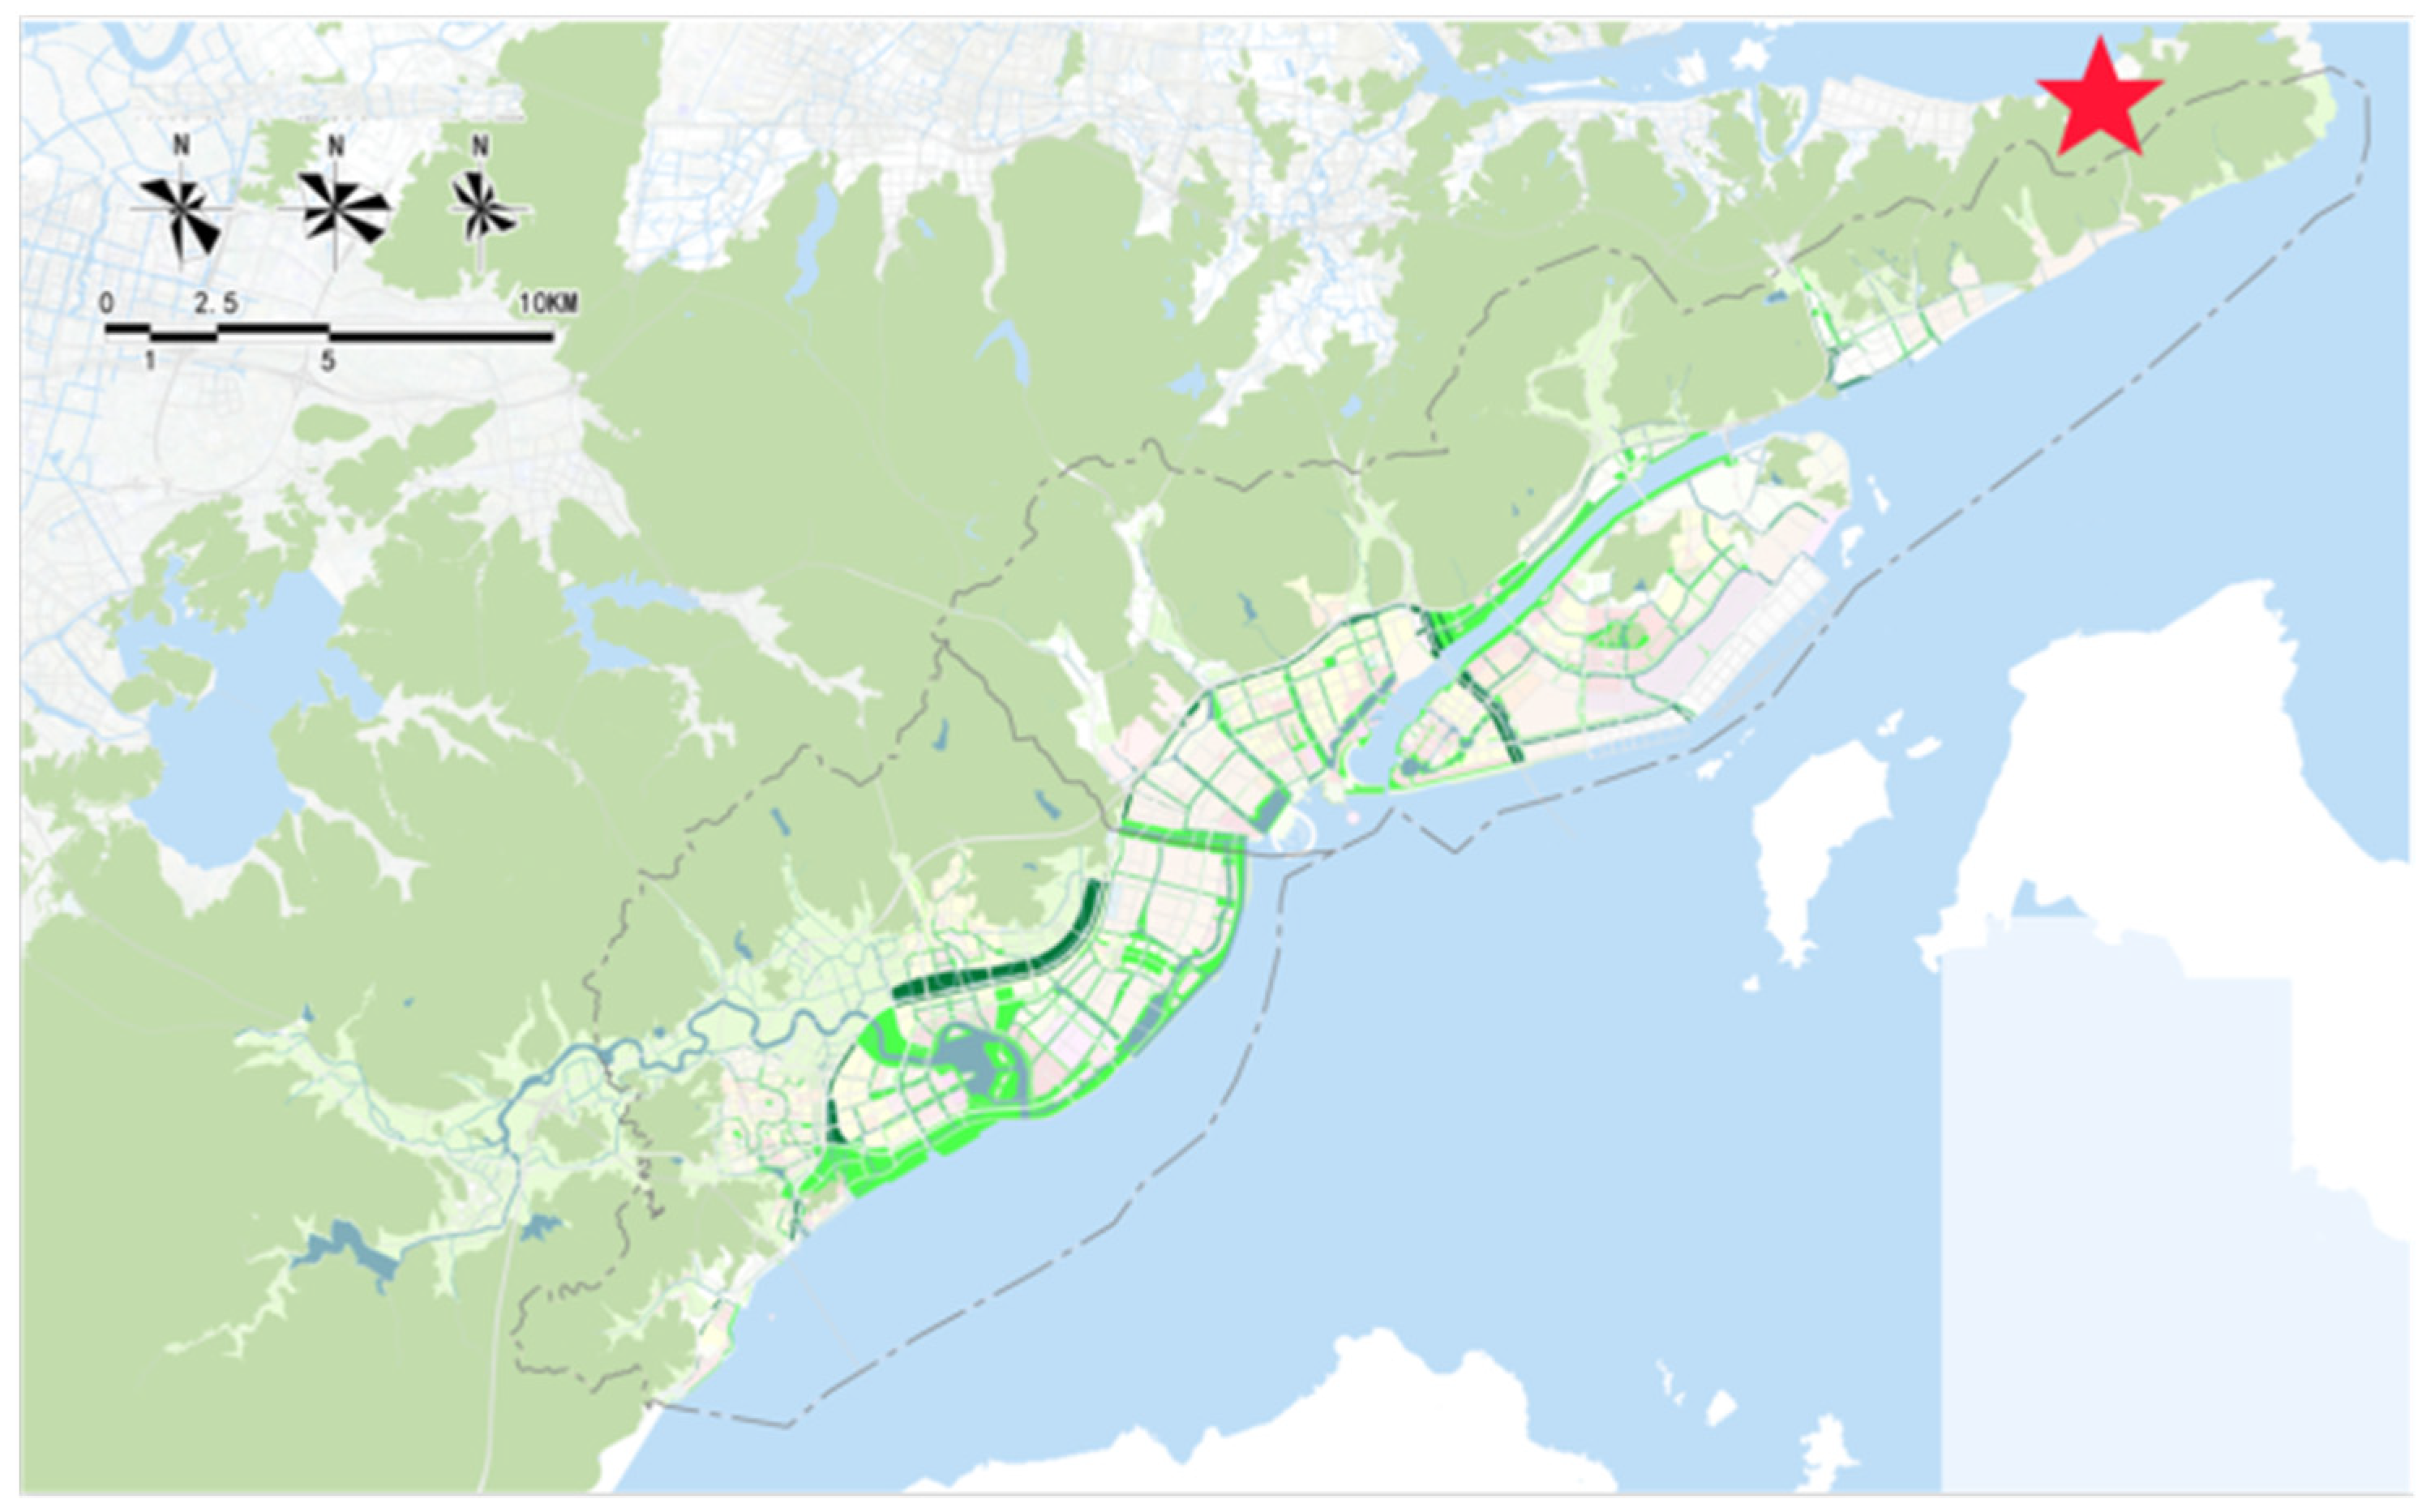
In this paper, a case study of the Meishan International Near-Zero Carbon Emission Demonstration District (MINCEDD) was investigated in order to propose an integrated energy planning scheme for this district. Moreover, a three-step planning method for the planning of NCEDDs was proposed and includes planning objectives, approaches, and strategies. After that, the planning results were analyzed and compared with respect to the indexes of renewable energy and CO2 reduction.

2. Methods and Algorithms

2.1. The Three-Step Planning Method

A three-step planning method for NCEDD development is proposed that determines the planning objectives, planning strategies, and planning approaches. Firstly, the planning objectives are determined by focusing on targets such as CO2 reduction, renewable energy utilization, etc. After that, the planning strategies are formed as the overall principles of the planning approaches, which consist of reducing energy demand, applying renewable energy based on local resource conditions, and improving integrated energy efficiency through means such as thoroughly utilizing waste heat on the demand side. Finally, the planning approaches are proposed based on the objectives and on the local conditions affecting access to natural resources, current and planned building construction, traffic and industry, etc., and can be categorized into the demand-side, supply-side, grid-side, and storage-side approaches, according to the energy application segment.

2.1.1. Determining the Planning Objectives

The objectives should be determined to satisfy the NCEDD target as well as to be appropriate the local conditions of the district. Therefore, the research team investigated local energy supply companies, local governments, local factories, etc. to thoroughly understand the current conditions for renewable energy utilization and potential, the electricity supply, industrial energy consumption, and waste energy potential, etc.
The research team evaluated and researched the energy utilization potential and advantage of the district by analyzing the current energy supply, energy consumption, and renewable and waste energy potential. After that, the NCEDD objectives were determined with respect to the indexes of renewable energy utilization and CO2 emission reduction.

2.1.2. Establishing the Planning Strategies

In order to the achieve the objectives that were previously determined, the planning strategies were established from the aspects of reducing energy demand, improving energy efficiency, and utilizing both waste heat and renewable energy. The strategies must not only be established according to the objectives but should also be adapted to the local conditions of the planned district.

2.1.3. Proposing the Planning Approaches

Planning approaches are based on “demand-supply-grid-storage”, which means reducing energy demand on the demand side, utilizing renewable energy on the supply side, and improving energy interconnection and peak load shifting on the grid and storage sides so as to achieve the objectives of the MINCEDD.

2.2. The Calculation Algorithms of Planning Indexes

After applying the three-step planning method, including the objectives, strategies, and approaches, indexes with respect to renewable energy utilization and CO2 emission reduction are proposed and summarized in Table 2. The indexes were evaluated by analyzing and comparing other similar planned districts. The advancement and feasibility of the planning scheme based on the three-step planning method can be proven after the evaluation.

2.2.1. Proportion of Renewable Energy to Primary Energy

In order to explain the definition of the RE/PE index, the algorithm of this index is introduced followed by its explanation in this sub-section.
Algorithm: Total renewable energy consumption (tce) ÷ Total primary energy consumption (tce) × 100%
Explanation: Renewable energy refers to the energy rather than fossil fuels and includes wind energy, solar energy, water energy, biomass, geothermal energy, ocean energy, etc. According to the second provision of the “China National Renewable Energy Law” [28], renewable energy power mainly consists of solar PV, wind power, biomass power, etc. Primary energy refers to the energy resources that exist in nature without processing and conversion, also known as natural energy, such as coal, oil, natural gas, hydropower, etc.
Total energy consumption is the total amount of annual energy consumed on the demand side in the planned district. RE/PE is the amount of total annual consumed renewable energy divided by the total annual consumed primary energy in the planned district.

2.2.2. Proportion of Renewable Power to Total Power Consumption

In order to explain the definition of the RP/PC index, the algorithm for this index is introduced followed by its explanation in this sub-section.
Algorithm: Renewable energy power generation (kWh) ÷ District total power consumption (kWh) × 100%
Explanation: Power generation refers to energy generation on the supply side. The meaning of renewable power is the power generated from the renewable energy that is explained in Section 2.2.1. RP/PC is the total annual renewable power generated divided by the total annual power consumed in the planned district.

2.2.3. CO2 Emission Reduction

In order to explain the definition of the CO2 emission reduction index, the algorithm of this index is introduced followed by its explanation in this sub-section.
Algorithm: (CO2 emission caused by conventional energy supply − CO2 emission caused by near-zero carbon emission energy supply) ÷ CO2 emission caused by conventional energy supply × 100%
Explanation: Conventional energy is the primary energy that has been mass-produced and widely used, such as coal, oil, natural gas, etc. Zero-carbon emission energy is the energy that is generated and consumed without creating carbon emissions, such as solar energy, wind energy, ocean energy, geothermal energy, etc. The near-zero carbon emission energy supply refers to the combination of conventional and zero-carbon emission energy supply in planned districts, which leads to the overall near-zero carbon emission effect.
The three-step planning method process is shown in Figure 2.

3. Present Situation of the Planning District

3.1. The Planning Area and Planning Period

The MINCEDD planning area, which is located in Ningbo, Zhejiang province, is 333 km2 and includes Meishan Island in the Beilun area, Chunxiao Street, and Baifeng Town. The planning area is shown in Figure 3.
According to the regulatory plans, the main planning area comprises six core areas that make up a total land area of 43.49 km2 and includes Financial Town, the Menhu Area, the Industry Area, the Bonded Area, the East Area, and the Li’ao Area (as is shown in Figure 4).
The planning period is from 2020 to 2050, with mid-term planning taking place from 2020 to 2030 and long-term planning taking place from 2030 to 2050.

3.2. Local Energy Resources

The MINCEDD belongs to the subtropical monsoon climate zone (see Figure 5) [29] and contains abundant renewable resources and clean energy. In order to appropriately propose energy planning schemes based on local conditions, energy resources, including solar energy, wind energy, biomass energy, liquefied natural gas (LNG) cold energy, and hydrogen energy, are each analyzed and evaluated in the following.

3.2.1. Solar Resource

Solar energy is one of the most competitive sources of renewable energy due to its abundance and clean operation. Total annual solar radiation of MINCEDD is greater than 4008 MJ/m2/a [30].

3.2.2. Wind Resource

Wind resources are relatively rich in the MINCEDD [31]. Wind resources are simulated using computational fluid dynamics (CFD) numerical software. The simulation results show that in the winter and summer, the dominant wind directions are northwest and southeast, respectively. In addition, the dominant wind speed is about 7.48 m/s in winter and 7.95 m/s in summer and occurs at the height of 80 m. The wind speed distribution map at different heights in the planning area is shown in Figure 6.

3.2.3. Hydrogen Energy Resource

Ningbo is a city with a large amount of industrial by-product hydrogen, which is mostly expulsed from the Daxie Industrial Park. According to TrendBank statistics, Ningbo can supply about 72 kt/yr of by-product hydrogen, which indicates the large planning potential of by-product hydrogen from the industry sector. Moreover, the purity of industrial by-product hydrogen from Donghua Energy and from Wanhua Chlor-Alkali is 99.99% based on site investigations. Existing hydrogen by-product production is detailed in Table 3.

3.2.4. LNG Cold Energy Resource

An LNG receiving station that belongs to Zhonghai Ningbo Liquefied Natural Gas Co., Ltd. is located at the northeast end of the planning area. The external transmission capacity of the LNG receiving station is 7 million tons per year. Currently, only 400 ktons of LNG per year is used for cold energy air separation operations, while most of the remaining cold energy is released into the sea water. Hence, there is large application potential in which the remaining cold energy can be used. The LNG receiving station location is shown in Figure 7.

3.2.5. Other Resources

The biomass resources and low-grade heat sources in the planning area were investigated and evaluated. The existing biomass power plants cover all biomass resources in the planned district and part of the biomass resources beyond the MINCEDD in Ningbo (including domestic waste). There is additional capacity that can be used by the MINCEDD biomass power plant in the future even though the capacity of the plant will maintain its status due to garbage odor concerns in the selected location. In addition, a sewage treatment plant with a daily treatment capacity of 35,000 tons will be built in the near future. According to the progress being made in the construction of the sewage plant and the surrounding users, it is proposed that a small-scale sewage source heat pump system can be developed by the MINCEDD in the future. Apart from biomass and sewage source, low-grade heat sources, groundwater sources, soil sources, and seawater sources are not suitable for exploitation due to the environmental and policy constraints.

3.3. Current Energy Consumption

The total energy consumption in the MINCEDD was about 318 ktce in 2017 and includes 106.9 ktce of building consumption, 177.3 ktce of industry consumption, and 34.2 ktce of traffic consumption. The building, industry, and traffic sectors account for 33.5%, 55.7%, and 10.8% of the total energy consumption, respectively.
In addition, there are 235.8 ktce of primary energy that are consumed by electricity, which is 74.1% of the total primary energy consumption. The natural gas consumption is 27.5 ktce and fossil fuel (incl. coal and oil) consumption is 55 ktce, representing 8.6% and 17.3% of total primary energy, respectively. Figure 8 illustrates the energy consumption and percentages of different energy sectors and energy sources [32].

4. The Integrated Energy Planning Scheme

4.1. The Planning Objectives

The primary energy consumption is 318 ktce in 2017, and the energy intensity per unit GDP is 0.15 tce/CNY. The integrated energy planning objectives for the MINCEDD were determined by taking NCEDD as a guide, planning based on the local population and GDP, integrating local energy resources and energy demand characteristics, and using the quantitative scenario analysis method [33]. The planning objectives are listed in Table 4.

4.2. The Planning Strategies

4.2.1. Reducing Energy Demand

The core of achieving the objective of near-zero carbon emissions is reducing energy consumption on the demand side and increasing the sources of the energy supply. Energy demands consist of building demand, industry demand, and traffic demand.
Building demand can be reduced by passive measures, which are as follows: (1) improving building envelope performance to reduce winter heating and summer cooling and (2) introducing natural ventilation to reduce the demand for cooling and heating during the transition seasons.
Industry demand can be reduced by industrial restructuring, which is achieved by restricting and gradually eliminating high-energy-demand industries (i.e., energy consumption per unit output value higher than 0.07 kgce/CNY) and introducing high output with low-energy-consumption industries (i.e., energy consumption per unit output value lower than 0.015 kgce/CNY).
Traffic demand is reduced by transportation energy transformation and by changing the travel mode, for instance, restricting cars with high emissions, encouraging public and green travel, etc.

4.2.2. Improving Energy Efficiency and Utilizing Waste Heat

  • Improving energy efficiency of building sector:
In buildings, energy consumption mainly takes place through lighting, sockets, air conditioning, power system, and special equipment.
In terms of lighting, a building’s energy consumption can be reduced by using LED lights, installing intelligent control, controlling the lighting by zones, etc.
The amount of energy consumed by a building in terms of air conditioning can be reduced by improving the energy efficiency of a system and equipment, such as heating/cooling units, boilers, pumps, fans, air handling units, etc.
The amount of energy that a building consumes in terms of its power system consists of the energy that is used by water pumps, elevators, etc. The energy efficiency measures for water pumps refers to the selection of high-efficiency and variable-frequency equipment. The energy efficiency measures for elevators are variable frequency, group controlling, etc.
Waste heat can be applied in the following ways. (1) Heat recovery on the air system side: Using a heat exchanger to recover the heat from exhaust air or fresh air so that the fresh air can be pre-heated or cooled and can reduce the energy for fresh air. (2) Units can recover condensation heat: The heat that is generated from cooling condensation water in the summer is recovered for domestic hot water heating to decrease the hot water heating energy, which has a significant energy-saving effect for buildings with a high demand for domestic hot water such as in-patient buildings and hotels. (3) Elevator energy feedback: The energy that is generated during elevator operation is given back to the power grid or to the micro power grid for reuse, which can save electricity consumption by about 30%.
2.
Improving energy efficiency of industry sector:
First, the energy efficiencies of general equipment, such as boilers, motors, transformers, and air compressors, should be improved.
Second, heat recovery and cascade utilization are the major approaches for reusing industrial waste heat. This means the recovered heat is used for industrial processes or for heating the areas in the building. Most equipment, such as prime motors, heating furnaces, air compressors, annealing furnaces, VOC handling units, boilers, etc., only consume small amounts of heating energy. Recovering the remaining industrial heating energy for centralized heating can save primary energy, improve economic benefit, and reduce pollution.

4.2.3. Utilizing Renewable Energy Adapted to Local Conditions

For urban areas, utilizing renewable energy that can be adapted to local conditions is the last guaranteed method through which near-zero carbon emissions can be achieved and is based on decreasing energy demand, improving energy efficiency, and using waste heat. This means providing zero-carbon emission energy supply, which is close to or is more than fossil fuel consumption.
Renewable energy consists of solar energy, wind energy, ocean energy, geothermal energy, etc. Distributed renewable energy is the best way to use renewable energy sources. This can be achieved, for example, by installing a solar photovoltaic system, wind turbines, etc., for buildings or in communities. High-percentage renewable power is consumed by cascade grid connection and energy storage to maintain the stability of the power grid.

4.3. The Planning Approaches

4.3.1. Demand Side

  • Building Sector
The point and surface combination method is used for building sector energy demand reduction. From the point of view of the retrofitting objectives, energy conservation measures can be proposed for existing buildings, and design and construction requirements of energy conservation are proposed for new buildings. Therefore, all of the buildings will be constructed by conforming to the national ultra-low energy or near-zero energy building standards.
All existing buildings in MINCEDD will be retrofitted with energy conservation measures by 2030. Standards of ultra-low energy building are required for new buildings so that all new buildings conform to the current national standard “Technical standard for nearly zero energy buildings” [34] by 2030. Buildings built during 2030–2050 conform to the claims for the near-zero energy building standards determined by the current national standard “Technical standard for nearly zero energy buildings” [34]. The specific building performance parameters are listed in Table 5.
In terms of surfaces, replicable projects for future community construction in accordance with “Pilot Work Plan for Future Community Construction in Zhejiang Province” are planned. The planning schemes for low-carbon communities are listed in Table 6.
After applying the above building energy conservation measures, the building energy demand forecasting results are listed in Table 7 and Table 8. Scenario 1 refers to the conventional scenario for 2030, i.e., energy increases under the current rate. Scenarios 2 and 3 refer to the near-zero carbon emission scenarios for 2030 and 2050, respectively.
2.
Traffic Sector
Green transportation and low-carbon travelling are recommended to reduce the amount of energy that is consumed by the traffic sector. In terms of “light-storage-charging” technology, there are seven power charging stations and five hydrogen refueling stations that are planned for green transportation. The vehicles will consume 100% of clean energy for public utilities, such as buses, taxi, and delivery vehicles, by 2030 and for private cars by 2050.
3.
Industry Sector
The industry energy conservation and low-carbon-emission objectives can be achieved by improving equipment efficiency and by integrating energy utilization and industrial restructuring. The introduction of industries with energy consumption per unit output below 0.20 tce/CNY into districts is encouraged. The evaluation and development recommendations for industrial structures are listed in Table 9.

4.3.2. Supply Side

In order to achieve the target proportion of renewable energy and renewable power, renewable energy is the major source of energy on the supply side. The scheme for the supply side focuses on photovoltaic and wind power generation and the full utilization of LNG cold energy and hydrogen energy. The renewable energy capacity is planned according to demand forecast results, consuming maximum renewable power, avoiding reverse power transmission, and decreasing peak–valley difference fluctuations. The layout of the energy scheme for the supply side is shown in Figure 9.
  • Solar Energy
To maximize the photovoltaic (PV) installation, it is suggested to make full use of a building’s roof, façade, and structure to design building-integrated photovoltaics (BIPV). The maximum area of factory roofs (≥60% of roof area) and available civil building roofs (≥20% of roof area) are utilized to install solar photovoltaic systems. The capacity of installed solar photovoltaic systems will increase to 600 MW by 2030 and will increase to 642 MW by 2050. The planning scheme for photovoltaic systems for different types of buildings is detailed in Table 10 and Table 11.
2.
Wind Energy
Distributed onshore wind power and offshore wind power will be developed first. Then, centralized onshore wind power will be installed during the period of 2030~2050. The distributed wind power will be installed near factories and warehouses and will be more than 300 m away from residential areas. Offshore wind power will be installed away from channels and in the areas near the seacoast that are not sheltered. In addition, the installation of onshore wind power generation facilities on the ridge, where the wind resources are superior, is suggested. The wind capacities for different planning periods are shown in Table 12.
3.
Hydrogen energy
It is recommended that hydrogen energy is obtained from industrial by-products and hydrogen electrolysis devices that are powered by surplus renewable power.
There are five hydrogen refueling stations with a capacity of 500 kg/d that are planned according to integrated energy supply stations for the traffic sector. Two of them will be built in the integrated stations by 2030 in order to satisfy the hydrogen demands of buses, delivery vehicles, and transportation vehicles. The other three hydrogen refueling stations will be built by 2050 in order to satisfy the increasing demand for the use of hydrogen in the traffic sector in the future. Furthermore, the main applications are the construction of hydrogen refueling stations, household hydrogen fuel cells, hydrogen fuel vehicles, and trucks. Hydrogen will be partially mixed with natural gas and will used for cooking and heating in buildings in the long term. The overall utilization plan for hydrogen energy is shown in Figure 10.
4.
LNG cold energy
There is currently an LNG receiving station with a capacity of 7 Mton in the MINCEDD. Cold energy can be released and utilized after the LNG is gasified.
A cold energy cascade utilization industrial area that includes air separation, CO2 liquefaction and dry ice manufacturing, medical refrigeration, and a data center is planned near the receiving station. Simultaneously, the natural gas that is produced after the gasification of LNG can be used for office buildings or small-scale commercial tri-generation system fuel cells in industrial parks and in surrounding areas. The layout proposed in the diagram of the industrial park is in Figure 11, and the LNG cold energy cascade utilization process is shown in Figure 12.

4.3.3. Grid Side

The port, industry, city, transportation, urban energy grid, green transport charging grid, and port microgrid will be planned, all of which compose the green energy grid that is required for energy dispatch.
  • Urban Energy Grid
In the MINCEDD, renewable energy mainly includes wind energy and solar energy. The scheme through which renewable energy will be connected to the grid is illustrated in Figure 13.
The voltage that is necessary for solar PV to connect is 0.4 kV. The voltage of the rest power is increased to 10 kV in order to continue consumption when the consuming ability under 0.4 kV is insufficient. Small and large amounts of wind power are preferentially connected to the 10 kV and 110 kV substations, respectively. This means that small and large amounts of wind power can be connected to the secondary side of the 220 kV substation, the secondary side of the 110 kV substation, and the 10 kV switching station, which is based on a different scale. PV facilities are widely distributed in the planning area and are suitable for connecting to the 0.4 kV voltage class, which is mainly intended for self-use.
2.
Green Transport Charging Grid
The charging infrastructures for electric vehicles (EV) and hydrogen energy vehicles are EV charging stations and hydrogen refueling stations, respectively, whose layouts constitute the green transport charging grid in Figure 14.
According to the principle of optimal land utilization and the use characteristics of EVs, it is suggested that charging stations should be built together with existing public service facilities. PV devices can be installed on the ceiling of the charging station to increase the renewable energy use.
A hydrogen refueling station will be built in the Li’ao area, which is located on the main roads and is in a location that is convenient for hydrogen vehicle users. Additionally, a hydrogen refueling station will be built in the port area during long-term planning.
3.
Port Microgrid
The concept of an onshore power supply is regarded as an effective solution to make ports free of greenhouse gas emissions, air pollutants, vibrations, and noise pollution.
The Meishan port is located in the southeast of the zero carbon emission demonstration area. The port has 10 berths. Shore power facilities will be built successively for each berth and will be able to output 50 Hz and 60 Hz alternating currents (AC) with a voltage class of 6.6 kV.
An AC/DC hybrid microgrid will be built in the port area for shore-to-ship power, which can improve the utilization of renewable energy distributed in the port area. The microgrid is shown in Figure 15.
In addition, hydrogen energy applications will be explored in transport ships and in logistics vehicles.

4.3.4. Storage Side

According to different types of energy and demands in near-zero carbon emission demonstration districts, multiple energy storage facilities are planned, which will consist of electrical energy storage (EES), thermal energy storage (TES), hydrogen storage, and compressed air energy storage (CAES) facilities. EES and TES can handle energy balances from the supply and demand sides in time series. Hydrogen storage and CAES facilities are oriented to the actual needs of industrial production.
  • Electrical Energy Storage
EES can transform electrical energy from power grids into a storable form and can ensure that it can be converted back into electrical energy if needed.
In the MINCEDD, there is no suitable terrain to construct pumped hydro storage facilities. Therefore, battery energy storage is widely utilized in this plan. There are three major ways to apply battery energy storage, which are as follows:
PV with small-scale battery energy storage
In order to maximize solar energy use and reduce the peak–valley difference, residential, commercial, and industrial users should be encouraged to install PV with small-scale battery energy storage for self-use with the 0.4 kV access voltage class. A battery storage device operating from 0.1 kWh to 0.2 kWh can be allocated for each kilowatt PV device. Users will be able to obtain a one-time subsidy for battery energy storage devices.
Medium-scale power storage facilities on the user side
Users with a large peak–valley difference, such as those in offices and commercial buildings, should be encouraged to install medium-scale power storage facilities on the user side, and these users will receive one-time subsidy for the installation of these power storage facilities and discounted electricity prices.
Large-scale centralized power storage facilities
Around the substation, centralized power storage facilities will be built to reduce load fluctuation and to improve the stability of the power distribution grid.
2.
Thermal Energy Storage
TES refers to the temporary storage of thermal energy and is able to increase the utilization of thermal energy equipment. For the cold energy demand in industrial areas, cold energy storage facilities will be built to store cold energy during the valley–load period and will release it during the peak–load period, which can restrain the fluctuation that take place during load cooling and will allow industrial and residential demand to be met.
3.
Hydrogen Storage
Hydrogen can be stored directly for use in fuel cells or can be transported to users. In the planned district, hydrogen storage facilities will be built for fuel cell vehicles and residential functions.
4.
Compressed Air Energy Storage
In CAES systems, a compressor driven by off-peak or low-cost electricity is used to store energy by compressing air into an air reservoir. Since the self-discharge that is generated by CAES is very low, it can act as a long-term storage device. In addition, the investment cost for CAES is obviously low. In the industrial area, CAES facilities will be planned and constructed for the automobile production industry.
5.
The Layout of Energy Storage Facilities
Based on land-use load types, the layout of energy storage facilities is planned as depicted in Figure 16.
According to the load forecast and the capacity of renewable energy sources that will be installed for the planning year (2030), the total capacity of the energy storage facilities will need to be about 300 MWh (electricity) in order to maximize the renewable energy power generation consumption, avoid the generation of renewable energy power generation, and reduce the fluctuations in the peak–valley differences. The capacities of the different storage types are listed in Table 13.

4.4. The Planning Safeguard Measures

The MINCEDD planning scheme was proposed for the planning period from 2020 to 2050. The planning safeguard measures are under development by local governemnts and organizations currently. However, in order to achieve the planned scheme, safeguard measures in terms of technical measures and policies and subsidies are proposed in this article. Additionally, it is suggested that the local governemnts and organizations should make safeguard measures based on these measures.

4.4.1. Technical Measures

An integrated energy management platform is planned to be constructed to provide technical support for the realization of the planning scheme. As a district integrated energy service provider, it is considered to build a comprehensive energy monitoring and management platform based on 5G mobile internet. This platform is used as the hardware foundation, which can be combined with big data analysis to promote the implementation of energy conservation management and user behavior for energy conservation in the MINCEDD.
The platform is connected to the users to collect energy demand data and to the district energy supply system to collect the energy supply data from renewable energy systems, gas distributed energy supply systems, waste heat utilization systems, and energy storage systems. Hence, the comprehensive management and dispatch of energy demand and supply can be achieved through the platform. There are four modules for the operation of the platform, which are listed in Table 14.

4.4.2. Policies and Subsidies

The energy planning indexes that consist of renewable and clean energy capacity, energy conservation parameters for building, industrial and traffic sectors, grid capacity, and storage capacity can be included into land grant clauses during land bidding. After that, the indexes are committed to be implemented by developers or constructors during the construction period, whereby the planning indexes can be achieved.
Apart from the land grant clauses, policies and subsidies are formulated to ensure that the planning approaches are carried out (see Table 15).

5. Planning Evaluation

5.1. Indexes Analysis

5.1.1. Proportion of Renewable Energy to Primary Energy

The authors of [32] propose that the proportion of non-fossil-fuel-based energy consumption increase to 20% by 2020. The current shares of renewable energy sources are 39.3 MW for solar PV, 94.5 MW for onshore wind power, and 32 MW for biomass. During the planning period, the capacities of solar PV and wind power will be increased to 642 MW and 788 MW by 2050. However, the biomass capacity will be kept the same due to the selected location and garbage odor concerns in that area. The total amount of renewable energy that will be used by 2030 is 460 ktce and 890 ktce by 2050. The authors of [32] estimate that the primary energy consumption will be 625 ktce by 2030 and 650 ktce by 2050. Therefore, the proportions of renewable energy to total primary energy will be 73% by 2030 and 108% by 2050, which are slightly higher than the planning objectives. Table 16 displays the current and planned renewable energy conditions.

5.1.2. Proportion of Renewable Power to Total Power Consumption

Renewable power can be calculated by multiplying the installed capacity by the amount of power generated per unit capacity that is estimated according to past applications. In 2017, the total amounts of renewable power being consumed were 39.3 MW for solar PV, 94.5 MW for wind power, and 32 MW for biomass. The total amount of existing and planned renewable energy used by 2050 is 600 MW for solar PV, 419 MW for wind power, and 32 MW for biomass, with 1883 GWh of electricity being generated by 2030. The installed capacity of solar PV, wind power, and biomass is expected to be 642 MW, 788 MW, and 32 MW, respectively, by 2050. This can generate 2873 GWh of electricity by 2050. Furthermore, the MINCEDD is expected to consume 1928 GWh and 2581 GWh of power by 2030 and 2050, respectively. Hence, the RP/PC of the MINCEDD is expected to be 98% by 2030 and 111% by 2050. This means that the renewable power generated by 2030 can cover almost all of the electricity consumption in the district. Moreover, as the installed capacity of the renewable power is expected to increase and the electricity consumption is expected to decrease by 2050, the amount of renewable power that is generated will be greater than the electricity consumed. Therefore, the index of RP/RC is over 100%. The surplus of renewable power can be supplied to the national power grid for users outside the MINCEDD. Renewable energy generation is listed in Table 17.

5.1.3. CO2 Emission Reduction

The 13th Five-Year National Energy Plan and the 13th Five-Year Plan for Low Carbon Development in the Zhejiang province indicated that CO2 emissions will be reduced by 18% by 2020 compared to 2015 [35]. The reductions in CO2 emissions can be divided into supply side reductions and demand side reductions. Supply side reductions are caused by the application of renewable energy, hydrogen energy, LNG cascade utilization, and geothermal energy, and demand side reductions are caused by industrial waste energy and distributed energy station applications.
Compared to the current conditions, CO2 emissions on the supply side are expected to be reduced by 0.46 Mton and 0.77 Mton by 2030 and 2050, respectively. Additionally, on the demand side, reductions of 0.32 Mton by 2030 and 0.44 Mton by 2050 are expected. The authors of [32] estimated that CO2 emissions from the MINCEDD will be 1.08 Mton by 2030 and 1.20 Mton by 2050, both of which are under the benchmark scenario in which the district is developed without CO2 reduction measures. The total CO2 reduction rate is expected to approach 70% and 100%, respectively, by 2030 and 2050. This indicates that the CO2 emissions in the MINCEDD are expected to be nearly zero by 2050, leading to the MINCEDD being in a near-zero carbon district. The CO2 reductions for the supply side and demand side are listed in Table 18.

5.2. Indexes Comparison

The MINCEDD indexes are compared to the similar indexes of the international project and other districts outside of Zhejiang. The results show that the MINCEDD indexes are all more advanced than other indexes.

5.2.1. Indexes Comparison with the International Project

The “Ningbo Meishan Near-Zero Carbon Emission Demonstration Zone Construction Planning and International Cooperation Research Project Technical Report” [32] is a preliminary international project that details the energy planning scheme for the MINCEDD. The MINCEDD energy plan that is introduced in this paper is developed based on the four aspects of the demand side, supply side, grid side, and storage side. The results show that the RE/PE is expected to reach 73% and that the RP/PC is expected to reach 98% by 2030. The MINCEDD indexes are more advanced than those determined in the international project (see Table 19).

5.2.2. Indexes Comparison with Demonstration Districts outside Zhejiang

The MINCEDD was one of the five demonstration project plans for China State Grid in 2019, and the remaining four demonstration projects are the Beidaihe Integrated Energy Demonstration District (IEDD), the Zhengding IEDD, the Lankao IEDD, and the Guzhenkou IEDD [36].
The RE/PE for the Beiudaihe IEDD was 20% for 2020 and is 20% for the Zhending IEDD by 2030. In addition, the CO2 emission reduction rate is expected to reach 15% by 2030. The RE/PE and the RP/PC for the Lankao IEDD were greater than 60% and 90%, respectively, in 2021. There is no specific energy-related index that has been identified for the Guzhenkou IEDD because the energy plan is focused on an intelligent power grid.
Compared to the indexes above, the indexes of RE/PE and RP/PC of the MINCEDD are higher than that of both the Beidaihe IEDD and Zhending IEDD. The RP/PC of the MINCEDD is expected to be at relatively the same level as that of the Lankao IEDD by 2030. In summary, the indexes of the MINCEDD are relatively more advanced than those of other demonstration districts outside of Zhejiang. The detailed indexes are listed in Table 20.

6. Conclusions and Recommendations

Energy consumption in developed urban areas is relatively high. Moreover, the renewable energy and carbon sequestration resources in these areas are limited. Integrated energy planning methods and schemes for NCEDDs in urban areas have been proposed in this paper to provide a reference for urban energy planning with near-zero carbon emission objectives.
A three-step planning method was proposed for the integrated energy planning of NCEDDs in urban areas that allows objectives to be determined, planning strategies to be established, and planning approaches to be proposed. Planning strategies include reducing energy demand; improving the energy efficiency of building, industry, and traffic sectors; and utilizing renewable energy sources that have been adapted to local conditions. Approaches are proposed according to these strategies, which encompass reducing energy demand and increasing renewable energy applications on the demand side and supply side, respectively, as well as improving energy interconnection and peak–valley differences in power levels.
The integrated energy planning for the MINCEDD was investigated as a case study to explain the planning method and scheme. The CO2 emission reduction objectives in the MINCEDD are 0.75 Mton and 1.1 Mton by 2030 and 2050, respectively. The planned results show that annual CO2 emissions will be reduced by 0.78 Mton by 2030 and 1.21 Mton by 2050 through the implementation of approaches that are related to the supply, demand, grid, and storage points of view. Furthermore, the CO2 emission rates are expected to approach 70% and 100% by 2030 and 2050, respectively. Compared to the other districts with an integrated energy planning scheme, the renewable energy utilization and CO2 emission reduction performances are relatively advanced in the MINCEDD.
In addition to the approaches proposed in this case study, other innovative measures can be implemented according to local conditions of the planned district. For example, energy buses (Ebus) (i.e., fifth-generation district energy network) are recommended for future integrated energy planning in urban areas, which provides opportunities for sharing heating and cooling energy under ultra-low temperature conditions compared to those of fourth-generation energy systems. Moreover, these measures can improve system efficiency by capturing low-grade heat sources and waste heat, which is an advanced heat recovery and energy synergy method that can be implemented in various building types [40].
Moreover, this method is only being used a few cases at present, and its feasibility needs to be verified and improved through continuous use. Therefore, this method should be used reasonably according to the characteristics of the project and should not be copied completely when planning demonstration districts. Although this method can ensure the rationality of the energy plan to a certain extent, it cannot guarantee the implementation of these plans. Therefore, when planning a demonstration district, it is necessary to clarify the implementation factors of the planned energy schemes, including the scenarios, location, stages, capacities, energy efficiencies, etc., of the applications of energy systems. In addition, it is necessary to implement safeguard measures to ensure the implementation of the plan. The safeguard measures can be policy requirements; financial subsidy support, the establishment of management platforms, publicity and guidance; the development of integrated energy service operation models; innovative energy business models; etc. Apart from the technical measures, the three-step planning method and the integrated energy planning scheme should be carried out with policies and incentives issued by the government and organizations to ensure its implementation. Future research into the implementation of this three-step planning method for other NCEDD should be conducted to demonstrate the rationality, feasibility, and limitations of this conducted research. It is suggested that this NCEDD planning case study be used as a reference in future projects.

Author Contributions

Writing—original draft preparation, X.X., Y.W., Y.Z. and H.J.; writing—review and editing, X.X.; supervision, Y.R. and J.W.; project administration, Y.R. and K.G. All authors have read and agreed to the published version of the manuscript.

Funding

This research was funded by National Natural Science Foundation of China (No. 51978482).

Data Availability Statement

Not applicable.

Conflicts of Interest

The authors declare no conflict of interest.

Nomenclature

NCEDD   near-zero carbon emission demonstration district
GHGsgreenhouse gas emissions
CCScarbon capture and storage
LNGliquefied natural gas
CFDcomputational fluid dynamics
GDPgross domestic product
LEDlight emitting diode
VOCvolatile organic compounds
EERenergy efficiency ratio
COPcoefficient of performance
IPLV(C)integrated part load value (cooling)
Dnominal evaporation of boiler, t/h
Qnominal heating output of boiler, MW
PVphotovoltaics
BIPVbuilding integrated photovoltaics
EVelectric vehicle
ACalternating current
EESelectrical energy storage
TESthermal energy storage
CAEScompressed air energy storage
Tceton of standard coal equivalent
kgcekilogram of standard coal equivalent
CNYChinese Yuan

References

  1. United Nations. The Paris Agreement. 2015. Available online: https://www.un.org/ga/search/view_doc.asp?symbol=FCCC/CP/2015/L.9/Rev.1 (accessed on 21 January 2021).
  2. Zheng, J. Analysis on the Impact of EU Green New Deal and Green Agreement. Environ. Sustain. Dev. 2020, 2, 40–42. [Google Scholar]
  3. Tang, Y.; Chen, W. The Impact of Biden’s Climate and Energy Policy Proposition on China and its Suggestions and Countermeasures. World Sci.-Tech. R&D 2021, 43, 605–615. [Google Scholar]
  4. Li, H.; Cui, G. Main Points and Enlightenment of Japan’s Green Growth Strategy. China Electr. Equip. Ind. 2021, 6, 52–55. [Google Scholar]
  5. Xi, J. Speech at the General Debate of the 75th United Nations General Assembly. China Daily, 24 September 2020. Available online: http://www.chinadaily.com.cn/a/202009/24/WS5f6c08aca31024ad0ba7b776.html (accessed on 21 January 2021).
  6. China CCTV. The Central Committee of the Communist Party of China and the State Council issued the “Opinions on the Complete, Accurate and Comprehensive Implementation of the New Development Concept to Achieve Carbon Peak and Carbon Neutrality”. Shanghai Energy Conserv. 2021, 10, 1054. [Google Scholar]
  7. Wang, Z.; Xue, L. The Release of “Carbon Peak Action Plan by 2030”. Resour. Guide 2021, 11, 7. [Google Scholar]
  8. He, C.; Jiang, K.; Chen, S.; Jiang, W.; Liu, J. Zero CO2 Emissions for an Ultra-Large City by 2050: Case Study for Beijing. Curr. Opin. Environ. Sustain. 2019, 36, 141–155. [Google Scholar] [CrossRef]
  9. IPCC. Special Report on Global Warming of 1.5 °C; Cambridge University Press: Cambridge, UK, 2018. [Google Scholar]
  10. Deng, X.; Xie, J.; Teng, F. What is Carbon Neutrality. Clim. Chang. Res. 2021, 1, 107–113. [Google Scholar]
  11. Cai, B.; Li, W.; Dhakal, S.; Wang, J. Source Data Supported High Resolution Carbon Emissions Inventory for Urban Areas of the Beijing-Tianjin-Hebei Region: Spatial Patterns, Decomposition and Policy Implications. J. Environ. Manag. 2017, 206, 786–799. [Google Scholar] [CrossRef]
  12. Li, Y.; Sun, L.; Zhuang, G. Analysis on the Connotation and Construction Path of Near-Zero Carbon Emission Demonstration Zone. Bus. Econ. 2017, 36, 21–25. [Google Scholar]
  13. Liu, C. China Demonstration Project Construction Path and Supporting Measures in Near-zero Carbon Emission Zone. China Econ. Trade Guide 2017, 36, 58–60. [Google Scholar]
  14. Long, W. Demand-Side Urban Energy Planning. HV&AC 2015, 45, 60–66. [Google Scholar]
  15. Long, W.; Liu, K. Some Key Points in Urban Demand Side Energy Planning. HV&AC 2017, 47, 2–9. [Google Scholar]
  16. Long, W. Demand Side Energy Planning of Green Industry Park. Shanghai Energy Conserv. 2016, 10, 533–539. [Google Scholar]
  17. Long, W. Demand-Side Energy Planning Complied with Supply Side Structural Reform-Preface of Book “Demand-Side Community Energy Planning and Energy Micro-Net Technologies”. HV&AC 2016, 46, 135–138. [Google Scholar]
  18. Jelić, M.; Batić, M.; Tomašević, N. Demand-Side Flexibility Impact on Prosumer Energy System Planning. Energies 2021, 14, 7076. [Google Scholar] [CrossRef]
  19. Wang, J.; Zeng, P.; Liu, J.; Li, Y. Coordinated Planning of Multi-Energy Systems Considering Demand Side Response. In Energy Reports, Proceedings of the 2020 7th International Conference on Power and Energy Systems Engineering (CPESE 2020), Fukuoka, Japan, 26–29 September 2020; Elsevier: Fukuoka, Japan, 2020. [Google Scholar]
  20. Yu, H.; Huang, Z.; Pan, Y.; Chen, W.; Jing, R.; Li, Y.; Li, Y.; Lin, M.; Liu, H.; Liu, J.; et al. Guidelines for the Implementation of Urban Demand Side Energy Planning; China Construction Industry Press: Beijing, China, 2018; p. 375. Available online: http://ss.zhizhen.com/detail_38502727e7500f266958a49170b691e38c0b18b32cfbbeb31921b0a3ea25510134114c969f2eae5cea2a197fb58a956c1ecadaf343b123bdcbb66c56596b1631d3553196fe37f46855337573c23a06c5? (accessed on 28 November 2021).
  21. Khalilpour, K.R. The Transition from X% to 100% Renewable Future: Perspective and Prospective, Polygeneration with Polystorage for Chemical and Energy Hubs. Acad. Press 2019, 513–549. Available online: http://ss.zhizhen.com/detail_38502727e7500f265bcd780c2f14aa8e2db5e5bc5fdc4f821921b0a3ea255101c944b624736f9e85f6b33ab1fdc5048fccc22aa85d4f7f2889125aed905f86484f16e318dea09d1ddf7462043f5301cf? (accessed on 28 November 2021).
  22. Dobbelsteen, A.; Roggema, R.; Tillie, N.; Broersma, S.; Fremouw, M.; Martin, C.L. Urban Energy Transition; Elsevier: Amsterdam, The Netherlands. [CrossRef]
  23. Shenzhen Academy of Building Research (Shenzhen, China). Special Energy Plan for Ya’an Green Ecological City. 2013, unpublished report. Available online: http://www.upssz.net.cn/newsinfo_803_997.html (accessed on 28 November 2021).
  24. Cheng, L.; Zhang, J.; Huang, R.; Wang, C.; Tian, H. Case Analysis of Multi-Scenario Planning Based on Multi-Energy Complementation for Integrated Energy System. Electr. Power Autom. Equip. 2017, 37, 282–287. [Google Scholar]
  25. Tang, M.; Xu, Z. Taking the Energy Planning of the Central District of Lingui New District in Guilin as an Example Discuss the Main Route of Demand Side Energy Planning. In Proceedings of the 2017 Annual Conference of Shanghai Institute of Refrigeration, Shanghai, China, 18 December 2017; China Academic Journal Electronic Publishing House: Shanghai, China, 2017. [Google Scholar]
  26. Tianjin Architectural Design Institute (Tianjin, China). Energy Planning of Tianjin Health Industry Park University of Traditional Chinese Medicine. 2019, unpublished work.
  27. Zhejiang Zheneng Energy Service (Zhejiang, China); Tongji Architectural Design Group (Shanghai, China). Integrated Energy Planning for Xiangbao District in Ningbo. 2018, unpublished work.
  28. Renewable Energy Law of the People’s Republic of China. 2006. Available online: http://bfqk.5read.com/pdf/67/%E4%B8%AD%E5%9B%BD%E3%80%8A%E5%8F%AF%E5%86%8D%E7%94%9F%E8%83%BD%E6%BA%90%E6%B3%95%E3%80%8B%E8%BF%91%E6%97%A5%E5%87%BA%E5%8F%B0.pdf (accessed on 28 November 2021).
  29. Zhou, Z.; Wang, L.; Lin, A.; Zhang, M.; Niu, Z. Innovative Trend Analysis of Solar Radiation in China during 1962–2015. Renew. Energy 2017, 119, 675–689. [Google Scholar] [CrossRef]
  30. Zhang, Y.; Ren, J.; Pu, Y.; Wang, P. Solar Energy Potential Assessment: A Framework to Integrate Geographic, Technological, and Economic Indices for a Potential Analysis. Renew. Energy 2019, 149, 577–586. [Google Scholar] [CrossRef]
  31. Wang, Q.; Kwan, M.-P.; Fan, J.; Zhou, K.; Wang, Y.-F. A Study on the Spatial Distribution of the Renewable Energy Industries in China and Their Driving Factors. Renew. Energy 2019, 139, 161–175. [Google Scholar] [CrossRef]
  32. Rocky Mountain Institute; National Center for Climate Change Strategy Research and International Cooperation (Beijing, China). Construction Planning and International Cooperation Project Report of Ningbo Meishan Near-Zero Carbon Emission Demonstration Zone. 2019, unpublished work.
  33. Zhang, C.; Su, B.; Zhou, K.; Yang, S. Decomposition Analysis of China’s CO2 Emissions (2000–2016) and Scenario Analysis of Its Carbon Intensity Targets in 2020 and 2030. Sci. Total Environ. 2019, 668, 432–442. [Google Scholar] [CrossRef]
  34. China National Standardization Committee. Technical Standard for Nearly Zero Energy Buildings GB/T 51350-2019; China Construction Industry Press: Beijing, China, 2019. [Google Scholar]
  35. Development and Reform Commission of Zhejiang Province. The 13th Five-Year Plan for Low-Carbon Development in Zhejiang Province. 2016. Available online: http://www.zj.gov.cn/art/2016/5/20/art_1229540818_4666989.html (accessed on 28 November 2021).
  36. The General Office of the People’s Government of Zhejiang Province. Action Plan for Building a National Clean Energy Demonstration Province in Zhejiang Province (2018–2020). Available online: http://www.zj.gov.cn/art/2018/9/25/art_1229019365_61718.html (accessed on 28 November 2021).
  37. He, Z. The Start of Construction of Hebei Beidaihe Ubiquitous Power Internet of Things in Comprehensive Demonstration Park Project. National Grid News, 14 November 2019. [Google Scholar]
  38. Kang, W.; Wu, Y. Hebei Zhengding Builds County-Level Energy Internet Comprehensive Demonstration Zone. National Grid News, 8 August 2019. [Google Scholar]
  39. Wang, D. Preliminary Study on Henan Electric Power Lankao Energy Internet Comprehensive Demonstration Project. China Electric Power News, 11 November 2019. [Google Scholar]
  40. Revesz, A.; Jones, P.; Dunham, C.; Davies, G.; Marques, C.; Matabuena, R.; Scott, J.; Maidment, G. Developing Novel 5th Generation District Energy Networks. Energy 2020, 201, 117–389. [Google Scholar] [CrossRef]
Figure 1. The relationship among near-zero carbon emissions, low carbon emissions, and zero carbon emissions.
Energies 15 00874 g001
Figure 2. The three-step planning method process.
Energies 15 00874 g002
Figure 3. The MINCEDD planning area.
Energies 15 00874 g003
Figure 4. The planning areas.
Energies 15 00874 g004
Figure 5. Climate zone distribution of China.
Energies 15 00874 g005
Figure 6. Wind speed chart at different heights.
Energies 15 00874 g006
Figure 7. Geographical location of the LNG receiving station.
Energies 15 00874 g007
Figure 8. The composition of primary energy consumption.
Energies 15 00874 g008
Figure 9. Source-side energy plan layout.
Energies 15 00874 g009
Figure 10. The overall utilization plan for hydrogen energy.
Energies 15 00874 g010
Figure 11. Schematic diagram of LNG cold energy industry layout.
Energies 15 00874 g011
Figure 12. LNG cold energy cascade utilization flow chart.
Energies 15 00874 g012
Figure 13. The scheme through which renewable energy will be connected to the grid.
Energies 15 00874 g013
Figure 14. The layout of charging infrastructures.
Energies 15 00874 g014
Figure 15. The hybrid micro-grid in the port.
Energies 15 00874 g015
Figure 16. The layout of energy storage facilities.
Energies 15 00874 g016
Table 1. The limitations of recent research into district energy planning.
Planned DistrictYa’anA Northern DistrictGuilinTianjinXiaongbao
Absence of clear planning methodN/A
Absence of planning objectivesN/A
Absence of demand reducing schemes
Absence of quantitative analysis, layout, and application scenarios of energy schemesN/AN/A
Absence of renewable energy utilzation schemesN/AN/AN/AN/A
Absence of grid or storage schemesN/AN/A
“●” means the condition that is invloved in the district planning.
Table 2. The summary of major planning indexes.
IndexesObjectives of 2030Planning Results of 2030Objectives of 2050Planning Results of 2050
Proportion of renewable energy to primary energy (RE/PE)≥70%73%≥90%108%
Proportion of renewable power to total power consumption (RP/PC)≥90%98%100%111%
CO2 emission reduction (ton)≥750,000780,000≥1,100,0001,210,000
CO2 emission reduction rate--70%--100%
Table 3. Industrial by-product hydrogen in Ningbo area.
Company NameHydrogen Production
(ton/a)
Zhenhai Refinery144,000
Sinochem117,000
Zhenyang Chemical Industry8100
Siming Chemical7200
Beilun Area9400
Daxie Petrochemical53,000
Wanhua Chemical70,000
Wanhua Chlor-Alkali15,000
Donghua Energy20,000
Total443,700
Table 4. The planning objectives and index compliance.
IndexesObjectives of 2030Objectives of 2050
RE/PE≥70%≥90%
RP/PC≥90%100%
CO2 emission reduction (ton)≥750,000≥1,100,000
Table 5. Energy conservation measures for buildings.
Residential BuildingsPublic Buildings
Construction Year2030205020302050
Building Envelope Performance
Roof (W/m2·K)0.50.30.450.3
External Wall (W/m2·K)0.60.40.70.4
External Window (W/m2·K)1.81.41.81.4
Solar heat gain coefficient (Winter)≥0.40≥0.40≥0.40≥0.40
Solar heat gain coefficient (Summer)≤0.30≤0.30≤0.15≤0.15
Equipment Energy Efficiency
Unitary air conditioner (EER)4.04.54.04.5
Chiller (COP)6.06.256.06.25
Multi-connected split air conditioner (IPLV(C))5.06.05.06.0
Air-cooled heat pump (heating EER)2.02.32.02.3
Air-cooled heat pump (cooling EER)3.23.43.23.4
Gas boiler (D ≤ 2.0/Q ≤ 1.4)92%94%92%94%
Gas boiler (D > 2.0/Q > 1.4)94%96%94%96%
Pump 1Level 2Level 1Level 2Level 1
1 The pump energy efficiency is determined based on the related current national standard for pump.
Table 6. Low-carbon communities planning scheme.
Type of Community2020–20252026–20302031–20402041–2050
QuantityBuilding Area (m2)QuantityBuilding Area (m2)Building Area (m2)
Hydrogen community//3400,0007,000,000–9,000,000fully promoted
Direct current community3300,00010–121,000,000–1,500,000
All electric community3300,00010–121,000,000–1,500,000
Zero energy community5500,00010–151,000,000–2,000,000
Table 7. Annual power consumption per building area for Scenarios 1–3 (unit: kWh/m2).
ScenarioResidential BuildingShopping Mall + OfficeSchool
Scenario 13015070
Scenario 2217550
Scenario 3207447
Table 8. Annual power consumption for Scenarios 1–3 (unit: GWh).
ScenarioResidential BuildingShopping Mall + OfficeSchoolCurrent ConditionTotal
Scenario 1127686923191224
Scenario 28231861319780
Scenario 3130522953191066
Table 9. The evaluation and development recommendations of industrial structure.
ItemsECIOEC/OEvaluated PointsEvaluationDevelopment Recommendation
(%)(%)(kgce/CNY)ECOutputEC/OTotalEvaluationPDRE
Car manufacturer29.3052.400.020715291214100.00 Assembly orientated
General equipment9.9010.400.02590108919088.45
Rubber plastic5.303.300.0409538318184.24
Metalwork2.202.100.0309828718787.15 Reducing plating and casting manufacturing
Railways and traffic1.402.400.0209929119289.69
Buildings12.207.000.0458878017581.73 Developing prefabricated buildings and green and low-energy buildings
Other industries13.3013.500.03087148718787.29
Gas production18.907.200.0708177015873.63 Recovering cooling energy
Textile industry5.701.500.1109425214869.02 Energy consumption control and waste heat recovery
Paper making1.800.200.23098009845.89 Restriction of high-pollution and -demand industries
Total100.00100.00 9001007301730807.09
Peak29.3052.400.230995291214100.00
Abbreviation interpretation: EC—energy consumption; IO—industrial output; EC/O—energy consumption per unit output; P—prior; D—develop; R—restrict; E—eliminate.
Table 10. PV layout plans for different types of buildings by 2030 (40 MW in existence).
Building TypeRoof AreaRoof Usage RatePV AreaPV CapacityPower Generation
(m2)(%)(m2)(MW)(GWh)
Existing industry3,220,000601,930,0001,930,000193
Residential300,0002060,00060,0006
Commercial Office910,00020183,000183,00018
Industry4,070,000602,441,0002,441,000244
Education190,0002038,00038,0004
Warehouse2,260,000201,357,0001,357,000136
Total10,950,000/6,009,0006,009,000601
Table 11. PV layout plans for different types of buildings by 2050 (40 MW in existence).
Building TypeRoof AreaRoof Usage RatePV AreaPV CapacityPower Generation
(m2)(%)(m2)(MW)(GWh)
Existing industry3,217,000601,930,200193.0193
Residential332,0002066,5006.67
Commercial Office1,006,00020201,30020.120
Industry4,475,000602,684,800268.5268
Education207,0002041,3004.14
Warehouse2,487,000201,492,200149.2149
Total11,724,000--6,416,000641.5641
Table 12. The wind power capacity.
TypeTotal Capacity of 2030 (MW)Total Capacity of 2050 (MW)
Distributed wind power66131
Offshore wind power258337
Onshore wind power95 (current condition)320
Total419788
Table 13. The capacities of different storage types.
Storage TypesCapacity
PV + Small-scale
Battery Energy Storage
60 MWh
Medium-scale Power Storage80 MWh
Large-scale Centralized
Power Storage
20 MWh
Heat Storage30 MWh (heating)
Cold Storage60 MWh (cooling)
Hydrogen Storage2500 kg
CAES30 MWh
Table 14. The integrated energy management platform modules.
Module NameFunctions
User energy management moduleEnergy consumption analysis, energy efficiency evaluation, user power management
Energy supply management moduleEnergy index analysis, energy supply quality analysis, energy supply optimization analysis
Energy transaction management moduleEnergy trading management, invoice management, expense management
Special value-added service moduleUser energy saving consultation and benefit analysis, big data analysis
Table 15. The policies and subsidies for the planning scheme implementation.
Planning Approach CategoryPolicies and SubsidiesRelated Department
Solar PVSubsidies for distributed PVThe management committee of the MINCEDD
Wind powerSubsidies for distributed wind powerThe management committee, the development and reform committee, and the land and resources bureau of the MINCEDD
LNG energySubsidies and measures for the introduction of LNG energy utilization industriesThe development and reform committee of the MINCEDD
Hydrogen energySubsidies for hydrogen production from renewable energyThe development and reform committee of the MINCEDD
Building energy conservationSubsidies for ultra-low energy buildingsThe management committee of the MINCEDD
Low carbon communitiesSubsidies for the equipment of direct current low carbon communities, and hydrogen fuel cellsThe management committee, the development and reform committee, and the power grid companies of the MINCEDD
Industry energy conservationMeasures for the introduction of high-tech or low-carbon green industriesThe management committee, and the economic and information committee of the MINCEDD
Green trafficSubsidies for electric vehicle charging facilities; preferential electricity price for public charging facilitiesThe management committee, and power grid companies of the MINCEDD
Power distribution gridMeasures for renewable power accessing to power distribution gridThe development and reform committee, and the power grid companies of the MINCEDD
Smart green portSubsidies or preferential electricity price for the electricity of the portsThe management committee, the development and reform committee, and the port office of the MINCEDD
Table 16. Current and planned renewable energy conditions.
ProjectsCurrent Conditionby 2030by 2050
Installed Capacity (MW)Annual Energy Saving (ktce)Installed Capacity (MW)Annual Energy Saving (ktce)Installed Capacity (MW)Annual Energy Saving (ktce)
Solar PV39.310601146642156
Wind powerDistributed00663213163
Offshore00258171337222
Onshore94.56294.562319.5211
Biomass324832483248
Total165.812010524591462700
Table 17. Current and planned renewable energy generation.
ProjectsCurrent Conditionby 2030by 2050
Installed Capacity (MW)Annual Amount (GWh)Installed Capacity (MW)Annual Amount (GWh)Installed Capacity (MW)Annual Amount (GWh)
Solar PV39.339601600642640
Wind powerDistributed0066130131260
Offshore00258700337910
Onshore94.525594.5255319.5865
Biomass321983219832198
Total165.84921052188314622873
Table 18. The CO2 emission reductions of the source and demand side.
ProjectsCurrent Conditionby 2030by 2050
Installed Capacity (MW)Annual CO2 Reduction (ton)Installed Capacity (MW)Annual CO2 Reduction (ton)Installed Capacity (MW)Annual CO2 Reduction (ton)
Solar PV39.311,000601177,000642188,000
Wind powerDistributed//6638,00013177,000
Offshore//258206,000337268,000
Onshore94.575,00094.575,000319.5255,000
Biomass3258,0003258,0003258,000
Hydrogen energy//12.6 MW fuel cell + 2 hydrogen stations12,00030 MW fuel cell + 5 hydrogen stations27,000
LNG cascade utilization//800,000 ton LNG/yr41,000800,000 ton LNG/yr40,000
Geothermal energy//42.7560078.841100
Distributed energy stations sourced by natural gas//
  • fuel cell: 4.5 MW;
  • centrifugal cooling: 16,000 RT;
  • absorption cooling: 1000 RT;
  • boilers: 46 t/h
300
  • fuel cell: 4.5 MW;
  • centrifugal cooling: 16,000 RT;
  • absorption cooling: 1000 RT;
  • boilers: 46 t/h
300
Total source side reduction/145,000/608,000/915,000
Demand side reductionThe measures of building energy conservations, industrial waste heat utilization, etc. are implemented on the demand side. The demand side CO2 reduction is estimated as 320,000 ton by 2030 and 440,000 ton by 2050.
Total reduction/145,000/928,000/1,355,000
Table 19. Comparison of the MINCEDD indexes and the international project.
IndexMINCEDDThe International Project
2030205020302050
RE/PE73%108%71.4%93.8%
RP/PC98%111%90%100%
Table 20. The comparison of the MINCEDD indexes and those of other districts outside of Zhejiang.
DistrictMINCEDDBeidaihe IEDD [37]Zhengding IEDD [38]Lankao IEDD [39]
Year203020502020202020302021
RE/PE73%108%≥20%3%20%≥60%
RP/PC98%111%///≥90%
CO2 emission reduction rate70%100%/10%15%/
Publisher’s Note: MDPI stays neutral with regard to jurisdictional claims in published maps and institutional affiliations.

