Article

Ship-Based Carbon Capture and Storage: A Supply Chain Feasibility Study

1
Interfaculty Msc TIL, Delft University of Technology, 2628 CN Delft, The Netherlands
2
Faculty of Civil Engineering and Geosciences, Delft University of Technology, 2628 CN Delft, The Netherlands
3
Faculty of Mechanical, Maritime and Materials Engineering, Delft University of Technology, 2628 CD Delft, The Netherlands
4
Heerema Marine Contractors, 2332 AA Leiden, The Netherlands
*
Author to whom correspondence should be addressed.
Energies 2022, 15(3), 813; https://doi.org/10.3390/en15030813
Submission received: 8 December 2021 / Revised: 14 January 2022 / Accepted: 19 January 2022 / Published: 23 January 2022
(This article belongs to the Special Issue Energy Intensity of Transport and Environmentally Friendly Mobility)

Abstract

:
The International Maritime Organisation (IMO) calls for the maritime industry to restrict its CO2 emissions by −40% (IMO2030) and −70% (IMO2050). This paper answered the following research question: “Which technical, economic and emissions-related conditions predominantly determine the feasibility of a conceptual supply chain of liquid CO2 that is captured from the exhaust gases of LNG powered offshore vessels?” The captured CO2 is transported to land where it is utilized by a final customer. The study followed a systems engineering approach. Problem definition was followed by a requirements analysis (technology, emissions, economy and operations), design with scenarios and a case study with realistic vessel deployment, modeling and evaluation. All designs have technical uncertainties and financial risks, but the sale of captured CO2 could be a crucial advantage of the proposed concept over other concepts. The main conclusion is that emission and financial targets (payback time) can be met by aligning the offshore transportation distance with the capacity to store CO2 on board and the available means of transport to the final user. Specialists from the vessel owner indicate that capturing, storage and off-loading is likely to have minor implications for the vessel availability and regular operations.

1. Introduction

The energy transition from fossil fuels to renewable energy sources has a major impact on many industries worldwide. During this energy transition, the biggest shift can be seen in the form of sustainable solutions. The maritime industry, providing most of transport worldwide, is struggling to find feasible emission reduction options with a sizeable impact in the required time frame. Growth or decline of the total emission of CO2 by shipping is determined by many factors [1]. A few of them stand out: number of vessels, carbon intensity and vessel speed. The number of vessels worldwide is rising due to increasing demand for transport and globalization. This will increase the amount of fuel used in shipping, hence total emissions of CO2. This trend may be partially compensated by a higher fuel efficiency of newer ships and a lower vessel speed (slow steaming), if prevailing weather and sea conditions allow it [2]. The International Maritime Organization (IMO), a governing body for shipping with 174 member states, has made long-term economic and sector scenarios. According to these scenarios, more goods will be transported over the seas by more vessels. In a business-as-usual scenario this might lead to a steep growth in CO2 emission, up to 250% by 2050 [3]. To counter that trend, IMO has agreed on targets and obligations to limit greenhouse gas emissions from vessels. With regard to CO2 emissions, it has set emission reduction targets of at least −40% on a ’per transport work’ basis, as an average across international shipping by 2030, compared to the base year 2008 level. For 2050 this target rises to −70% [4].
In addition to the pressure by the IMO, a carbon tax is also looming [5], which means that the prevention of emissions into the atmosphere will have a higher priority in the affected industries. In some industrial applications (power plants/waste incineration plants) on land, emissions are prevented by capturing CO2 from the exhaust gases of industry [6].
Shipping is a technically complex mode of transport. It is much easier to electrify a truck then it is to electrify a large vessel. The long service life of an average vessel and the available supply conditions lead to a pledge for a transition scenario. This would have two effects. First, by using a cleaner burning fuel, air pollution targets can be achieved. Second, a transition scenario may help to bridge the period until more permanent solutions to decarbonize maritime transport are developed and introduced [7,8]. Among vessel owners, LNG is regarded as an interesting alternative to HFO [9]. This explains the use of LNG to power vessels in regular and special applications, such as offshore vessels. The need and ways of onboard capture of CO2 was discussed in [10,11,12]. If the product cannot be used onboard, offloading and transport to another location becomes necessary. Studies into suitable logistic concepts were done by [13,14]. One could even go further and include the end user in the analysis. Such a source-to-end user concept is missing in the literature.
Earlier research [15] into the feasibility of carbon capture technology on board ships compared diesel and LNG on three dimensions: technical feasibility, emissions and costs of capture. The authors estimated that carbon capture has the highest potential on board ships sailing on LNG because of lower costs. This study will add another criterion to the analysis: the limited impact on vessel operations. The main objective of the study is to analyze the feasibility of capturing the CO2 on board a large vessel that is used in highly specialized offshore operations. CO2 can be used in various applications on shore. It takes a logistic operation to link production and consumption, hence the supply chain of the captured CO2 needs to be mapped. It starts at the temporary storage units on board, followed by the drop-off as part of a planned port call by the particular vessel or by a gas carrier, and then the onshore transport to, and use by, a final customer.
The feasibility analysis allows ship owners and financiers to make informed decisions about the addition of the capture technology to existing or new ships.
The research aims to answer the following research question: “Which technical, economic and emissions-related conditions predominantly determine the feasibility of a conceptual supply chain of liquid CO2 that is captured from the exhaust gases of LNG powered offshore vessels?”.

2. Materials and Methods

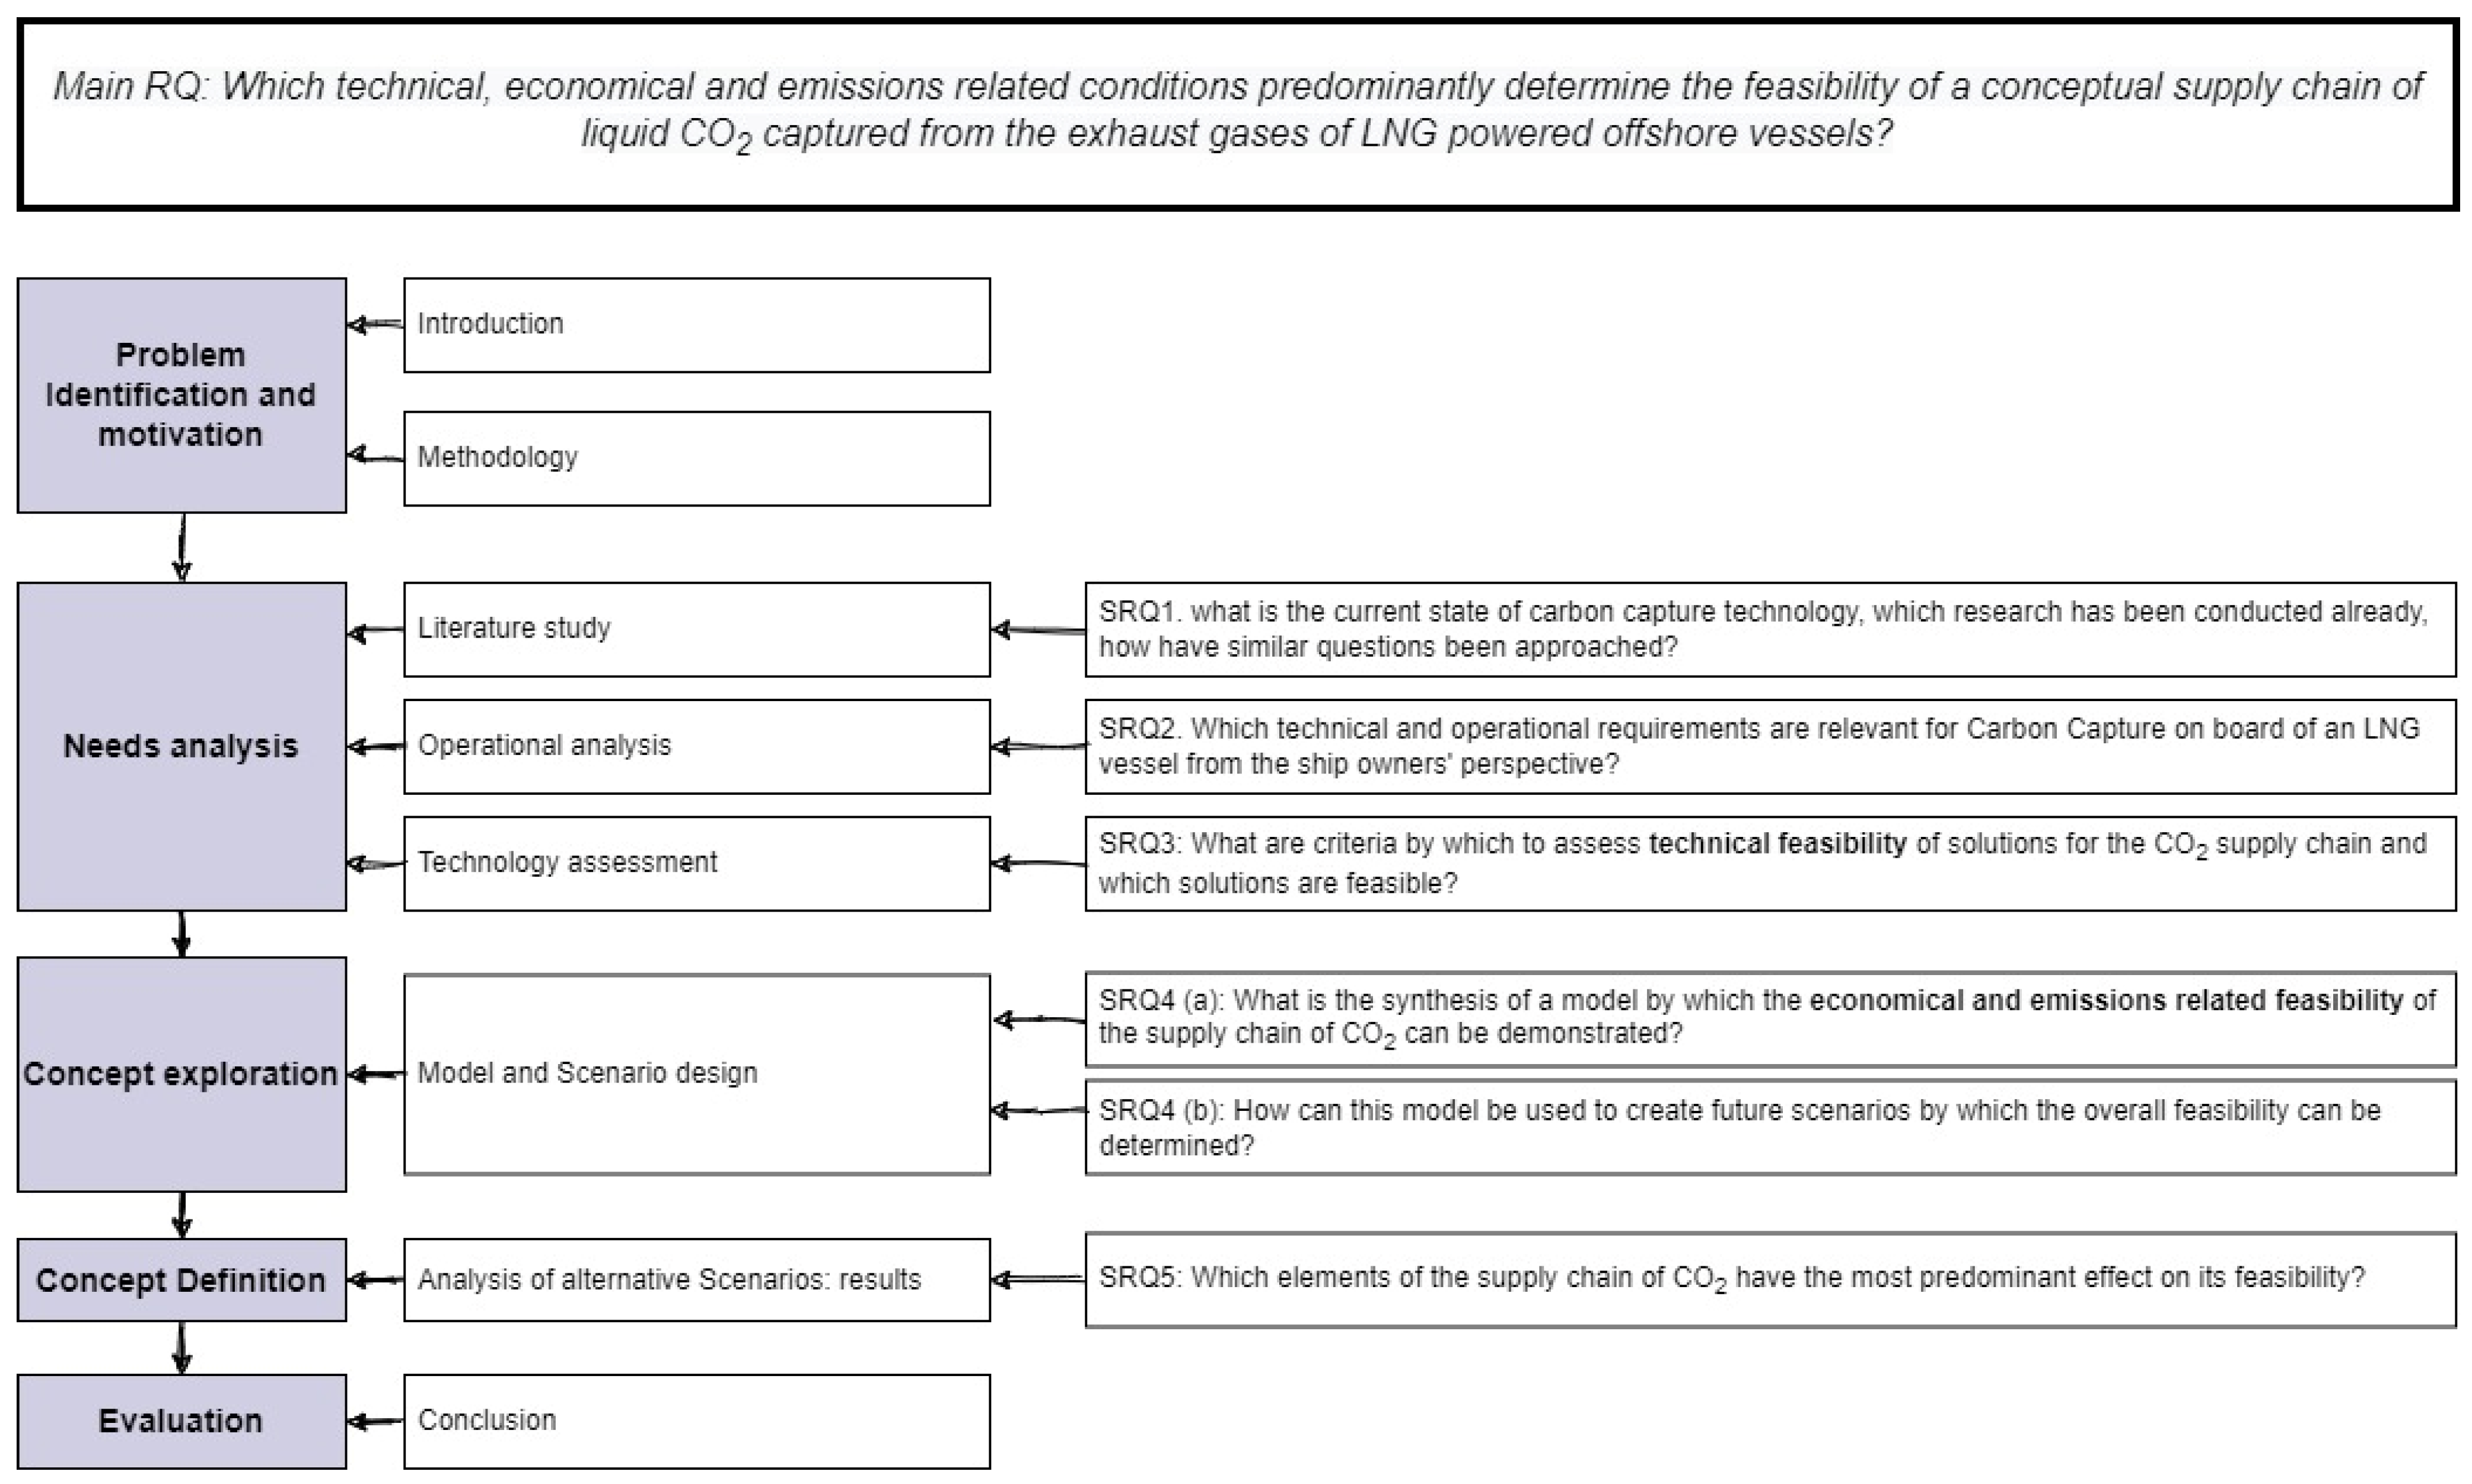
2.1. Research Framework

A suitable research framework was found in the systems engineering system life cycle model (see Figure 1). This model was chosen as a template for this study because it allows one to consider and compare all concepts with the appropriate detail in a consistent, structured and transparent way. It divides the study into three main parts [16]:
  • Requirements analysis: A systems engineering project usually starts with a translation of the customer needs statement into a set of requirements. These requirements are the basis for any design. They will also be used to evaluate the design(s). The requirements were derived from scientific and technical literature and many discussions with the ship owner/user and external experts.
  • Concept exploration (modeling): In this stage a model was developed that allows estimation of the emission reduction potential and (economic) impact of each concept on board the offshore vessel. Next, operations scenarios were built to estimate the volume of CO2 to be captured and stored. The way the vessel is deployed, the space needed and location of the technical systems are also important factors to determine if a concept is compatible with regular operations on board the vessel. This also affects how the transport to an onshore user would best be carried out.
  • Concept definition (case study): The most interesting concepts were analyzed in more detail to derive the key factors that are likely to affect the overall feasibility of the proposed carbon capture and supply chain concept. This part includes a first validation of the final concept(s). However, it is not a fully feasibile study because this would have meant that all elements of the concept(s) would have been tested at a realistic scale.

2.2. Requirements Analysis

The following areas seem most relevant in a sociotechnical study:
  • Technology: What are the requirements for and elements of a fully functioning CO2 capture and logistic concept for this vessel type? How much CO2 could be captured?
  • Emissions: Is the emission of CO2 during transport lower than the amount captured? Are the IMO2030 and IMO2050 emission reduction targets feasible?
  • Economics: What is the investment cost and payback time of the capture technology? What would be the impact of a CO2 tax?
  • Operations: What is an acceptable impact of the concept on vessel availability and regular operations? Can carbon capture be executed in conjunction with operations and activities, or does it require temporary stopping of work?

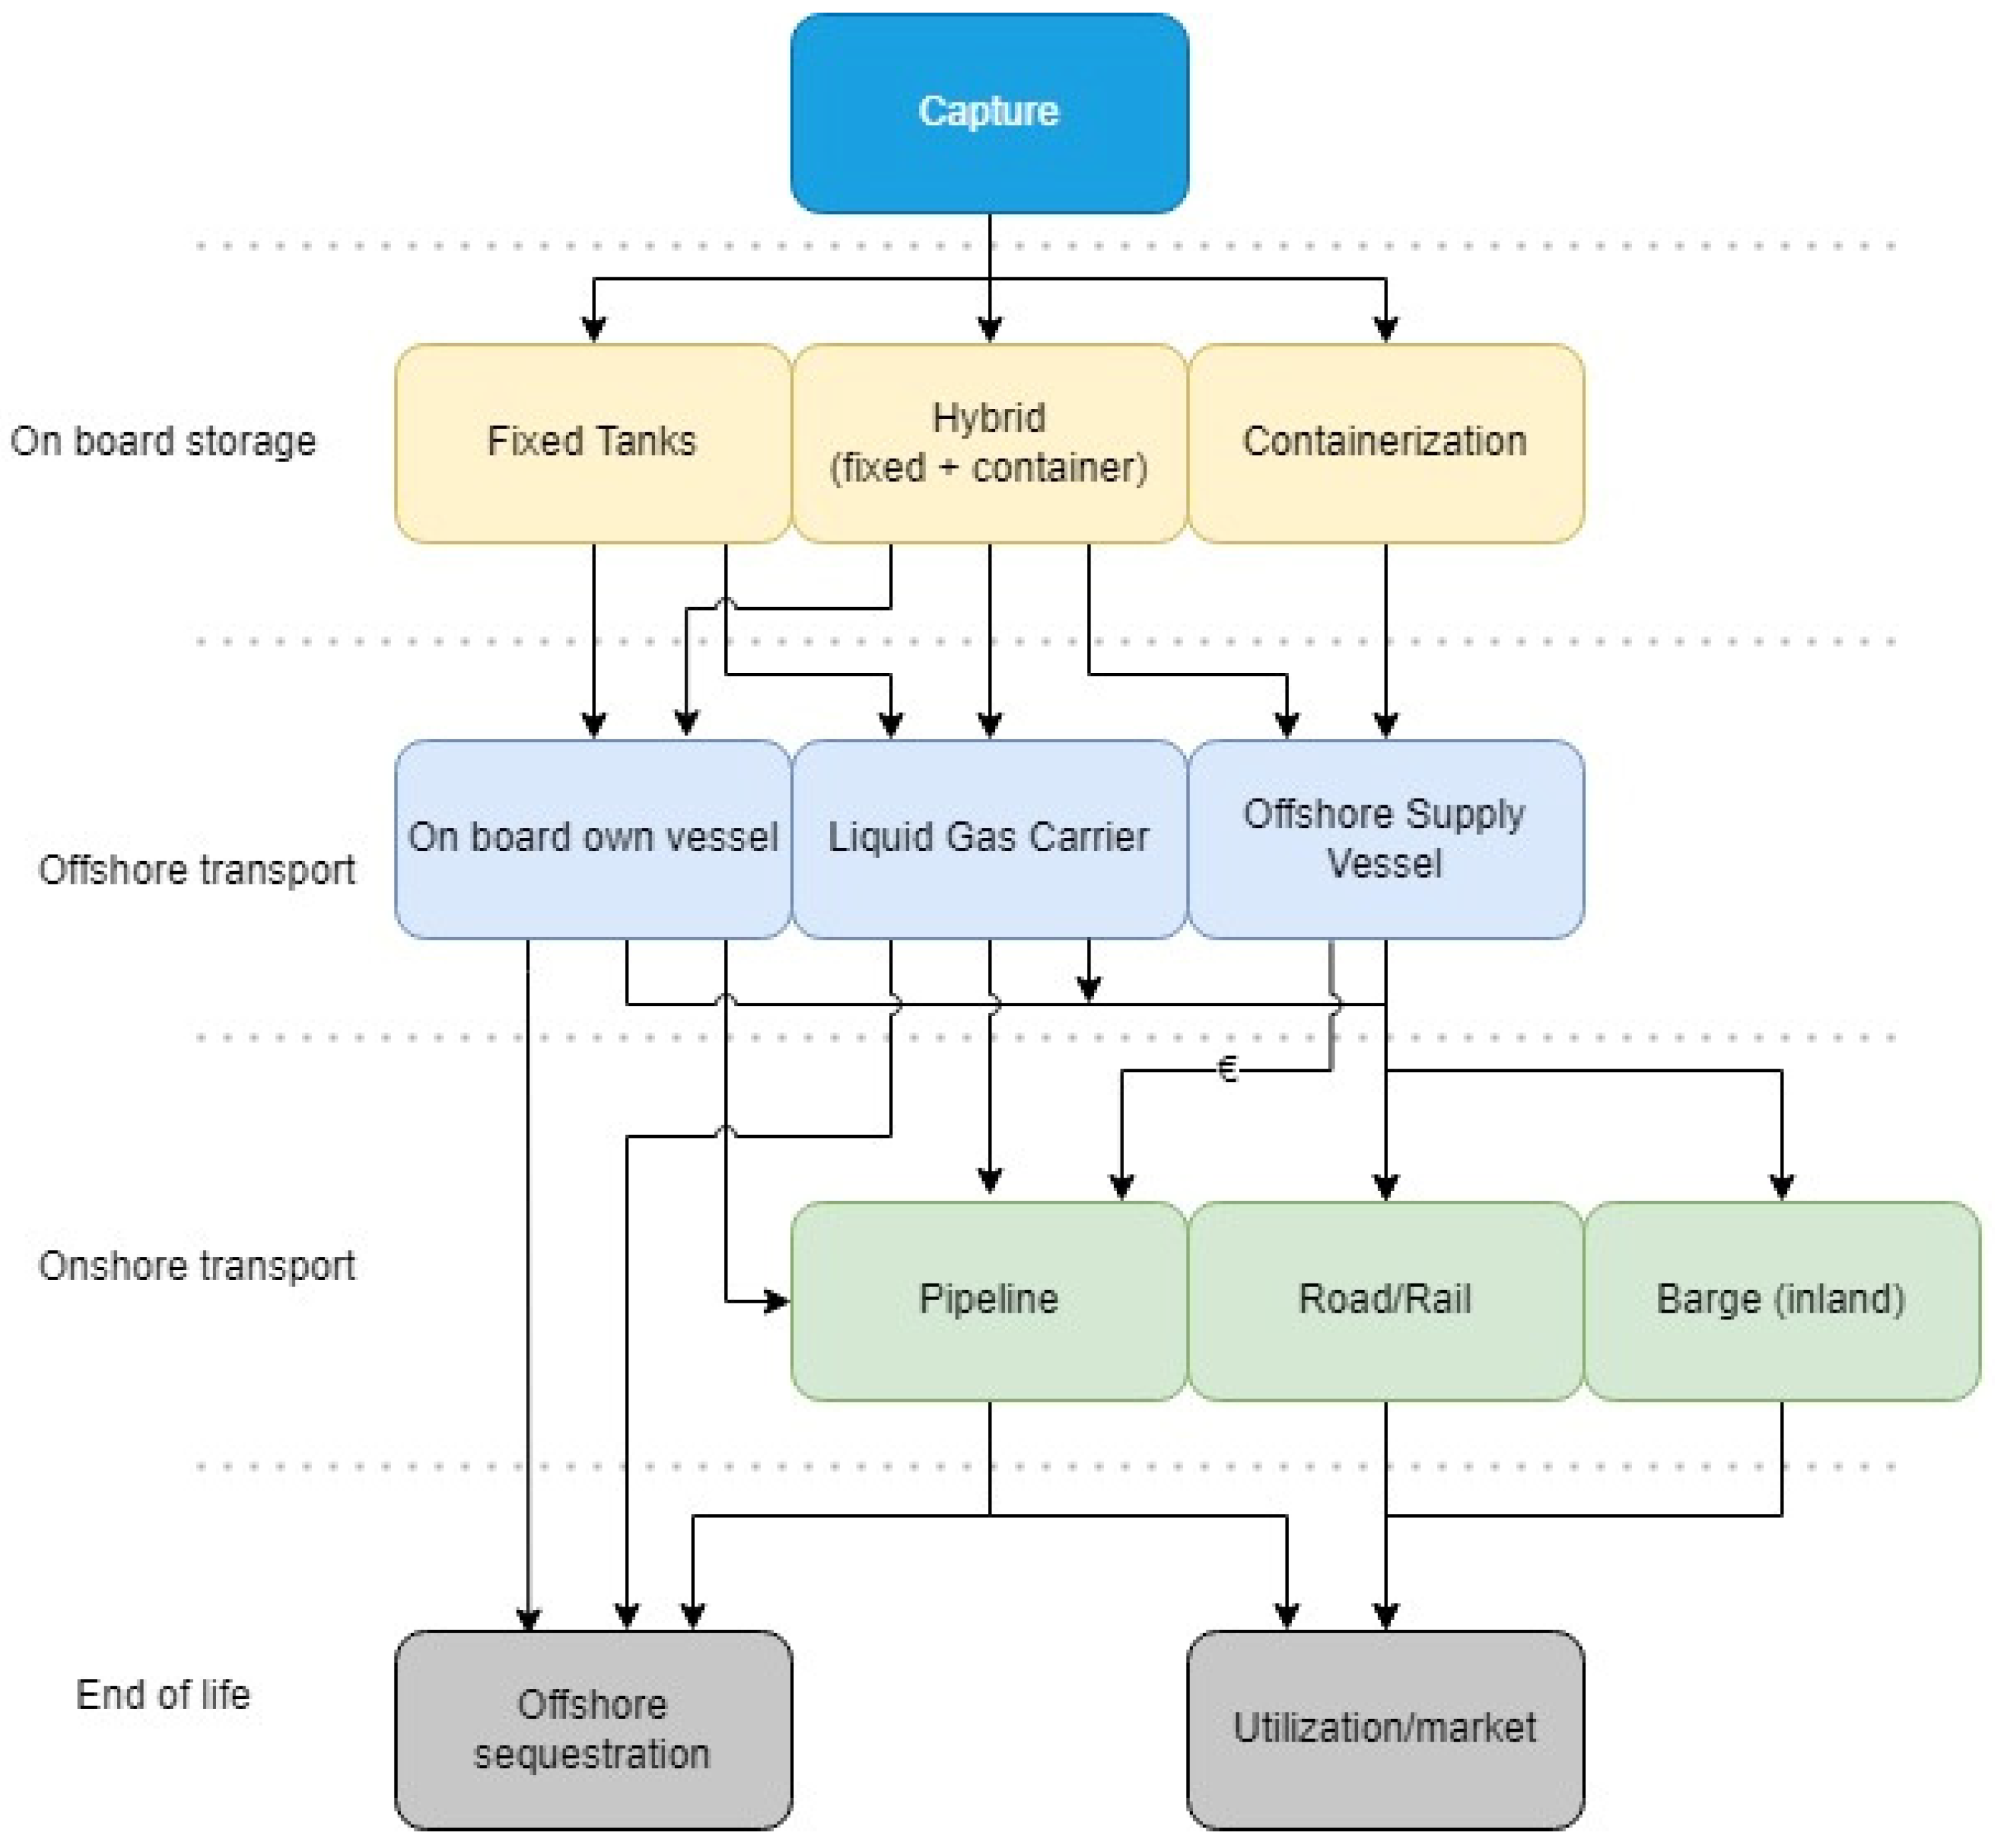
2.3. Technical Concept

A ship-based carbon capture concept can logically be divided into three main steps. First, capture, which is everything that happens on board the vessel (size and type of storage tanks on board). Second, transport, which includes offshore and onshore transport of liquid CO2. Offshore transport is especially relevant for vessels that rarely enter the port. Third, there is end-of-life or utilization of the CO2. Here, the product receives a sales price, which would allow partial recovery of the cost of the previous steps. Each concept should fulfill a set of requirements, namely (1) technology readiness level on a scale of 1–9 (TRL) [17], (2) safety, (3) compatibility with other parts of the supply chain, (4) scalability and (5) availability. Requirements 2 to 5 are rated on a scale of 1 (low), 2 (medium), 3 (high). Table 1 contains these requirements. It is part of a larger multi-criteria analysis.

2.3.1. Carbon Capture

The scientific research into the supply chain of carbon capture and storage is mainly focused on the technological development of the system itself, and in particular on the application of the system to capture CO2 emitted by fixed industrial applications on shore (e.g., coal-fired power stations or waste processing) [18,19]. Previous research [10] found that absorption technology is the carbon capture technology that best fits a maritime application and is most mature. The exhaust or flue gases are led through an absorption column containing a concentration of a solvent (for example ammonia). This solvent takes a large part of the CO2 out from the flue gas, after which clean exhaust gases leave the exhaust pipe. The amount of CO2 that can theoretically be captured depends on a number of design parameters and operational conditions, such as gas flow velocity, dimensions of the installation and variability in engine speed. The ratio of CO2 that is captured and CO2 that would be emitted without carbon capture is called “capture rate” [20]. A capture rate of 80% to 90% is realistically achievable for vessels [9]. The CO2 is then regenerated from the solvent at higher temperature. The solvent is returned to the absorption column, with which a closed system applies for the solvent. The CO2 is cooled and compressed to liquefy, after which it is stored on board.
Previous research [10] found that the system can best be integrated on board vessels that sail on Liquefied Natural Gas (LNG), because carbon capture then becomes an (energy-) efficient add-on to the technical systems already used to manage LNG on board the vessel. These vessels have large amounts of cold matter available (LNG is stored in liquid form at −162 °C). This cold matter can be used to cool and thereby liquefy the CO2. The heat from exhaust gases can also be used to regenerate the CO2 from the solvent. Optimal temperature management means that by operating the system the fuel consumption increases by 2–5%. This value was estimated and verified by experts from Conoship (NL). This smart application also limits the costs of the system [9], which are estimated at between €100 and €150 per tonne of CO2 captured [15]. This presents a benchmark for the sales price of the Liquid CO2 (LCO2).

2.3.2. On Board Storage

In Table 2, the quantities of CO2 produced can be observed. The amount of CO2 strongly depends on the capture rate and the operational profiles of the vessel. Assuming a capture rate of 80%, burning 1 m3 LNG will result in approximately 0.9 m3 liquid CO2 outflow [21].
The vessel, used as a use case, has a fuel (LNG) storage capacity of 8000 m3. The CO2 storage capacity installed on board the vessel limits the time it can sail in any operational mode. Once the storage is full, it needs to be emptied/unloaded. Three technical solutions seem feasible as a means to store the liquid CO2 on board. The first option is to use fixed tanks. The vessel owner then chooses a fixed storage volume. The second choice is to use containers. The CO2 will then be stored in twenty-foot tank containers. This solution provides more flexibility, since it can be predetermined how much CO2 will be captured. A disadvantage could be that it is more labor-intensive (e.g., connecting/disconnecting containers, re-allocating containers on the vessel), which collides with the criterion of ’minimal operational impact’. Finally, a combination of both gives a third, hybrid storage solution. In-depth technical information can be found in [14].

2.3.3. Transportation

When the storage on board is full, the captured CO2 should be unloaded. The way the vessel is utilized, and its sheer dimensions, make frequent port visits unfeasible. Hence, the best logistic solution would be to let a carrier vessel come alongside to unload the CO2. The amount of storage determines the interval at which to unload, and the type of storage determines the type of vessel that comes alongside. If they are fixed tanks, a CO2 carrier/tank vessel is required to take the LCO2 off the vessel. This can be the same type of vessel as used in LNG bunkering operations, it can be even the same vessel. However, due to the different physical properties and temperature requirements of LNG and LCO2, different tanks are needed for the storage and transport of LNG and LCO2. It is not feasible to use the same tank to fuel the vessel with LNG and afterwards fill it with LCO2, this would require full emptying and heating (from −162 °C to −50 or −20 °C). If the LCO2 is stored in containers, it is best to transport them via an offshore supply vessel (OSV). An offshore crane vessel as used in this research is visited on average once every three weeks by such a supply vessel, whereby the CO2 containers can be offloaded with a crane onto the OSV. The CO2 must also be transported on land, unless the end user is also located in the port area. If containers were used for storage, then the next step is transport by road, rail or inland waterway. If the CO2 is offloaded by a liquid gas carrier, then transport by pipeline does not demand additional treatment and its associated costs and production of CO2, as mentioned in [22], and therefore is considered most logical. If a buffer storage is used in port, the LCO2 could also be loaded into containers, but this is not considered in this research. The actual choice of land transport mode is also dependent on the transport volumes and the availability of a pipeline connection. The latter may be a future case in Rotterdam.

2.3.4. Utilization–End-Of-Life

When searching for end users, an endless row of applications is available. The LCO2 could be used directly. There are many applications for liquid CO2, some of which are already in use (for instance carbonation of soft drinks, medical applications, fire extinguishers, use in greenhouses), and some are still under development (including chemical conversion into energy carriers like synthetic fuels, or materials like cement or plastics) [23]. Using captured LCO2 would replace the current feedstock. In case this is made from a fossil fuel, using this captured LCO2 reduces their use and hence an amount of new CO2 released when selling captured LCO2 to the industry.
Another increasingly popular application is (temporary) storage. This involves pumping large amounts of LCO2 into an empty oil or gas field. Reservoirs of this kind have been used for some time for CO2 storage [24].
The global underground storage capacity is estimated to be between 5200 and 27,200 Gigatons [11]. To illustrate: a crane vessel annually produces about 50,000 tonne CO2, which equates to [0.000001%] of the total storage capacity. Permanent storage is not very economical. CCS is a highly expensive method [25], and hence recovering this cost is necessary. Permanent storage does not generate such revenue, in contrast to the utilization alternative. One revenue generating example of application of LCO2 is in Enhanced Oil Recovery (EOR), where CO2 is used to push oil out of hard-to-reach rock formations for extraction. This allows a sales price of €13–35/tonne CO2 [20].
Figure 2 shows how the various technical solutions for the supply chain of LCO2 are related and which are more or less compatible. The choice that most determines the technical composition of the chain is the first choice to be made by the vessel owner, namely the type of storage on board.

2.4. Emissions

In itself, each considered option discussed so far is technically feasible. However, there are also other considerations in this complex puzzle. A vessel owner must weigh their goods before the implementation of carbon capture. The decision strongly depends on the type of vessel. This will be shown by comparing two rather different vessel types. Type 1 is defined as a cargo vessel sailing regularly from port to port. The advantage of a type 1 vessel is its constant operational profile and a relatively easy-to-predict CO2 production per trip.
It can also (easily) offload the captured CO2 at the next opportunity (the next port). A drawback of such a vessel is that the space required for capture and storage takes up some valuable cargo space. Type 2 is defined as an offshore vessel, such as an offshore heavy lift crane vessel. This has a rather stochastic operational profile, whereby the required power can fluctuate strongly with short power peaks. The size of this vessel has the advantage that there is a lot of space on board for the capture installation and temporary storage on board. A drawback of this vessel is that it rarely enters ports, which means that either a supply vessel should be deployed to offload the gas or that the gas should be offloaded somewhere offshore. Type 2 therefore has a more complex supply chain than the type 1 vessel. Type 2 provides the case study. The study itself is a part of a larger collaboration that investigates the feasibility of vessel-based carbon capture on board a large offshore crane vessel that runs on LNG provides (DerisCO2). The owner of such a vessel has provided the researchers with the necessary technical and operational details. The engines of this vessel are already running on LNG, which means that there is experience with large-scale storage and handling of liquefied gas on board. The disadvantage is that it is a unique vessel, and the feasibility for this type of vessel does not necessarily apply to a type 1 vessel.
The relevant requirement can be stated as follows:
  • Emission minimization: The goal is to capture as much CO2 as is technically and operationally feasible. The CO2 emission during the transport of LCO2 must not neutralize the emission avoided by capturing.
This research is further on mainly focused on the offshore crane vessel. The reasons for this are as follows. First, the supply chain for this vessel is more complex, and therefore more relevant to map out. Second, this vessel will be used in further research into the integration of the system.

2.5. Economics

CO2 emission is generally seen as a waste, which should be avoided as much as possible. However, the shipping industry is a slow-moving industry when it comes to emission abatement. This can be explained by the long service life of an average vessel, complex enforcement of emission regulation and a large diversity of merchant ships [9]. In a highly competitive industry like shipping, costs are a key decision factor for company management. Hence, the aim is to realize the concept with the lowest impact on Capital Expenses (CAPEX) and Operational Expenses (OPEX) and also to recover the investment in the carbon capture installation in a short period of time. An investment payback period of 3–5 years was requested by the commissioner. Pollution does not occur in a concentrated way as it would do in for instance a (large) electric power plant. It originates at many isolated, self-moving ’small’ power plants with high capacities.
Capturing and transporting CO2 is in itself a costly exercise. As long as the cost of emissions is lower than the cost of investment and regulation allows, large-scale changes will not occur. There are however a few (policy) levers, which could be set to create the appropriate conditions:
  • CO2 tax: There is a tax on the emission of CO2 for some polluting industries in some countries [26]. Shipping has so far been excluded from initiatives such as the Paris Agreement [5], but has been on the table at COP26 [27]. In a scenario where a tax is levied on every tonne of CO2 a vessel emits, capturing this CO2 may have financial benefits for a vessel owner, as it saves on taxes payable.
  • Emission permits: Shipping could also become part of an emission trading system, like the European Emission Trading System (ETS). The captured CO2 could then be traded and priced properly.
  • Utilization revenue: A good example of a system where the costs of carbon capture can pay for itself is the OCAP (Organic CO2 for Assimilation by Plants) network in Rotterdam [22]. CO2 is captured from industrial processes in the port area and transported via pipelines to greenhouses in the Westland over a distance of ±30 km. Here the CO2 is sold for €50 to €100 per tonne to greenhouse owners, who use it to enrich plant growth.

2.6. Operations

A vessel owner’s business model requires the maximum use of a vessel. Onboard capture and storage may impact technical activities onboard a crane vessel. It may reduce the storage space for containers or other cargo in cargo vessels. It introduces the need to unload CO2 at sea for offshore vessels. The many considerations make compromises inevitable and the operational costs may differ per vessel type, size, sailing distance etc. This complex matter is only briefly touched in this study, as a consideration that may also affect overall feasibility.

3. Scenarios and Modeling

The model describes the relevant variables and their mathematical relationships. Scenarios are used to describe regular operations and the supply chain. Running the model allows estimation of emissions and costs. After this analysis it becomes apparent which factors have the most influence on both Key Performance Indicators (KPIs). This informs a ship owner if a specific concept is worth further investigation.

3.1. Model Scope

The model allows the running of operations scenarios. A single scenario consists of the three identified supply chain phases: capture, transport and utilization. There is an element of time in each scenario, so that the final costs and emissions can be expressed in euros and tonne CO2 per period (usually one year) and phase of the supply chain. The amount of fuel consumed during regular operations in a year determines the emitted CO2 by tonne. The model also estimates the CO2 emitted during an entire scenario. If the emission savings would meet the targets described in the introduction, then the ship owner could potentially achieve the IMO2030/2050 targets in that specific scenario. The model allows a modification of the conditions under which a scenario meets the requirements.
There are two main outputs of the model: costs and CO2-emissions. Their calculation is based on similar logic. First, both for cost and emissions, the total impact of these for a supply chain scenario is calculated and compared to the business as usual. To express this in formulas, it can be considered as follows:
Cost of capture + cost of transportation offshore + cost of transportation onshore + cost of utilization = cumulative cost
Cost business as usual − cumulative cost = avoided cost
Paybacktime = CAPEXinvestment year 0 Avoidedcost
This same logic applies to emissions. For emissions, the cumulative emissions are compared to the IMO2030/2050 targets. In Equation (1), the capture phase can be split up in several operational phases, such as work, transit, idle or in port. Also, in Equation (1), it must be noted that ‘cost of utilization’ is negative if the CO2 is sold at the end of the supply chain.

3.2. Data and Assumptions

Since the study is based on the use case of a single offshore heavy lift vessel, and conducted in collaboration with the company operating the vessel, the data is mainly based on this type 2 vessel. The company has given access to the operational details of the ship such as fuel consumption, emission data and operational details. Due to privacy, generalized numbers are used in this paper unless numbers are from external or public sources. Many of the values used in this study are assumed to be values based on realistic comparable situations. The reason for this is that the research largely covers a new technique that has not yet been applied. The reliability of the data is in line with the purpose of the study. A sensitivity analysis is used to discuss the realism of the assumptions. Table A1 and Table A2 in Appendix A provide an overview of the key figures that have been calculated using the model.

3.3. Model Verification and Validation

A set of systematic tests was carried out to verify the functioning of the model. These tests include outlier identification, sensitivity analyses and technical reliability and boundary condition tests.
The study was carried out in close contact with experts from TNO (the Netherlands Organisation for applied scientific research), CONOSHIP, a naval architecture bureau from the Netherlands, and experts from the field at Heerema. Several times during the research vital elements like the various technical alternatives, assumptions, choices and results have been discussed. These meetings as well as a substantial literature study were used to validate the model and its output.

3.4. Case Study

Especially with complex models it is common to start with a base scenario [14]. From there, a single parameter is iteratively changed to observe the effect on the results of that one parameter.

3.4.1. Base Scenario

Each scenario covers one year of regular vessel operations. During this period, the vessel will be working 50% of the time, have 30% of the time in transit, and 20% of the time in port or idle, with associated emission characteristics. To provide the company’s operational managers with choice and flexibility, a hybrid storage mode has been chosen for the base scenario. The vessel carries 550 m3 fixed tanks and 25 TEU tank containers, with a total of 1100 m3 in hybrid storage capacity. This gives the vessel a minimum operational time of 11 days before the tanks are full (the operational mode where most fuel is burned is during transit). The costs associated with capture have been estimated at €100/tonne CO2, which is an (optimistic) estimated value for ship-based carbon capture, obtained from previous research [15]. The ship is, on average, at a distance of 100 km offshore during the year, and the end user is 50 km from the loading point in the port, connected by pipeline. This is again based on the example of the OCAP pipeline in Rotterdam.

3.4.2. Scenario Sets

Several sets of scenarios were generated by varying the parameters in the base scenario. The main variations relate to distance (off- and onshore), storage capacity, operational mode and cost of capture. Table A3 in Appendix B shows all choices. Cost of capture is expressed in €/tonne CO2 captured. This estimated value that includes capital expenses (CAPEX), operational expenses (OPEX), installation costs, system costs, man hours, engineering costs, etc.
The base scenario is a good starter, but a different setup is also possible. This means that it should not be considered as the best performing scenario. Therefore, a second variation run is performed, where the best performing scenario of the first iteration (xA3) is used as the base case for a second iteration. This iteration varies with respect to increase in engine efficiency (i.e., 25% lower emission of CO2), skipping the land transport by disposing the CO2 directly offshore in a permanent storage location, and finally, the scenario where the system’s investment cost decreases by 25%. See Table A4 in Appendix B for details.

4. Case Study Results

4.1. Base Scenario Results

It was found that there is no realistic circumstance whereby the base case, scenario 1.1 (Table A3), has a payback period of less than 5 years (see Figure 3). Even with a very optimistic sales price for CO2 and high tax on CO2, the payback time is 6 years. Looking further within the first six sets of scenarios, there are conditions that are more favorable. The ship does meet the 2050 targets without problems though, so the solution is future-proof.

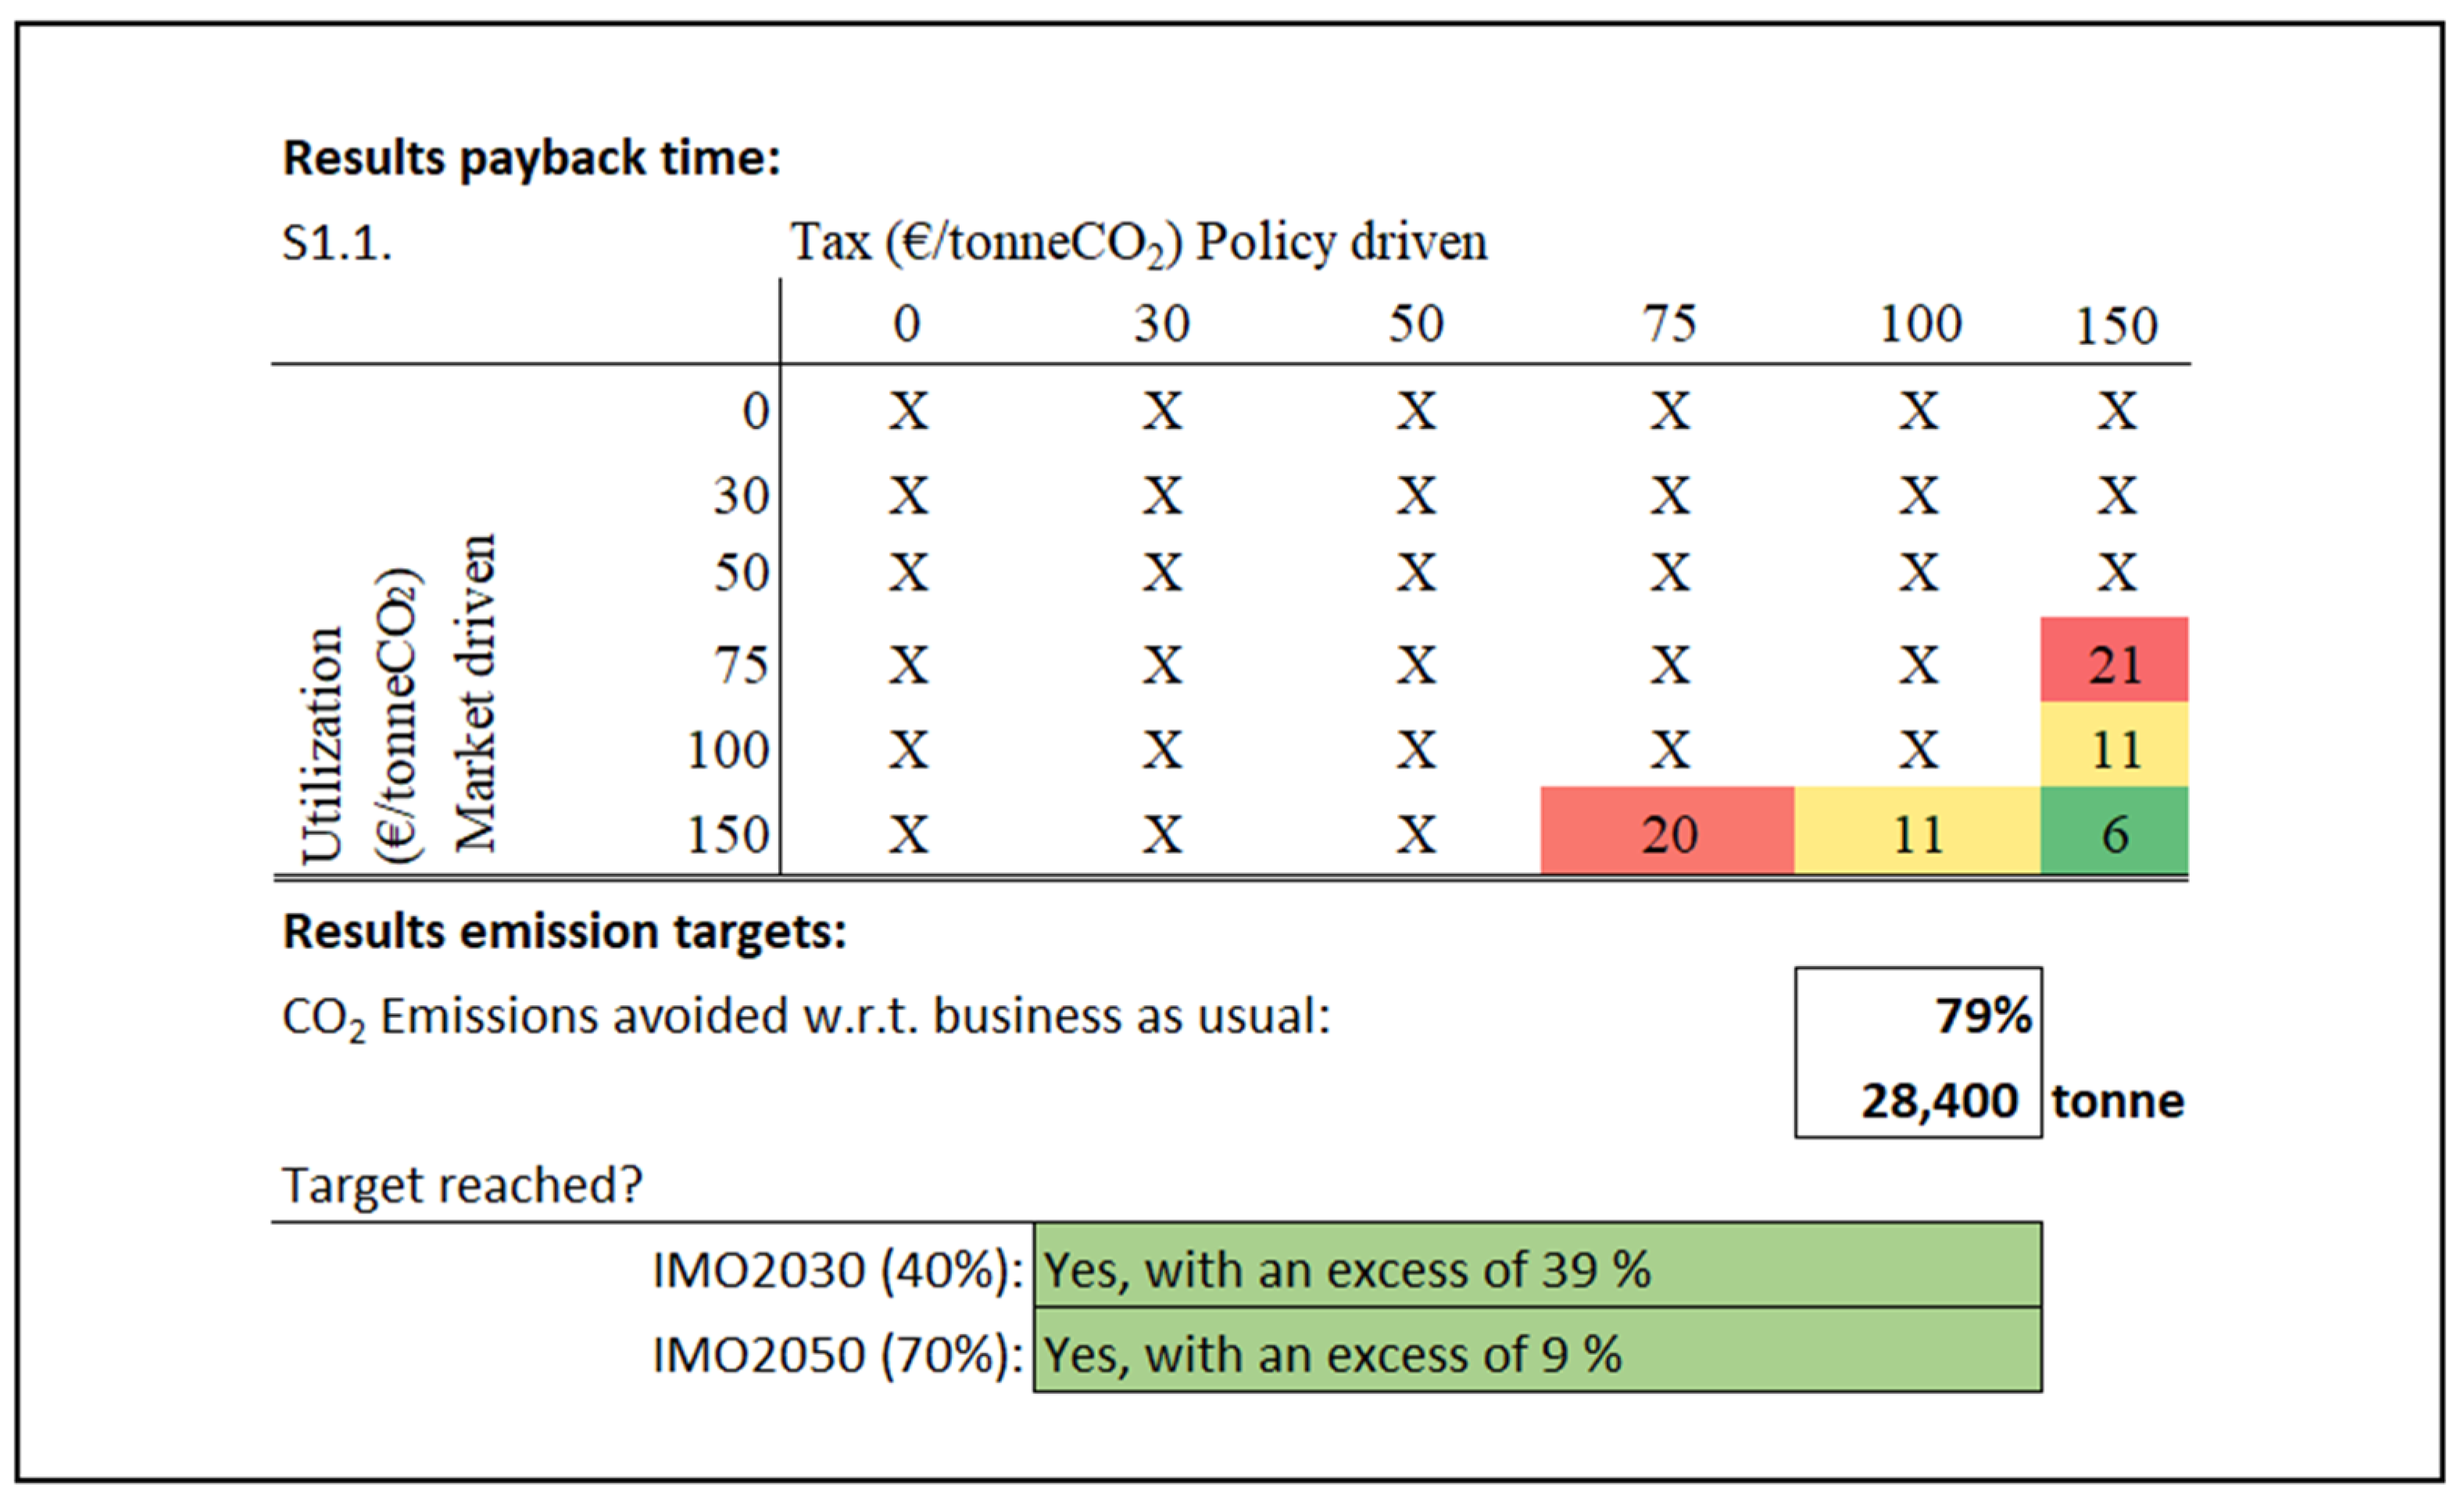
4.2. First Iteration

The best performing scenario from the first iteration set is scenario 4.3. This scenario looks at a 25% reduction in investment costs with respect to the base case, relatively short transport distances (100 km offshore, 50 km onshore) and a large amount of storage capacity (2200 m3) during the offshore work, with an offloading interval of 29 days applies. Figure 4 shows these results. The range of feasible conditions with regard to payback period increases. The total emissions in the supply chain also decrease, as an offloading vessel has to come less often to unload the CO2 (due to this larger storage capacity).
Table 3 shows an overview of the results, expressed in the effect of some essential parameters on the payback period. The minimum and maximum impacts are determined by the smallest and largest change in payback time measured as a result of adjusting one of these parameters. A positive value indicates an increase in payback time, which is negative for the feasibility of the system. The further apart the values are, the more significant the influence of that parameter on the result.
The most polluting scenario in the first set is scenario 2.1, where the most kilometers are covered in the supply chain. In this scenario, 75% of the emissions are still avoided, compared to the business as usual case, which indicates that the IMO2050 targets can be achieved in this and all other scenarios. However, the results are sensitive to economic growth. In a high economic growth scenario, the total net pollution is likely to rise, making it harder to reach the 2050 targets. However, increased profit margins in this high economic growth scenario can stimulate investments into decarbonizing technologies such as ship-based carbon capture.

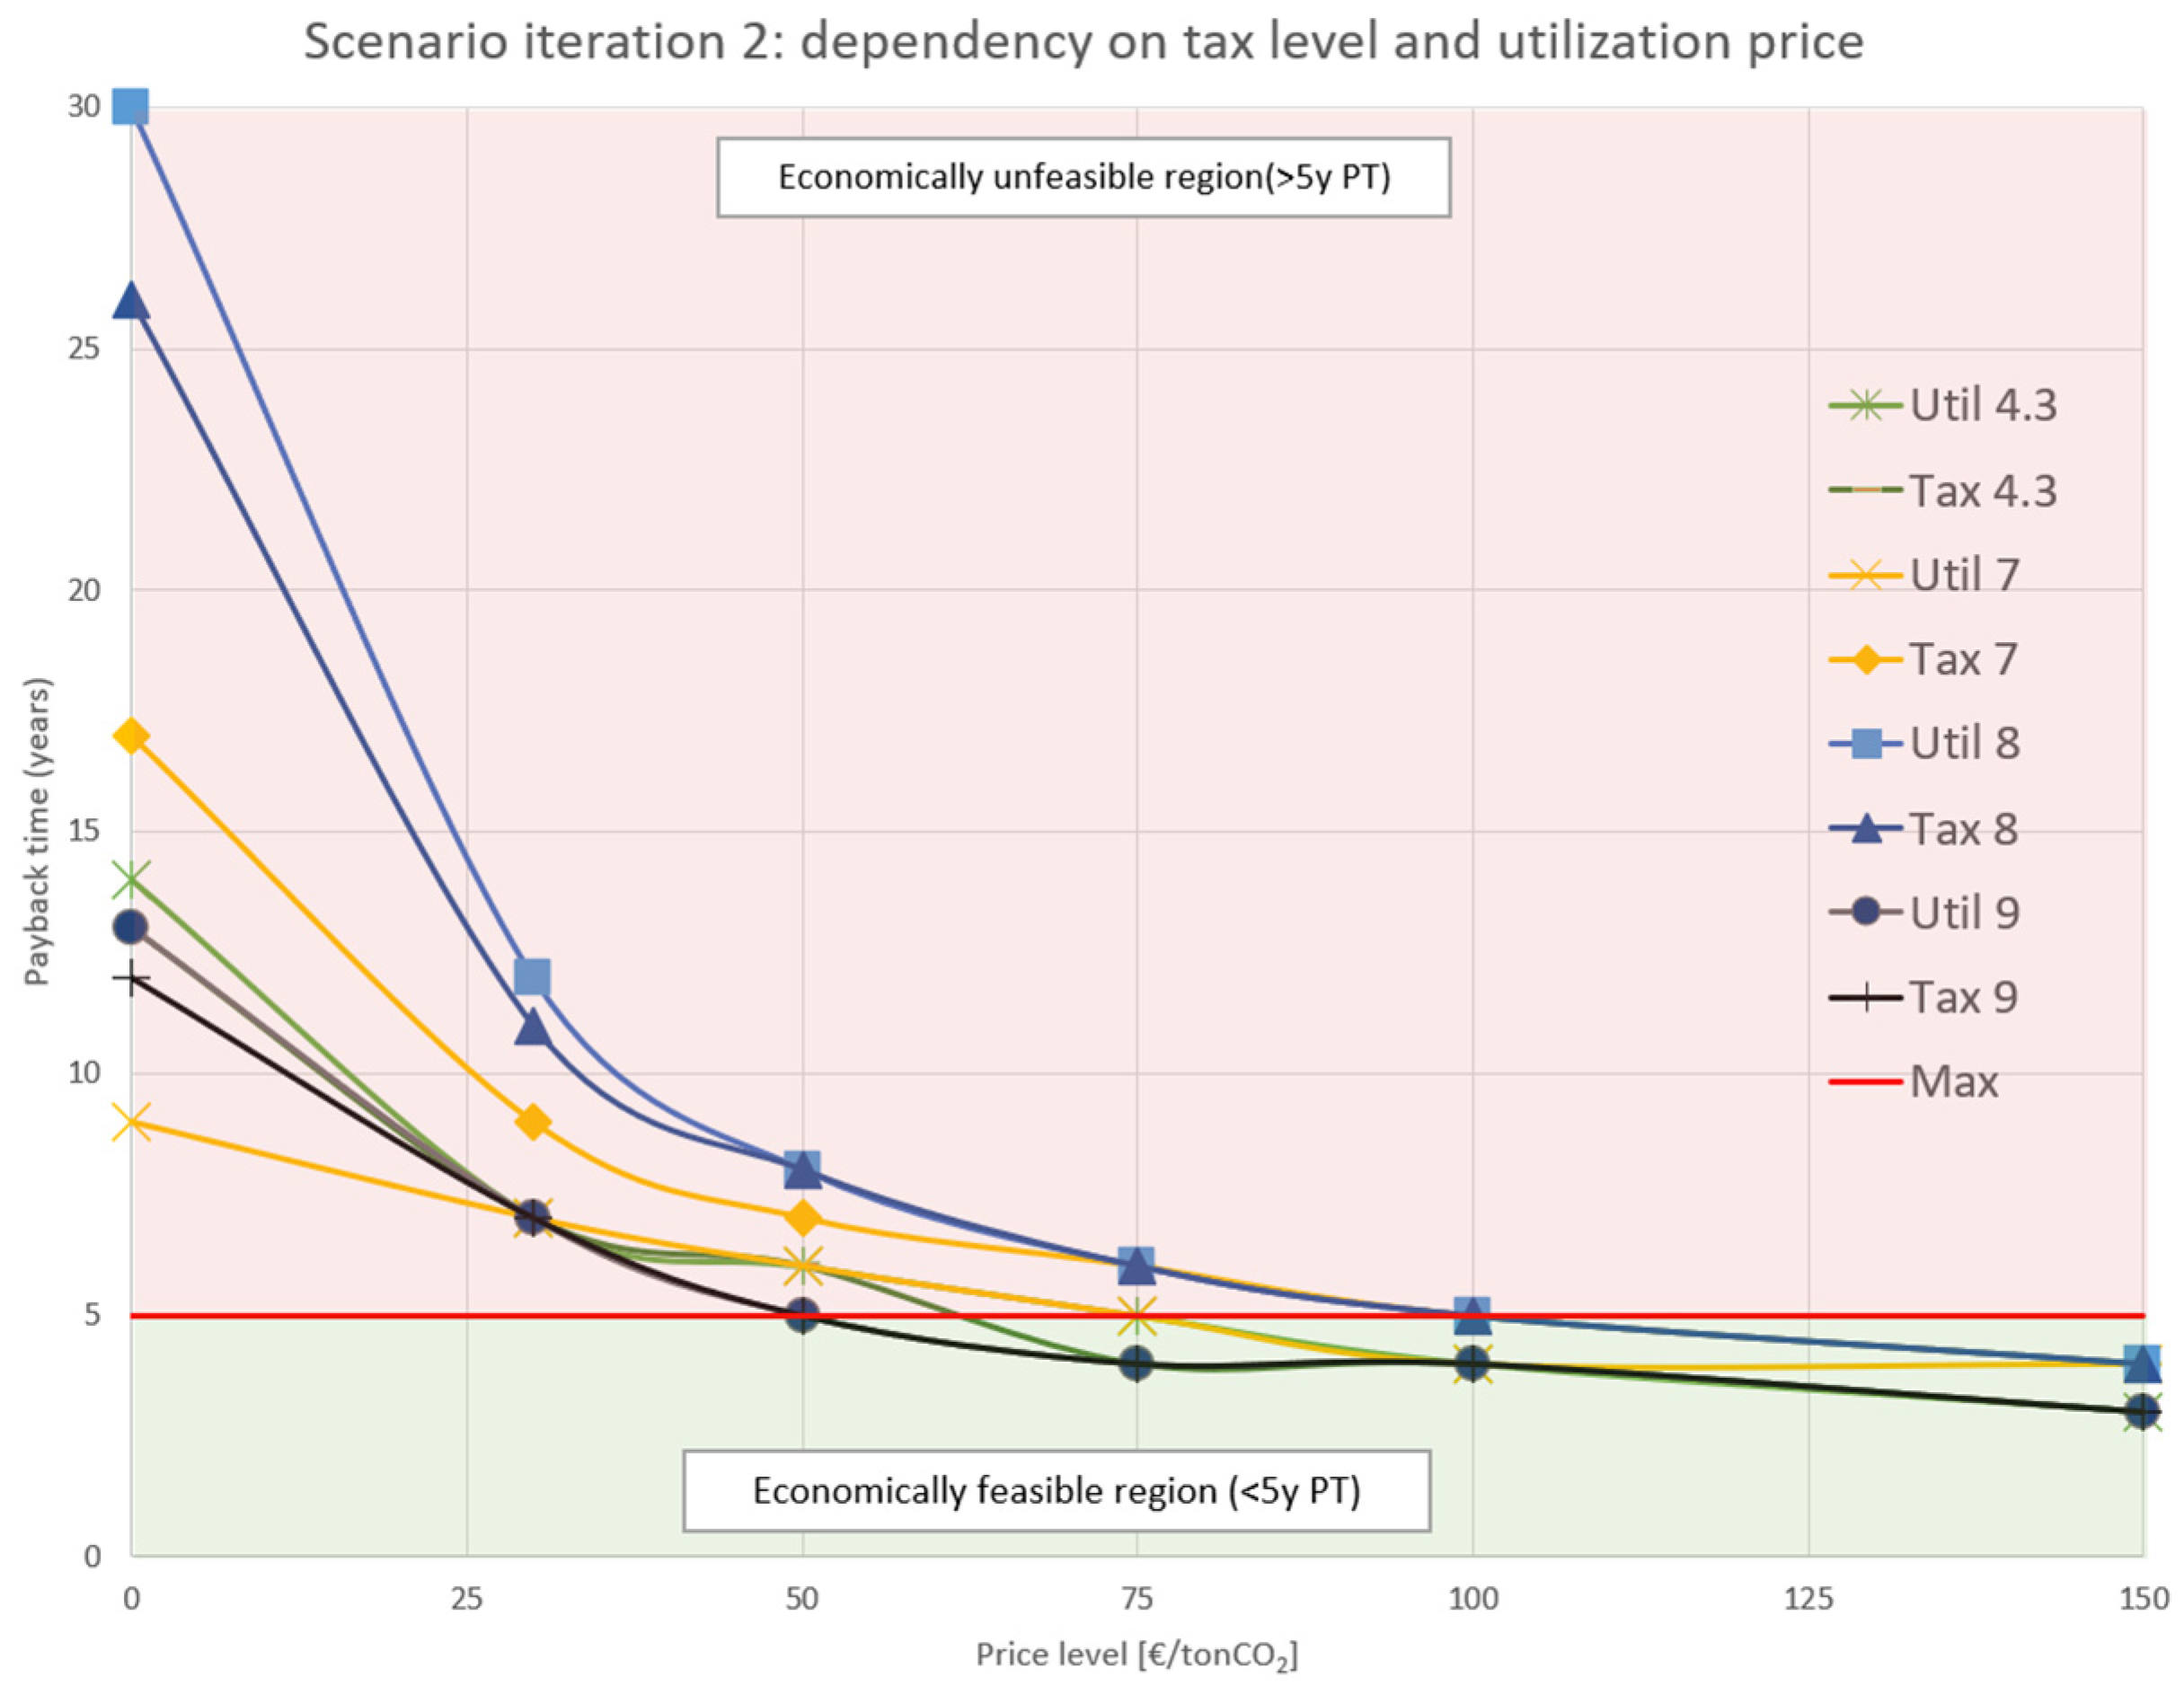
4.3. Second Iteration

With scenario 4.3 as the new base case, three other scenarios have been tested. Table A4 in Appendix B shows the variations for this set. The results are summarized in Figure 5. The red line in this figure indicates the maximum payback period of 5 years. All points below that line are feasible combinations. A line indicates the course of either utilization price or tax level, while the opposite parameter is fixed at a price of €150. For example, the course of the bottom row and rightmost column from Figure 4 can be seen as the green lines in Figure 5. This figure shows that the best way to create feasibility is to reduce investment costs (CAPEX) (scenario 9). Next is to reduce the emissions by 25% (scenario 7), and finally skipping the offshore transport phase. The latter is mainly due to the fact that in the model the price per m3 of fixed storage is linked to the capacity, while for containers a fixed amount is charged for installing the connecting infrastructure to containers, and this is not affected by the amount of storage/containers.

4.4. Detailed Design

A supply chain has been designed in detail on the basis of the case study and scenario analysis (Figure 6). It contains the most decisive conditions. The feasibility of this design will now be analyzed from a ship owner’s point of view.
For a period of one year the ship will install a wind farm and operate off the Dutch coast at an average distance of 100 km from the port of Rotterdam. The ship should operate about 50% of the time, cruise 30% of the time between sites, and remain stationary or in port for maintenance 20% of the time. The onboard carbon capture installation will capture an average of 82% of the CO2, whereby the ship uses an average of 2% more LNG than it would do if no carbon capture would take place.
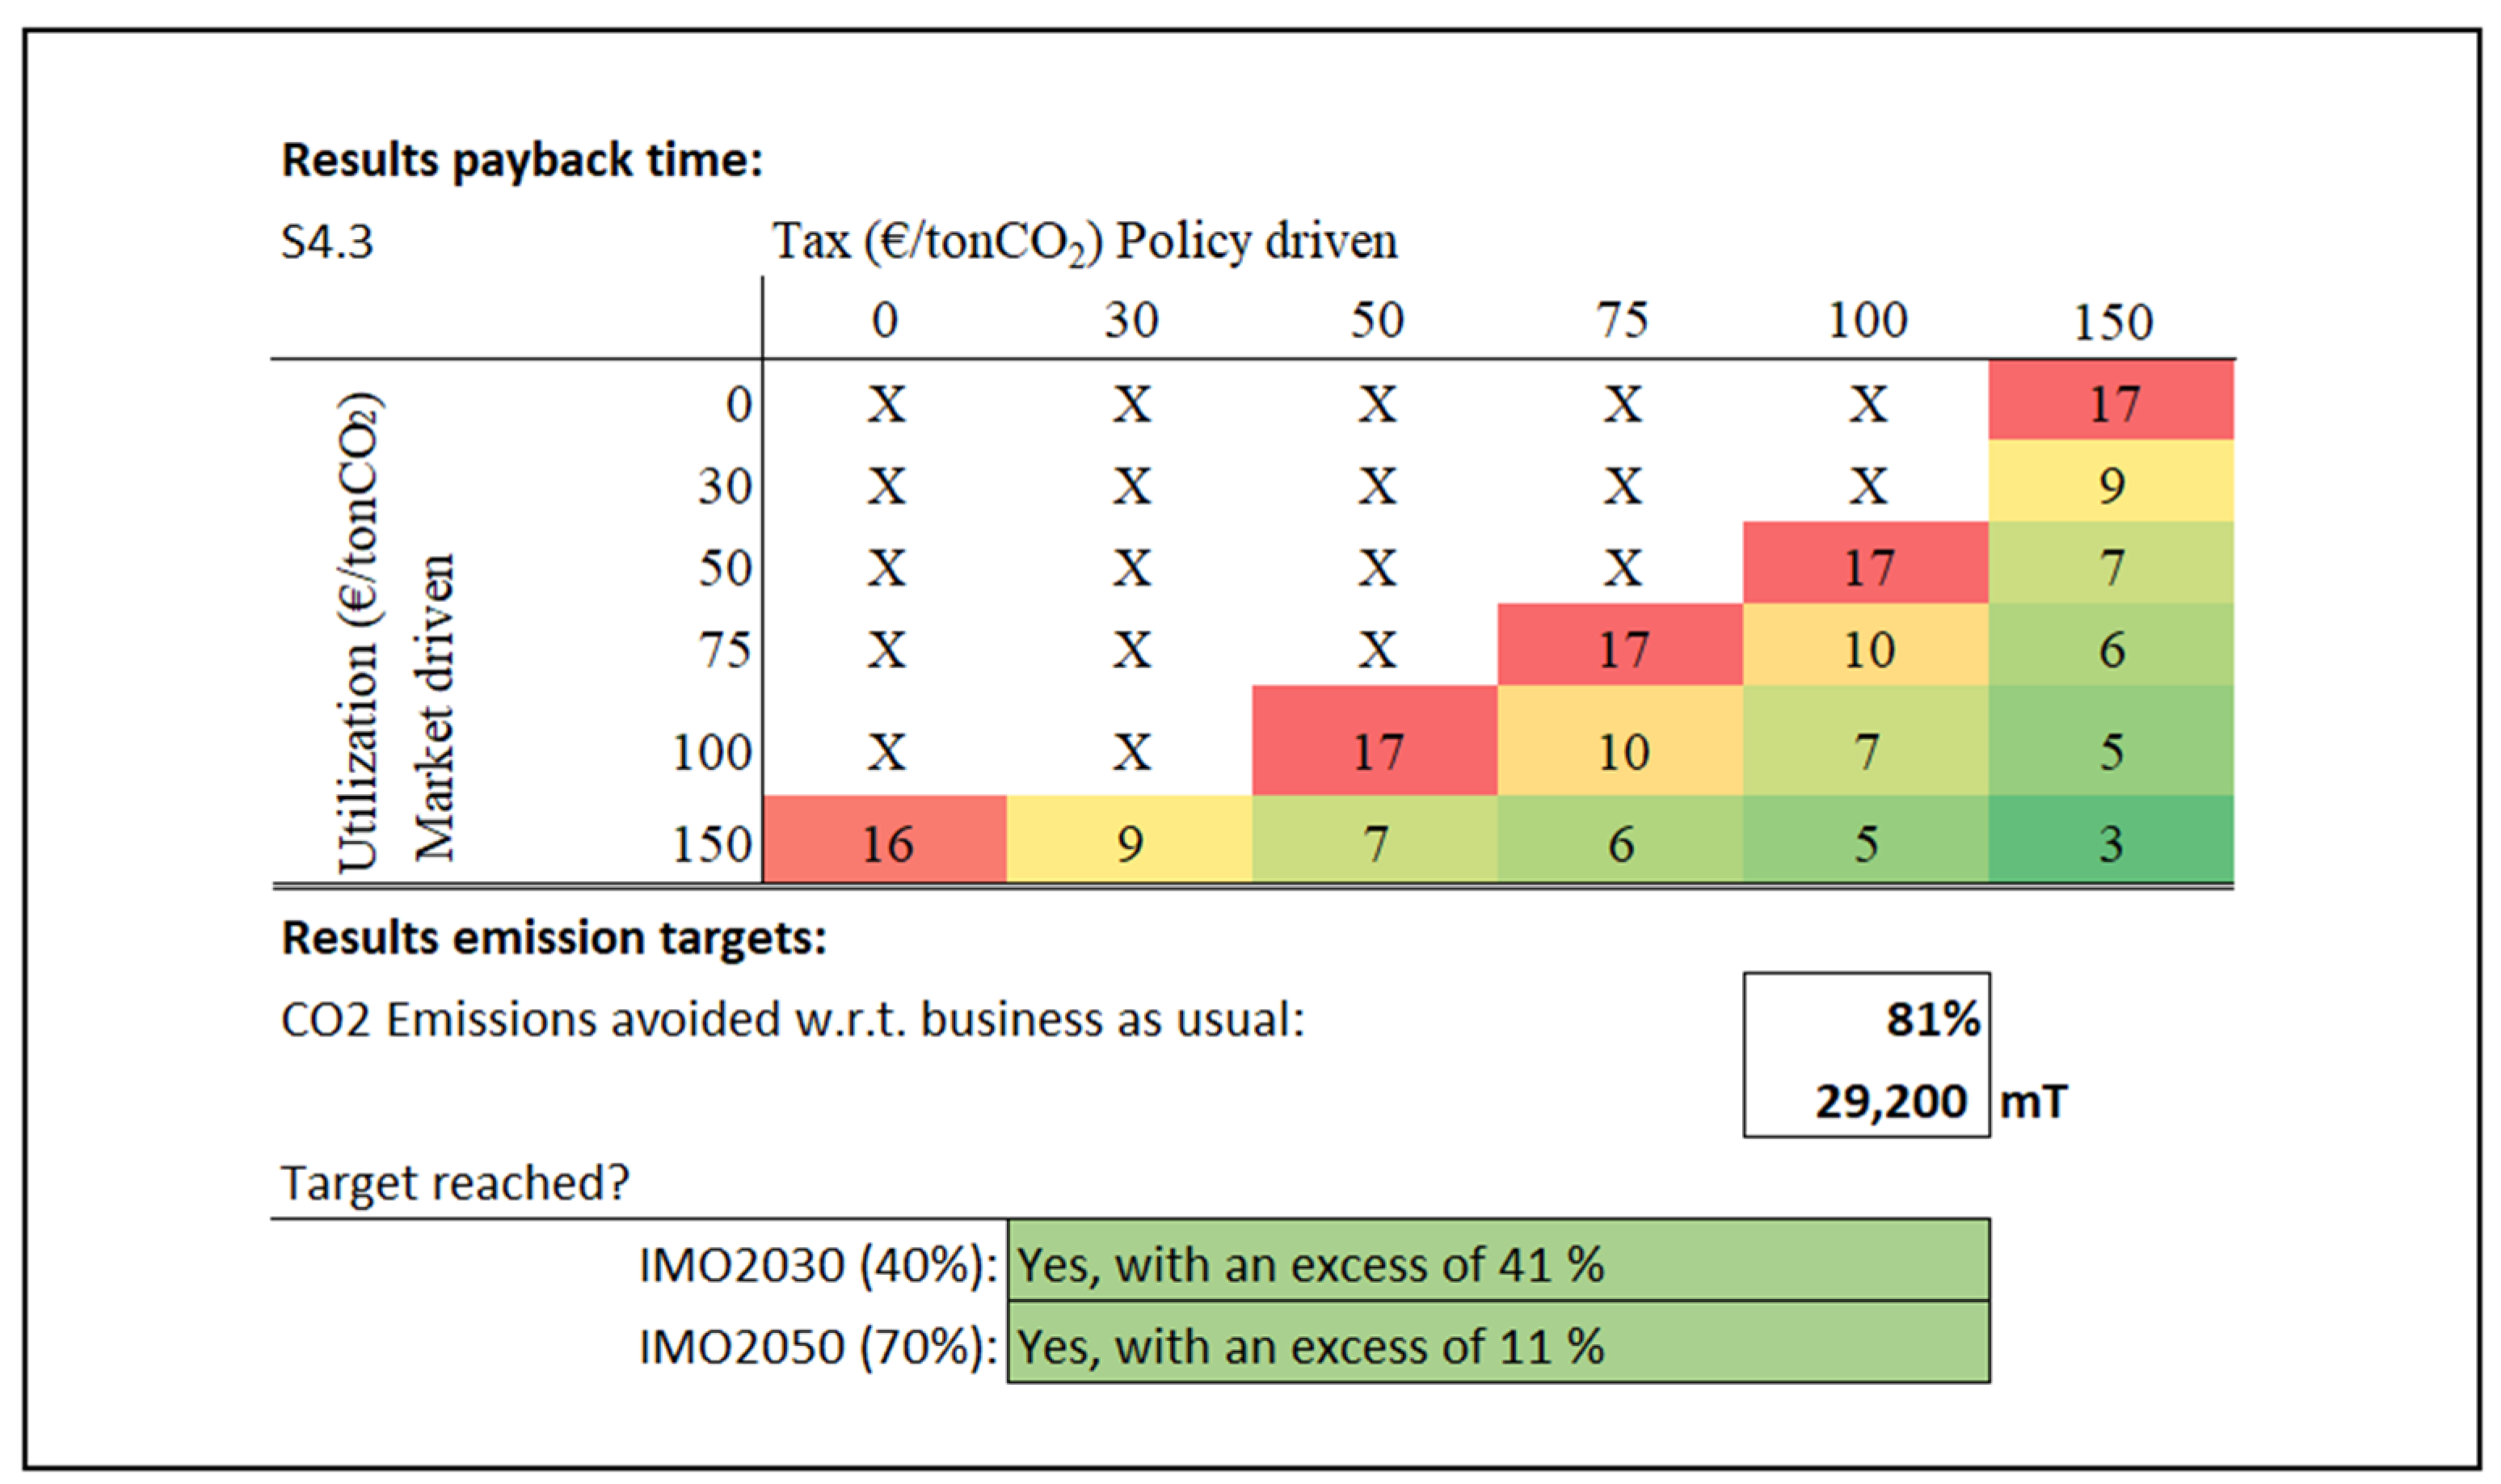
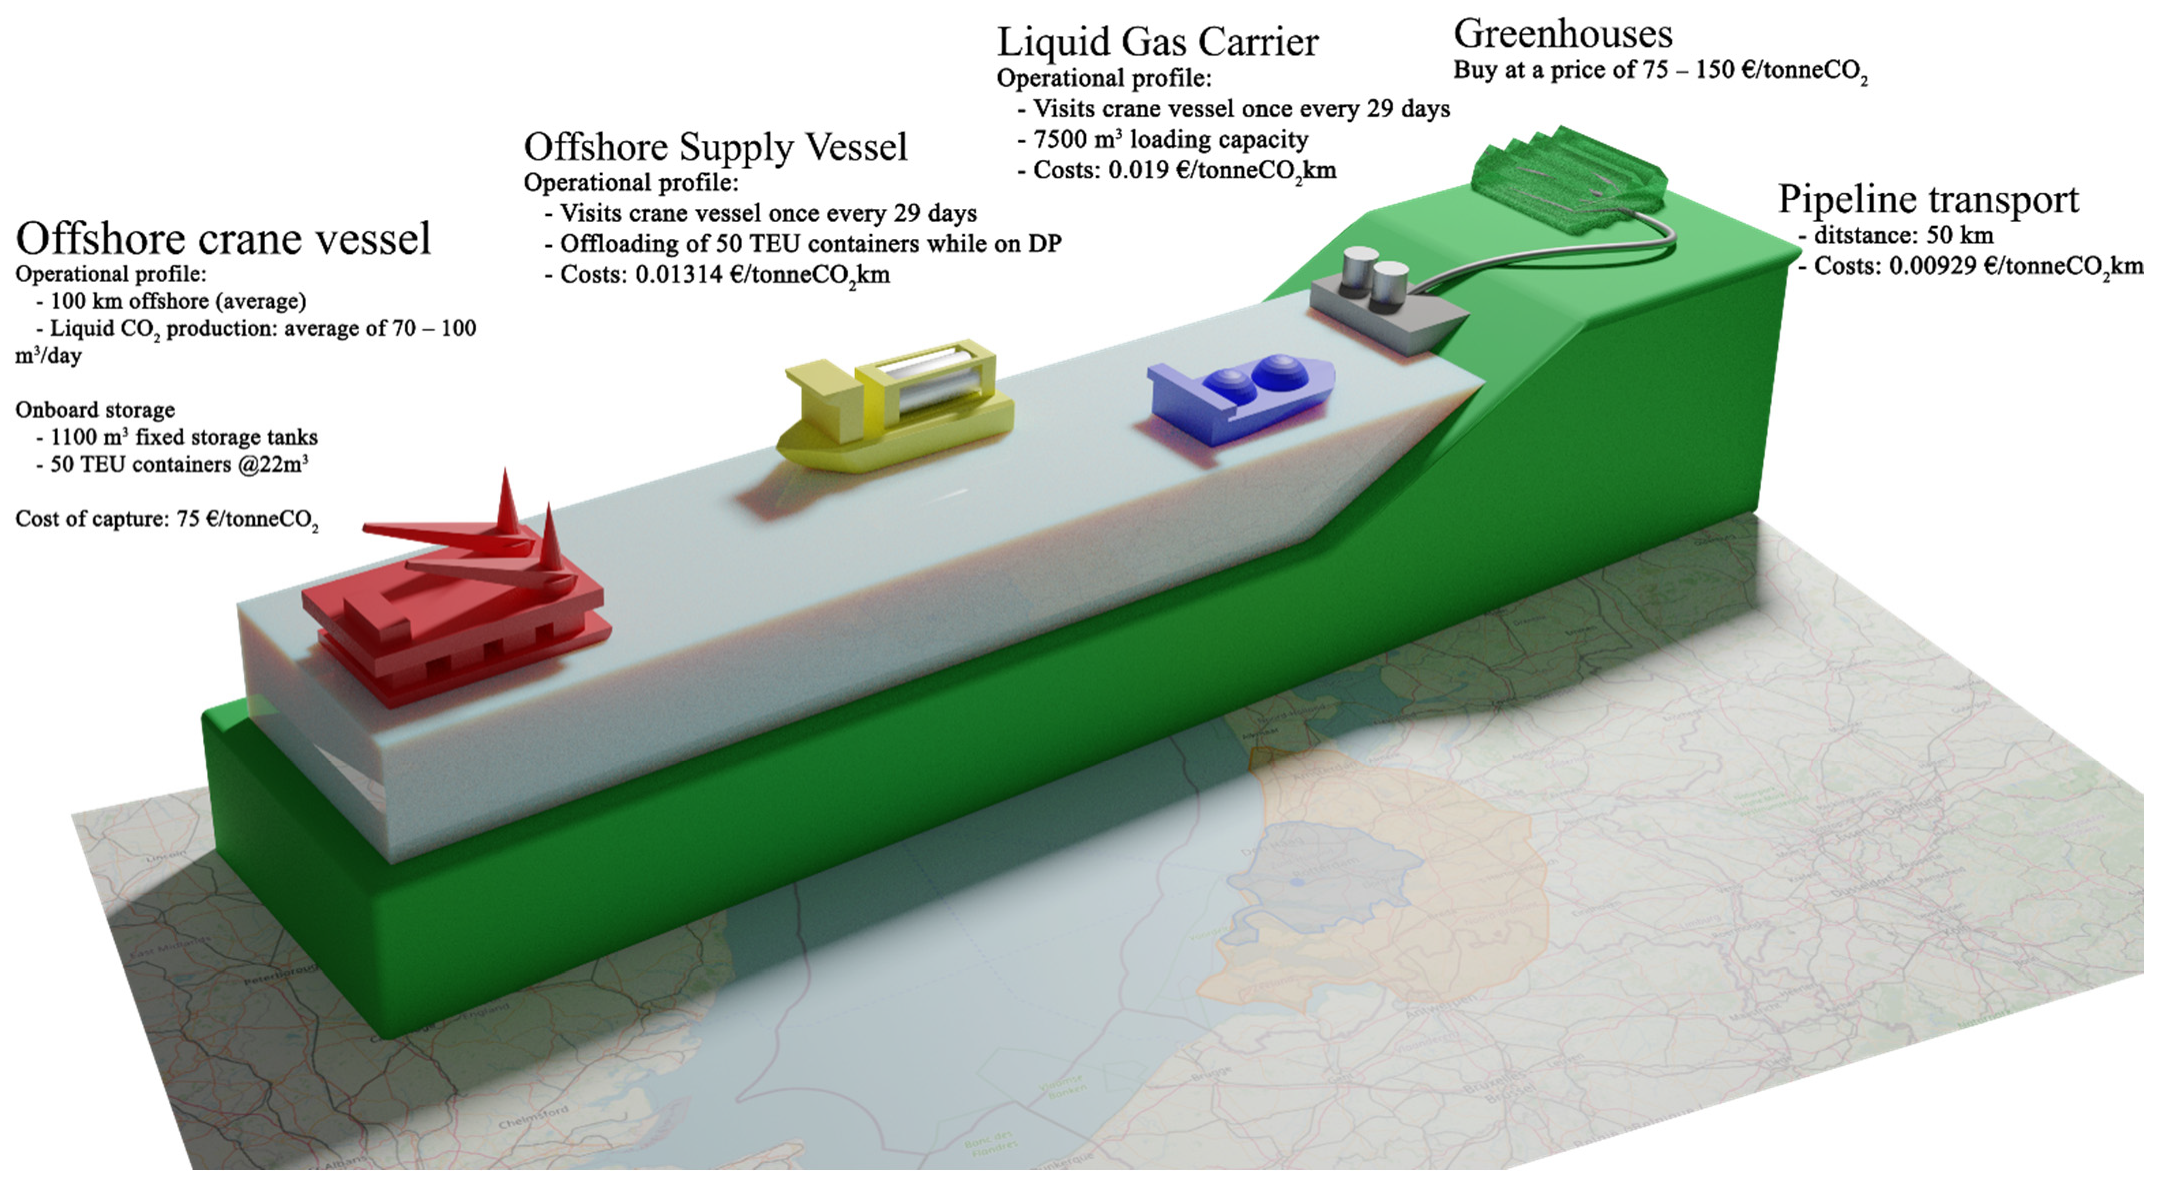
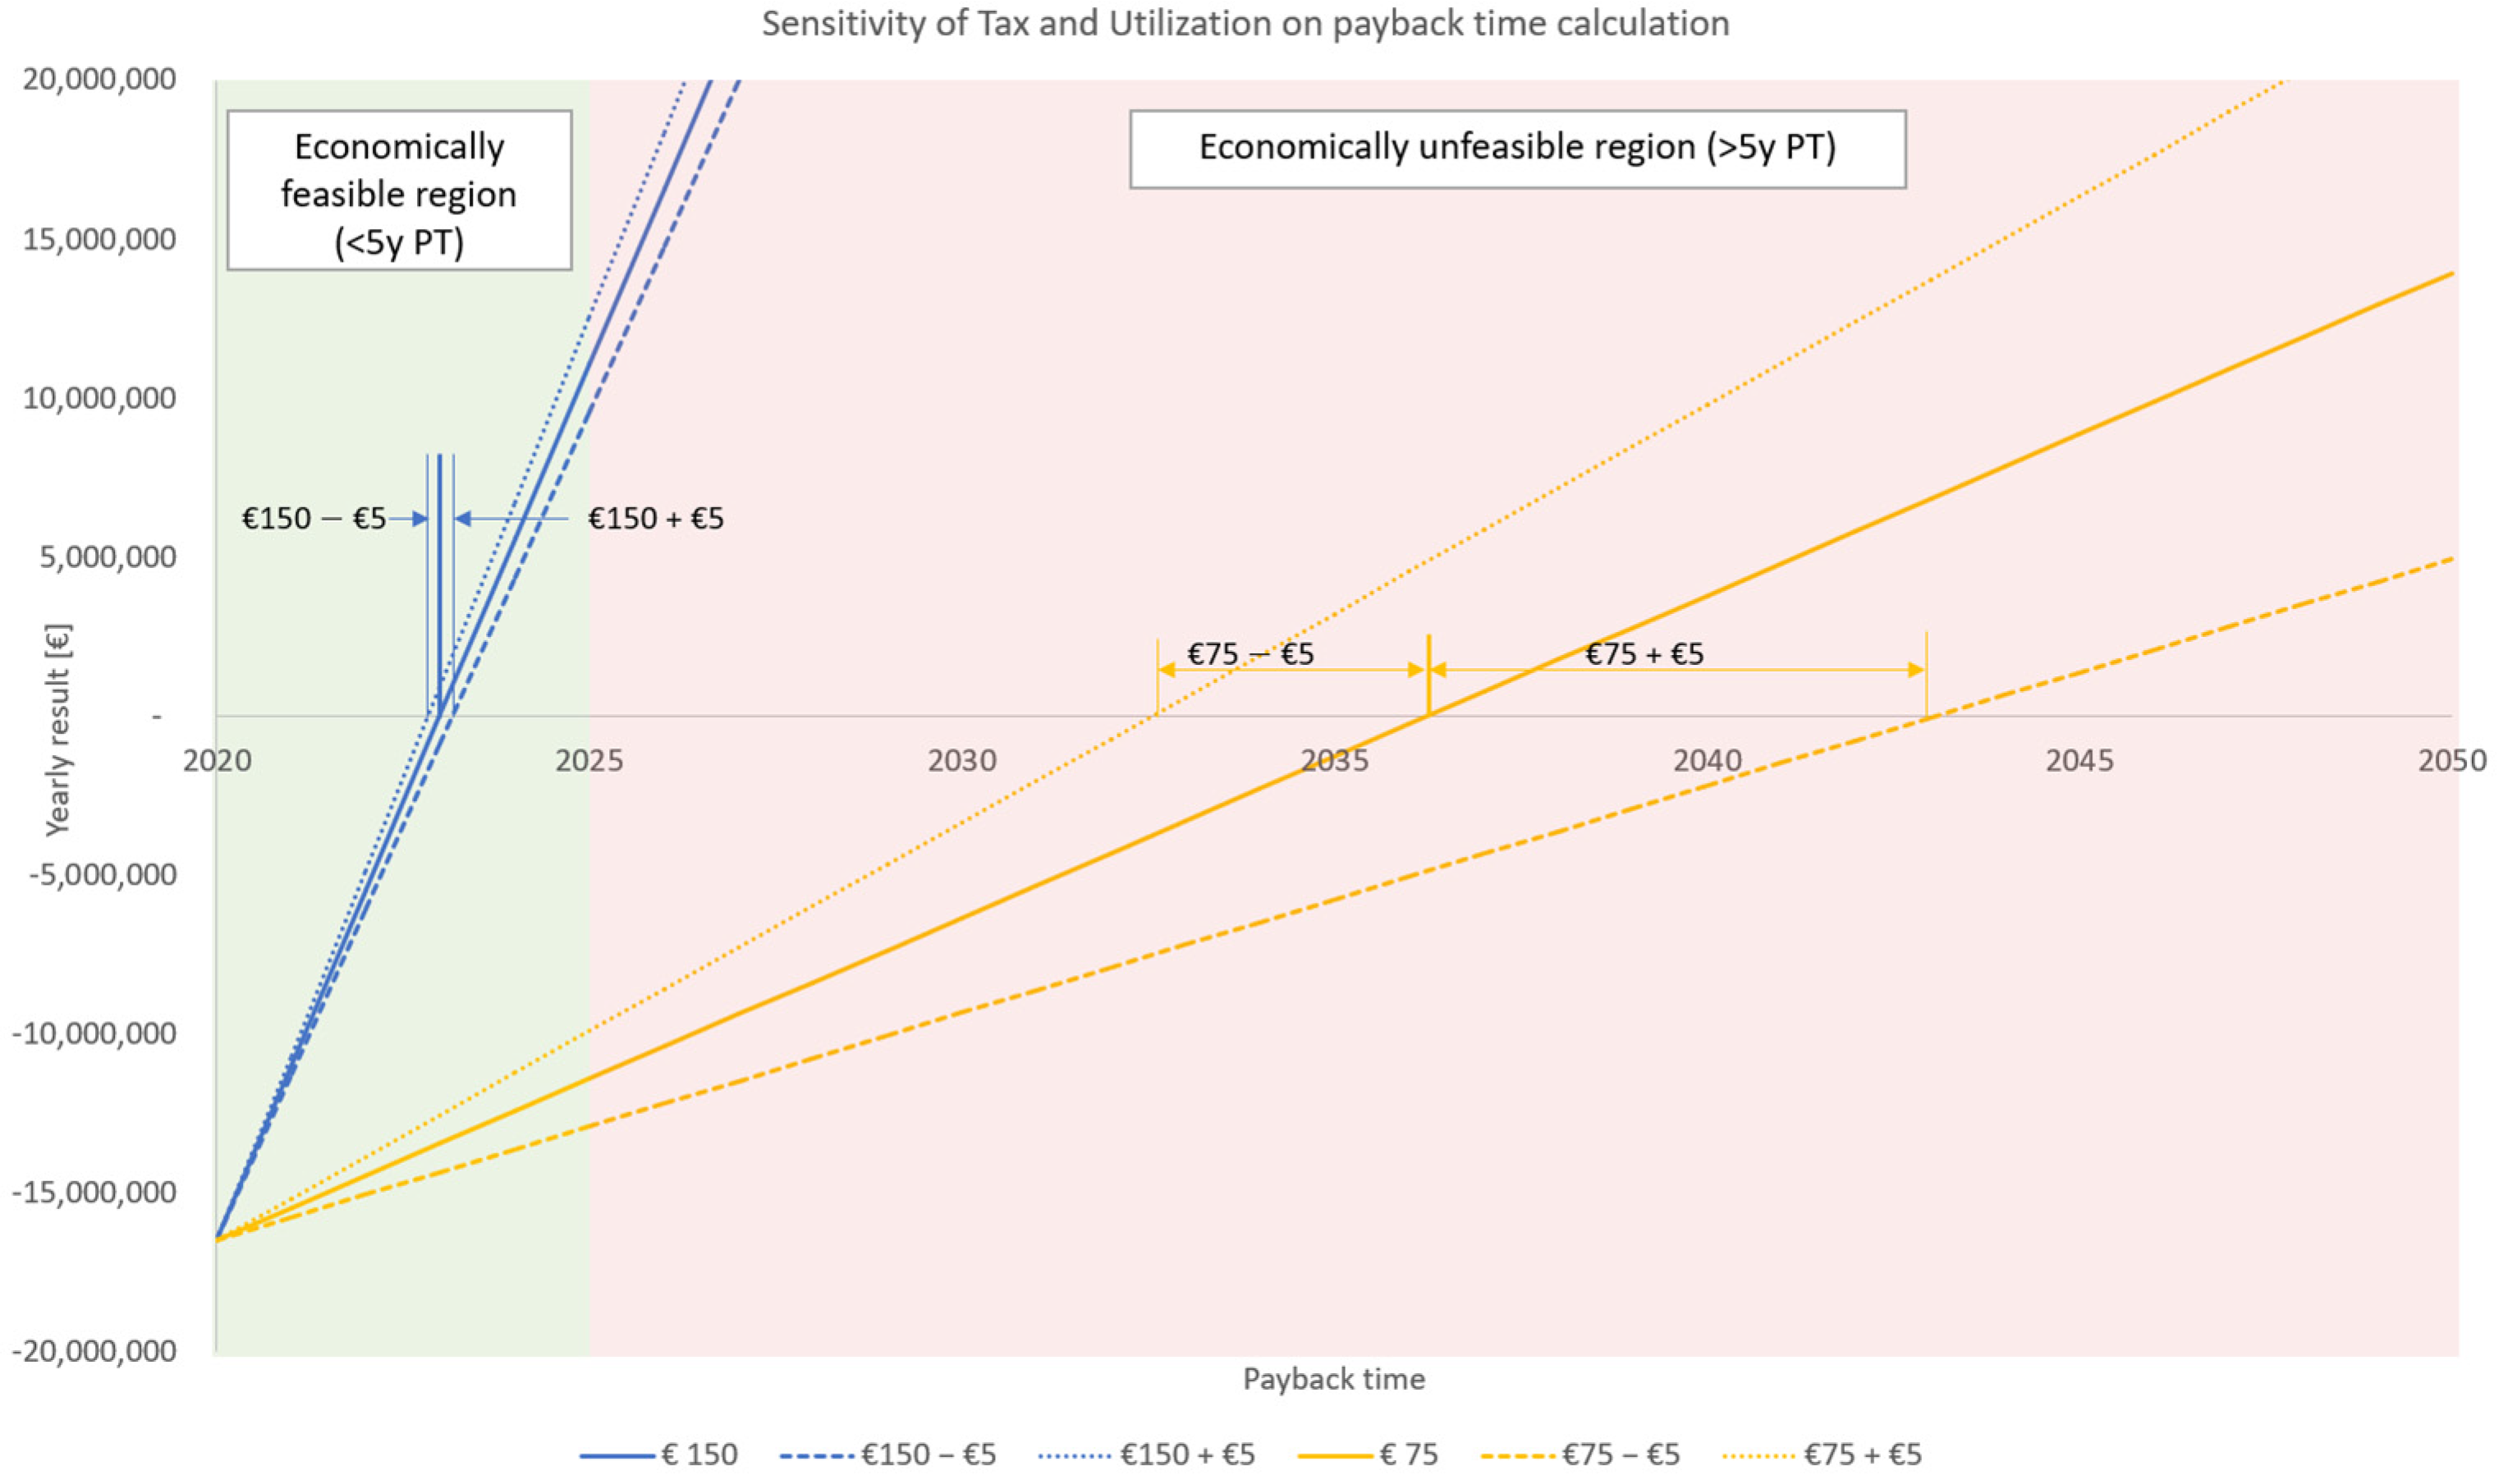
  • Capture Phase: The ship owner has invested €16.5 M in the carbon capture installation, and can capture the CO2 at a cost of €75 per tonne of CO2. The ship has hybrid storage on board with built-in fixed tanks with a size of 1100 m3. The vessel has space to store 50 tank containers (22 m3 each). The payback period under the above conditions is shown in Table 4. A more detailed time planning could optimize CO2 pickup moments and reduce distance covered, hence cost.
Table 4. Effect on payback time from variations of case study parameters.
Payback Time (Years)Taxation (€/tonne CO2)
Utilization (€/tonne CO2) 75100150
7513 years8 years5 years
1008 years6 years4 years
1504 years4 years3 years
  • Transportation Phase: The CO2 is transported with liquid gas carriers and offshore supply vessels, which come along once every 29 days to offload. The CO2 is distributed via the OCAP pipeline [22]. The average length of this transport pipeline is 50 km.
  • Utilization phase: The pipeline ends in the horticultural greenhouses in the Westland area (north-west of Rotterdam) to promote plant growth. The CO2 is sold here, for which the ship owner can receive €75–€ 150 per tonne of CO2.
An external condition is that there is a carbon tax of €75–€150 per tonne CO2. If the tax and sales price are equal and at a level of €150/tonne CO2, the results can be found in Table 5.

4.4.1. Strategic Considerations

A vessel owner considering an investment in carbon capture should answer the following questions:
  • Does the ship comply with the IMO2030/IMO2050 targets if carbon capture is used?
  • What are the technical implications for the ship, i.e., how much space is there on board the ship for capture and storage facilities?
  • To what extent does the capture and storage effect the operational activities for which the vessel was designed and is this acceptable?
  • What is willingness to pay to capture the CO2 on board and is that enough to pay for the capture and storage?
  • What is the average distance at which the ship can operate offshore? Any doubling in distance can increase payback time by 25% to 60%. Emissions from the supply chain are also affected by distance, although the effect of costs on feasibility is greater. A liquid gas carrier can sail almost 9000 km with 1100 m3 on board before emitting as much as it transports [14].
  • What is an acceptable payback period?
  • How to use external conditions to reduce the payback period? A carbon tax combined with the sales of CO2 can generate income at price levels of €75–€100 per tonne of CO2, which may make the payback period acceptable.
It is important to emphasize that every ship is different and every ship owner has different answers to these questions.

4.4.2. Evaluation

This research concerned a topic that is still very new and unexplored in literature. As a consequence, public data is hardly available and reliability of what is available is questionable. The fact that the research was commissioned by a commercial company has at no time led to influencing the results of this company. The authors have had sufficient freedom and access to internal data that was needed, without direction towards specific results.
The methodology used leads to a range of interesting results, which help a ship owner to understand the relevant aspects of the supply chain of CO2. The ship owner can simulate the different conditions and adapt investment decisions according to the outcomes of the model.
Many assumptions need further study, which is logical given the state-of-the-art nature of this topic. There is a lot of uncertainty, in particular about the economic conditions. For instance, the payback period depends on factors like technical progress, policy-making (regulation, CO2 tax level), future market size and price for the captured CO2.
External factors (utilization and tax) influence the slope of the payback line. The sensitivity to the results of a small change in these parameters is higher for larger investments than for smaller ones. The difference indicates an inaccuracy in the calculation method, due to this linearization effect (Figure 7). However, these sensitive conditions occur when the payback period is outside the range of 3–5 years. Only the area near and below the red line in Figure 5 is relevant, where the model is less sensitive, and hence this is not a real problem for this case. With a different payback period, this observation may be different, however.
The use case with the offshore heavy lift crane vessel is useful for developing certain parts of the technology, but the uniqueness of this vessel may have an adverse effect on large-scale applicability to other vessel types.

5. Results and Conclusions

Designs for ship-based carbon capture and logistics have been discussed in this paper. Systems engineering was used as a guide to do research in a well-structured and transparent way. After the requirements analysis, attention was given to preliminary and detailed designs. In these designs attention was given to technical aspects, emission reduction potential and economics (income from utilization and taxation of CO2.) Details were explored by means of operations scenarios for the dedicated offshore heavy lift vessel of the commissioner. The main research question was addressed as follows: first, determine the technical options for such a supply chain. Second, determine the potential to reduce CO2 emissions to the proposed (IMO2030 and IMO2050) levels. Third, determine the economic conditions, which would stimulate vessel owners to invest in the concept.

5.1. Technology

The type of onboard storage technology largely determines the technical possibilities upstream the supply chain, and has therefore been identified as a critical choice in the design of the supply chain. There are direct consequences for emission reduction and economics. An example is to double storage capacity. While demanding a larger investment, it can reduce payback time by 20% to 60%.
For the transport phase, the distance the CO2 transported offshore is more decisive than the distance onshore. Doubling the total distance traveled offshore can increase the payback time by a quarter to more than twice as long. This effect becomes less significant when the cost of capture decreases by 25%.

5.2. Emissions

The emission reduction potential is less relevant for the design of the supply chain. The emissions that are released in the supply chain of carbon capture, as well as the emissions that cannot be captured due to operational and technical limitations of the carbon capture system, are so small compared to the necessary favorable conditions that under each scenario considered in this study, the emissions reduction targets of IMO2030 and IMO2050 can be achieved.

5.3. Economics

In a highly competitive market, capital costs and payback periods are of primary concern for vessel owners. A payback period of 3–5 years reduces financial risks, yet as a consequence, many scenarios become economically unfeasible. All solutions have technical uncertainties and financial risks, but the sale of captured CO2 could be a crucial advantage of the proposed concept over other concepts. The income from utilization shortens the payback period. If a tax would be levied on CO2 emissions, then investing in capture technology would mean saving on CO2-taxes as well. Vessel owners, faced with a choice between ’make them pay’ or ’get paid’ in combination with stricter regulation, may favor the latter.
In conclusion, ship-based carbon capture technology is a very effective way to reduce emissions for large offshore LNG powered work vessels. This means that there is a great potential for a vessel owner to achieve the IMO2030 and IMO2050 targets if the boundary conditions are met. These economic and legal conditions are beyond the control of the ship owner.

6. Discussion and Further Research

The starting point of this analysis was purely technical. At the end of the study the authors concluded that most of the uncertainty is of an economic nature. Hence the advice for more economic studies.
  • A study into the disruptive nature in the CO2 market of ship-based carbon capture. As the adoption of the technology increases in popularity among ship owners, more CO2 will be marketed, which in turn entails the risk of market saturation.
  • A study into the scope of a CO2 tax. Will this only target pure CO2 emissions, or also CO2 equivalent emissions? If GWP becomes relevant, then the issue of methane slip in LNG engines should be considered, as it will negatively affect the capture potential. It could also mean that engine conversion from HFO to LNG is not a viable route anymore.
  • A study into the effect of subsidies to stimulate this technology. With subsidies the cost of capital and the payback period could be reduced substantially. What would be the optimal subsidy level? Should it be a temporary subsidy?
  • If the cost of capture would decrease to such a level that it could become economically beneficial for a ship owner to produce and sell more CO2, there is a risk of overshooting and more fossil fuels will be burned. Should this be prevented and if so, how?
  • Transport of CO2 is expensive. What are the options to use it on the vessel, for example to produce synthetic fuels onboard? This would render the whole supply chain issue obsolete.
  • Ships operate on a global scale. This study mainly looked at European conditions. For a complete life cycle analysis, the opportunities in other places in the world must be examined in more detail.

Author Contributions

Conceptualization, M.B., J.V. and J.P.; Data curation, M.B.; Formal analysis, M.B.; Investigation, M.B.; Methodology, M.B.; Supervision, J.V., J.P., V.D. and D.S.; Validation, M.B.; Visualization, M.B.; Writing—original draft, M.B.; Writing—review & editing, J.V. All authors have read and agreed to the published version of the manuscript.

Funding

This research did not receive any specific grant from funding agencies in the public, commercial, or not-for-profit sectors.

Institutional Review Board Statement

Not applicable; study did not contain research on humans or animals.

Informed Consent Statement

Not applicable.

Data Availability Statement

For this study no publicly archived datasets were used. Data used was taken from the references mentioned in the paper. Expert validation was provided by Heerema.

Conflicts of Interest

The authors declare no conflict of interest.

Appendix A

Table A1. Economical assumptions and calculated constants. Sources without brackets are listed in footnote of table.
ParameterValueUnitSource/
Footnote
Comment
Capture
Cost of capture
100€/tonne CO2[15]Assumed value, based on estimations by TNO/ASPEN+
Transportation offshore
Container daily lease price
4.93€/day1
Offshore supply vessel charter rate21411.5€/day2
Offshore supply vessel trip dependent cost0.01314€/tonne km[28]
Liquid gas carrier transport price0.019€/tonne km[29]
Transportation onshore prices
Road
0.07€/tonne km3
Rail0.267€/tonne (100 km)4
Pipeline0.00929€/tonne km5
Inland barge0.03429€/tonne km6, 7
Utilization costs
onshore sequestration low
6.195€/tonne CO2[20]
Onshore sequestration high11.504€/tonne CO2[20]
Offshore sequestration low7.965€/tonne CO2[20]
Offshore sequestration high17.699€/tonne CO2[20]
Sequestration profit EOR sales low13.274€/tonne CO2[20]
Sequestration profit EOR sales high35.398€/tonne CO2[20]
Horticulture sales price50.00€/tonne CO28and interviews
Utilization sales assumed50.00€/tonne CO2[30]
Table A2. Emissions related assumptions and calculated constants.
ParameterValueUnitSource/
Footnote
Comment
Emissions base case
Work95tonne CO2/dayHeeremaRounded value
Transit130tonne CO2/dayHeeremaRounded value
Daily LCO2 production with 82% capture rate and 102% LNG usage
Work80tonne/dayCalculated
Transit110tonne/dayCalculated
Transportation offshore
Liquid gas carrier8.633 × 10−6tonne/tonne km CO2[13]
Offshore supply vessel0.1385tonne/km9Amount of CO2 left outside of this equation (i.e., same for 1 tonne or 100 tonnes)
On board own vessel130tonne/dayHeerema
Onshore transportation
Road1.032 × 10−6tonne/tonne km CO210
Rail3.5 × 10−6tonne/tonne km CO2 [31]
Inland barge3.5 × 10−6tonne/tonne km CO2 [31]
Pipeline No CO2 emissions in ideal situation
Utilization emissions
Materials vector No CO2 emissions in ideal situation
Direct utilization Depending on the input value chosen (0–100%)
Horticulture No CO2 emissions in ideal situation
Sequestration No CO2 emissions in ideal situation

Appendix B

Table A3. Overview of scenario variations 1–6 first iteration.
Scenario SetScenario SubsetDescriptionDefault ParametersVariation
1 Hybrid (50/50) OSV/LCG
Offshore distance 100 km
Onshore distance 50 km pipeline
Cost of Capture €100
1.1Sailing, small storage1100 m3 storage
11 days offloading interval
1.2Sailing, large storage 2200 m3 storage 22 days offloading interval
1.3Working, large storage 2200 m3 storage
29 days offloading interval
2 Hybrid (50/50) OSV/LCG
Onshore distance 50 km pipeline
Cost of Capture €100
Offshore distance 200 km
2.1Sailing, small storage1100 m3 storage
11 days offloading interval
2.2Sailing, large storage 2200 m3 storage
22 days offloading interval
2.3Working, large storage 2200 m3 storage
29 days offloading interval
3 Hybrid (50/50) OSV/LCG
Offshore distance 100 km
Cost of Capture €100
Onshore distance 100 km pipeline
3.1Sailing, small storage1100 m3 storage
11 days offloading interval
3.2Sailing, large storage 2200 m3 storage
22 days offloading interval
3.3Working, large storage 2200 m3 storage
29 days offloading interval
4 Hybrid (50/50) OSV/LCG
Offshore distance 100 km
Onshore distance 50 km pipeline
Cost of Capture €75
4.1Sailing, small storage1100 m3 storage
11 days offloading interval
4.2Sailing, large storage 2200 m3 storage
22 days offloading interval
4.3Working, large storage 2200 m3 storage
29 days offloading interval
5 Hybrid (50/50) OSV/LCG
Onshore distance 50 km pipeline
Cost of Capture €75
Offshore distance 100 km
5.1Sailing, small storage1100 m3 storage
11 days offloading interval
5.2Sailing, large storage 2200 m3 storage
22 days offloading interval
5.3Working, large storage 2200 m3 storage
29 days offloading interval
6 Hybrid (50/50) OSV/LCG
Offshore distance 100 km
Cost of Capture €75
Onshore distance 50 km
6.1Sailing, small storage1100 m3 storage
11 days offloading interval
6.2Sailing, large storage 2200 m3 storage
22 days offloading interval
6.3Working, large storage 2200 m3 storage
29 days offloading interval
Table A4. Overview of scenarios 7, 8 and 9.
ScenarioDescriptionDefault ParametersVariation
7Engine emissions −25%Hybrid (50/50) OSV/LCG
Offshore distance 100 km
Onshore distance 50 km pipeline
COC €75
2200 m3 storage
CAPEX €16.5 M
Emissions factor 0.75
40 days offloading interval
8No onshore transportationOffshore distance 100 km
COC €75
2200 m3 storage
29 days offloading interval
Emissions factor 1
CAPEX €16.5 M
0 km onshore
Liquid gas carrier 100%
9CAPEX −25%Hybrid (50/50) OSV/LCG
Offshore distance 100 km
Onshore distance 50 km pipeline
COC €75
2200 m3 storage
29 days offloading interval
Emissions factor 1
CAPEX €12.35 M

References

  1. European Commission. Quantification of Emissions from Ships Associated with Ship Movements between Ports in the European Community. 2002. Available online: https://ec.europa.eu/environment/air/pdf/chapter2_ship_emissions.pdf (accessed on 29 October 2020).
  2. Lee, H.; Aydin, N.; Choi, Y.; Lekhavat, S.; Irani, Z. A decision support system for vessel speed decision in maritime logistics using weather archive big data. Comput. Oper. Res. 2018, 98, 330–342. [Google Scholar] [CrossRef]
  3. IMO. Third IMO Greenhouse Gas Study 2014. 2015. Available online: https://wwwcdn.imo.org/localresources/en/OurWork/Environment/Documents/Third%20Greenhouse%20Gas%20Study/GHG3%20Executive%20Summary%20and%20Report.pdf (accessed on 14 April 2021).
  4. IMO. Initial IMO Strategy on Reduction of GHG Emissions from Ships. 2018. Available online: https://www.imo.org/en/MediaCentre/HotTopics/Pages/Reducing-greenhouse-gas-emissionsfrom-ships.aspx (accessed on 14 April 2021).
  5. van der Minkelis, N. Letter from KVNR to Ship Owners on Impact of Announced ETS for Shipping; Koninklijke Vereniging van Nederlandse Reders, KVNR, Dept. of Technical and Environmental Affairs: Rotterdam, The Netherlands, 2020. [Google Scholar]
  6. AVR. First Tons of CO2 Captured from Residual Waste Supplied to Greenhouse Horticulture. 2019. Available online: https://www.avr.nl/en/press/first-tonnes-of-co2-captured-from-residualwaste-supplied-to-greenhouse-horticulture (accessed on 29 October 2020).
  7. Clayton, R. LNG Will Be Transitional Fuel for 2030, Nor-Shipping Hears. 2019. Available online: https://lloydslist.maritimeintelligence.informa.com/LL1127750/LNGwill-be-transitional-fuel-for-2030-NorShipping-hears (accessed on 29 October 2020).
  8. Upstreamonline.com. LNG Remains a Dead End for Decarbonizing Maritime Transport. 2019. Available online: https://www.transportenvironment.org/newsroom/blog/lng-remainsdeadend-decarbonising-maritime-transport (accessed on 29 October 2020).
  9. PaBalcombe, U.; Brierley, J.; Lewis, C.; Skatvedt, L.; Speirs, J.; Hawkes, A.; Staffell, I. How to decarbonize international shipping: Options for fuels, technologies and policies. Energy Convers. Manag. 2019, 182, 72–88. [Google Scholar] [CrossRef]
  10. Van den Akker, J. Carbon Capture Onboard LNG-Fueled Vessels. Ph.D. Thesis, Delft University of Technology, Delft, The Netherlands, 2017. [Google Scholar]
  11. Christiaanse, C. Offshore Transport, Conditioning and Storage of Carbon Dioxide. TU Delft Repository, Delft, 2018. Available online: https://repository.tudelft.nl/islandora/object/uuid%3A32548387-8048-497c-bf36-c6cd2ede4718 (accessed on 29 October 2020).
  12. Feenstra, M.; Monteiro, J.; van den Akker, J.T.; Abu-Zahra, M.R.; Gilling, E.; Goetheer, E. Ship-based carbon capture onboard of diesel or LNG-fuelled ships. Int. J. Greenh. Gas Control. 2019, 85, 1–10. [Google Scholar] [CrossRef]
  13. Aspelund, A.; Tveit, S.P.; Gundersen, T. A liquefied energy chain for transport and utilization of natural gas for power production with CO2 capture and storage—Part 3: The combined carrier and onshore storage. Appl. Energy 2009, 86, 805–814. [Google Scholar] [CrossRef]
  14. TEBODIN. CO2 Liquid Logistics Shipping Concept (LLSC) Overall Supply Chain Optimization; Knowledge Sharing Report; TEBODIN: The Hague, The Netherlands, 2011. [Google Scholar]
  15. Monteiro, J. Co2asts—Carbon Capture, Storage and Transfer in Shipping; Co2ASTS Public Concise Report; EU Interreg V A programme: Strassbourg, France, 2020. [Google Scholar]
  16. Kossiakoff, A.; Sweet, W.; Seymour, S.; Biemer, S. Systems Engineering Principles and Practice, 2nd ed.; John Wiley & Sons Inc.: Hoboken, NJ, USA, 2011. [Google Scholar]
  17. Sanchez, R. Technology Readiness Assessment Guide doe g 413.3-4a; US Department of Energy: Washington, DC, USA, 2011. [Google Scholar]
  18. Bassano, C.; Deiana, P.; Vilardi, G.; Verdone, N. Modelling and economic evaluation of carbon capture and storage technologies integrated into synthetic natural gas and power-to-gas plants. Appl. Energy 2020, 263, 114590. [Google Scholar] [CrossRef]
  19. Cuellar-Franca, R.M.; Azapagic, A. Carbon capture, storage and utilization technologies: A critical analysis and comparison of their life cycle environmental aspects. J. CO2 Util. 2015, 9, 82–102. [Google Scholar] [CrossRef]
  20. Rubin, E.S.; Davidson, J.E.; Herzog, H.J. The cost of CO2 capture and storage. Int. J. Greenh. Gas Control. 2015, 40, 378–400. [Google Scholar] [CrossRef]
  21. Ros, J.; Doedee, V.; Van den Akker, J.; Vredeveldt, A.; Linders, M.; Goetheer, E.; Monteiro, J. Update on post-combustion carbon capture and storage on LNG fueled vessels. In Proceedings of the 15th Greenhouse Gas Control Technologies Conference, Cheltenham, UK, 15–18 March 2021. [Google Scholar]
  22. OCAP. Over OCAP. 2020. Available online: https://www.ocap.nl/nl/overocap/index.html (accessed on 29 October 2020).
  23. Olfe-Krautlein, B.; Naims, H.; Bruhn, T.; Lorente Lafuente, A.; Tobias, M. CO2 as an Asset? 2014. Available online: http://publications.iass-potsdam.de/pubman/item/escidoc:620894:4/component/escidoc:844891/IASS_Fact_Sheet_2014_2_en.pdf (accessed on 18 February 2020).
  24. Equinor. Northern Lights ccs. 2020. Available online: https://northernlightsccs.com/en (accessed on 29 October 2020).
  25. GrandView Research. Carbon Dioxide Market Size, Share & Trends Analysis Report. 2020. Available online: https://www.grandviewresearch.com/industry-analysis/carbondioxide-market (accessed on 18 February 2020).
  26. Asen, E. Carbon Taxes in Europe. 2019. Available online: https://taxfoundation.org/carbon-taxes-in-europe-2019/ (accessed on 29 October 2020).
  27. Timmermans, F. Speech by Frans Timmermans at COP26 Carbon Pricing in the European Union: An Invitation to the World. 2021. Available online: https://www.edf.org/media/cop26-ends-strong-result-carbon-markets-and-international-call-action-most-urgent-climate (accessed on 5 November 2021).
  28. Dosen, H.C.; Langeland, J. Offshore Freight Rate Determinants. Master’s Thesis, Norwegian School of Economics, Bergen, Norway, 2015. Available online: https://openaccess.nhh.no/nhh-xmlui/bitstream/handle/11250/300120/MasterThesis.PDF?sequence=1&isAllowed=y (accessed on 29 October 2020).
  29. Kler, R.D.; Neele, F.; Nienoord, M.; Brownsort, P.; Koorneef, J.; Belfroid, S.; Peters, L.; Wijhe, A.V.; Loeve, D. Transportation and Unloading of CO2 by Ship—A Comparative Assessment; WP9FinalreportCO2Shipping, CATO2 programme; TNO: Utrecht, The Netherlands, 2016. [Google Scholar]
  30. Lloyds Register & UMAS. Zero Emission Vessels 2030. How Do We Get There? Low Carbon Pathways 2050 Series, London. 2017. Available online: https://www.lrs.or.jp/news/pdf/LR_Zero_Emission_Vessels_2030.pdf (accessed on 5 November 2021).
  31. McKinnon, A. CO2 Emissions from Freight Transport in the UK; Commission for Integrated Transport: London, UK, 2007. [Google Scholar]
Figure 1. Research methodology incl. structure of the paper and sub research questions, adopted from [17].
Energies 15 00813 g001
Figure 2. Graphical overview of technically feasible supply chain paths. The € symbol from OSV to pipeline indicates that this is a possible route, but very costly.
Energies 15 00813 g002
Figure 3. Results scenario 1.1. Payback time in years. Conditions marked with an X have a payback time >30 years, which equals the typical lifetime of a vessel.
Energies 15 00813 g003
Figure 4. Results scenario 4.3. Best result from first iteration.
Energies 15 00813 g004
Figure 5. Results second iteration: scenario 7, 8 and 9.
Energies 15 00813 g005
Figure 6. Visualization of supply chain from case study (own figure).
Energies 15 00813 g006
Figure 7. Payback period scenarios.5 year payback time as feasibility criterion.
Energies 15 00813 g007
Table 1. Technical feasibility of the supply chain of ship-based carbon capture.
TRLSaCoScAv
Capture
Fixed tanks independent92111
Fixed tanks integral93111
containers92111
Offshore Transportation
Liquid gas carriers63211
Own vessel92313
Offshore supply vessel93222
Storage barge63211
Onshore Transportation
Pipeline93322
Road92233
Rail92223
Inland waterway93311
Utilization
Materials: solvents/pharmaceuticals/fertilizer/urea93322
Direct: Dry ice, beverages, fire extinguishers93322
Horticulture93322
Sequestration onshore91311
Sequestration offshore93311
Note: Sa = Safety; Co = Compatibility; Sc = Scalability; Av = Availability.
Table 2. Predicted daily amount of storage needed at a 96 MW crane vessel for different operational conditions (Heerema n.d.).
Operational ModeCO2 [tonne/day]CO2 [m3/day]
Working8072.66
Sailing11099.91
Idle2724.52
Port3531.79
Table 3. Effect on payback time from variations of scenario parameters.
Effect on Payback Time of:MinMax
Onboard storage × 2−20%−65%
Offshore distance × 2 for COC €100+25%+130%
Offshore distance × 2 for COC €75+60%+75%
Cost of Capture −25%−17%−60%
Onshore distance × 20%+14%
Table 5. Results case study.
Results of Full Case Study (1 Year)ValueUnit
Total distance traveled by OSV/LGC2517Km
Total distance traveled via pipeline629Km
Total amount of CO2 emitted by supply chain6884tonne
Total amount of CO2 saved with respect to business as usual29,200tonne
Costs for shipowner without carbon capture5,407,000
Cost of supply chain per year655,121
Total profit per year4,753,000
Publisher’s Note: MDPI stays neutral with regard to jurisdictional claims in published maps and institutional affiliations.

