1. Introduction
A challenge and opportunity of the energy transition to renewable energy is the participation of citizens in both the production and ownership of renewable energy assets. As the European Union (EU) recently increased the percentage of 2030 key targets to 40 per cent with the “Fit for 55” package [
1], focusing on the involvement of the private sector and the citizens, new regulations were put in place. In the context of “Clean Energy for all Europeans”, the recasts of the Renewable Energy Directive (REDII) [
2] and the Electricity Market Directive (EMD) [
3] provide new opportunities for the activities of individual and Collective Self-Consumption (CSC) as well as for Renewable Energy Communities (RECs) and Citizen Energy Communities (CECs). These concepts provide the framework for citizens to collectively participate in the energy system and give the chance for a new type of initiatives to rise. Thereby, citizens can use this new legal framework in order to participate in the energy market, contributing to an increased decentralized renewable energy production and consumption (prosumption).
LEMs offer a platform to exchange energy locally [
4]. An extended review on LEMs [
5] mentions that small producers were excluded from the energy market in the past because of legislative restrictions. Local electricity markets provide a solution to this issue by creating a local market platform to the residents of a community which balances locally electricity production with consumption. In most of the reviewed literature [
6], LEMs are posed as a market solution for the integration of the continuously increasing small renewable production units in the distribution system. The concept of LEM is directly linked with the emergence of the economic entity of the energy prosumer as it is a structural component that is required to foster an electricity market player in a LEM.
The integration of renewable energy in the grid requires the decentralization of power system control aided by further evolution of microgrids [
7]. Microgrids pose an innovative solution to foster community microgrids or energy communities [
8] and also facilitate rural electrification [
9]. Community Renewable Energy (CRE), as defined in [
10], can be a decisive factor in the energy transition. A similar case to the one considered in this paper is the study case of [
11] which provides a design of how to create a community-based microgrid and pricing, which increases social welfare. This is a case of a microgrid connected to the public grid, similar to other two papers [
12,
13]. Another paper [
14] proposes a P2P autonomous community model for prosumers based on an energy contract that leads to a win-win situation for all stakeholders. Research has been carried out recently [
15] concerning the control of the energy flow of community microgrids. Other studies [
16] suggest that a community microgrid with prosumers with PVs can reduce the cost of electricity by 30 percent as PV penetration gets maximized by multiple simultaneous demand and offer.
Off-grid microgrid applications are studied mainly for countries of the global south, such as the work of [
17] which uses data from communities in Nepal to develop a DC off-grid microgrid using HOMER and SIMULINK as simulation tools. The research of [
18] studies the possibility of demand side-management in off-grid rural electrified areas in Tanzania, classifying loads in four different categories. The research of [
19] is insightful as it proposes a photovoltaic-based off-grid microgrid for communities of Nigeria which aims to increase social welfare in the community. Relevant research [
20] focuses on off-grid cases in Africa and examines the cost of energy for users comparing Solar Home Systems (SHSs) to grid powered by PV or diesel generators and grid connected solutions: “SHSs are the cheapest option for small levels of consumption, grid connection is the cheapest for large levels, and mini-grids occupy the middle range”. Paper [
21] examines solutions to the problem of sizing energy production assets in off-grid systems with both economical and functional criteria. Finally, the work of [
22] studies the resilience of two off-grid microgrids in Latin America and concludes as follows: “Communities benefit from more robust distribution systems that can endure technical, social, economic, and environmental disturbances without losing functionality and can quickly be restored to normal operating conditions”.
This paper investigates the creation of an off-grid community microgrid in combination with a local energy market in a community in south Europe. Off-grid community microgrids is a promising solution to rural electrification and energy transition which has not been researched in depth. This paper contributes in three fields of research: (1) In the field of research on community microgrids by exploring first the social and technical constraints of the selected existing community of LMRA and then proposing a microgrid and a market according to the needs of the community. The proposed microgrid and market have two important characteristics: The off-grid architecture and collective management and ownership of resources. This work reinforces the research on energy issues taking into consideration real social factors. (2) In the field of LEMs based on DL technologies by simulating its function on the proposed off-grid community microgrid. (3) In the interconnection of many different, already installed, autonomous electrical systems and new consumers into one community microgrid, aiming to find solutions to rural electrification by applying new methods, such as LEMs, in combination with existing simple infrastructure.
2. Materials and Methods
2.1. Methodology
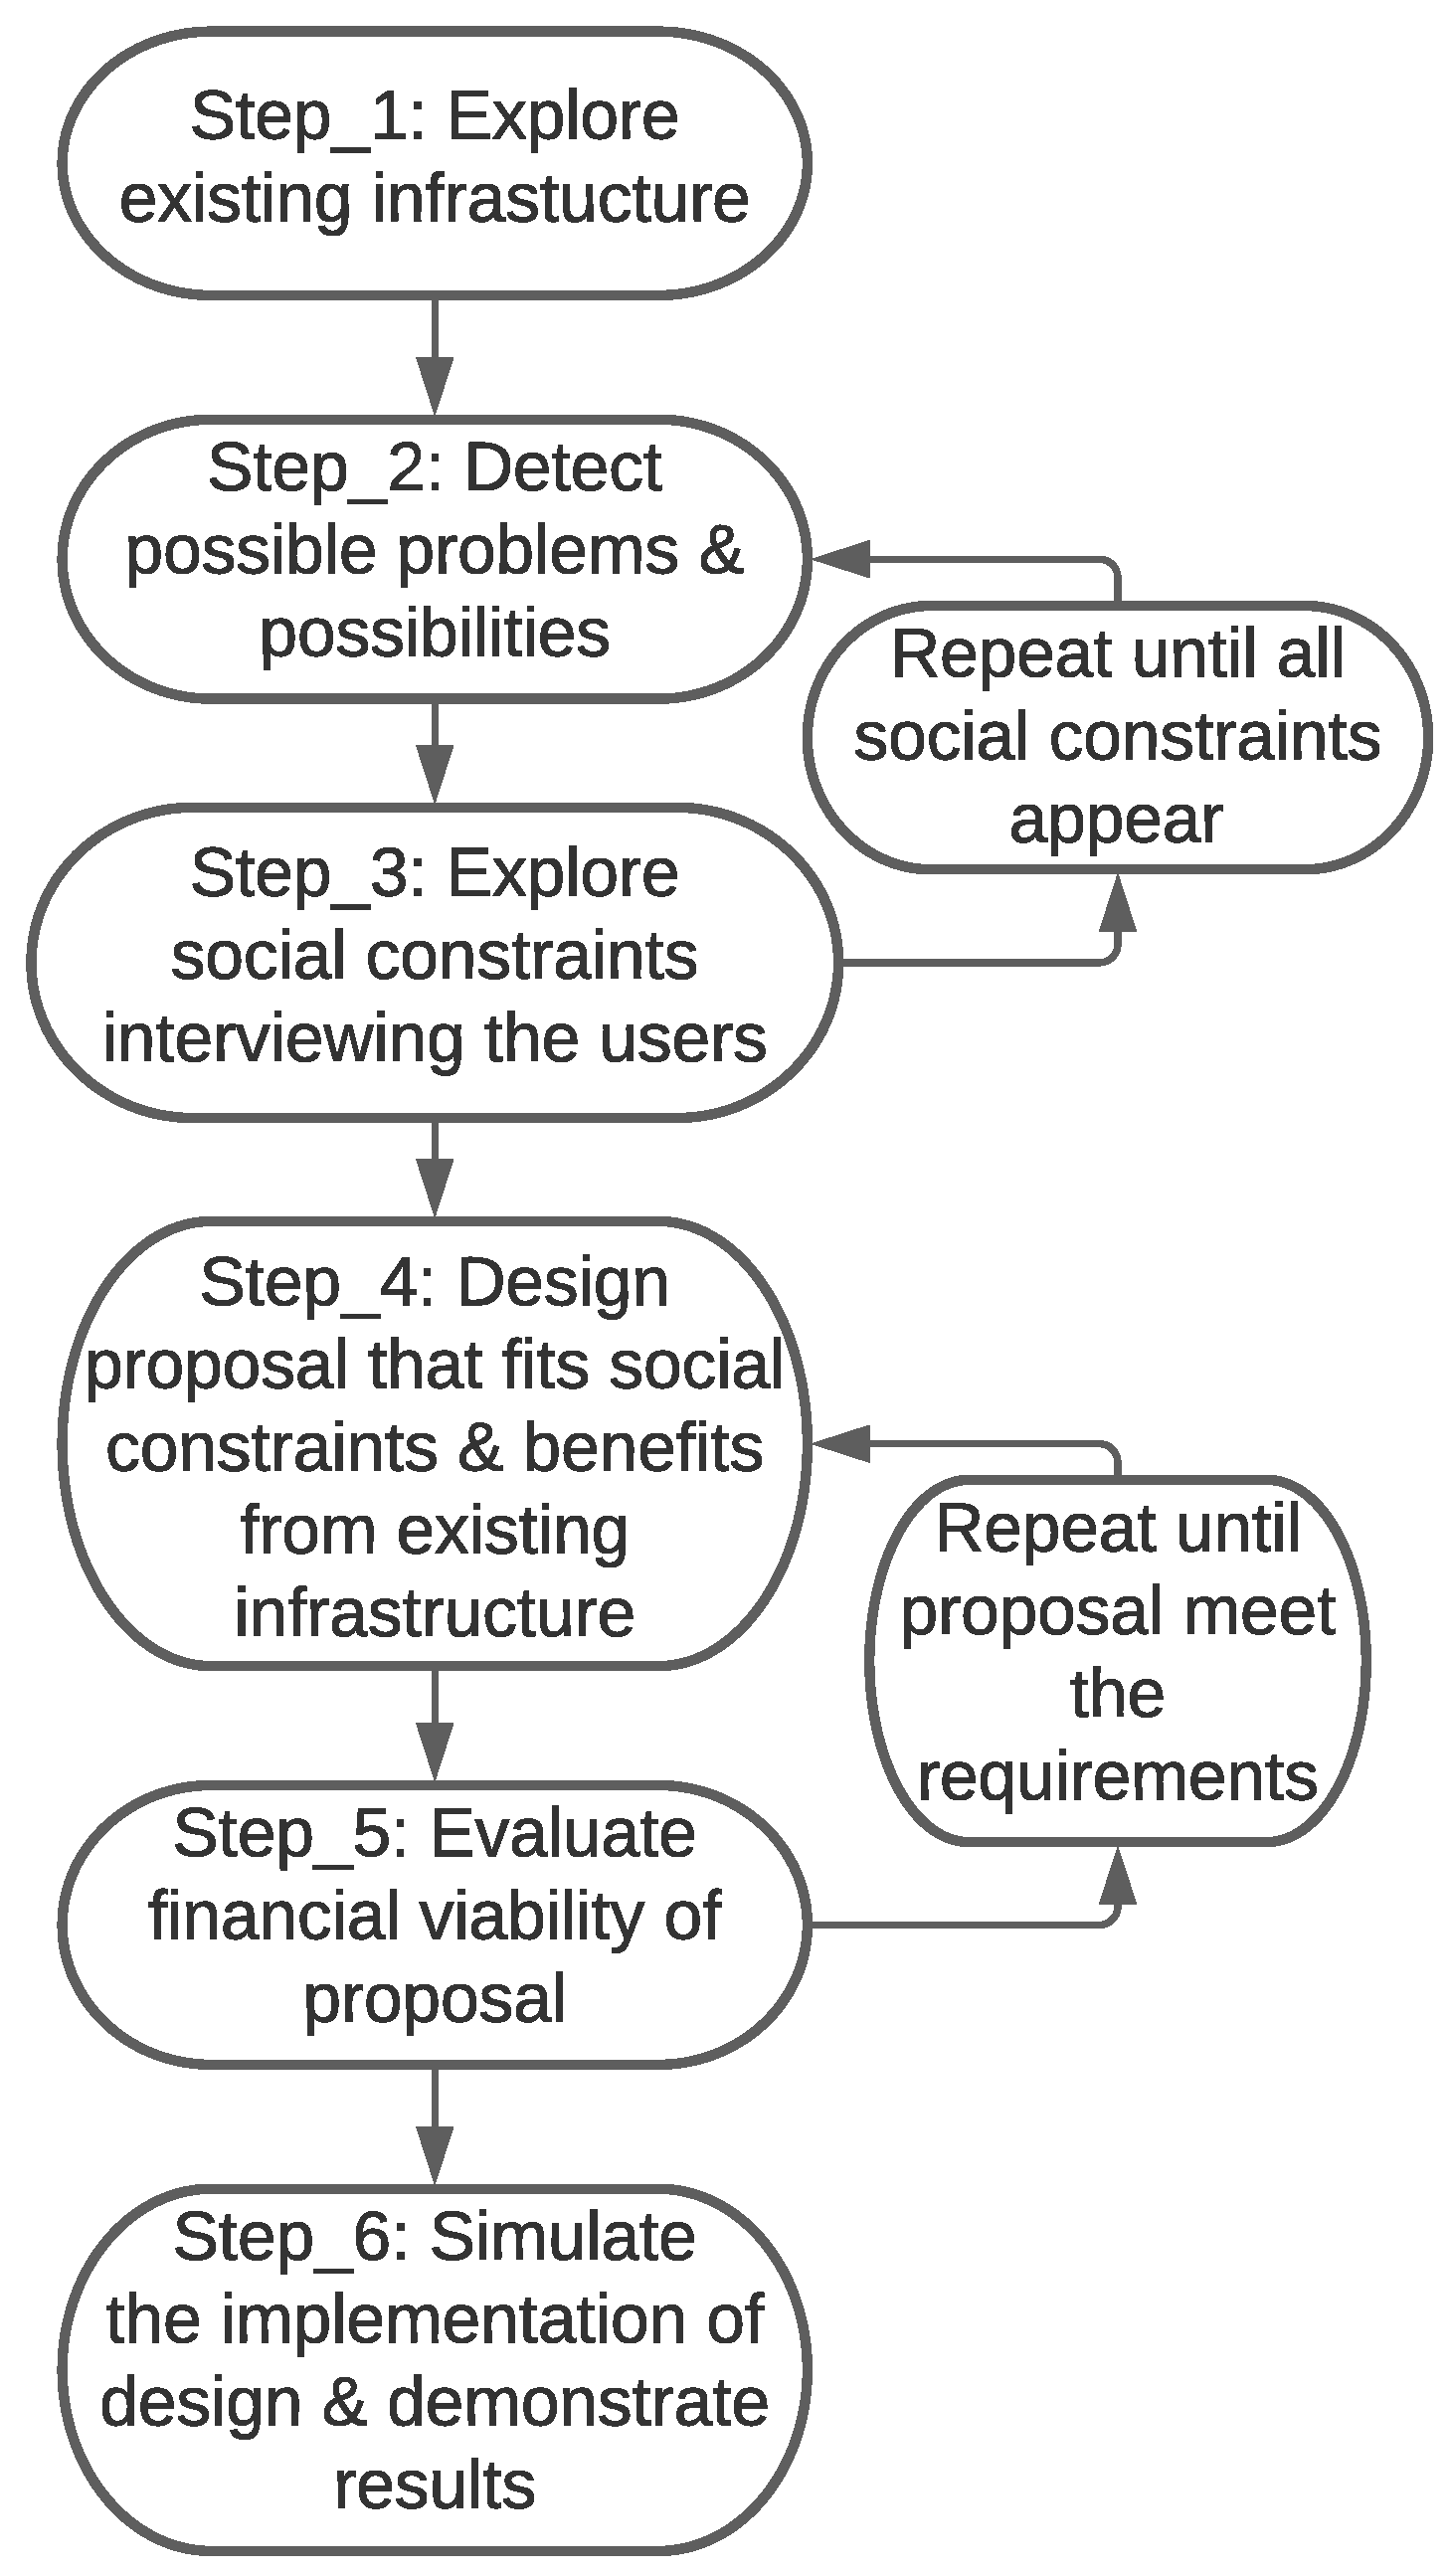
The method used for taking into account both technical and social constraints of our case is demonstrated in
Figure 1. The first step is to explore and list the existing infrastructure of the selected community. The second step is to detect the existing problems in the use of this infrastructure and detect possible solutions and the possibilities for an intervention. The third step is to explore the social context of the case and find the constraints by interviewing the users of the infrastructure, which in our case are the ones who are going to possibly implement the designed microgrid. Steps 2 and 3 should be repeated until all social constraints appear. The fourth step is to design a proposal that takes into account all the social constraints and benefits from the existing infrastructure. The fifth step is to evaluate the financial viability of the proposal. After this step, there is a feedback loop to the previous step until the proposal meets the requirements. Once the proposal is ready, the last step is to simulate the implementation of the proposal and demonstrate the results.
2.2. Social and Technical Constraints of Research
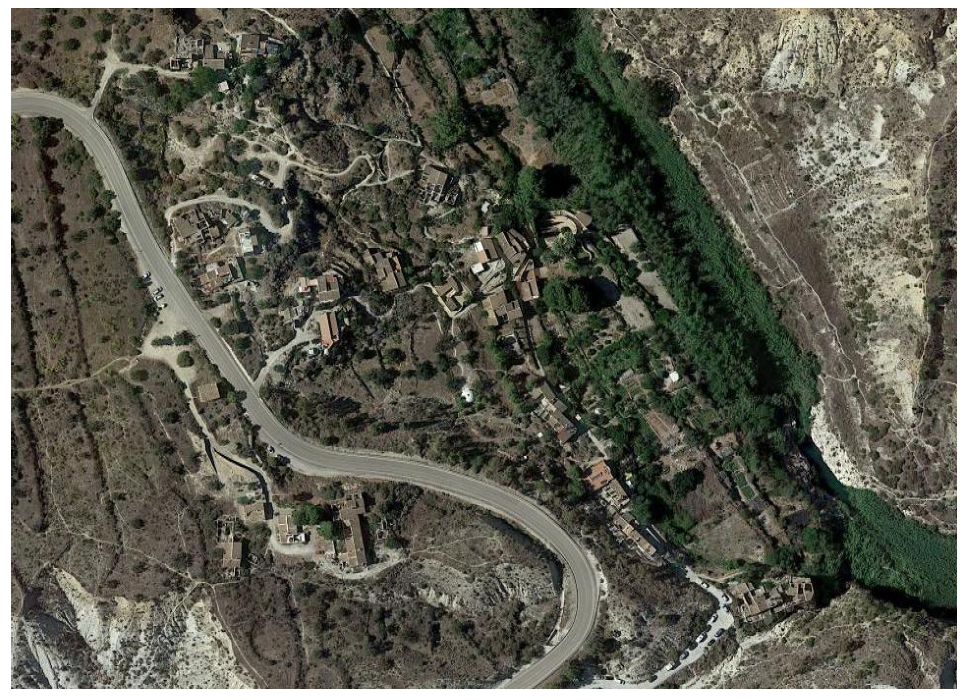
This work studies the creation of a microgrid and a LEM in the village LMRA, belonging in the province of Almeria in the south of Spain (
Figure 2). The following characteristics of the community provides a favorable case for the study.
- (a)
The appropriate energy infrastructure of the village, which consists of 14 autonomous solar house systems, not interconnected with each other.
- (b)
Personal working experience of the first author on site, which provides a good understanding of the community in the following aspects: (1) If this community is appropriate for a Local Energy System (LES), (2) an understanding of the cultural and environmental interests of the villagers, and (3) the interrelation of the various community activities.
- (c)
The possibility of actual implementation of this study case by the community of users in LMRA because of the existence of a technological investigation center in the location, Sunseed Desert Technology.
Some salient features of this case study are:
- (a)
LMRA is situated in one of the sunniest areas of Europe with an average direct beam nominal radiance of 800 W/
(provided by PVGIS [
23]), therefore PV is selected as the most suitable renewable source of power.
- (b)
The residents prefer self-consumption and self-production of electrical energy as part of a self-governance strategy of the community.
- (c)
Ecology is a high principle among residents, so they would like to minimize the use of diesel fuel for generators.
A bottom-up approach based on the typical electrical devices found in homes is used to estimate the magnitudes of electrical load profiles [
24,
25]. A survey is performed to obtain an inventory of the houses’ appliances and those they wish to acquire in future. The load for a given house
i is calculated by Equation (
1):
where
is the total number of appliances owned by the interviewed sample user.
is the power rating of the appliance of this house and
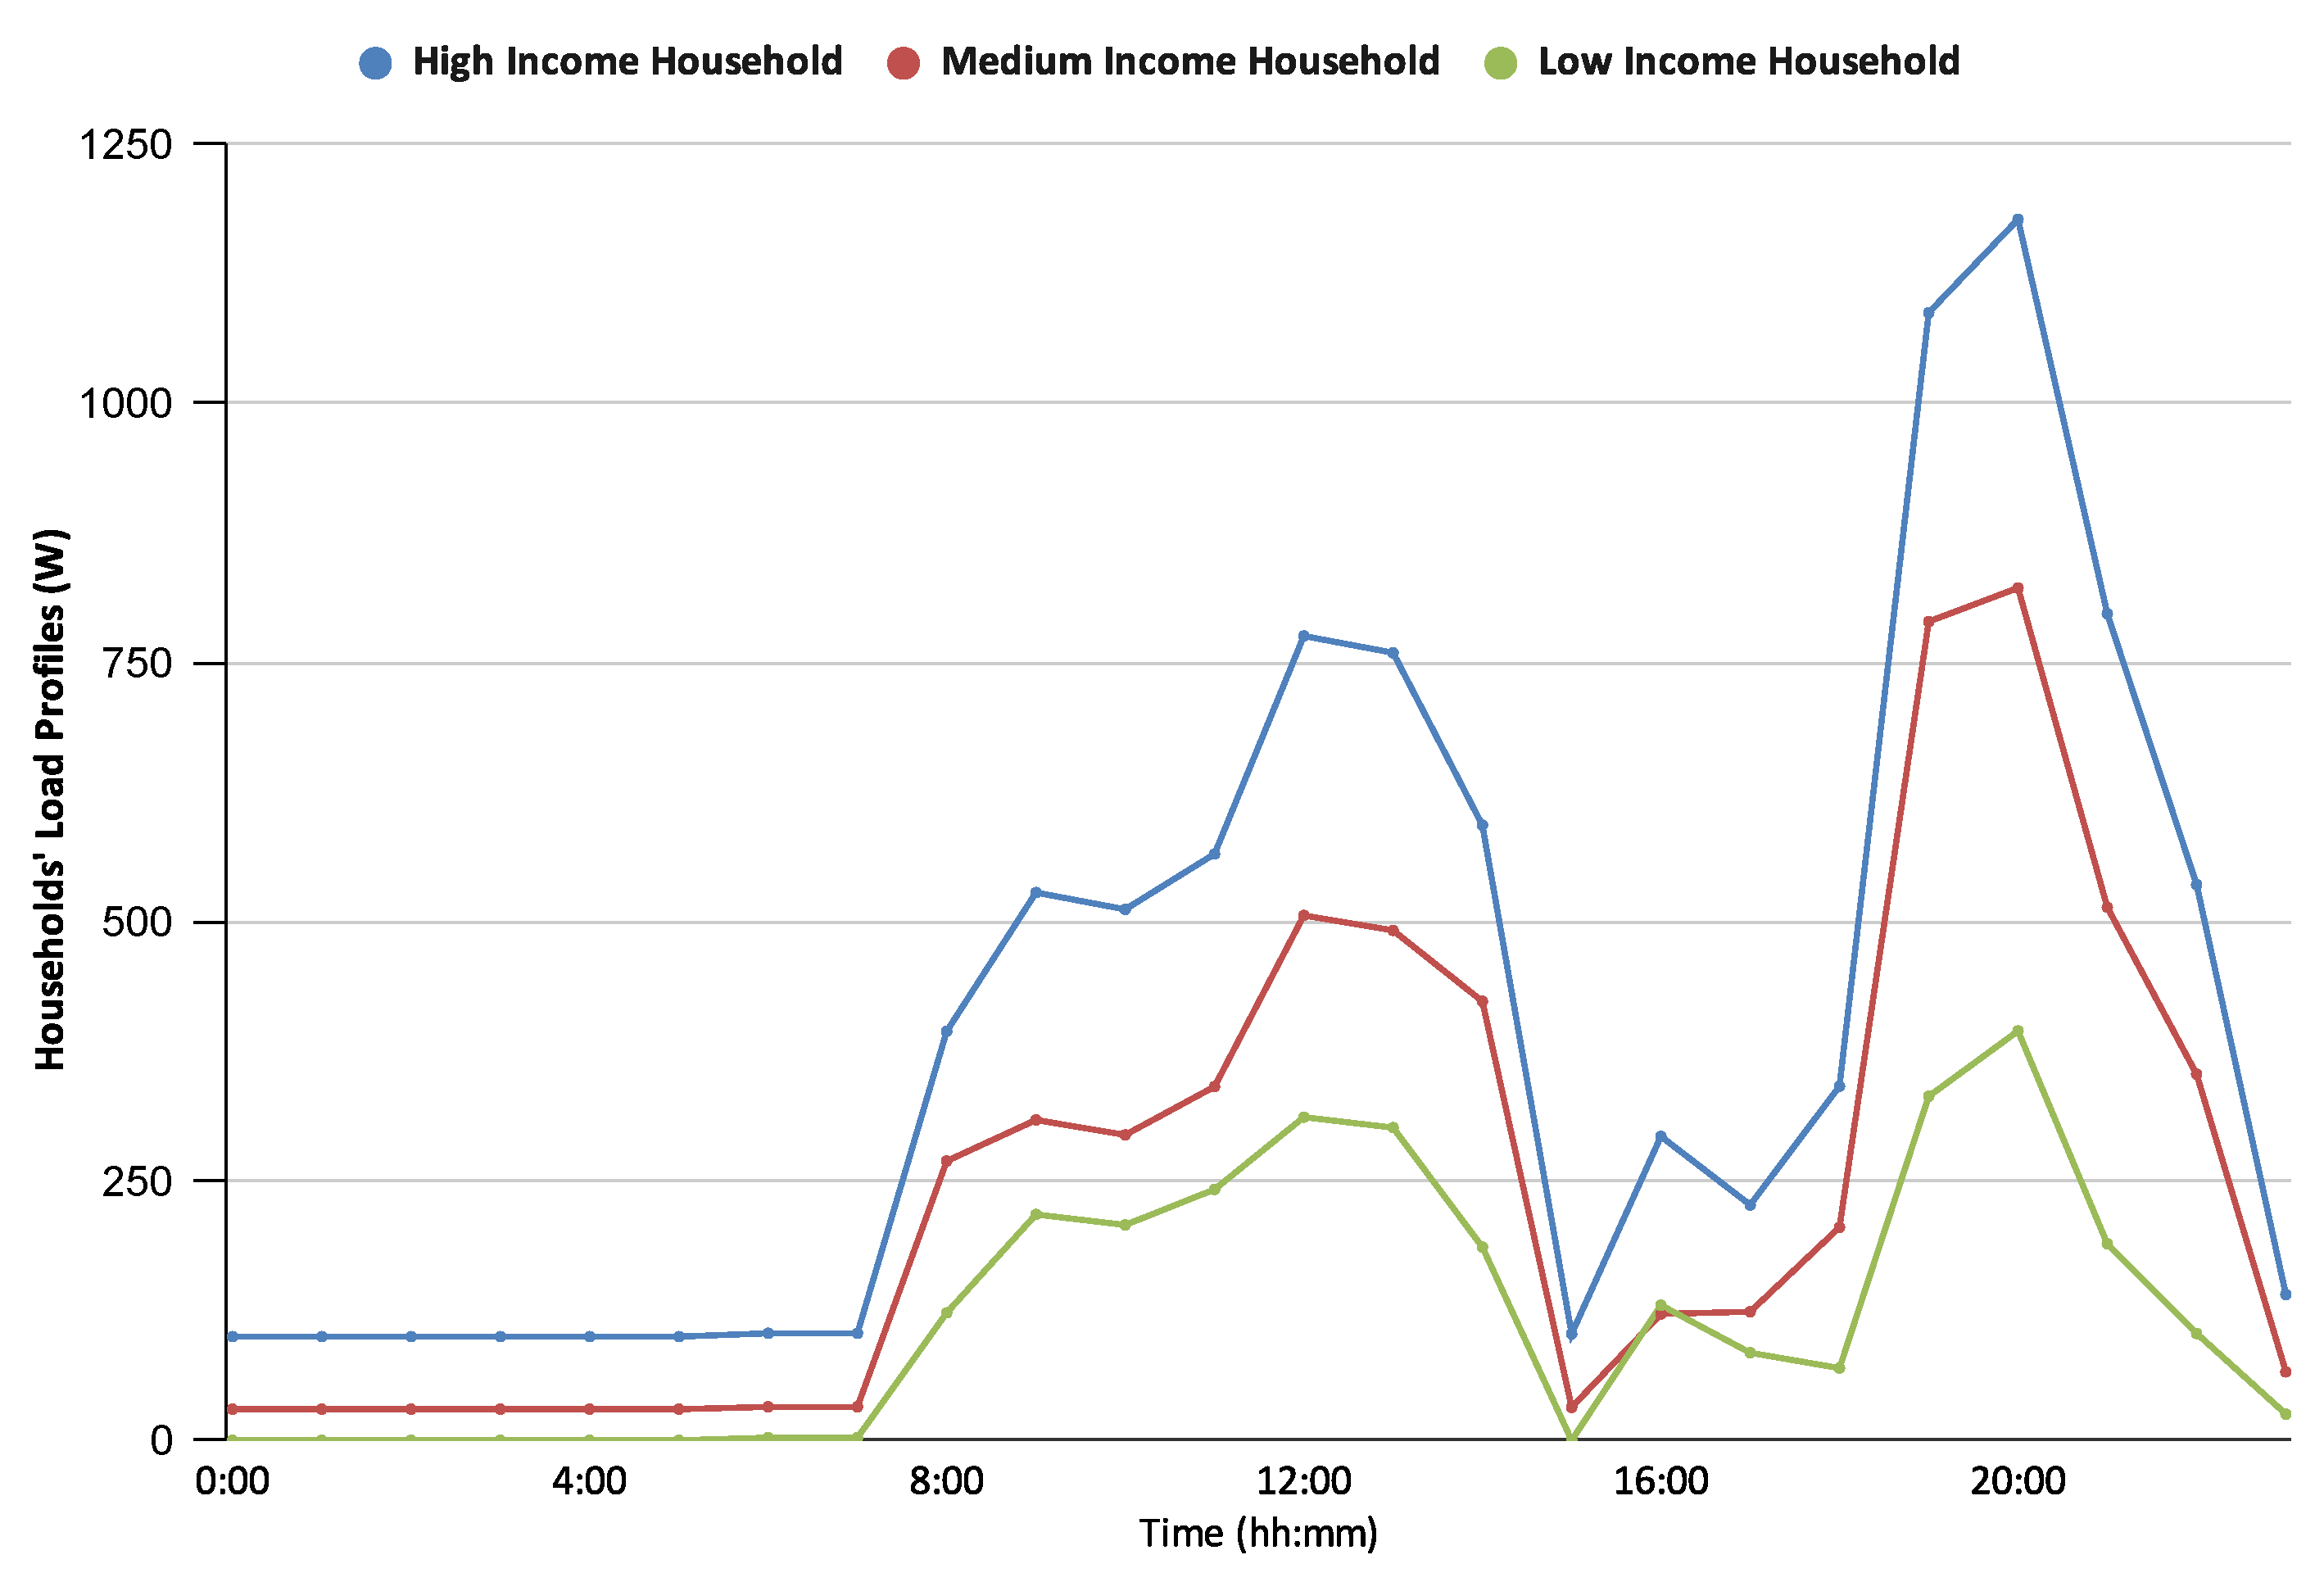
is the approximate daily time of usage of the specific appliance. The users are categorized according to their electricity needs in 3 categories: High Consumption Profile with, on average, 293 kWh/month, Medium Consumption Profile with, on average, 180 kWh/month, and Low Consumption Profile with, on average, 89 kWh/month with the daily load profile demonstrated in
Figure 3. In these three categories, different numbers of devices were introduced and based on an approximate daily time of usage using coincidence factor 0.85 of all loads, a daily and yearly load profile of a unified LMRA grid was created. The total AC loads of the proposed microgrid consist of: Number of High Consumer Profile: 5 (28 per cent), number of Medium Consumer Profile: 3 (17 per cent) that have loads during the whole year, 6 (33 per cent) that have loads only for some months, and number of Low Consumer Profile: 4 (22 per cent). In LMRA, there are some potential new connections/loads which are 3, (one Low, one Medium, and one High Consumption Profile). In summary, there are three different entities: (A) 14 prosumers with PVs and storage of which, 8 also have diesel generators and (B) 4 consumers which already buy excessive energy from prosumers with private agreements. (C) Three possible new consumers which need to buy energy to cover their demand. In the end, the following data were gathered: The total existing assets of LMRA are: 14 sets of batteries with a total 259.08-kWh capacity, 14 sets of PVs of total of 15 kWp, 8 diesel generators, 6 kWp in total, and 18 buildings with a total of 30,348.2 kWh consumption per year, of which approximately 16 per cent is covered by the diesel generators (
Table 1).
2.3. Designing the Microgrid
The objective of the design is to create a more sustainable and stable way to electrify the village of LMRA in a cost-efficient way, taking into consideration the local social and technical constraints. The design includes the existent assets of the houses, adding communal assets in order to form a microgrid (PV and storage). The aim is through the interconnection of the existing autonomous SHSs with the communal assets to take advantage of the maximum production from renewable resources. Moreover, in this way the “new” houses/clients will also avoid the purchase of individual assets but the microgrid will provide them electricity through the excess of individual electrical systems.
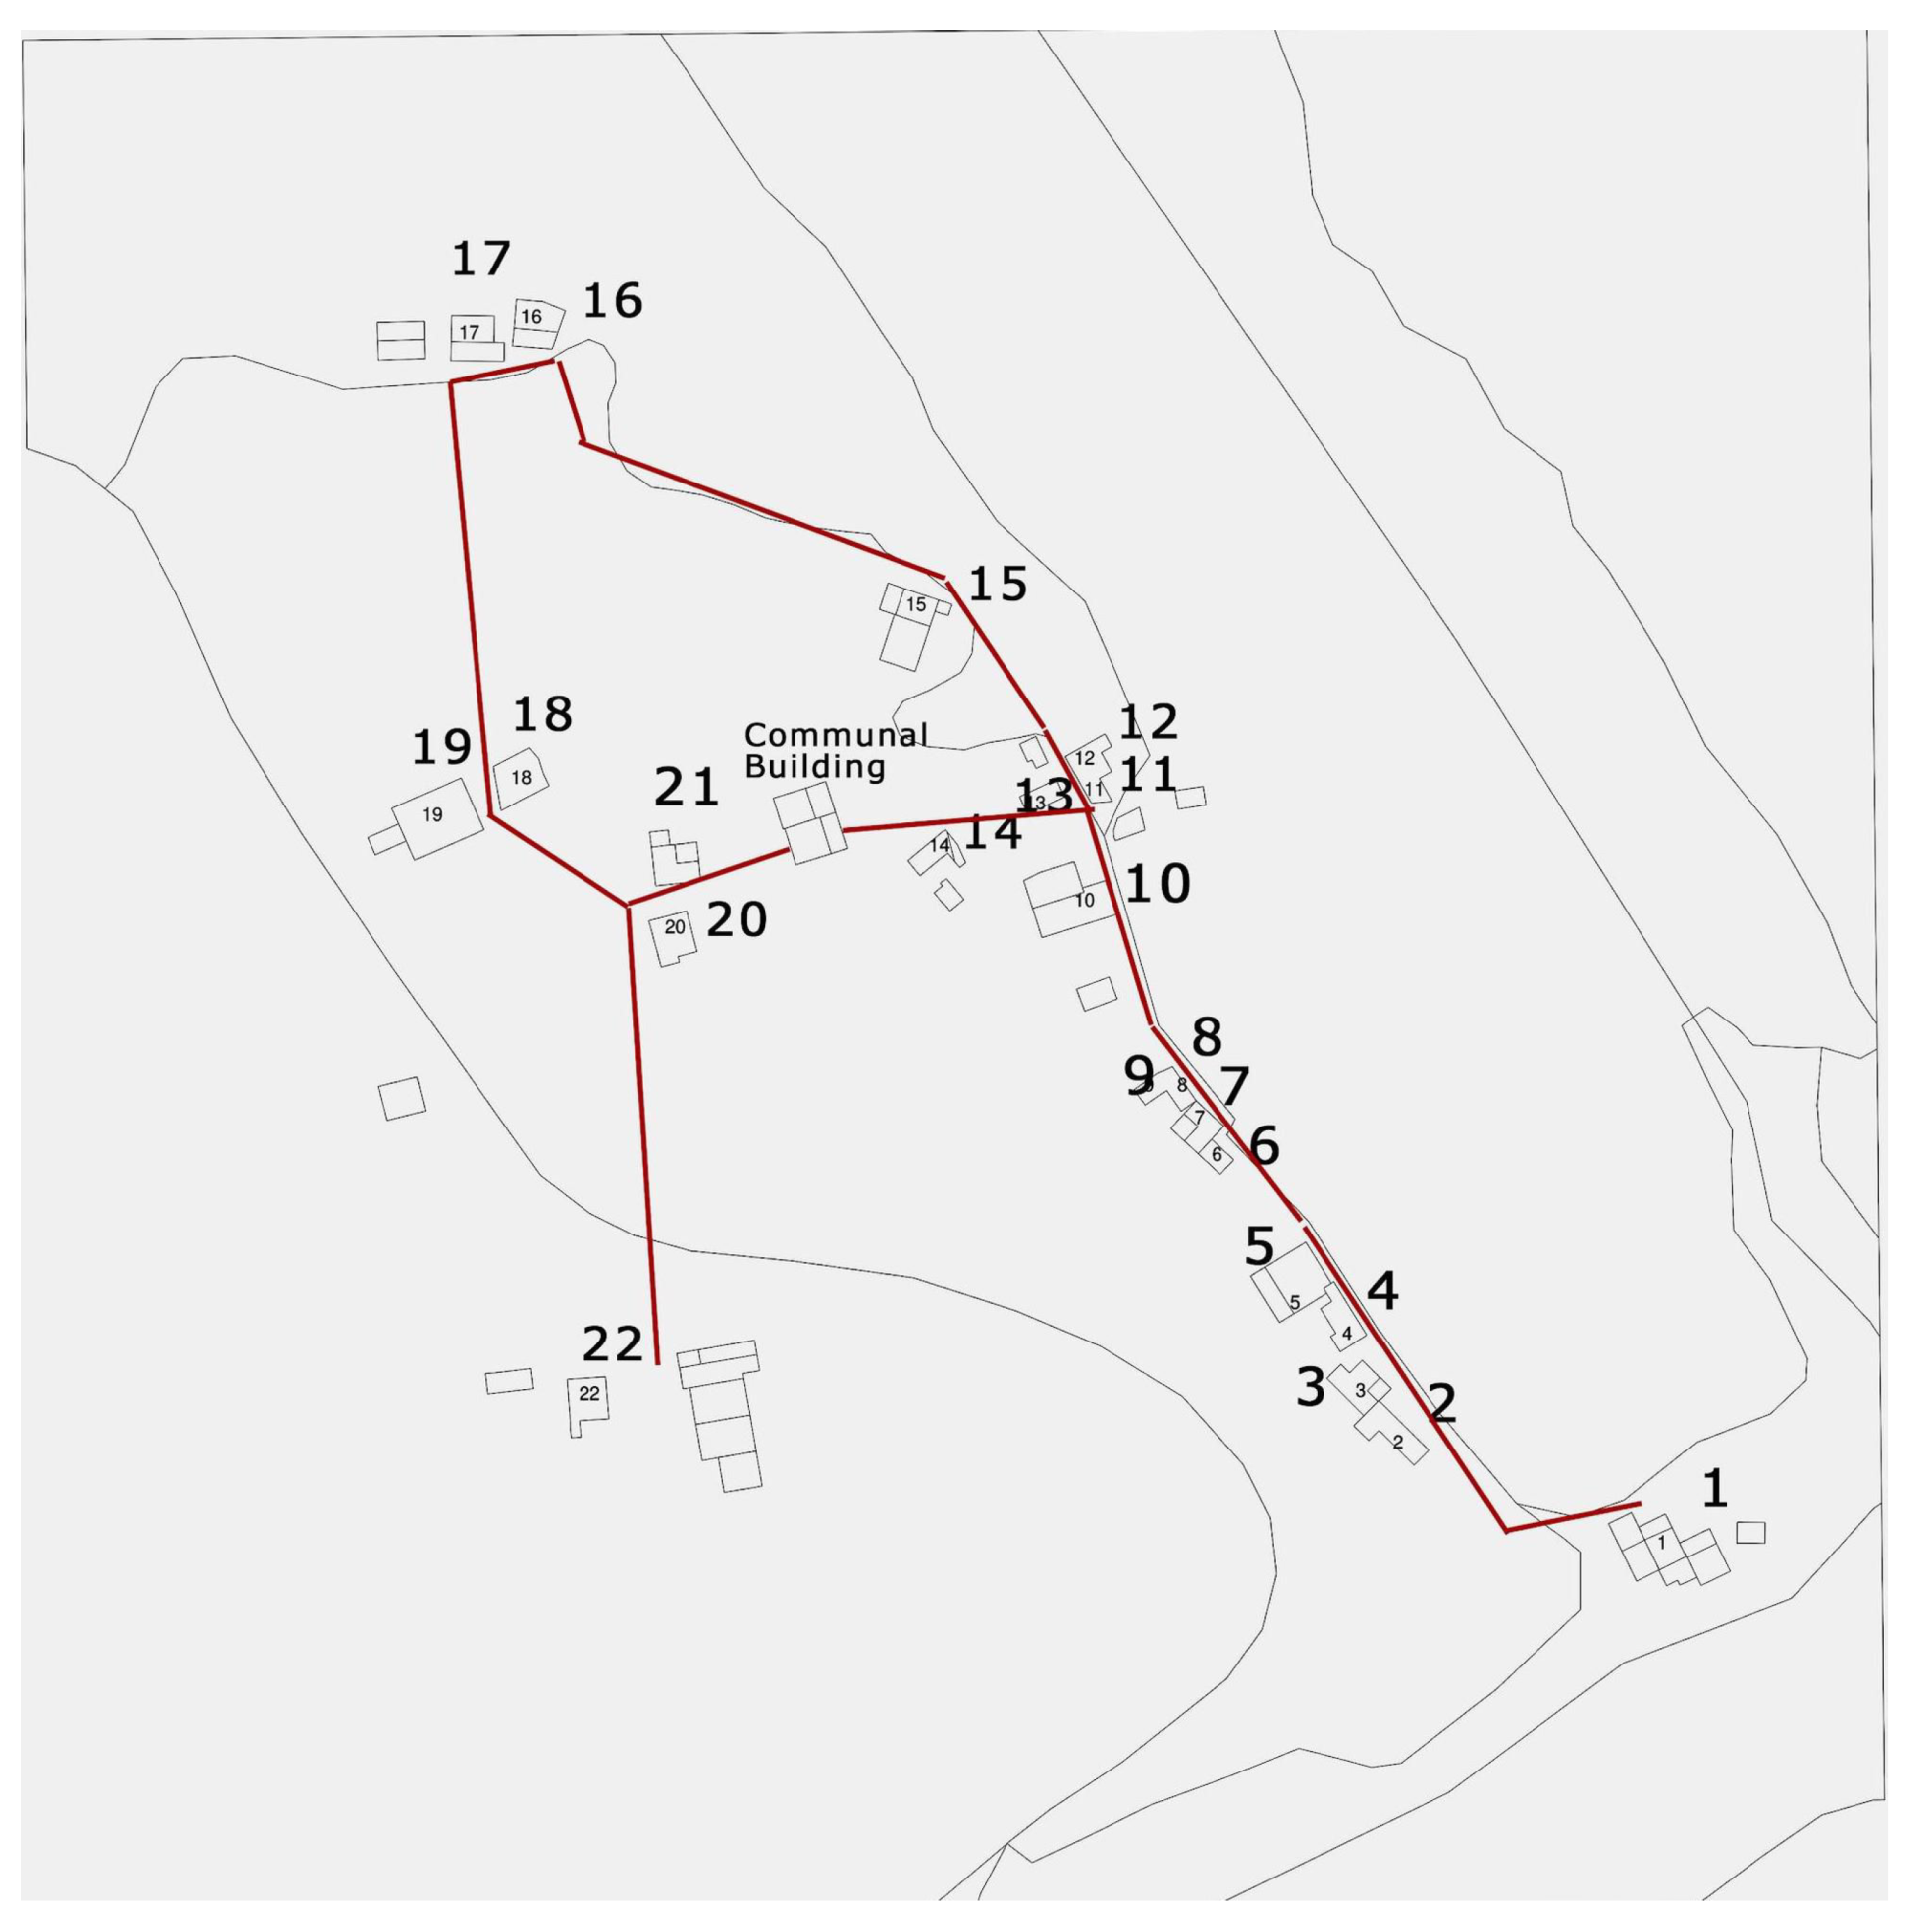
The study case investigates the development of the case for 20 years. The design is taking into consideration the assumption of the rising need for electricity in existing loads for the following 20 years by 10 percent and 3 new houses. This leads to a new total average per year load of the microgrid, which is 41,504.07 kWh, therefore more assets are required. The daily total load of all houses is similar to the load profile of each household’s profile with the addition of a 10 percentage daily variation, without the addition of any community load. The design focuses on the communal management of energy so two new communal assets are proposed, communal PVs and communal storage (batteries) in order to cover the extra 15 MWh/year of consumption. These technologies are already applied in the community and have proven to be a reliable source of electrification. The map of the designed microgrid based on the real location of the houses is presented in
Figure 4.
In the design, the replacement of existing inverters is considered with new inverters that are able to function in parallel, combined with controllers to control the power flow. The users of the microgrid will be interconnected with the development of Low Voltage (LV) distribution lines.
2.4. Sizing and Simulating the Communal Assets
In this section, the appropriate sizing of communal assets is performed. The design determines the best possible, or optimal, system that satisfies the user-specified constraints at the lowest total Life-cycle Cost (LC), given a maximum loss-of-load-probability value [
26]. This cost is the present value of the initial, component replacement, operation, maintenance, and fuel costs. The National Renewable Energy Laboratory (NREL) optimization computer model for distributed power, “HOMER”, is used. The simulation tests any combinations of the system components to determine the size of the PV arrays and storage.
The best solution that addresses load requirements corresponds to 15.4 kWp of new PV and 50 kWh of storage, which leads to 95 percent renewable penetration in energy production. The LC of the system is 41.275 €, the initial capital is 23.767 €, the operational, maintenance and fuel costs are 1.512 €/year, and the Levelized Cost of Energy (LCOE) of the system is 0.08 €/kWh. Distribution line development costs are calculated to 6000 €, which is added to the above. The proposed economic design is: (a) The communal assets are bought by the investment of all community members, (b) all community members contribute equally to the initial capital, (c) running costs are covered by the monthly earnings of the communal assets, and (d) once the initial capital is covered by the communal earnings, it will be returned to the community members. (e) Prosumers have their own earnings (depending on their consumption and production) and consumers are paying their bills to both prosumers and community assets.
In parallel, a base case scenario was developed in order to compare it with the proposed one. The base case scenario follows the concept of electrification as it is until now, staying not interconnected and off-grid, but upgrading its individual components in order to meet the raising needs of electricity and introducing three new autonomous SHSs for the electrification of the 3 new houses (
Table 2). The costs of upgrading the 14 SHSs is 44,750 euros and the cost of the new SHS is 23,600 euros resulting in 68,350 euros of investment, without adding running, maintenance, or replacement costs. There is a difference of 38,583 euros in investment cost between the investment of creating the microgrid (23,767 + 6000 = 29,767 euros) and this case. Moreover, the maintenance and replacement costs of individual systems are expected higher than of a larger communal system.
2.5. Designing and Simulating the Local Energy Market
A local energy market is proposed in order to foster the energy exchange between houses and between houses and communal assets. The aim of the local market is the welfare of the entire community, meaning better services of electricity during the year on a cheap price and cooperation between the members of the community based on a common-owned asset.
The market: (a) Creates contracts of use between the different users that compensate the different assets that each user is contributing to the grid (e.g., House A uses the energy of House B because House B has more PV panels); (b) regulates the priority of use of energy produced in the system; (c) compensates the members of the community for the capital investment of creating the system; (d) compensates the replacement and maintenance costs of the system; and (e) compensates the running costs of the system management (salaries, equipment, etc.).
Platform D3A [
27] from grid singularity offers a modeling that met the needs of the case. D3A platform is based on distributed ledger technologies in which the users exchange energy using smart contracts. The market functions on a two-sided biding market. Blockchain can optionally be enabled on simulations running locally with the backend code base. The current basic blockchain integration uses substrate [
28]. Substrate has components called pallets, where each pallet can represent different functionality, such as smart contracts, storage, and auctions. Currently, the integration of D3A includes a storage pallet that provides immutable storage of executed transactions.
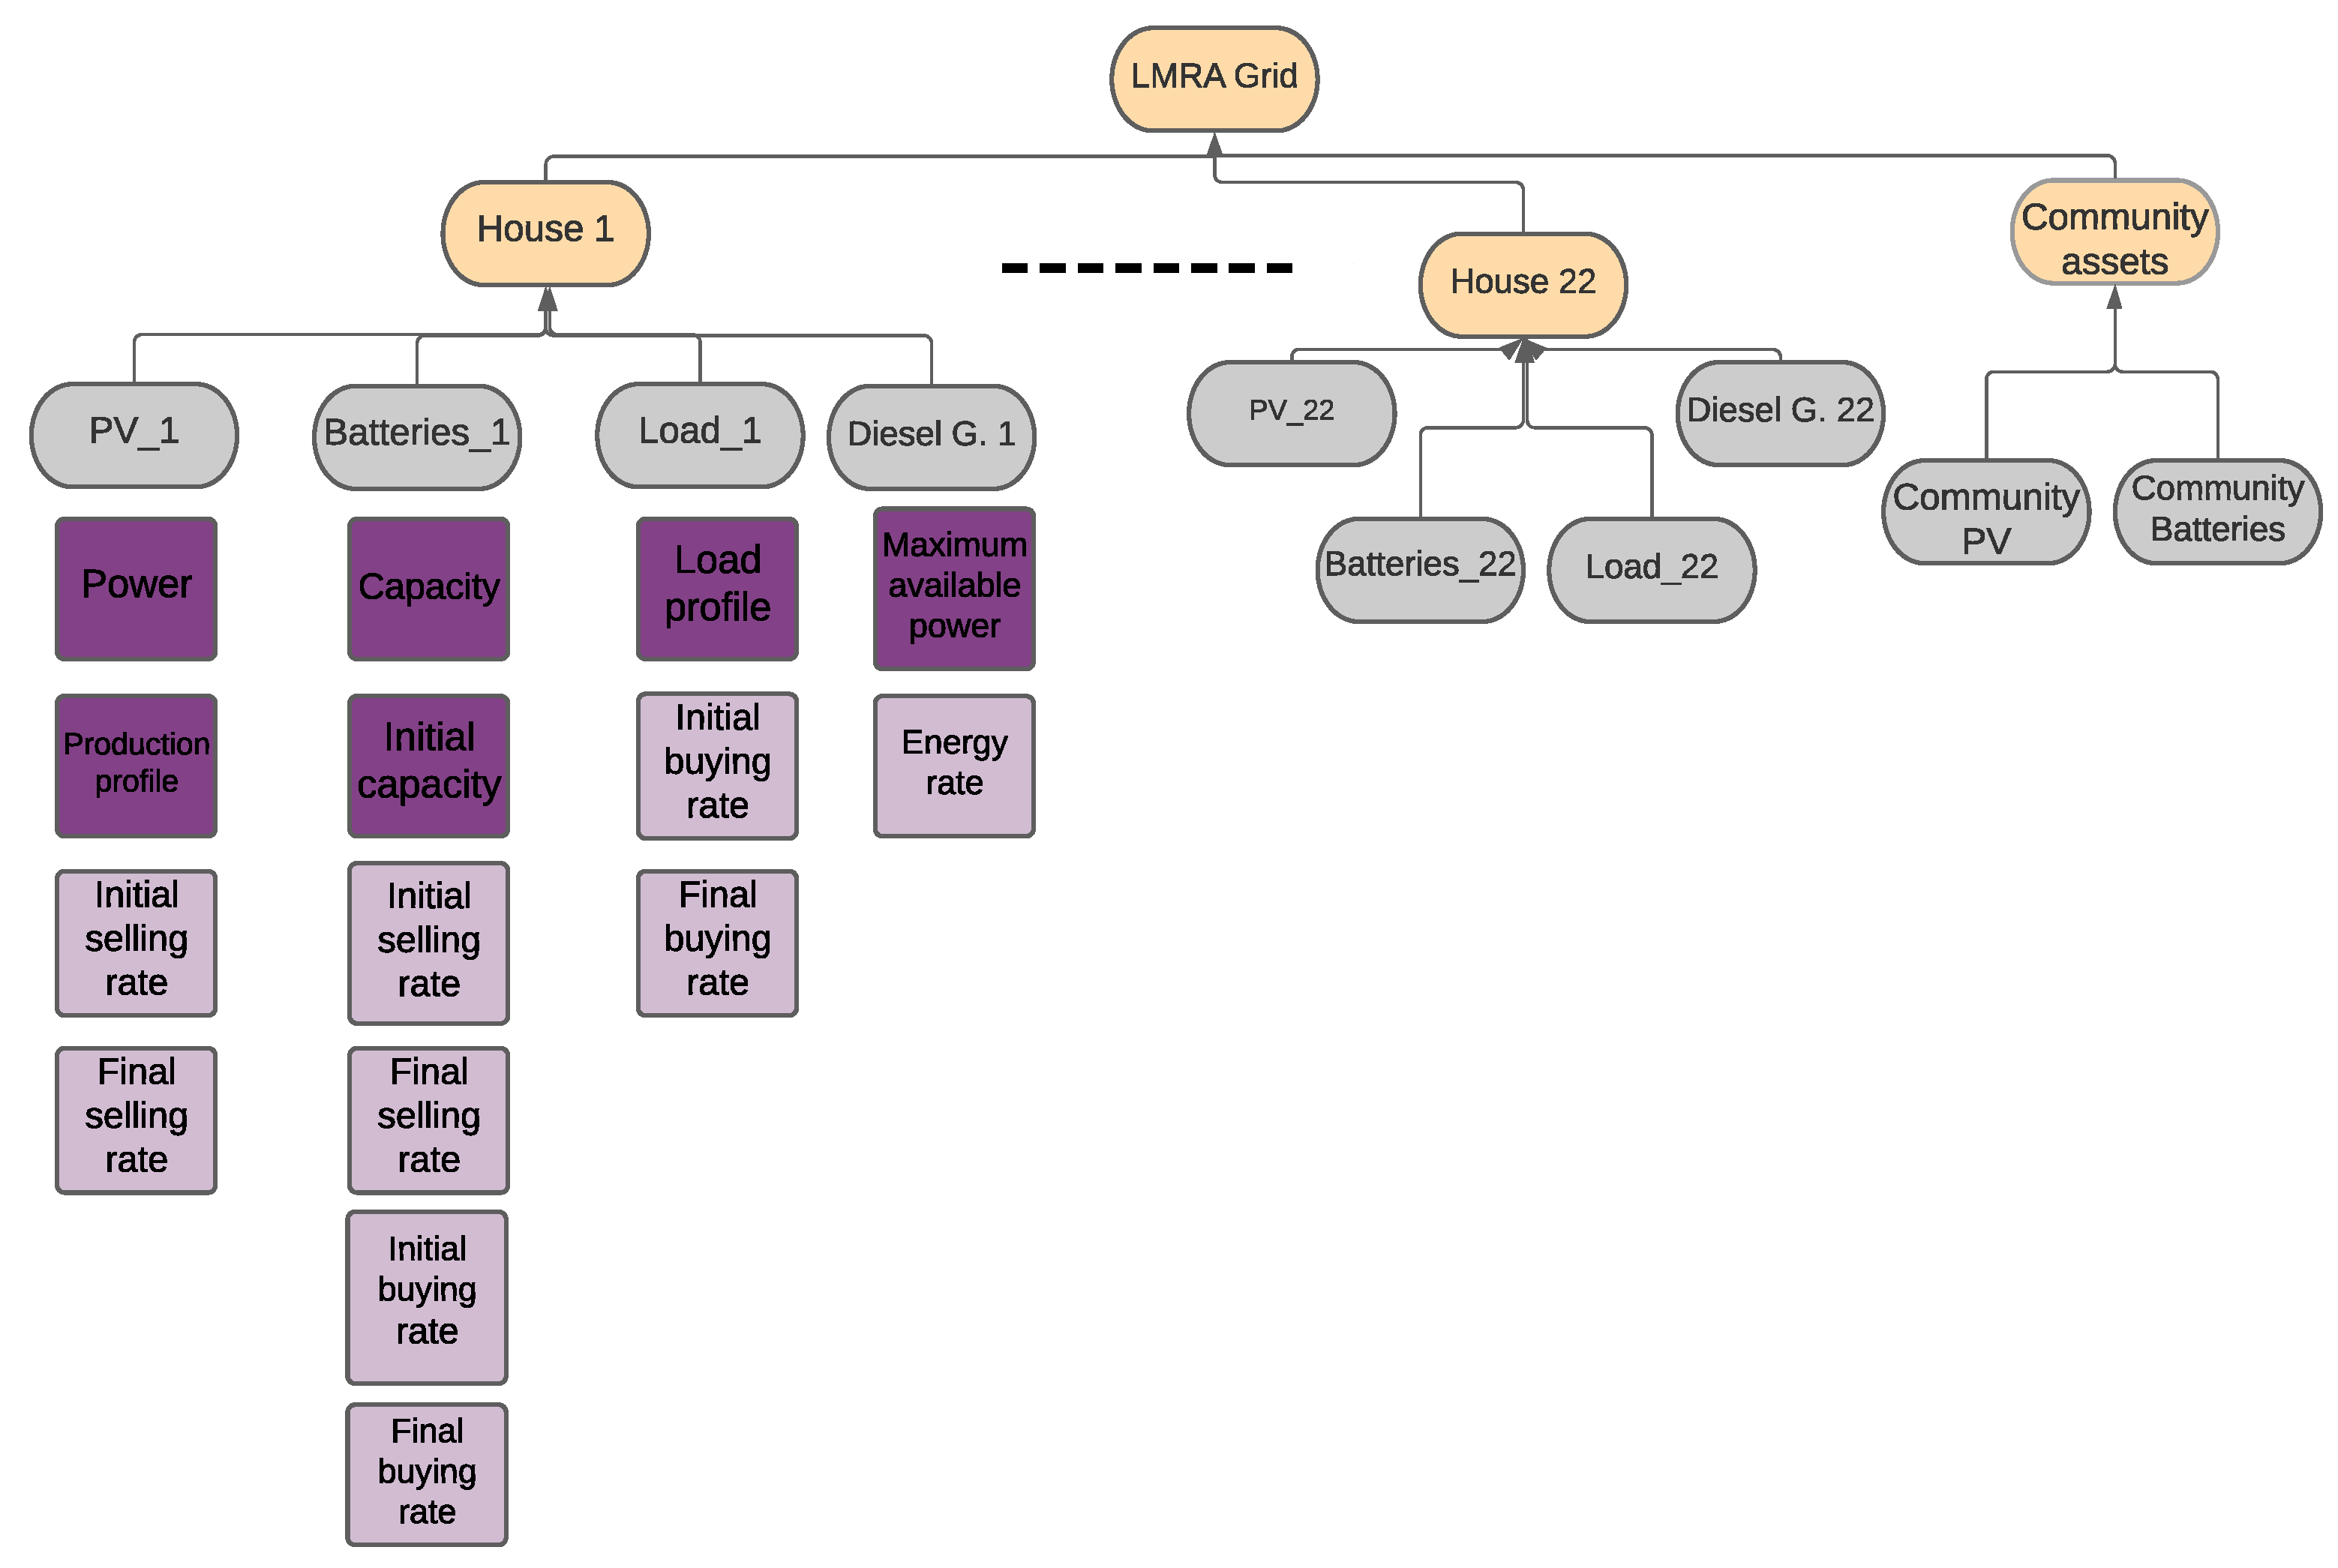
The modeling of the infrastructure follows the online platform set up by D3A and it is portrayed in
Figure 5. In the online platform, the microgrid is simulated and on top of that the market is established and checks if the results can accomplish our goals. The system is set up in its final form when all the houses are interconnected, including new residents and communal property is installed. All 21 users can be represented with their assets and each one represents a “market” as it is called by the D3A platform. Market users are modeled as follows: Each house has devices (PVs, storage, and generator), which act independently, participating in a biding market and loads that buy the cheapest price in the market.
In the market, there are three entities:
- (A)
Prosumers, who buy and sell power;
- (B)
Consumers who only buy power from the system;
- (C)
Communal assets that sell power to the system and buy their own produced energy.
Prosumers have a varying bill depending on their consumption and production, consumers have a bill, similar to the case, if they were connected to the public grid but with a lower price, while communal assets have only earnings. Each device has price constraints which determines their behavior in the system. Price constraints for the devices are shown in
Table 3. When power is traded through the system, an extra grid fee of 0.1 cent/kWh is applied on top of the price.
Each user is considered a market and has its own Internal Agent (IAA) which performs the external and internal transactions. IAAs buy produced energy from assets inside the market and sell it to the load. At the same time, IAAs buy and sell energy with IAAs of other markets/houses. Two examples,
Table 4 and
Table 5 are demonstrated in order to understand in depth its function.
The pricing is a strategic decision in the market as it is defining the priority to the energy sold. So the pricing was decided according to the following criteria:
- (i)
PVs start selling from 7 cent/kWh, a relatively low price because the PV price should be low and close to the cost of PV power according to the HOMER simulation;
- (ii)
The communal PV and house PV price is the same in order to avoid competition between house’s PV and communal PV. Communal PV will always sell more as it is always available, while house PVs are selling their power to all houses;
- (iii)
House and communal batteries at the lowest buying price is 5 cents/kWh so as to not compete with the load in buying energy when the price is very low;
- (iv)
Communal batteries maximum buying price is lower in order to not compete with house batteries when the price is high and energy is scarce. Self-consumption is promoted;
- (v)
Communal batteries selling price is a bit lower (maximum and minimum) than house batteries, making communal batteries useful for the community and always available before they use diesel generators ();
- (vi)
Batteries selling price is lower than the diesel generator’s price in order to create a priority to the energy used. Only when all batteries reach 50 percent state of charge will the generators be asked to sell power.
- (vii)
Diesel generator’s selling price is 30 cents/kWh as occurred by energy cost in HOMER simulations.
The simulation was deployed for 6 days for 4 different months for different starting SOC for storage in order to explore the worst and best case scenarios. Minimum SOC for all storage devices is 50 percent, so below that they do not sell power. In detail, the test cases for having a seasonal profile of the market are:
- (1)
1 January 2021–7 January 2021: (Worst case scenario). Batteries starting SOC: 50 percent, PV production at its lowest;
- (2)
1 April 2021–7 April 2021: Batteries starting SOC: 80 percent;
- (3)
1 July 2021–7 July 2021: (Best case scenario). Batteries starting 90 percent, highest PV production;
- (4)
1 October 2021–7 October 2021: Batteries starting SOC: 80 percent.
3. Simulation and Financial Results
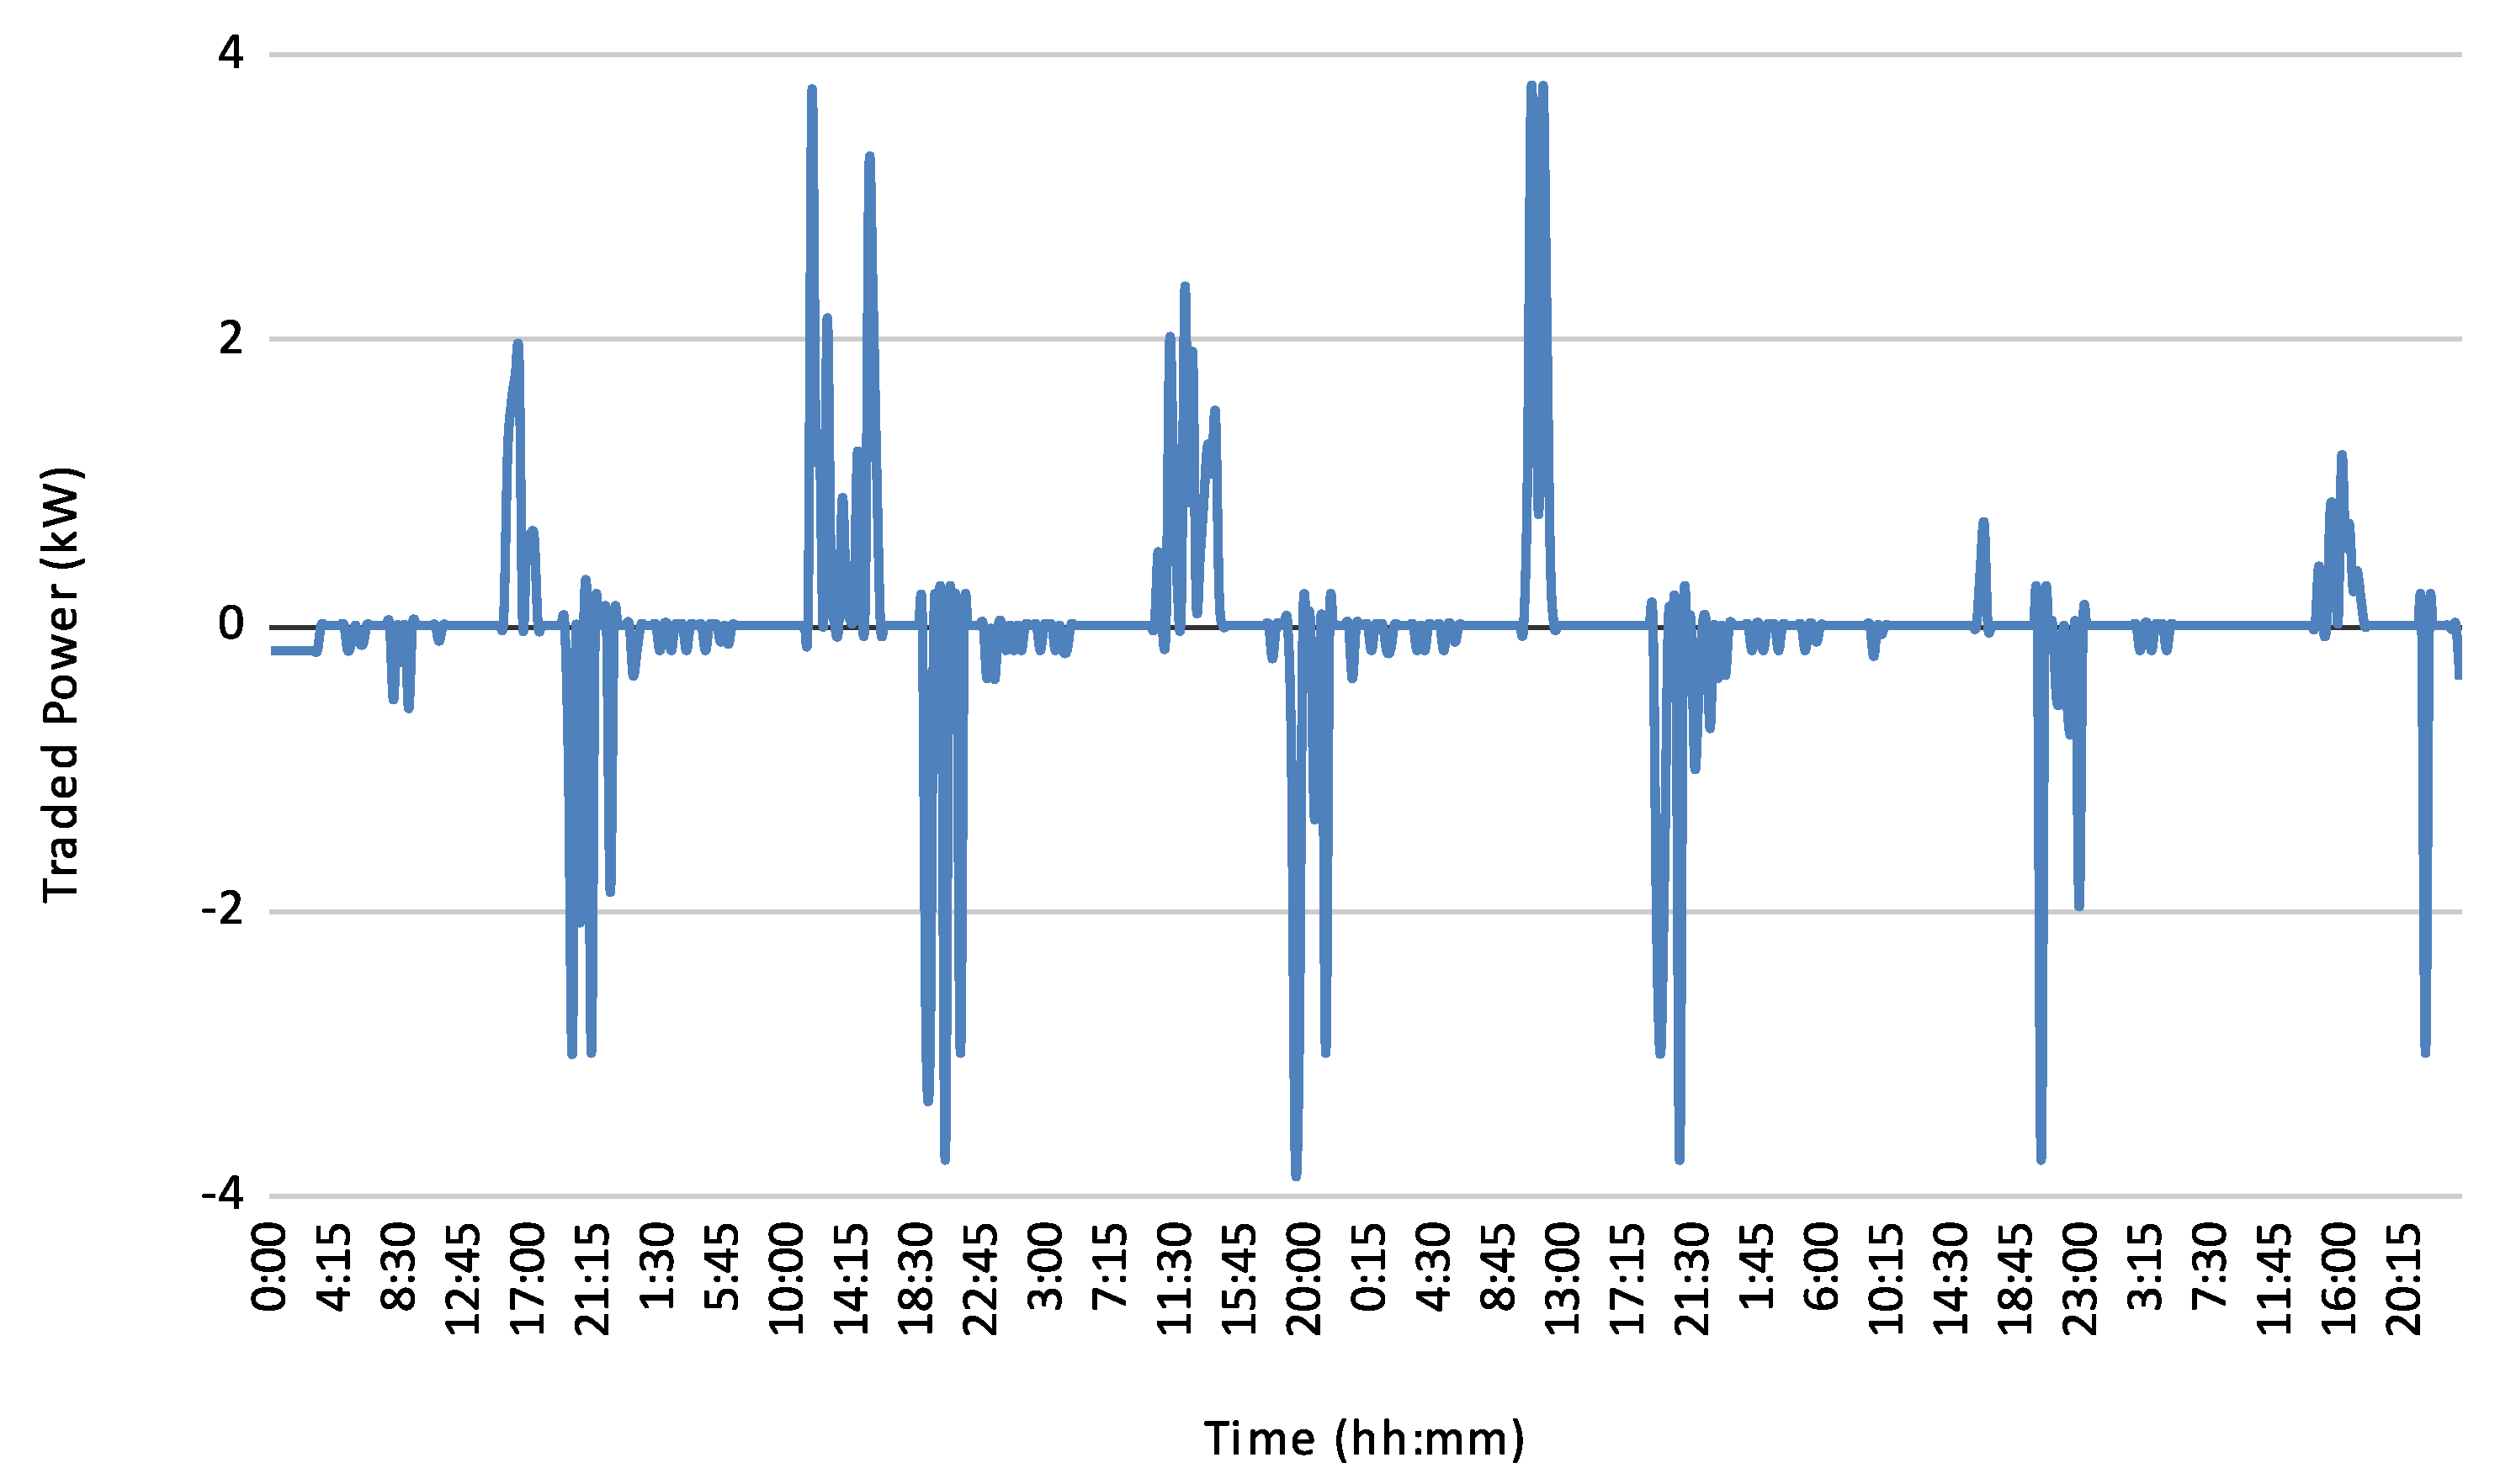
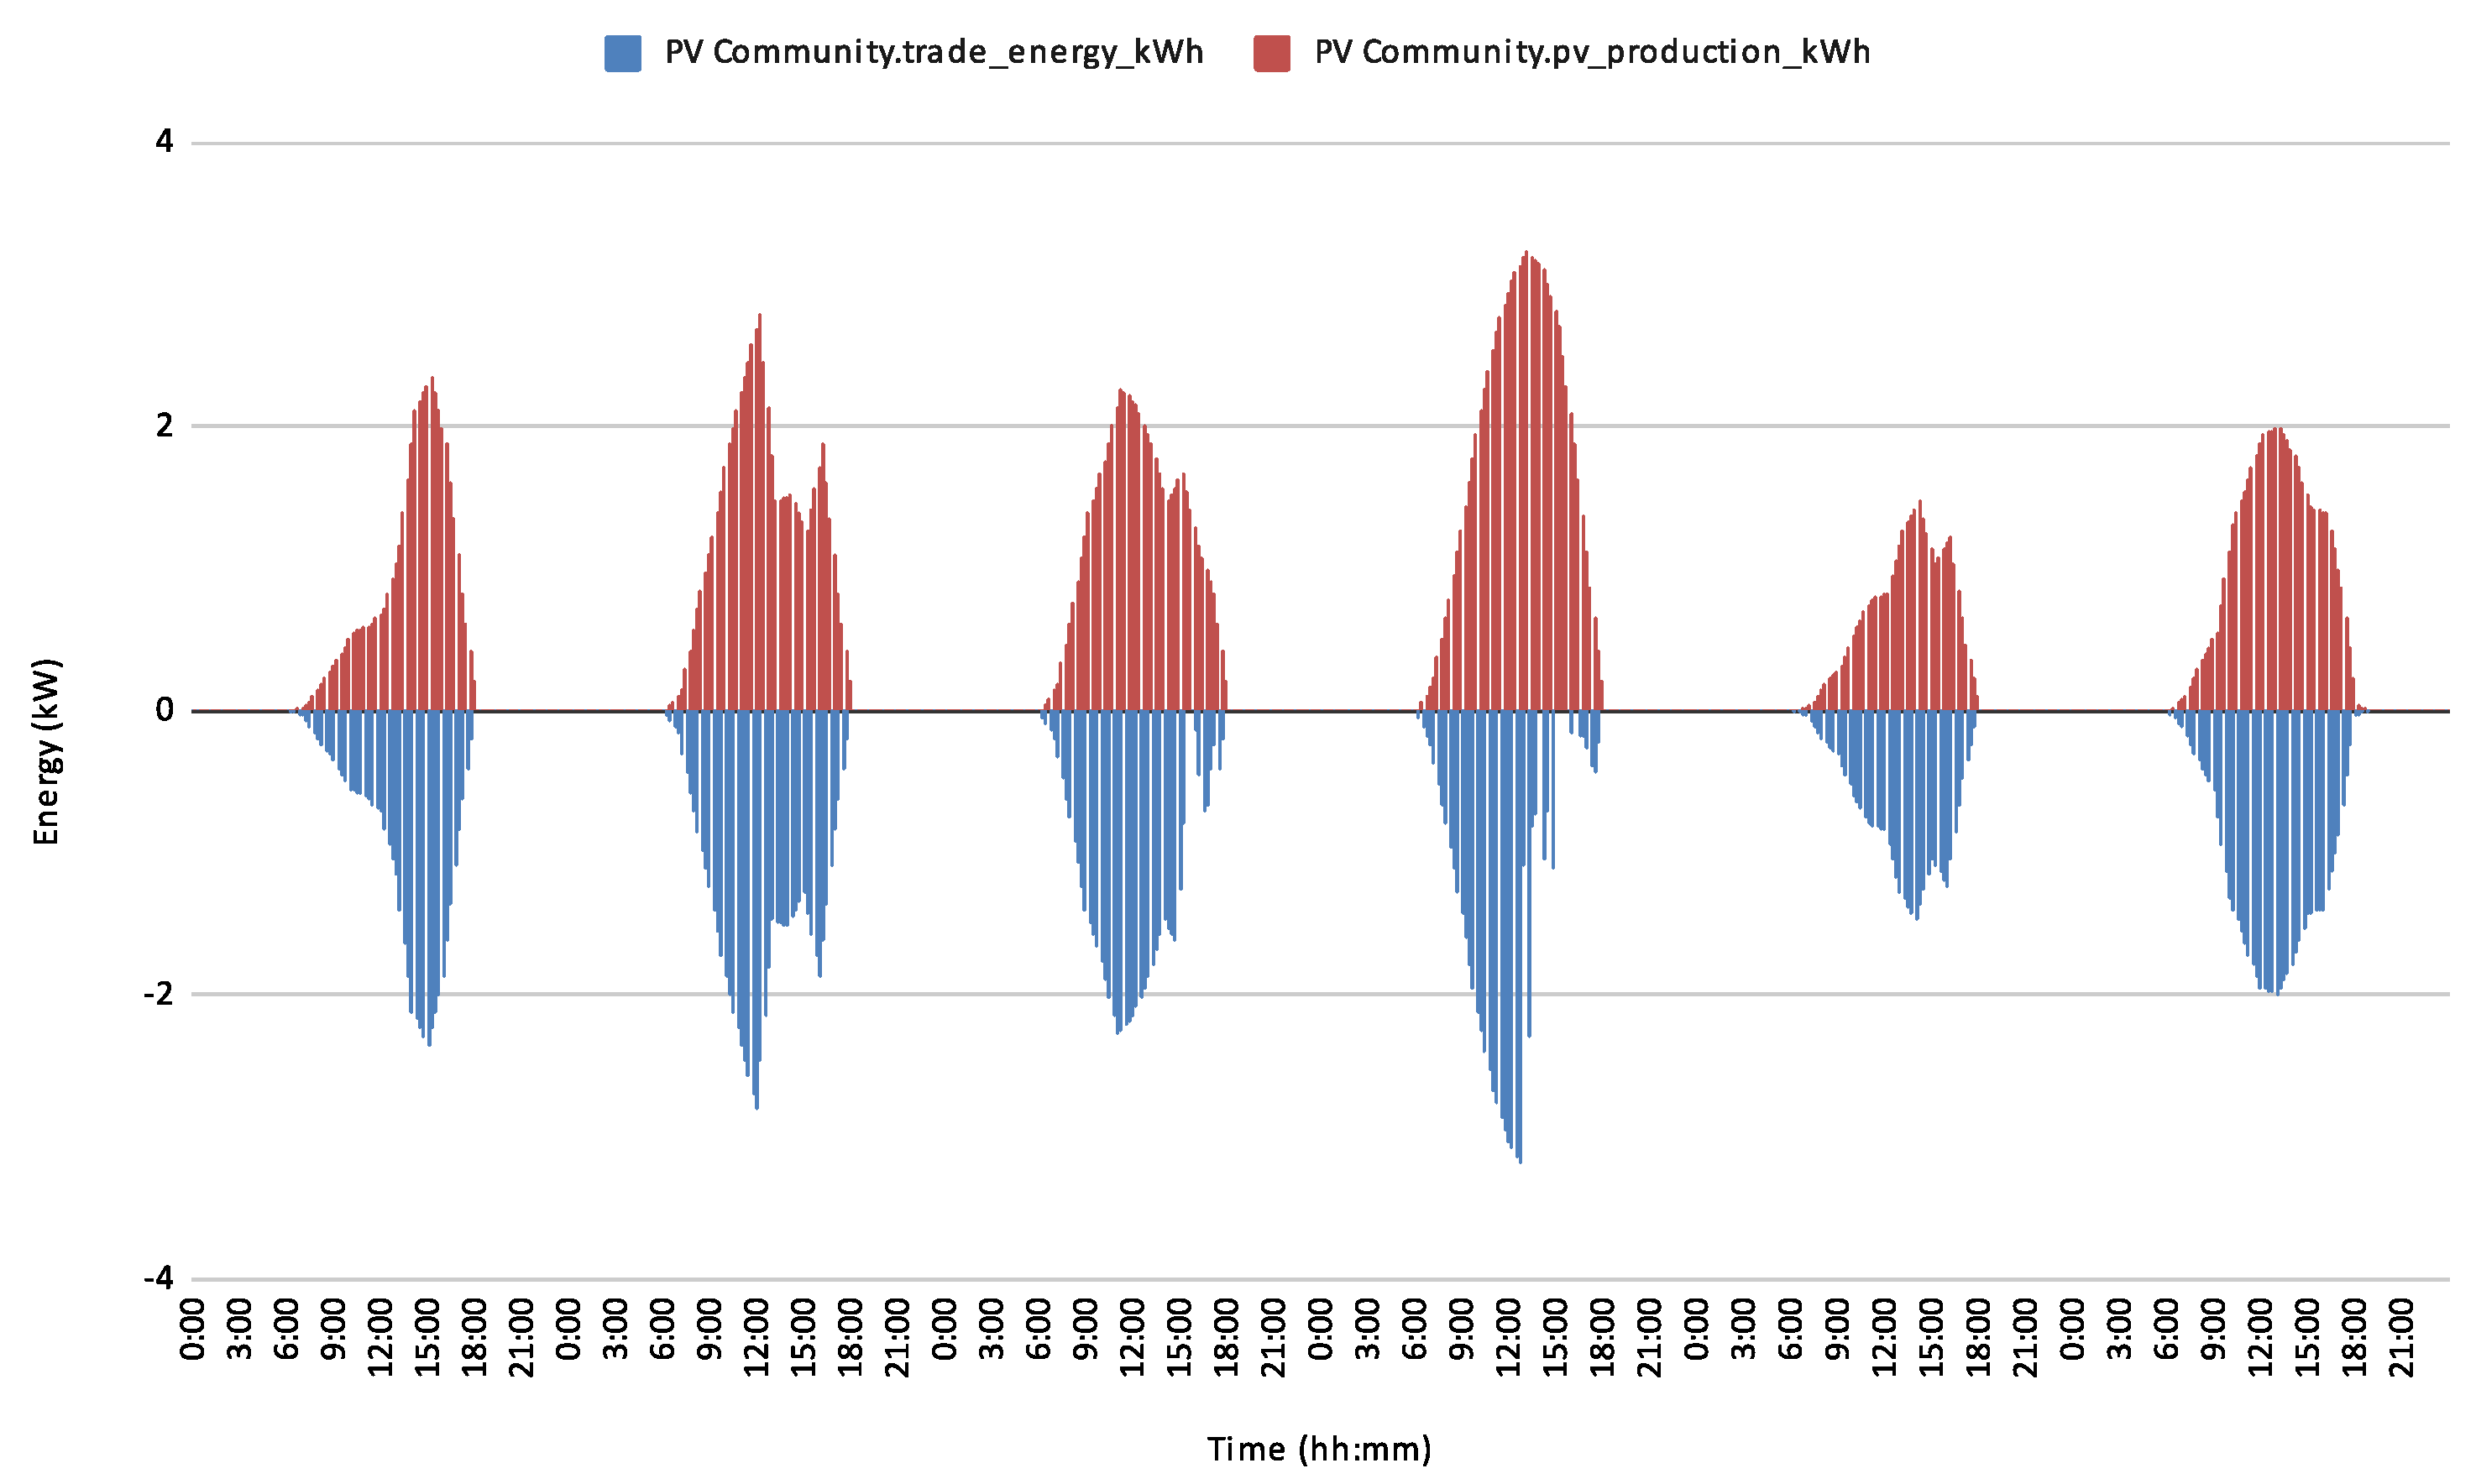
Community assets cover successfully the extra power needed by the community by participating on average 16 percent in all traded power in the system, trading more power than any house. Generators participate only by 5 percent in the total year’s energy production, while before the creation of the microgrid they were participating by 16 percent. In
Figure 6 and
Figure 7, it is demonstrated how community storage and community PV participates in the total energy trade for 6 days in April. In
Figure 6, when the power is positive, the storage is buying power, mainly from community PV, and when the power is negative, the storage is selling power to other houses. In
Figure 7, the power produced (positive) and power sold (negative) by the community PV is presented, proving that the utilization factor of the PVs in the microgrid is very high (90 percent). In addition, it is observed that during peak hour, near 15:00, the community PV cannot sell its energy as the loads are covered by the devices of the houses and the community storage and rest of the storage is full.
Looking at the data of the energy exchange through the year, some statistics are extracted regarding the billing of power. The average selling price of community PV is 11.3 cents/kWh and the average selling price for community storage is 18.4 cents/kWh. The communal earnings are demonstrated in
Table 6 resulting in almost 3000 euros the community assets. This amount overpasses the running costs, resulting in accumulation of capital in order to return the investment to the investors.
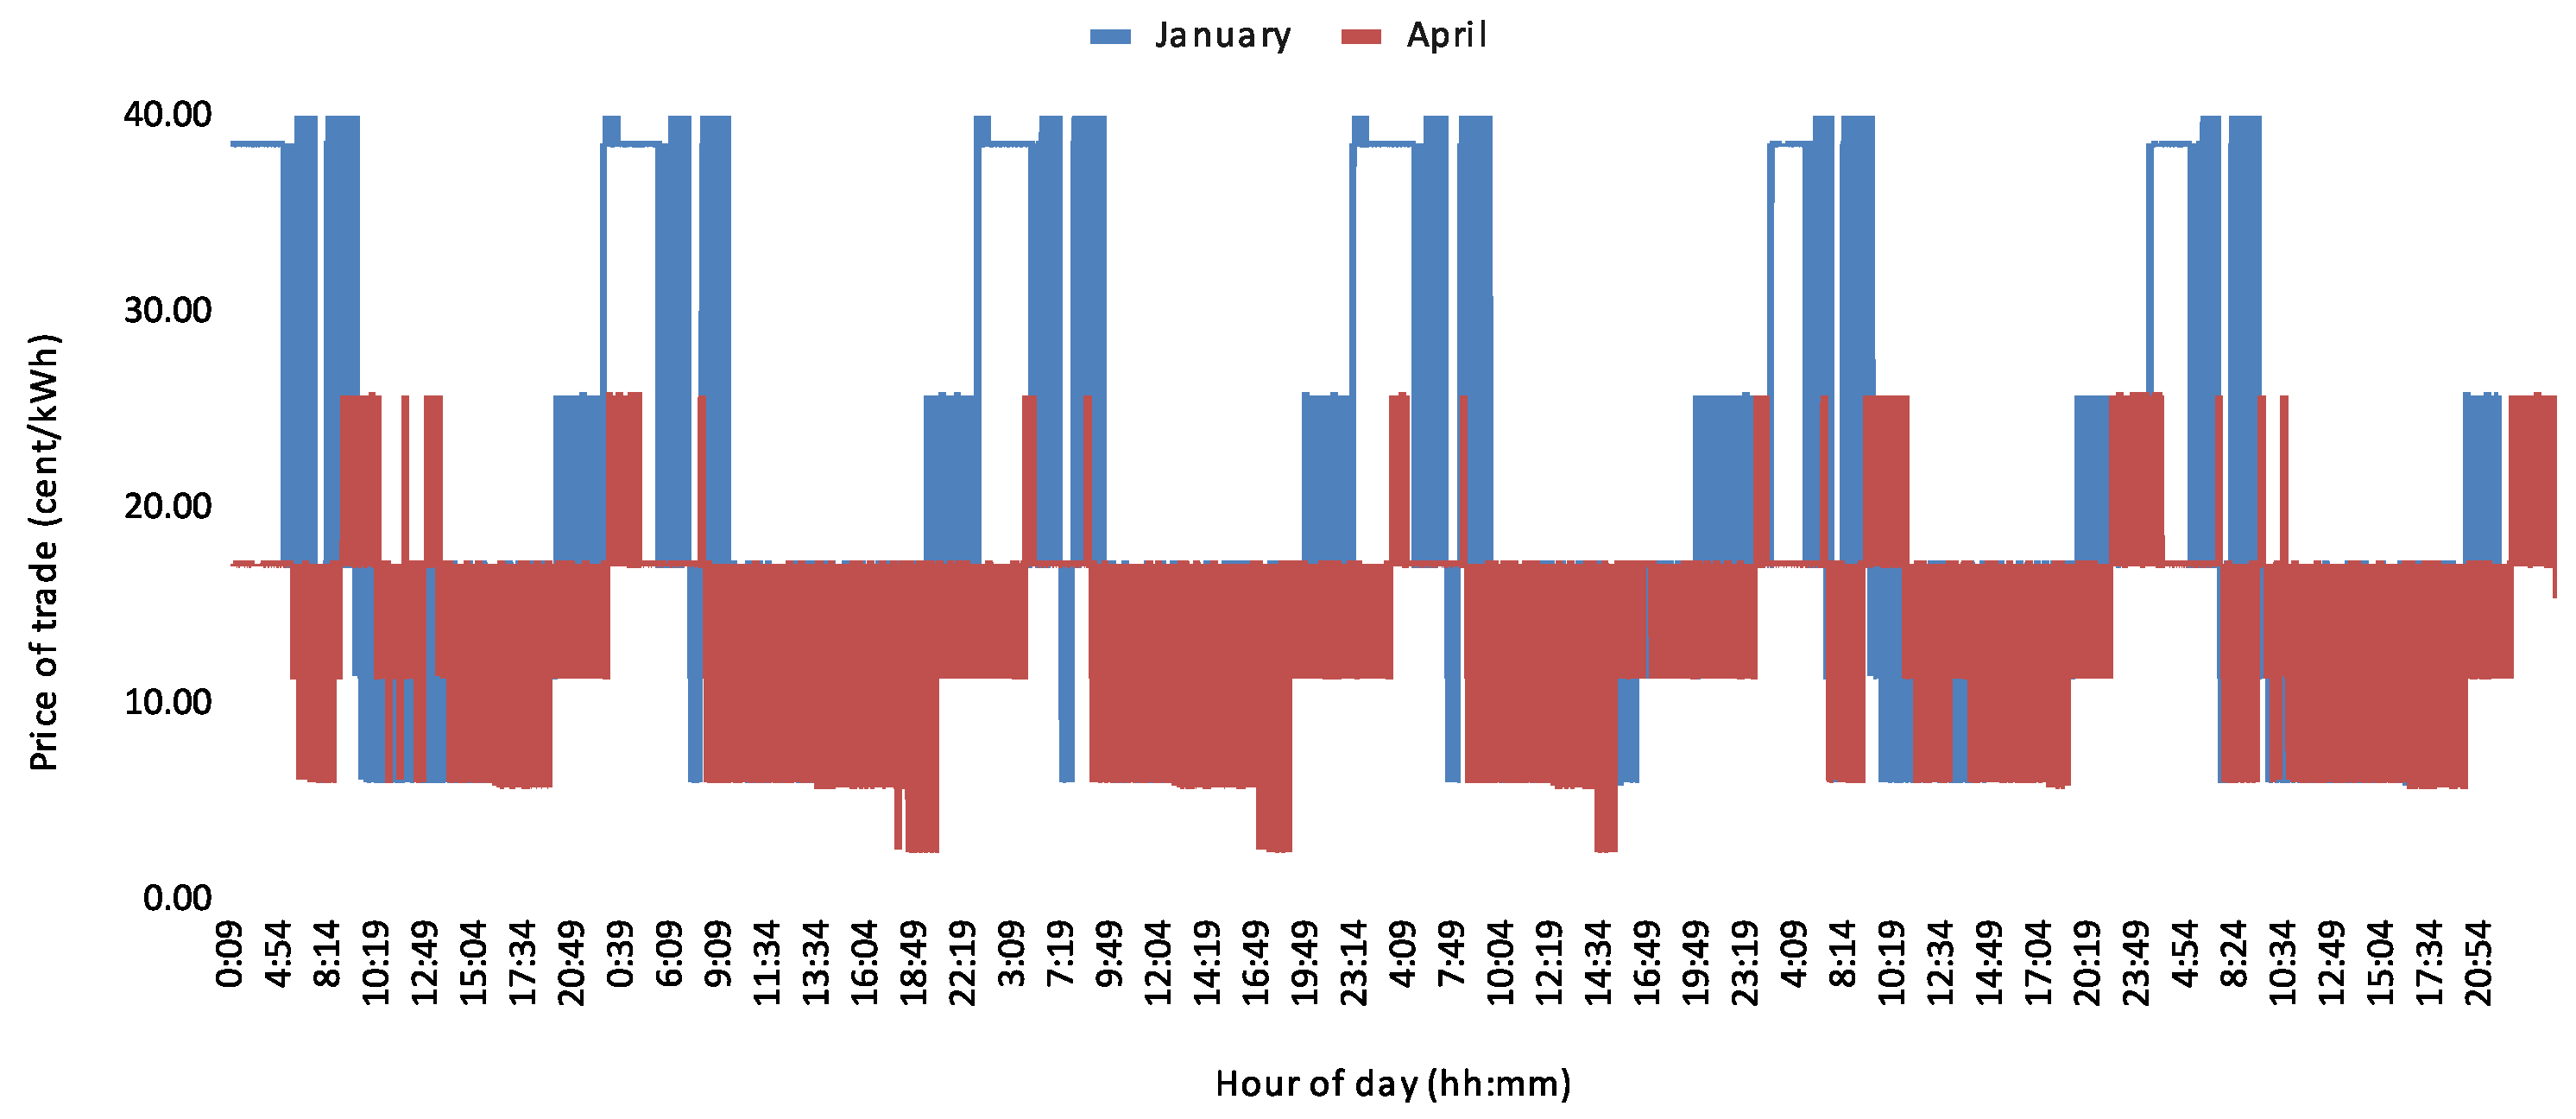
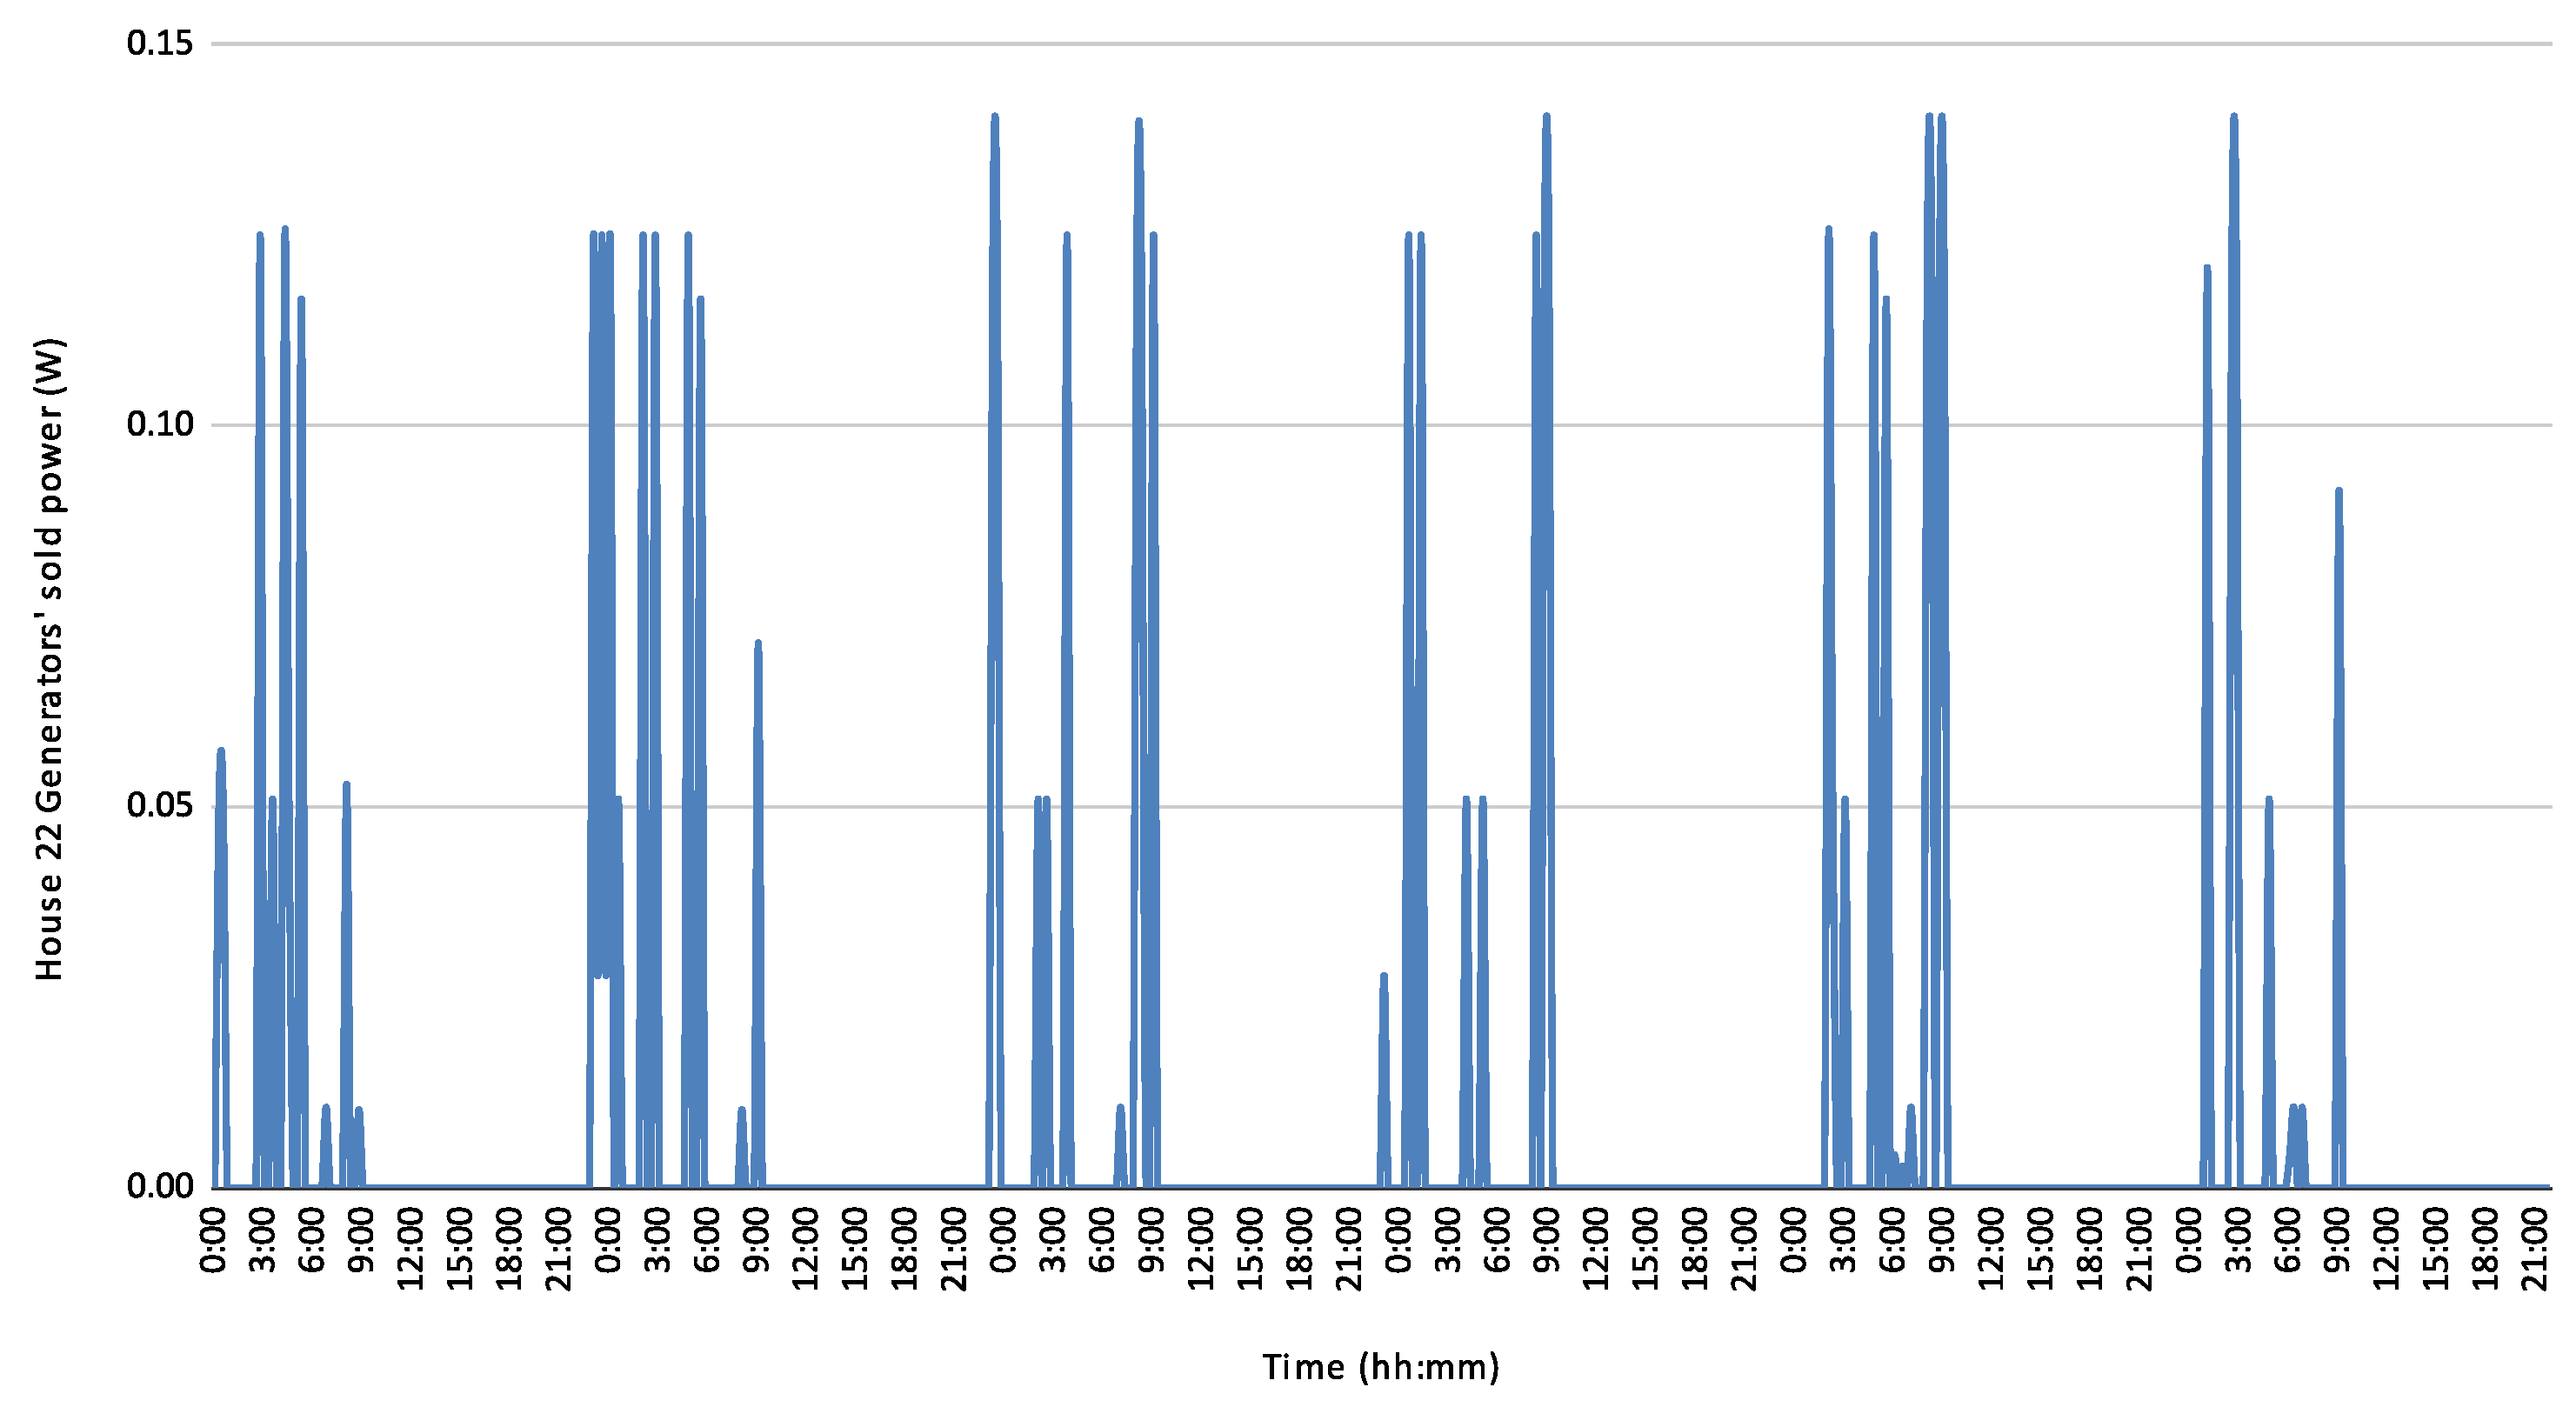
The generators participate in the market only in the January test case, with 5.5 percent of the total demanded energy, as only in the winter does the system require the addition of this power for supporting all loads. The average price of January is much higher than April’s price, as presented in
Figure 8. The generators act according to the need of each house and are activated during the most “difficult” time of the grid during night hours, as presented in
Figure 9.
Each individual house’s load has the option to buy power from its own devices, other houses’ devices or communal assets. Houses buy mainly from PVs during the day and from storage during the night. The results show that houses tend to buy power from other houses’ or community assets as they have 5–20 percent of self-consumption. The average trading price of the loads is demonstrated in
Table 7.
Only consumer houses cover their load by buying energy from the microgrid. The cost of the bought energy depends on their consumption profile: (1) Low Consumer profile: On average 12.21 euro/per month; (2) Medium Consumer profile: On average 28.96 euro/per month; and (3) High Consumer profile: On average 45.13 euro/per month, an acceptable pricing according to the criteria of the research’s design.
4. Discussion
On the one hand, the designed microgrid and local market seems to cover the needs and constraints of the community, both technically and socially, providing a possible plan for the future electrification of the community. On the other hand, there are obstacles included in the application of a complex system as such in a small scale and a community-owned grid. The existing infrastructure provides independence and simplicity in its function that do not implicate neither connectivity to the public grid, neither bills to companies outside the community. Moreover, the current operation is clearly analog without any digital tools. The transition of that state of infrastructure into a more complex digital-based microgrid will require adaptation by the users and a smart community management of the grid. The designed microgrid is an asset for the future and requires a forward-thinking mindset.
The use of a local market in order to foster the energy exchange facilitates the process however, introduces something new into the community that are money transactions between the users/members of the community, a new element that needs attention for the balance of the social system. The mechanism of the market is that all devices compete in order to sell their energy at the best price. Further research should be done, in order to find more appropriate means to foster a more cooperative exchange of energy that is technically and socially feasible.
The market allows the users to cover their needs and return the investment in some years time. In comparison to the base case scenario, the solution of the microgrid is cheaper and more efficient in the use of resources. A possible challenge in this process could be that the transition of the existing infrastructure to an interconnected microgrid might bring unexpected technical problems and require more time. Further research is required in the implementation of an off-grid decentralized control in combination with the function of a digital local market.


